Article

Parametric Energy Efficiency Impact Analysis for Industrial Process Heating Furnaces Using the Manufacturing Energy Assessment Software for Utility Reduction

1
Industrial and Management Systems Engineering, West Virginia University, Morgantown, WV 26506, USA
2
Mechanical and Aerospace Engineering, West Virginia University, Morgantown, WV 26506, USA
*
Author to whom correspondence should be addressed.
Processes 2024, 12(4), 737; https://doi.org/10.3390/pr12040737
Submission received: 28 February 2024 / Revised: 22 March 2024 / Accepted: 2 April 2024 / Published: 4 April 2024
(This article belongs to the Section Energy Systems)

Abstract

:
Industrial process heating furnace operations consume considerable energy in the U.S. manufacturing sector, making it crucial to identify energy efficient strategies due to the growing need to minimize energy usage and emissions. It is important to identify the potential impact of these factors to enable process engineers to operate process heating systems at the maximum possible efficiency. This study examines and identifies the key impact factors that influence the efficiency of process heating systems using MEASUR (v1.4.0), the DOE software tools such as the insulation effectiveness, the burner stoichiometry, cooling medium, thermal storage, and atmospheric gases. Data from a two-fuel-fired heat treatment furnace and an electric arc furnace (EAF) for steelmaking were employed to establish the baseline heat balance models in MEASUR. The fractional factorial design experiment was developed with two-level parameter values and energy efficiency strategies for the heat input into industrial furnaces. The three most significant parameters for the heat input for a fuel-fired industrial furnace, Industrial Furnace A, are excess air percentage or the oxygen percentage in flue gas (OF), average surface temperature (ST), and combustion air temperature (CT). Similarly, for an electric industrial furnace, Industrial Furnace B, the parameters are charge temperature (CHT), average surface temperature (ST), and time open (TO). A comparative analysis was carried out for the fuel-fired and equivalent electric resistance furnaces to identify the prospect of electrification of industrial furnaces relying upon fossil fuels. The study aims to assist industries and designers in making informed decisions regarding industrial furnace upgrades, process optimization, and maintenance investments, resulting in substantial energy and cost savings, and a reduced environmental impact.

1. Introduction

Process heating is the application of heat in an industrial context to create, treat, or modify manufactured items. Energy is used in process heating to increase or maintain the temperature of the materials used in manufacturing. It is necessary to subject the materials to process heating in the manufacturing process of most consumer and industrial goods, including those made of plastics, rubber, metal, concrete, glass, and ceramics [1]. In Process heating systems, energy is transferred to the material to be treated. The technologies depend entirely on or are used in combination with conduction, convection, or radiative heat transfer methods to deliver heat to a substance [2]. In 2014, the U.S. industrial sector consumed 2203 MWh (Megawatt hour) of energy for process heating, which comprised 690 MWh of steam, 108 MWh of electricity, and 1406 MWh of fuel and industrial process heating operations consume considerable amounts of manufacturing energy, accounting for approximately 70% of the total, representing a substantial portion of the energy demand in manufacturing [3]. Common types of process heating systems include fuel-based, electricity-based, steam-based, and hybrid systems [1]. Steam-based process heating systems accomplish heating via a direct or indirect steam application. Steam contains a considerable amount of energy per unit mass, generally within 646 to 807 Watt per kg (Watt/kg) [4]. The temperature in a blast furnace can reach about 3000 °F, allowing iron to melt [5], and a pottery kiln can typically reach temperatures ranging between 2000 and 2400 °F [6]. Industrial furnaces come in several shapes and sizes but operate on the same basic principles and consists of major components like a heating chamber, energy system, burners, exhaust system, load handling system, temperature control system, and pressure control system [7]. Industrial furnaces can be broadly categorized into two major types based on their heat-generating source or energy source: fuel-fired (or combustion) and electric [7]. Electrical furnaces are generally more energy efficient than fuel-fired furnaces [8,9]; however, the selection of a specific type of industrial furnace depends on the process requirement, the availability of fuels and electricity, fuel and electricity prices, operational and maintenance costs, and environmental regulations. Several general operations performed with industrial furnaces are heat treatment, smelting, sintering, forming, incineration, metals reheating, etc. [1]. Incineration has the potential to destroy a large variety of highly contaminated wastes while significantly reducing the quantity of substances required to be disposed of. The energy mix for the U.S. during the year 2021 indicates that non-renewables fulfill 88% of the energy demand [10], and we depend mainly on fossil fuels as they are energy-rich sources and are relatively cheap to process [11]. Industrial furnaces, including kilns, ovens, and boiler furnaces, are the dominant type of process heating equipment. A study has found that furnaces consume about 30% of the fuels utilized in the industrial sector and 10% of the industrial electricity demand [12]. But the gases leaving the furnace contain a considerable amount of heat energy, resulting in the decreased thermal efficiency of furnaces, which could be improved by recovering the thermal energy that is present in off-gas [13].
Industrial furnaces are complex systems that require careful attention and monitoring to maintain optimal energy performance. The energy performance of an industrial furnace is affected by various parameters, and some of these parameters have a more significant impact on the energy performance of the furnace than others. There is insufficient research conducted to evaluate how different factors affect the energy performance of industrial furnaces and determine which factors have the most notable impact. This research aims to fulfill this need by identifying the top parameters that affect industrial furnaces’ energy performance. The study evaluates the energy performance of the upgraded parameters compared to the base parameters, providing a clear picture of the impact of various parameters on energy consumption. This research will help business owners to identify the most significant parameters to prioritize and focus their resources on to improve their industrial furnaces’ energy performance. Companies can make informed decisions about furnace upgrades and maintenance investments based on the findings of this study, resulting in better energy efficiency, cost savings, and a reduced environmental impact. We aimed to address the issues mentioned here by modeling the energy used by industrial furnaces using the PHA (Process Heat Assessment) module of the MEASUR (Manufacturing Energy Assessment Software for Utility Reduction). The PHA module is specifically designed to analyze thermal energy usage and identify areas of inefficiency in process heating systems, which will pave the way for devising a plan to enhance energy efficiency.
Creating computer models for energy systems to predict and analyze energy usage is known as energy modeling. It is a valuable technique for identifying the energy efficiency measures that can be used for facilities, including in areas such as heating and cooling, building energy, and mechanical systems. There are numerous energy software tools on the U.S. Department of Energy (DOE) website, and the MEASUR is one of the most versatile software. MEASUR, as its name implies, is an analysis tool that can be used by energy manufacturers to cut down on their utilities. It can be used to evaluate process heating, process cooling, steam systems, compressed air, motors, pumps, fans, wastewater, and heat loss from solid, liquid, and gaseous fuels [14]. It can also be used to identify low or no-cost energy-saving opportunities with the help of its Treasure Hunt module. The Process Heating Assessment (PHA) module of MEASUR can be used to assess the industrial process heating equipment such as furnaces, kilns, ovens, and melters by measuring their energy usage and estimating the potential reduction with the adoption of chosen techniques for energy efficiency improvement [15]. This tool interchangeably uses the terms furnace, process heating equipment, process heating system, and PH System. Moreover, as a general term in this tool, the term “furnace” refers to all frequently used process heating equipment, including furnaces, ovens, heaters, melters, kilns, dryers, and boilers. PHA uses bottom-up heat balance analysis to determine the total amount of energy a furnace consumes, considering heat-to-load and various heat losses. The PHA module of the DOE (Department of Energy) software MEASUR is a specialized tool for the analysis of the energy consumption of process heating equipment, including industrial furnaces. It can be used to conduct a heat balance analysis to identify the significant areas of energy usage under various operating conditions. While other software tools such as the CFD (Computational Fluid Dynamics) simulation software and Ansys have been used for the energy study, it is essential to note that the PHA module of the MEASUR is a specialized, and the most widely used, software tool dedicated to the process heating equipment, which means that MEASUR is likely to be more effective and accurate compared to other tools. The other important aspect of the MEASUR is its credibility and reliability since it has undergone the DOE’s verification process at different stages.
Most of the scientists in the field, whose work has been summarized in the literature survey section, have focused on the methodology of enabling and improving the energy efficiency of process heating systems. The research presented in this paper, however, focuses on a parametric impact analysis that spans the domain of the process heating energy efficiency measures. Although there is significant literature on this research topic, minimal research efforts have been put forth explicitly linking the factors related to process heating systems and energy efficiency and environmental impacts, especially in relation to various type of operational characteristics of the process heating systems. The DOE software tool MEASUR contains the ability to analyze process heating systems in a thorough and detailed manner, both for fuel-fired and electrical process heating systems. MEASUR combines more than 50 equipment and property calculators for simple energy-related calculations and analyses. The utilization of the powerful software paradigm and framework presented by MEASUR adds significant intensity and robustness to the research results, which have not been approached and examined by other scientists in the field. The principal objective of the study is to explore the potential of conserving energy in process heating industrial furnaces using heat balance analysis, use the MEASURE to develop the model for furnaces with actual industrial furnace data and estimate the energy consumption under various circumstances, and perform statistical and sensitivity analyses to identify the most significant parameters for industrial furnaces’ energy efficiency. The fuel-fired furnace analyzed is a heat treatment furnace, whereas the electric one is a steel-making electric arc furnace. The models are used to project energy utilization patterns under diverse operating conditions of industrial furnaces and statistical and sensitivity analyses are conducted using these models to pinpoint the essential parameters affecting energy savings. The energy efficiency of industrial furnaces is paramount as it impacts production costs and the environment significantly. The energy efficiency study carried out here is crucial in identifying areas of inefficiency and waste, enabling the development of plans and strategies to reduce energy consumption, lower operating costs, and decrease environmental impact.

2. Materials and Methods

2.1. Literature Review

Industrial furnaces have been in use globally for various purposes for a long time. As the range of applications broadened, manufacturers created different furnaces to meet the demand. The designing and operation phase of industrial furnaces must consider several factors, including combustion, heat transfer, temperature, maintenance and durability, automation and control, emissions, energy efficiency, and safety. To precisely determine the rate of coal powder combustion in the furnace, Zhang et al. [16] developed a one-dimensional macroscopic model of pulverized coal combustion which shows that medium temperature, oxygen content, and particle size are the key factors that determine how quickly the coal burns. One of the critical parameters that must be under strict control in industrial furnaces is temperature, and this control should be accurate and quick. Gani et al. [17] proposed a PID (Proportional-Integral-Derivative) controller based on a Genetic Algorithm (GA) to address the lower accuracy and longer rise and settling times of the controller where authors considered the Integral of Absolute Error (IAE) as the algorithm’s objective function to optimize the error. The information on heat transfer between the furnace and surrounding walls of a circulating fluidized bed (CFB) boiler was critically reviewed by Basu et al. [18]. The authors evaluated the suspension densities above the secondary air level from static pressure measurements in some commercial CFB boilers operating at full load, discovered that they were correlated with a correlation coefficient of 0.93, and concluded that the main element affecting heat transfer in a CFB furnace is suspension density, followed the bed temperature and the height of the heat exchanger.
Industrial furnaces must be maintained routinely to increase their effectiveness, increase safety, extend their useful lives, maintain reliability, and adhere to regulatory requirements. Junger et al. [19] analyzed the maintenance plans for North America and Europe’s typical basic oxygen furnaces (BOF) and the calculations showed that switching from the BOF everlasting lining to a lining with a lifetime of 5000–7000 heat cycles is feasible and allows steel operators to save money. Industrial furnace emissions are a growing concern as can be seen by the increased number of laws being enforced to reduce these emissions’ detrimental environmental effects and industrial emissions are expected to rise by 15% before 2050 [20]. An experimental investigation was carried out by Szego et al. [21] to look at the scaling of nitrogen oxide (NOx) emissions from a parallel jet burner system in a moderate or extreme low-oxygen dilution (MILD) combustion furnace, and they found that NOx emissions were decreased by up to 48% and 10% when fuel was diluted by up to 76% by mass with CO2 and N2, respectively, with a maximum temperature reduction of only 56 °C.
Switching to renewable fuels like charcoal from coal-based fuels is appealing for lowering total greenhouse gas emissions from the steel production process. Mathieson et al. [22] compared the combustibility of four varieties of charcoal with pulverized coal injection (PCI) in a simulated blast furnace (BF) environment, which indicated that using injection rates higher than that of coal is viable and suggested the possibility of greater BF productivity. Lee et al. [23] investigated the possibility of using tail fuel gas (FG), a byproduct of the petrochemical process, in place of natural gas (NG) as the fuel for the furnace and showed that the furnace’s efficiency dropped when NG replaces FG. However, the experiment’s results using an industrial furnace showed that reducing the concentration of O2 in the fresh incoming air and increasing its temperature will accomplish the target of fuel savings and decrease the emission of CO2 and NOx. Kirschen et al. [24] showed energy balances, energy efficiencies, and the influence of gas burners in several steelmaking EAFs using data derived from plant measurements and showed a reduction in the electrical energy requirement by using NG; however, the study did not indicate that there was a substantial impact on the total energy input to an EAF.
Oxy-fuel combustion refers to burning hydrocarbon fuel in an environment composed chiefly of oxygen instead of the usual air. Han et al. [25] demonstrated through numerical verification that using oxy-fuel combustion rather than air-fuel combustion increases the efficiency of a steel reheating furnace by about 50% compared to air-fuel combustion. Kilinc et al. [26] conducted energy efficiency studies on an industrial reheating furnace from an integrated industrial firm which led to the identification of cost-saving opportunities, resulting in the installation of a new recuperator, economizer, and gas analyzer in the reheating furnace, yielding total energy savings of 2,913,924 kcal/h with a realized average investment payback period of 1.06 years. The savings opportunities ensured a total decrease in CO2 emissions of 3,900,990 kg/yr, increasing the efficiency of the reheating furnace from 61.83% to 69.43%. Heating the charge before placing it in the furnace lowers the possibility that the material will experience thermal stress or shock and improves the efficiency of the entire process. Kangvanskol et al. [27] studied the energy efficiency improvement achieved by using a preheating chamber for four slabs before introducing them into the reheating furnace and showed that the energy consumption after the introduction of the chamber decreased by 0.94%, 1.46%, 1.75%, and 1.89%, respectively, and improved efficiency from 69.88% to 70.54%, 70.92%, 71.13%, and 71.22%, respectively. Chakravarty et al. [28] researched opportunities to enhance the energy efficiency of a functioning natural gas-powered reheating furnace; they measured various parameters to formulate the energy balance for natural gas-powered reheating furnaces and found total energy savings of 0.1841 GJ/ton, and the reheating furnace’s efficiency improved from 32.32% to 38.90% and these changes led to a reduction in fuel consumption of more than 21%.
The angle of the furnace flue damper impacts the amount of time that the hot gas flow spends in the radiation section of the furnace, which, in turn, affects the overall thermal efficiency and the amount of fuel consumed by the furnace. Lee et al. [29] altered the angle of the furnace flue damper and their study showed that when the damper angle was decreased from 45 to 39 degrees, there was a decrease in pressure within the furnace of −5.1 mmH2O in the radiation area and −3.3 mmH2O in the convection area; the average temperatures rose by 40 °C in the convection area, and 42 °C in the radiation area with an increase in flue gas temperature of 28 °C and the potential to reduce the annual fuel consumption by 2.3 × 10⁶ m3 and carbon dioxide emissions by 2.6 × 10³ tons. Hasanuzzaman et al. [30] performed a complete overview of energy-saving methods and strategies for heating processes in industries that rely on combustion and reported that implementing a recuperator in the furnace could save up to 25% in energy, and using economizers in boilers could result in energy savings of 10% to 20%.

2.2. Mathematical Modelling

Sardeshpande et al. [31] offered up a model-based technique for benchmarking energy-intensive industrial operations, using industrial glass furnaces as an example to explain this technique. Mass and energy balances, heat loss equations for the various zones, and empirical equations based on operational procedures were used to construct a simulation model. The authors presented a 100 tonnes per day (TPD) end-fired furnace case study to illustrate the model’s potential, which had a minimum energy requirement of roughly 3830 kJ/kg (1647 Btu/lb), and found that 53% of the heat generated by the fuel is transferred through the glass as usable heat which includes 41% of the heat being conveyed by the glass, 6% of the heat being from the reaction, and 6% of the energy used for heating the batch gas. The primary energy losses were the heat of the flue gas (22.5%), followed by furnace wall and opening losses (15%). The authors concluded that energy usage for actual furnaces running at these production scales might be reduced by 20–25%. Masoumi et al. [32] aimed to create a mathematical model that can determine the efficiency of a furnace when the operating and combustion air conditions change. For the furnace considered in this research, the findings revealed that, by preheating the air to 485.6 °F and lowering the excess air to 15%, the exhaust gas temperature could be reduced from 1000 °F to 402 °F and the furnace efficiency could be increased from 63% to 89% which suggested that, by expanding the heat transfer area, the furnace’s capacity could be boosted by up to 30% without impacting its efficiency.
One of the most energy-intensive industrial processes is melting the charge material mixture in an EAF. An artificial neural network (ANN) approach was employed by Gajic et al. [33] to model the impact of the chemical composition of the melted steel, and therefore, the charge material mixture, on the specific electrical energy consumption. The optimal neural network model was determined to be a 5-5-1 Multilayer Perceptron (MLP) obtained after 89 cycles, and it was capable of accurately predicting the electrical energy consumption based on the chemical composition of the charge material mixture. The presented model supported the notion that the chemical composition of the charge material mixture is a crucial factor in determining the electrical energy consumption of thane EAF. The authors concluded that the model could assist in decision-making to optimize the charge material mixture recipes, thereby decreasing electrical energy costs, which are significant operating expenses in an EAF. He et al. [34] proposed fixing the furnace heating schedule issue to assist forging firms in achieving energy efficiency and reducing emissions. This study established a multi-objective furnace charging model to address the charging issue faced by continuous heating furnaces, aiming to minimize capacity difference and waiting time. The researchers developed an improved strength pareto evolutionary algorithm 2 (SPEA2) for this study. A comparison of the results obtained from the improved SPEA2 algorithm with those from SPEA and SPEA2 showed that the improved SPEA2 could produce better solutions without adding to the time complexity. It resulted in a reduction in heating time by a total of 93 min and a saving of 7533 GJ of energy. The authors concluded that the findings from this research could assist the forging industry in enhancing the utilization of this type of furnace, reducing the heating time and unnecessary preservation time, and ultimately achieving sustainable energy savings and a reduction in emissions.

2.3. Energy Efficiency Study for Industrial Furnaces Using Specific Software Tools

Filipponi et al. [35] investigated the forging industry, which typically begins by heating steel in furnaces and involves additional steps such as thermal treatments and various types of machining. This study used CFD simulation software and discovered that the energy loss from a typical forging furnace insertion/extraction process was 5606 MJ over 10 min, with most of the loss (5252 MJ) being caused by convective heat flow. The findings specifically showed that turbulence caused by temperature and pressure variations between the furnace’s inside and exterior is the primary reason for heat loss during the opening. The research findings demonstrated that decreasing the door opening duration from 157 s to 40 s can reduce energy loss, fuel usage, and environmental emissions. Mohite et al. [36] investigated the issue of minimizing heat loss through walls by finding the optimal wall thickness in an induction furnace. The study used the Ansys Workbench software and used Alumina, Magnesia, and Zirconia (with thermal conductivity values 16, 15, and 7.5 W/m·K, respectively) as the three types of ramming masses. The study commenced with a wall thickness of 50 mm for all three material types, with initial heat loss values of 1566, 1469, and 734 kWh, respectively. The optimal thicknesses were 170, 160, and 130 mm, resulting in heat loss values of 562, 528, and 288 kWh, respectively. The research concluded that the optimal geometry and characteristics of the ramming mass could decrease total losses by 60% through the induction furnace’s optimal wall thickness and material properties.
The feasibility of waste heat recovery and energy efficiency was evaluated by Si et al. [37] at a steel plant. Using the DOE software’s process heating assessment and survey tool (PHAST), the results showed that the overall efficiency of the reheat furnace was 60%. The research discovered that the losses from the flue gas were the largest source of energy waste in the reheat furnace, representing 29.5% of the total energy losses when the furnace was operating at full capacity. The research also revealed substantial heat losses from the wall, roof, and hearth, totaling 7,139,170 kJ/h during full operation, and suggested considering insulation. The study stated that using waste heat to preheat the billets to 315 °C would take 1.48 h and result in estimated annual energy savings of 215 thousand USD with a payback period of three years. It was estimated that switching the charge end from a fixed opening to a variable opening would reduce opening losses by 83%, yielding annual energy savings of 46 thousand USD. Jha et al. [38] used PHAST to assess the energy efficiency of a reheating furnace at a steel manufacturing facility. The temperature readings for various variables were taken every 5 min, and the average was calculated over three days for this study. The energy efficiency was recorded as 44.66% by PHAST, and flue gas loss was reported to be 40.2%, the highest among all losses accounted for during the operation.

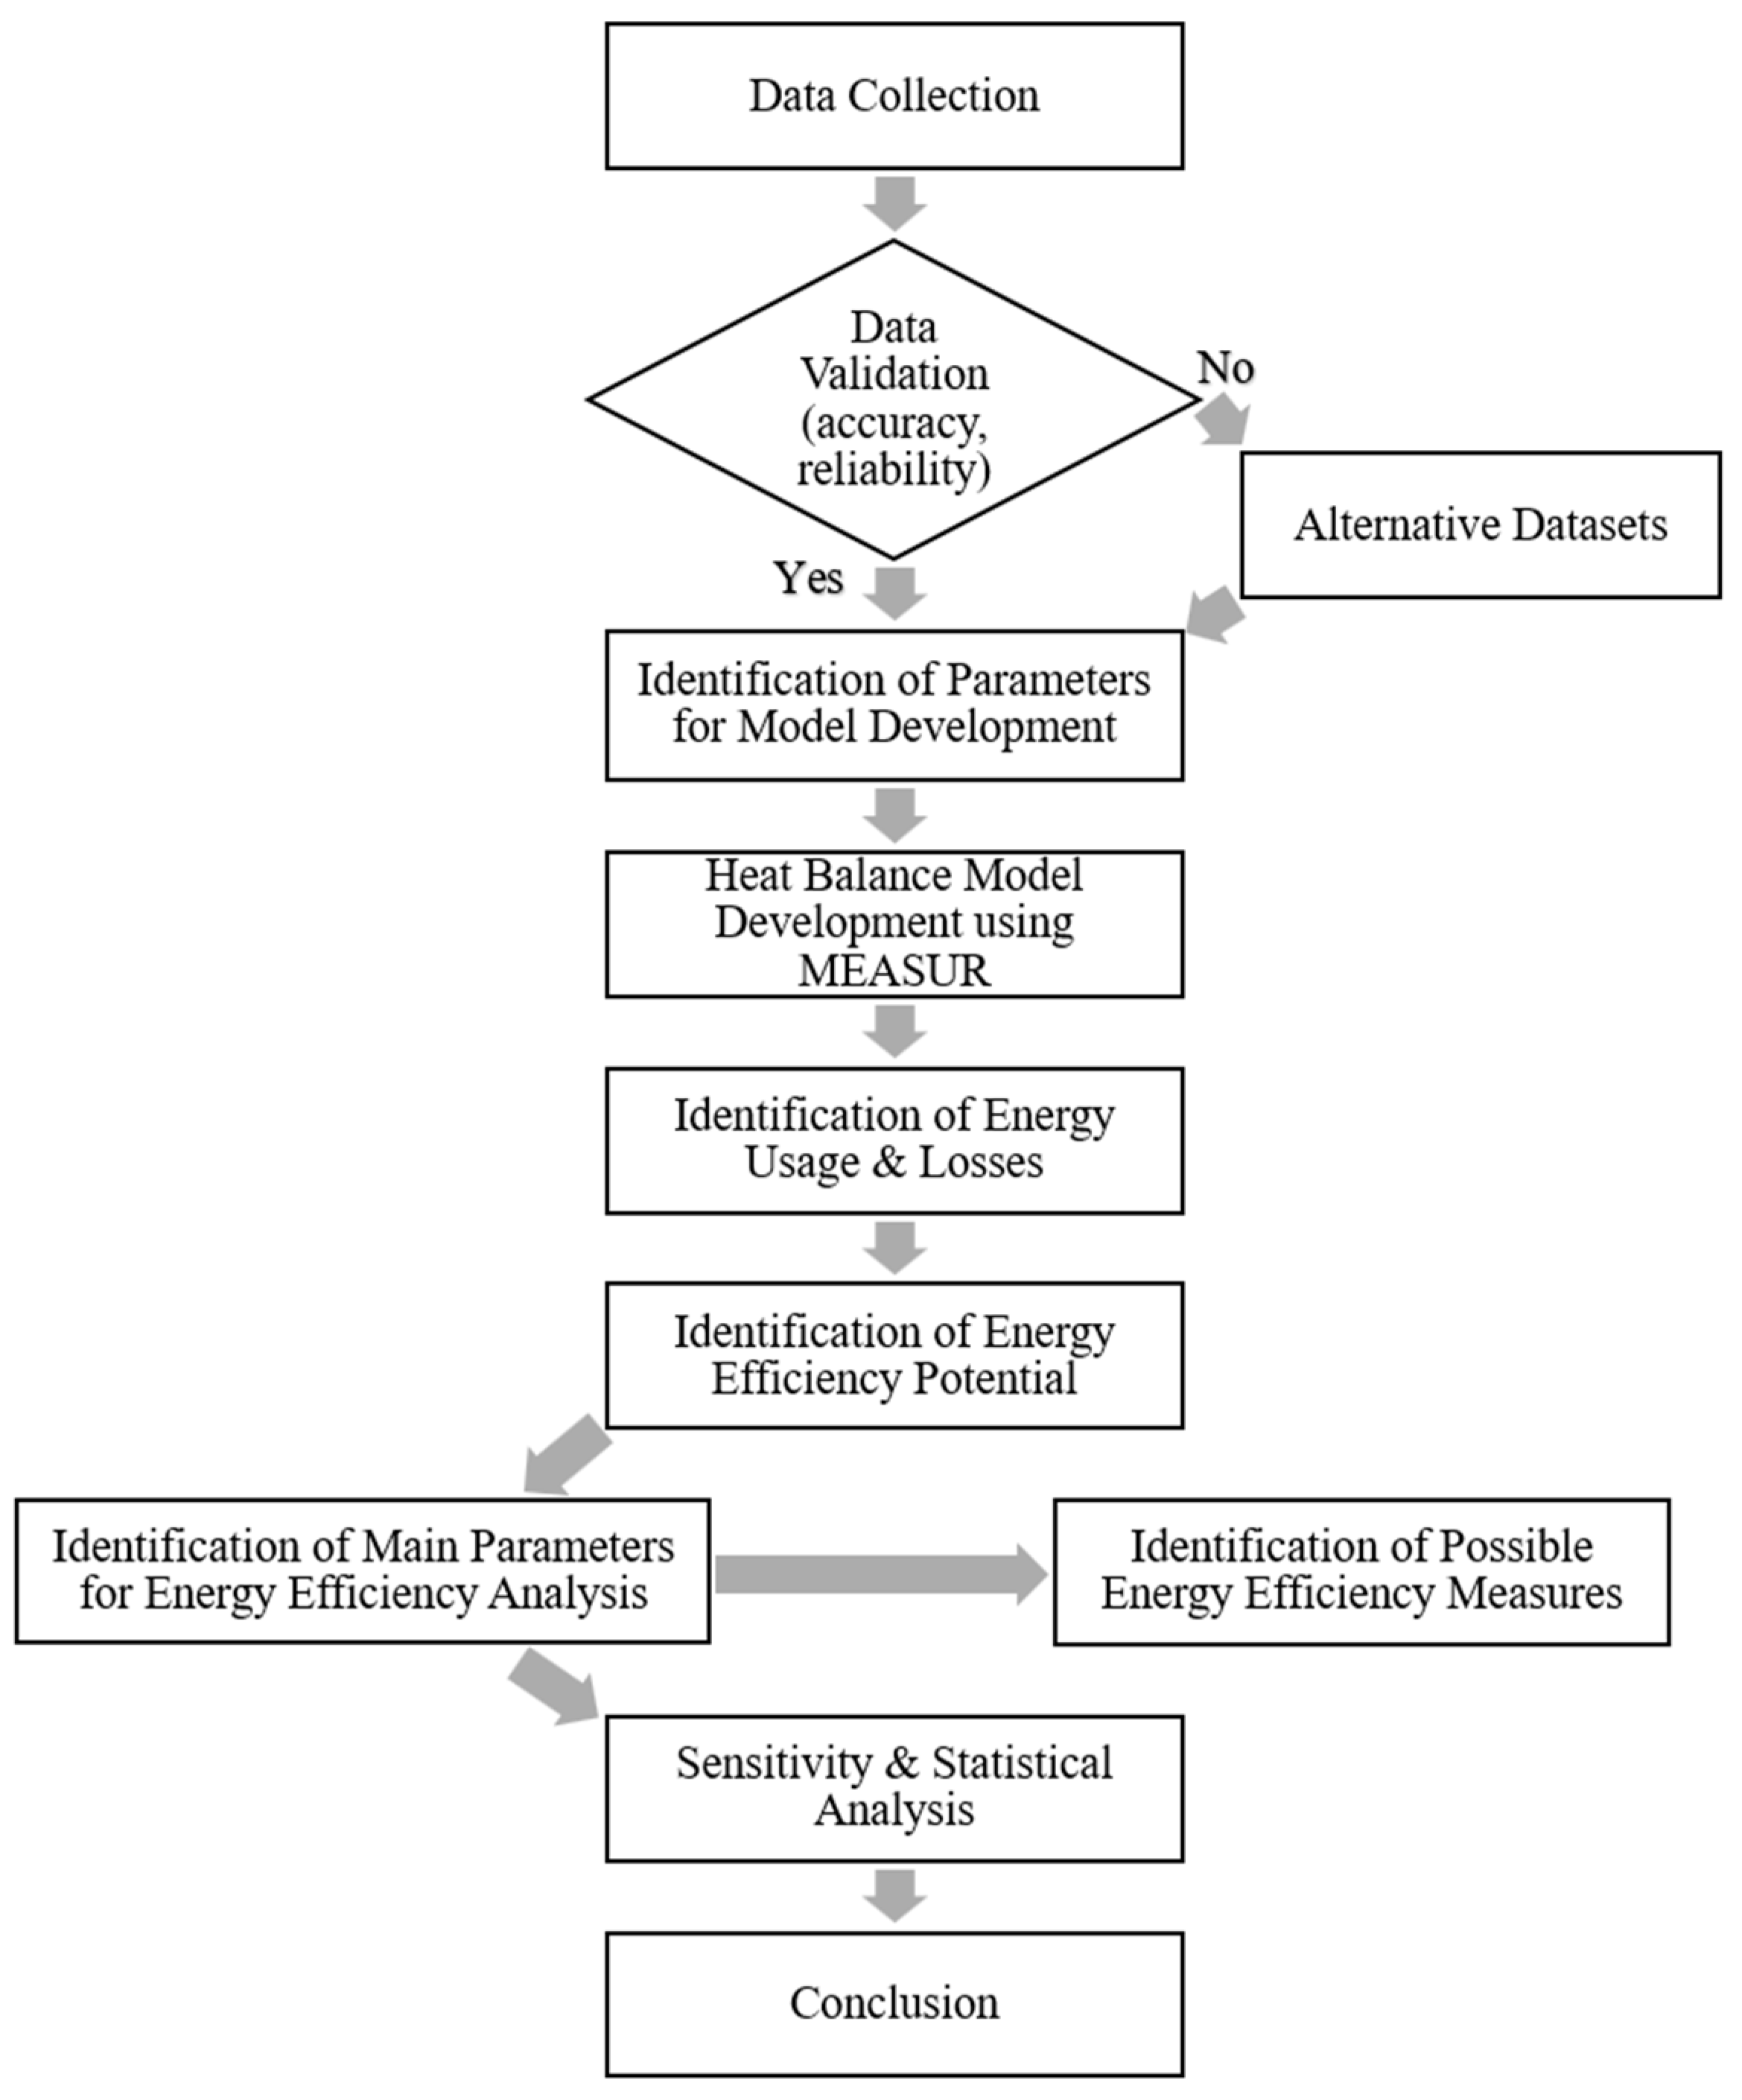
2.4. Research Approach

This research aims to model and analyze the heat energy needed for industrial furnaces using the MEASUR for one fuel-fired and one electric industrial furnace. The fuel-fired furnace analyzed is a heat treatment furnace, whereas the electric one is a steel-making electric arc furnace. The models are used to project energy utilization patterns across diverse operating conditions of industrial furnaces. A general outline of the research approach is depicted in Figure 1.
Heat balance is the fundamental tool used to make energy efficiency improvements to industrial furnaces, boilers, and steam systems [39]. Heat balance involves determining the total heat input to a system from various sources and the heat output from the system. Then, the input and the output are balanced to account for all of the heat [39]. The MEASUR employs a bottom-up heat balance analysis to determine the overall energy consumption of industrial furnaces. The heat balance equation for the industrial furnace can be expressed as follows:
Q = QL + QFL + QWL + QOL + QCL + QEL + QLL + QAL + QML
where,
  • Q = Total rate of heat input, in MMBtu/h or kW;
  • QL = Heat absorbed by the load;
  • QFL = Flue gas heat losses;
  • QWL = Heat loss through walls;
  • QOL = Heat losses through fixed/variable openings;
  • QCL = Heat losses through water/air cooling;
  • QEL = Heat losses through extended surfaces;
  • QLL = Heat losses through hot gas leakages;
  • QAL = Atmospheric heat losses;
  • QML = Miscellaneous heat losses.
Based on actual operational data, two baseline models have been developed for industrial furnaces; one each for those powered by fuel and the other for those powered by electricity. The System Setup section in the PHA module was utilized to build a baseline energy model by setting the industrial furnace’s baseline energy uses or losses.

2.5. Model Development

Here, the industrial furnace’s heat energy is modeled for two industrial furnaces located at separate manufacturing facilities in the United States. The first model is designed for a heat treatment pusher furnace, Industrial Furnace A, which is located in Michigan and runs on natural gas. The second model is for a steelmaking EAF, Industrial Furnace B, in Pennsylvania. Industrial Furnace A runs for a total of 5760 h per year, with its operational schedule consisting of three shifts per day, each eight hours long, five days per week, and spanning 48 weeks per year. As per the plant utility data, the cost of electricity is 0.05 USD per kWh, and the cost of natural gas is 9 USD per MMBtu. The emissions rates [40] of 52.91 kgCO2/MMBtu, 0.12 kgNOx/MMBtu, and 0.0003 kgSOx/MMBtu are used to calculate the emissions from natural gas. Table 1 displays a variety of categories and their respective baseline parameters that were used to establish a heat balance for Industrial Furnace A.
Industrial Furnace B is a hybrid industrial furnace with some chemical energy supplied by natural gas, coal carbon, and electrode material. Industrial Furnace B runs for a total of 6000 h per year. As per the plant utility data, the cost of electricity is 0.08 USD per kWh, and the cost of natural gas is 8 USD per MMBtu. The emissions rates [40] of 331.29 kgCO2/MWh, 0.174 kgNOx/MWh, 0.192 kgSOx/MWh, 52.91 kgCO2/MMBtu for natural gas, 96.1 kgCO2/MMBtu for coal carbon, and 151.2 kgCO2/MMBtu fpr the electrode (from MEASUR database) were used for the emissions calculations. Table 2 displays a variety of categories and their respective baseline parameters that were used to establish a heat balance.
Table 3 presents the baseline models for fuel-fired and electric furnaces. The models were developed using actual operational data from industrial furnaces as baseline values shown in Table 1 and Table 2 above. These baseline models will serve as a reference for generating modified scenarios to study industrial furnace energy efficiency.

3. Model Analysis and Results

3.1. Model Modification for Industrial Furnace

After the baseline for an industrial furnace was established, areas that could be optimized for industrial furnace energy efficiency and emissions were identified. This involved scrutinizing the models and their inputs to understand how they interact with each other and affect the furnace’s overall performance. For this, ten energy efficiency strategies were developed that were specific to areas with high energy uses or losses, using the heat balance analysis in MEASUR to pinpoint these regions to improve the industrial furnace’s performance and reduce its heat energy consumption.

3.2. Percentage Change Analysis

The percentage change method is used as a sensitivity analysis approach to evaluate how sensitive a heat input is to changes in specific parameters. In this method the energy efficiency measures identified earlier are subjected to two levels of variation: a low level and a high level. Low- and high-level values were selected based on previous research and the feasible operational limits of Industrial Furnaces A and B and were calculated at these two levels relative to the baseline heat input, as listed in Table 2 and Table 3 below. (In Table 2 and Table 3, the nomenclature are: OF = oxygen in flue (%); CT = combustion air temperature (°F); CHT = charge temperature (°F); FD = furnace draft (inH2O; ST = average surface temperature (°F); WS = wind speed (mph); SE = surface emissivity; FT = fixture temperature (°F); FM = fixture material (specific heat: (Btu/(lb-°F)); TO = time open (%); H_current = current heat input (Btu/h); H_low = heat input at a low level (Btu/h); H_high = heat input at a high level (Btu/h)).
In the analysis shown in Table 4, it is clear that oxygen in flue gas (OF), average surface temperature (ST), and combustion air temperature (CT) are most sensitive to the heat input based on the percentage change method. It follows on from this that the energy efficiency measures that are most sensitive to the heat energy consumption of Industrial Furnace A optimize the excess air percentage, improving the insulation, and preheating the combustion air.
In the analysis shown in Table 5, charge temperature (CHT), average surface temperature (ST), and time open (TO) are the parameters that are most sensitive to heat input. This relates to the fact that the energy efficiency measures that are most sensitive to the heat energy consumption of Industrial Furnace B are preheating the charge, improving the insulation, and minimizing the opening time of the furnace doors. Minimizing the opening time is required since thermal energy is lost through the openings in industrial furnaces during operation [41].

3.3. Fractional Factorial Design

A fractional factorial design is used as a statistical approach to determine the most significant factors affecting the heat input in industrial furnaces. The use of a fractional factorial design reduces the number of experimental runs required while permitting a comprehensive analysis of the effects of a subset of factors on a response variable. The statistical software R was utilized to design the two-level fractional factorial experiment with 16 runs and then to quantify the relationship between the ten factors mentioned earlier and the response variable heat input through regression analysis.
Multiple linear regression (MLR) analysis was performed for the fractional factorial design to investigate the relationship between the ten predictor variables and the response variable heat input. The p-value at a 5% significance level was used in this statistical analysis to evaluate the significance of each factor under consideration. In addition, the multiple R-squared and adjusted R-squared values were used to evaluate the model’s overall goodness of fit. The analysis produced some remarkable findings that provided insight into the importance and influence of each predictor variable. Table 6 and Table 7 present the findings of the multiple linear regression analyses.
It can be inferred, based on the p-values presented in Table 6, that oxygen in flue gas (OF), average surface temperature (ST), and combustion air temperature (CT) are the most significant parameters affecting the heat input, with corresponding p-values of 4.37 × 10⁻⁹, 2.44 × 10⁻⁸, and 2.78 × 10⁻⁷, respectively. Therefore, the energy efficiency measures that significantly impacted the heat energy consumption of Industrial Furnace A were optimizing the excess air percentage, improving the insulation, and preheating the combustion air.
From the p-values shown in Table 7, it can be concluded that the charge temperature (CHT), average surface temperature (ST), and time open (TO) were the most significant factors affecting heat input, with p-values of 6.13 × 10⁻⁵, 0.000935, and 0.008465 respectively. Hence, the energy efficiency measures that significantly impacted the heat energy consumption in Industrial Furnace B were preheating the charge, improving the insulation, and minimizing the opening time of furnace doors.
Figure 2 and Figure 3 display rankings of the significance of the studied parameters for heat energy input.
Figure 4 displays the CO2, NOx, and SOx emissions for each of the 16 experiments. It is evident that the emissions are proportional to the heat energy input, and implementing energy efficiency measures will play a significant role in reducing these emissions. Similarly, Figure 5 represents the electrical heat input and CO2, NOx, and SOx emissions for Industrial Furnace B. Taking steps to improve energy efficiency will be crucial in decreasing these emissions.

3.4. Result from Optimal Operating Condition

The optimal scenarios have been identified for both furnaces by selecting the best parameter values for the parameters considered in the fractional factorial analysis in this study. These scenarios have only been established for a comparative study with the baseline; however, better conditions may exist depending on the number of energy efficiency measures implemented and the extent of variation in the parameters. The results of this analysis are shown in Table 8 and Table 9 for Industrial Furnace A and Industrial Furnace B, respectively. Furthermore, the scenarios with the best parameter values for the three most significant parameters have been created, and the results are shown in Table 8 and Table 9 for Industrial Furnace A and Industrial Furnace B, respectively.
It can be observed that the total heat input and emissions are decreased by 31% for Industrial Furnace A and by 15% for Industrial Furnace B by employing the optimal conditions. Similarly, by employing the optimal conditions for the three most significant parameters, the total heat input and emissions are decreased by 21% for Industrial Furnace A and 13% for Industrial Furnace B.

3.5. Comparative Analysis of Fuel-Fired and Electric Industrial Furnaces

A comparative study was performed between a fuel-fired industrial furnace and an equivalent electrical furnace to evaluate the energy requirements and emissions created by two distinct energy sources for similar thermal demands and parameter spectrums and the prospect of the electrification of fuel-based industrial furnaces was investigated. The fuel-fired furnace chosen was Industrial Furnace A, and it was contrasted with the equivalent electrical resistance furnace. The findings of this evaluation are presented in Table 10 and are graphically shown in Figure 6. The results showed that the total heat input for the fuel-fired furnace was 57% higher than the equivalent electrical resistance furnace. This is due to the absence of flue gas losses in electrical resistance furnaces, which accounts for a significant portion of the total heat input in fuel-fired furnaces.
This comparison illustrated that electric industrial furnaces are generally more energy efficient, and fuel-fired furnaces require a greater focus on combustion optimization. In contrast, the CO2 emissions from the electrical resistance furnace were 68% higher than those from the fuel-fired furnace. This is because the specific energy mix used to generate electricity determines the emissions rates of any region.

3.6. Analytical Validation of PHA Heat Balance

An attempt has been made in this section to examine the PHA heat balance results analytically to determine their accuracy in the process heating evaluation for industrial furnaces. For this purpose, an analysis has been carried out for the flue gas using the PHA and analytical methods to calculate and compare the flue gas loss and total heat input to the fuel-fired industrial furnace. An excess air percentage is recommended for combustion and flue gas analysis; however, determining the excess air percentage is not always feasible. Determining the percentage of oxygen in flue gas is the simplest way and this can be measured using a flue gas analyzer. The bottom-up heat balance analysis uses the percentage of available heat approach. The available heat in a combustion system can be determined using the available heat charts. Figure 6 shows one of the available heat charts, for natural gas in particular (1000 Btu/ft3), considering a combustion air temperature of 60 °F. Let us consider the hypothetical conditions of a fuel-fired furnace with the following specifications:
Type of fuel usedNatural gas
Charge Stainless steel—300 series
Average specific heat (solid)0.14 Btu/lb-°F
Melting point2550 °F
Charge feed rate825 lb/h
Charge inlet temperature60 °F
Charge outlet temperature525 °F
Flue gas temperature1200 °F
Combustion air temperature60 °F
Ambient air temperature60 °F
Oxygen in flue gas11%
The heat required by the charge (HC) can be evaluated as [42]:
H C = Charge feed rate × specific heat × changes in temperature   = 825   l b / h × 0.14   B t u / l b - ° F × ( 525 60 )   ° F   = 53,707.50   B t u / h
The percentage of available heat for the given conditions can be calculated as being 44.50% from Figure 7, which is represented by an orange line. Considering no other losses for the current analysis, the net heat required by the furnace will be the heat required by the charge, i.e., 53,707.50 Btu/h, and 55.50% of the heat energy will be lost through the stack. The flue gas loss (FGL) from the industrial furnace can be evaluated as follows [42]:
Flue gas loss   ( FG L ) = N e t   h e a t   r e q u i r e d A v a i l a b l e   h e a t   ( % ) N e t   h e a t   r e q u i r e d   = 53,707.50   B t u / h 0.445 53,707.50   B t u / h   = 66,983.51   B t u / h
The total heat input (HI) or gross heat input from the industrial furnace can be determined as [42]:
Total heat input   ( HI ) = Net heat required + Flue gas loss   = 53,707.50   B t u / h + 66,983.51   B t u / h   = 12,691   B t u / h
The total heat input for this scenario using MEASUR is 121,403 Btu/h, which is almost in agreement with the analytically calculated value of 120,691 Btu/h, confirming the accuracy of MEASUR in analyzing the heating process of industrial furnaces. The slight disparity between the two values could be attributed to the potential errors in decimal point readings for the available heat or the fuel parameters.

4. Conclusions and Future Work

MEASUR was employed in this study to develop a baseline model for both fuel-fired and electric furnaces. The heat balance was determined for each baseline model by considering the diverse energy losses arising during operational phases. Verifying the heat balance of industrial furnaces and the efficacy of MEASUR as a tool for this purpose was carried out by comparing the baseline and analytical results. Potential energy efficiency measures were identified based on the baseline results, and a sensitivity analysis was performed by creating three modified scenarios and varying the key parameters associated with those measures. A percentage change analysis was conducted to determine the change in heat input by modifying the parameters at two levels, considering the practical and feasible limits. In the subsequent step, a two-level fractional factorial experimentation with 16 runs was designed, and a regression analysis was performed using the statistical tool R. The relationships between independent parameters (ten for Industrial Furnace A and eight for Industrial Furnace B) and the response variable heat input were quantified through multiple regression analysis (MLR). The MLR analysis was used to illustrate the parameters’ significance and identify the most significant parameters for both industrial furnaces. The goodness of fit for the regression models was analyzed and confirmed by the R-squared values, adjusted R-square values, p-values associated with the F-statistic, and residual plots. A summary of the key findings of this study is shown below:
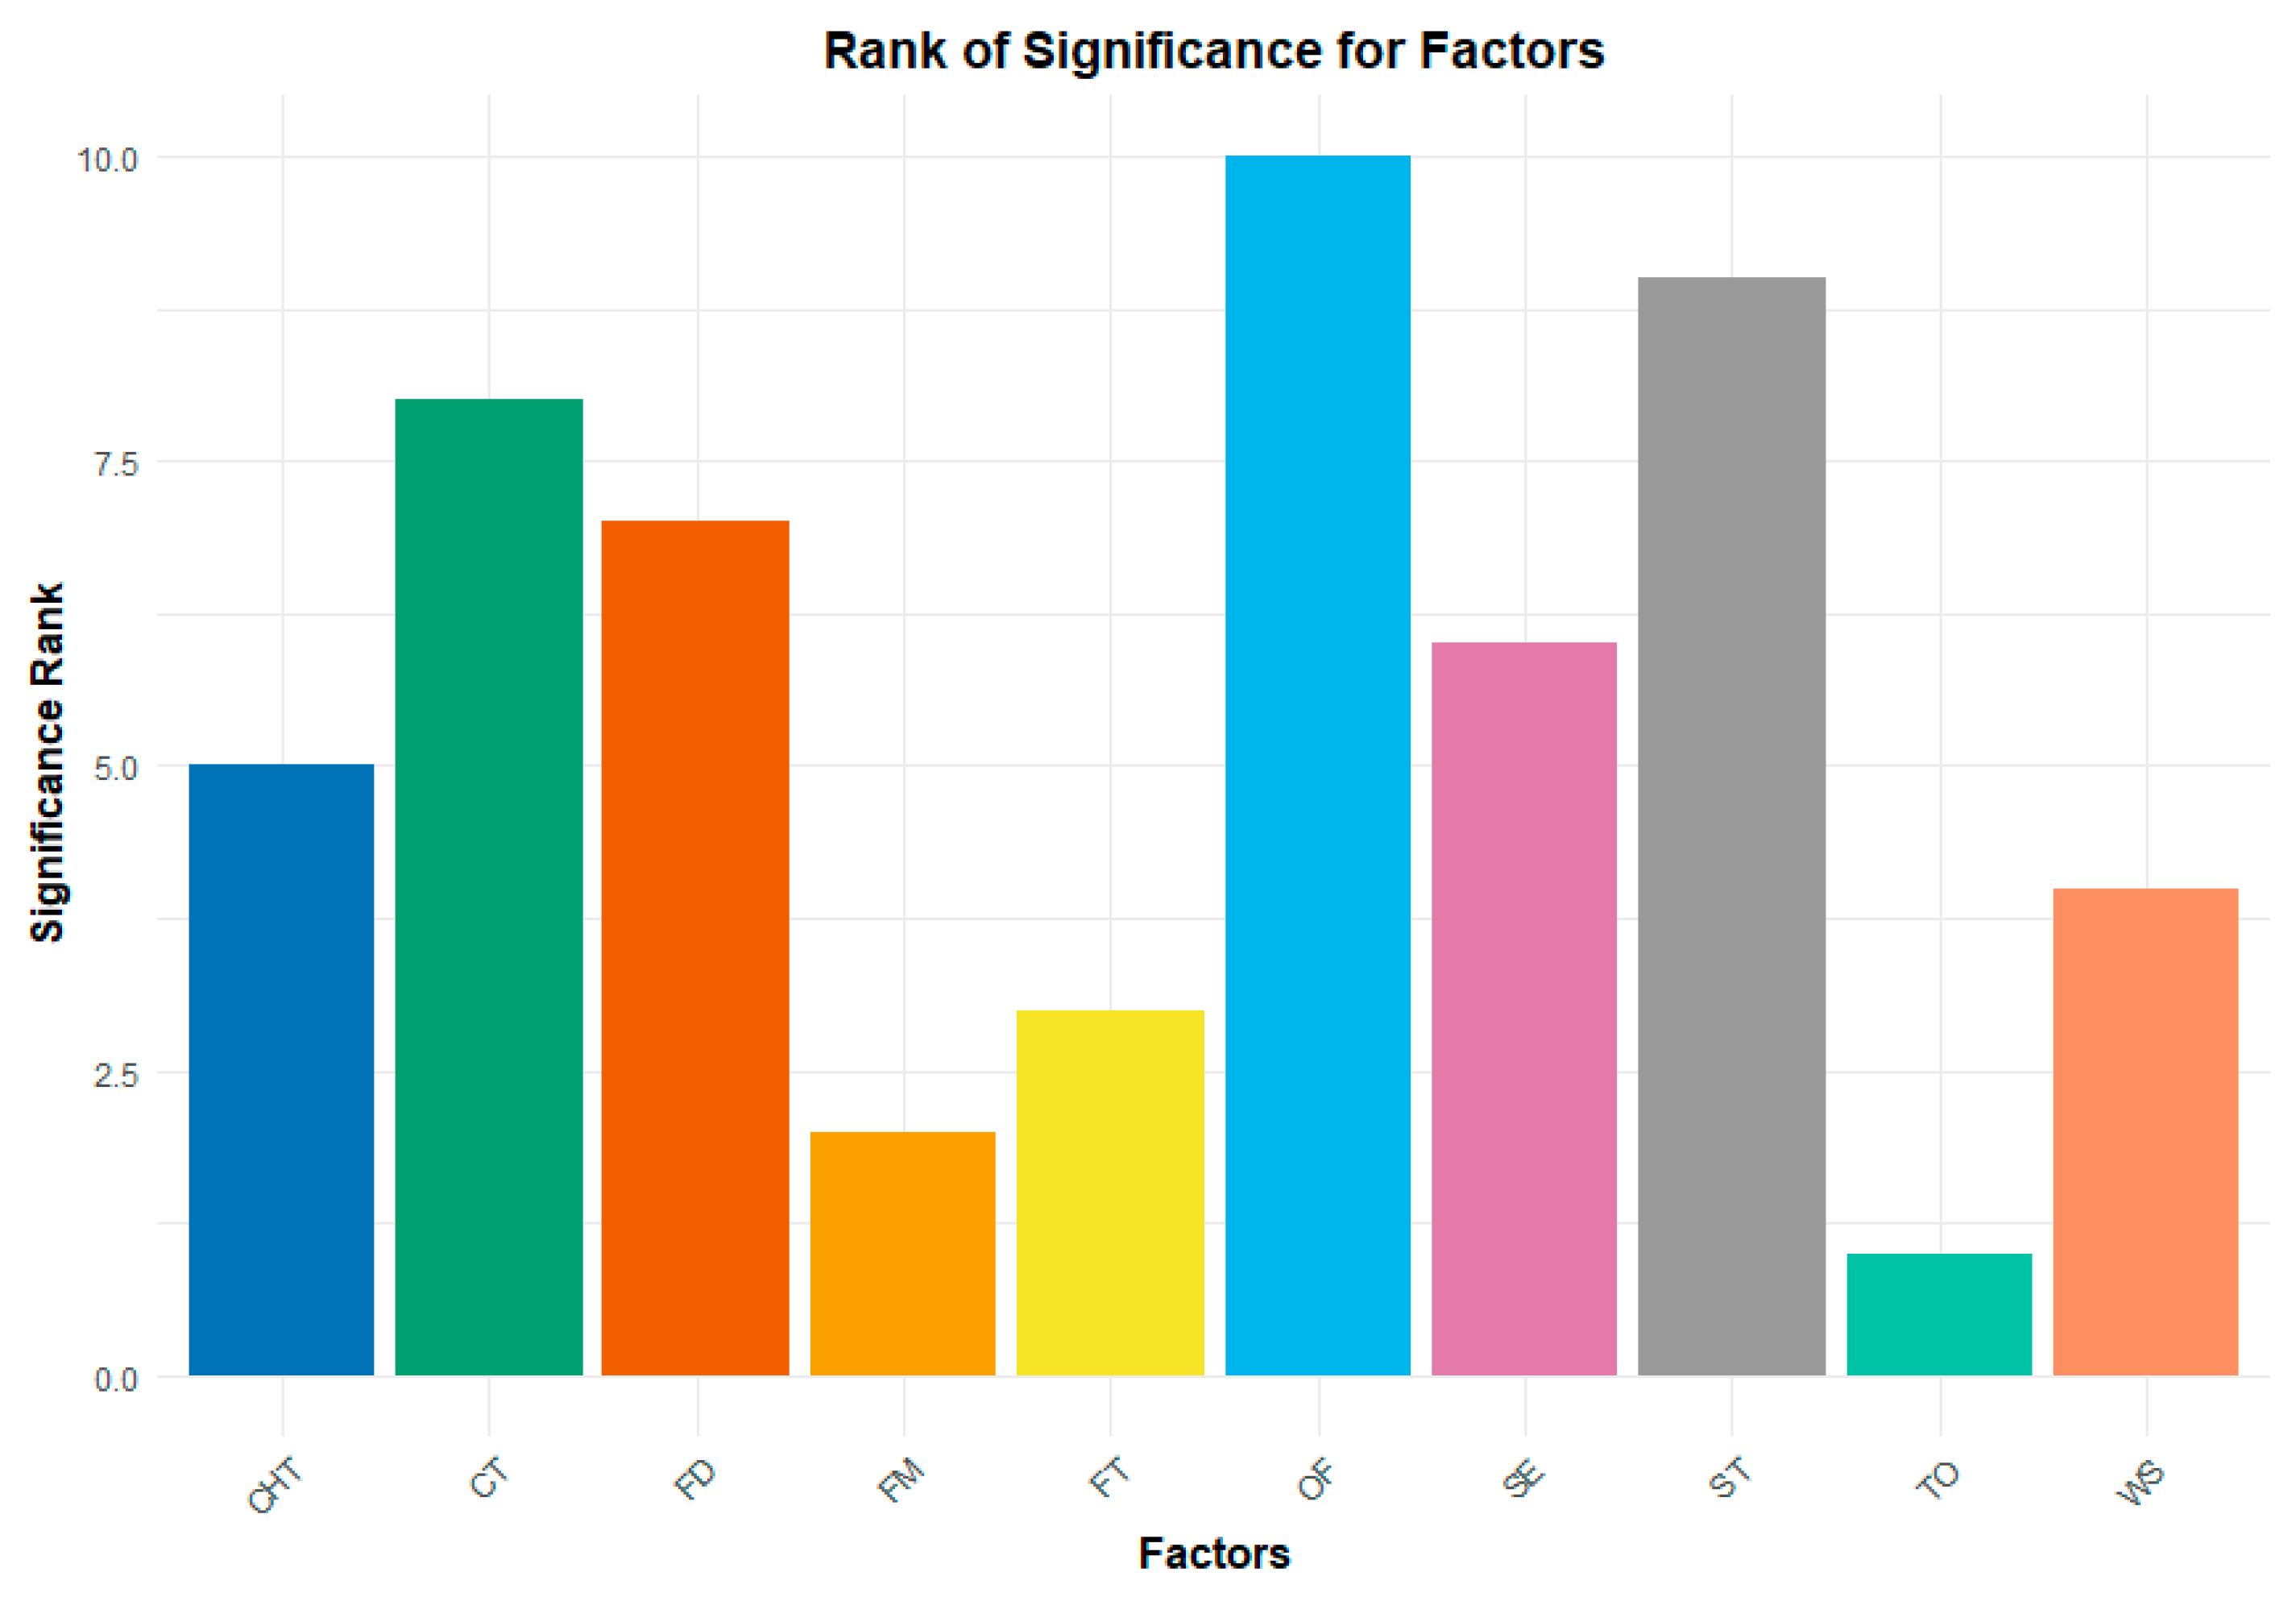
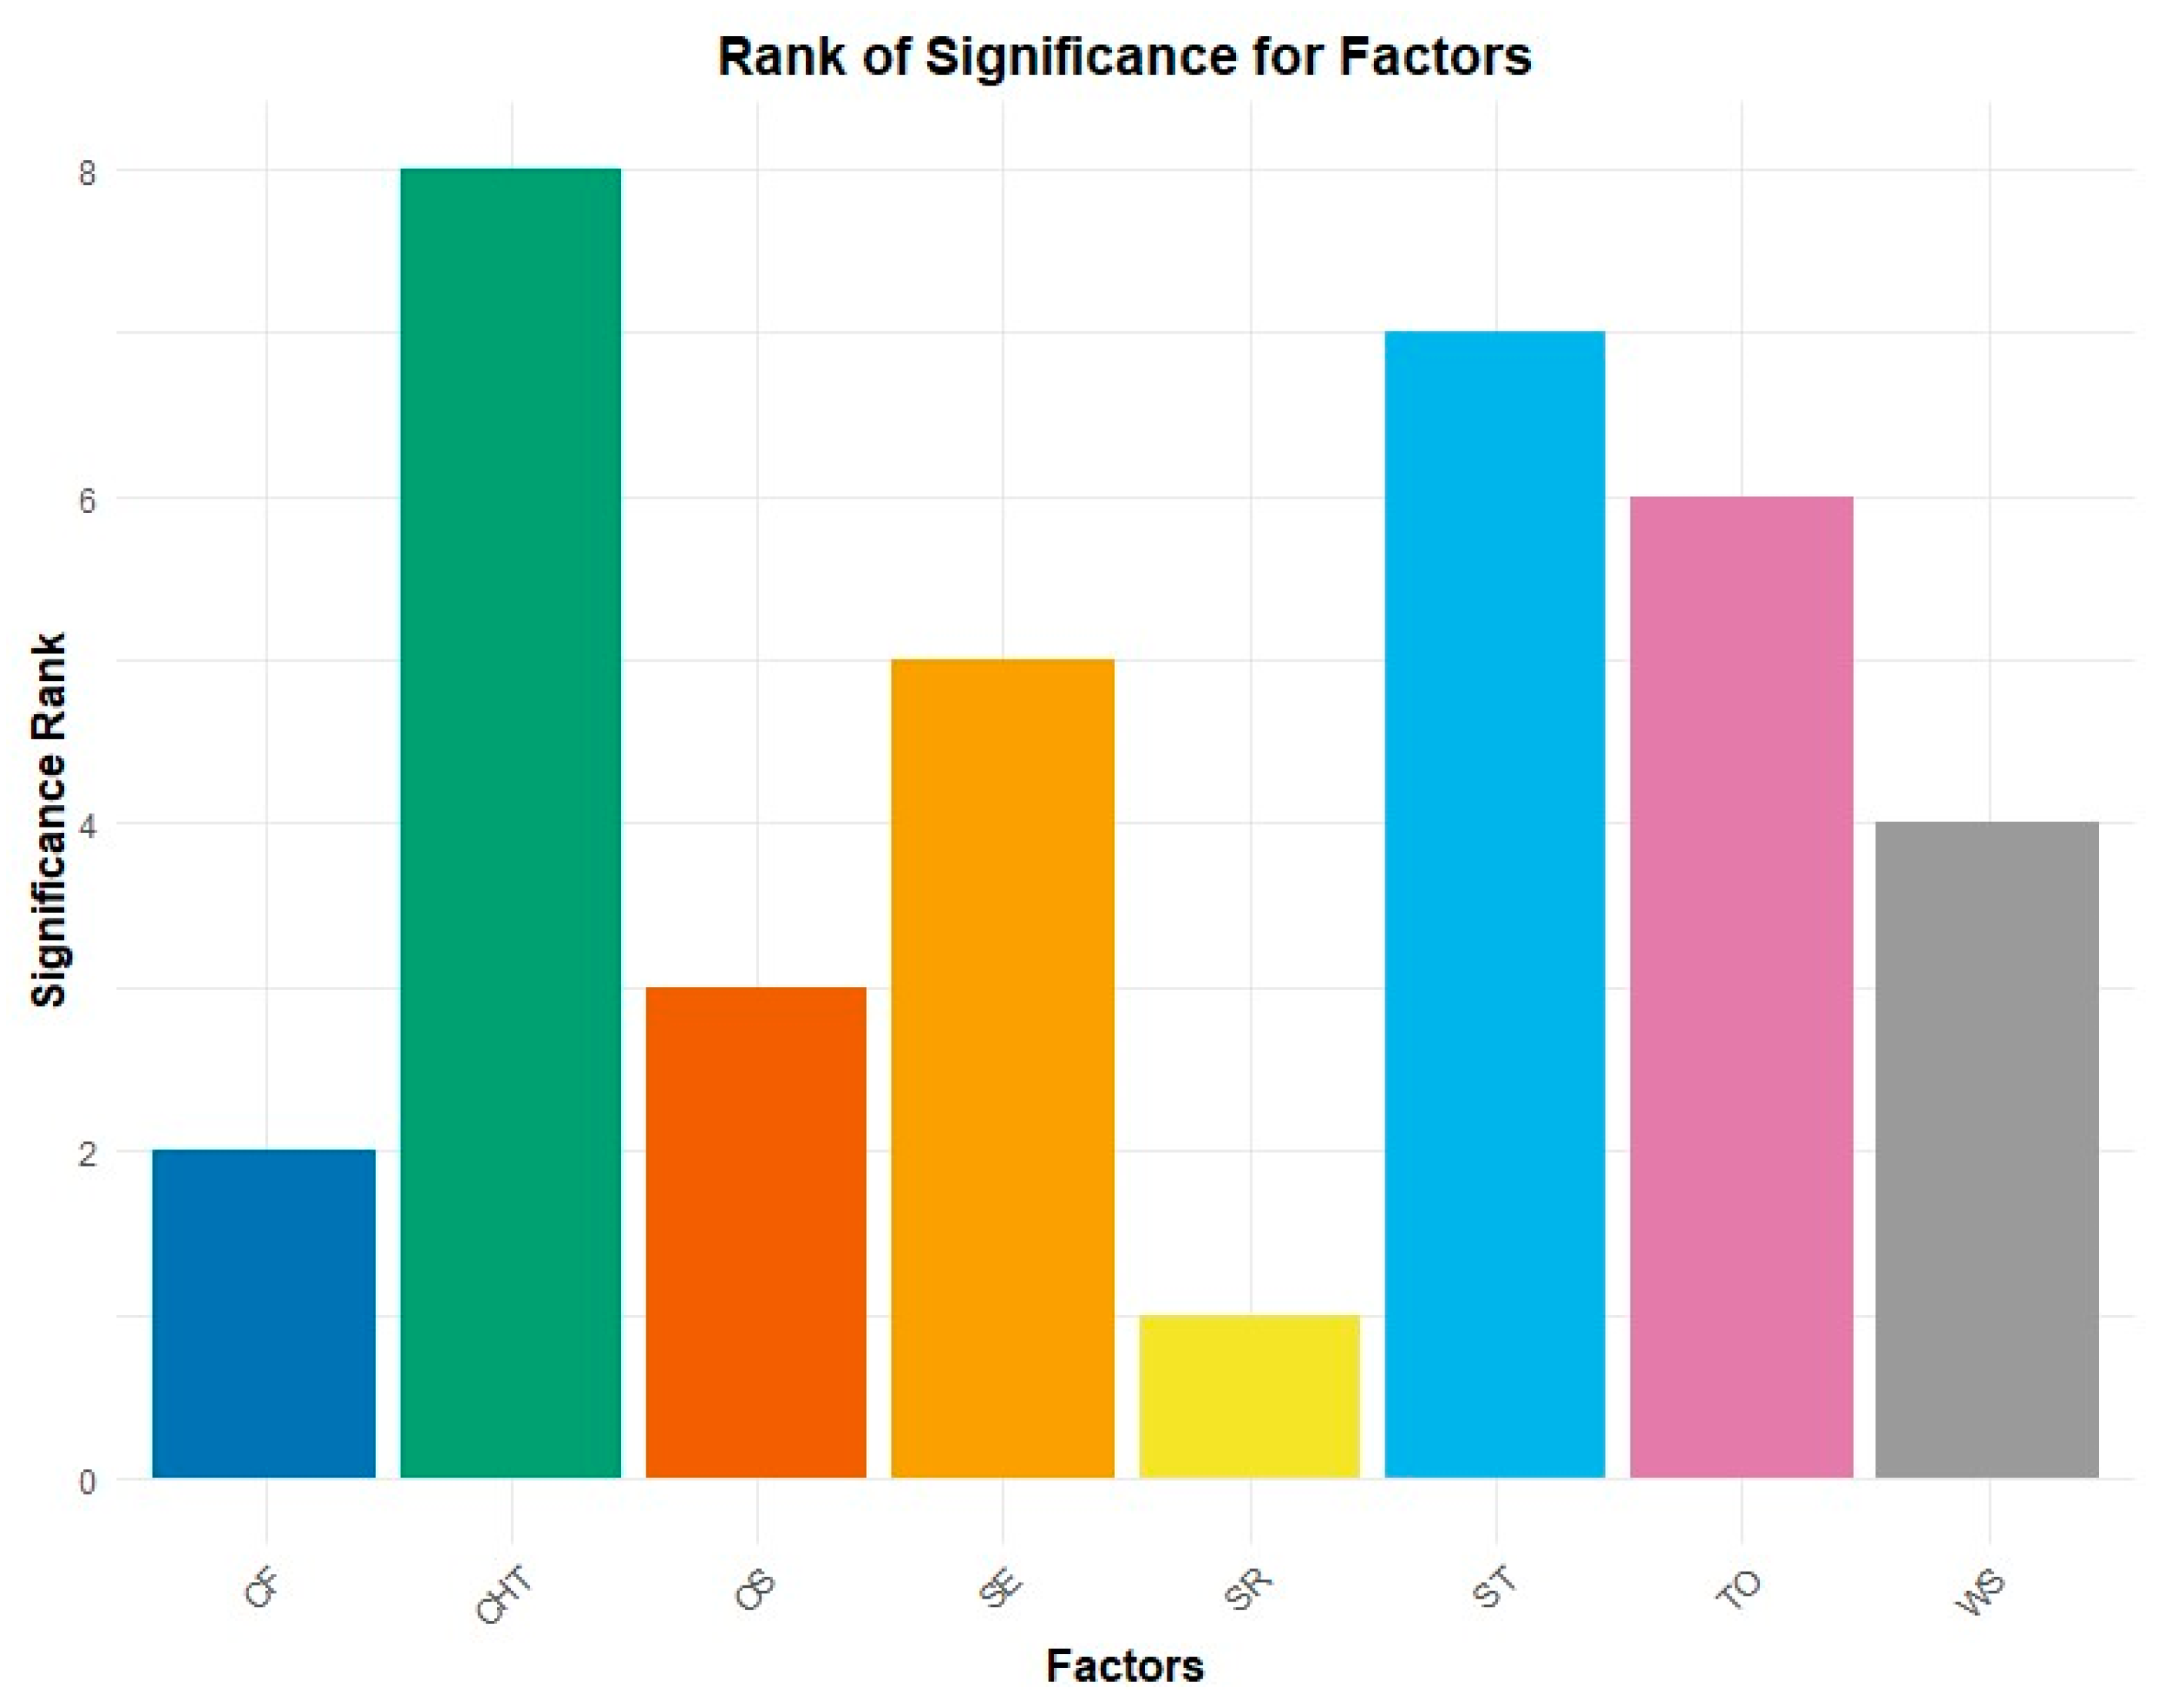
  • The three most significant parameters affecting the heat input in Industrial Furnace A are excess air percentage or the oxygen percentage in flue gas (OF), average surface temperature (ST), and combustion air temperature (CT) with p-values of 4.37 × 10⁻⁹, 2.44 × 10⁻⁸, and 2.78 × 10⁻⁷, respectively, and for Industrial Furnace B are charge temperature (CHT), average surface temperature (ST), and time open (TO) with p-values of 6.13 × 10⁻⁵, 0.000935, and 0.008465, respectively
  • The three most significant energy efficiency measures to heat input for Industrial Furnace A are optimizing the excess air percentage, improving the insulation, and preheating the combustion air, and for Industrial Furnace B they are preheating the charge, improving the insulation, and minimizing the opening time of the furnace doors.
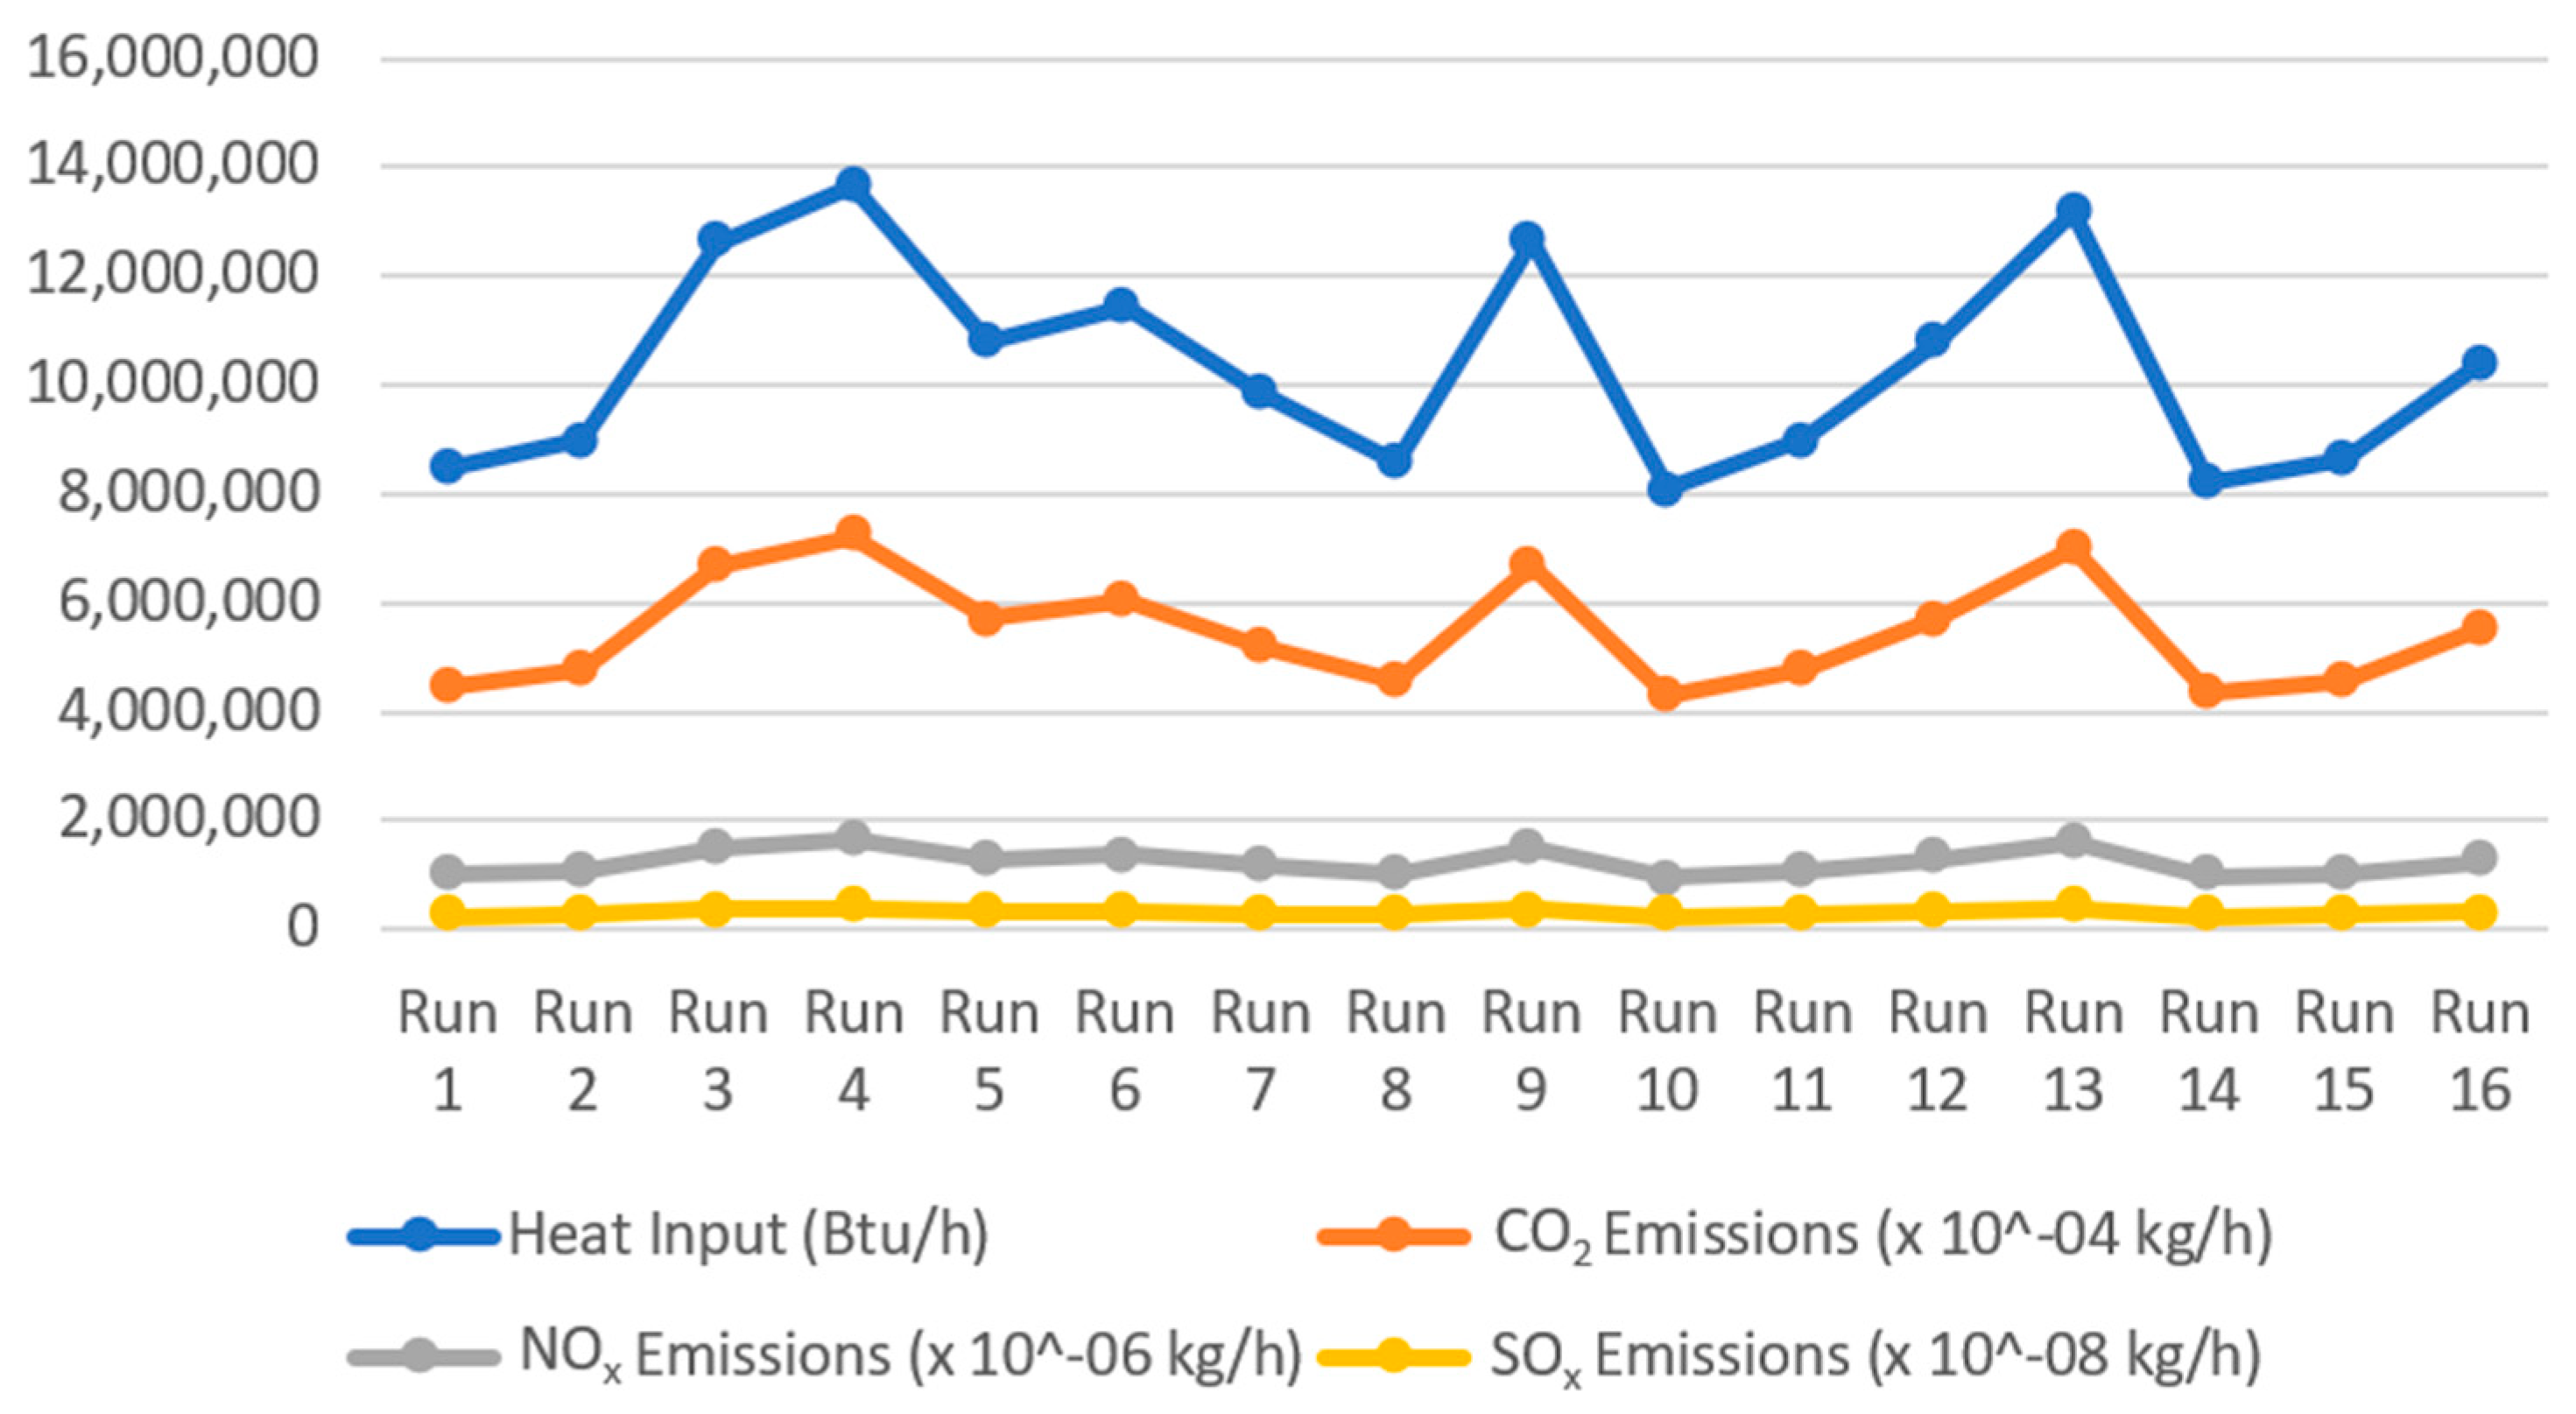
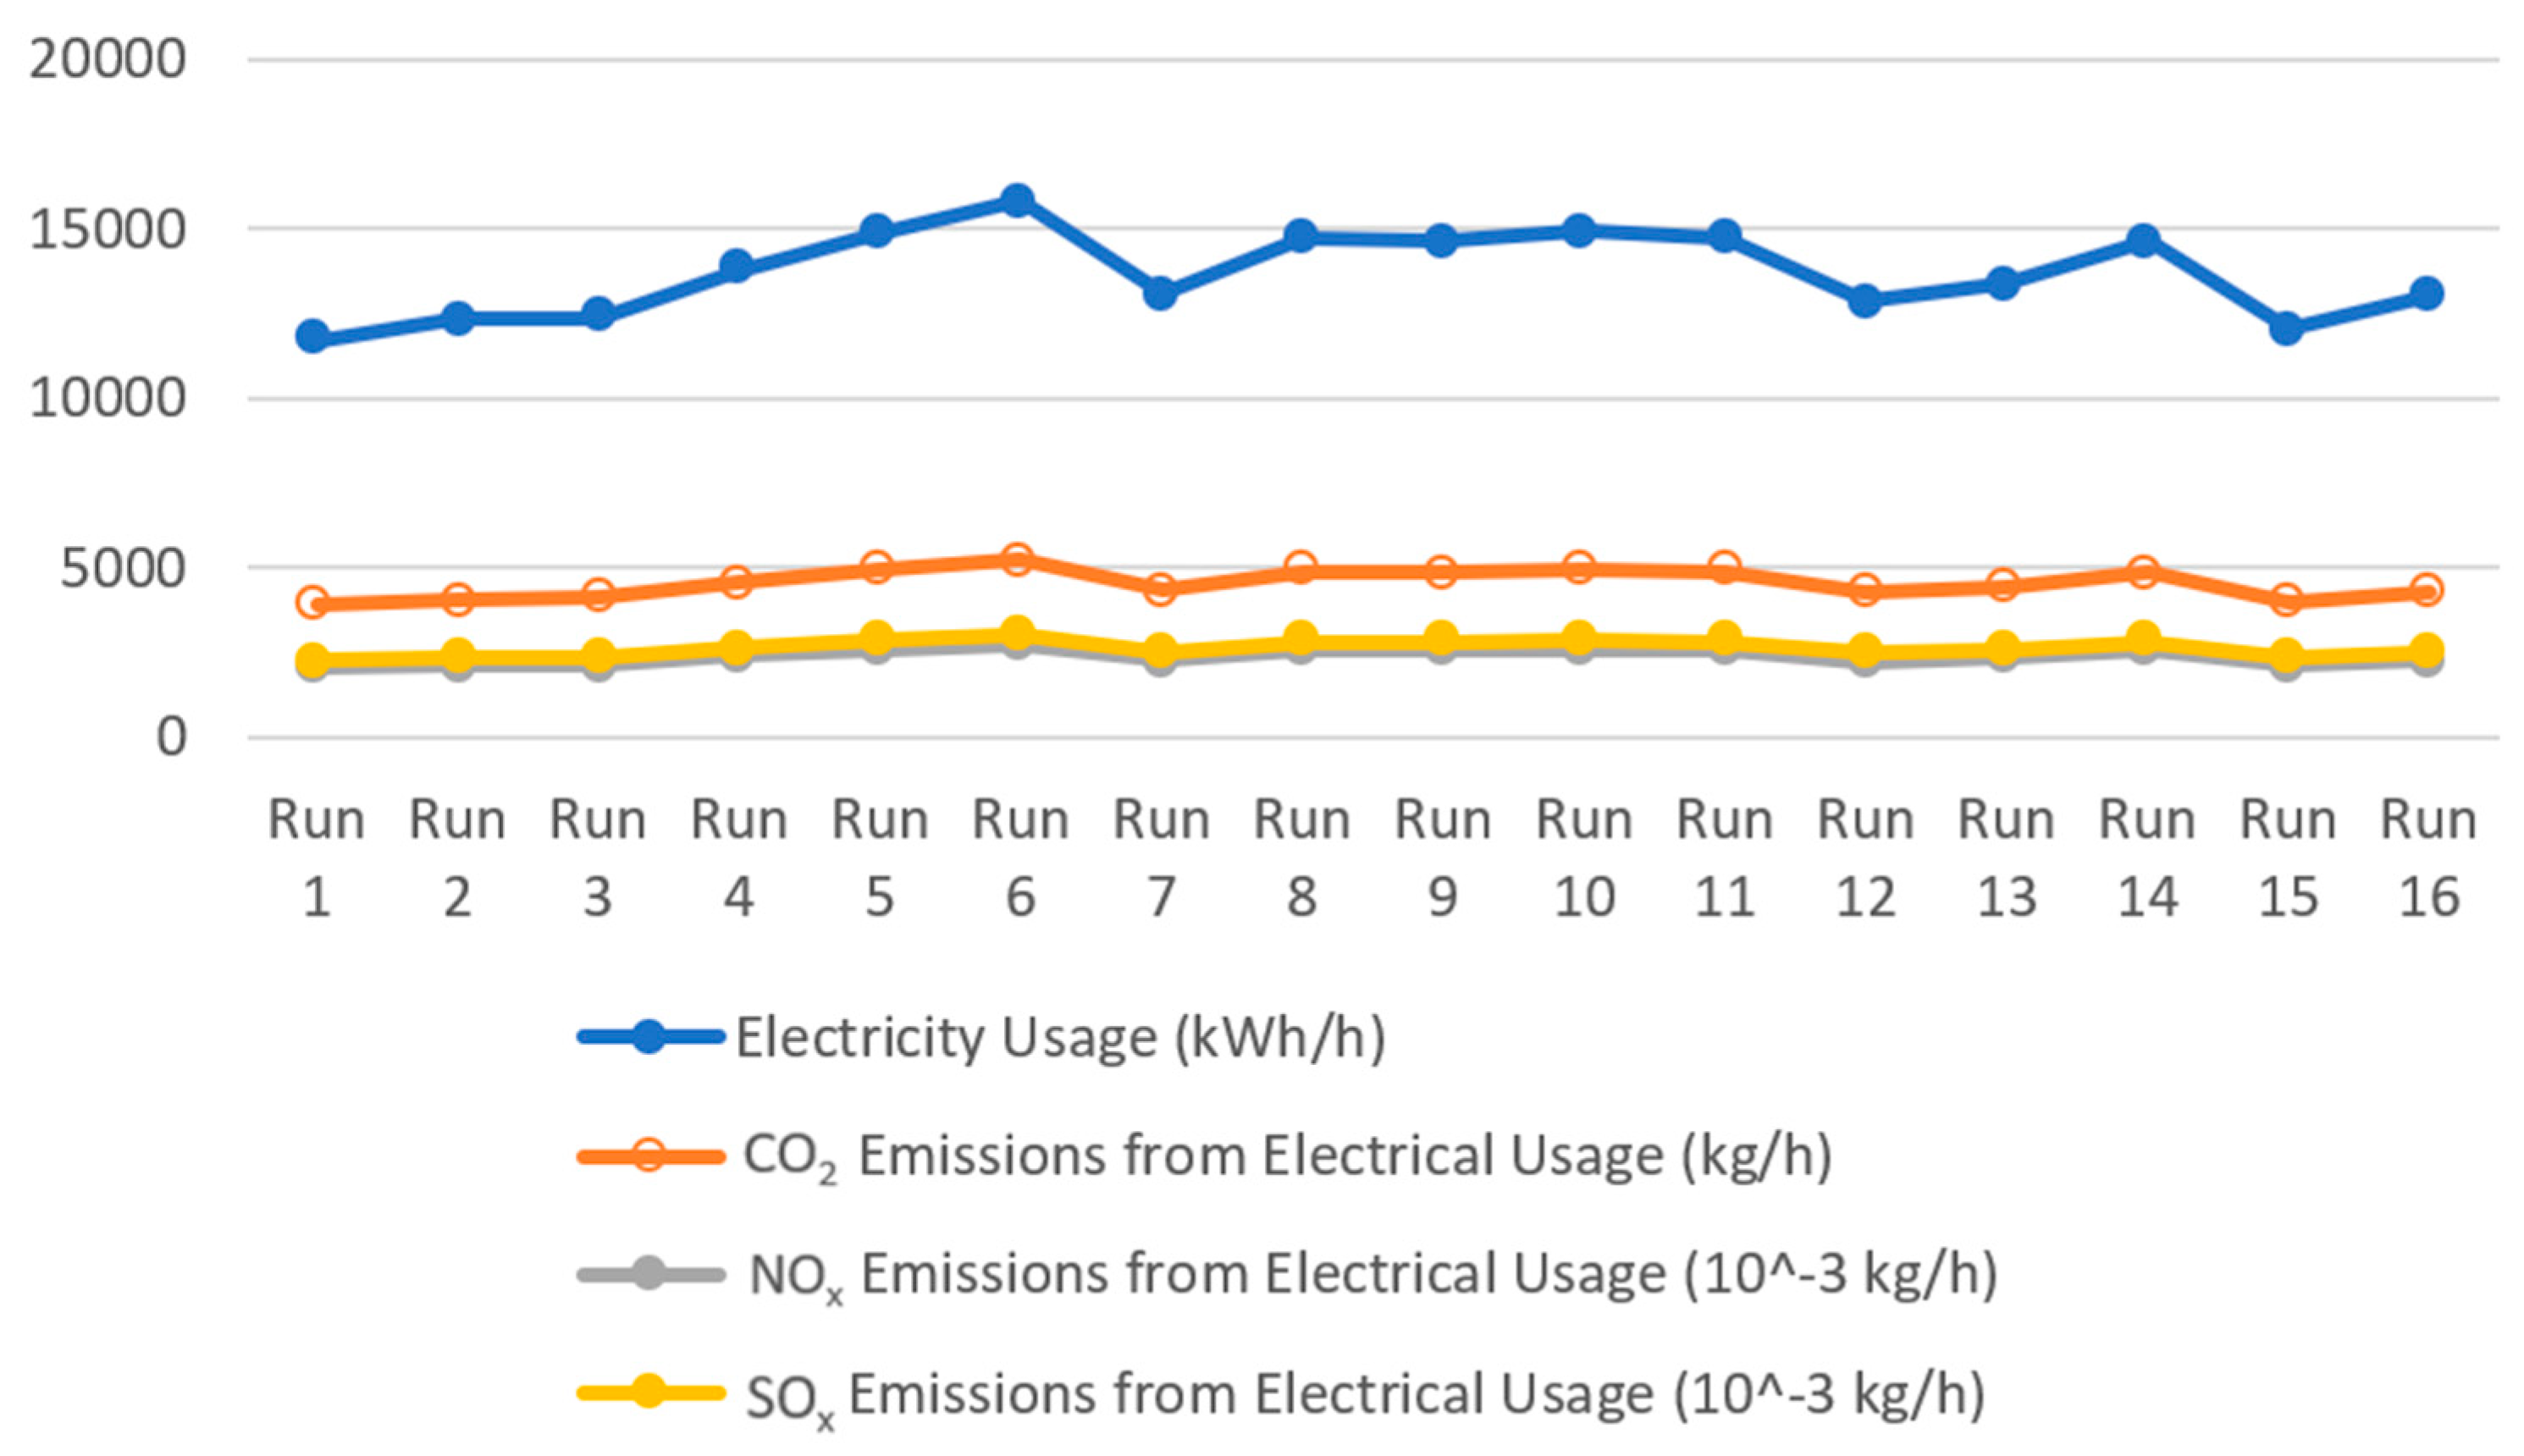
  • CO2, NOx, and SOx emissions are proportional to the heat input in both industrial furnaces, and employing energy efficiency measures will significantly reduce the emissions.
  • The total heat input and emissions decreased by 31% for Industrial Furnace A and 15% for Industrial Furnace B by employing the optimal conditions of furnace operations based on the parameters used for the fractional factorial design experimentation.
  • The total heat input and emissions decreased by 21% for Industrial Furnace A and by 13% for Industrial Furnace B by employing the optimal conditions of the three most significant parameters based on the parameters used for the fractional factorial design experimentation.
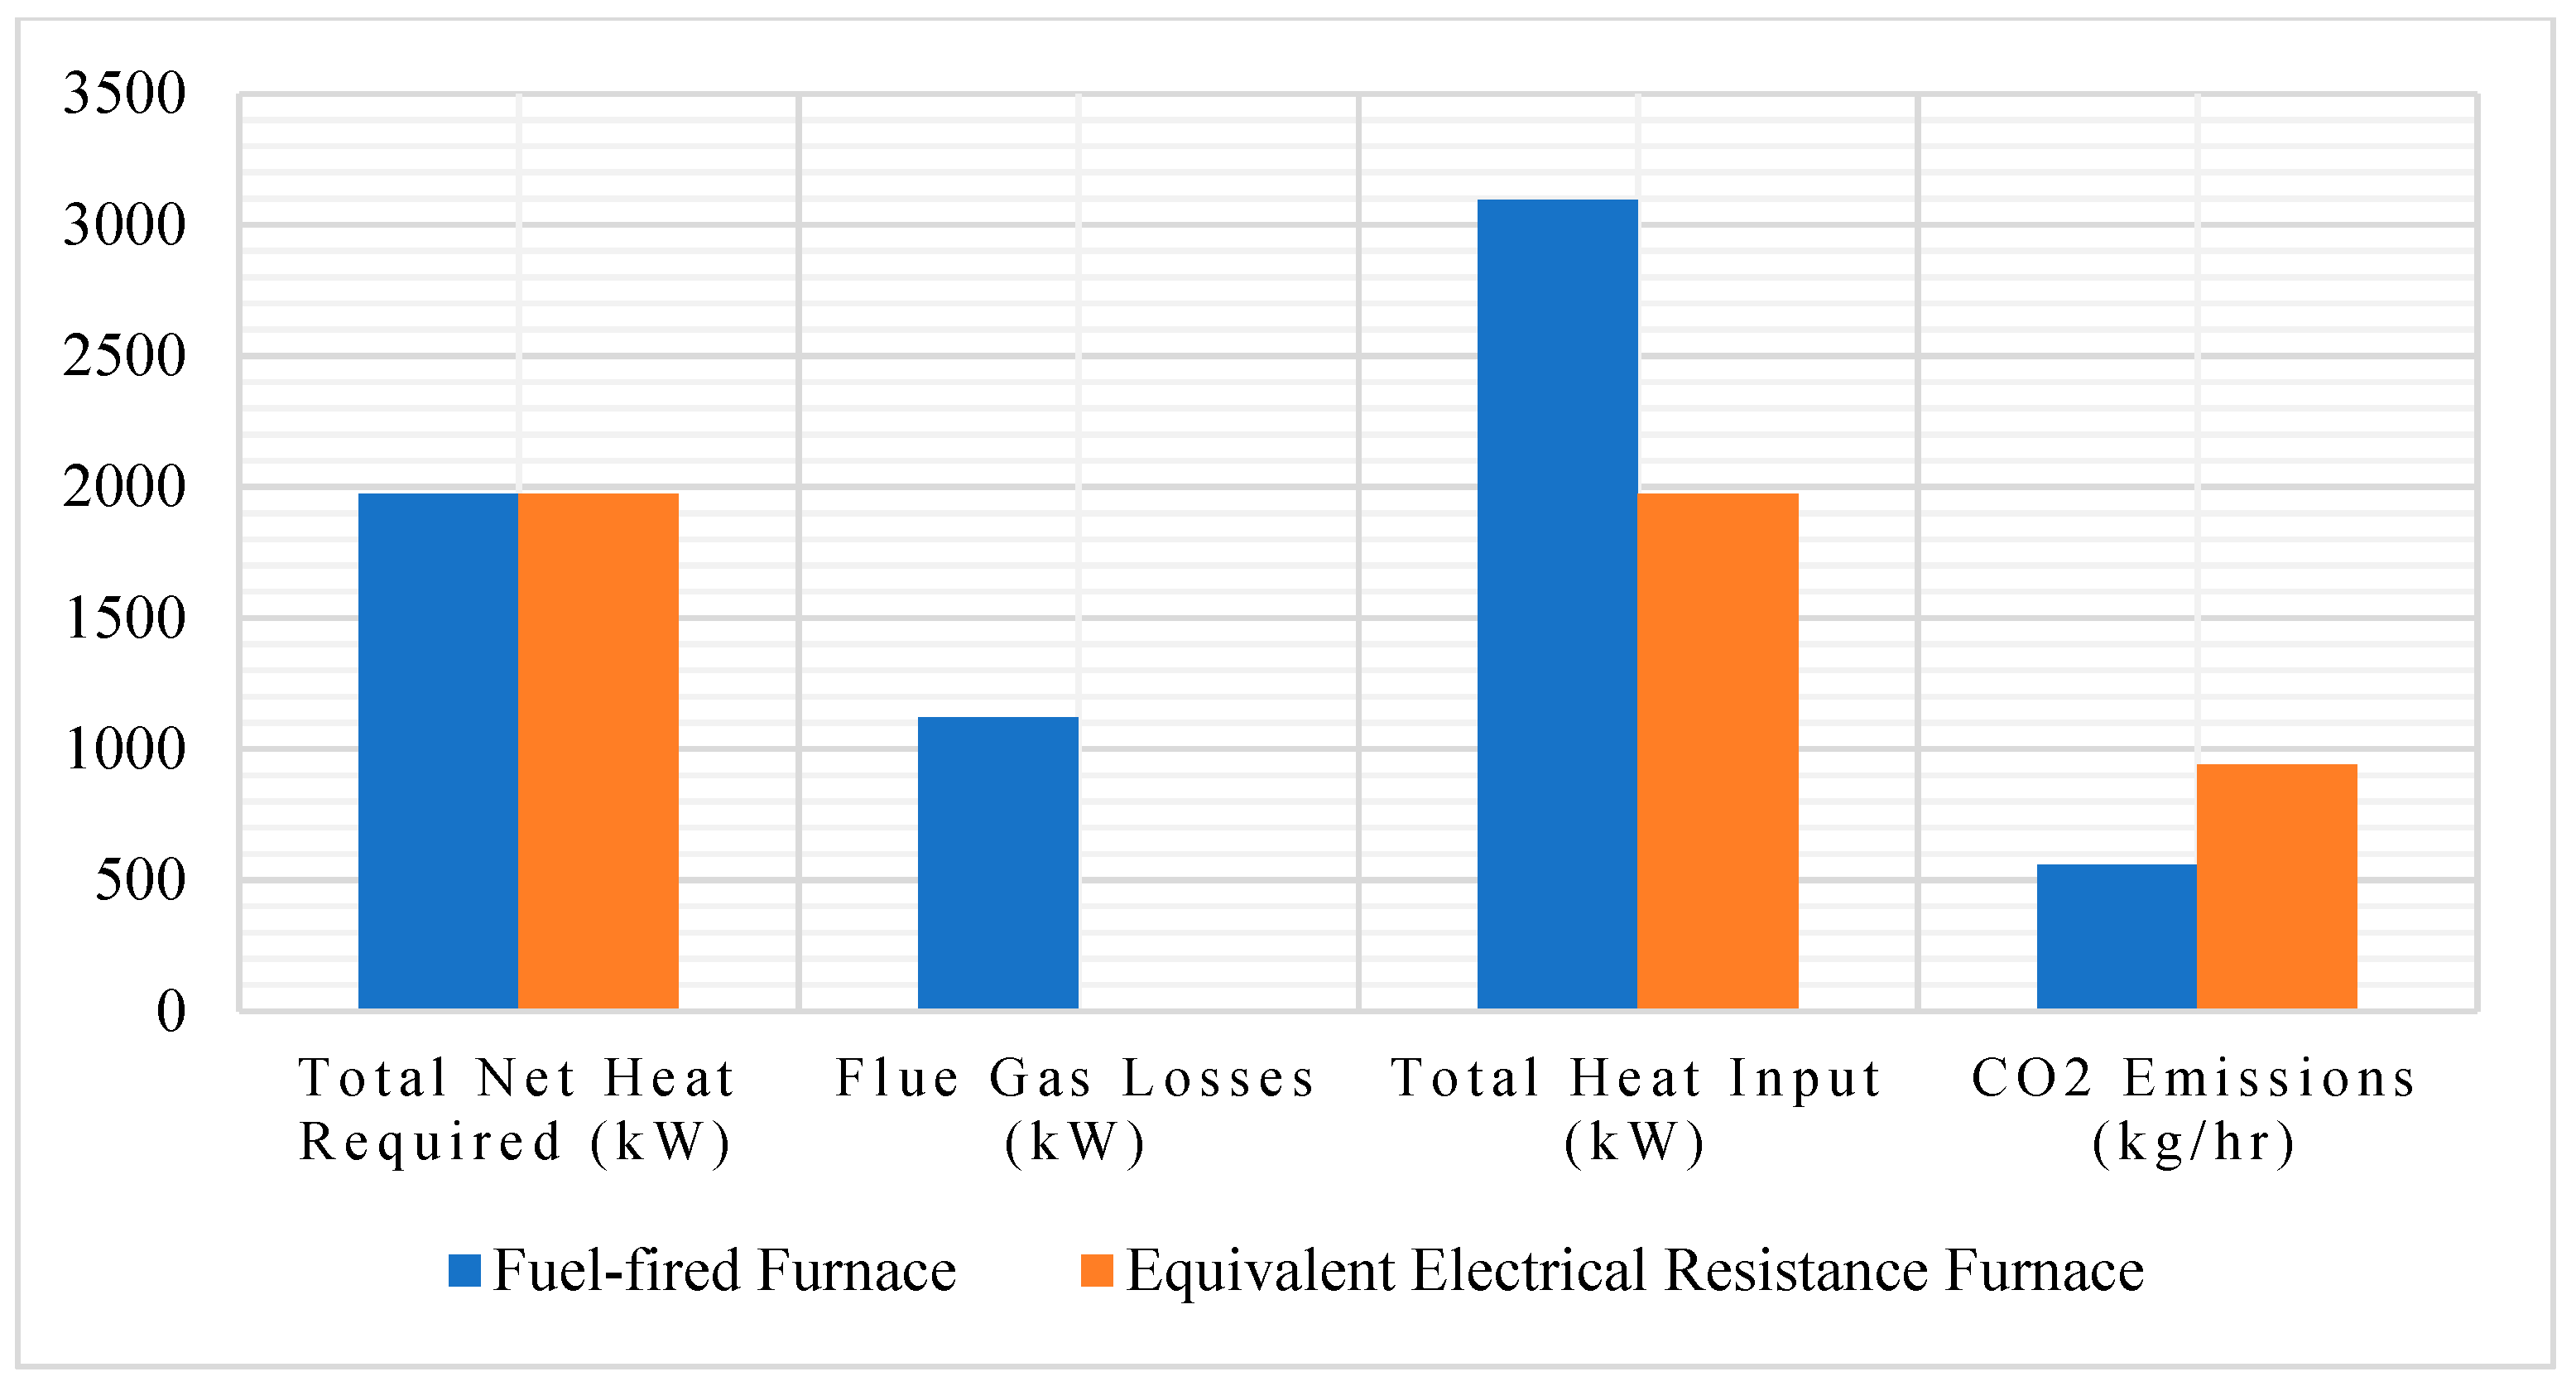
  • A comparative analysis showed that the total heat input for the fuel-fired furnace was 57% higher than the equivalent electrical resistance furnace; however, the CO2 emissions for the electrical resistance furnace were 68% higher than those for the fuel-fired furnace in the same geographical region.
The future work on this topic involves increasing the number and severity of the parameters impacting the energy performance of industrial furnaces. A summary of possible forthcoming work relating to this research study is listed below:
  • The parameter space can be expanded further for both furnaces to explore the effects of different combinations of parameters and how they impact energy efficiency.
  • A dynamic system with advanced sensors and controls can be implemented to collect the data over an extended period to achieve more accurate results from this research.
  • A comprehensive analysis can be conducted to identify the optimal ways to recover the waste heat from cooling and atmosphere losses to reduce a plant’s utility bills.

Author Contributions

Writing—original draft preparation, P.S.B.; writing—review and editing, B.G., R.D., H.L. and Z.L. All authors have read and agreed to the published version of the manuscript.

Funding

This research received no external funding.

Data Availability Statement

The data are not publicly available due to non-disclosure agreements.

Conflicts of Interest

The authors declare no conflicts of interest.

References

  1. U.S. Department of Energy. Improving Process Heating System Performance: A Sourcebook for Industry; U.S. Department of Energy: Washington, DC, USA, 2015.
  2. U.S. Department of Energy. Chapter 6: Innovating Clean Energy Technologies in Advanced Manufacturing; U.S. Department of Energy: Washington, DC, USA, 2015.
  3. Office of Energy Efficiency and Renewable Energy. Available online: https://www.energy.gov/eere/amo/static-sankey-diagram-process-energy-us-manufacturing-sector-2014-mecs (accessed on 6 November 2022).
  4. U.S. Department of Energy. Improving Steam System Performance: A Sourcebook for Industry; U.S. Department of Energy: Washington, DC, USA, 2014.
  5. The Editors of Encyclopaedia Britannica. Encyclopaedia Britannica. 2022. Available online: https://www.britannica.com/technology/blast-furnace (accessed on 7 January 2023).
  6. Wytse. The Beginning Artist. 2021. Available online: https://www.thebeginningartist.com/kiln-temperatures (accessed on 7 January 2023).
  7. Bureau of Energy Efficiency. General Aspects of Energy Management and Energy Audit; Bureau of Energy Efficiency: New Delhi, India, 2010. [Google Scholar]
  8. Grayson, K. Are Electric Furnaces the Future of Glass Manufacturing? 2019. Available online: https://mo-sci.com/electric-furnaces-future-glass-manufacturing (accessed on 12 January 2023).
  9. Unver, U.; Unver, H.M. Comparison of Natural Gas Fired and Induction Heating Furnaces. In Progress in Exergy, Energy, and the Environment; Springer: Cham, Switzerland, 2014; pp. 1009–1016. [Google Scholar]
  10. U.S. Energy Information Administration. U.S. Energy Facts Explained. 2022. Available online: https://www.eia.gov/energyexplained/us-energy-facts (accessed on 11 January 2023).
  11. National Geographic Society. Nonrenewable Resources. 2022. Available online: https://education.nationalgeographic.org/resource/nonrenewable-resources (accessed on 11 January 2023).
  12. Frassine, C. Energy saving options for industrial furnaces—The example of the glass industry. In ECEEE Industrial Summer Study Proceedings; European Union: Maastricht, The Netherlands, 2016. [Google Scholar]
  13. Hartfuß, G.; Schmid, M.; Scheffknecht, G. Off-Gas Waste Heat Recovery for Electric Arc FurnaceSteelmaking Using Calcium Hydroxide (Ca(OH)2) Dehydration. Steel Res. Int. 2020, 91, 2000048. [Google Scholar] [CrossRef]
  14. Nimbalkar, S.; Armstrong, K.; Thirumaran, K.; Guo, W.; Accawi, G.; Wenning, T.; Thekdi, A. Process Heating Assessments Using DOE’s Manufacturing Energy Assessment Software for Utility Reduction (MEASUR) Tool Suite. In Proceedings of the AISTech Conference—The Iron & Steel Technology Conference and Exposition, Cleveland, OH, USA, 4–6 May 2020. [Google Scholar]
  15. Office of Energy Efficiency & Renewable Energy. MEASUR. Available online: https://www.energy.gov/eere/amo/measur (accessed on 12 January 2023).
  16. Zhang, W.; Zhang, F.; Zhang, J.; Zhang, J.; Zhang, J. One-dimensional mathematical model of coal combustion in furnace and its simulation. IOP Conf. Ser. Earth Environ. Sci. 2019, 252, 032115. [Google Scholar] [CrossRef]
  17. Gani, M.M.; Islam, M.S.; Ullah, M.A. Optimal PID tuning for controlling the temperature of electric furnace by genetic algorithm. SN Appl. Sci. 2019, 1, 880. [Google Scholar] [CrossRef]
  18. Basu, P.; Nag, P.K. Heat transfer to walls of a circulating fluidized-bed furnace. Chem. Eng. Sci. 1996, 51, 1–26. [Google Scholar] [CrossRef]
  19. Junger, H.J.; Jandl, C.; Cappel, J. Relationships Between Basic Oxygen Furnace Maintenance Strategies and Steelmaking Productivity; AIST: Warrendale, PA, USA, 2008. [Google Scholar]
  20. Sundaramoorthy, S.; Kamath, D.; Nimbalkar, S.; Price, C.; Wenning, T.; Cresko, J. Energy Efficiency as a Foundational Technology Pillar for Industrial Decarbonization. Sustainability 2023, 15, 9487. [Google Scholar] [CrossRef]
  21. Szego, G.; Dally, B.; Nathan, G. Scaling of NOx emissions from a laboratory-scale mild combustion furnace. Combust. Flame 2008, 154, 281–295. [Google Scholar] [CrossRef]
  22. Mathieson, J.G.; Rogers, H.; Somerville, M.A.; Jahanshahi, S. Reducing net CO2 emissions using charcoal as a blast furnace tuyere injectant. ISIJ Int. 2012, 52, 1489–1496. [Google Scholar] [CrossRef]
  23. Lee, C.-L.; Jou, C.-J.G. Saving fuel consumption and reducing pollution emissions for Industrial Furnace. Fuel Process. Technol. 2011, 92, 2335–2340. [Google Scholar] [CrossRef]
  24. Kirschen, M.; Risonarta, V.; Pfeifer, H. Energy efficiency and the influence of gas burners to the energy related carbon dioxide emissions of electric arc furnaces in steel industry. Energy 2009, 34, 1065–1072. [Google Scholar] [CrossRef]
  25. Han, S.H.; Lee, Y.S.; Cho, J.R.; Lee, K.H. Efficiency analysis of air-fuel and oxy-fuel combustion in a reheating furnace. Int. J. Heat Mass Transf. 2018, 121, 1364–1370. [Google Scholar] [CrossRef]
  26. Kilinç, E.; Kaya, D.; Kiliç, F.Ç.; Eyidoğan, M.; Özkaymak, M.; Taylan, O.; Pedrycz, W. An energy efficiency analysis of an industrial reheating furnace and an implementation of efficiency enhancements methods. Energy Explor. Exploit. 2014, 32, 989–1003. [Google Scholar] [CrossRef]
  27. Kangvanskol, K.; Tangthieng, C. An energy analysis of a slab preheating chamber for a reheating furnace. Eng. J. 2014, 18, 1–12. [Google Scholar] [CrossRef]
  28. Chakravarty, K.; Kumar, S. Increase in energy efficiency of a steel billet reheating furnace by heat balance study and Process Improvement. Energy Rep. 2020, 6, 343–349. [Google Scholar] [CrossRef]
  29. Lee, C.-L.; Jou, C.-J.G. Improving furnace energy efficiency through adjustment of Damper Angle. Int. J. Hydrogen Energy 2013, 38, 2504–2509. [Google Scholar] [CrossRef]
  30. Hasanuzzaman, M.; Rahim, N.A.; Hosenuzzaman, M.; Saidur, R.; Mahbubul, I.M.; Rashid, M.M. Energy savings in the combustion based process heating in industrial sector. Renew. Sustain. Energy Rev. 2012, 16, 4527–4536. [Google Scholar] [CrossRef]
  31. Sardeshpande, V.; Gaitonde, U.N.; Banerjee, R. Model based energy benchmarking for Glass Furnace. Energy Convers. Manag. 2007, 48, 2718–2738. [Google Scholar] [CrossRef]
  32. Masoumi, M.E.; Izakmehri, Z. Improving of refinery furnaces efficiency using mathematical modeling. Int. J. Model. Optim. 2011, 1, 74–79. [Google Scholar] [CrossRef]
  33. Gajic, D.; Savic-Gajic, I.; Savic, I.; Georgieva, O.; Di Gennaro, S. Modelling of electrical energy consumption in an electric arc furnace using Artificial Neural Networks. Energy 2016, 108, 132–139. [Google Scholar] [CrossRef]
  34. He, F.; Shen, K.; Guan, L.; Jiang, M. Research on energy-saving scheduling of a forging stock charging furnace based on an improved SPEA2 algorithm. Sustainability 2017, 9, 2154. [Google Scholar] [CrossRef]
  35. Filipponi, M.; Rossi, F.; Presciutti, A.; De Ciantis, S.; Castellani, B.; Carpinelli, A. Thermal analysis of an Industrial Furnace. Energies 2016, 9, 833. [Google Scholar] [CrossRef]
  36. Mohite, N.T.; Benni, R.G.; Desai, A.A.; Patil, V. Optimization of Wall Thickness for Minimum Heat Losses for Induction Furnace. Int. J. Eng. Res. Technol. 2017, 10, 453–461. [Google Scholar]
  37. Si, M.; Thompson, S.; Calder, K. Energy Efficiency Assessment by process heating assessment and survey tool (PHAST) and feasibility analysis of waste heat recovery in the reheat furnace at a steel company. Renew. Sustain. Energy Rev. 2011, 15, 2904–2908. [Google Scholar] [CrossRef]
  38. Jha, M.; Singh, V.K. Assessment of energy efficiency in reheating furnace of a steel plant by using process heating assessment and survey tool (PHAST). Recent Res. Sci. Technol. 2013, 5, 33–36. [Google Scholar]
  39. Capehart, B.L.; Turner, W.C.; Kennedy, W.J. Guide to Energy Management; The Fairmont Press, Inc.: Lilburn, GA, USA, 2015. [Google Scholar]
  40. U.S. Energy Information Administration. Environment. Available online: https://www.eia.gov (accessed on 22 July 2023).
  41. Cheng, Q.; Gong, J.; Xiao, G.; Yang, C.; Liu, Z.; Qi, B. Research on energy-saving production planning of periodic forging resistance furnace. J. Clean. Prod. 2020, 275, 122897. [Google Scholar] [CrossRef]
  42. Carpenter, K.; Kissock, J.K. Energy Efficient Process Heating: Managing Air; SAE International: Detroit, MI, USA, 2006. [Google Scholar]
  43. Fives North American Combustion Inc. North American Combustion Handbook—A Basic Reference on the Air and Science of Industrial Process Heating with Gaseous and Liquid Fuels Volume I, 3rd ed.; Fives North American Combustion Inc.: Cleveland, OH, USA, 2001. [Google Scholar]
Figure 1. Overview of research approach.
Processes 12 00737 g001
Figure 2. Rank of significance of factors in Industrial Furnace A.
Processes 12 00737 g002
Figure 3. Rank of significance of factors in Industrial Furnace B.
Processes 12 00737 g003
Figure 4. Heat input and emissions for Industrial Furnace A (1 MMBtu/h = 293 kWh/h).
Processes 12 00737 g004
Figure 5. Electrical usage and emissions for Industrial Furnace B.
Processes 12 00737 g005
Figure 6. Fuel-fired vs. equivalent electrical resistance furnace.
Processes 12 00737 g006
Figure 7. Available heat chart for natural gas (1000 Btu/ft3) (1 MMBtu/h = 293 kWh/h) [43].
Processes 12 00737 g007
Table 1. Baseline heat balance parameters for the Industrial Furnace A.
Class of ParametersDescription of Baseline ParametersUnitValue
Charge/LoadName of Charge Material-Steel-4320
Feed Ratelb/h16,000
Inlet Temperature°F75
Outlet Temperature°F1710
Specific HeatBtu/lb-°F0.114
Latent Heat of FusionBtu/lb107.48
Specific Heat of Molten MaterialBtu/lb-°F0.134
Melting Point of Material°F2590
Combustion Air & FuelCombustion Air Temperature°F75
Moisture Percentage in Combustion Air%0.92
Excess Air%77.43
Fuel Used-Natural Gas
Fuel Temperature°F65
Flue GasFlue Gas Temperature°F815
Percentage of Oxygen in Flue Gas%9.6
Specific Gravity of Flue Gas-1
Ambient ConditionsAmbient Temperature°F75
Relative Humidity%50
FixturesFixture Material-Refractory
Specific HeatBtu/lb-°F0.25
Feed Ratelb/h400
Inlet Temperature°F100
Outlet Temperature°F1710
Furnace WallsAverage Surface Temperature°F180
Wind Velocitymph6.5
Surface Emissivity-0.8
Surface Areaft21152
Orientation of Surface-Vertical Plates
Furnace CoolingCooling Fluid-Water
Specific HeatBtu/lb-°F1
Densitylb/gal8.338
Flow Rategal/min130
Inlet Temperature°F75
Outlet Temperature°F100
AtmosphereAtmosphere Gas-Nitrogen
Specific HeatBtu/SCF-°F0.0185
Flow RateSCF/h2200
Inlet Temperature°F75
Outlet Temperature°F1710
OpeningsType of Opening-Rectangular
Number of Openings-2
Thickness of Furnace Wallin8
Length of Openingsin41
Height of Openingsin27
Area of Openingsft215.38
View Factor-0.811
Percentage Time Open%7
LeakagesDraft Pressure of Furnacein H2O0.15
Opening Areaft21.08
Temperature of Leaking Gases°F1710
Extended SurfacesTotal Areaft20.625
Average Surface Temperature°F560
Surface Emissivity-0.8
Table 2. Baseline heat balance parameters for the Industrial Furnace B.
Class of ParametersDescription of Baseline ParametersUnitValue
Charge/LoadName of Charge Material-Carbon Steel
Feed Ratelb/h49,000
Inlet Temperature°F77
Outlet Temperature°F2985
Average Specific Heat (Solid)Btu/lb-°F0.16
Latent Heat of FusionBtu/lb107.48
Average Specific Heat (Molten)Btu/lb-°F0.175
Melting Point of Material°F2800
Ambient ConditionsAmbient Temperature°F77
Relative Humidity%50
Furnace WallsAverage Surface Temperature°F255
Wind Velocitymph1.5
Surface Emissivity-0.8
Surface Areaft21365
Orientation of Surface-Vertical Cylinders
Furnace coolingCooling Fluid-Water
Specific HeatBtu/lb-°F1
Densitylb/gal8.338
Flow Rategal/min1950
Inlet Temperature°F71
Outlet Temperature°F88
OpeningsType of Opening-Round
Number of Openings-2
Thickness of Furnace Wallin20
Diameter of Openingsin150
Area of Openingsft2245.44
View Factor-0.86
Percentage Time Open%5
SlagMass of Slaglb/h6500
Inlet Temperature°F77
Outlet Temperature°F2985
Specific HeatBtu/lb-°F0.23
Chemical EnergyNatural Gas InputMMBtu/h7.5
Coal Carbon Injectionlbs/h525
Coal Heating ValueBtu/lb9100
Electrode Uselbs/h125
Electrode Heating ValueBtu/lb11,000
Exhaust (Off) GasExhaust Gas Temperature°F2750
CO in Exhaust Gas%13
H2 in Exhaust Gas%9
CH4 in Exhaust Gas%4
Volumetric Flow Ratecfm7500
Dust Loadinglb/scf0.0012
Table 3. Heat balance baseline results for Industrial Furnace A and B.
Energy Loss/Use (Btu/h) 3Industrial Furnace A 1Energy Loss/Use (kW)Industrial Furnace B 2
Charge Materials2,982,240Charge Materials7583.15
Fixture Losses161,000Wall Losses222.80
Wall Losses526,057Cooling Losses4860.39
Cooling Losses1,625,910Opening Losses596.67
Atmosphere Losses66,545Slag Losses1274.12
Opening Losses26,425Total Net Heat Required14,537.13
Leakage Losses1,342,378Off Gas (Exhaust) Losses3698.39
Extended Surface Losses1654Electrical Heat Delivered14,234.35
Total Net Heat Required6,732,208Chemical Energy Delivered4001.17
Available Heat (%)63.8%Gross Heat Input18,235.52
Flue Gas Losses3,826,500CO2 Emissions (tonne CO2/h)5.78
Gross Heat Input10,558,708--
CO2 Emissions (tonne CO2/h)0.558--
1 Fuel Fired Furnace; 2 Electric Furnace; 3 1 Btu/h = 0.293071 Wh/h.
Table 4. Percentage change in heat input at two levels for Industrial Furnace A.
ParametersCurrentLowHighH_CurrentH_LowH_High% Change Low% Change High
OF9.6313.510,558,7089,354,24512,635,086−11.41%19.67%
CT757525510,558,70810,558,7089,648,3590.00%−8.62%
CHT757525510,558,70810,558,70810,043,7750.00%−4.88%
FD0.150.10.2010,558,70810,172,36610,884,410−3.66%3.08%
ST18010032510,558,7089,880,88112,164,134−6.42%15.20%
WS6.51.510.510,558,70810,289,14010,708,573−2.55%1.42%
SE0.80.070.810,558,70810,364,74810,558,708−1.84%0.00%
FT100100100010,558,70810,558,70810,417,5530.00%−1.34%
FM0.250.140.2510,558,70810,447,60410,558,708−1.05%0.00%
TO721510,558,70810,529,10510,606,073−0.28%0.45%
Table 5. Percentage change in heat input at two levels for Industrial Furnace B.
ParametersCurrentLowHighH_CurrentH_LowH_High% Change Low% Change High
CF19501910199018,235.5218,135.8218,335.22−0.55%0.55%
SR65006000700018,235.5218,137.5118,333.53−0.54%0.54%
CHT777785018,235.5218,235.5216,459.410.00%−9.74%
TO521018,235.5217,877.5218,832.18−1.96%3.27%
OS15011515018,235.5217,987.5218,235.52−1.36%0.00%
ST25510065018,235.5218,031.5619,276.31−1.12%5.71%
WS1.50.59.518,235.5218,204.2018,375.92−0.17%0.77%
SE0.80.070.918,235.5218,146.3818,247.73−0.49%0.07%
Table 6. Multiple linear regression analysis results for Industrial Furnace A.
Parametersp-Value
Furnace Draft (FD)9.80 × 10⁻⁷
Surface Emissivity (SE)1.84 × 10⁻⁶
Combustion Air Temperature (CT)2.78 × 10⁻⁷
Charge Temperature (CHT)7.90 × 10⁻⁶
Oxygen in Flue (OF)4.37 × 10⁻⁹
Wind Speed (WS)0.00137
Fixture Temperature (FT)0.00199
Fixture Material (FM)0.03448
Average Surface Temperature (ST)2.44 × 10⁻⁸
Time Open (TO)0.03814
Multiple R-squared value: 0.9996
Adjusted R-squared value: 0.9989
F-statistic: 1401 on 10 and 5 DF, p-value: 5.636 × 10⁻⁸
Table 7. Multiple linear regression analysis results for Industrial Furnace B.
Parametersp-Value
Cooling fluid flow rate (CF)0.371146
Slag rate (SR)0.378843
Charge temperature (CHT)6.13 × 10⁻⁵
Time open (TO)0.008465
Opening size/view factor (OS)0.196890
Average surface temperature (ST)0.000935
Wind speed (WS)0.152952
Surface emissivity (SE)0.088684
Average Surface Temperature (ST)2.44 × 10⁻⁸
Time Open (TO)0.03814
Multiple R-squared value: 0.9473
Adjusted R-squared value: 0.887
F-statistic: 15.73 on 8 and 7 DF, p-value: 0.0007954
Table 8. Optimal conditions results for Industrial Furnace A.
Energy Loss/Use (Btu/h) 1Baseline AOptimal ScenarioOptimal Scenario of Three
Most Significant Parameters
Charge Materials2,982,2402,653,9202,653,920
Fixture Losses161,00039,76039,760
Wall Losses526,05740,31593,877
Cooling Losses1,625,9101,625,9101,625,910
Atmosphere Losses66,54566,54566,545
Opening Losses26,42575507550
Leakage Losses1,342,3781,096,0471,096,047
Extended Surface Losses165416541654
Total Net Heat Required6,732,2085,531,7006,300,027
Available Heat (%)63.80%75.90%75.90%
Flue Gas Losses3,826,5001,758,6622,002,932
Gross Heat Input10,558,7087,290,3628,302,959
CO2 Emissions (kg CO2/h)558.66385.73439.31
NOx Emissions (kg CO2/h)1.270.871.00
SOx Emissions (kg CO2/h)0.00320.00220.0025
1 (1 MMBtu/h = 293 kWh/h).
Table 9. Optimal conditions results for Industrial Furnace B.
Energy Loss/Use (Btu/h) 1Baseline AOptimal ScenarioOptimal Scenario of Three
Most Significant Parameters
Charge Materials7583.155807.045807.04
Wall Losses222.808.6118.84
Cooling Losses4860.394760.694860.39
Opening Losses596.67139.47238.67
Slag Losses1274.121176.111274.12
Total Net Heat Required14,537.1311,891.9212,199.06
Off Gas (Exhaust) Losses3698.393698.393698.39
Electrical Heat Delivered14,234.3511,589.1411,896.28
Chemical Energy Delivered4001.174001.174001.17
Gross Heat Input18,235.5215,590.3115,897.45
CO2 Emissions (kg CO2/h)5780.544904.215005.96
CO2 Emissions from Electrical Usage (kg/h)4715.703839.373941.12
NOx Emissions from Electrical Usage (kg/h)2.482.022.07
SOx Emissions from Electrical Usage (kg/h)2.732.232.28
1 (1 MMBtu/h = 293 kWh/h).
Table 10. Comparison of fuel-fired and electric industrial furnaces.
Fuel-Fired Industrial Furnace (Industrial Furnace A) 1Equivalent Electrical Resistance Furnace
Energy Loss/Use (Btu/h)BaselineEnergy Loss/Use (kWh/h)Baseline
Charge Materials2,982,240Charge Materials874.01
Fixture Losses161,000Fixture Losses47.18
Wall Losses526,057Wall Losses154.17
Cooling Losses1,625,910Cooling Losses476.51
Atmosphere Losses66,545Atmosphere Losses19.5
Opening Losses26,425Opening Losses7.74
Leakage Losses1,342,378Leakage Losses393.41
Extended Surface Losses1654Extended Surface Losses0.48
Total Net Heat Required6,732,208Total Net Heat Required1973.02
Available Heat (%)63.80%Energy Input Available Heat100%
Flue Gas Losses3,826,500--
Gross Heat Input10,558,708Gross Heat Input1973.02
CO2 Emissions (kg/h)558.66CO2 Emissions (kg/h)940.19
1 (1 MMBtu/h = 293 kWh/h).
Disclaimer/Publisher’s Note: The statements, opinions and data contained in all publications are solely those of the individual author(s) and contributor(s) and not of MDPI and/or the editor(s). MDPI and/or the editor(s) disclaim responsibility for any injury to people or property resulting from any ideas, methods, instructions or products referred to in the content.

