

Optimized Bentonite Clay Adsorbents for Methylene Blue Removal

 , , , ,
  , and
, and
Abstract
1. Introduction
2. Materials and Methods
2.1. Materials
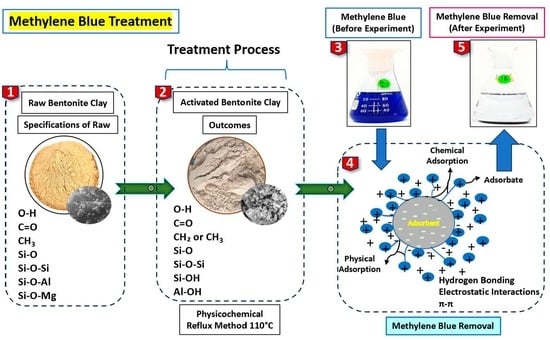
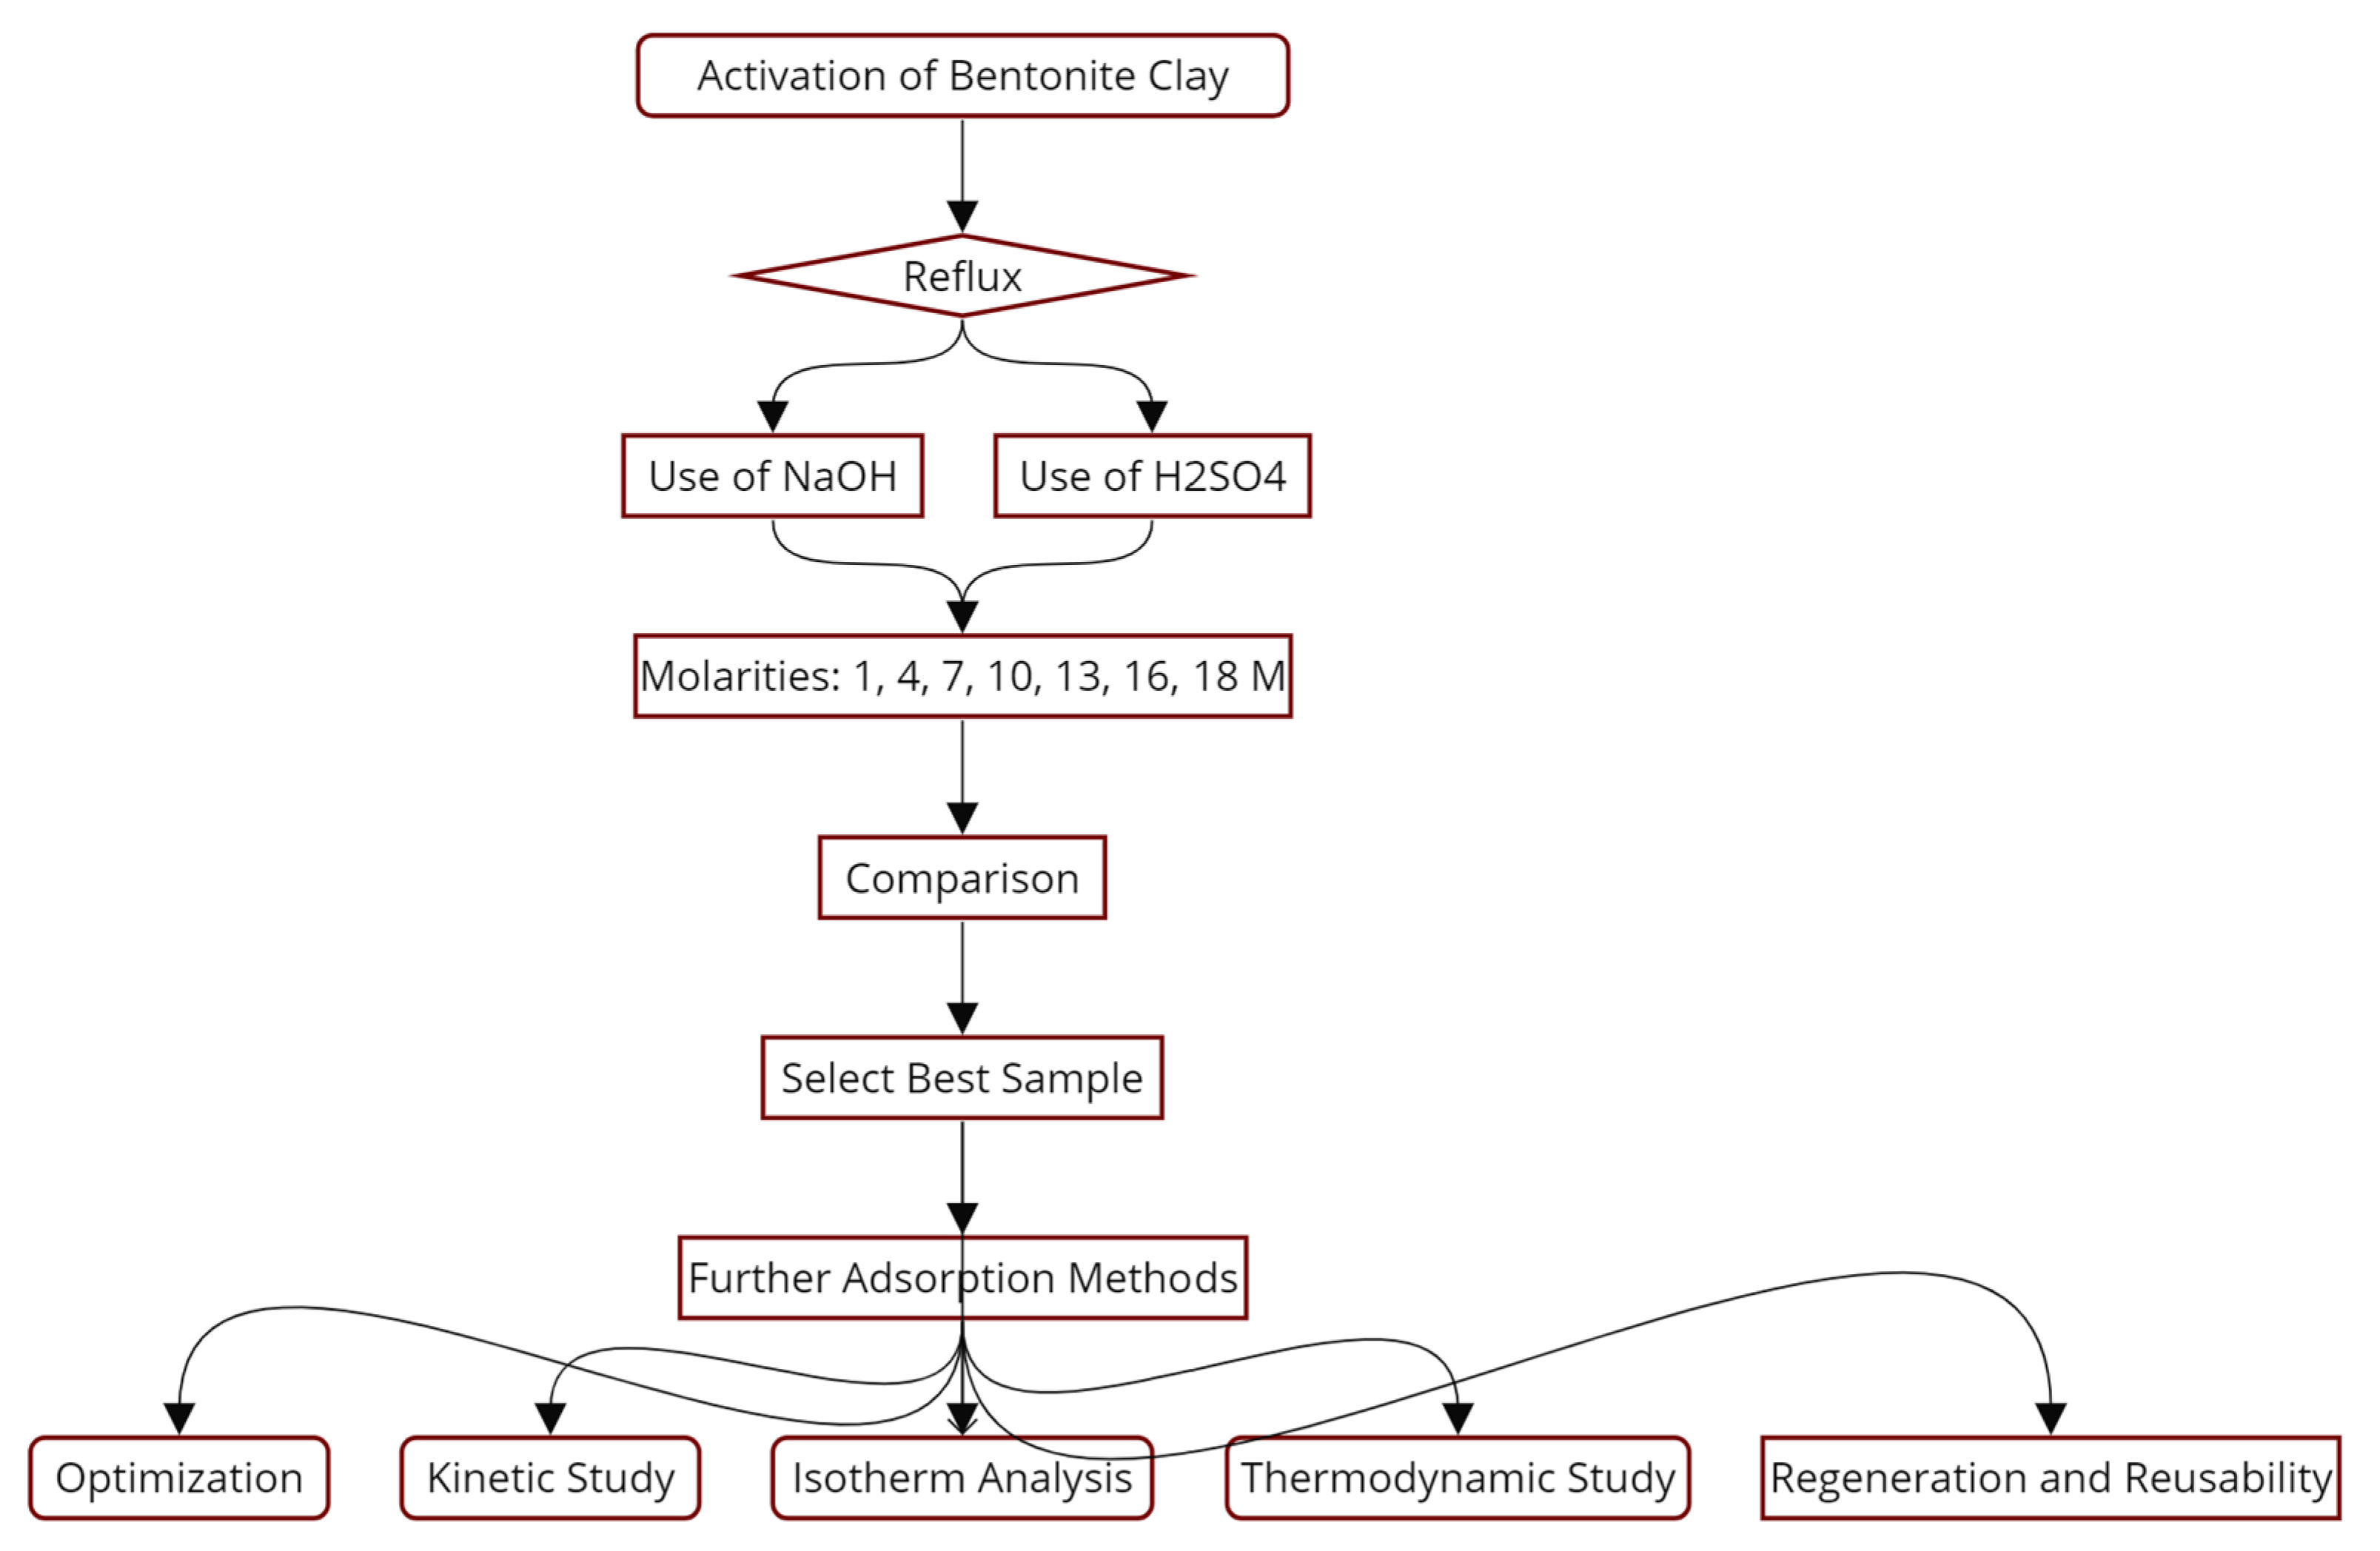
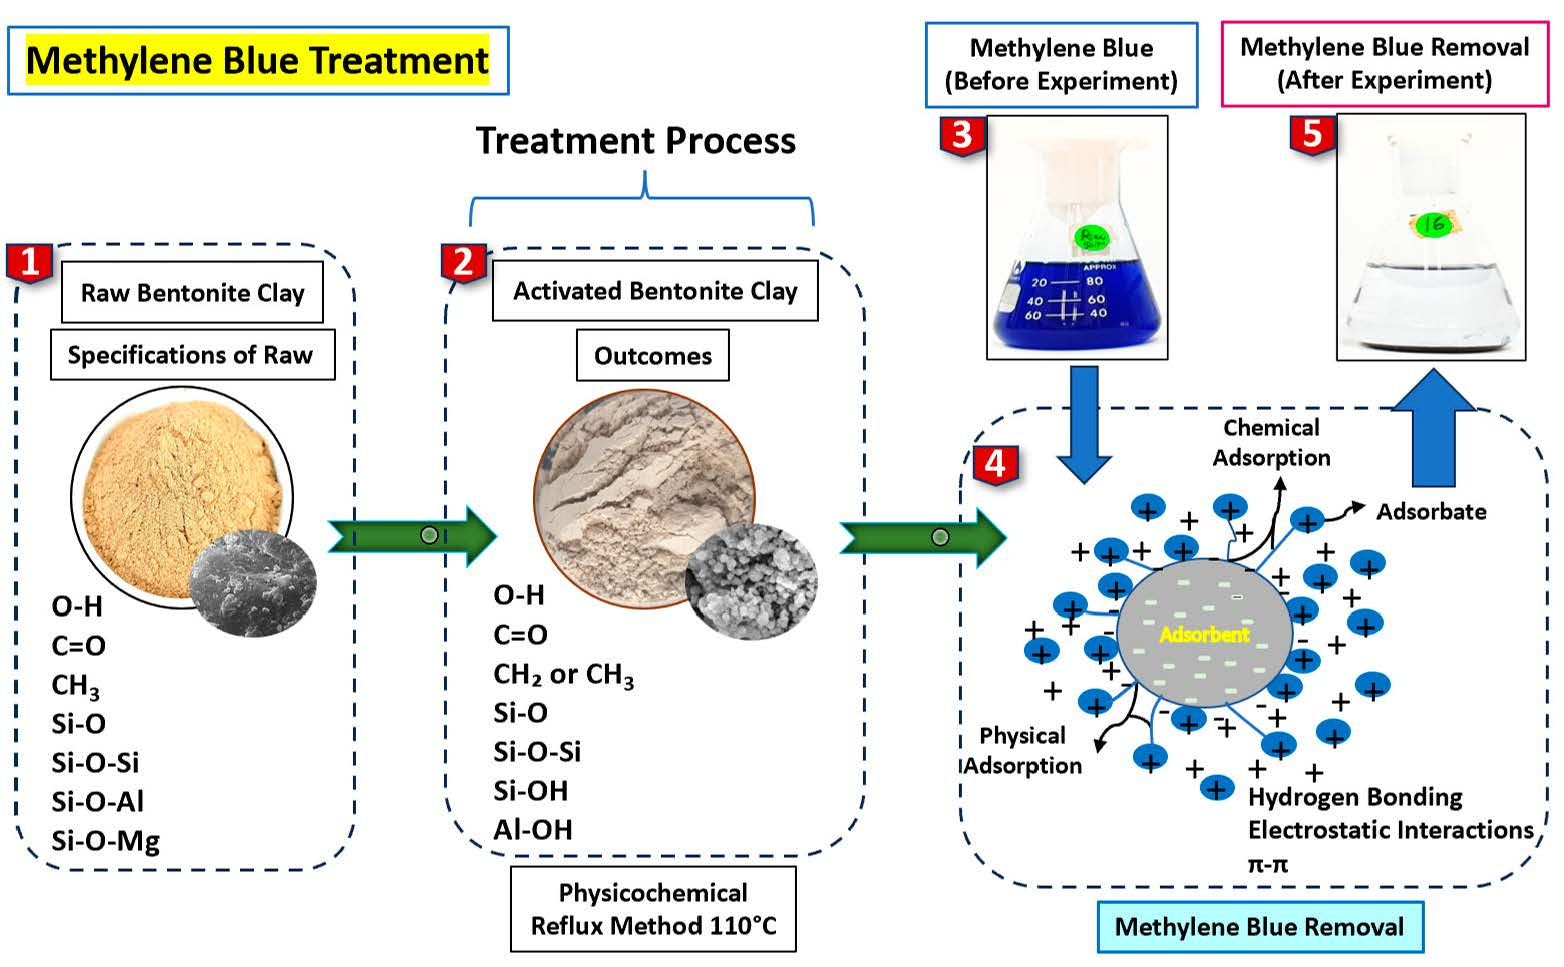
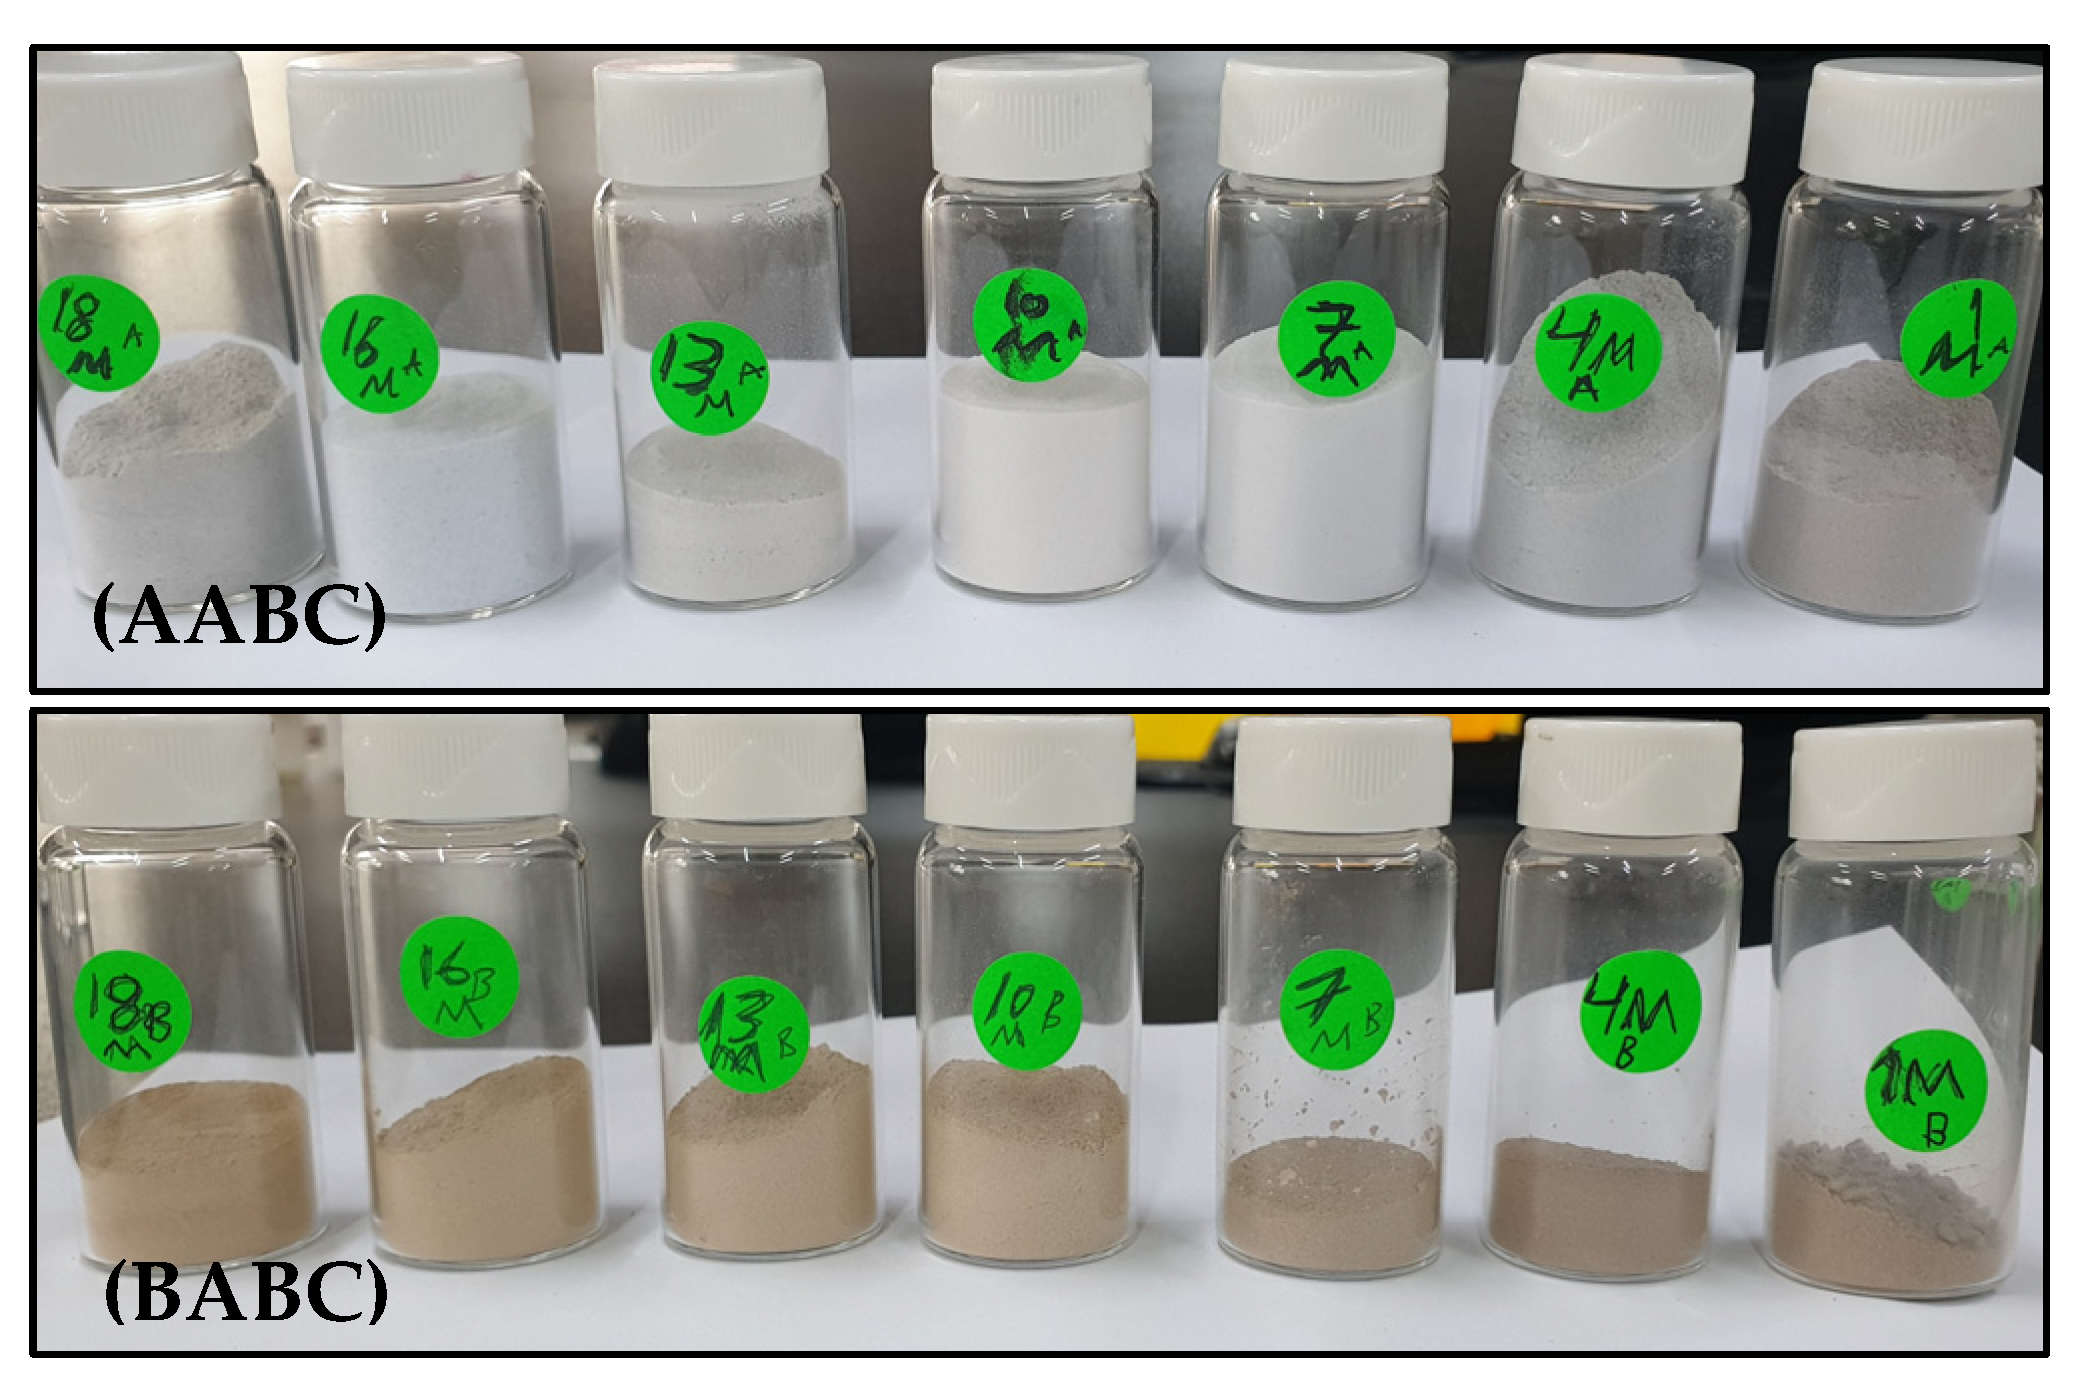
2.2. Activation of Bentonite Clay Methods
2.3. Surface Characterization
2.4. Batch Experimentation
2.5. Regeneration and Reusability
3. Results and Discussion
3.1. Surface Characterization of ABC
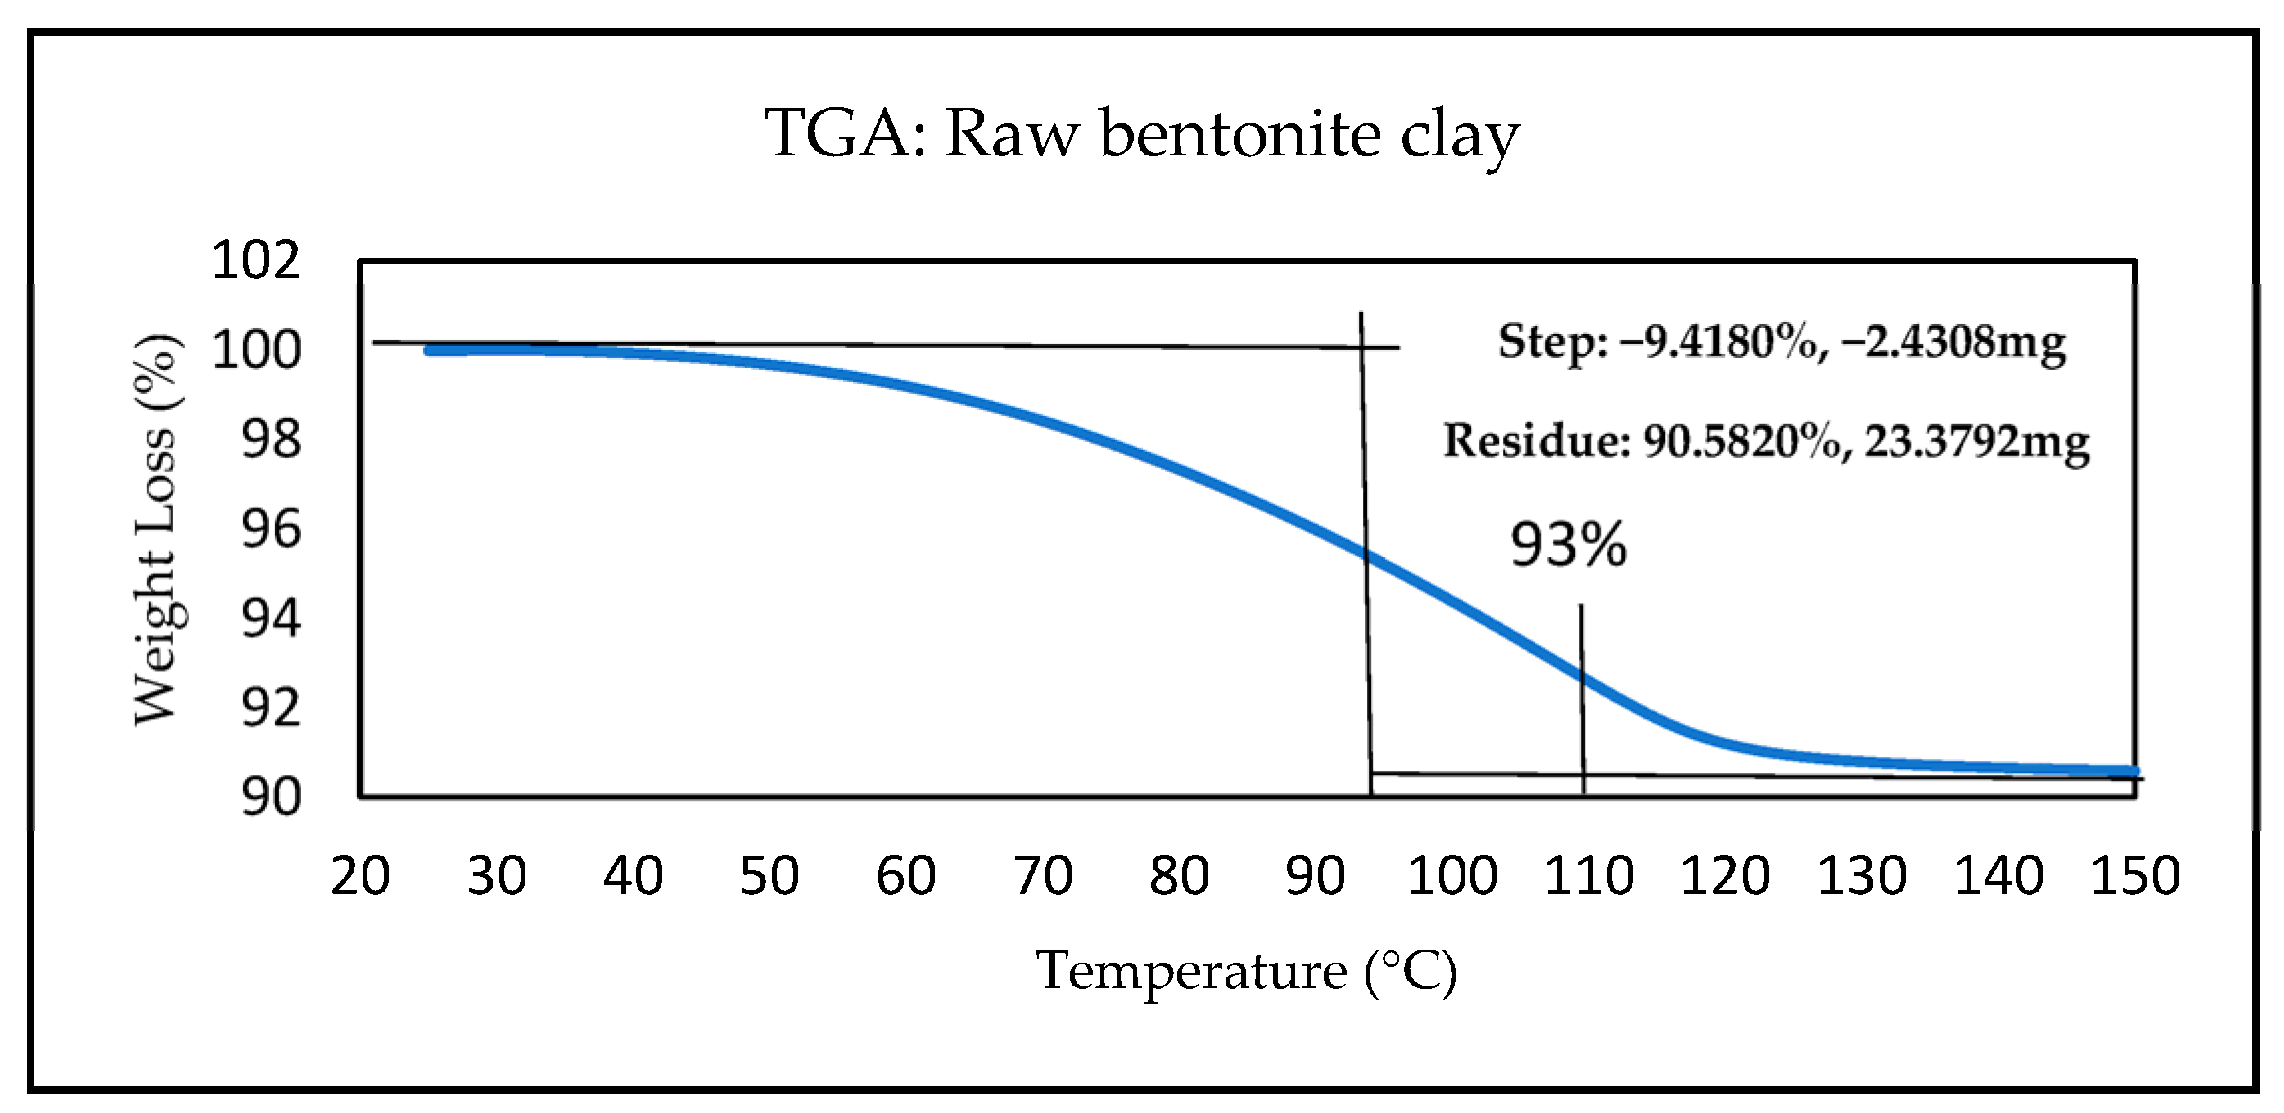
3.1.1. TGA Analysis
3.1.2. XRF Analysis
3.1.3. BET Analysis
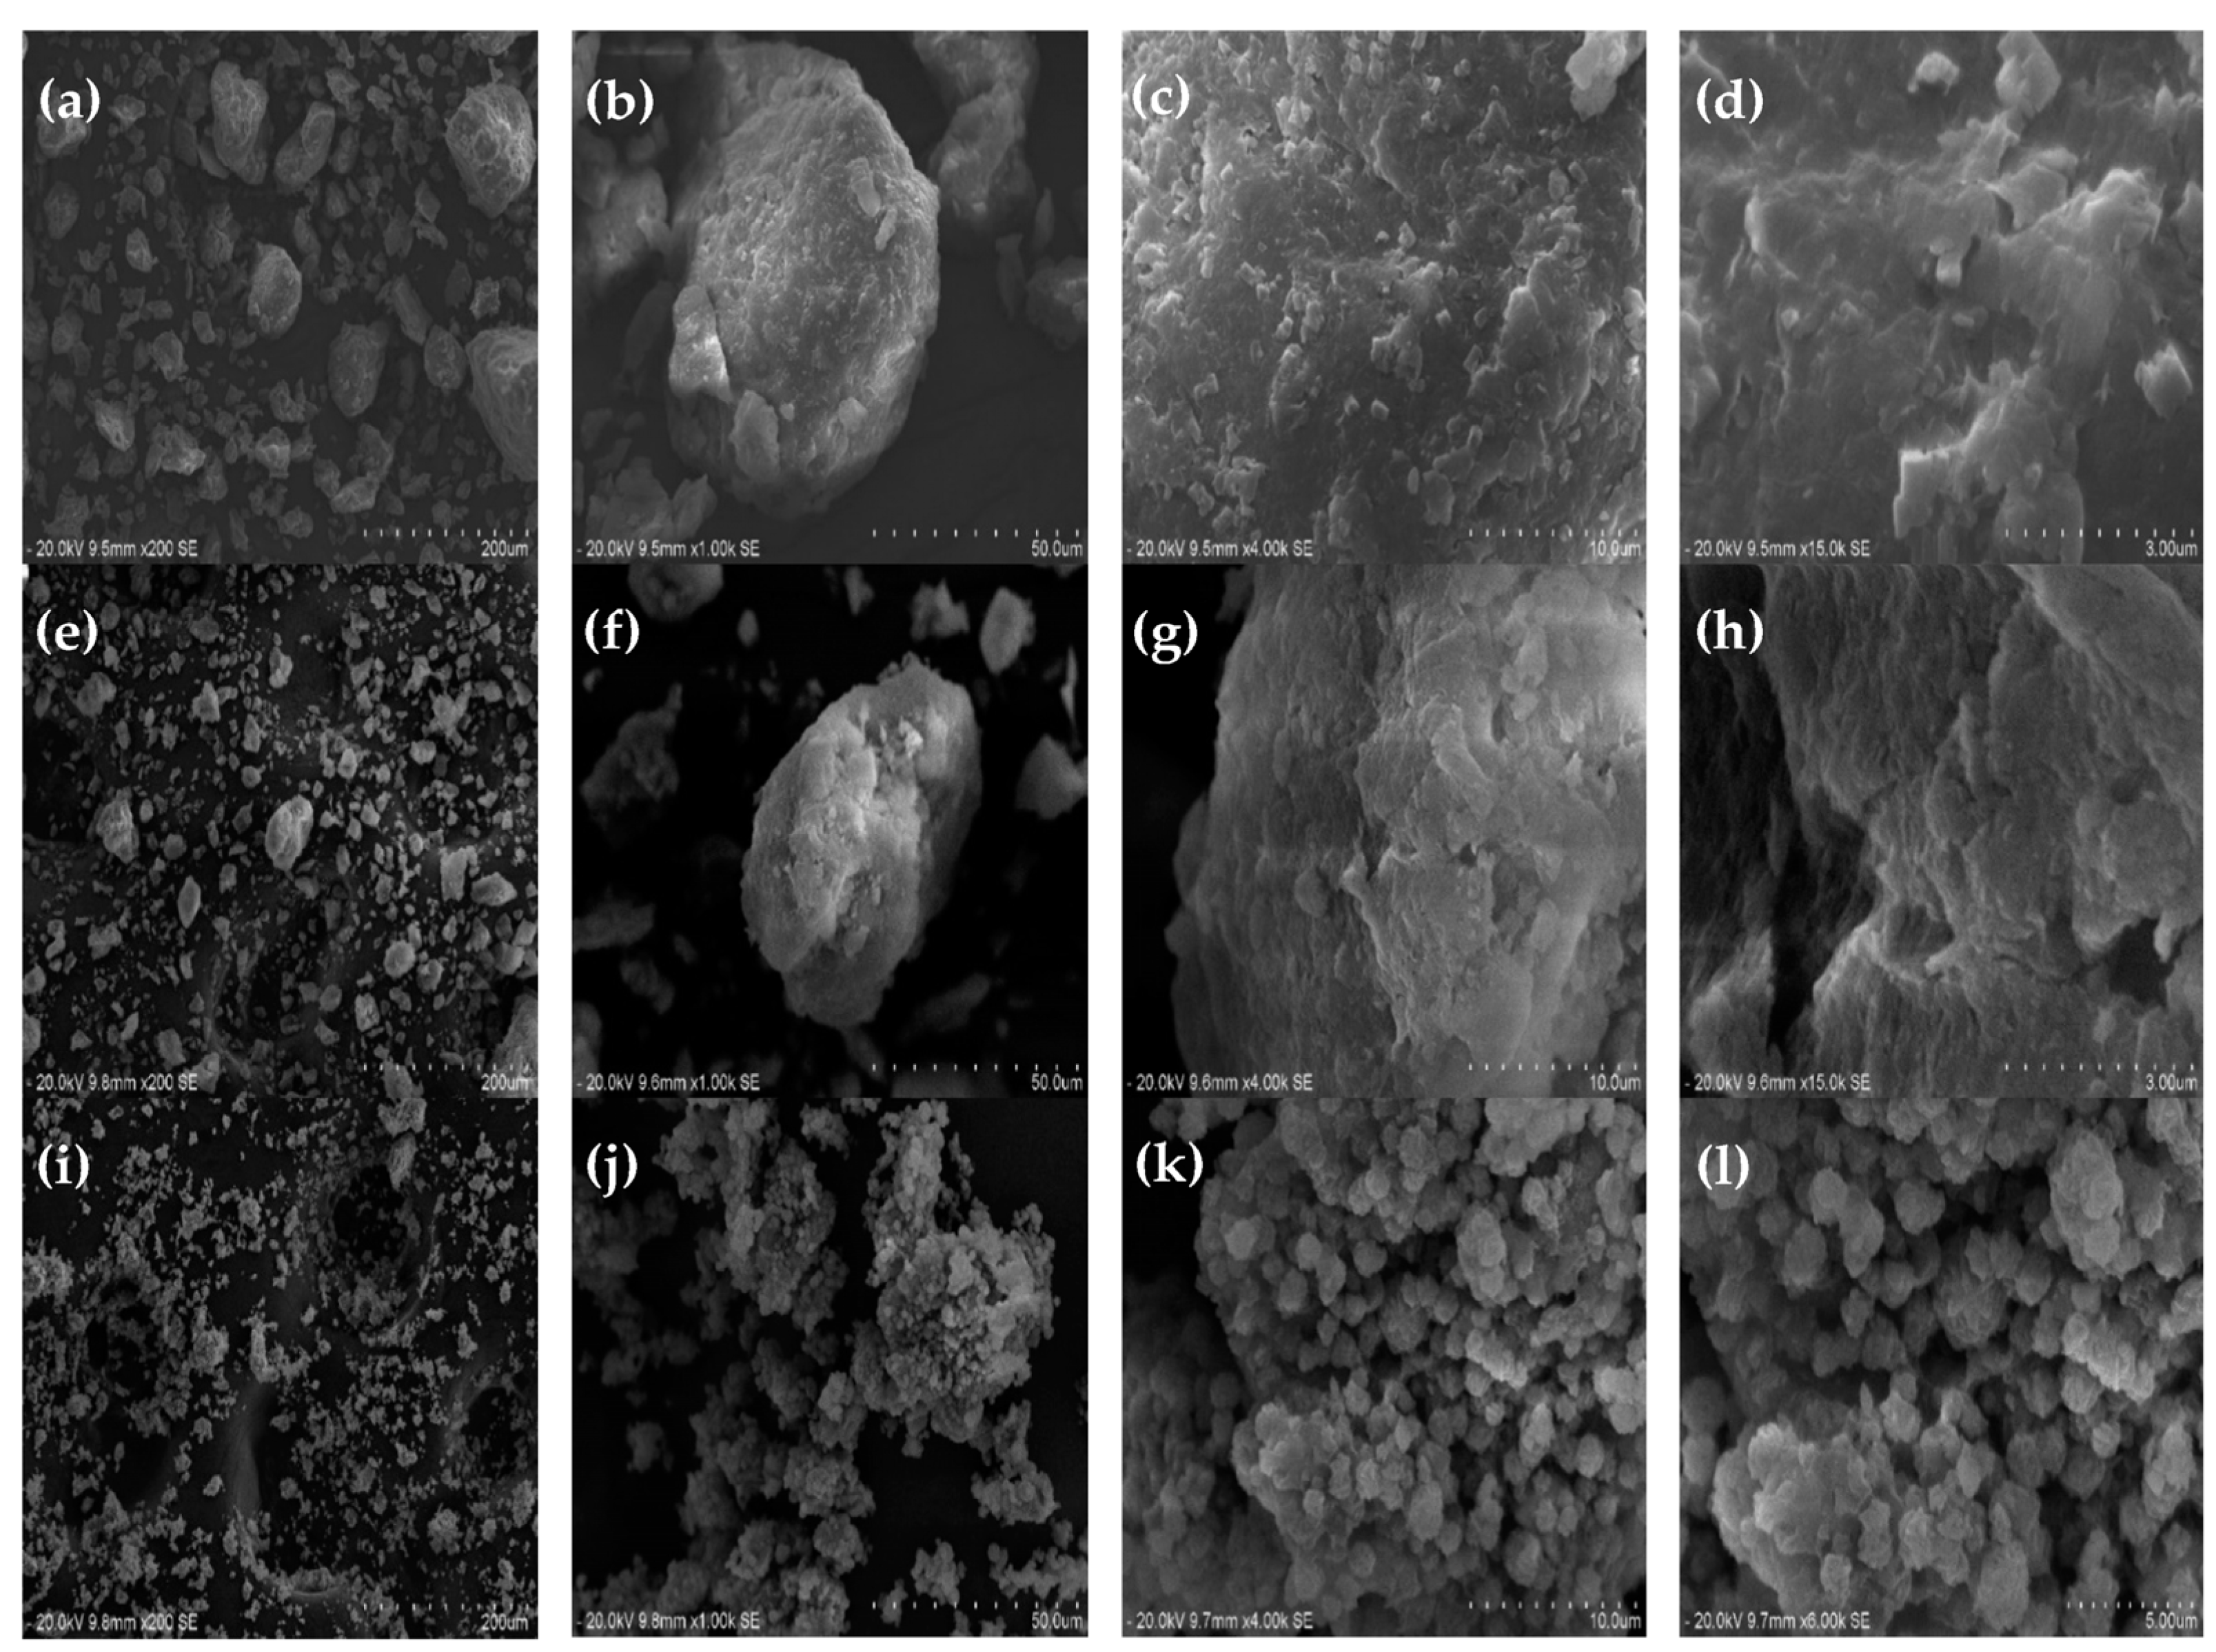
3.1.4. SEM Analysis
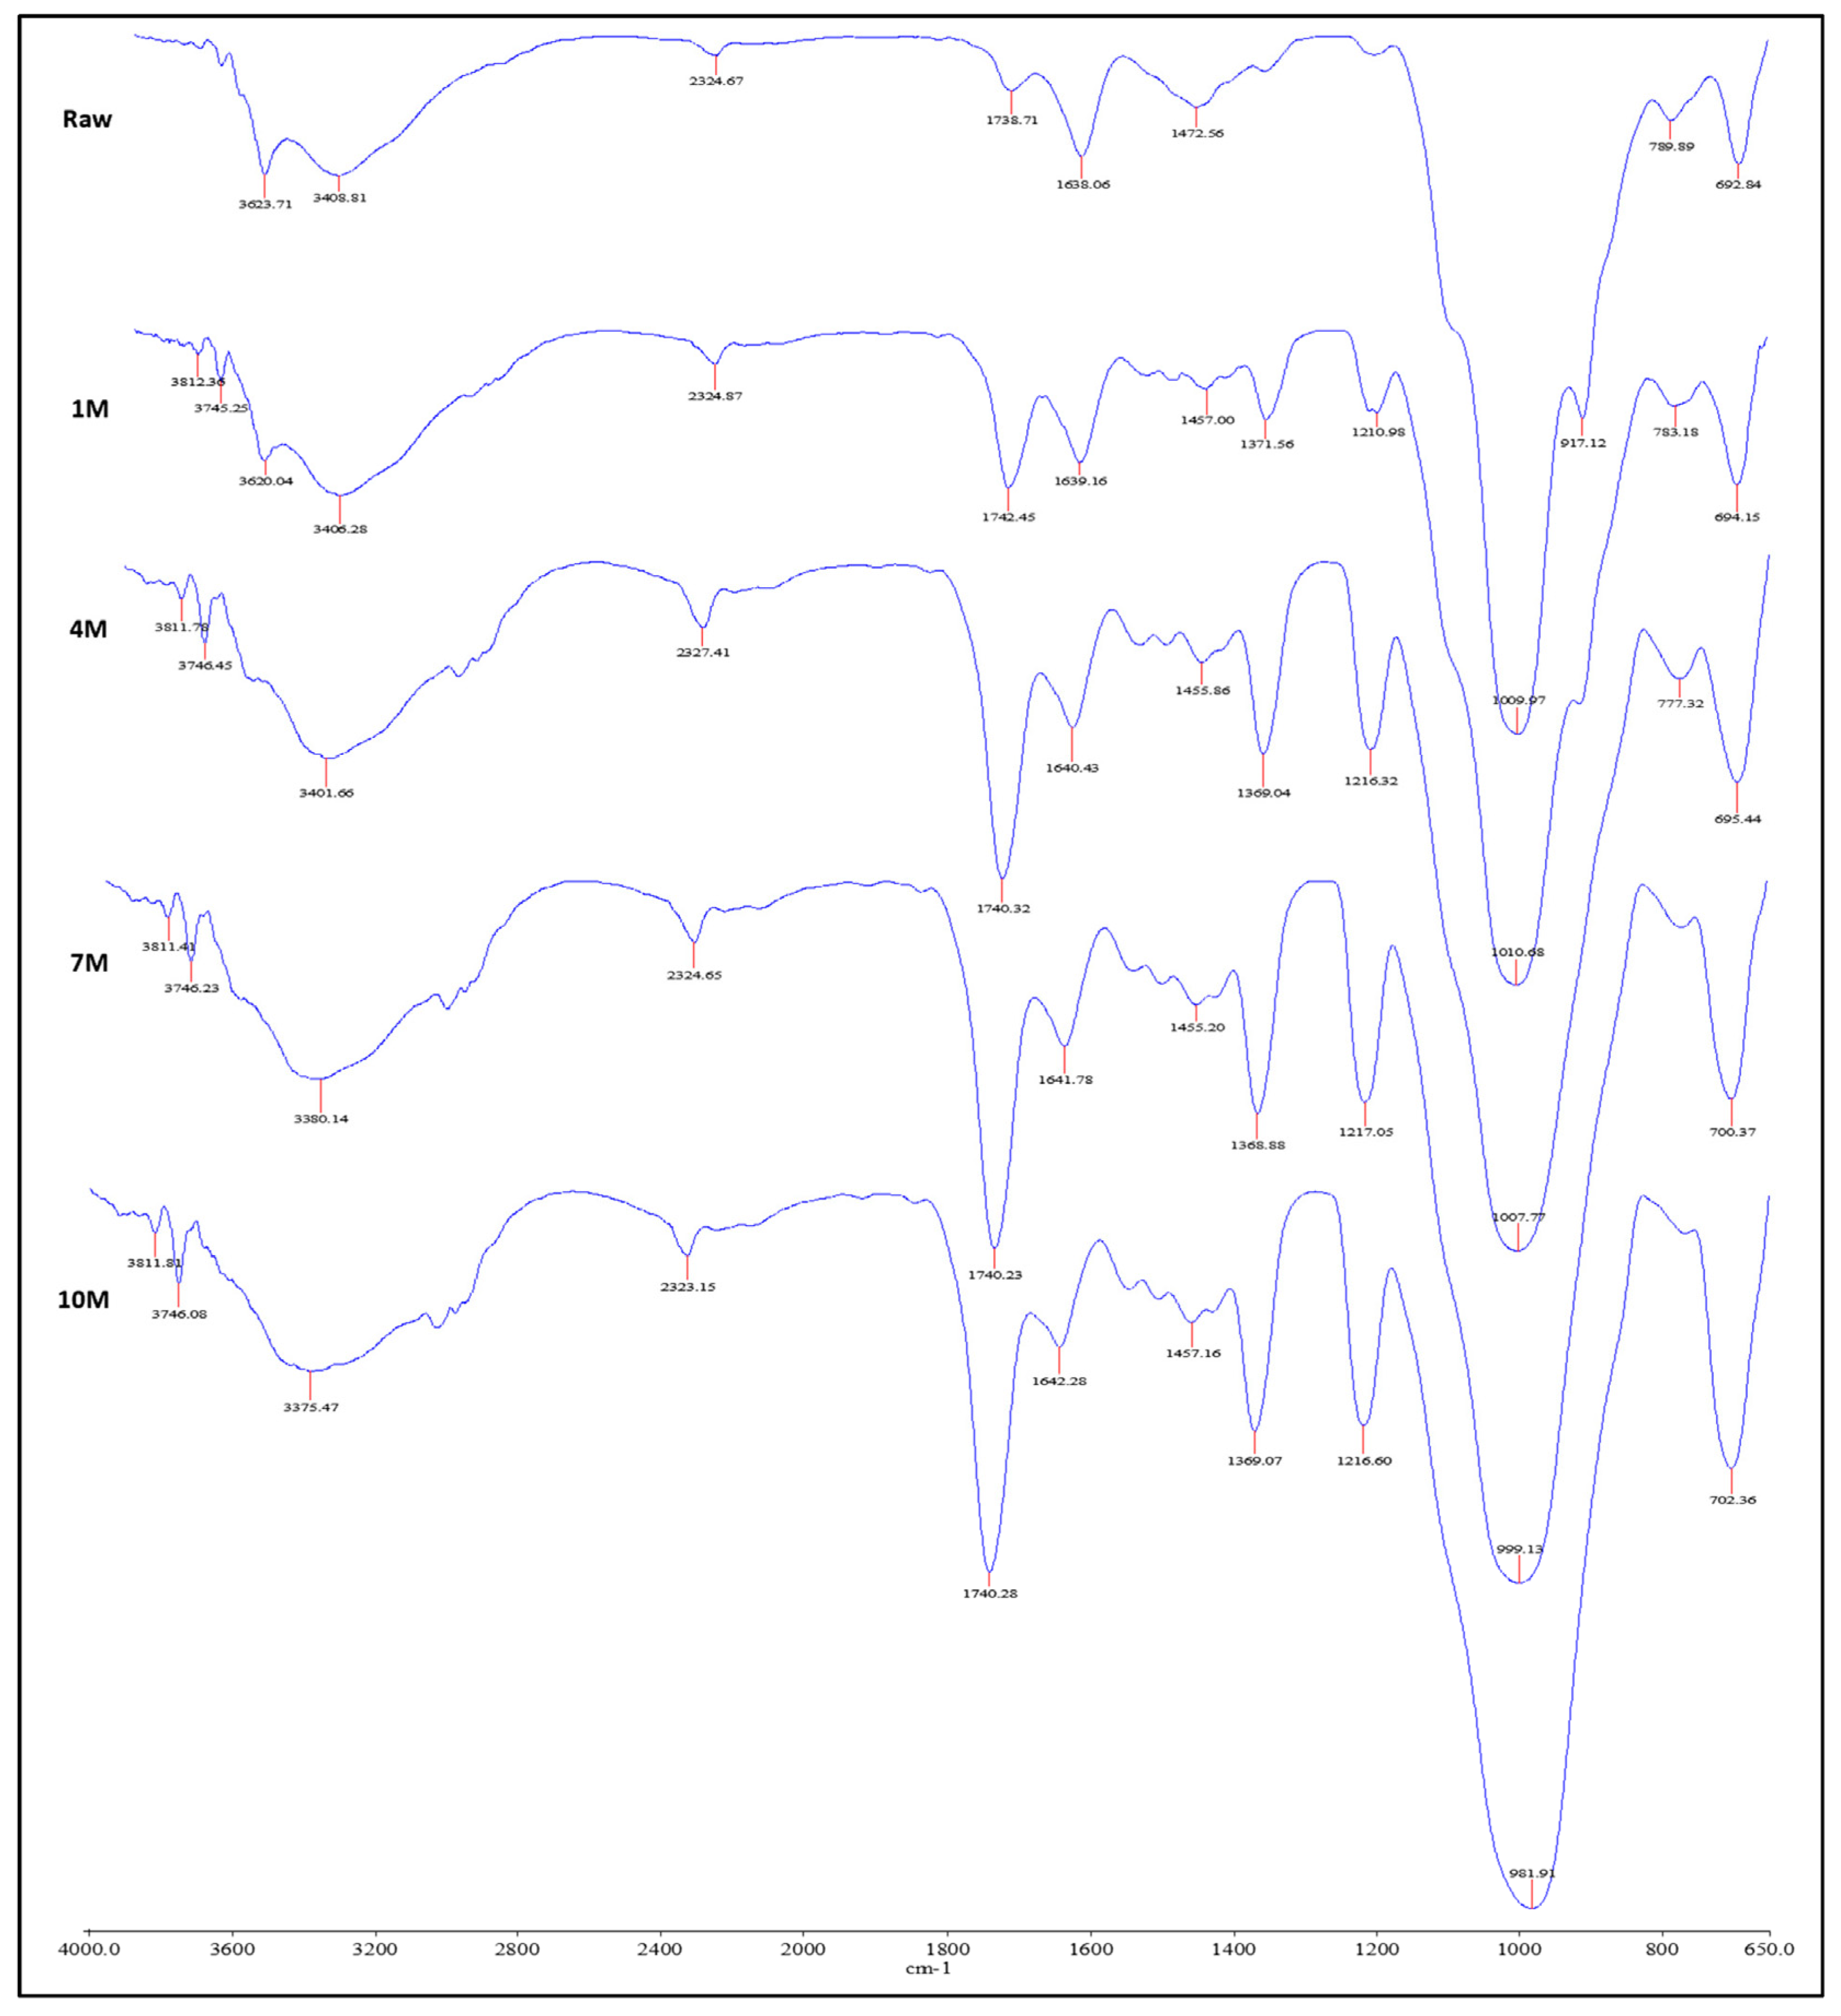
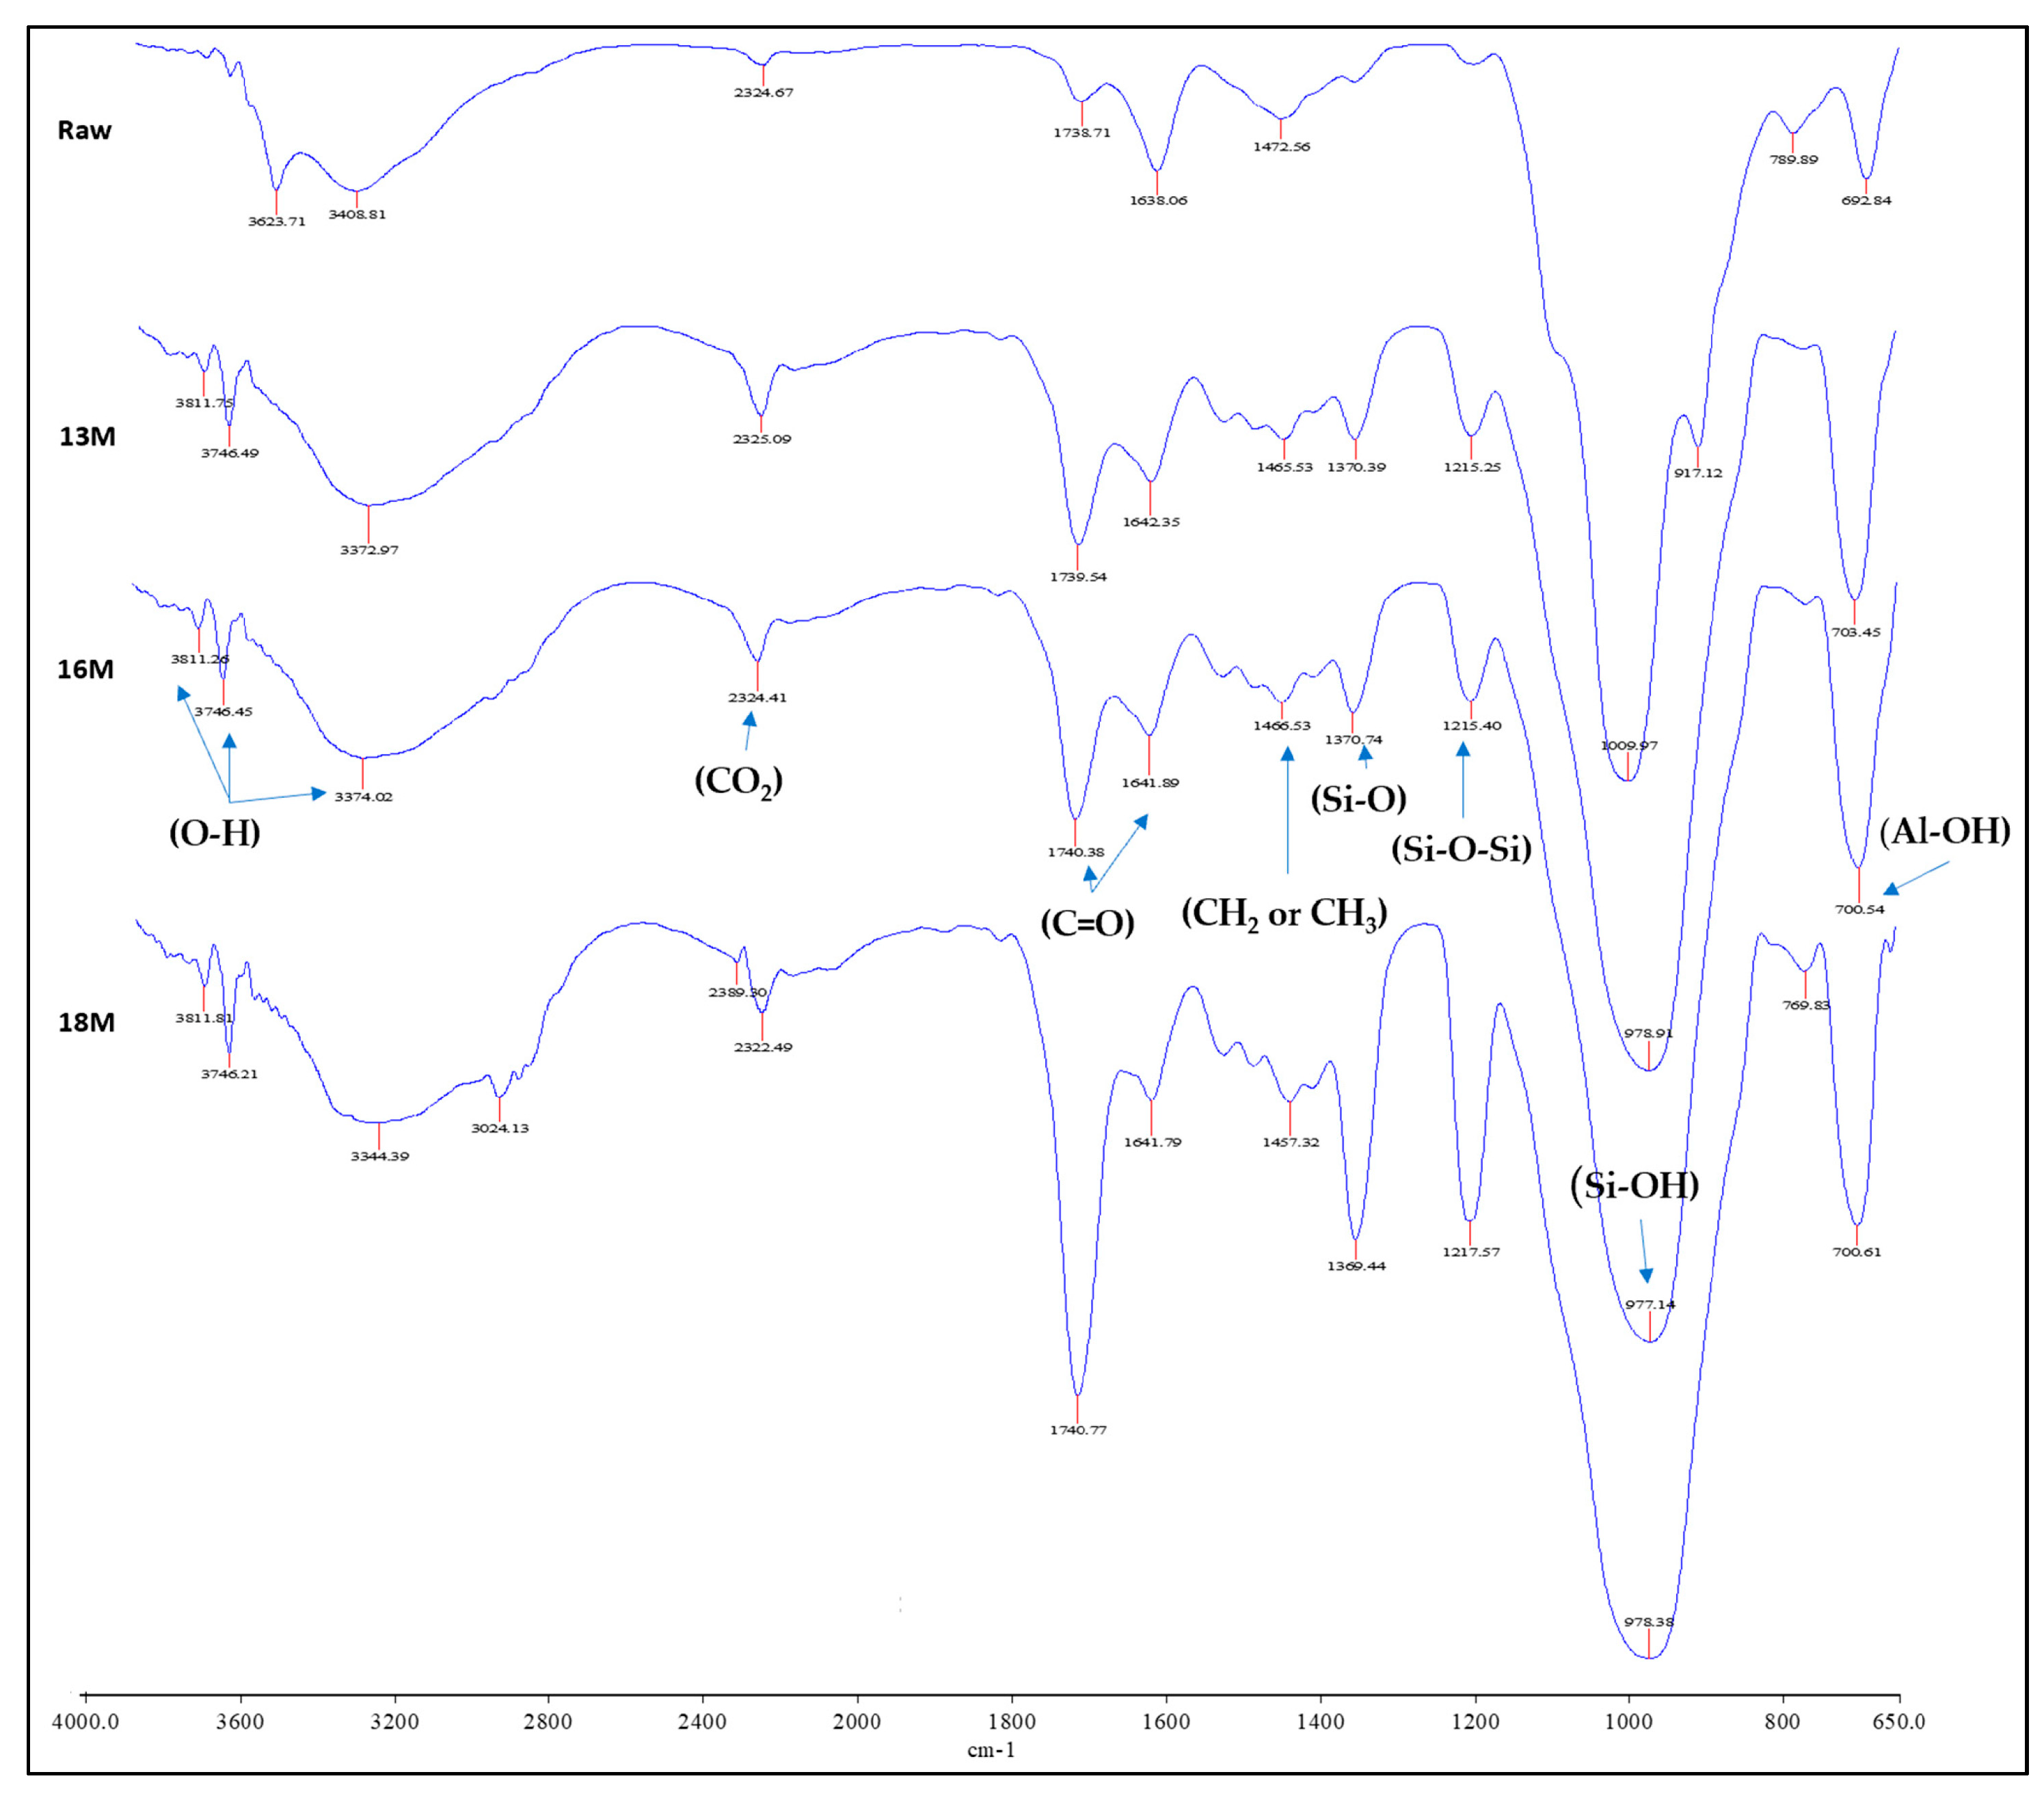
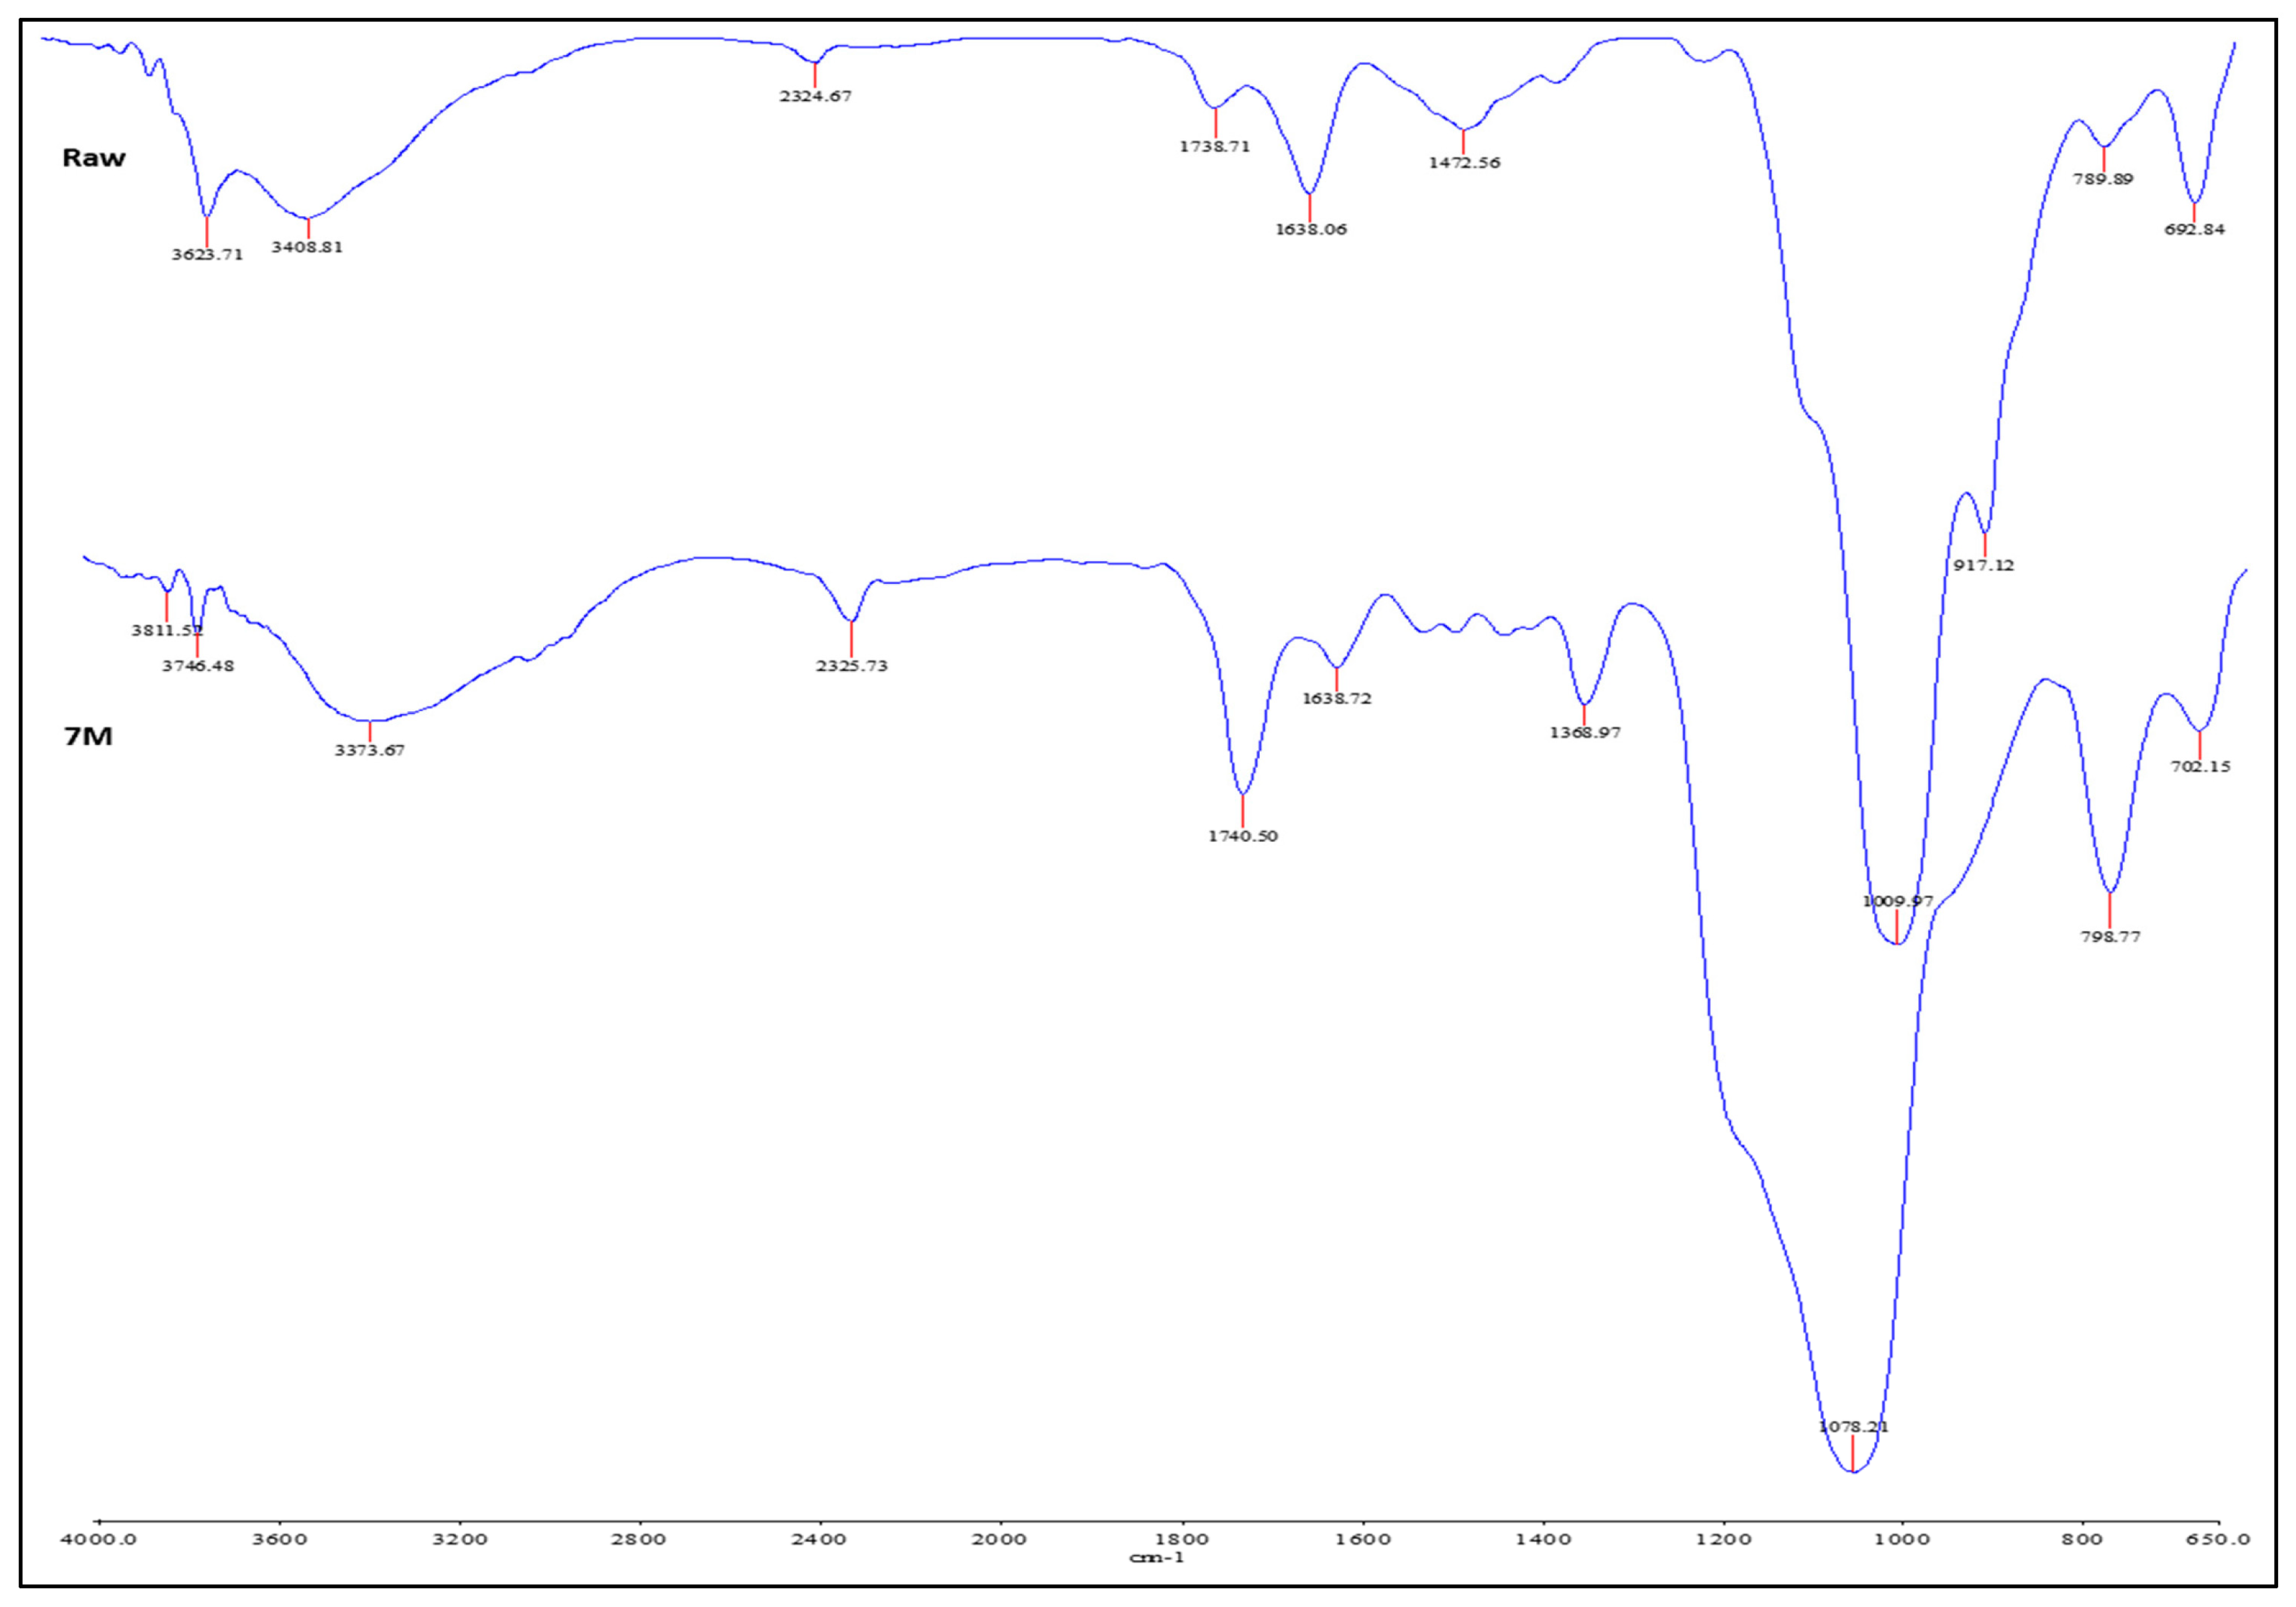
3.1.5. FTIR Analysis
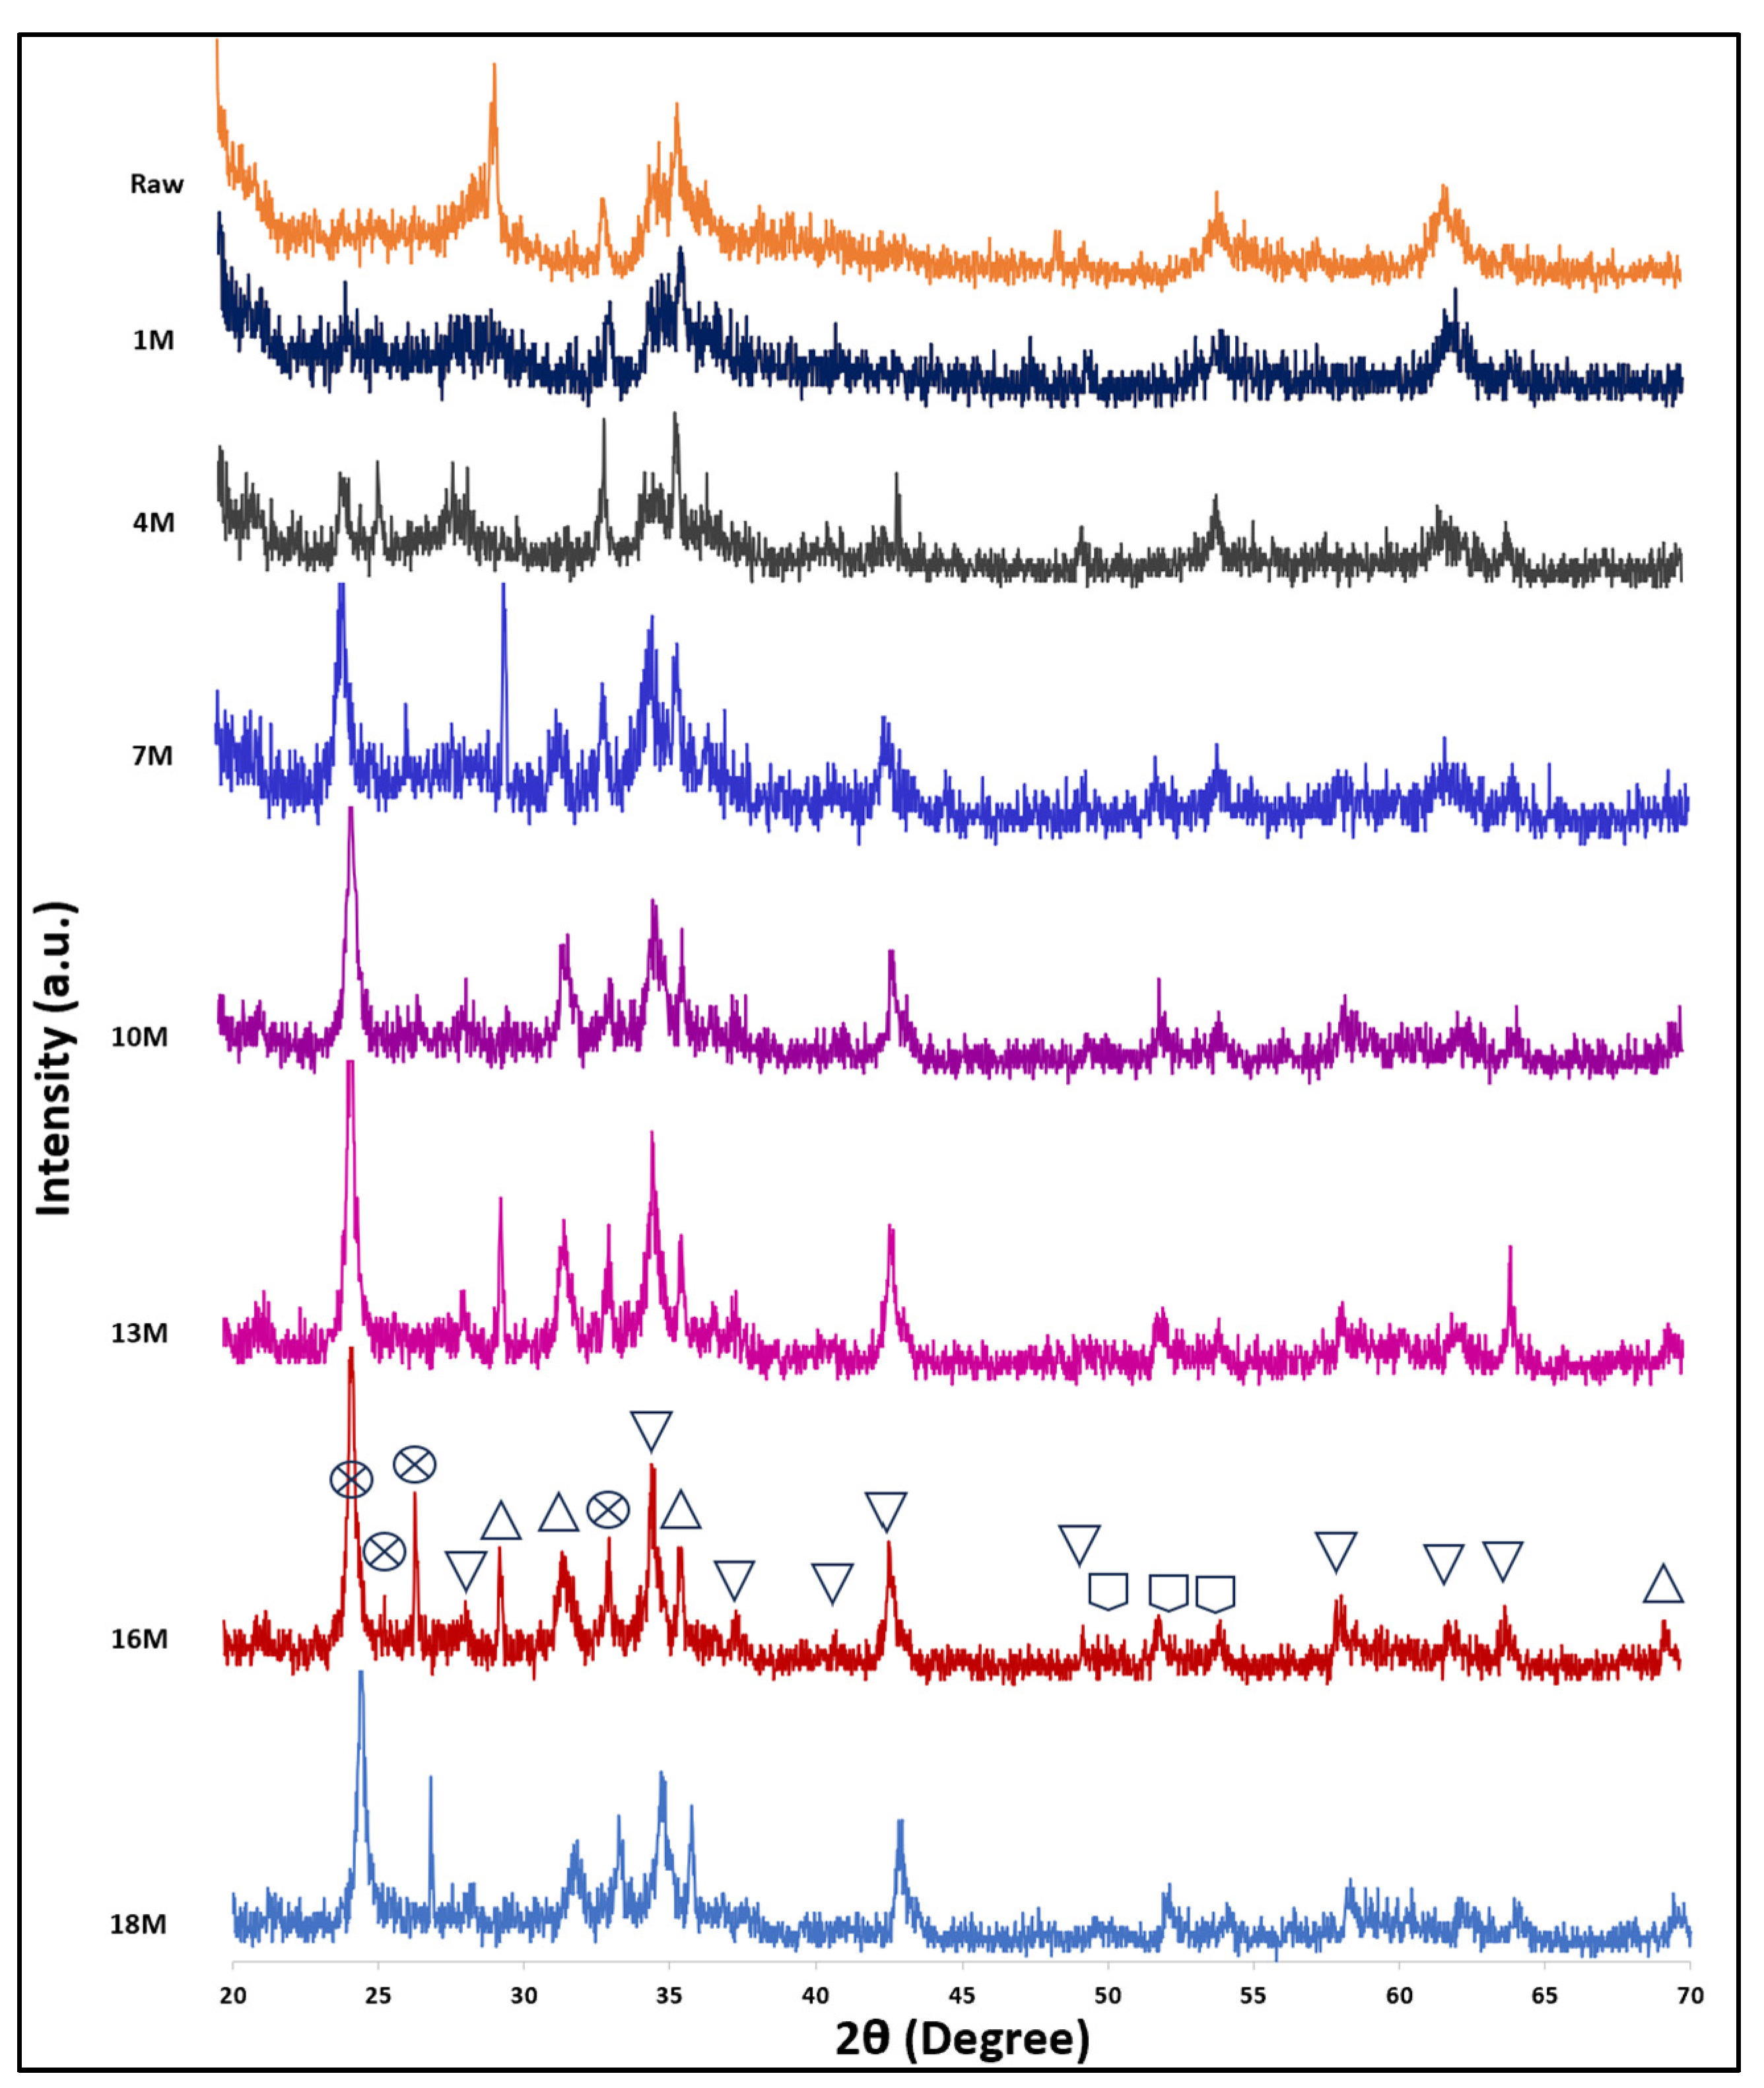
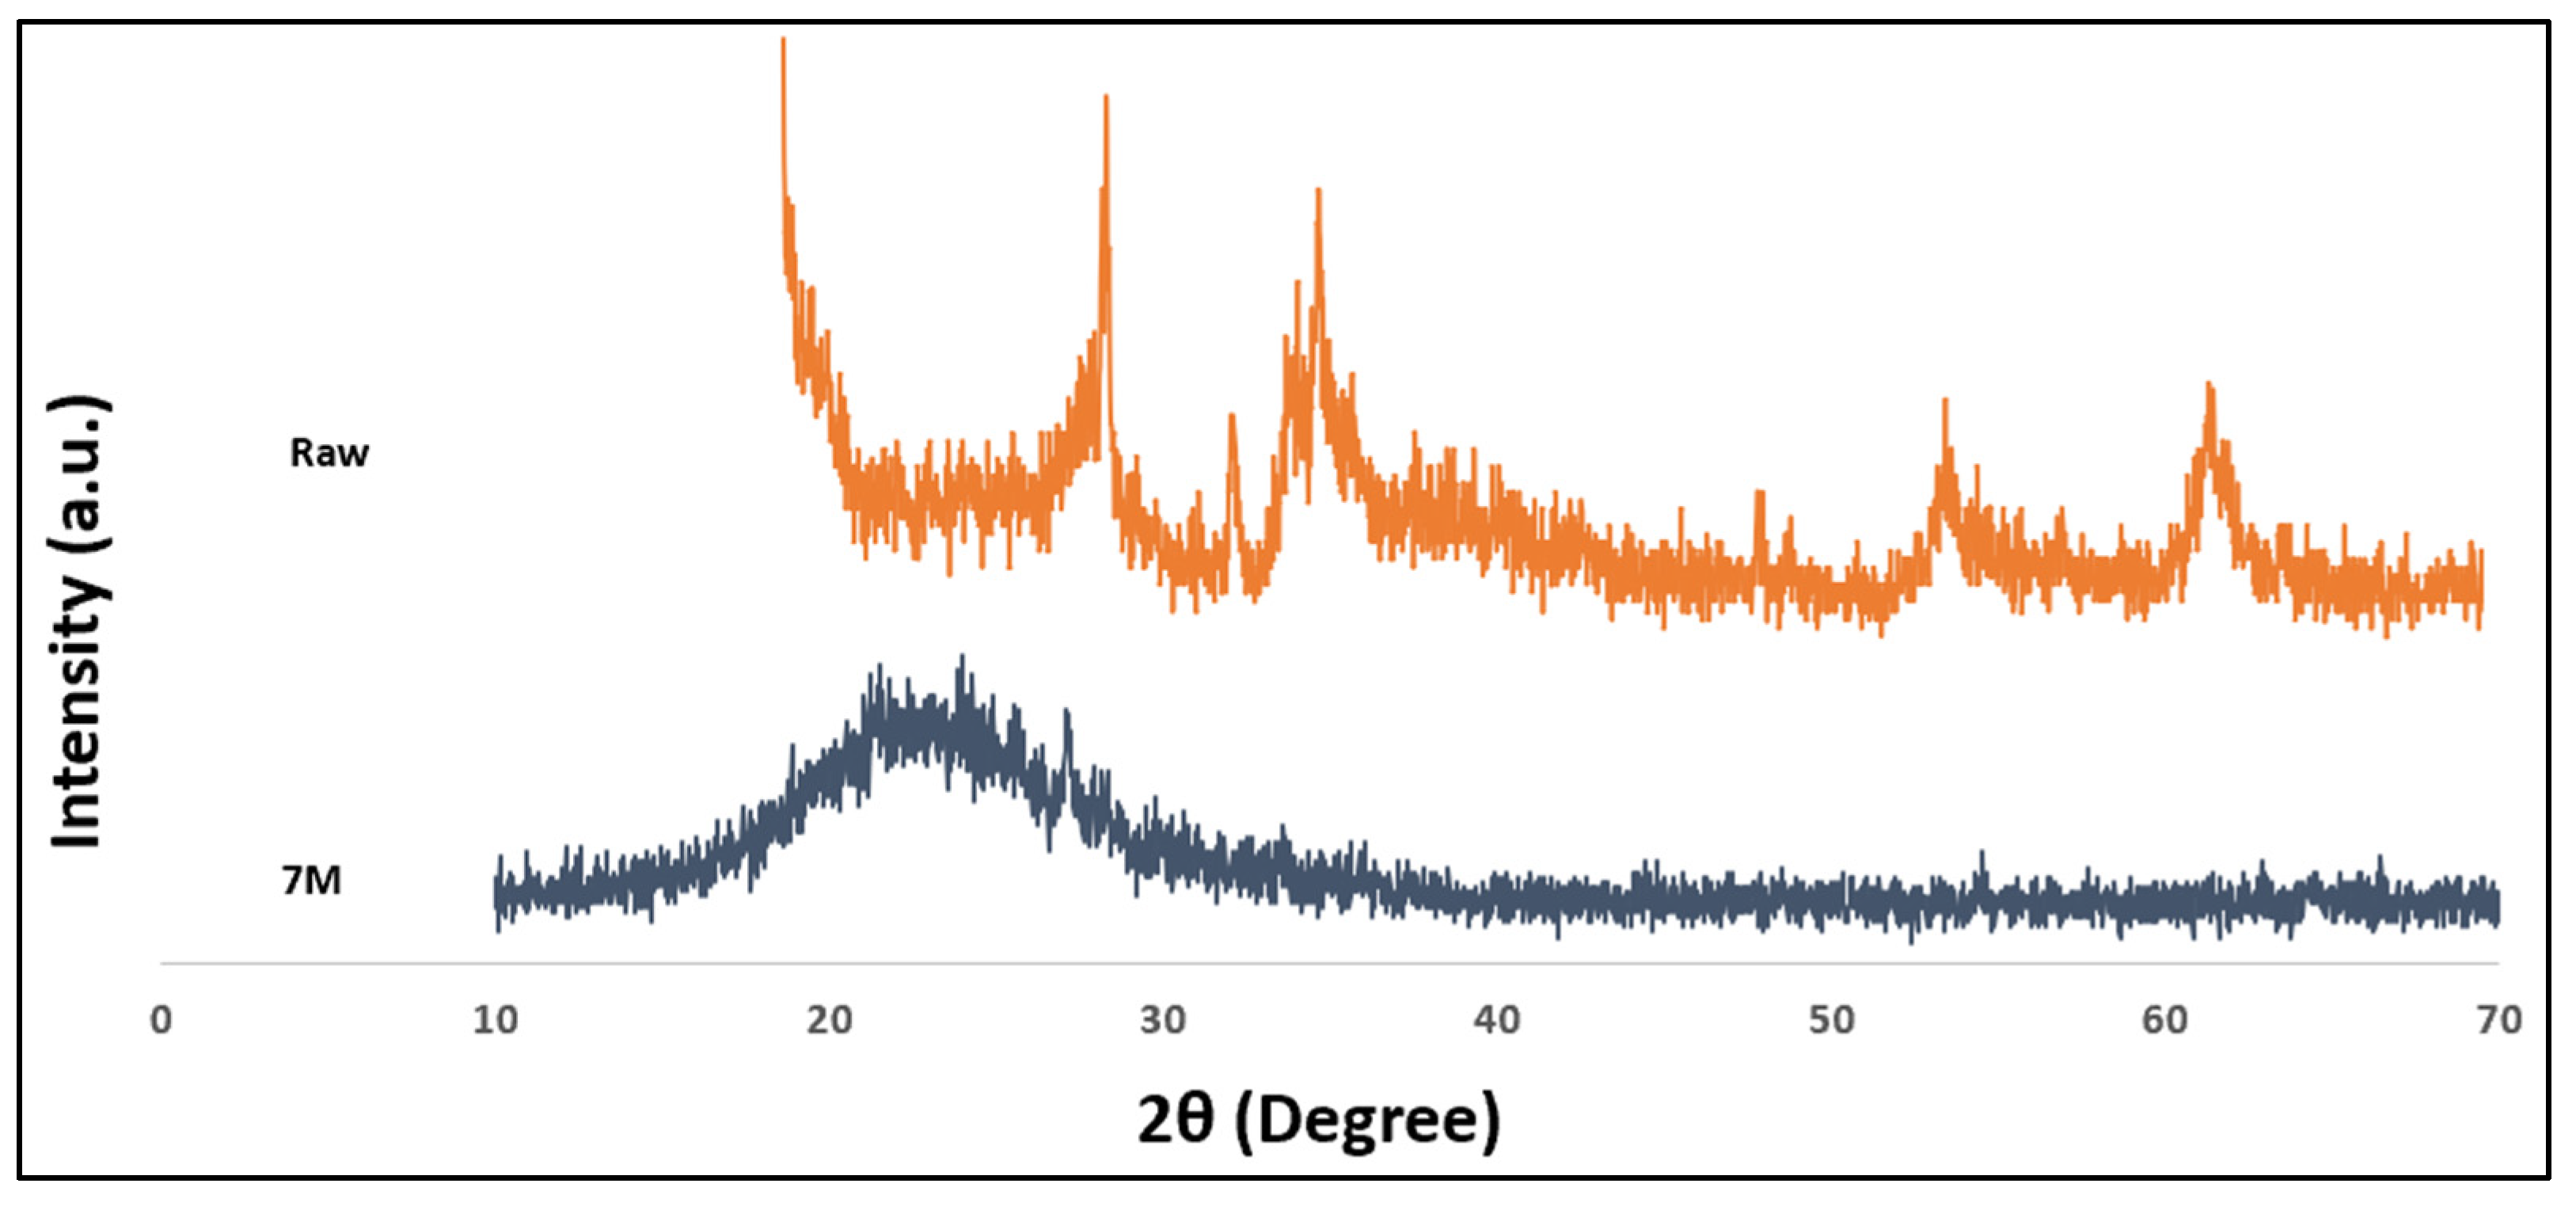
3.1.6. XRD Analysis
3.2. Adsorption Experiments
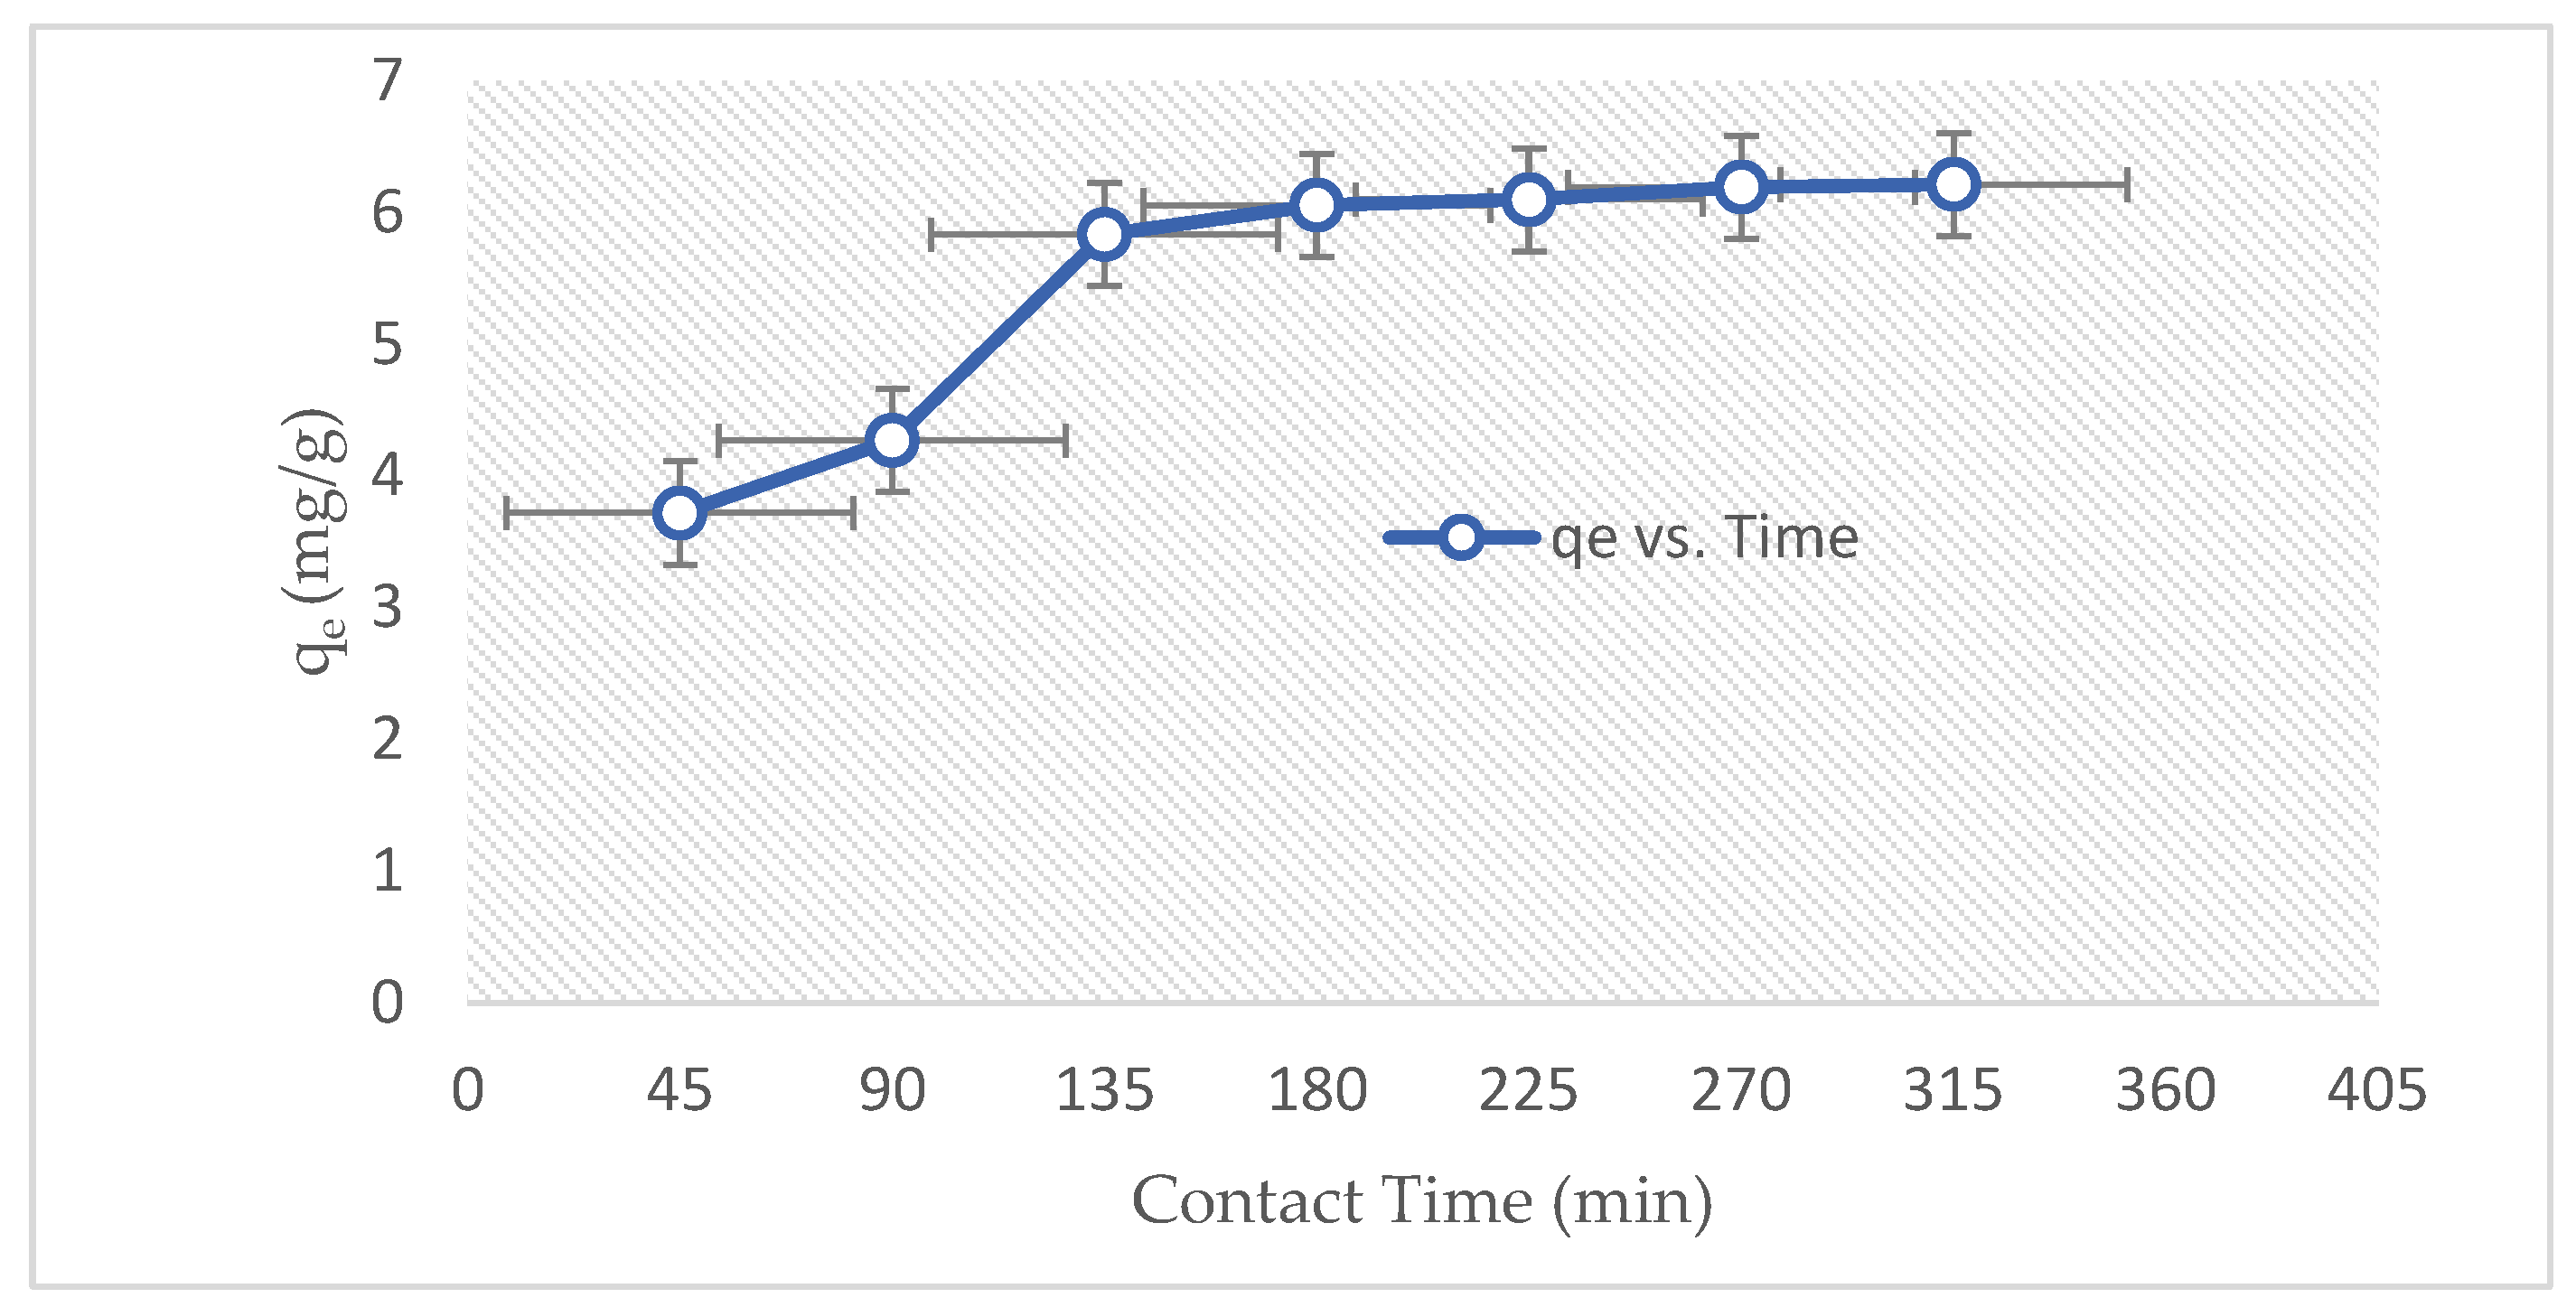
3.2.1. Effect of Contact Time
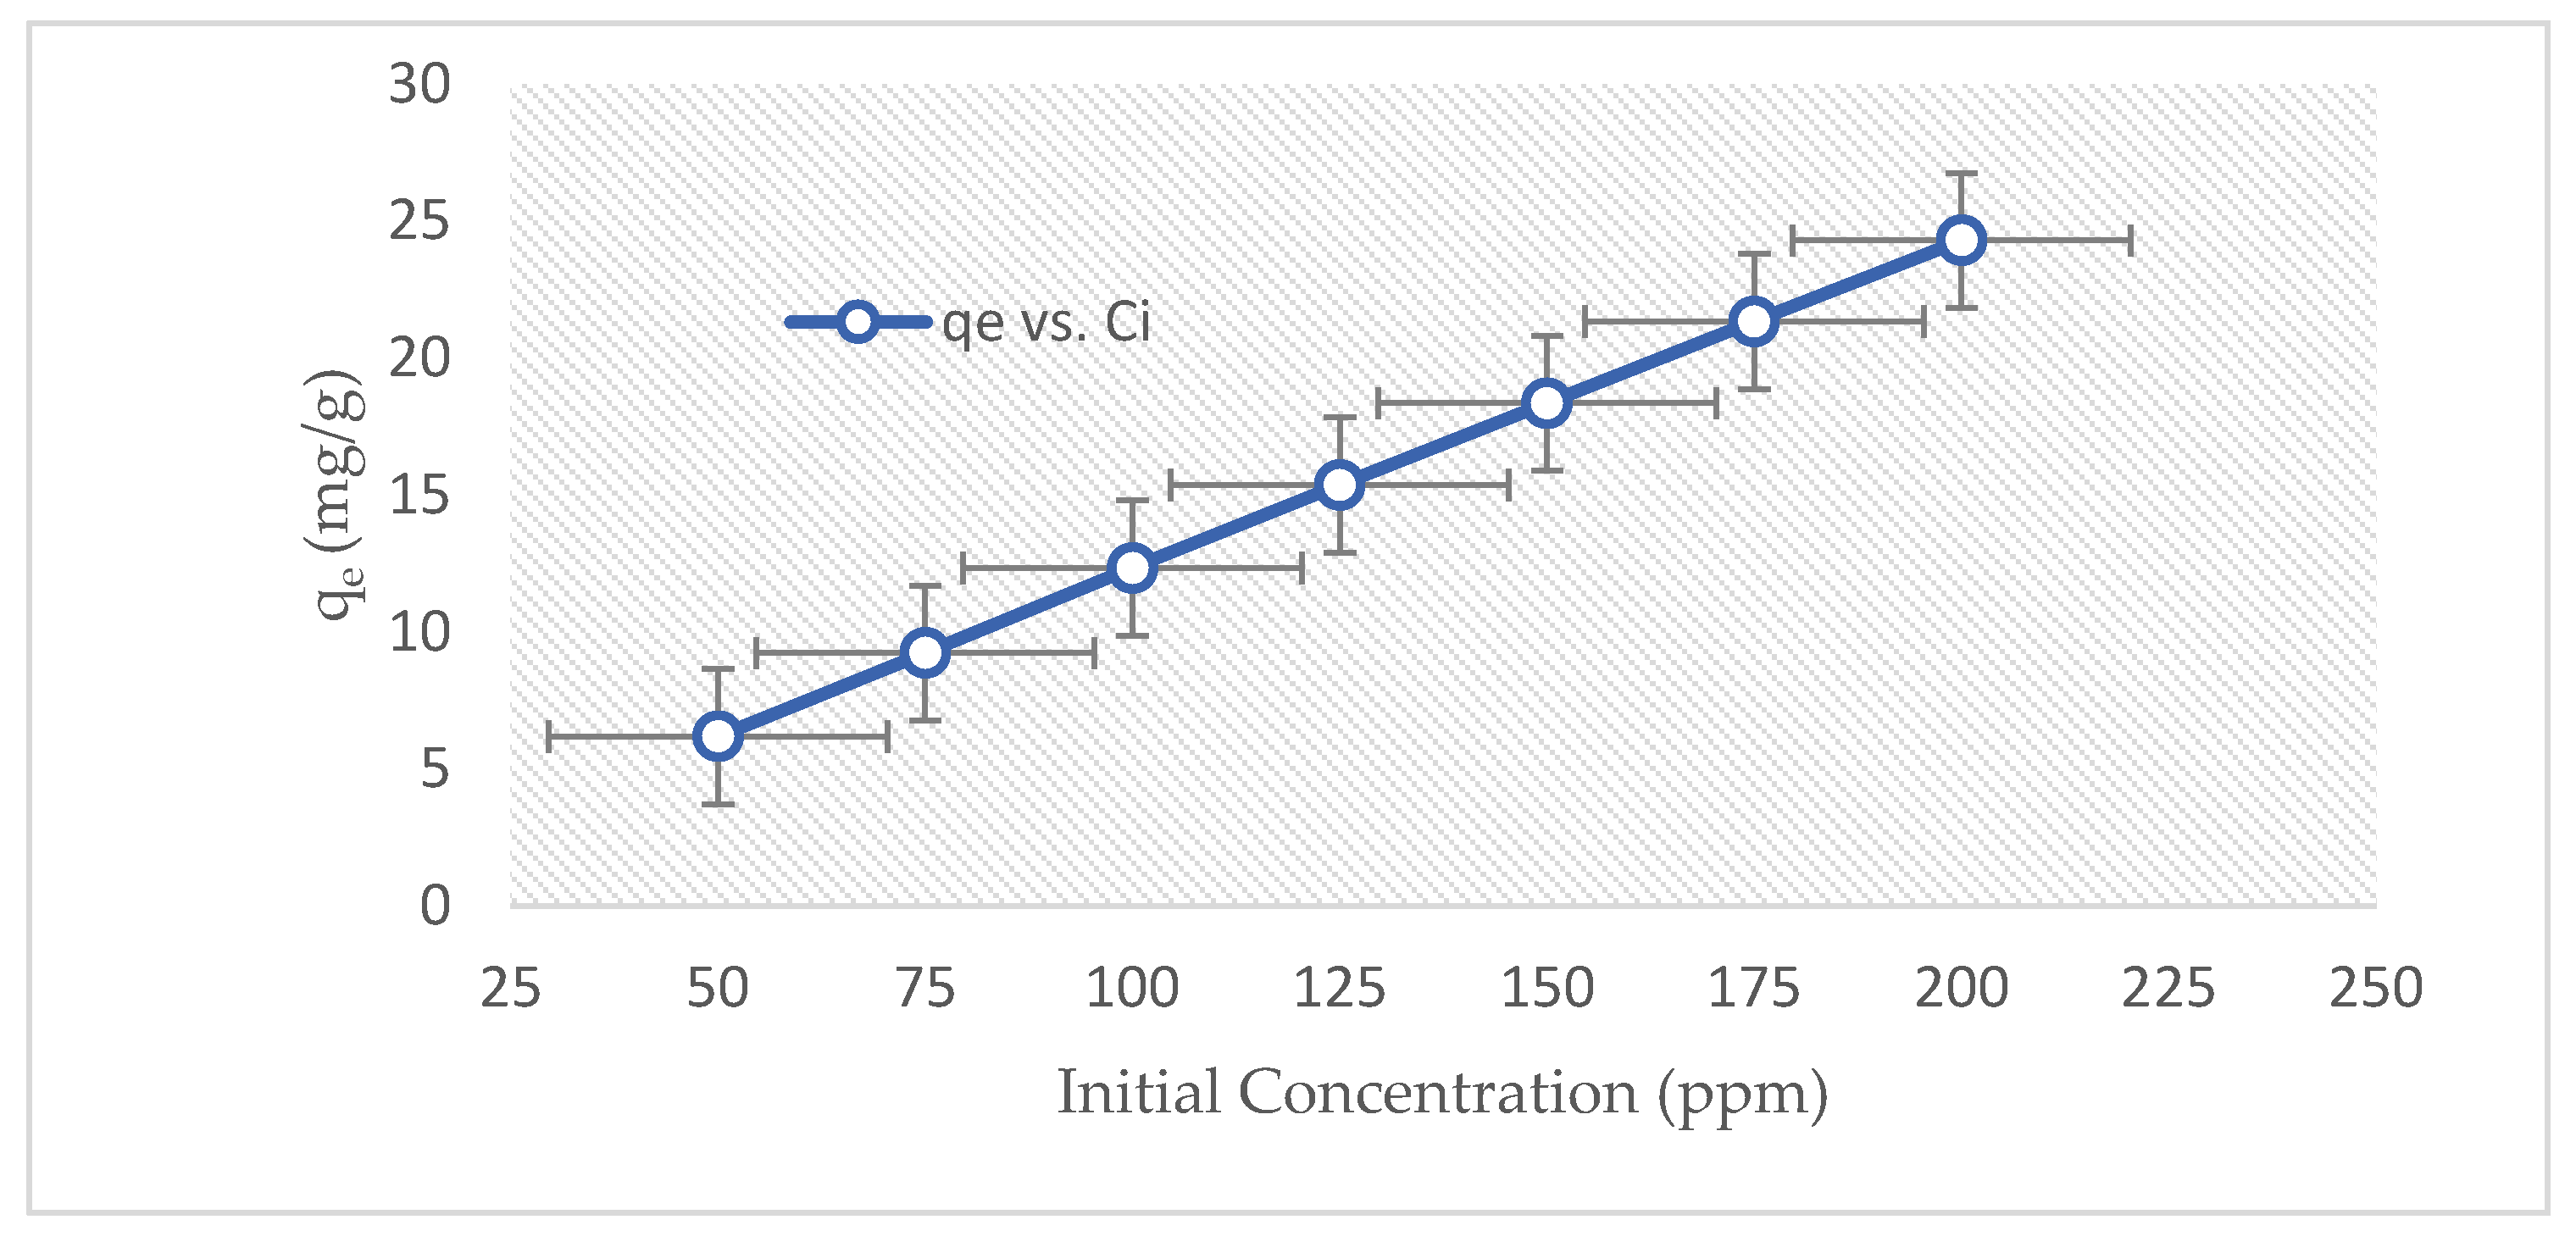
3.2.2. Effect of Initial Concentration
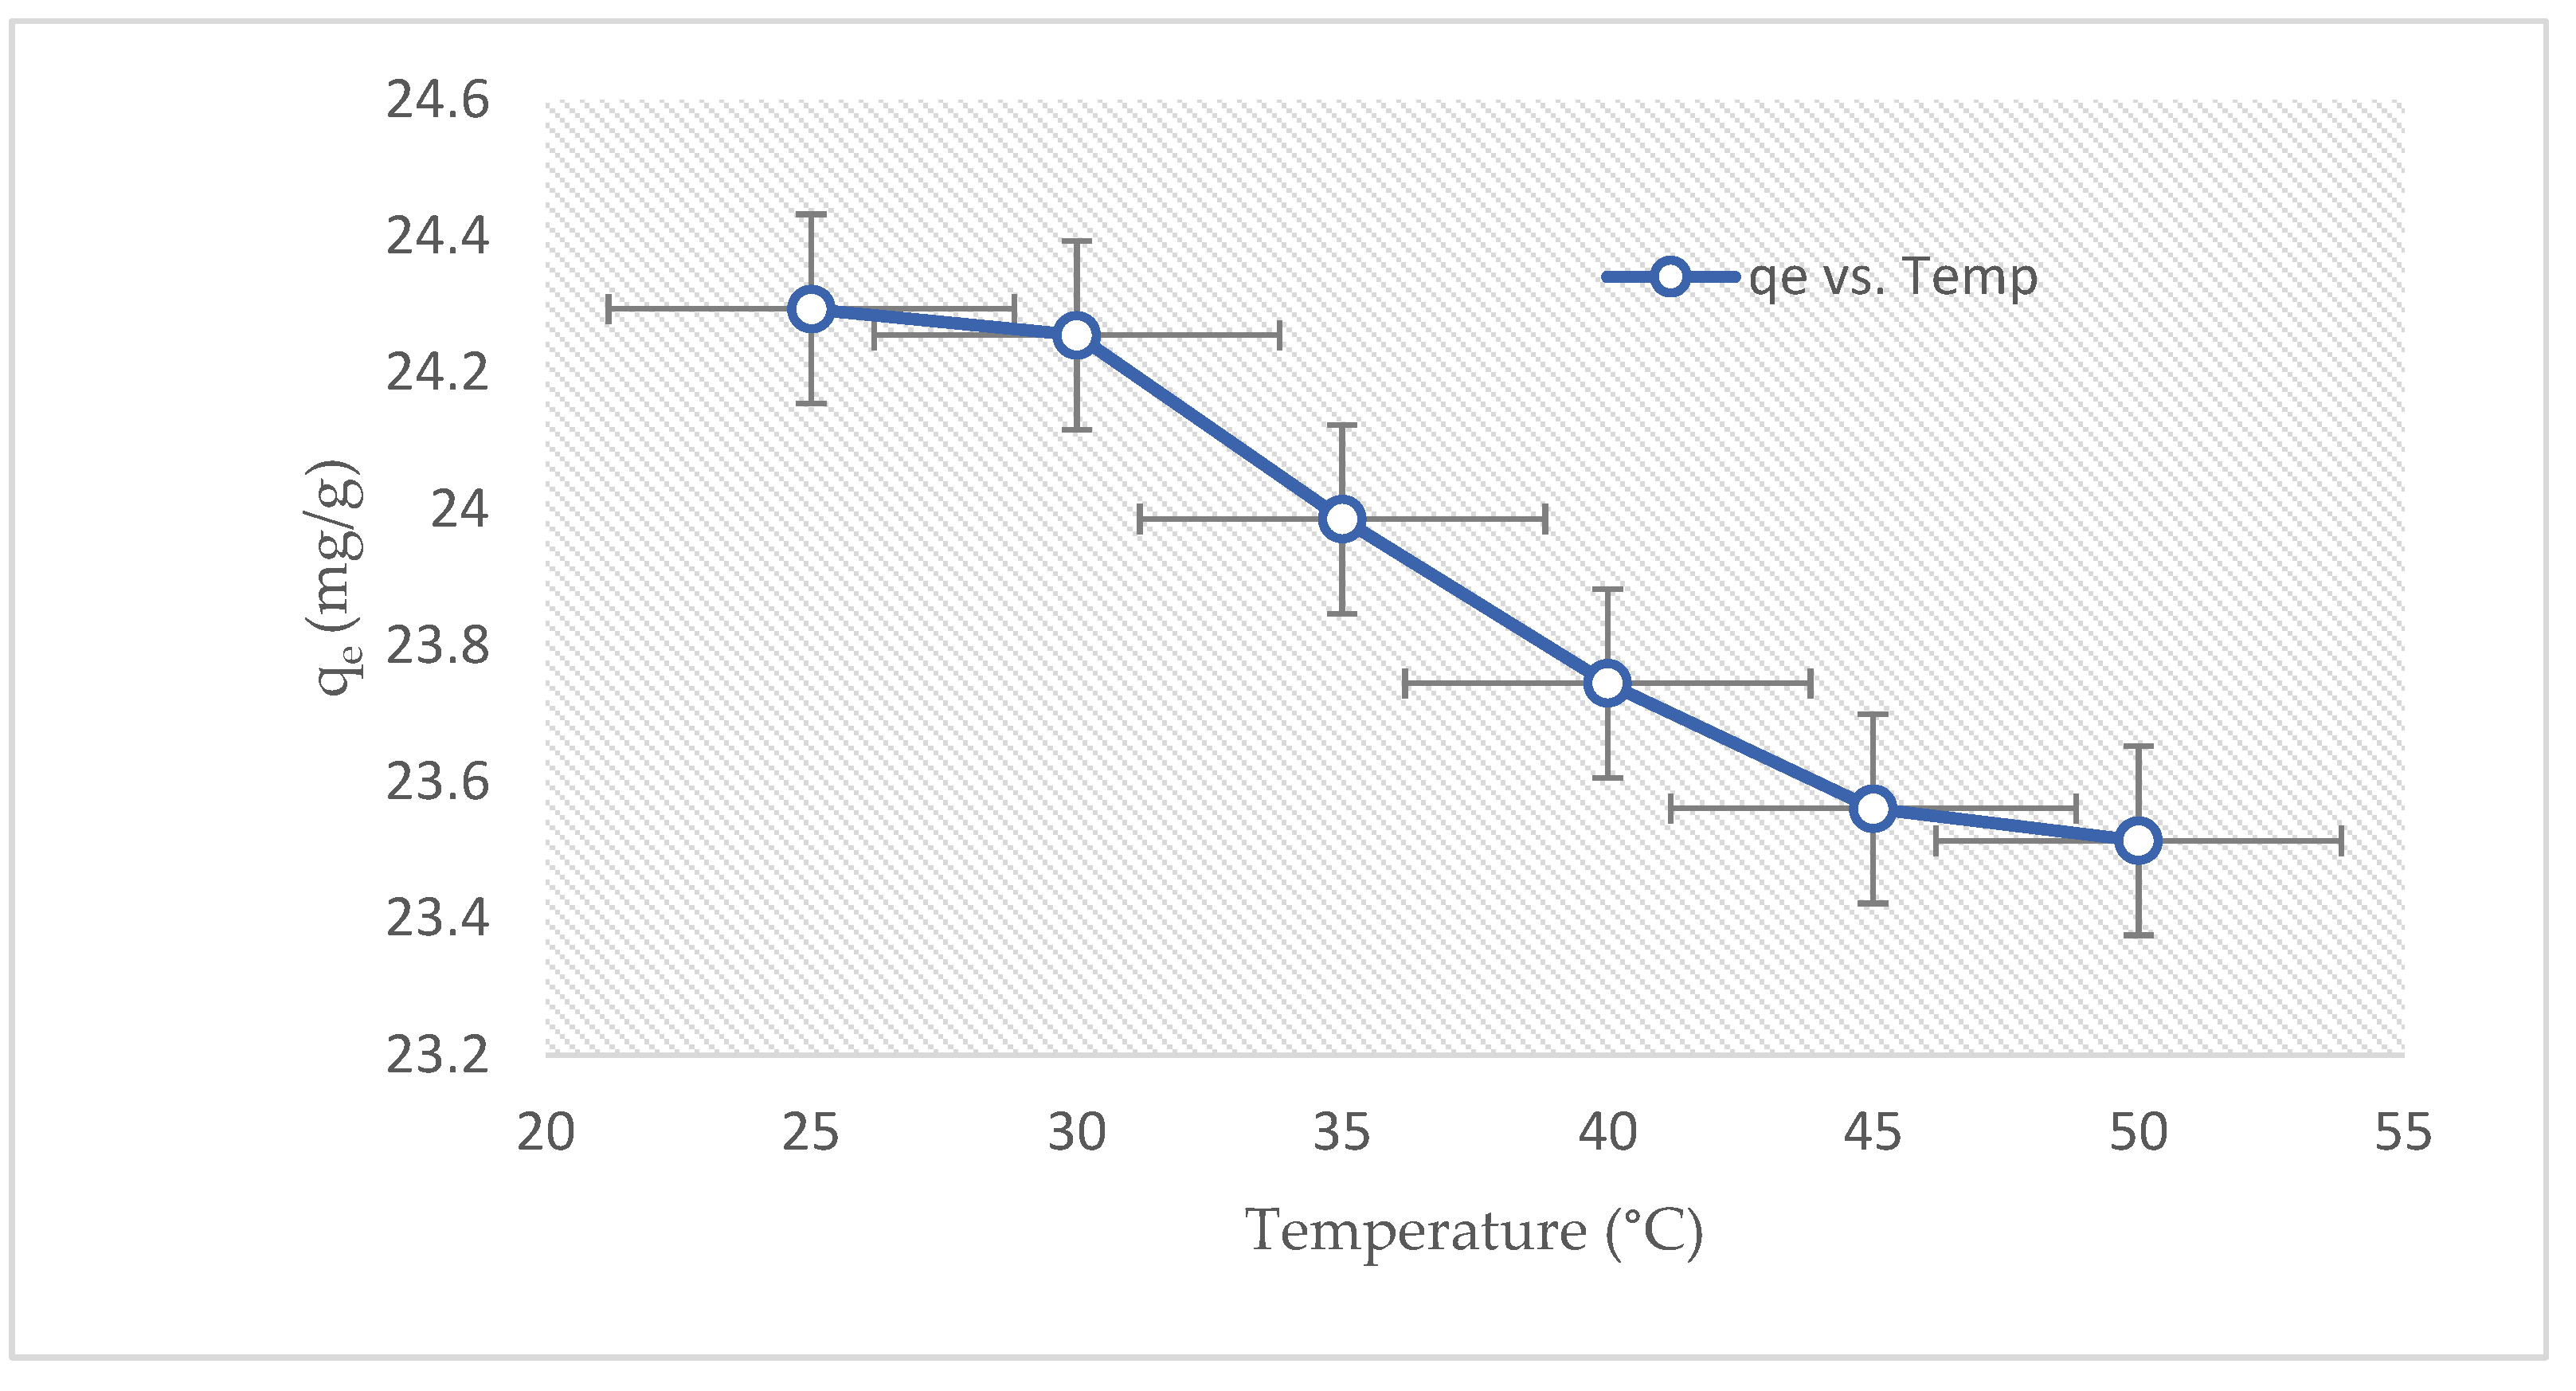
3.2.3. Effect of Temperature
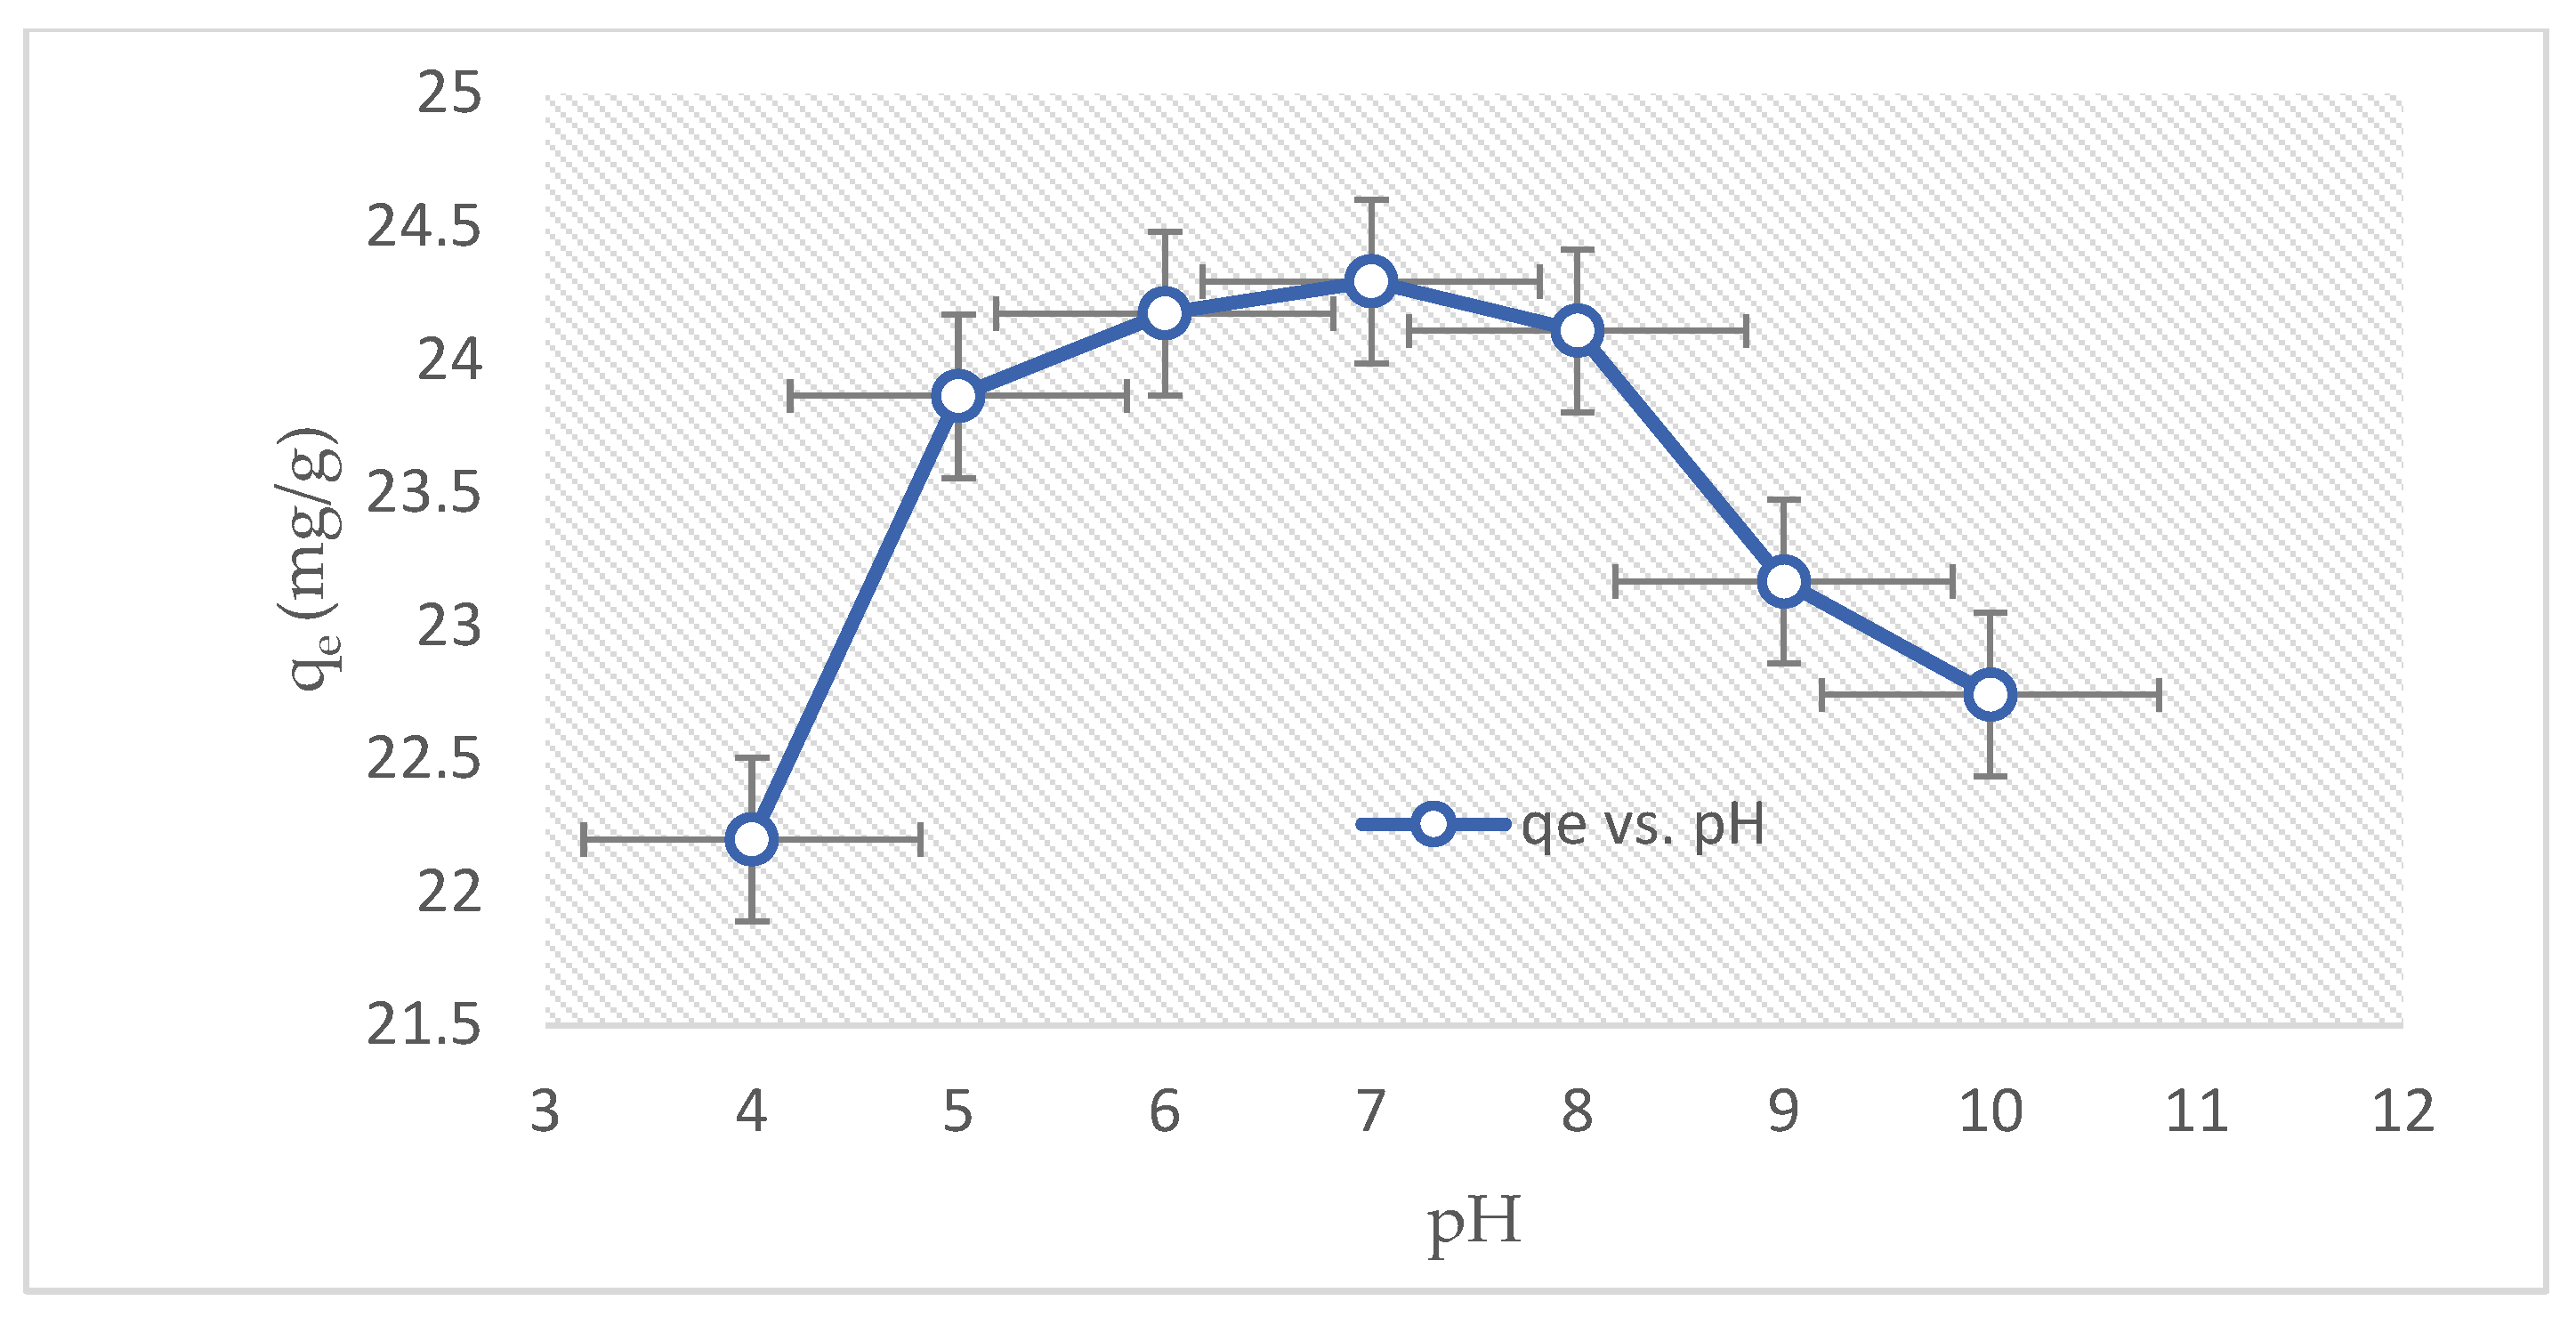
3.2.4. Effect of pH
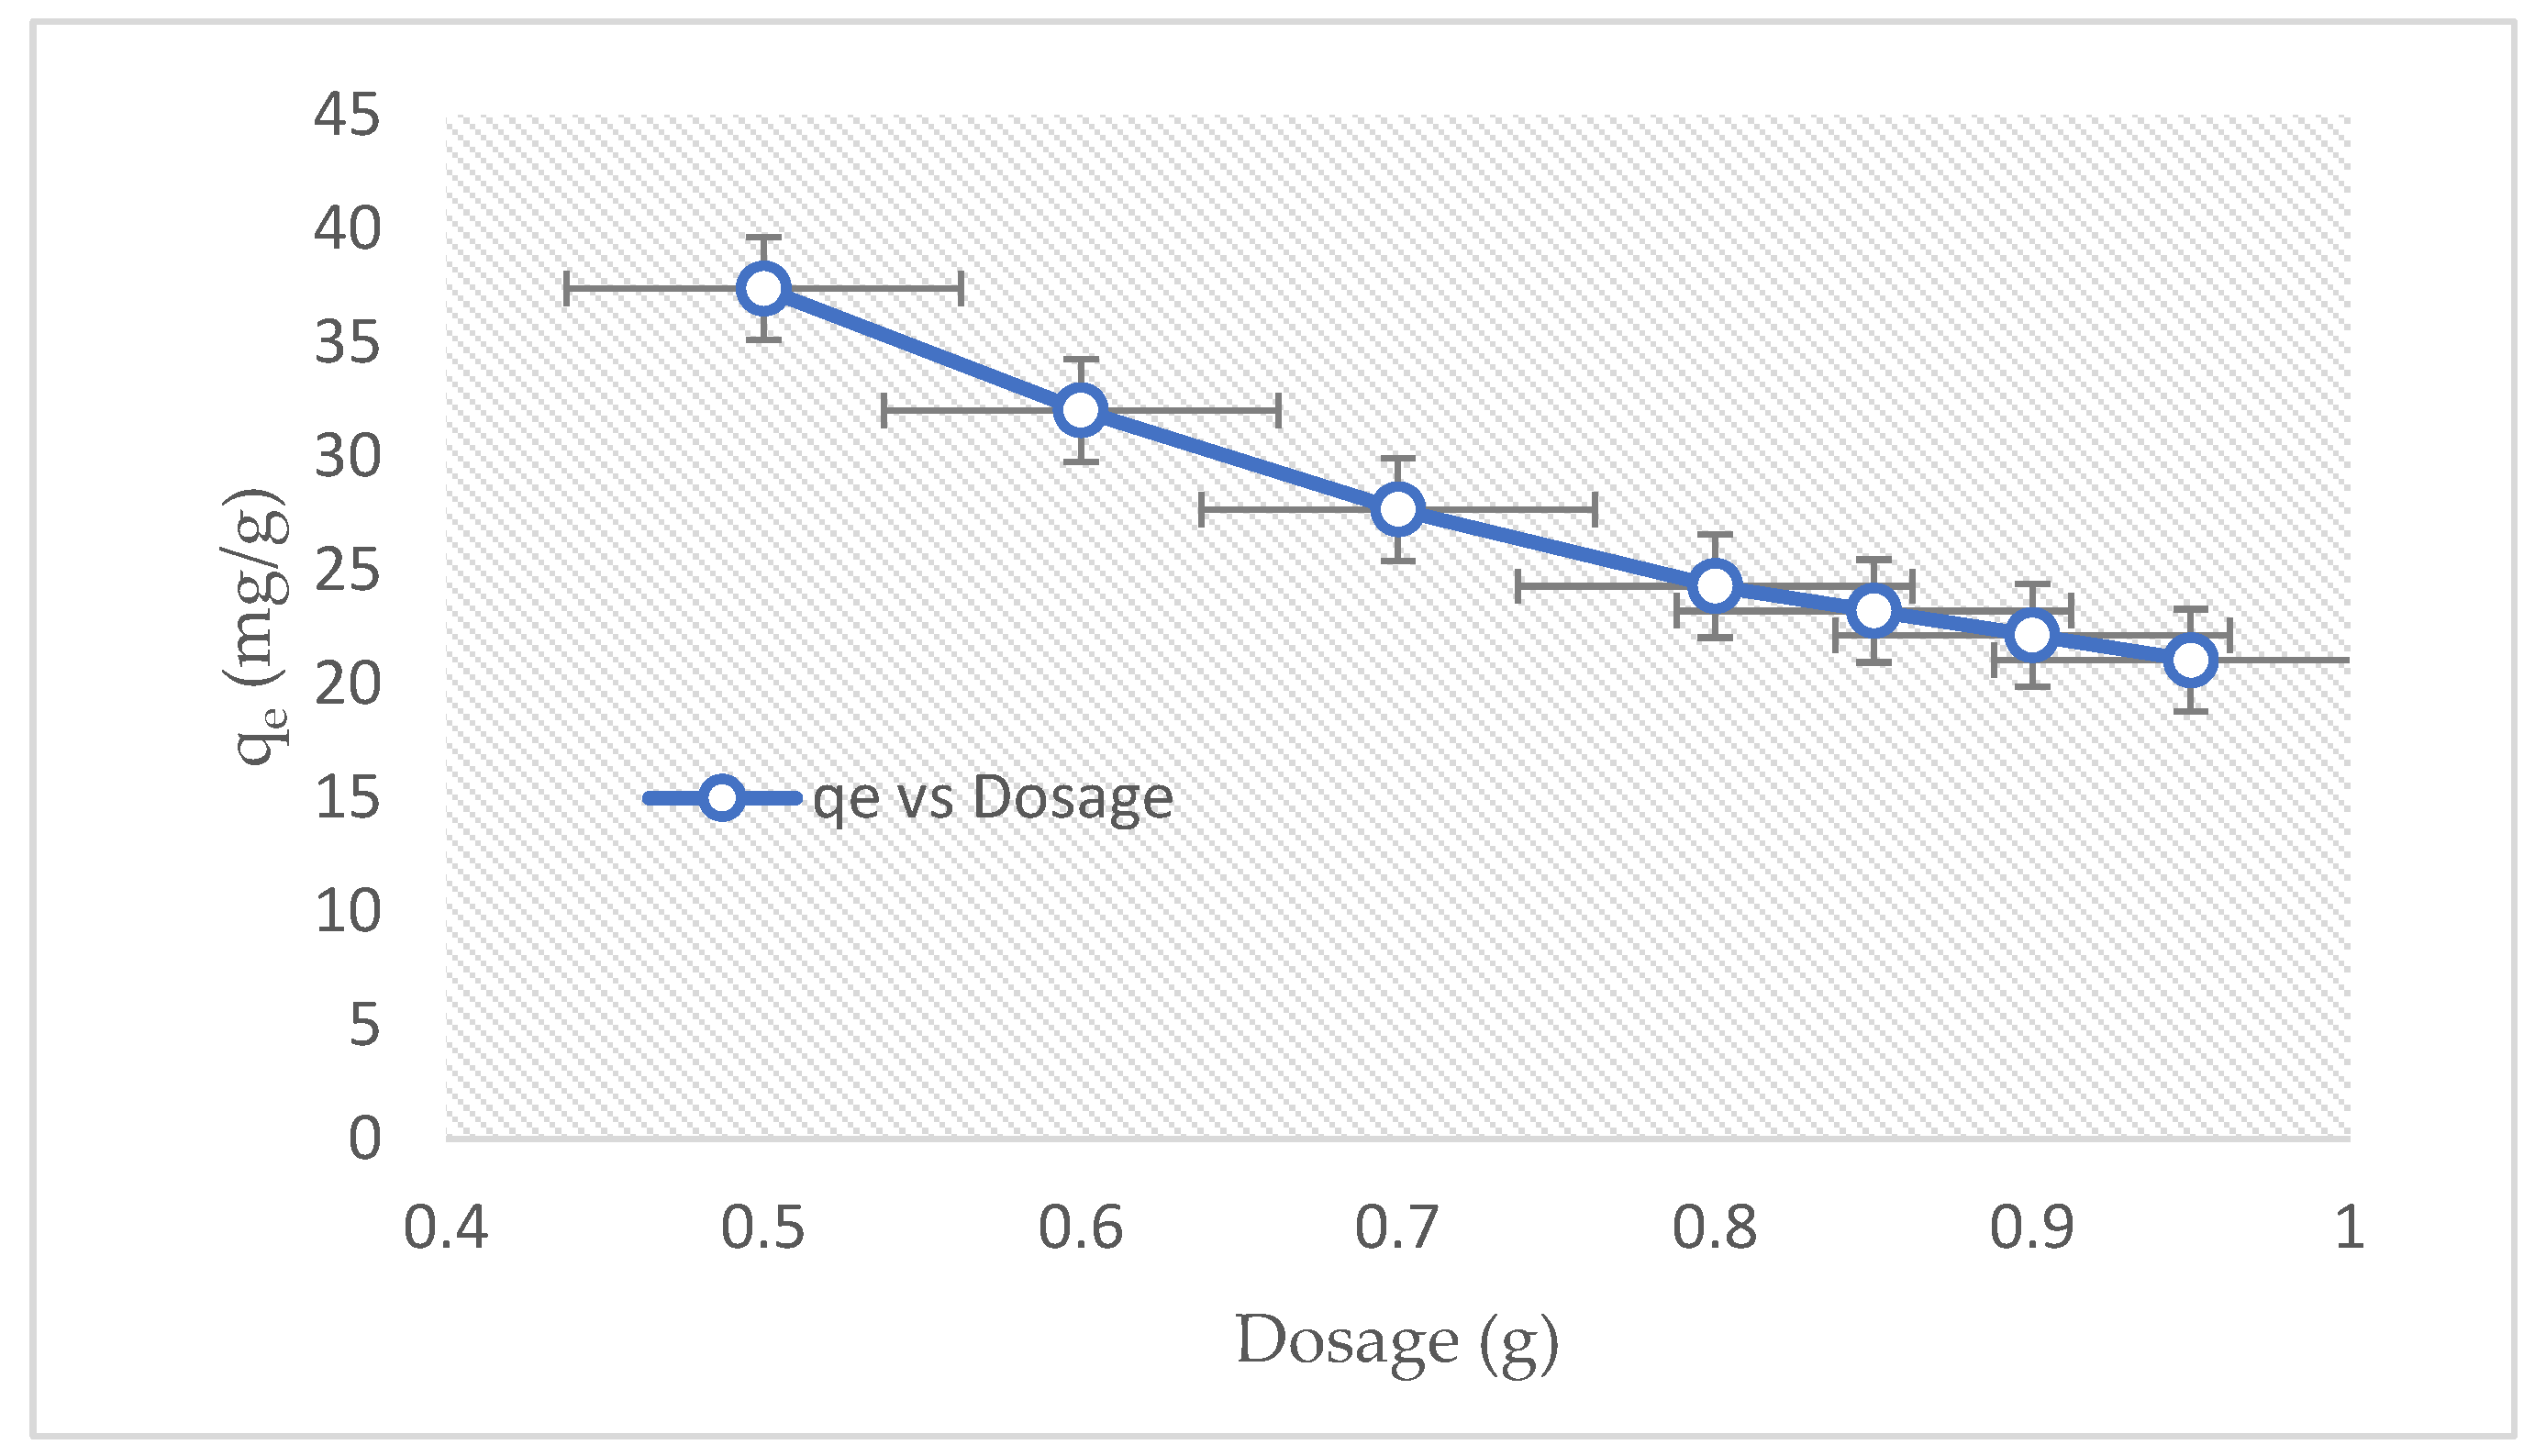
3.2.5. Effect of Dosage
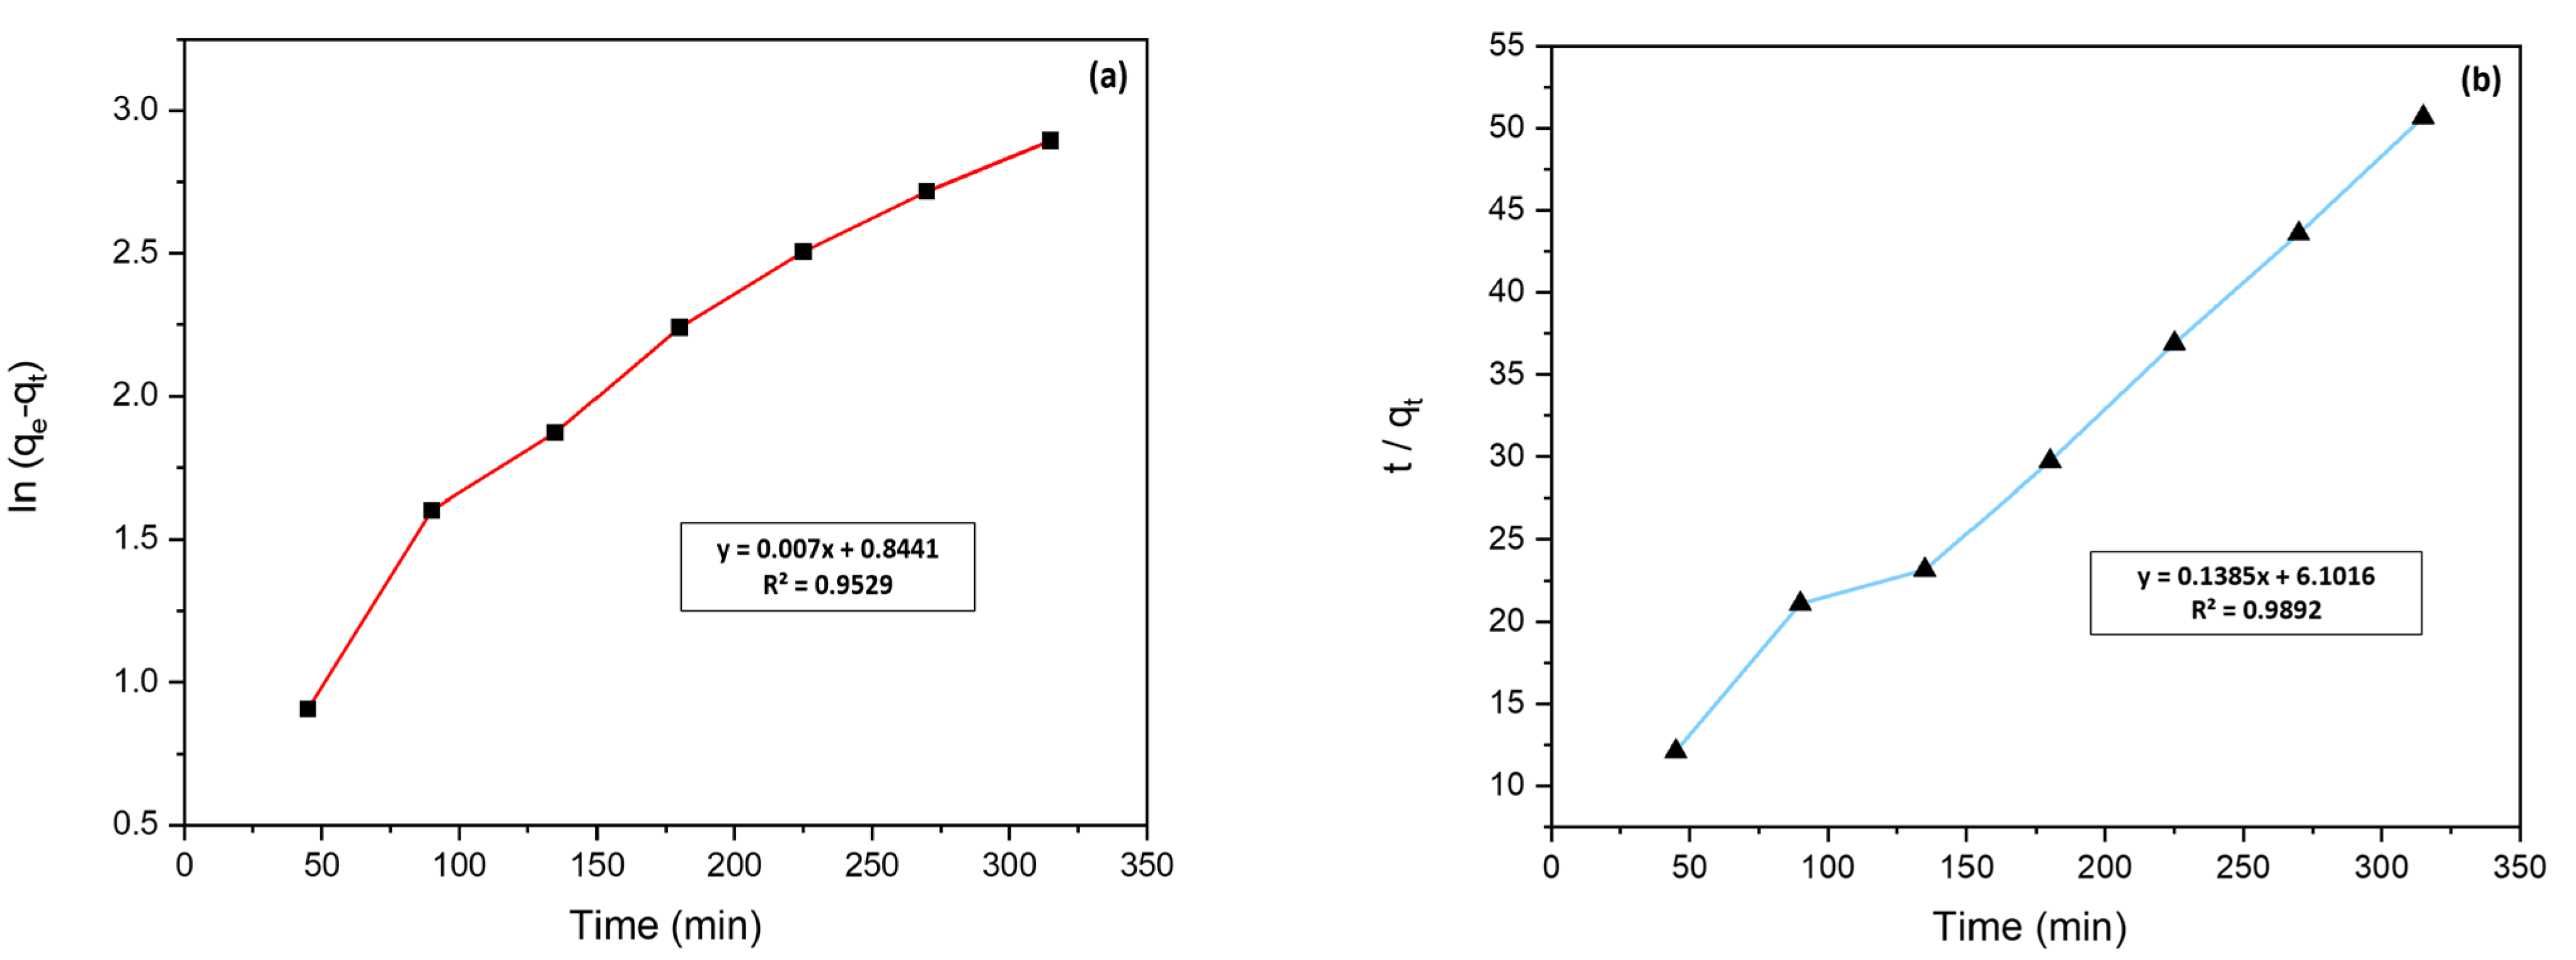
3.3. Kinetic Study of Methylene Blue Adsorption
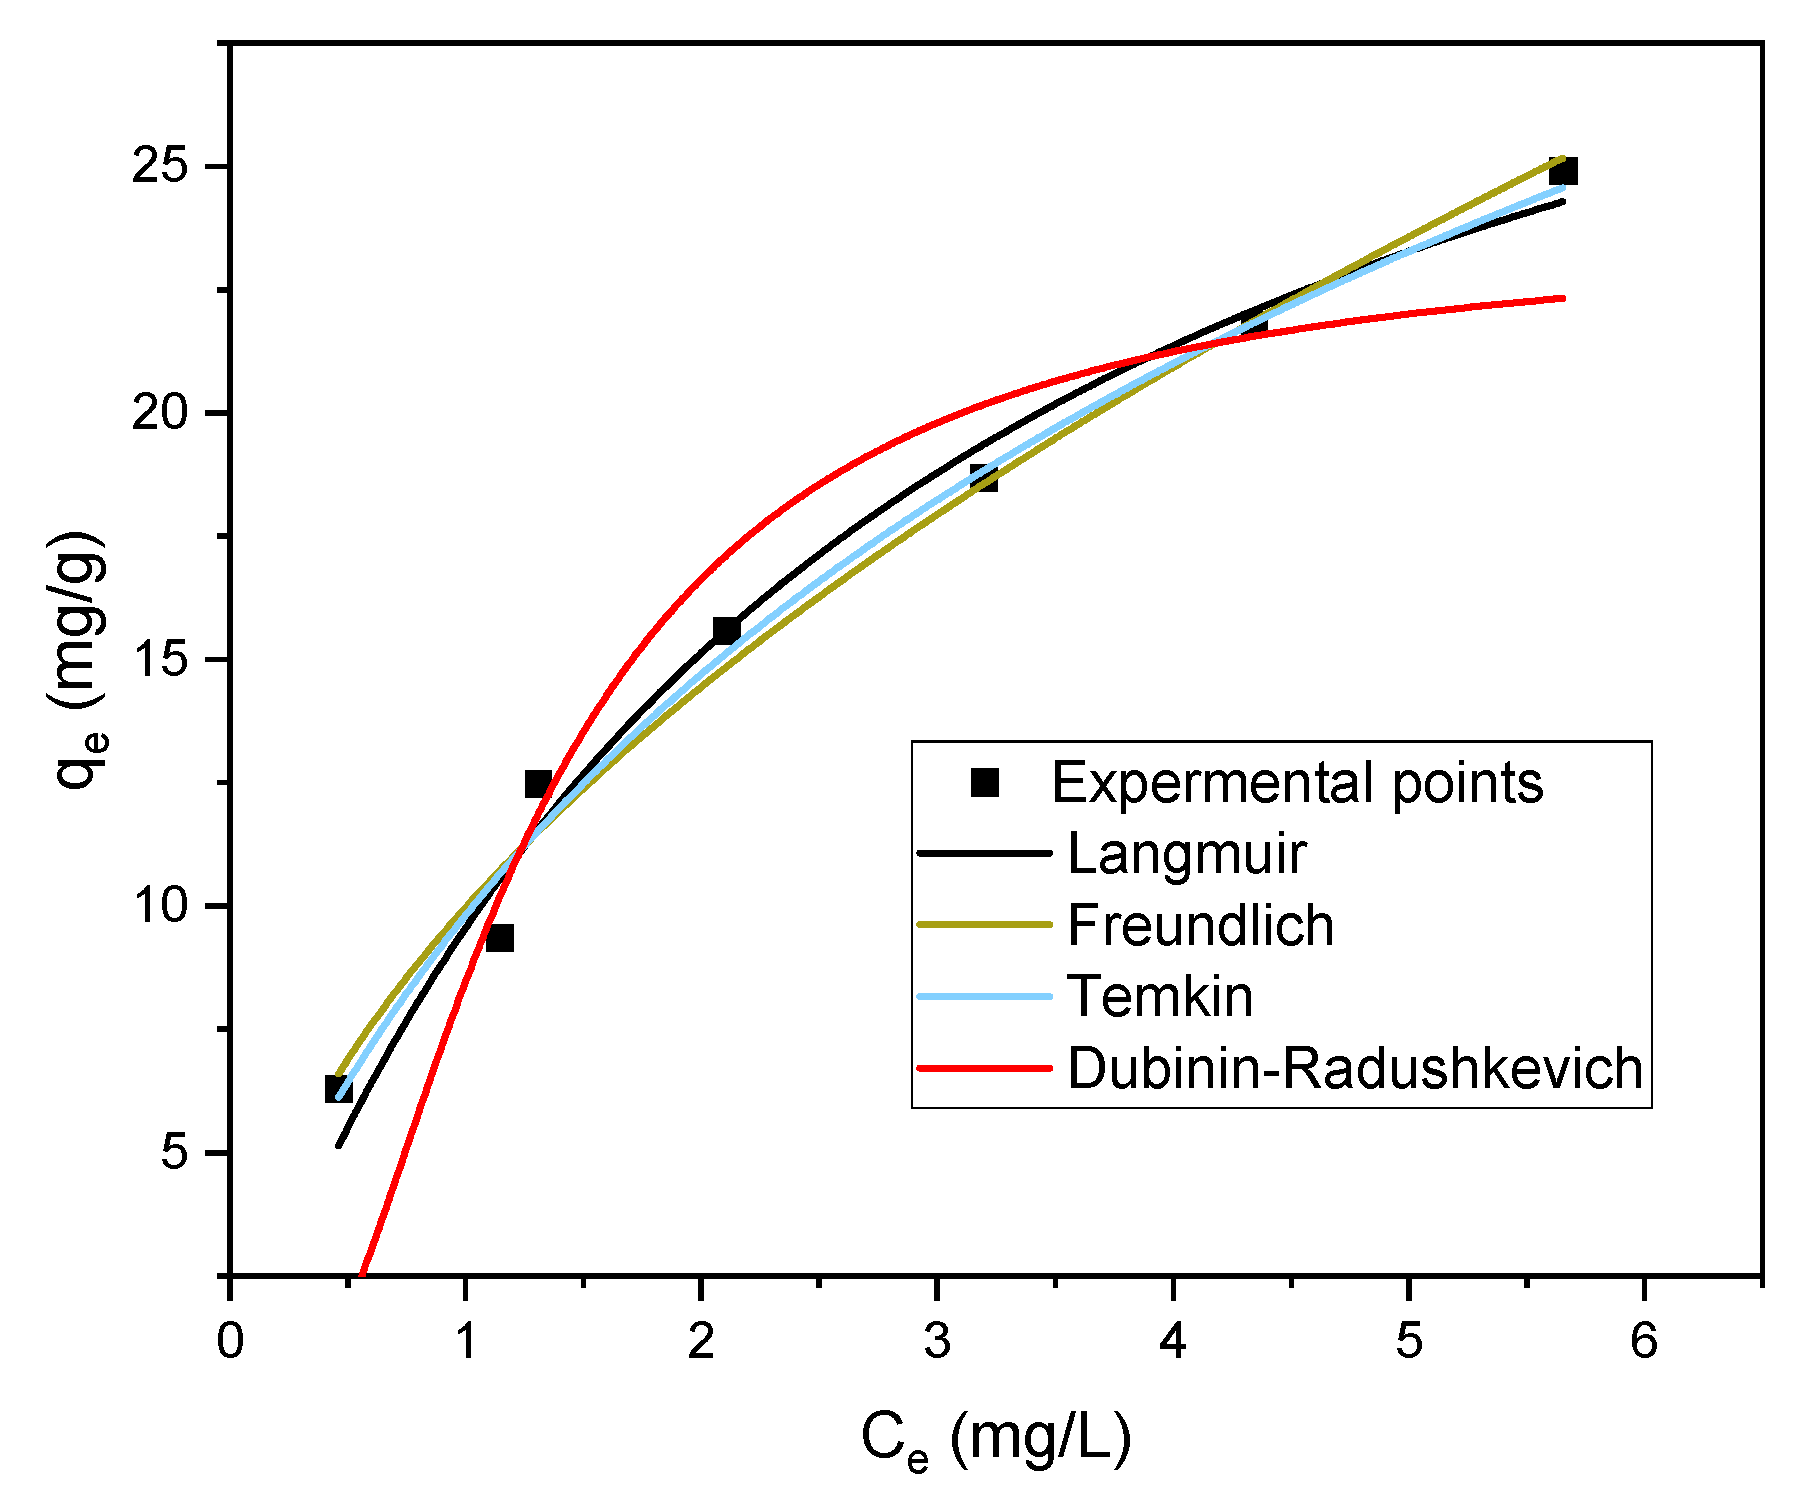
3.4. Isotherm Analysis of Methylene Blue Adsorption
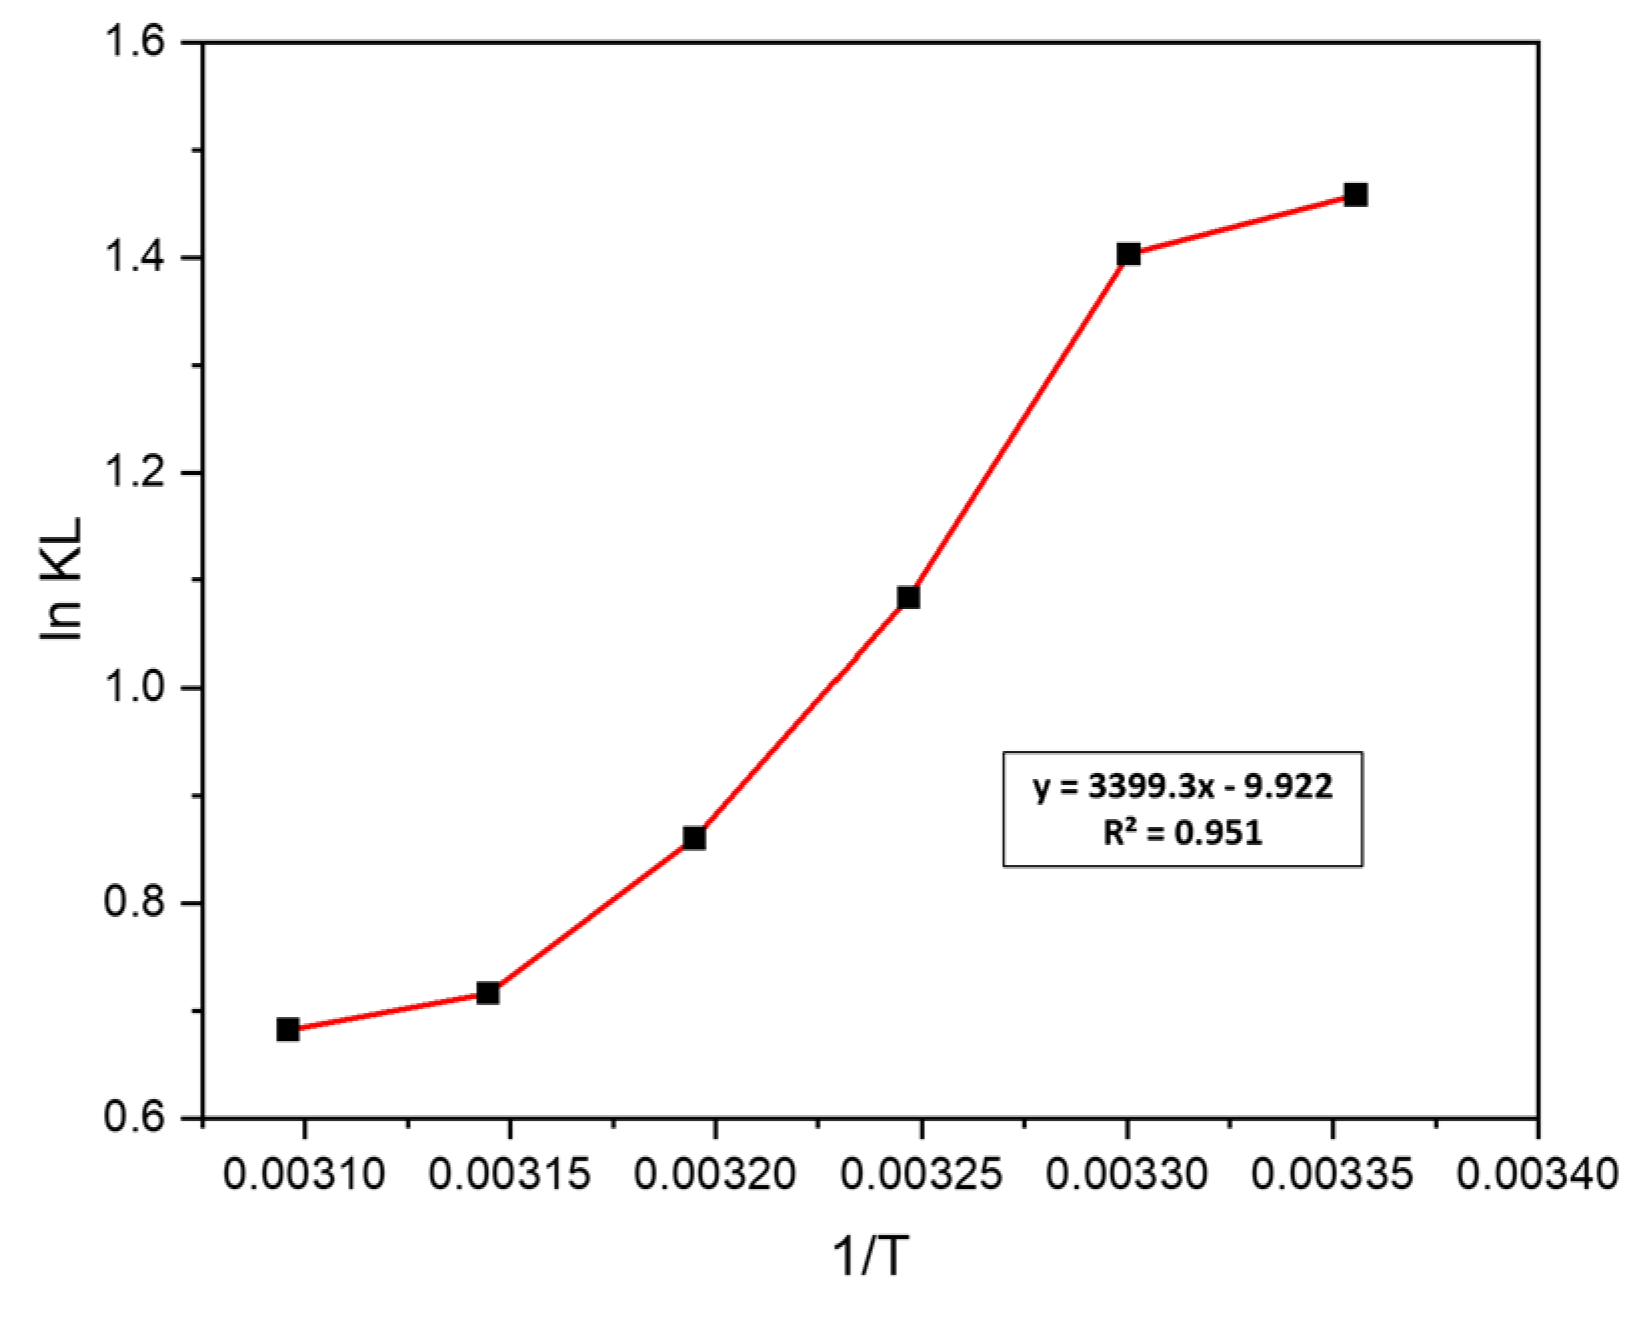
3.5. Thermodynamic Study
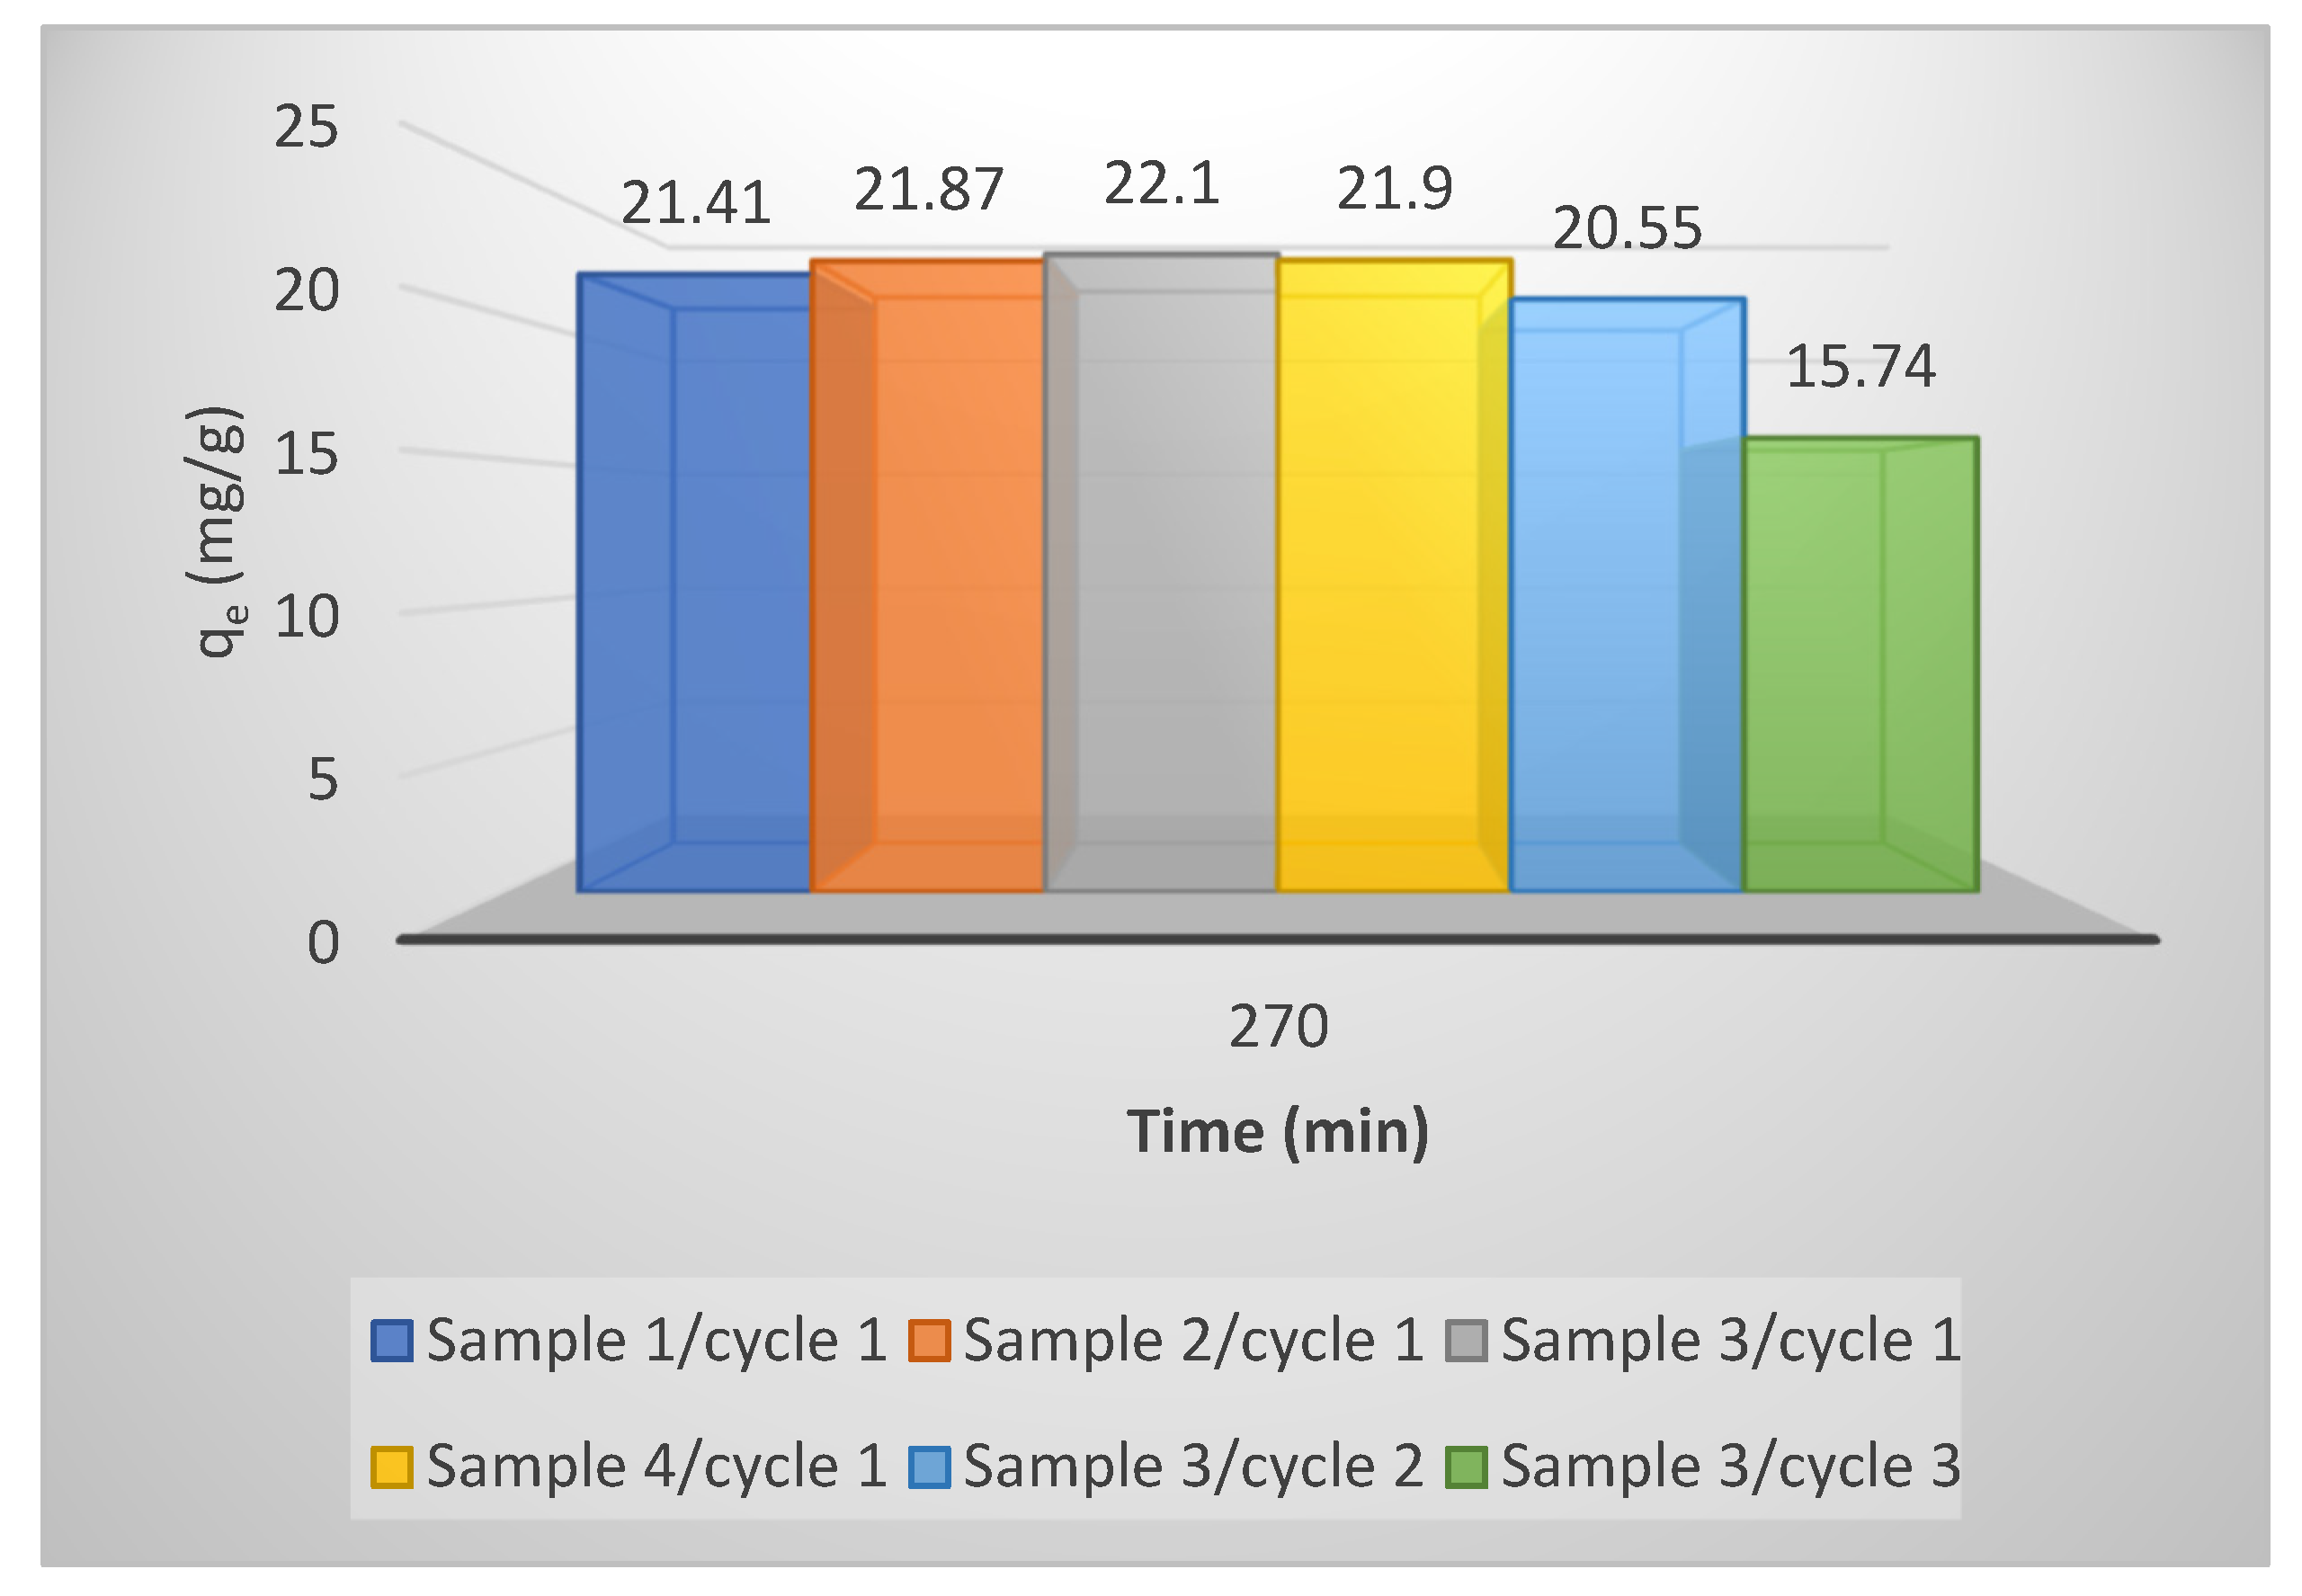
3.6. Regeneration and Reusability
3.7. Surface Characterization of BABC Pre- and Post-MB Adsorption
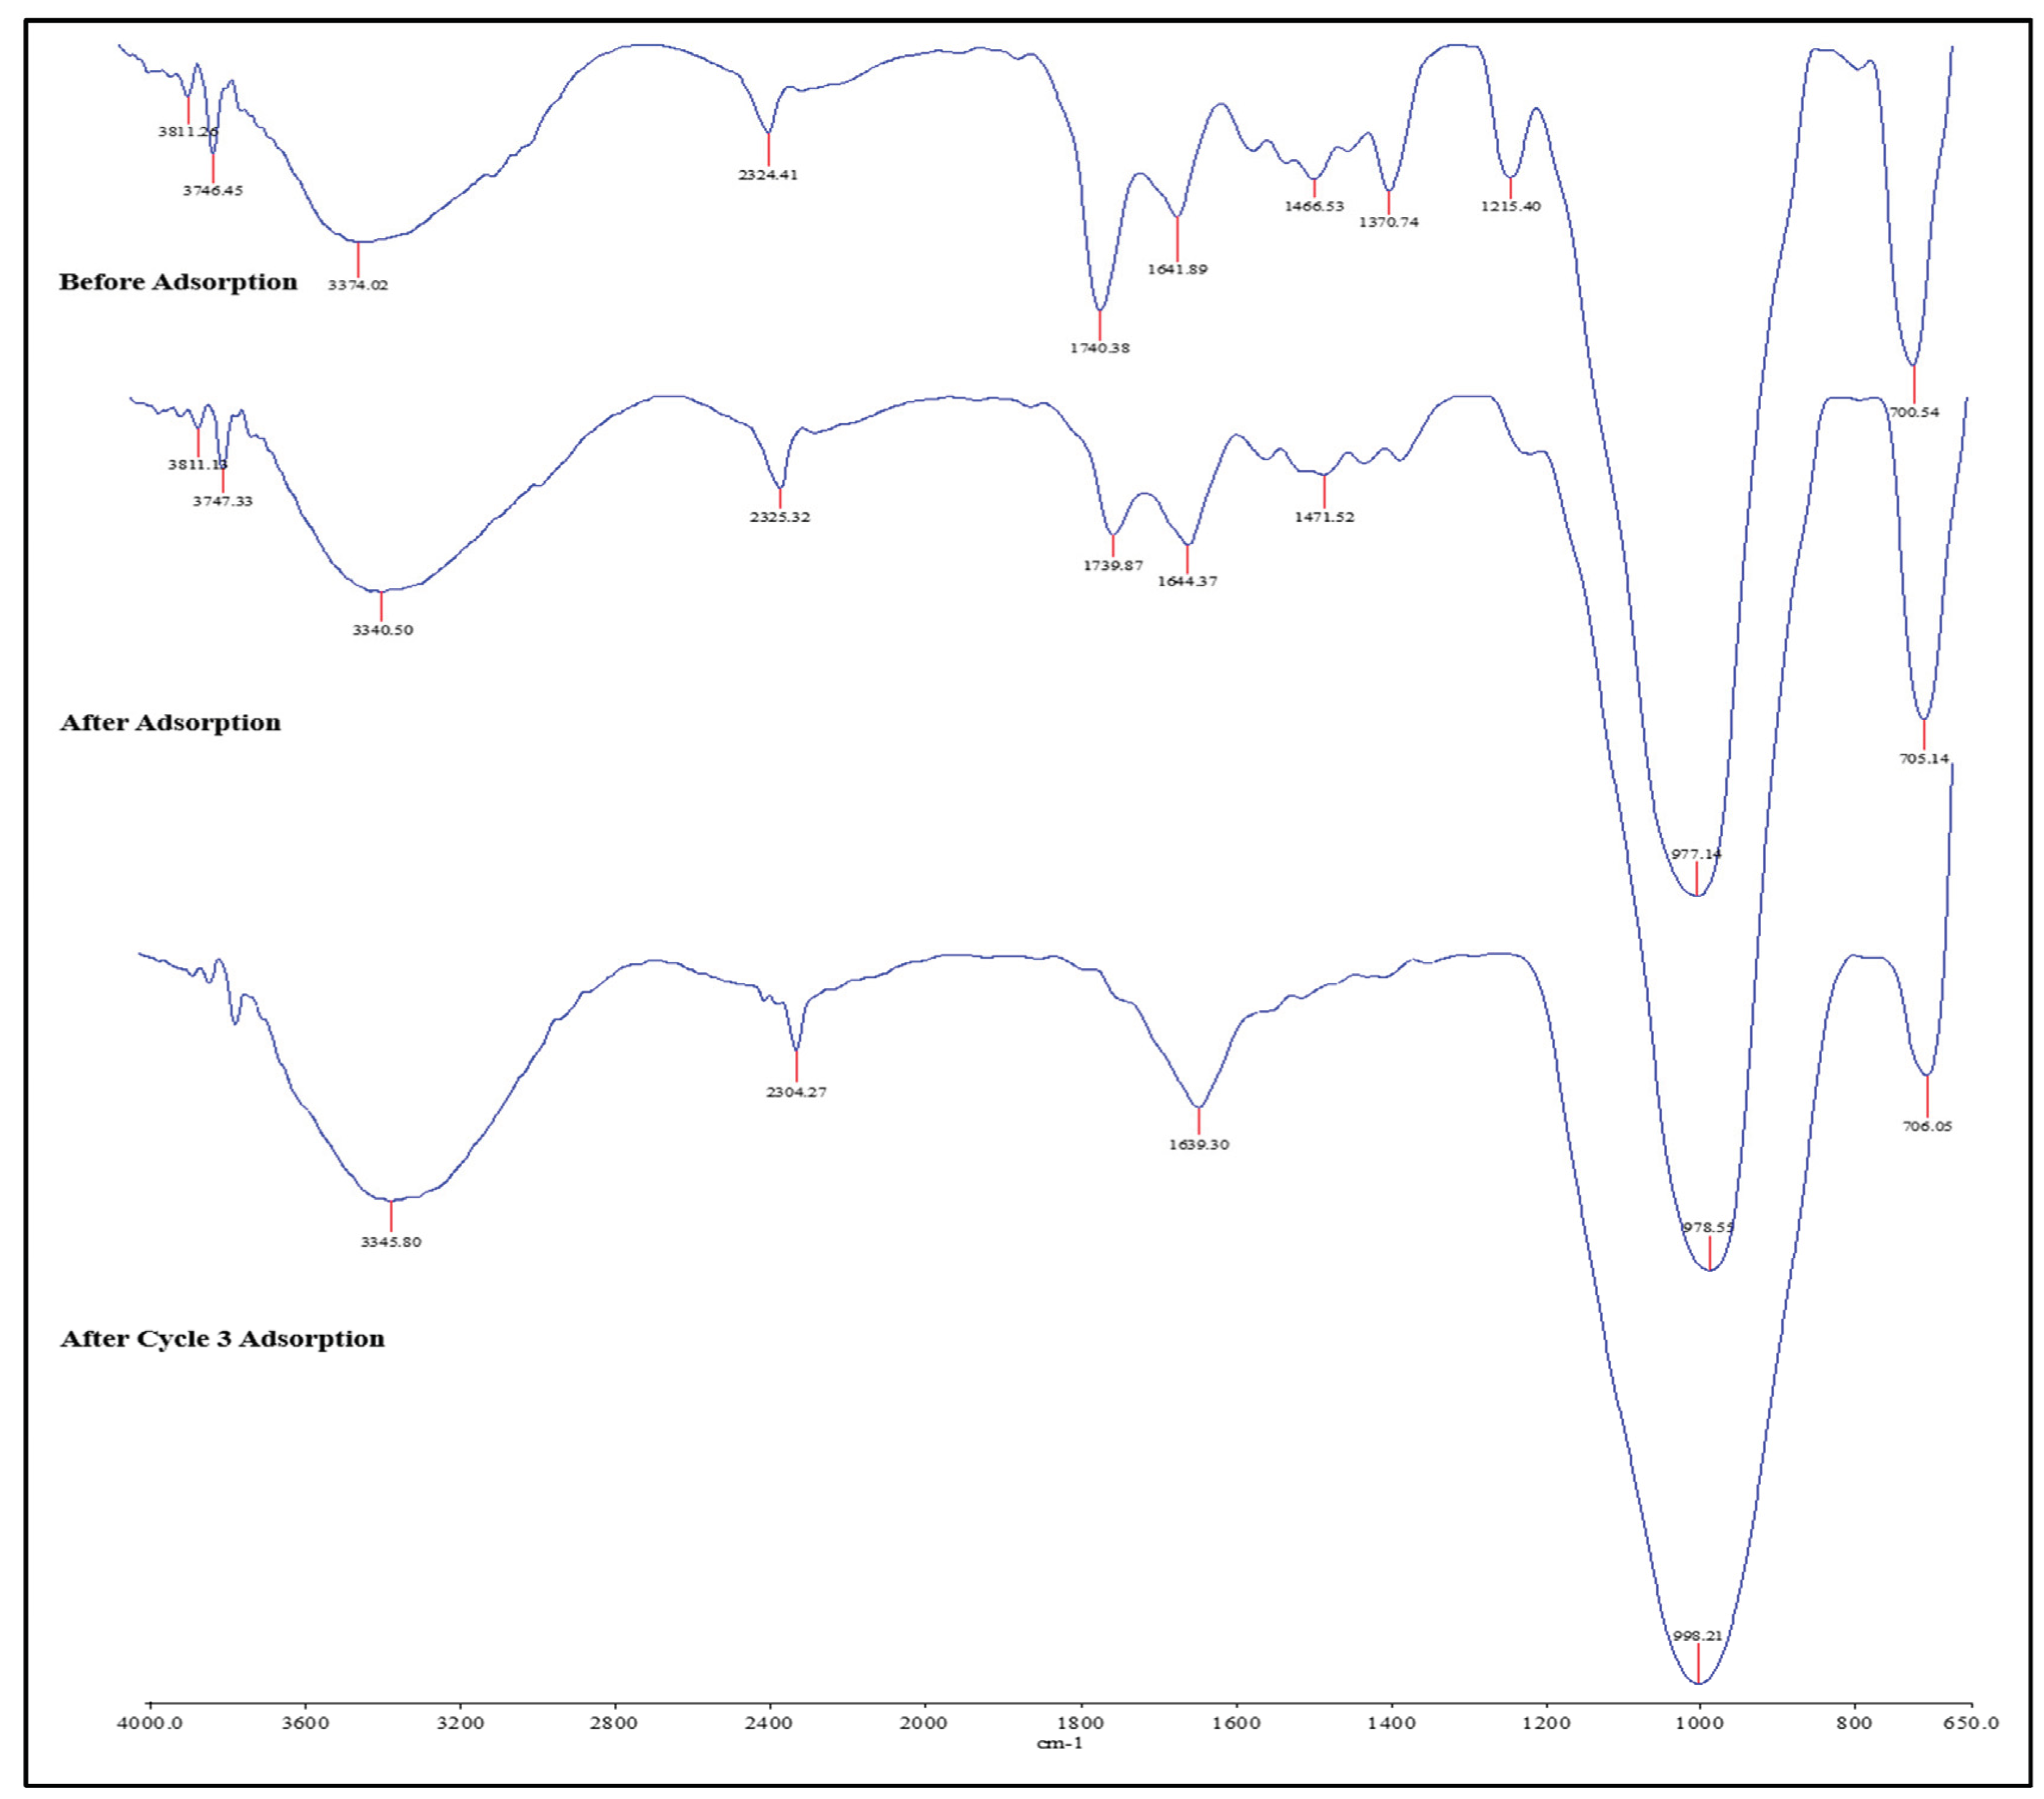
3.7.1. FTIR Analysis
3.7.2. BET Analysis
4. Conclusions
Supplementary Materials
Author Contributions
Funding
Data Availability Statement
Acknowledgments
Conflicts of Interest
References
- Seyrek, M.; Boran, F.; Okutan, M. Treatment of Automotive Paint Wastewater: Photocatalytic degradation of methylene blue using semi-conductive ZrO2. Int. J. Automot. Sci. Technol. 2023, 7, 316–324. [Google Scholar]
- Sultana, B. Degradation of Dyes Used in Textile Industries by Bacteria Isolated from Local Textile Effluents. Doctoral Dissertation, BRAC University, Dhaka, Bangladesh, 2017. [Google Scholar]
- Affat, S.S. Classifications, Advantages, Disadvantages, Toxicity Effects of Natural and Synthetic Dyes: A review. UTJ Sci. 2021, 8, 130–135. [Google Scholar]
- Ouedrhiri, A.; Lghazi, Y.; Bahar, J.; Himi, M.A.; El Haimer, C.; Youbi, B.; Khoukhi, M.; Bimaghra, I. Adsorption of the Methylene Blue Dye in Environmental Water Samples by Biochar Obtained from the Valorization of Argan Shells. Phys. Chem. Res. 2022, 10, 301–313. [Google Scholar]
- Varsha, M.; Senthil Kumar, P.; Senthil Rathi, B. A review on recent trends in the removal of emerging contaminants from aquatic environment using low-cost adsorbents. Chemosphere 2022, 287, 132270. [Google Scholar] [CrossRef] [PubMed]
- Hamad, H.N.; Idrus, S. Recent Developments in the Application of Bio-Waste-Derived Adsorbents for the Removal of Methylene Blue from Wastewater: A Review. Polymers 2022, 14, 783. [Google Scholar] [CrossRef]
- Abegunde, S.M.; Idowu, K.S.; Adejuwon, O.M.; Adeyemi-Adejolu, T. A review on the influence of chemical modification on the performance of adsorbents. Resour. Environ. Sustain. 2020, 1, 100001. [Google Scholar] [CrossRef]
- Anastopoulos, I.; Bhatnagar, A.; Hameed, B.H.; Ok, Y.S.; Omirou, M. A review on waste-derived adsorbents from sugar industry for pollutant removal in water and wastewater. J. Mol. Liq. 2017, 240, 179–188. [Google Scholar] [CrossRef]
- Mohammed, M.A.; Shitu, A.; Ibrahim, A. Removal of Methylene Blue Using Low Cost Adsorbent: A Review. Res. J. Chem. Sci. ISSN 2014, 2231, 606X. [Google Scholar]
- Shahrokhi-Shahraki, R.; Benally, C.; El-Din, M.G.; Park, J. High efficiency removal of heavy metals using tire-derived activated carbon vs commercial activated carbon: Insights into the adsorption mechanisms. Chemosphere 2021, 264, 128455. [Google Scholar] [CrossRef]
- Amin, M.T.; Alazba, A.A.; Shafiq, M. Adsorptive removal of reactive black 5 from wastewater using bentonite clay: Isotherms, kinetics and thermodynamics. Sustainability 2015, 7, 15302–15318. [Google Scholar] [CrossRef]
- Segun Esan, O. The Removal of Single and Binary Basic Dyes from Synthetic Wastewater Using Bentonite Clay Adsorbent. Am. J. Polym. Sci. Technol. 2019, 5, 16. [Google Scholar] [CrossRef]
- Rouhani, H.; Farhadi, F.; Akbari Kenari, M.; Eskandari, E.; Ramakrishna, S. Selection of suitable bentonite and the influence of various acids on the preparation of a special clay for the removal of trace olefins from aromatics. Clay Miner. 2021, 56, 185–196. [Google Scholar] [CrossRef]
- Wan, D.; Li, W.; Wang, G.; Chen, K.; Lu, L.; Hu, Q. Adsorption and heterogeneous degradation of rhodamine B on the surface of magnetic bentonite material. Appl. Surf. Sci. 2015, 349, 988–996. [Google Scholar] [CrossRef]
- Faridah, M.M.; Wan Ibrahim, W.A.; Nodeh, H.R.; Sutirman, Z.A.; Ting, N.N.; Sanagi, M.M. Recent advances in the preparation of oil palm waste-based adsorbents for removal of environmental pollutants—A review. Malays. J. Anal. Sci. 2018, 22, 175–184. [Google Scholar] [CrossRef]
- Tebeje, A.; Worku, Z.; Nkambule, T.T.I.; Fito, J. Adsorption of chemical oxygen demand from textile industrial wastewater through locally prepared bentonite adsorbent. Int. J. Environ. Sci. Technol. 2022, 19, 1893–1906. [Google Scholar] [CrossRef]
- Gandhi, D.; Bandyopadhyay, R.; Soni, B. Naturally occurring bentonite clay: Structural augmentation, characterization and application as catalyst. Mater. Today Proc. 2022, 57, 194–201. [Google Scholar] [CrossRef]
- Noyan, H.; Önal, M.; Sarikaya, Y. The effect of sulphuric acid activation on the crystallinity, surface area, porosity, surface acidity, and bleaching power of a bentonite. Food Chem. 2007, 105, 156–163. [Google Scholar] [CrossRef]
- Önal, M.; Sarikaya, Y. Preparation and characterization of acid-activated bentonite powders. Powder Technol. 2007, 172, 14–18. [Google Scholar] [CrossRef]
- Yener, N.; Bier, C.; Önal, M.; Sarikaya, Y. Simultaneous determination of cation exchange capacity and surface area of acid activated bentonite powders by methylene blue sorption. Appl. Surf. Sci. 2012, 258, 2534–2539. [Google Scholar] [CrossRef]
- Info, A. Effect of Activation Factors on Adsorption of Methylene Blue by Modified Bentonite. Prog. Color Colorants Coat. 2013, 6, 97–108. [Google Scholar]
- Amran, F.; Zaini, M.A.A. Sodium hydroxide-activated Casuarina empty fruit: Isotherm, kinetics and thermodynamics of methylene blue and congo red adsorption. Environ. Technol. Innov. 2021, 23, 101727. [Google Scholar] [CrossRef]
- Jais, F.M.; Chee, C.Y.; Ismail, Z.; Ibrahim, S. Experimental design via NaOH activation process and statistical analysis for activated sugarcane bagasse hydrochar for removal of dye and antibiotic. J. Environ. Chem. Eng. 2021, 9, 104829. [Google Scholar] [CrossRef]
- Kumar, A.; Lingfa, P. Base-Activated Sodium Bentonite Clay: Mutated Characteristics and Industrial Slant. ECS Trans. 2022, 107, 2303. [Google Scholar] [CrossRef]
- Ibrahim, A.S.; Al-Bidry, M.A. Activation Iraqi bentonite for using as drilling mud. IOP Conf. Ser. Mater. Sci. Eng. 2019, 579, 012006. [Google Scholar] [CrossRef]
- Nasuha, N.; Hameed, B.H. Adsorption of methylene blue from aqueous solution onto NaOH-modified rejected tea. Chem. Eng. J. 2011, 166, 783–786. [Google Scholar] [CrossRef]
- Cazetta, A.L.; Vargas, A.M.M.; Nogami, E.M.; Kunita, M.H.; Guilherme, M.R.; Martins, A.C.; Silva, T.L.; Moraes, J.C.G.; Almeida, V.C. NaOH-activated carbon of high surface area produced from coconut shell: Kinetics and equilibrium studies from the methylene blue adsorption. Chem. Eng. J. 2011, 174, 117–125. [Google Scholar] [CrossRef]
- Tabassum, M.; Bardhan, M.; Novera, T.M.; Islam, M.A.; Hadi Jawad, A.; Islam, M.A. NaOH-Activated Betel Nut Husk Hydrochar for Efficient Adsorption of Methylene Blue Dye. Water Air Soil Pollut. 2020, 231, 398. [Google Scholar] [CrossRef]
- Wang, W.; Liu, Y.Y.; Chen, X.F.; Song, S.X. Facile Synthesis of NaOH-modified Fishbone Charcoal (FBC) with Remarkable Adsorption towards Methylene Blue. Procedia Eng. 2018, 211, 495–505. [Google Scholar] [CrossRef]
- Amari, A.; Chlendi, M.; Gannouni, A.; Bellagi, A. Optimised activation of bentonite for toluene adsorption. Appl. Clay Sci. 2010, 47, 457–461. [Google Scholar] [CrossRef]
- Elfadly, A.M.; Zeid, I.F.; Yehia, F.Z.; Abouelela, M.M.; Rabie, A.M. Production of aromatic hydrocarbons from catalytic pyrolysis of lignin over acid-activated bentonite clay. Fuel Process. Technol. 2017, 163, 1–7. [Google Scholar] [CrossRef]
- Wang, J.; Guo, X. Adsorption isotherm models: Classification, physical meaning, application and solving method. Chemosphere 2020, 258, 127279. [Google Scholar] [CrossRef]
- Hashem, A.; Mim, S.; Payel, S.; Rahman, S.; Mizan, A.; Basaran, B.; Nail, A.; Sarker, M.I. Bioresource Technology Reports Thermally activated adsorbent over chemically modified Carica papaya tree adsorbents for removal of chromium from tannery wastewater. Bioresour. Technol. Rep. 2024, 25, 101692. [Google Scholar] [CrossRef]
- Shi, Q.; Wang, W.; Zhang, H.; Bai, H.; Liu, K.; Zhang, J.; Li, Z.; Zhu, W. Porous biochar derived from walnut shell as an efficient adsorbent for tetracycline removal. Bioresour. Technol. 2023, 383, 129213. [Google Scholar] [CrossRef]
- Ezzati, R. Derivation of Pseudo-First-Order, Pseudo-Second-Order and Modified Pseudo-First-Order rate equations from Langmuir and Freundlich isotherms for adsorption. Chem. Eng. J. 2020, 392, 123705. [Google Scholar] [CrossRef]
- Ichou, A.A.; Benhiti, R.; Abali, M.; Dabagh, A.; Chiban, M.; Zerbet, M.; Carja, G.; Sinan, F. Adsorption of pb(Ii) from aqueous solutions onto mgfeal-co3 ldh: Thermodynamic and kinetic studies. Desalin. Water Treat. 2020, 178, 193–202. [Google Scholar] [CrossRef]
- Elnaggar, K.; Farouk, S.; Abdelrazek, A.; Abdelsamie, A.; Ghallab, A.; Mohamed, B.; Elsayed, K.; Ramadan, Y. Optimization, and Characterization of Acid-Activated Bentonite. Int. J. Ind. Sustain. Dev. 2022, 3, 66–75. [Google Scholar] [CrossRef]
- Sarikaya, Y. The Effect of Thermal Treatment on Some of the Physicochemical Properties of a Bentonite. Clays Clay Miner. 2000, 48, 557–562. [Google Scholar] [CrossRef]
- Hebbar, R.S.; Isloor, A.M.; Prabhu, B.; Inamuddin; Asiri, A.M.; Ismail, A.F. Removal of metal ions and humic acids through polyetherimide membrane with grafted bentonite clay. Sci. Rep. 2018, 8, 4665. [Google Scholar] [CrossRef]
- Gumede, S.; Musonge, P. Characterisation of Mg-Al Hydrotalcite and Surfactant-Modified Bentonite Nano Clays for the Treatment of Acid Mine Drainage. Sustainability 2022, 14, 9501. [Google Scholar] [CrossRef]
- Hamah Sor, N.; Mermerdas, K.; Alzeebaree, R.; Ekmen, Ş.; Mulapeer, E.S. Microstructural and Hardened Characteristics of Sustainable High-Performance Alkali-Activated Mortar with Binary Blends of GGBFS and Earth Materials. 2023. Available online: https://papers.ssrn.com/sol3/papers.cfm?abstract_id=4570559 (accessed on 23 February 2024).
- Slaný, M.; Kuzielová, E.; Žemlička, M.; Matejdes, M.; Struhárová, A.; Palou, M.T. Metabentonite and metakaolin-based geopolymers/zeolites: Relation between kind of clay, calcination temperature and concentration of alkaline activator. J. Therm. Anal. Calorim. 2023, 148, 10531–10547. [Google Scholar] [CrossRef]
- Boudia, R.A.; Bendeddouche, C.K.; Mazari, M.M.; Ech-Chergui, A.N.; Zoukel, A.; Adjdir, M. Zeolite GIS polymorphs derived from clay fraction> 2 µm: The ability of clay fraction> 2 µm for crystallization of high-purity Na-P1 zeolite. Silicon 2023, 15, 5263–5270. [Google Scholar] [CrossRef]
- Kelechukwu, C.; Akaranta, O. Removal of Colorants Using Locally Activated Bentonite Clay: A Review. IOSR J. 2021, 15, 127574. [Google Scholar]
- Ravindra Reddy, T.; Kaneko, S.; Endo, T.; Lakshmi Reddy, S. Spectroscopic Characterization of Bentonite. J. Lasers Opt. Photonics 2017, 4, 3. [Google Scholar] [CrossRef]
- Tabak, A.; Yilmaz, N.; Eren, E.; Caglar, B.; Afsin, B.; Sarihan, A. Structural analysis of naproxen-intercalated bentonite (Unye). Chem. Eng. J. 2011, 174, 281–288. [Google Scholar] [CrossRef]
- Verma, A.; Riaz, U. Sonolytically intercalated poly(anisidine-co-toluidine)/bentonite nanocomposites: pH responsive drug release characteristics. J. Drug Deliv. Sci. Technol. 2018, 48, 49–58. [Google Scholar] [CrossRef]
- Hu, Y.; Guo, T.; Ye, X.; Li, Q.; Guo, M.; Liu, H.; Wu, Z. Dye adsorption by resins: Effect of ionic strength on hydrophobic and electrostatic interactions. Chem. Eng. J. 2013, 228, 392–397. [Google Scholar] [CrossRef]
- Zarroug, S.; Ben Mahmoud, S.; Hamzaoui, A.H.; Essafi, W. Study of the interaction between methylene blue dye and quenched polyelectrolyte with tunable hydrophobicity in aqueous media. J. Environ. Chem. Eng. 2019, 7, 103312. [Google Scholar] [CrossRef]
- Durowaye, S.I.; Sekunowo, O.I.; Lawal, A.I.; Ojo, O.E. Development and characterisation of iron millscale particle reinforced ceramic matrix composite. J. Taibah Univ. Sci. 2017, 11, 634–644. [Google Scholar] [CrossRef]
- Bumanis, G.; Vaičiukynienė, D. Alkali Activation of Milled Red Brick Waste and Calcined Illite Clay with Silica Gel Addition. Materials 2022, 15, 3195. [Google Scholar] [CrossRef]
- Vezentsev, A.I.; Volovicheva, N.A.; Korol’kova, S.V.; Sokolovskiy, P.V. Effect of the Acidic and Alkaline Activation of Bentonite-Like Clays on Sorption Properties in Relation to Fe3+ Ions under Static Conditions. Russ. J. Phys. Chem. A 2022, 96, 381–386. [Google Scholar] [CrossRef]
- Khalifa, A.Z.; Cizer, Ö.; Pontikes, Y.; Heath, A.; Patureau, P.; Bernal, S.A.; Marsh, A.T.M. Advances in alkali-activation of clay minerals. Cem. Concr. Res. 2020, 132, 106050. [Google Scholar] [CrossRef]
- Bhuyan, M.M.; Dafader, N.C.; Hara, K.; Okabe, H.; Hidaka, Y.; Rahman, M.M.; Khan, M.M.R.; Rahman, N. Synthesis of Potato Starch-Acrylic-Acid Hydrogels by Gamma Radiation and Their Application in Dye Adsorption. Int. J. Polym. Sci. 2016, 2016, 9867859. [Google Scholar] [CrossRef]
- Khairnar, S.D.; Shrivastava, V.S. Photocatalytic degradation of chlorpyrifos and methylene blue using α-Bi2O3 nanoparticles fabricated by sol–gel method. SN Appl. Sci. 2019, 1, 762. [Google Scholar] [CrossRef]
- Khosa, M.A.; Shah, S.S.; Nazar, M.F. Application of micellar enhanced ultrafiltration for the removal of methylene blue from aqueous solution. J. Dispers. Sci. Technol. 2011, 32, 260–264. [Google Scholar] [CrossRef]
- Aljar, M.A.A.; Rashdan, S.; El-fattah, A.A. Environmentally Friendly Polyvinyl Alcohol—Alginate/Bentonite Semi-Interpenetrating Polymer Network Nanocomposite Hydrogel Beads as an Efficient Adsorbent for the Removal of Methylene Blue from Aqueous Solution. Polymers 2021, 13, 4000. [Google Scholar] [CrossRef]
- Abd El-Latif, M.M.; El-Kady, M.F.; Ibrahim, A.M.; Ossman, M. Alginate/Polyvinyl Alcohol -Kaolin Composite for Removal of Methylene Blue from Aqueous Solution in a Batch Stirred Tank Reactor. J. Am. Sci. 2010, 6, 280–292. [Google Scholar]
- Al-asheh, S.; Banat, F. The Removal of Methylene Blue Dye from Aqueous Solutions Using Activated and Non-activated Bentonites. Adsorpt. Sci. Technol. 2003, 21, 451–462. [Google Scholar] [CrossRef]
- El Miz, M.; Akichouh, H.; Salhi, S.; El Bachiri, A.; Tahani, A. Adsorption-desorption and kinetics studies of Methylene Blue Dye on Na-bentonite from Aqueous Solution. IOSR J. Appl. Chem. 2014, 7, 60–78. [Google Scholar] [CrossRef]
- Ibrahim, S.; Ali, Z.T.A. Using of modified-bentonite as low-cost sorbent for removal of methylene blue dye from aqueous solution. Assoc. Arab. Univ. J. Eng. Sci. 2020, 27, 45–54. [Google Scholar] [CrossRef]
- Ravi; Pandey, L.M. Enhanced adsorption capacity of designed bentonite and alginate beads for the effective removal of methylene blue. Appl. Clay Sci. 2019, 169, 102–111. [Google Scholar] [CrossRef]
- Duwal, N. Investigation on the Selective Adsorption of Methylene Blue onto Clay Minerals of Kamerotarof Bhaktapur, Nepal. Master’s Thesis, Tribhuvan University, Kathmandu, Nepal, 2013. [Google Scholar] [CrossRef]
- Eleraky, M.I.; Abd, T.A.M.; Razek, E.; Elbasier, A.M.A. Removal of Methylene Blue Dye by Activated Egyptian Bentonite Clay. J. Environ. Sci. 2022, 51, 1–29. [Google Scholar] [CrossRef]
- Taher, T.; Rohendi, D.; Mohadi, R.; Lesbani, A. Thermal and Acid Activation (TAA) of Bentonite as Adsorbent for Removal of Methylene Blue: A Kinetics and Thermodynamic Study. Chiang Mai J. Sci. 2018, 45, 1770–1781. [Google Scholar]
- Benhouria, A.; Islam, A.; Boutahala, M.; Hameed, B.H. Calcium alginate–bentonite–activated carbon composite beads as highly effective adsorbent for methylene blue. Chem. Eng. J. 2015, 270, 621–630. [Google Scholar] [CrossRef]
- Amrhar, O.; Nassali, H.; Elyoubi, M.S. Adsorption of a cationic dye, Methylene Blue, onto Moroccan Illitic Clay. J. Mater. Environ. Sci. 2015, 6, 3054–3065. [Google Scholar]
- Chang, J.; Ma, J.; Ma, Q.; Zhang, D.; Qiao, N.; Hu, M.; Ma, H. Adsorption of methylene blue onto Fe3O4/activated montmorillonite nanocomposite. Appl. Clay Sci. 2016, 119, 132–140. [Google Scholar] [CrossRef]
- Saratale, R.G.; Sun, Q.; Munagapati, V.S.; Saratale, G.D.; Park, J.; Kim, D.S. The use of eggshell membrane for the treatment of dye-containing wastewater: Batch, kinetics and reusability studies. Chemosphere 2021, 281, 130777. [Google Scholar] [CrossRef] [PubMed]
- Sandollah, N.A.S.M.; Ghazali, S.A.I.S.M.; Wan Ibrahim, W.N.; Rusmin, R. Adsorption-desorption profile of methylene blue dye on raw and acid activated kaolinite. Indones. J. Chem. 2020, 20, 755–765. [Google Scholar] [CrossRef]
- Auta, M.; Hameed, B.H. Modified mesoporous clay adsorbent for adsorption isotherm and kinetics of methylene blue. Chem. Eng. J. 2012, 198–199, 219–227. [Google Scholar] [CrossRef]
- Banat, F.; Al-asheh, S.; Al-makhadmeh, L. Evaluation of the use of raw and acti v ated date pits as potential adsorbents for dye containing waters. Process. Biochem. 2003, 39, 193–202. [Google Scholar] [CrossRef]
- De Castro, M.L.F.A.; Abad, M.L.B.; Sumalinog, D.A.G.; Abarca, R.R.M.; Paoprasert, P.; de Luna, M.D.G. Adsorption of Methylene Blue dye and Cu(II) ions on EDTA-modified bentonite: Isotherm, kinetic and thermodynamic studies. Sustain. Environ. Res. 2018, 28, 197–205. [Google Scholar] [CrossRef]
- Azha, S.F.; Woon, L.K.; Ismail, S. Regeneration Feasibility of Bentonite by Sodium Persulfate. Trends J. Sci. Res. 2021, 1, 1–10. [Google Scholar] [CrossRef]
- Taylor, P.; Unuabonah, E.I.; Adedapo, A.O.; Nnamdi, C.O.; Adewuyi, A.; Omorogie, M.O.; Adebowale, K.O.; Olu-owolabi, B.I.; Augustine, E.; Taubert, A. Desalination and Water Treatment Successful scale-up performance of a novel papaya-clay combo adsorbent: Up-flow adsorption of a basic dye. Desalination Water Treat. 2014, 56, 536–551. [Google Scholar] [CrossRef]
- Shahadat, M. RSC Advances Regeneration performance of clay-based adsorbents for the removal of industrial dyes. RSC Adv. 2018, 8, 24571–24587. [Google Scholar] [CrossRef]
- Sagita, C.P.; Nulandaya, L.; Kurniawan, Y.S. Efficient and Low-Cost Removal of Methylene Blue using Activated Natural Kaolinite Material. J. Multidiscip. Appl. Nat. Sci. 2021, 1, 69–77. [Google Scholar] [CrossRef]
- Juzsakova, T.; Salman, A.D.; Abdullah, T.A.; Rasheed, R.T.; Zsirka, B.; Al-Shaikhly, R.R.; Sluser, B.; Cretescu, I. Removal of Methylene Blue from Aqueous Solution by Mixture of Reused Silica Gel Desiccant and Natural Sand or Eggshell Waste. Materials 2023, 16, 1618. [Google Scholar] [CrossRef] [PubMed]
- Ghosh, D.; Bhattacharyya, K.G. Adsorption of methylene blue on kaolinite. Appl. Clay Sci. 2002, 20, 295–300. [Google Scholar] [CrossRef]
- Al-futaisi, A.; Jamrah, A.; Al-hanai, R. Aspects of cationic dye molecule adsorption to palygorskite. Desalination 2007, 214, 327–342. [Google Scholar] [CrossRef]
- Ngoh, Y.S.; Nawi, M.A. Role of bentonite adsorbent sub-layer in the photocatalytic-adsorptive removal of methylene blue by the immobilized TiO2/bentonite system. Int. J. Environ. Sci. Technol. 2016, 13, 907–926. [Google Scholar] [CrossRef]


| Compound | Raw BC % | BABC (16 M) % | AABC (7 M) % |
|---|---|---|---|
| SiO2 | 52.390 | 47.353 | 79.121 |
| Al2O3 | 18.690 | 31.294 | 11.920 |
| Na2O | 2.147 | 12.001 | 0.089 |
| MgO | 2.357 | 3.182 | 0.644 |
| MnO | 0.526 | 0.568 | 0.013 |
| ZnO | 0.080 | 0.095 | 0.014 |
| K2O | 0.278 | 0.183 | 0.121 |
| CaO | 0.968 | 1.732 | 0.342 |
| TiO2 | 1.291 | 1.471 | 2.245 |
| BC | BABC | AABC | |||||||
|---|---|---|---|---|---|---|---|---|---|
| Activation | Raw | 1 M | 4 M | 7 M | 10 M | 13 M | 16 M | 18 M | 7 M |
| Surface Area (m2/g) | 8.86 | 30.90 | 55.71 | 70.72 | 65.20 | 60.28 | 74.15 | 51.97 | 42.76 |
| Pore Volume (cm3/g) | 0.22 | 0.38 | 0.72 | 1.01 | 0.73 | 0.80 | 1.11 | 0.69 | 0.106 |
| Pore Size (Å) | 162.4 | 246.01 | 259.23 | 288.37 | 225.69 | 266.75 | 300.20 | 266.78 | 121.23 |
| Model | Parameter | MB |
|---|---|---|
| PFO | qe (mg/g) | 2.32 |
| K1 (L/min) | 0.00002 | |
| R2 | 0.9529 | |
| PSO | qe (mg/g) | 7.22 |
| K2 (g/mg min) | 0.003 | |
| R2 | 0.9892 |
| Model | Parameter | MB |
|---|---|---|
| Langmuir | Qm (mg/g) | 27.93 |
| KL (L/mg) | 0.002 | |
| R2 | 0.9582 | |
| Freundlich | KF (mg/g) × (L/mg) (1/n) | 9.74 |
| n | 1.79 | |
| R2 | 0.9814 | |
| Temkin | bT (J/mol) | 7.56 |
| A (L/g) | 3.99 | |
| R2 | 0.9638 | |
| Dubinin–Radushkevich | ε (KJ/mol) | 5000,000 |
| β (mol2/KJ2) | 2 × 10⁻⁷ | |
| q (mg/g) | 19.18 | |
| R2 | 0.8165 |
| Adsorbate | ΔH (KJ/mol) | ΔS (KJ/mol) | ΔG (KJ/mol) | |||||
|---|---|---|---|---|---|---|---|---|
| MB | 25 °C | 30 °C | 35 °C | 40 °C | 45 °C | 50 °C | ||
| −28.26 | −82.49 | −3.61 | −3.53 | −2.77 | −2.23 | −1.89 | −1.83 | |
| BABC | Surface Area (m2/g) | Pore Volume (cm3/g) | Pore Size (Å) |
|---|---|---|---|
| Before Adsorption | 74.14 | 1.11 | 300.20 |
| After Adsorption | 73.1430 | 0.668 | 182.726 |
| After Cycle 3 | 53.86 | 0.479 | 136.543 |
| Substance | BET (m2/g) | Vol (mL) | Agitation (rpm) | Time (min) | Ci (mg/L) | Temp (C) | pH | Dose (g) | Removal (%) | qe (mg/g) | Isotherm/ Kinetic | Cycle/ Removal % | Ref. |
|---|---|---|---|---|---|---|---|---|---|---|---|---|---|
| Bentonite clay (NaOH) | 74.15 | 100 | 135 | 270 | 200 | 25 | 7 | 0.9 | 99.59 | 22.131 | Freundlich/second | 3/70.8 | Current study |
| MBC (H2SO4/clay) | - | 200 | 140 | 24 h | 300 | 30 | 12 | 0.2 | - | 34.652 | Freundlich/second | - | [71] |
| Kaolinite (H2SO4) | 76.86 | 50 | 150 | 20 | 20 | - | - | 0.2 | - | 3.40 | Langmuir/Ho-McKay | - | [77] |
| Malaysian kaolinite (HCl) | - | 15 | 2500 | 60 | 20–70 | 25 | 6 | - | 96 | 1.35–1.37 | Freundlich/second | - | [70] |
| SG | 633 | 40 | - | 80 | 10 | 25 | 7 | 0.25 | 86 | 34.3 | Freundlich/second | - | [78] |
| SG-ES | 360 | 80 | 32.0 | ||||||||||
| SG-SI | 330 | 57 | 22.8 | ||||||||||
| clay composite/TiO2 | - | 50 | 150 | 300 | 200 | 30 | 8 | 1.5 | 95 | 6.3 | Langmuir/second | 6/90 | [57] |
| Pure Kaolin (NaOH) | - | 100 | - | 3hrs | 12 | 27 | 10 | 0.8 | 100 | 20.49 | Freundlich | - | [79] |
| Palygorskite clay (NH4Cl) | 92 | 40 | 3000 | 60 | 60 | 25 | 9 | 0.3 | 99.5 | 5 ppm/40 mg/g–20 ppm/51 mg/g | Langmuir/second | - | [80] |
| 100 | 0.3 | 78 | |||||||||||
| 100 | 0.5 | 89 | |||||||||||
| Bentonite (TiO2) | - | 25 | - | 45 | 10 | 25 | 7 | 0.15 | 100 | 1.67 | Langmuir/second | 10 ppm/10 | [81] |
| 60 | 60 | 90 | 7 | ||||||||||
| 80 | 60 | 100 | 10 | ||||||||||
| Kaolin Composite | - | 800 | 750 | 360 | 20 | 22 | 9 | 8 | 90 | - | Freundlich/first | - | [58] |
Disclaimer/Publisher’s Note: The statements, opinions and data contained in all publications are solely those of the individual author(s) and contributor(s) and not of MDPI and/or the editor(s). MDPI and/or the editor(s) disclaim responsibility for any injury to people or property resulting from any ideas, methods, instructions or products referred to in the content. |
© 2024 by the authors. Licensee MDPI, Basel, Switzerland. This article is an open access article distributed under the terms and conditions of the Creative Commons Attribution (CC BY) license (https://creativecommons.org/licenses/by/4.0/).
Share and Cite
Hamad, H.N.; Idrus, S.; Yusuf, B.; Jamali, N.S.; Ahsan, A.; Suhartini, S.; Wahab, A.M.A. Optimized Bentonite Clay Adsorbents for Methylene Blue Removal. Processes 2024, 12, 738. https://doi.org/10.3390/pr12040738
Hamad HN, Idrus S, Yusuf B, Jamali NS, Ahsan A, Suhartini S, Wahab AMA. Optimized Bentonite Clay Adsorbents for Methylene Blue Removal. Processes. 2024; 12(4):738. https://doi.org/10.3390/pr12040738
Chicago/Turabian StyleHamad, Hamad Noori, Syazwani Idrus, Badronnisa Yusuf, Nur Syakina Jamali, Amimul Ahsan, Sri Suhartini, and Abdul Malek Abdul Wahab. 2024. "Optimized Bentonite Clay Adsorbents for Methylene Blue Removal" Processes 12, no. 4: 738. https://doi.org/10.3390/pr12040738
APA StyleHamad, H. N., Idrus, S., Yusuf, B., Jamali, N. S., Ahsan, A., Suhartini, S., & Wahab, A. M. A. (2024). Optimized Bentonite Clay Adsorbents for Methylene Blue Removal. Processes, 12(4), 738. https://doi.org/10.3390/pr12040738