Article

Experimental and Numerical Simulation Study on the Mechanism of Fracture-Increasing and Permeability-Increasing in Granite Pore Walls by the Air DTH Hammer Percussion Drilling

1
School of Engineering and Technology, China University of Geosciences (Beijing), Beijing 100083, China
2
School of Petrochemical Engineering and Environment, Zhejiang Ocean University, Zhoushan 316022, China
*
Author to whom correspondence should be addressed.
Processes 2024, 12(4), 758; https://doi.org/10.3390/pr12040758
Submission received: 12 March 2024 / Revised: 29 March 2024 / Accepted: 4 April 2024 / Published: 9 April 2024
(This article belongs to the Section Materials Processes)

Abstract

:
Air DTH (Down-The-Hole) hammer percussion drilling (vibration percussion drilling) has proven to be a highly efficient geothermal drilling technique, and percussion fractures near the wellbore benefit geothermal energy development in many ways (such as hydraulic fracturing, perforation, etc.). However, no research has been done on the mechanism of fracture-increasing and permeation-increasing in granite pore walls by air DTH hammer percussion drilling. This article: (1) using an air drilling test device, an air DTH hammer whole bit impact rock fragmentation test was conducted on granite in an atmospheric environment; (2) dyeing experiments, CT scanning, and 3D reconstruction modeling were used to characterize and identify wellbore cracks; (3) research the strength, porosity, and permeability changes of granite wellbore through mechanical and permeability testing experiments; and (4) numerical simulation of impact stress waves using particle flow code (PFC) 6.0 software to demonstrate the rationality of impact experimental results. The results show that the air DTH hammer impact can induce micro-cracks in the wellbore, and the distribution of cracks is regionalized, mainly due to the attenuation of the impact stress wave. The numerical results are consistent with the experimental results. The average strength of granite decreased by 16.5%, the average porosity increased by 9.5%, the average permeability increased by 63.3%, the porosity increased from 0.0025% to 0.03%, and the porosity increased by about 12 times under the air DTH Hammer percussion drilling. The above results provide the theoretical basis and experimental proof for the ability of air DTH hammer drilling to produce wellbore cracks and improve wellbore permeability. The presented experimental results can be a useful reference for building numerical models.

1. Introduction

Geothermal energy has been developed rapidly due to its attractive advantages of cleanness, renewability, and environmental friendliness [1,2]. Hot Dry Rock (HDR) is a typical type of deep geothermal energy, referring to intact rock with extremely low permeability within a depth of more than 3 km and a temperature range of 150 to 650 °C [3]. To provide technical support for the development and utilization of geothermal energy, especially the use of enhanced geothermal system (EGS) technology to develop dry, hot rocks with huge reserves [4,5], of which drilling and thermal storage transformation are two core technologies [6], which are crucial to leveraging the advantages of geothermal energy resources.
Both drilling and thermal storage renovations involve fractures. For geothermal resources, thermal storage fractures are first and foremost one of the indicators of geothermal resources: (1) the development of conventional hydrothermal thermal storage fractures indicates high productivity; and (2) the development process of the EGS (enhanced geothermal system) indicates that the formation and connectivity of the thermal storage fracture network represent the successful transformation of the thermal storage. The recent rise of medium- to deep-undisturbed single-well heat transfer technology also requires the addition of circumferential cracks to improve heat transfer efficiency [7]. In addition, the presence of cracks in the rock of the thermal storage wellbore can reduce the rock fracture pressure, providing more “guide fractures” for hydraulic fracturing in subsequent thermal storage renovations and helping to form complex fracture networks during rock initiation [8,9,10].
However, thermal storage fractures are also a technical bottleneck for geothermal drilling and thermal storage transformation [11]. On the one hand, thermal storage rock fractures pose a considerable challenge to drilling. When encountering fractures, drilling fluid leakage causes expensive waste of drilling fluid materials, increases the cost of plugging materials and non-drilling time for dealing with leakage, and even leads to drilling accidents such as sticking and wellbore instability [12,13]. The leakage of drilling fluid into the thermal storage can cause chemical reactions such as corrosion and precipitation with the rock on the surface of the fracture, which can change the structure of the fracture. The rock debris that cannot be returned with the drilling fluid entering the fracture can also cause sealing, damaging thermal storage, reducing production capacity, and even scrapping [14,15]. On the other hand, for relatively dense granite in enhanced geothermal systems, it is easy to form a single fracture and difficult to fracture into a network due to its high strength and fracture pressure. Therefore, carrying out hydraulic fracturing and thermal storage transformation is challenging and even induces earthquakes [16,17]. More than 60 EGS projects worldwide over the past half century have yet to be commercially successful, which has proven this bottleneck problem. Therefore, seeking technical methods to reduce hydraulic fracturing construction pump pressure has become a common goal of scientists and engineers engaged in EGS development, one of which is to use cracks in thermal storage rocks to reduce the initiation pressure.
To overcome the problems of hydraulic fracturing, domestic and foreign experts and scholars have begun to seek alternative technologies such as flexible fracturing, temperature-difference fracturing, and chemical fracturing [18,19,20].
In recent years, there have been many research projects using drilling technology to assist in thermal storage transformation, such as hydraulic jet drilling [21,22,23], lateral branch drilling [24,25], DTH hammer percussion drilling [26,27], and high-frequency hydraulic percussion drilling systems [28].
Air DTH hammer drilling (vibratory percussion drilling) has proven to be an efficient geothermal drilling technique (see Figure 1 for its flow chart). On the one hand, the vibration-impact rock breaking method is suitable for hard and brittle formation, and the use of air foam drilling fluid to achieve unbalanced drilling, slowing down the “cuttings holding” effect, can significantly increase the mechanical drilling rate (2–10 times). Moreover, lower wellbore pressures can prevent losses, reduce downhole accidents, and reduce formation damage. Therefore, it is very suitable for geothermal drilling [29,30]. In order to gain a deeper understanding of the impact of the drilling process, many researchers have conducted several laboratory experiments and numerical studies. Franca [31] conducted percussion drilling tests on sandstone and limestone under atmospheric pressure and proposed a complete model to evaluate the response mechanism of impact rotary drilling. Shadrina et al. [32] studied the failure of granite under unconfined stress conditions. Fourmeau et al. [33] conducted an experimental study of granite crushing by a seven-tooth drill under an impact load. Saksala et al. [34] used a three-ball tooth drill to conduct dynamic crushing tests on granite at different impact speeds and found the critical impact velocity of rock crushing and stripping caused by lateral crack penetration. Jiang et al. [35] developed an indenter impact rock breaking test bed to obtain the rock breakage volume, depth, and area under different impact conditions, and a numerical simulation was used to investigate the rock breakage process. The effect of indenter shape, impact energy, and impact velocity on rock breakage performance was investigated. Li et al. [36,37,38,39] studied deep granite’s damage characteristics and crushing mechanism under impact load using research methods such as laboratory tests, theoretical analysis, and numerical simulation. They found the wall cracks generated by percussion drilling.
It can be seen from the above literature that predecessors have done a lot of research work on percussion drilling. However, no research has been done on the mechanism of fracture-increasing and permeation-increasing in granite pore walls by air DTH hammer percussion drilling. In order to break through the bottleneck of EGS development and overcome the challenge of thermal storage renovation, based on the concept of protecting fractured thermal storage and providing wellbore fractures for thermal storage renovation, this article proposes to protect the original fractures during the drilling process by developing thermal storage with fractures while adding new fractures in relatively dense and stable granite. Using an air DTH hammer to impact fractured rock, new fractures are created on the granite wellbore. “Augmentation” has two meanings: for dense and microgranular granite, new microcracks or cracks may appear on the wellbore; for rocks with different degrees of initial damage (joints, textures, and microcracks), multiple fractures are enhanced under the impact of rock fragmentation. On the one hand, its purpose is to reduce the rock fracture pressure of later thermal storage transformation, making it easier to form multiple fracture networks. On the other hand, wellbore fractures also expand wellbore diameter, improve the permeability of near-wellbore thermal storage, and increase production capacity.
This article conducts experimental research on the damage and induced cracks on the hole wall caused by air DTH hammer drilling granite under atmospheric temperature and pressure conditions. Obtain the crack damage situation of granite under actual production working parameters and quantitatively analyze the actual crack situation and wellbore permeability through staining experiments, mechanical tests, CT scanning, and rock 3D reconstruction. Then, evaluate and analyze the improvement of wellbore permeability and the occurrence of wellbore cracks in air-downhole hammer drilling. The experimental results can provide data support for impact drilling modeling and numerical simulation of near-wellbore mechanical properties.

2. Experimental Methodology

2.1. Percussion Drilling Test

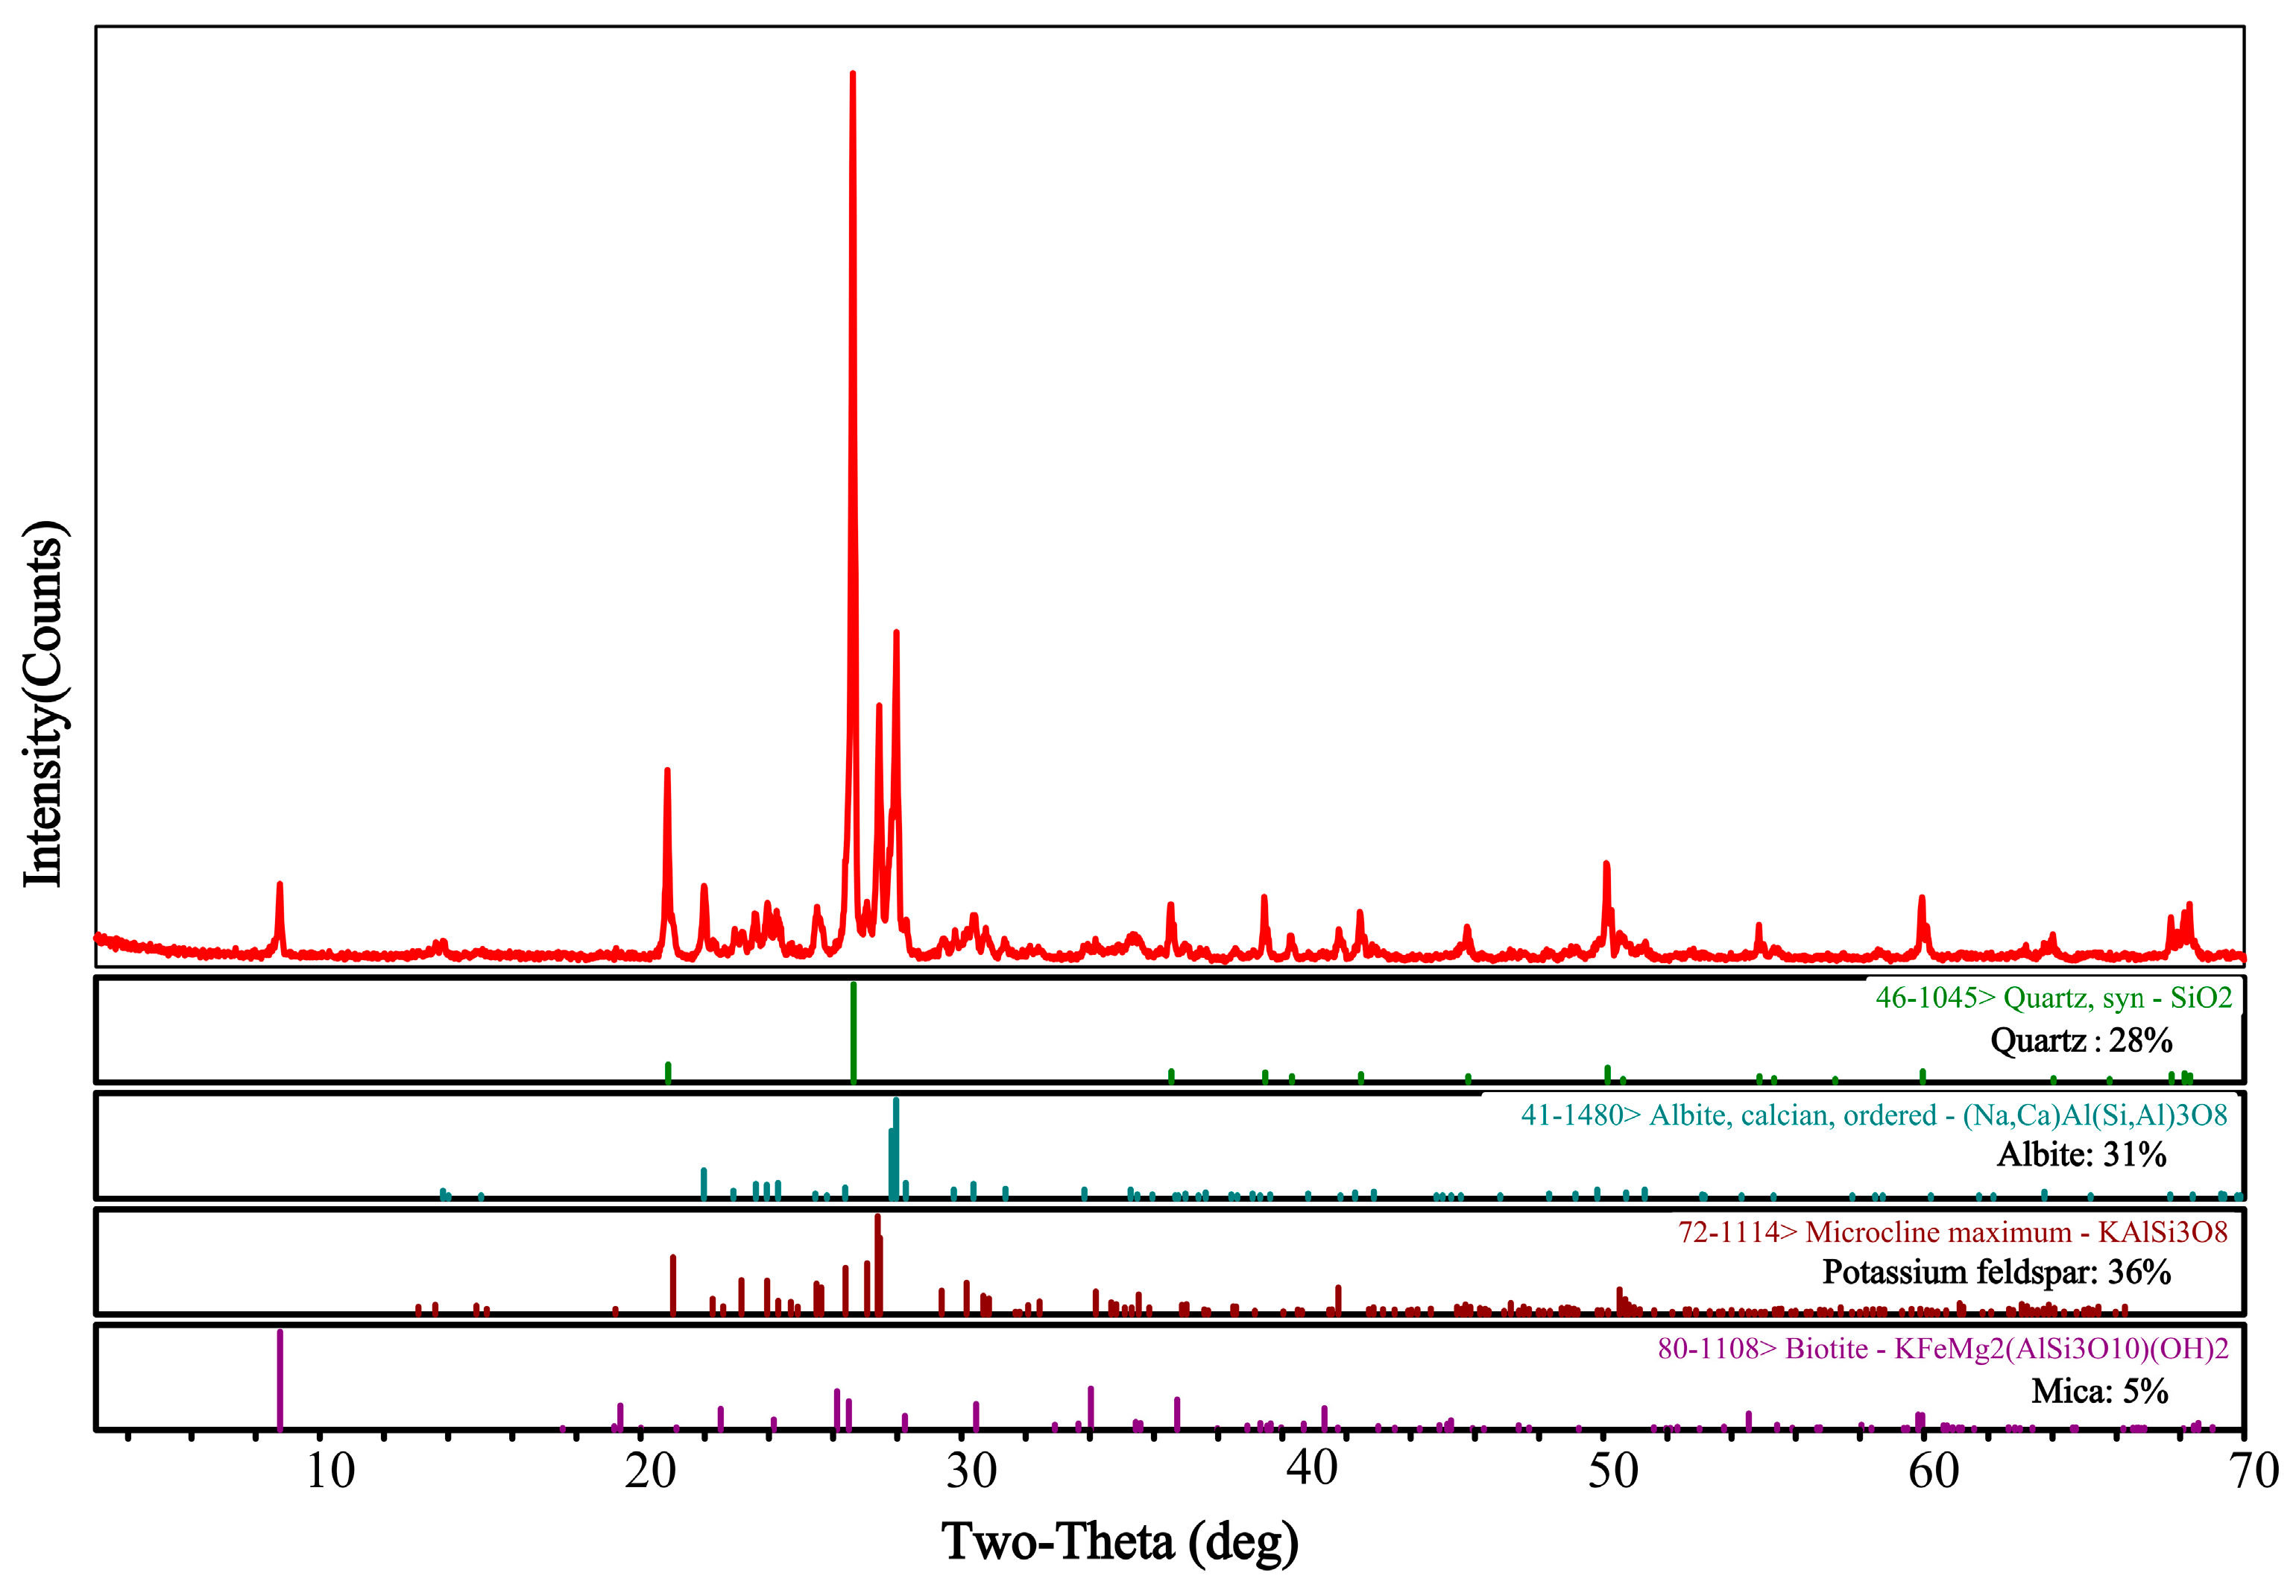
2.1.1. Granite Sample

Granite specimens, which were incised from a big granite block from Shandong Province in China, were used. Prior to impact testing, we tested the mechanical properties and conducted petrographic analyses of a granitic rock. Randomly select some original rock samples and grind them into 300-mesh rock powders using a jade mortar. Use the Smart Lab powder crystal diffractometer from the Powder Crystal Laboratory of the Chinese University of Geosciences (Beijing) for powder crystal X-ray diffraction (XRD) analysis. The analysis results are shown in Figure 2. The original granite’s main mineral components are quartz, plagioclase, potassium feldspar, and biotite, as shown in Table 1. According to the recommendations of ISRM, its physical and mechanical properties were measured (see Table 2).

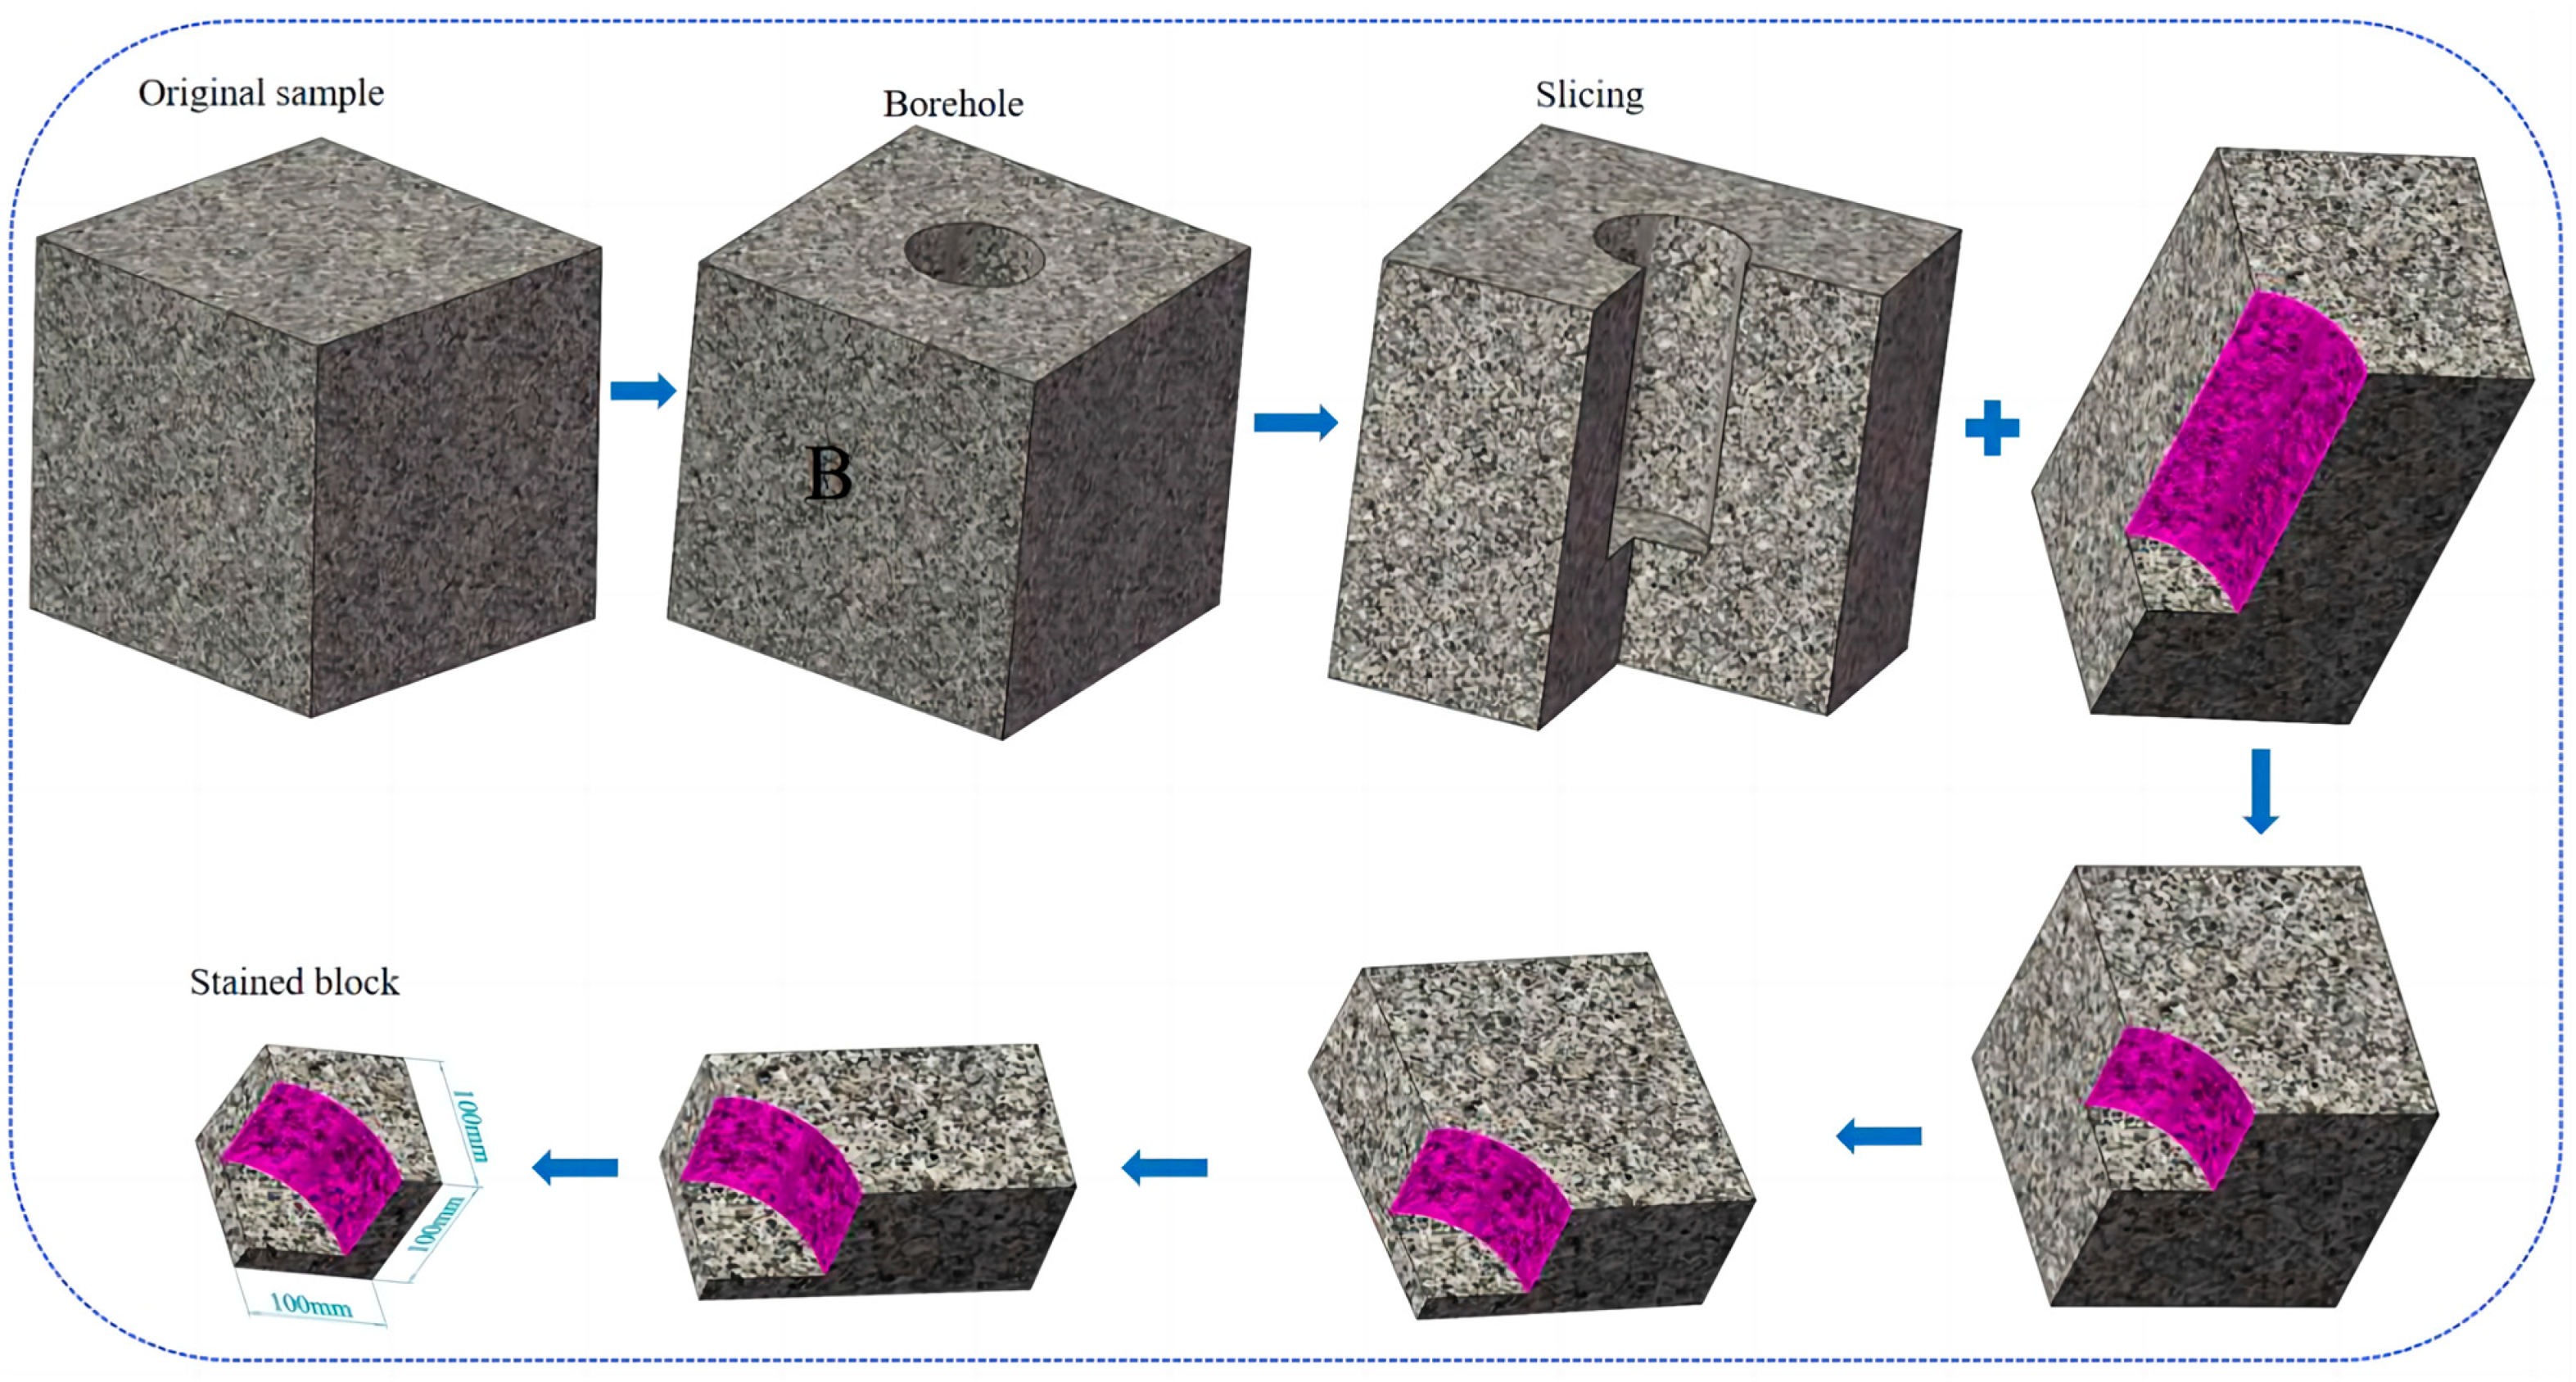
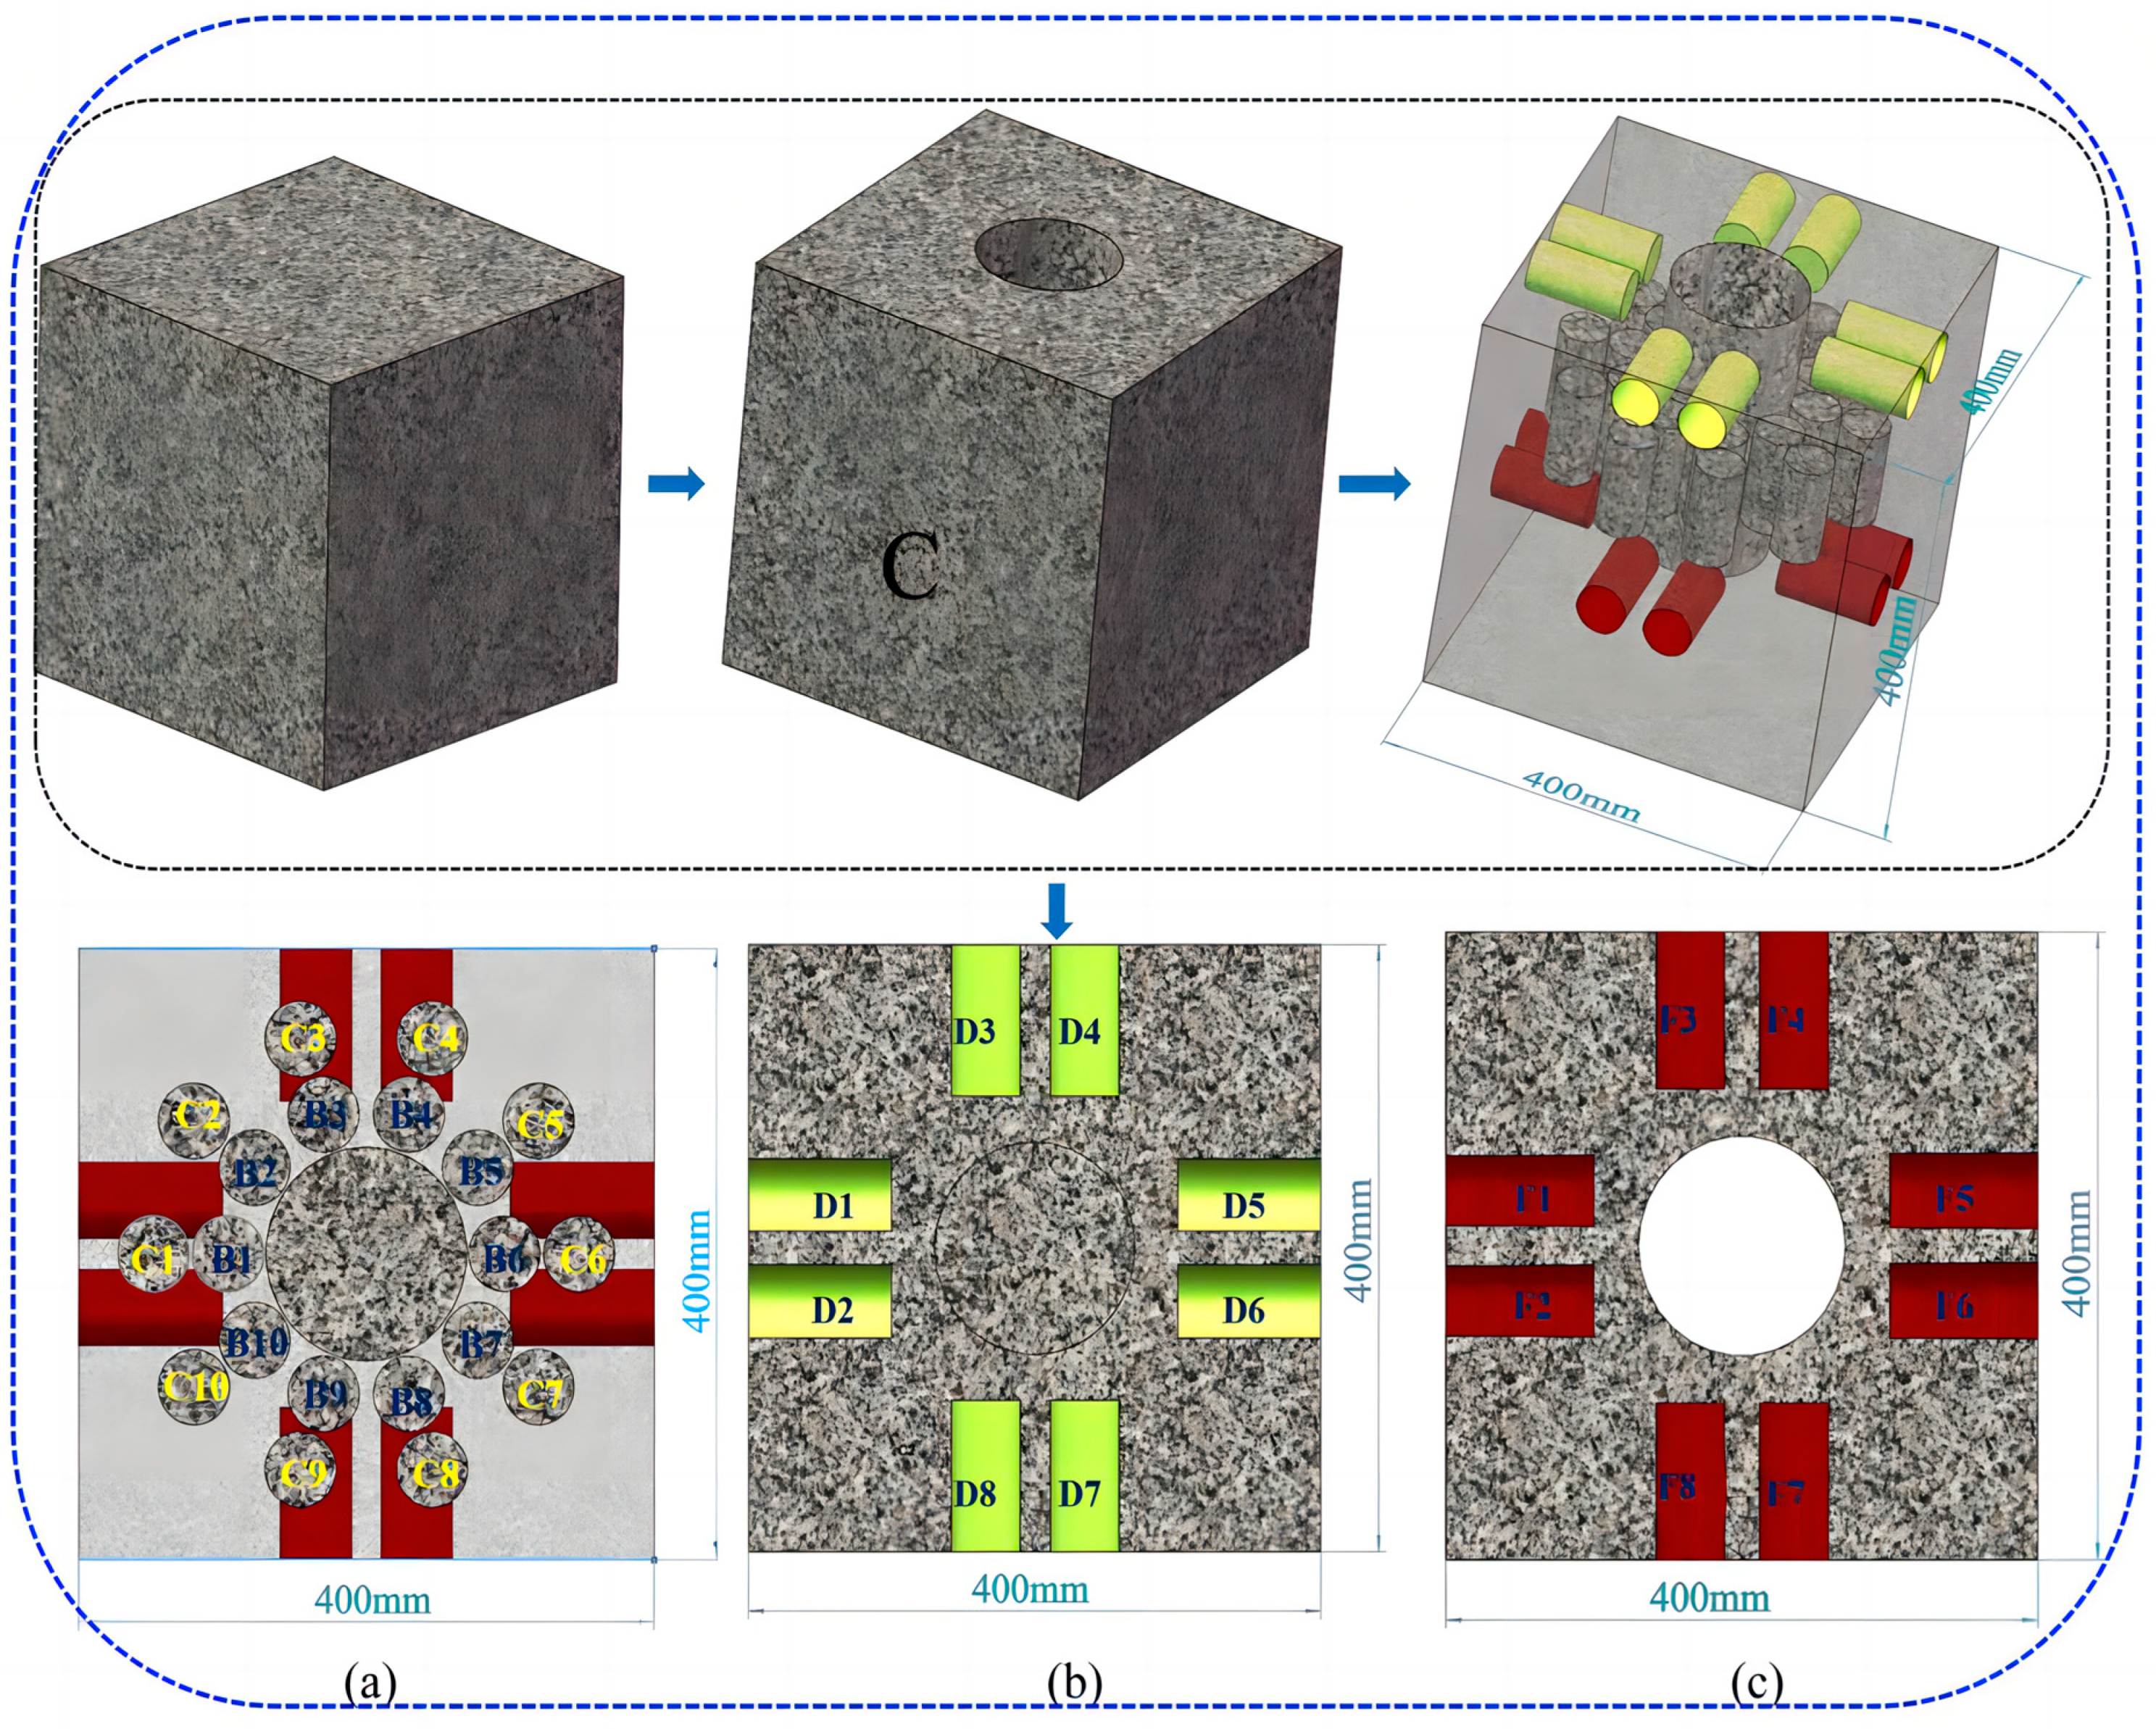
2.1.2. Impact Specimen Processing

Limited by drill type and test conditions, a bit with a diameter of 140 mm is selected. According to the volume effect, the plasticity of a solid at room temperature and pressure will decrease with the increase in geometric size of the deformable, and it will not change due to the change in volume until it reaches a certain size. According to existing research, it is generally believed that due to the more uneven chemical composition and microstructure in the larger objects, the more internal defects, the ductility is reduced. Sample size should be considered to eliminate the influence of sample size on the test results. Numerous studies have shown that if the ratio of the depth of the plastic zone to the minimum specimen width is less than 1/6, the size effect can be ignored [40,41,42,43]. According to the cavity expansion model proposed by Alehossein et al. [44], the ratio of plastic zone depth to penetration depth can be calculated as follows:
k p = 1 + s i n ϕ 1 s i n ϕ
k d = 1 + s i n φ 1 s i n φ
λ = ( k p 1 ) ( k d 1 ) + ( 1 2 v ) ( k p + 1 ) ( k d + 1 ) 2 k p
μ = λ k p k p + k d
( 1 + μ ) ξ ( k d + 1 ) / k d μ ξ ( k d 1 ) / k p = γ
ξ = r / a
where ξ denotes the ratio of the depth of the plastic zone to the penetration depth, r denotes the critical radius of the plastic zone, γ is a number characterizing the tool geometry, for the buttons used in this test γ = 0, ϕ and φ are the friction angle and dilatancy angle of the rock, respectively; here, φ is taken as 57°. k p and k d are the passive and dilatancy coefficients. a represents the contact radius between the peripheral button and granite; a is taken as 9 mm. The sample’s length, width, and height are 400 mm, 400 mm, and 400 mm, respectively. There are no obvious natural cracks on the surface of the granite specimen. Using wellbore size to determine the plastic zone when evaluating specimen size is more reasonable. Nevertheless, the drill teeth on the drill bit come into direct contact with the rock. The drill bit used in the experiment is shown in Figure 3. Specifically, our research scope includes granite blocks perpendicular to the wellbore axis. Therefore, we need to pay attention to the plastic zone generated by the edge teeth. The impact of the front ball tooth on the plastic area around the wellbore is not particularly significant and can be ignored. By substituting the granite parameters into Equation (6), ξ is 0.83, r is 7.47 mm, and the wall thickness (t) of the granite sample after drilling is 130 mm (see Figure 4).
The ratio r to t is close to 1/18 and less than 1/6. According to the verification calculation of the drill bit parameters used in the drilling test (see Table 3), the minimum sample edge length of the sample is 220.64 mm. Therefore, the sample size in this article is reasonable.

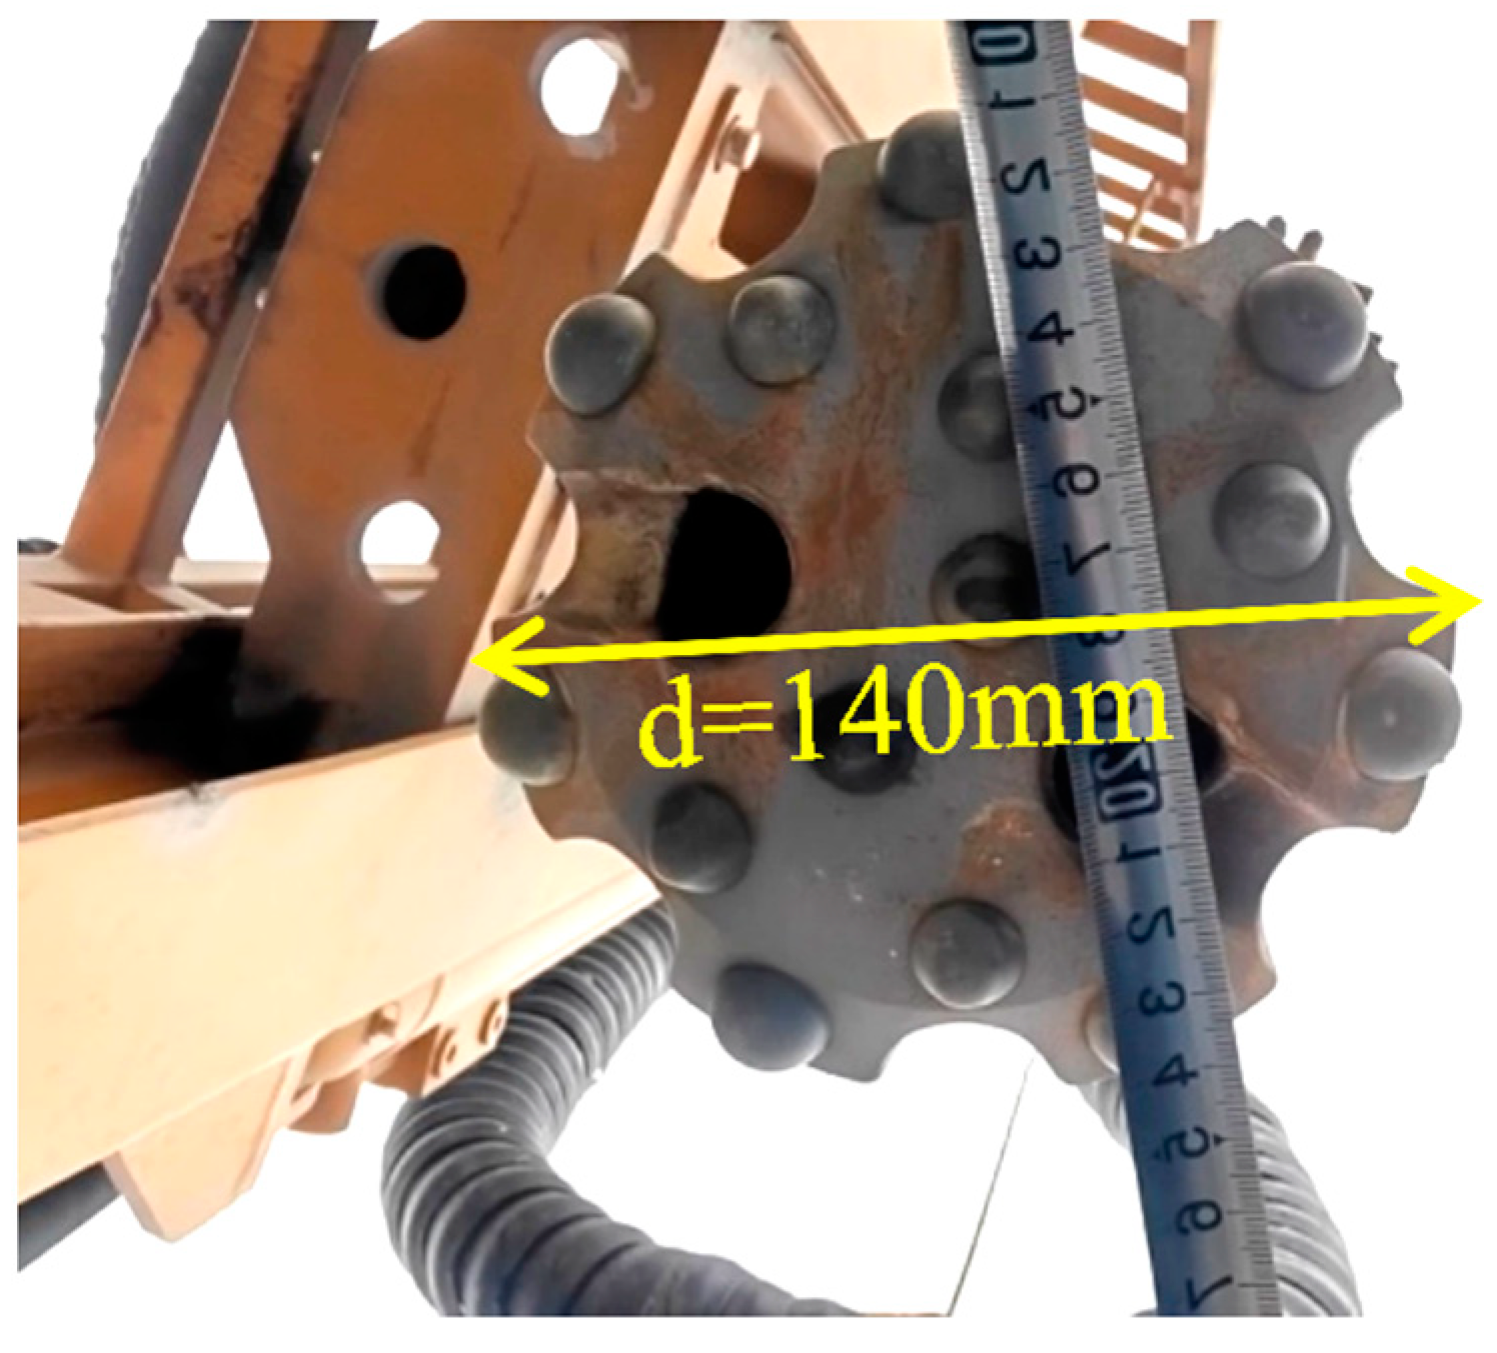
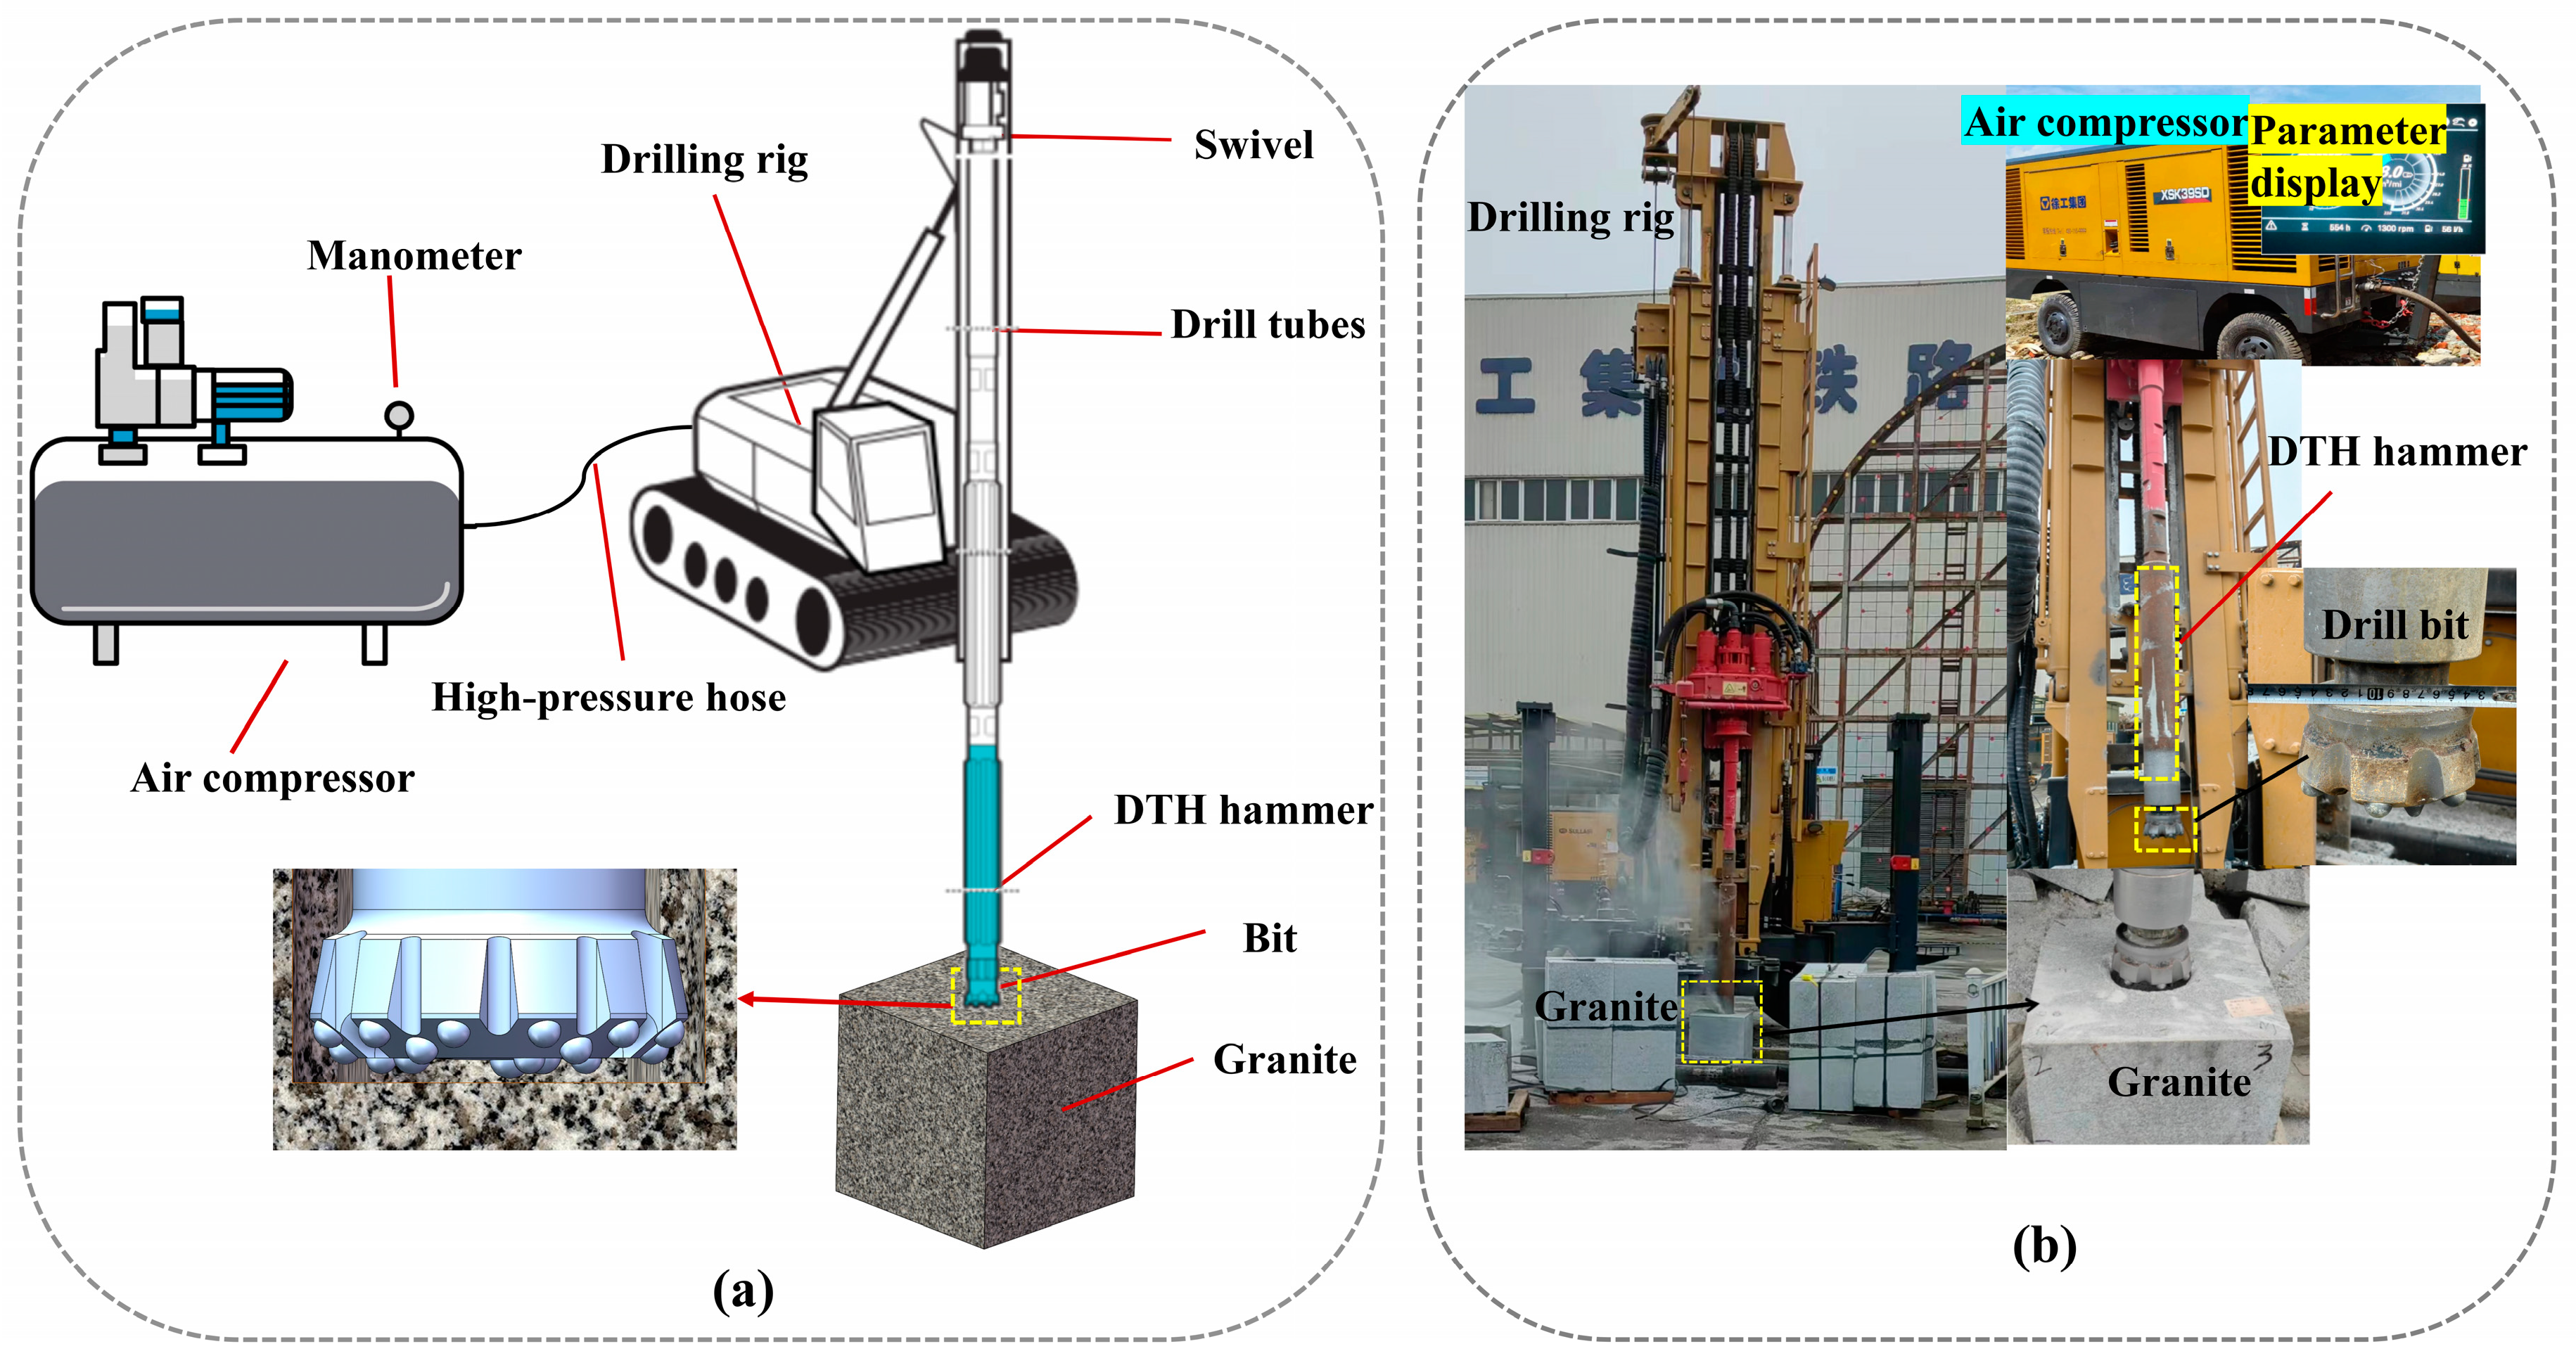
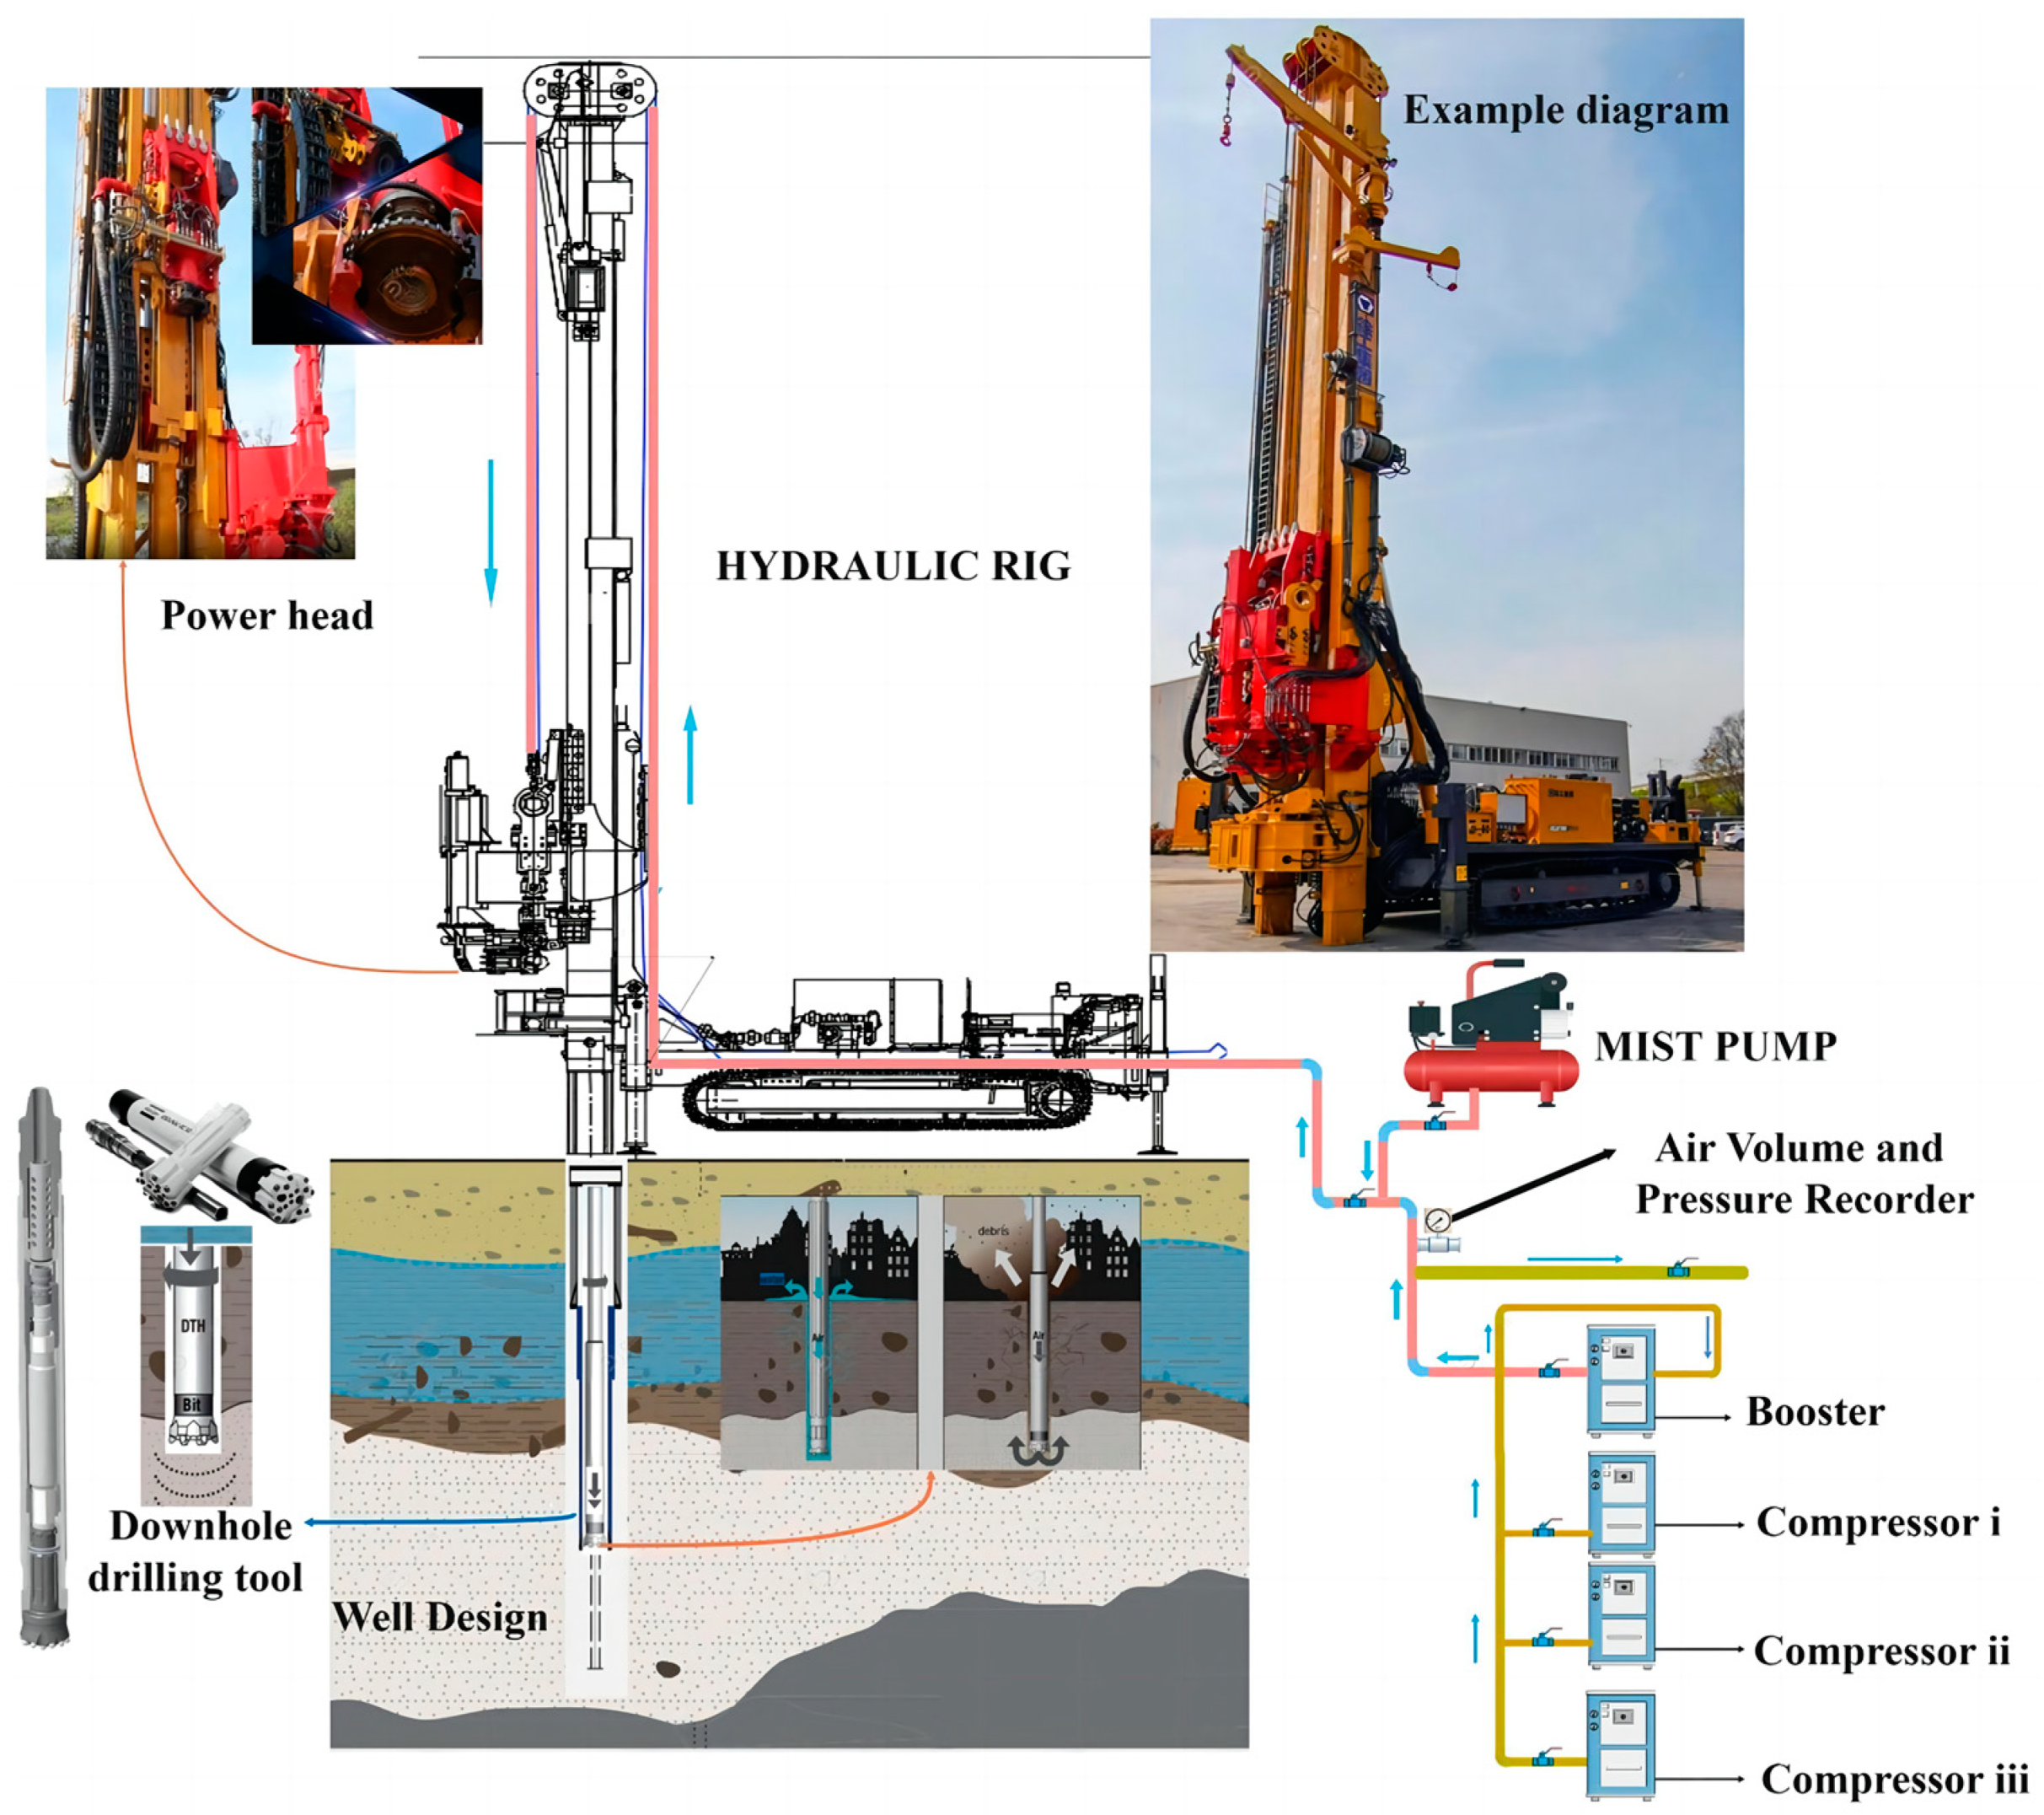
2.1.3. Percussion Drilling Equipment

The schematic diagram of the equipment is shown in Figure 5, mainly consisting of 7 parts: air compressor, drilling rig, drill pipe, high-pressure hose, DTH hammer, DTH hammer drill bit, and granite sample, with a wellbore diameter of 140 mm. The air compressor converts compressed air energy into the impact energy of a DTH hammer drill bit through a high-pressure hose and drill pipe through a DTH hammer, thereby achieving impact on granite samples [45]. In order to prevent the migration of granite samples during the impact process, an iron fixing device is used to fix the bottom of the granite sample.

2.1.4. Percussion Drilling Test Process

The location of the drilling test is the tunnel and underground space equipment testing site of Xuzhou XCMG Foundation Engineering Machinery Co., Ltd, Xuzhou City, Jiangsu Province, China. Due to the large volume of the drilling rig and supporting air compressor equipment, the test was conducted in a limited area. To ensure the accuracy of the test results, multiple pre-tests were conducted to obtain reasonable percussion drilling parameters, and finally, the parameters in Table 4 were used as the formal experimental parameters. A total of 4 formal experiments were conducted, with four drilled rock samples numbered A, B, C, and D obtained, and subsequent experimental analysis was conducted on them.

2.2. Percussion Crack Identification

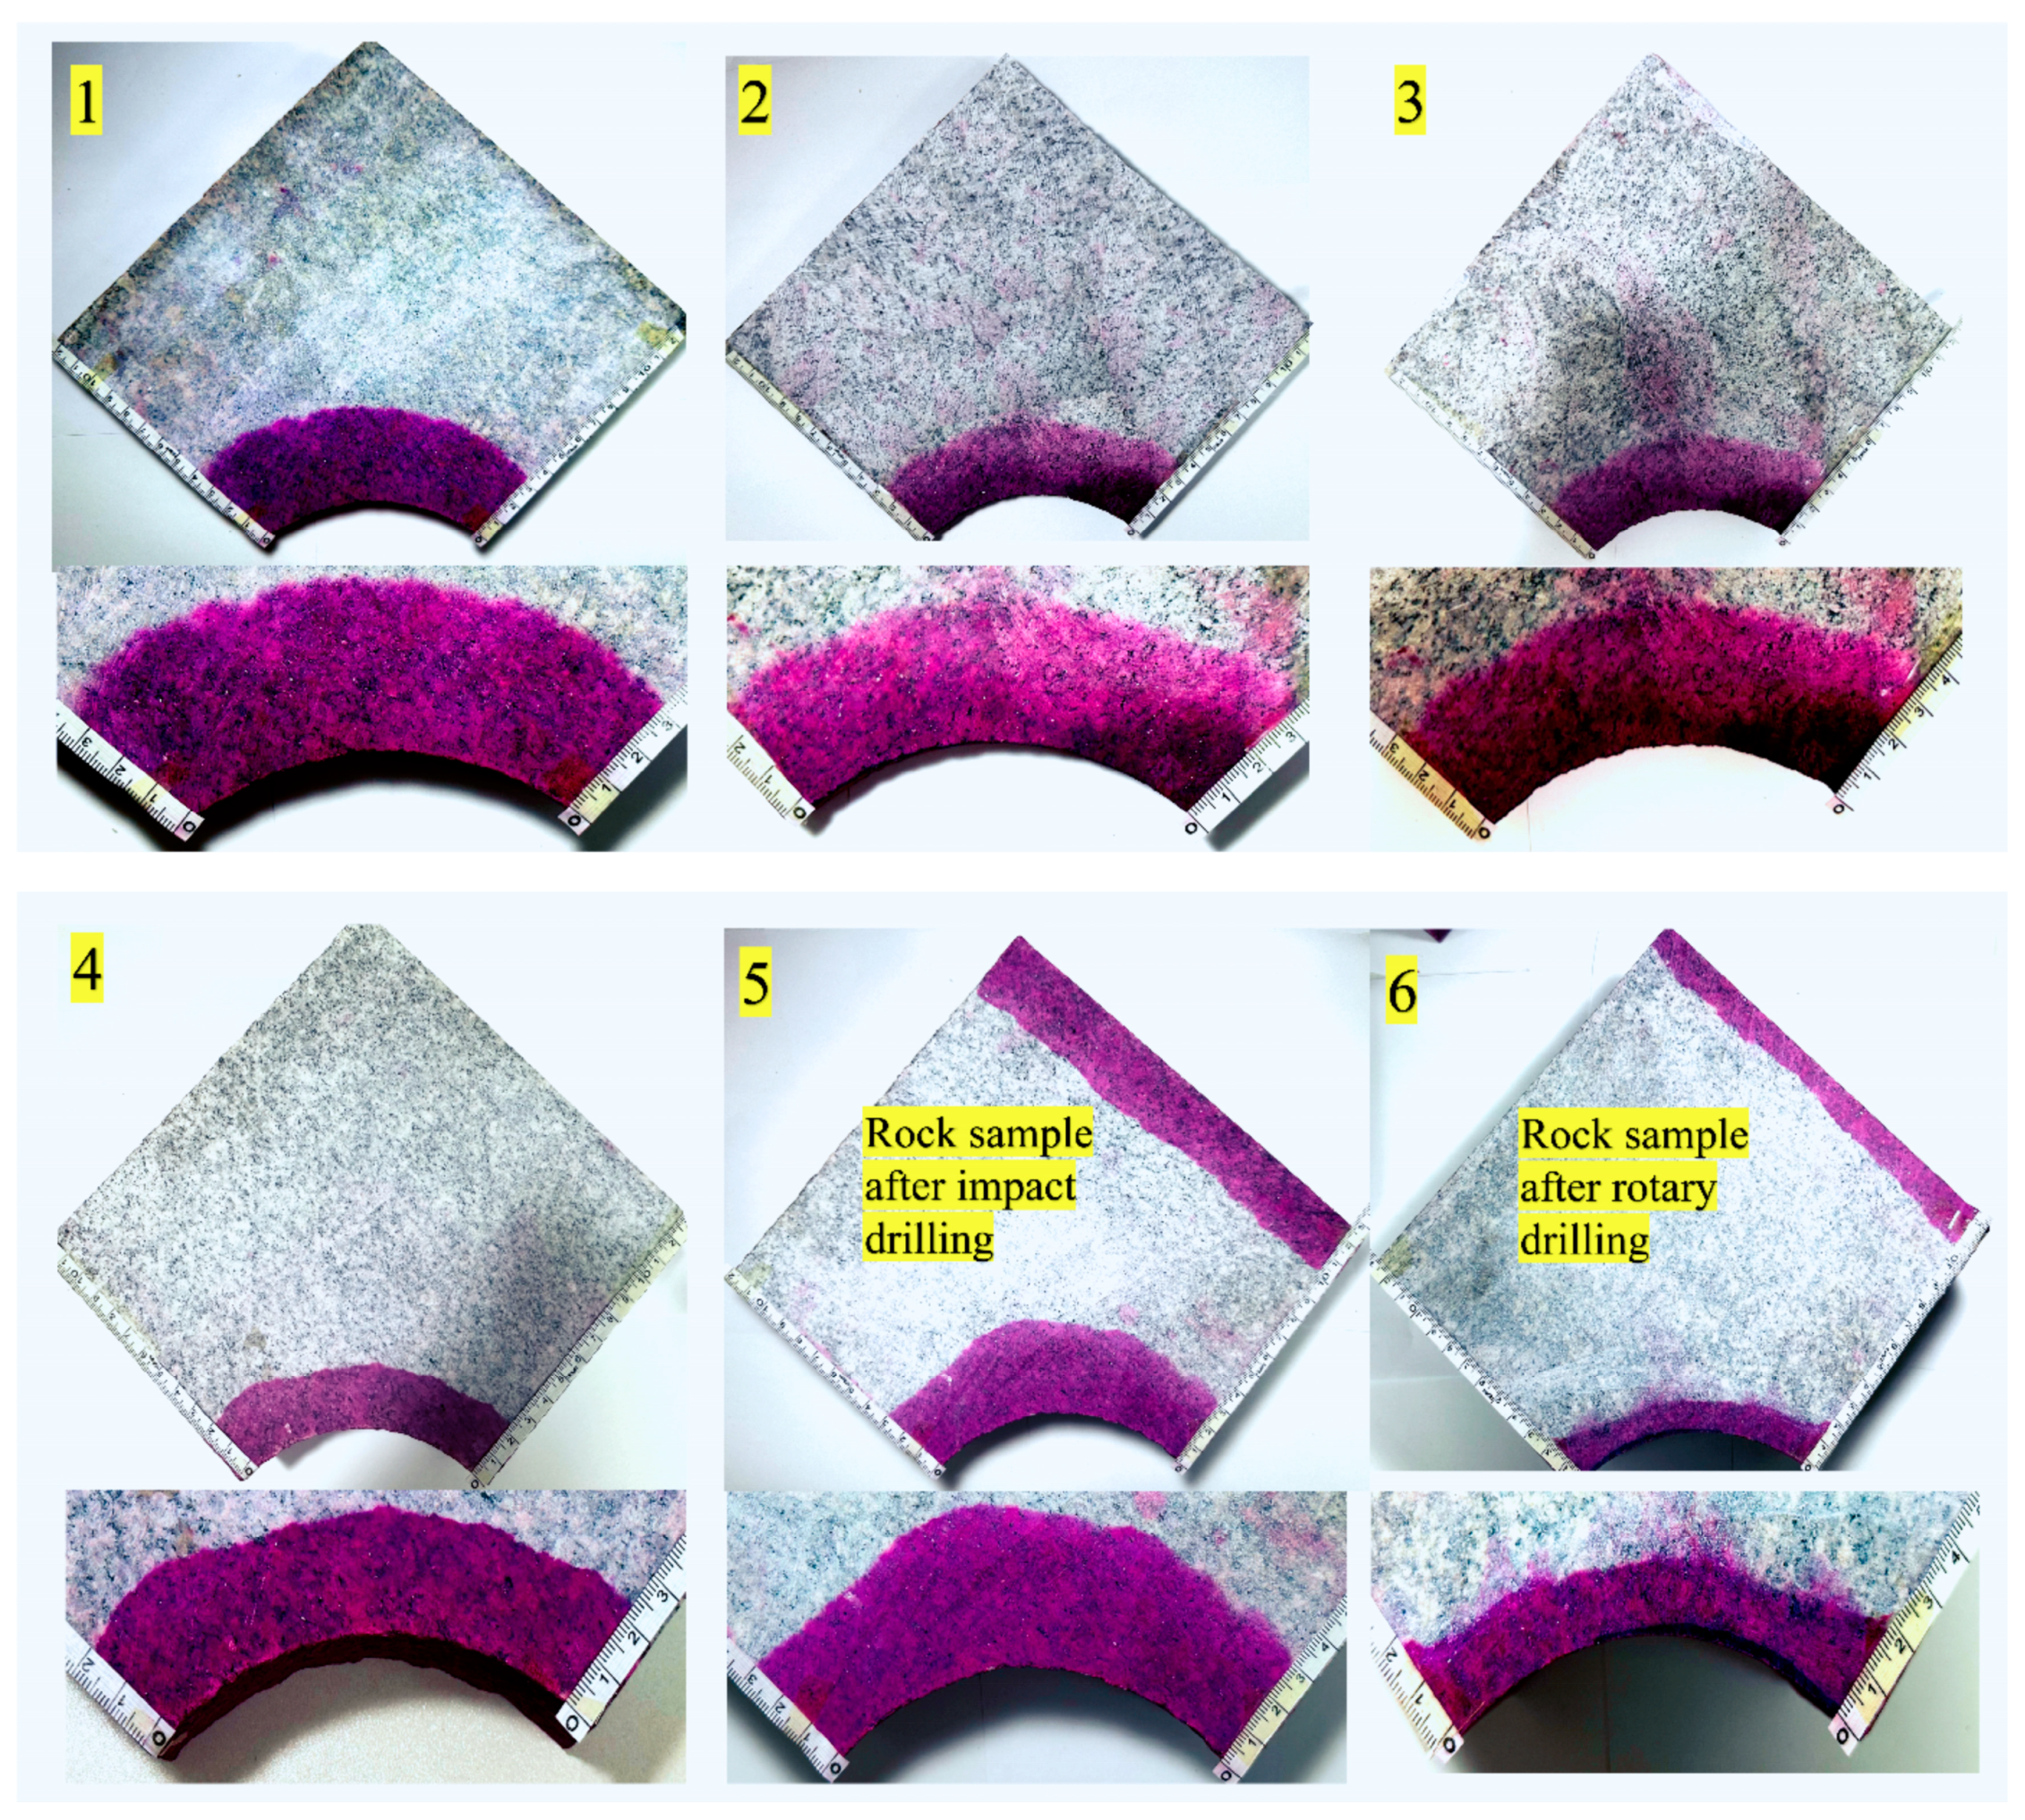
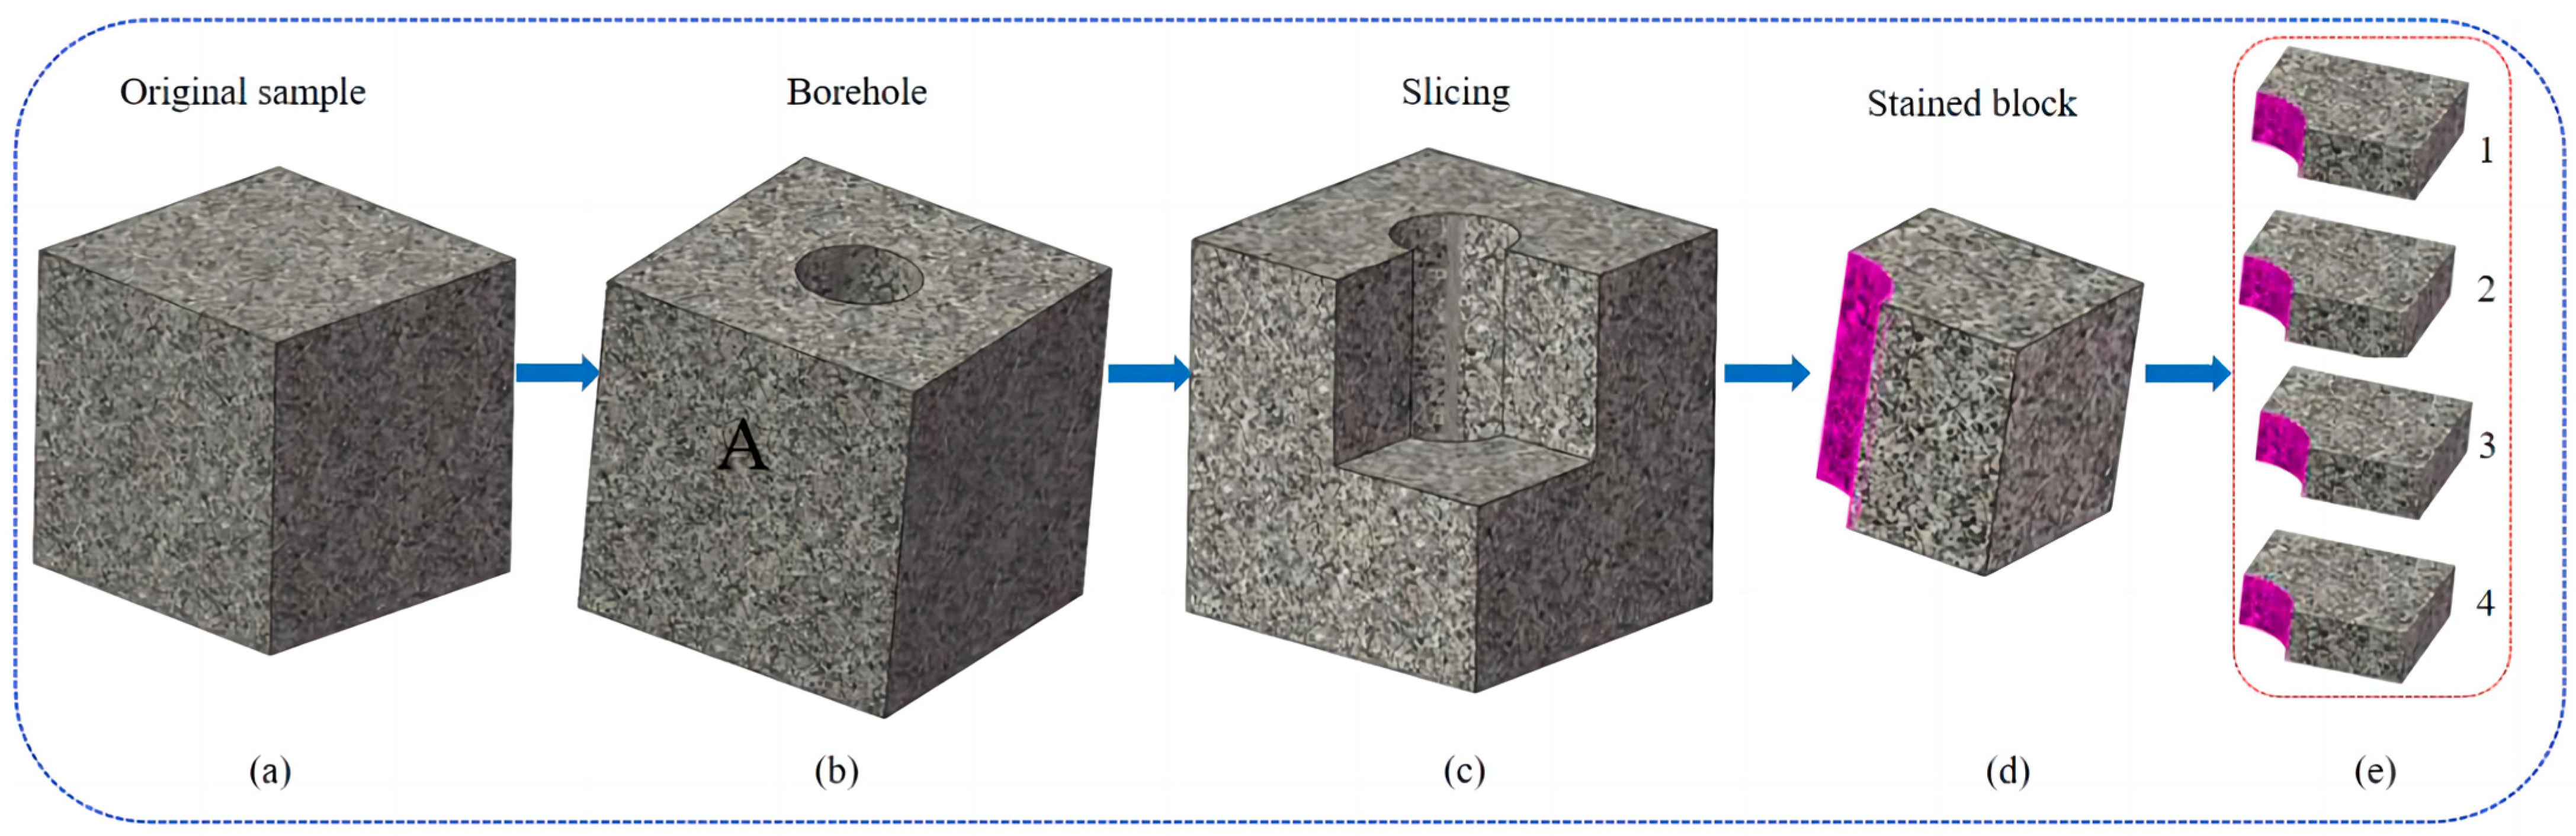
2.2.1. Dyeing Experiment

Three rock samples were subjected to staining experiments to identify cracks, including original undrilled rock samples, rotary drilling rock samples, and impact rotary drilling. A rock sample was prepared from the above experiments. The flow chart for cutting rock A is shown in Figure 6. First, cut the hole wall part of the rock block with a thickness of one-eighth of 200 mm (see Figure 6d), and then cut the rock block into 50 mm thick rock plates (see Figure 6e), numbered 1, 2, 3, and 4, and dye them separately. The original undrilled rock samples are processed into equal-sized rock plates without drilled holes for staining.
Firstly, carefully clean the impurities on the surface of the rock plate with a non-toxic and insoluble cleaning agent, and then let it dry for a while. Secondly, dye the cleaned rock plate evenly with a penetrating agent to ensure that the penetrating agent completely covers the detection area and remains moist throughout the penetration process. Due to the dense nature of the granite used in the experiment, a penetration time of 36 h was chosen. Finally, observe the surface of each rock block using an imaging agent.

2.2.2. CT Scan Recognition

The CT scanning system is a NanoVoxel-5000 series dual-ray source CT system produced by Tianjin Sanying Precision Instrument Co., Ltd, Tianjin, China. The resolution is 20 μm. The CT-scanned rock sample includes the original and rotary percussion drilling B rock samples. The rock sample of borehole B was cut, and the flow chart for cutting rock B is shown in Figure 7. The 100 × 100 mm granite sample at the bottom of the hole was selected as the CT scanning sample, and the control group was the original rock of equal size without a drilling gap. The granite sample scanned by CT is shown in Figure 6.

2.3. Mechanical and Permeability Experiments

2.3.1. Mechanical Test

Mechanical test rock samples include original and rotary percussion drilling rock samples. Rock sample C after percussion drilling is sampled; the flow chart for cutting rock C is shown in Figure 8. The rock samples are then processed into standard mechanical samples with a diameter of 50 mm and a height of 100 mm. Eight to ten samples are taken for each working condition to ensure the results of the subsequent multiple tests. A total of four sets of rock samples were collected, including rock columns with the axis parallel to the drilling axis and rock columns with the axis perpendicular to the drilling axis. Rock columns with the axis parallel to the drilling axis were divided into the following two situations: near-hole wall (No. B1–B10) and far-hole wall (No. C1–C10). Rock columns with the axis perpendicular to the drilling axis were divided into two situations: hole opening (No. D1–D8) and hole bottom (No. F1–F8).

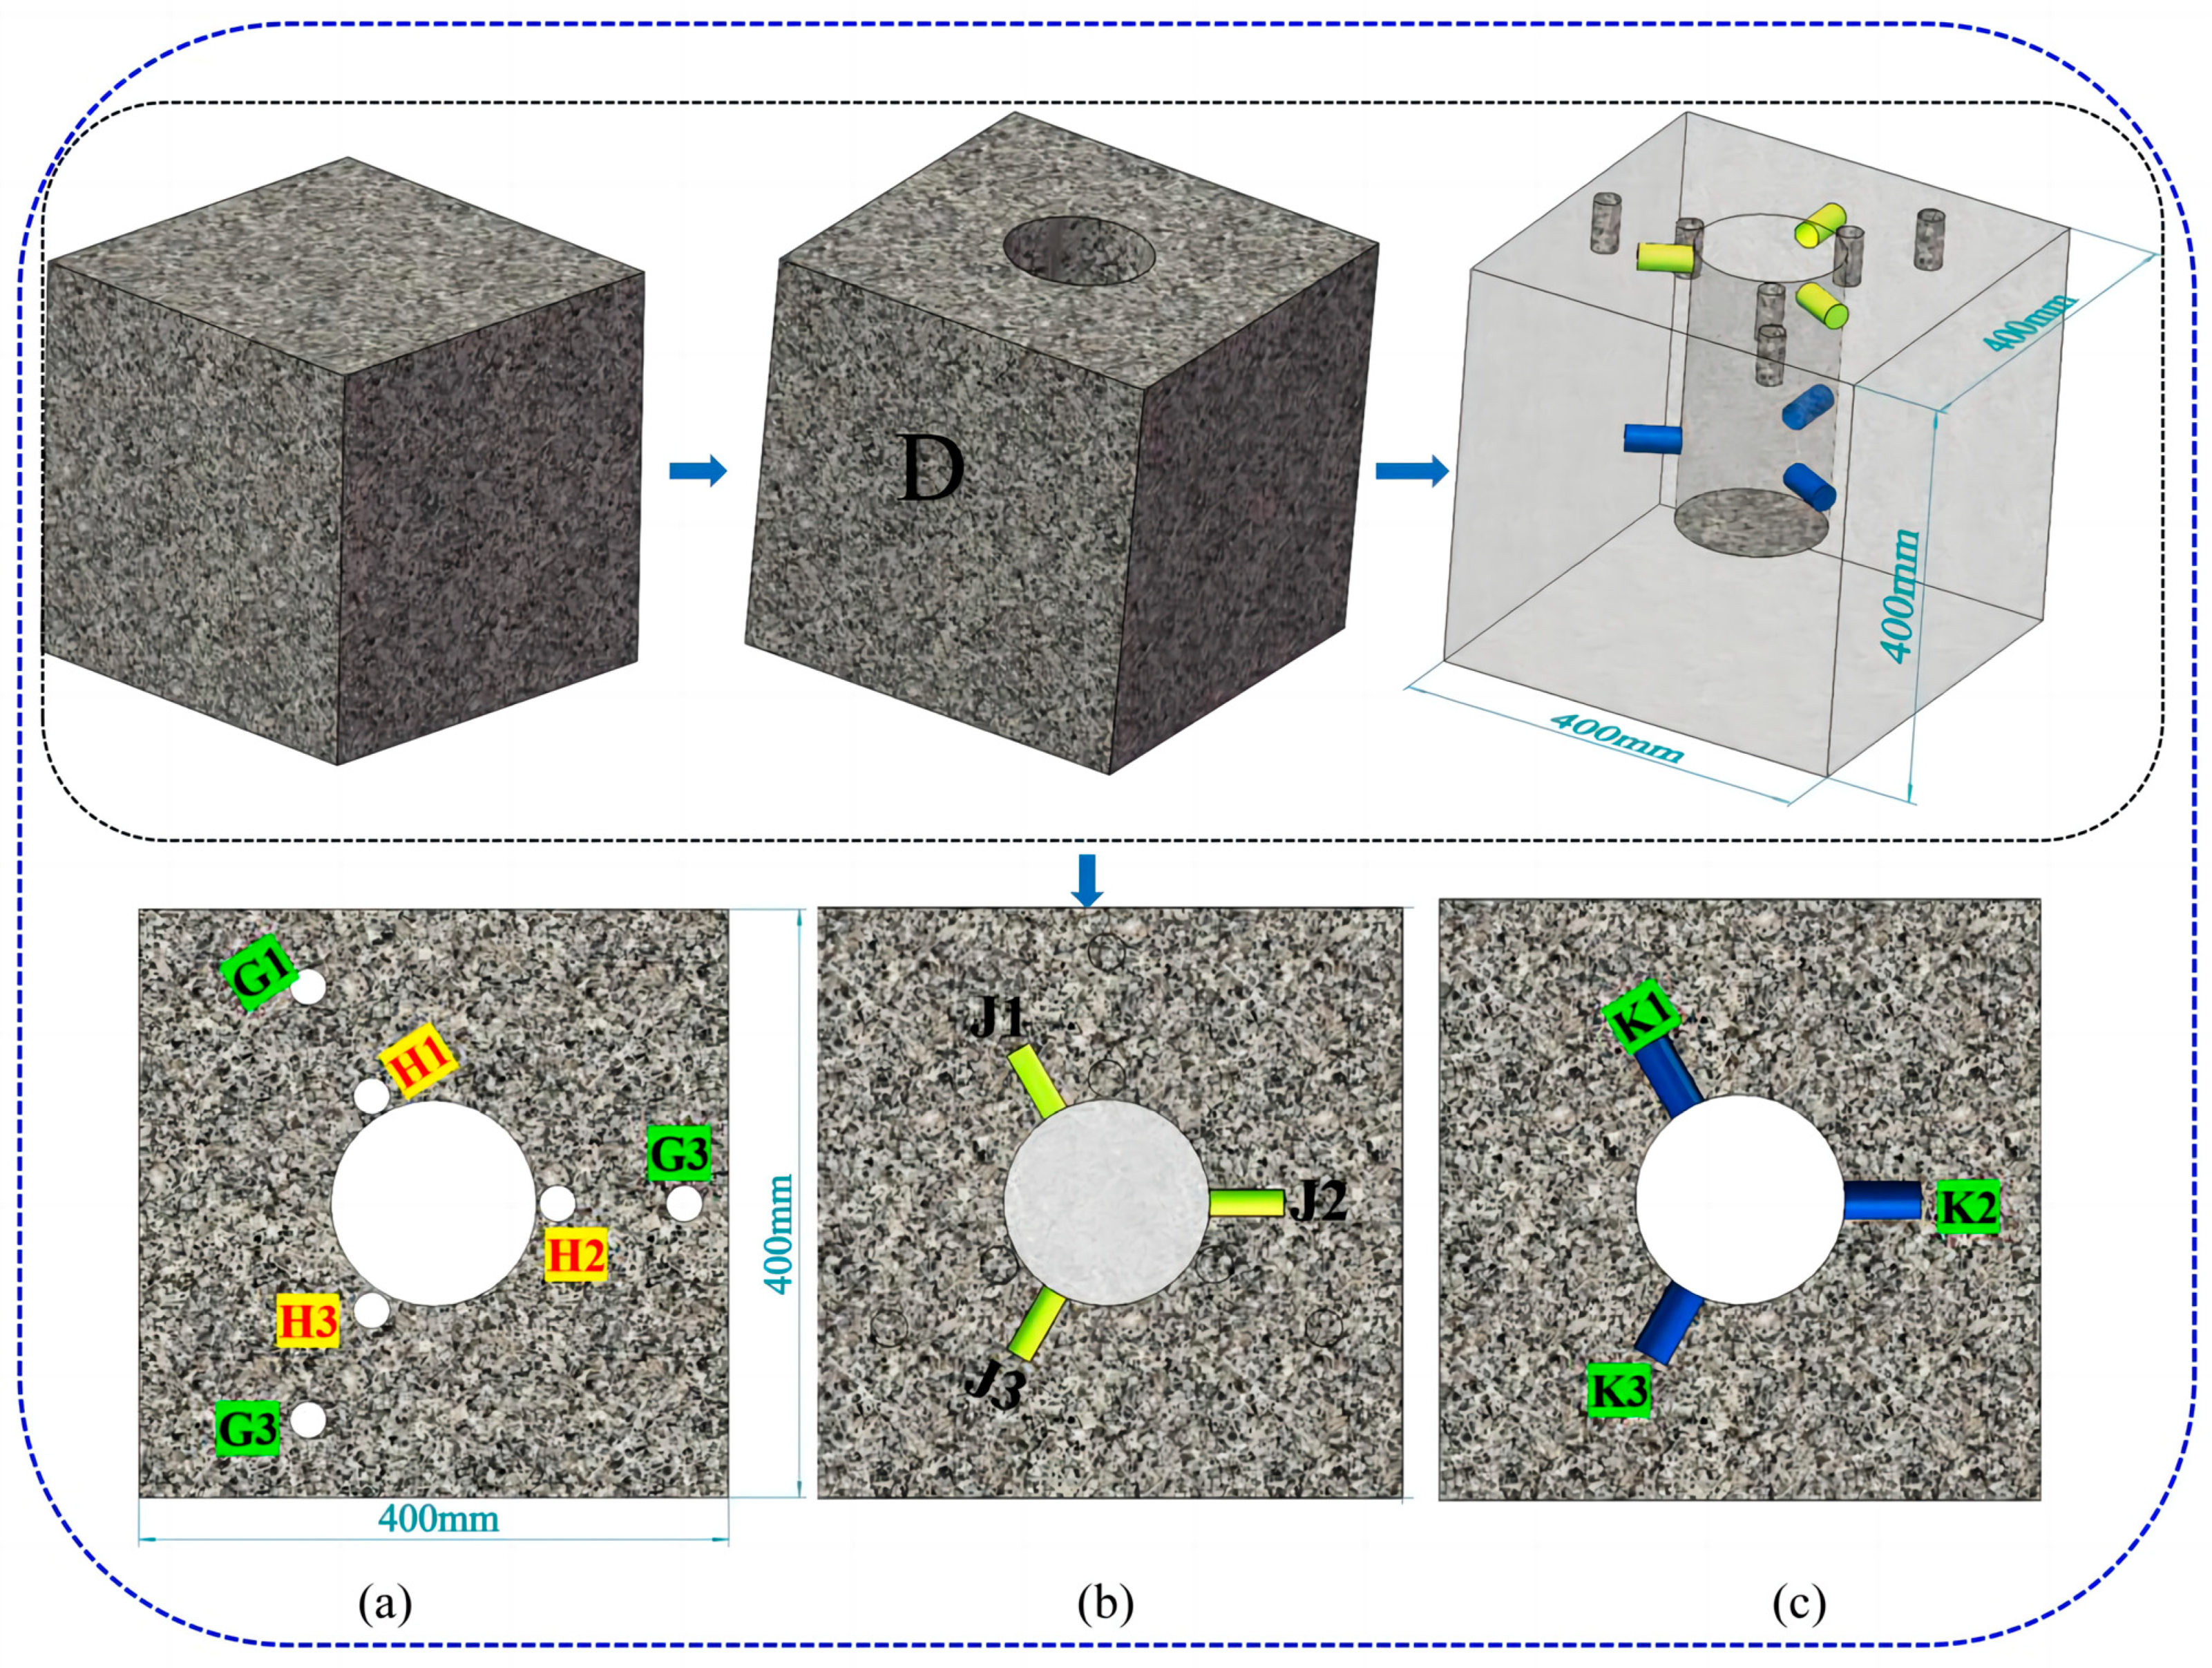
2.3.2. Permeability Measurement

Using axial flow and the core plunger pulse attenuation method for measurement. The rock samples required for permeability measurement include original and percussion-drilling rock samples. Rock sample D after percussion rotary drilling is sampled; the flow chart of cutting rock D is shown in Figure 9. The rock samples are then processed into standard mechanical samples with a diameter of 50 mm and a height of 100 mm. Two to three samples are taken for each working condition to ensure the results of subsequent multiple tests. Four sets of rock samples were collected, including rock columns parallel to the drilling axis and rock columns perpendicular to the drilling axis. The rock columns with the axis parallel to the drilling axis were divided into two situations: near-hole wall (No. H1–H3) and far-hole wall (No. G1–G3). The rock columns with the axis perpendicular to the drilling axis were divided into two situations: hole opening (No. J1–J3) and hole bottom (No. K1–K3).

3. Results and Discussion

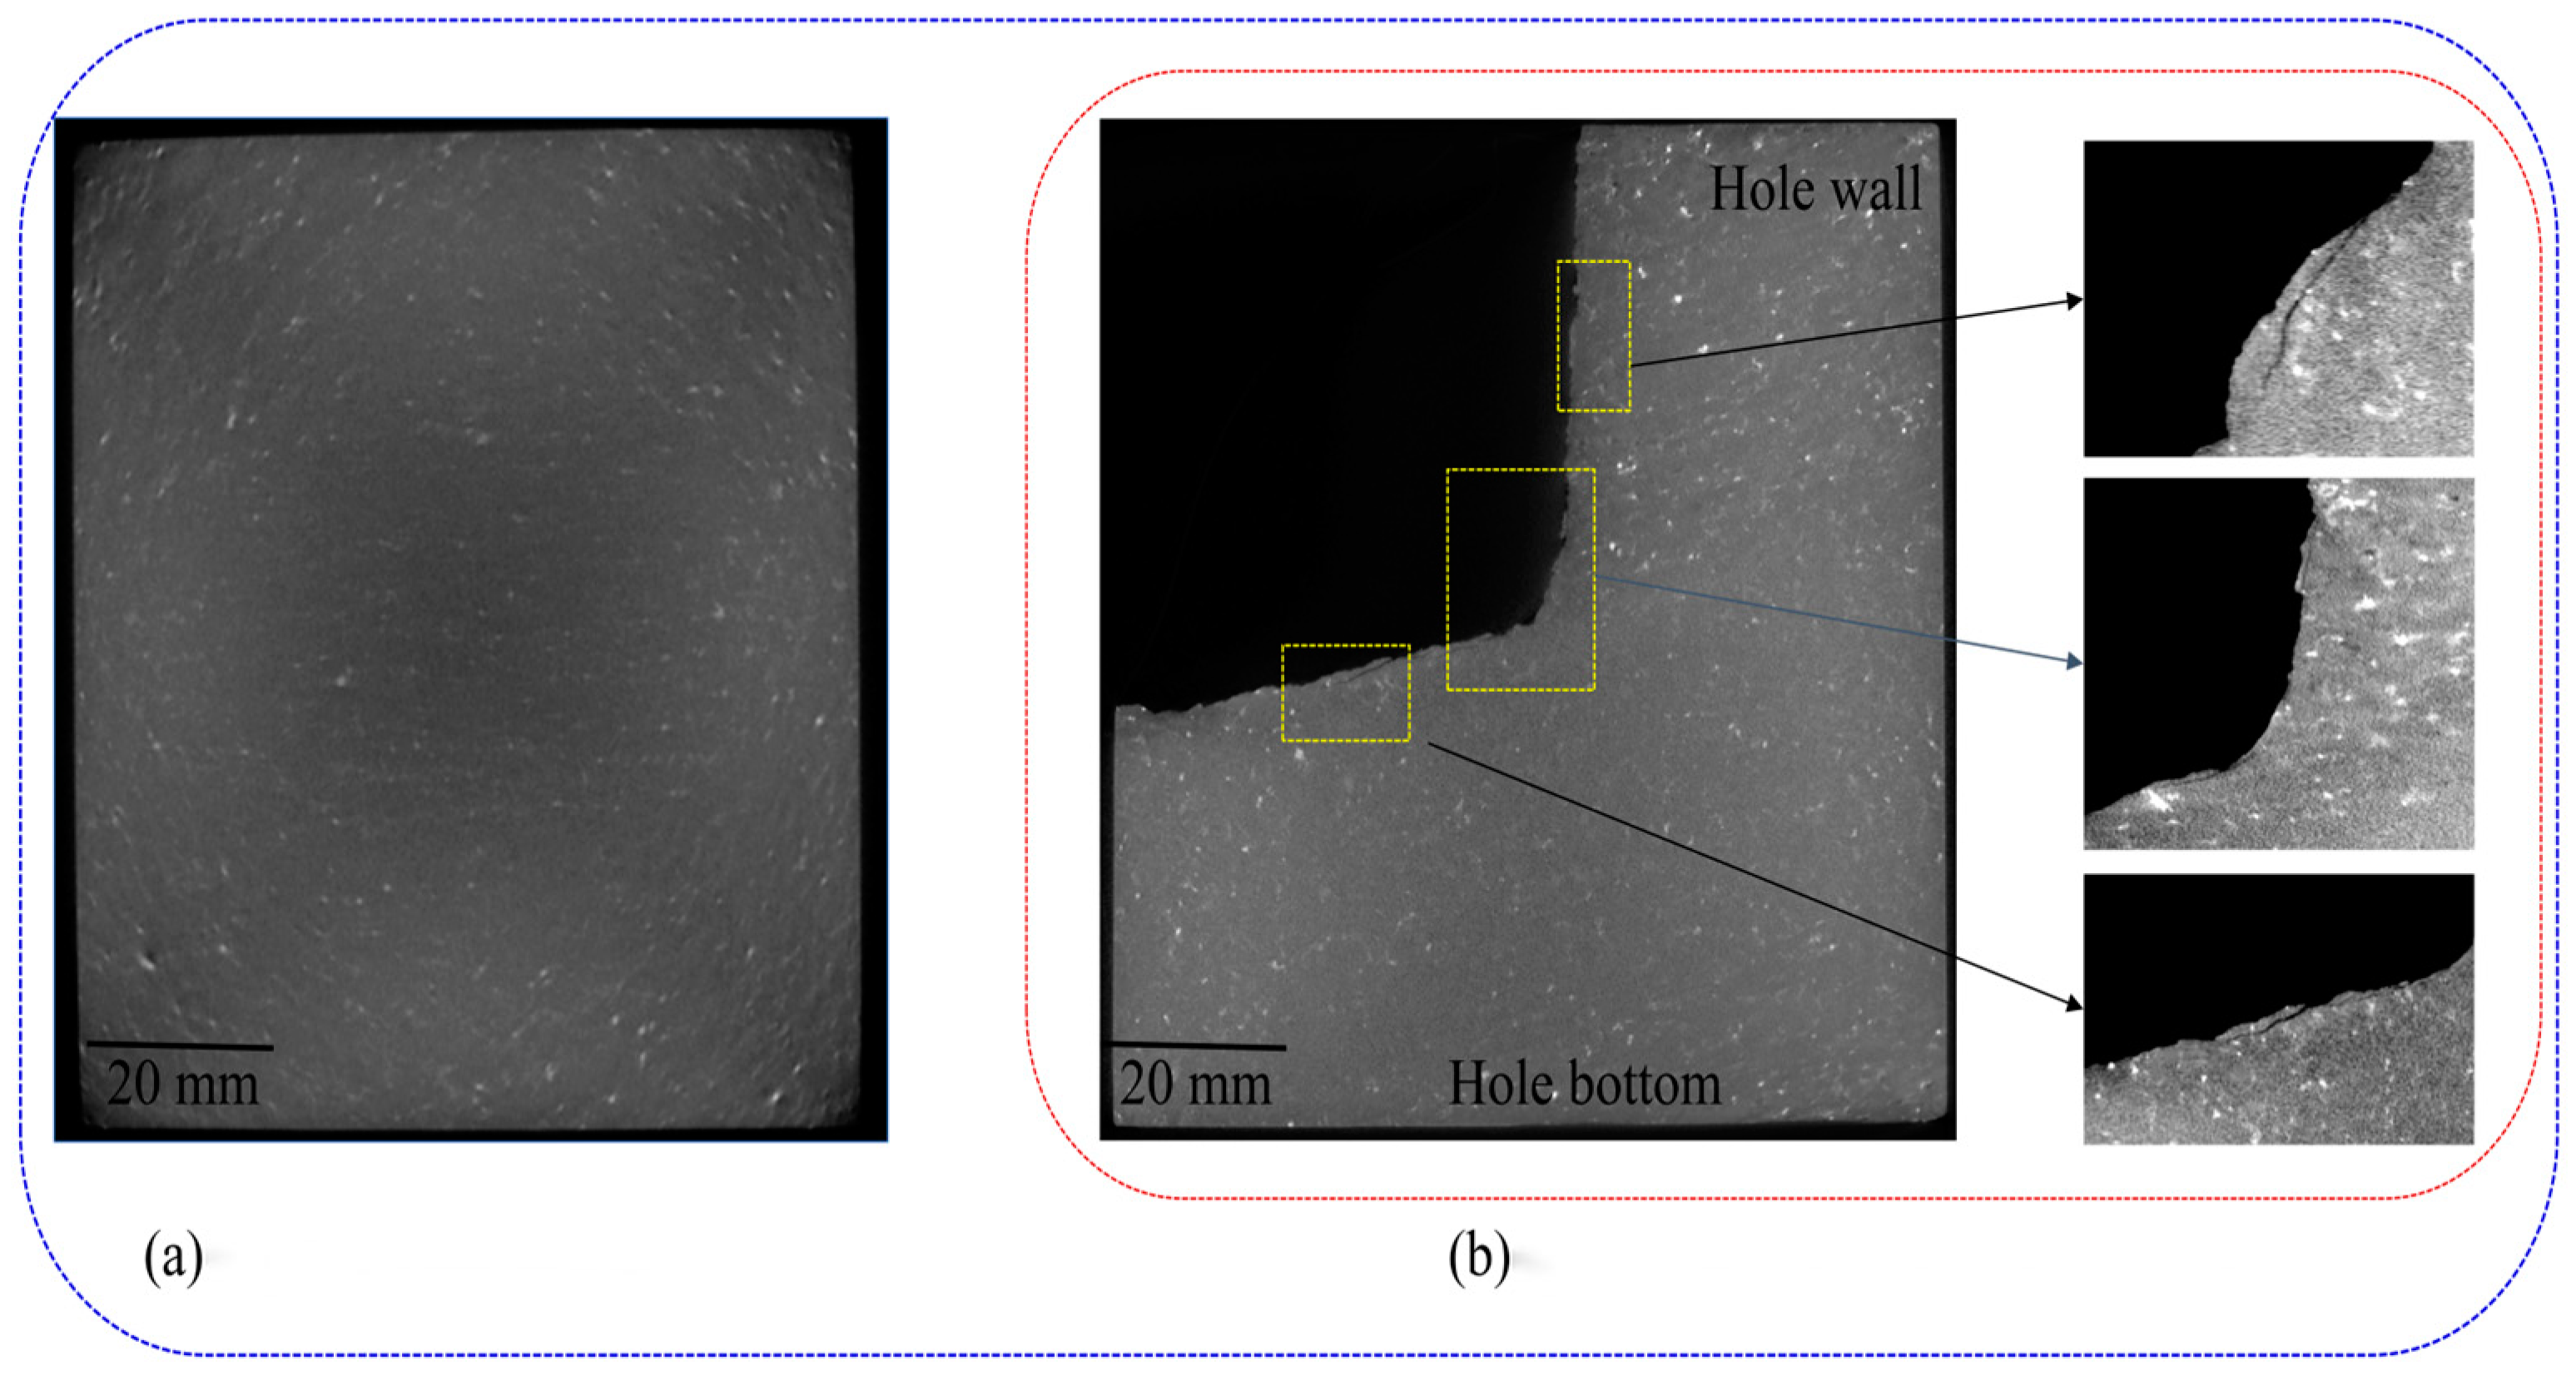
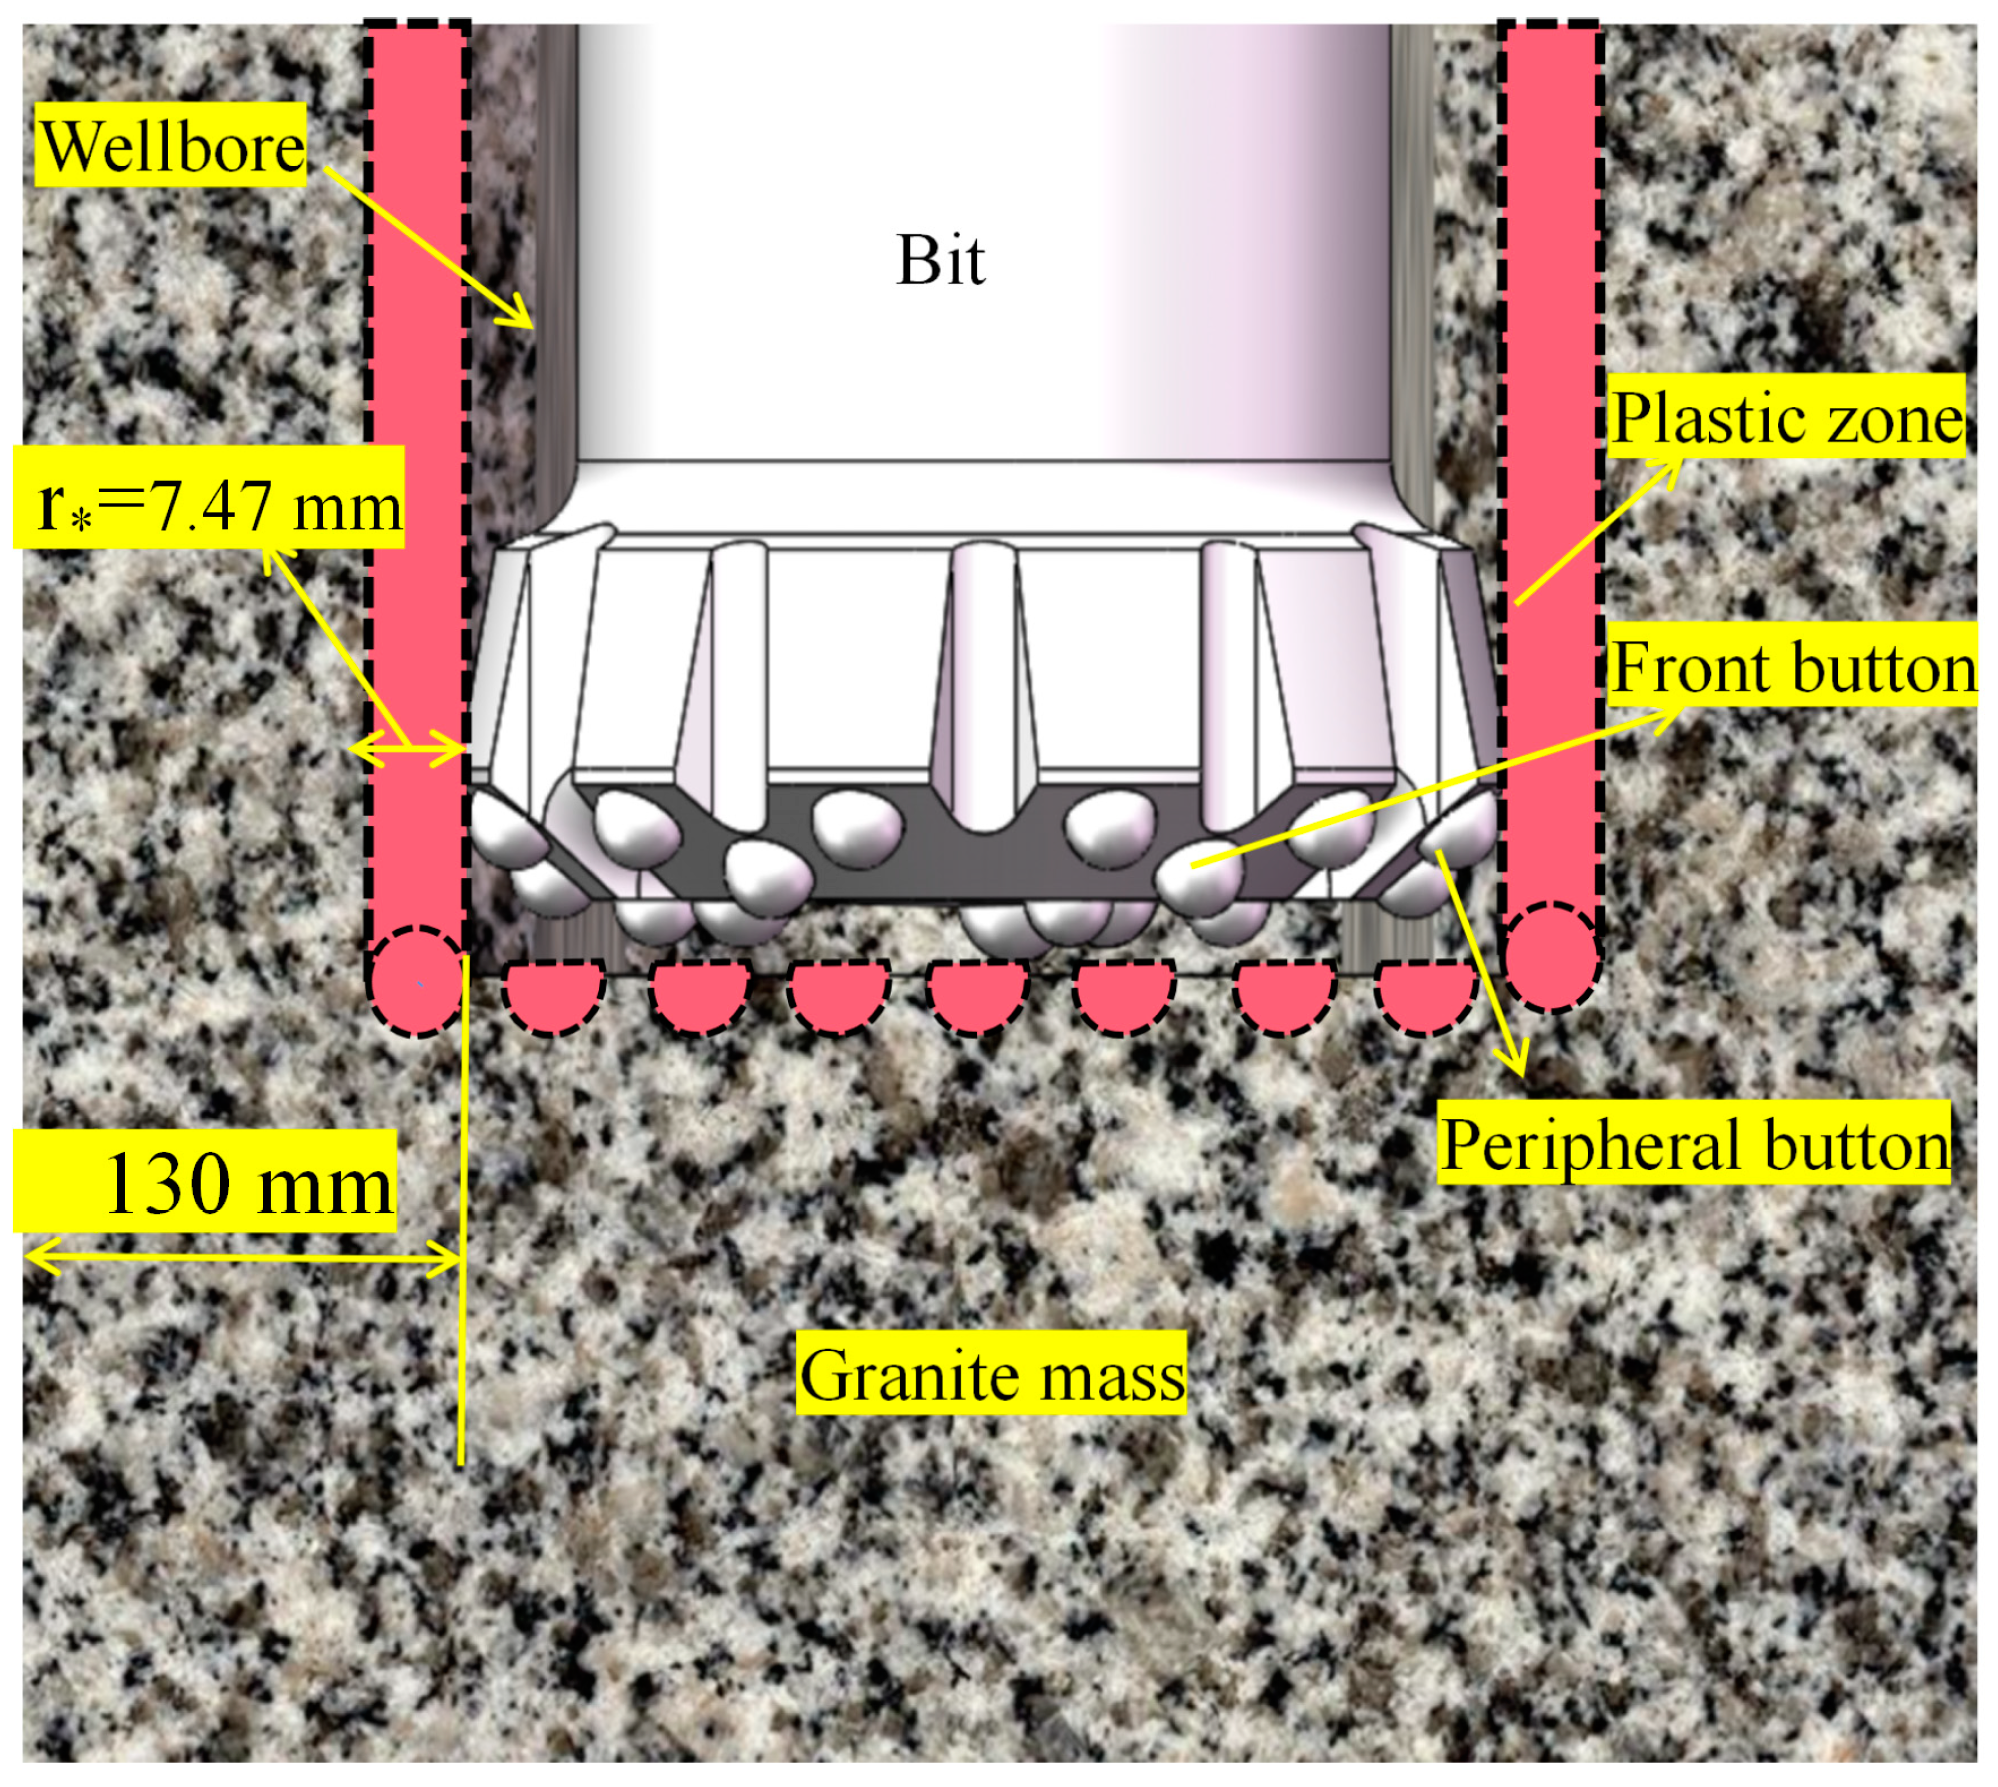
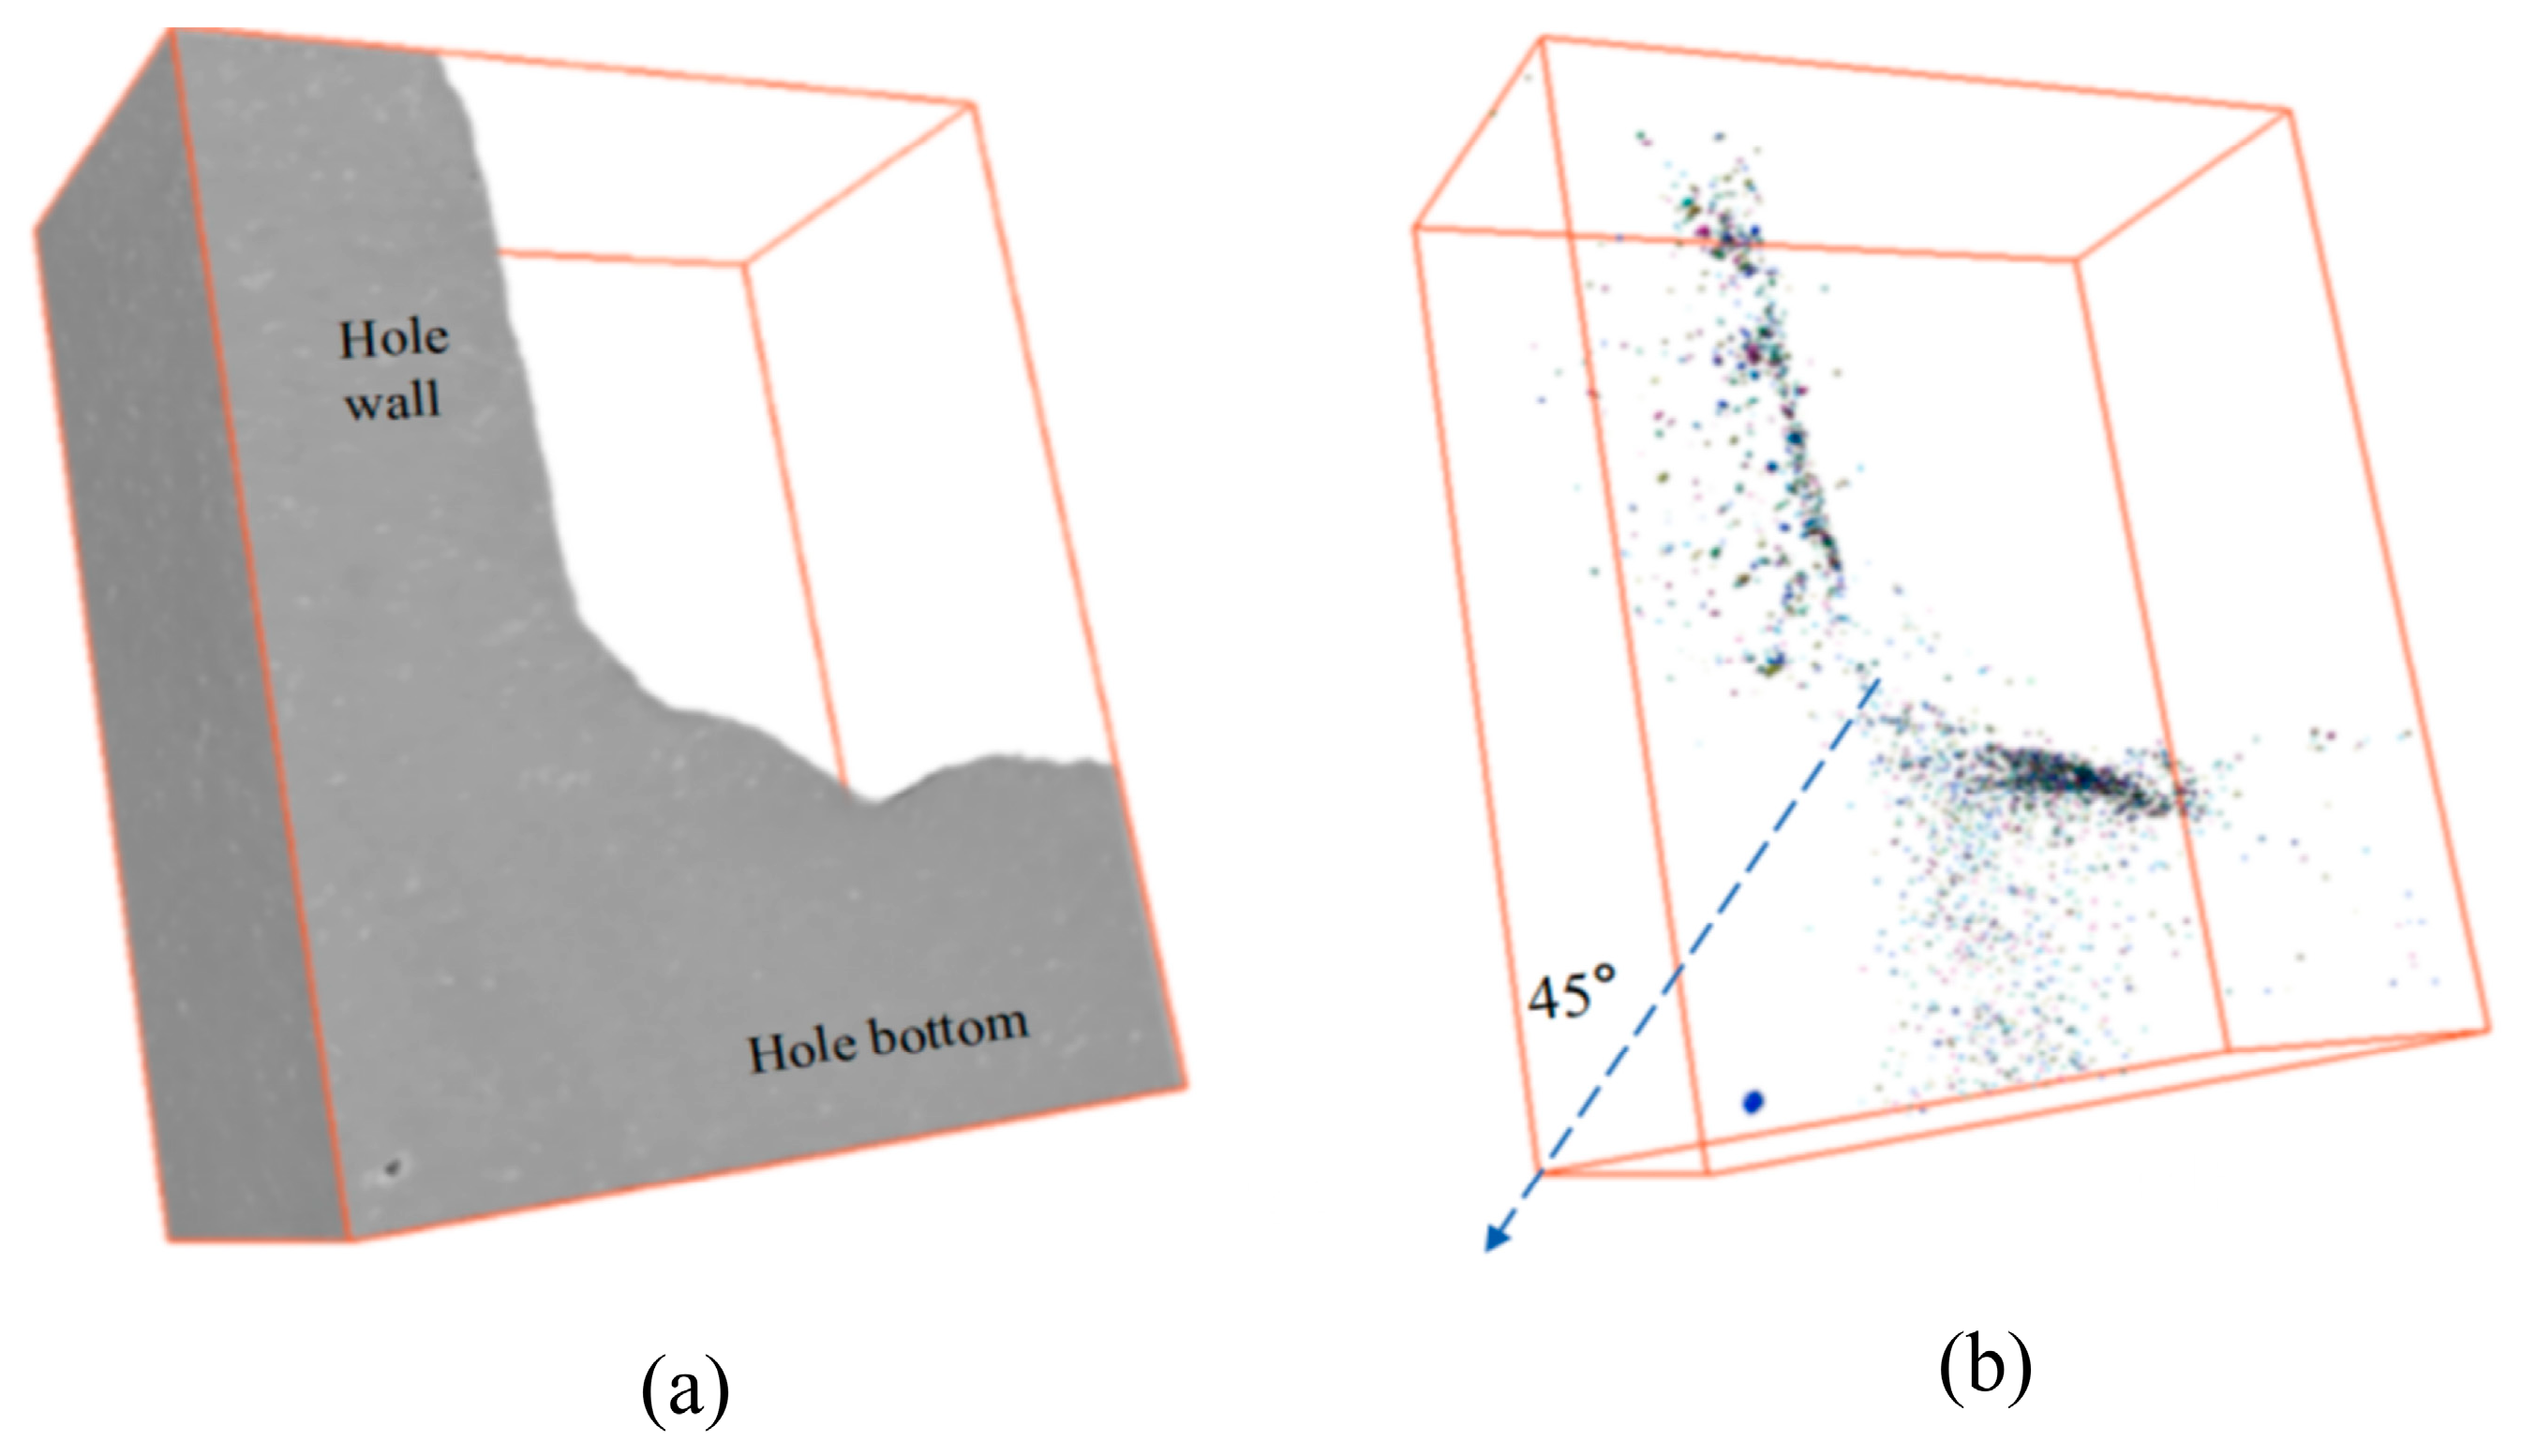
3.1. Analysis of Fracture Distribution around the Wellbore
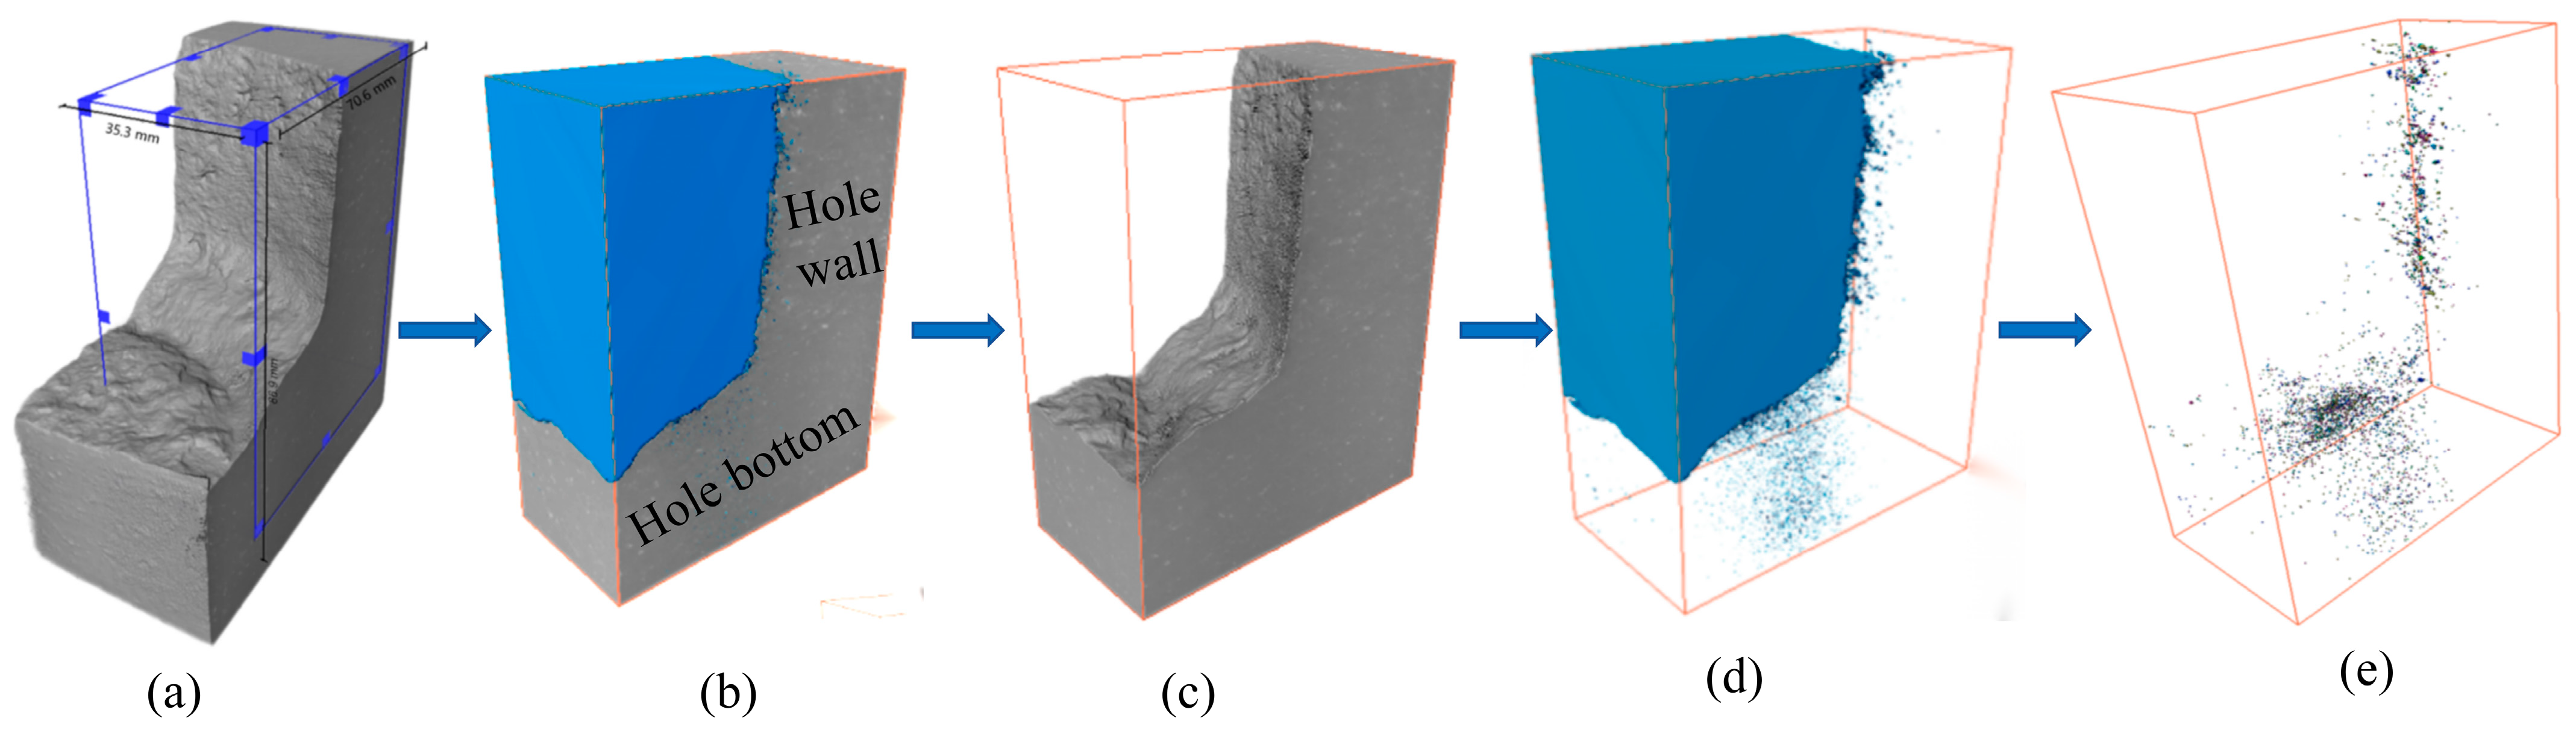
In order to eliminate errors caused by visual observation, we took photos of rock slices and processed them by adjusting the contrast to observe the staining area more clearly. The staining results are shown in Figure 10. From the staining results of rock block 1 (Figure 10(1)), it is evident that the color of the cracks on the stained healthy wall becomes more pronounced as the distance between the cracks and the borehole becomes closer, and the development of the cracks is better. The dyeing effect is relatively uniform and distributed in a regional pattern, roughly divided into three regions: 0–10 mm, 10–20 mm, and 2035 mm.
The dyeing effect is perfect within a range of about 0–10 mm near the wellbore, almost in a consolidated state. There should be many impact cracks in this area, with high density and continuity, making it a highly developed area for cracks. The dye color depth within the range of 10–20 mm from the hole wall gradually transitions to a light color, indicating that there are still many cracks within the range. However, they are not completely dense, and the cracks have developed but gradually become excessively weak, forming a crack development zone.
At a distance of 20–35 mm from the drilling hole, some cracks are still present, but their development is incomplete, and they are in a scattered distribution state. The continuity of the cracks decreases, but there are still areas where they can penetrate smoothly. The staining results of rock blocks 2–4 are the same as those of rock block 1. According to the staining results in Figure 10(6), it can be seen that the staining condition of rotary drilling is relatively uniform. However, the range is tiny and mainly concentrated in an area within 15 mm, and the color is very light compared to the percussion drilling results. It can be seen that ordinary rotary drilling has minimal damage to the rock near the borehole, mainly relying on the permeability of the original rock cracks. From the perspective of the diffusion range, it indicates that the communication between cracks could be more substantial; the capillary effect may not be evident due to the lack of significant cracks caused by impact.

3.2. CT Analysis

From the two CT scanning cross-sectional images, it can be preliminarily found that: (1) there are no visible internal pores and cracks on the pre-drilling rock block (see Figure 11a), and the material distribution in the rock block slices is generally relatively uniform; and (2) after drilling, the rock block (see Figure 11b) exhibits obvious cracks near the wellbore wall and bottom, but there are no visible pore cracks that develop inward.
It is preliminary determined that the scale of the primary pores and cracks inside the granite is small, and the number is insignificant. There are also reasons for insufficient scanning accuracy. However, this also fully shows that the macroscopic visible breakage of the rock wall position after drilling is simply caused by the impact, and the effect is very obvious.
The disturbance of drilling holes can produce apparent cracks on the granite surface, but there is almost no obvious inward extension. It is speculated that micropores mainly cause the disturbance of drilling holes in the rock’s interior. Therefore, Avizo 9.0 software was used to perform a 3D reconstruction of its CT results, and the reconstructed 3D pore model was used for observation and analysis. The results are shown in Figure 12.
It can be seen from Figure 13 that the distribution of rock pore structure from near to far from the wall and bottom of the well is from many to few, and such pore structure is the result of fracture formation caused by percussion drilling. The impact action causes denser pores in the rock at the bottom of the well. It extends deeper inward, indicating that under drilling disturbance, the rock at the bottom of the well is more affected by the disturbance than the rock at the wall of the well. The pores inside the rock are roughly distributed inward along a direction perpendicular to the bottom and wall of the well. There is almost no pore distribution along the 45° downward direction (blue arrow in Figure 13b), indicating that the rock in the direction of 45° outward along the drilling axis is the least disturbed during drilling operations.
Quantitative analysis of micropores in granite disturbed by drilling is conducted through the three-dimensional length, width, volume, and equivalent diameter of pores, and relevant laws are summarized.
According to the measurement results of 53,290 pore objects using Avizo software (as shown in Figure 14), the following is drawn:
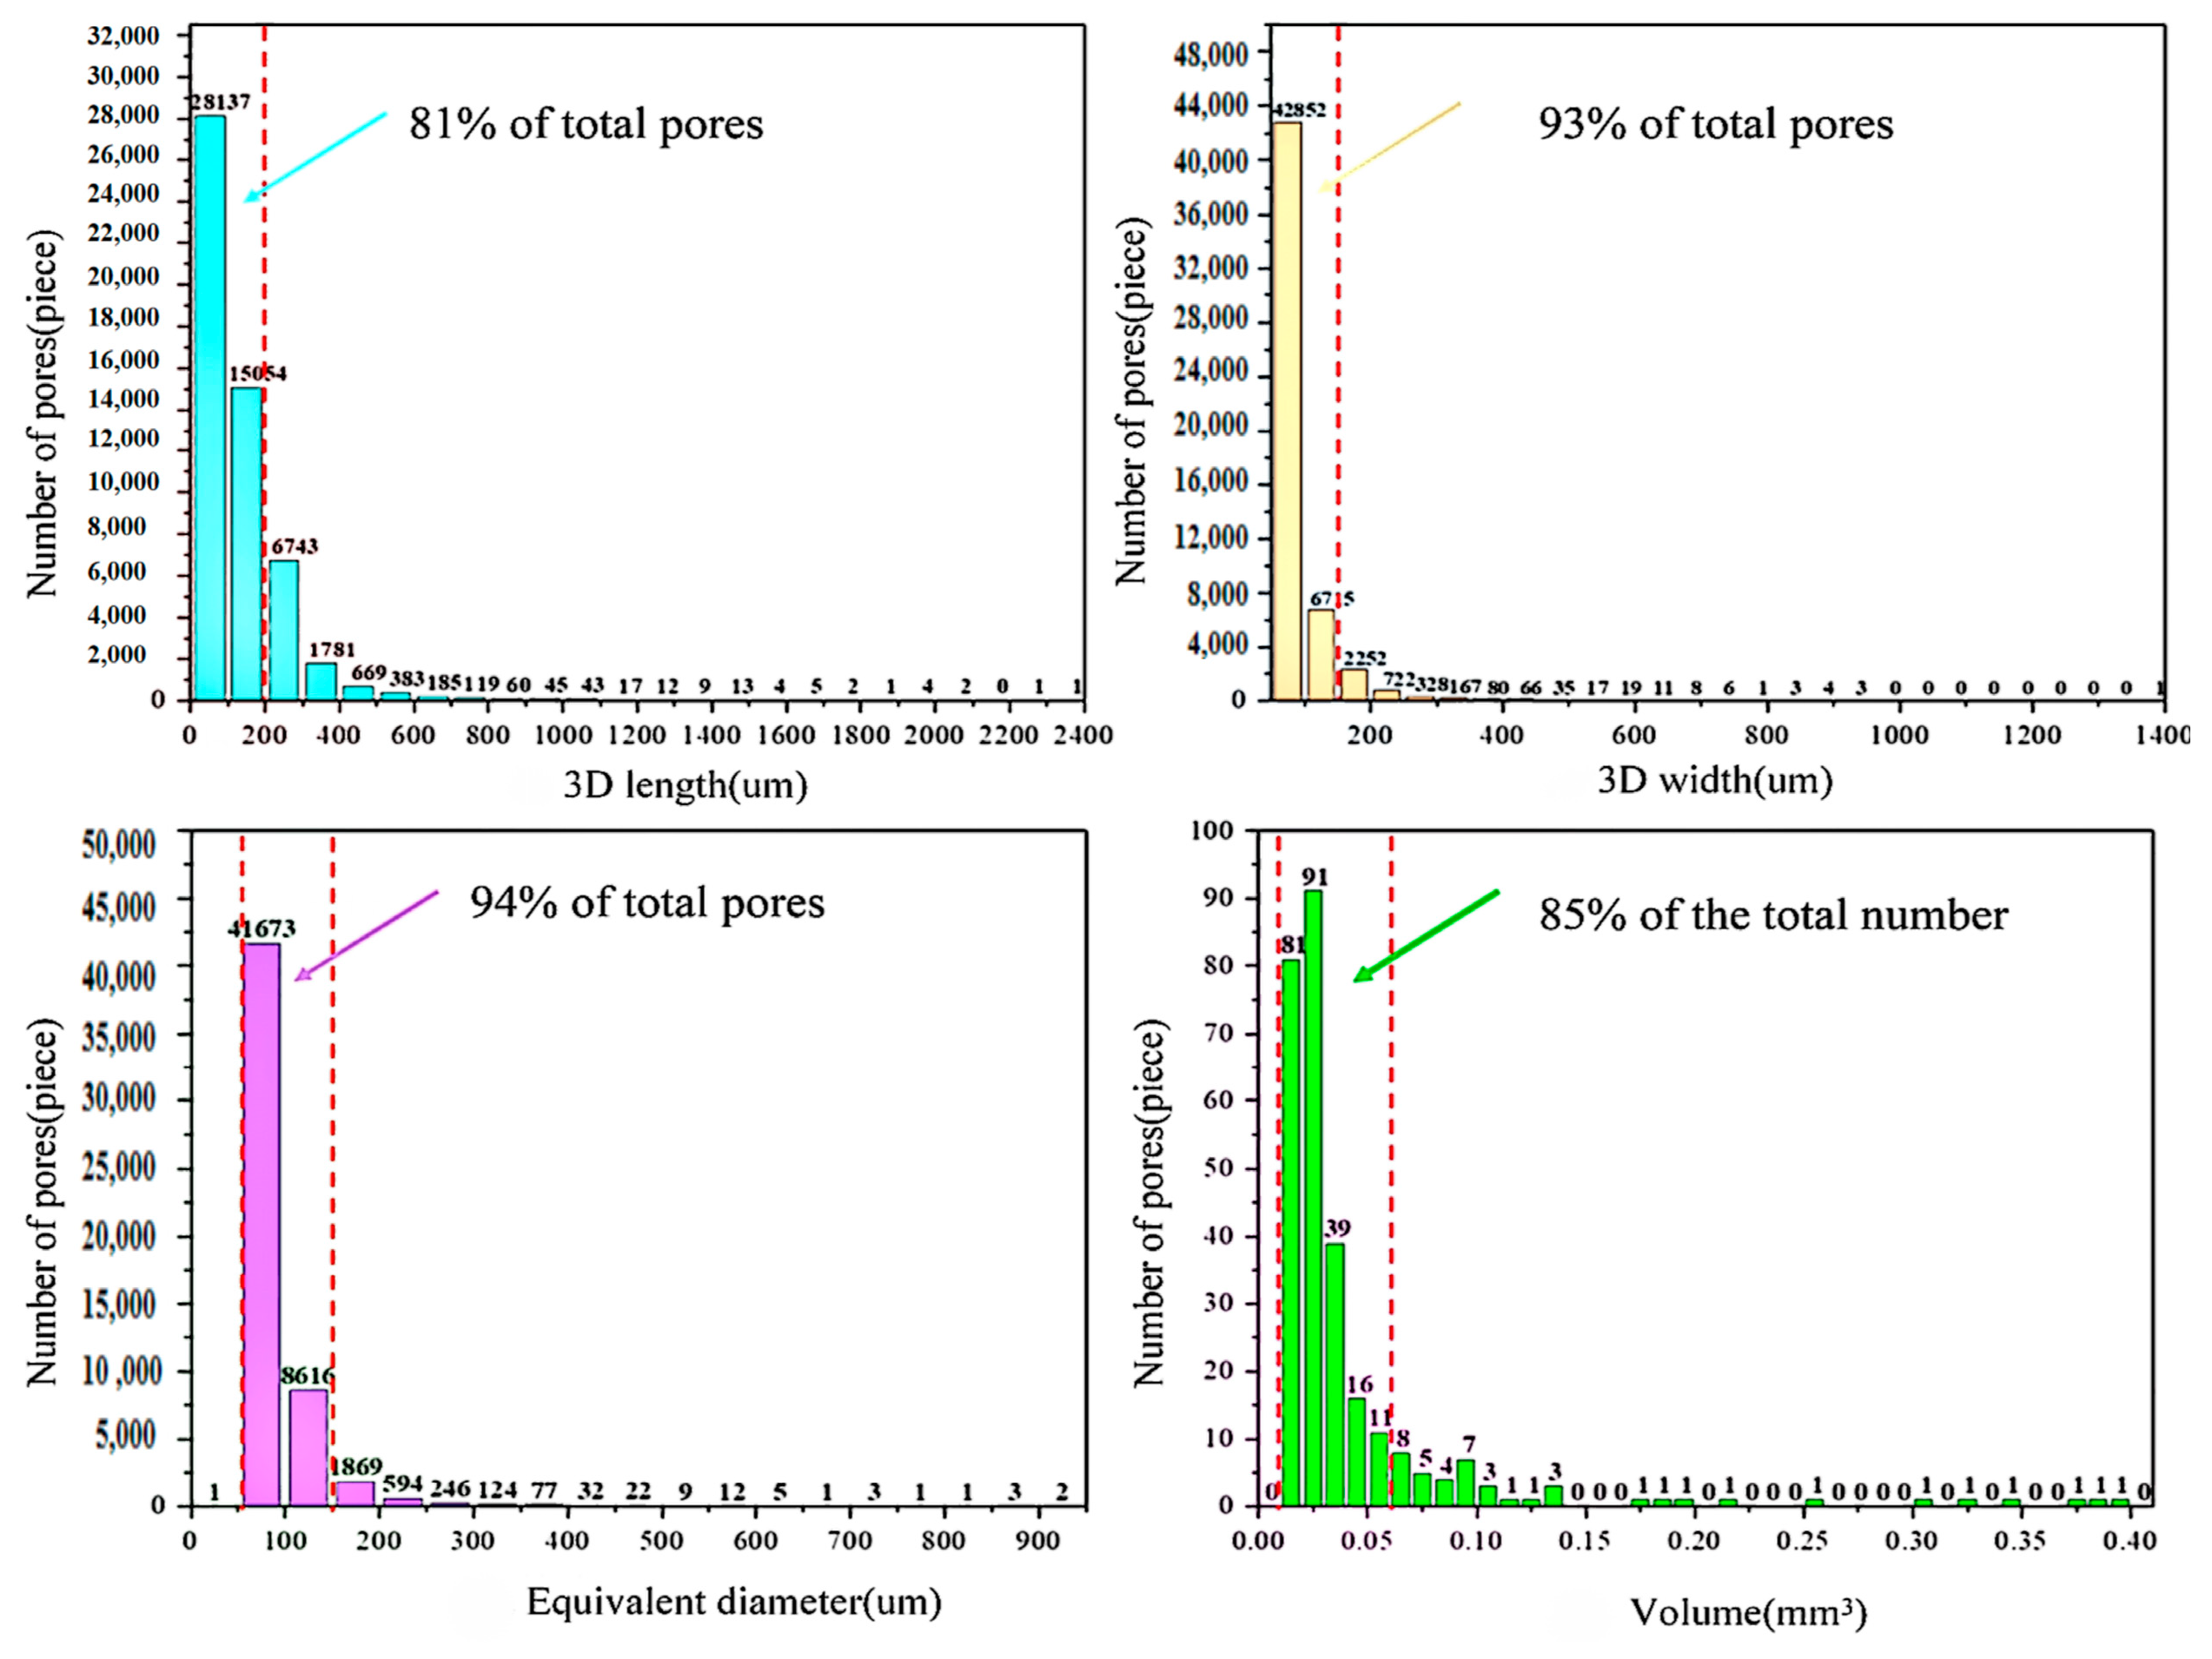
  • The three-dimensional length distribution of pores ranges from 0.06 to 2.38 mm, with pores smaller than 0.2 mm accounting for approximately 81% of the total number, and the number of pores shows a significant decreasing trend with the increase in three-dimensional length.
  • The three-dimensional width distribution of pores ranges from 0.06 to 1.36 mm, with pores less than 0.15 mm accounting for about 93% of the total number, and the number of pores shows a significant decreasing trend with the increase of three-dimensional width.
  • The equivalent diameter distribution of pores ranges from 0.06 to 0.91 mm, with pores ranging from 0.05 to 0.15 mm accounting for approximately 94% of the total number. The number of pores decreases significantly with the increase in equivalent diameter.
  • The volume distribution of pores ranges from 0.00016 to 0.4 mm3, with pores with a volume less than 0.01 mm3 accounting for over 99%. Among pores with a volume greater than 0.015 m3, 85% are pores with a volume between 0.015 and 0.06 mm3. After a volume greater than 0.04 mm3, the number of pores decreases sharply.
  • After drilling experiments, the porosity of the granite block increased from 0.0025% to 0.03%, and the porosity increased by about 12 times.
From this, it can be seen that the internal pores of granite caused by drilling disturbance are mainly micropores, and the number of pores sharply decreases after the critical point where the pore size exceeds about 0.15 mm, with smaller pores being the primary type. The air DTH hammer impact experiment can significantly improve the porosity of granite.
Scanning the complete rock sample shows that the crack size is considerable and can be directly recognized by the naked eye. According to the results of microscopic crack scanning, the connection between large cracks is also connected by smaller pore structures. The distribution of rock pore structure from near to far on the wellbore wall ranges from more to less, and from near to far on the bottom of the wellbore, also from more to less, confirming that this type of pore is the result of impact drilling and fracturing.
Impact fracturing causes more and denser pores in the rock at the bottom of the well, with a greater depth extending inward, indicating that the impact on the bottom of the borehole is more intense and the rock at the bottom of the well is more affected by impact disturbance than the rock at the wall of the well. The development of wellbore cracks is consistent with the permeability test, indicating the main direction of crack communication. The pores inside the rock develop roughly along the direction of the drilling axis at the bottom of the hole or perpendicular to the direction of the drilling axis towards the hole wall. The compaction zone and crack zone have a more pronounced effect at the bottom of the hole, and the development effect of lateral and radial cracks on the rock sample on the hole wall is pronounced. When identifying pore structures more significant than 50 microns, the increase in porosity is much more significant than the results of permeability testing, indicating that the cracks drilled by impact are more extensive than the original cracks. Based on the staining results, it is indicated that the crack size inside the granite wellbore is not necessarily a case of a single crack with a larger size continuously extending but rather a form of more minor cracks communicating with larger pores.

3.3. Analysis of Mechanical Test Results

3.3.1. Uniaxial Compression Test

Test standard adoption: GB/T50266-2013, “Standard For Test Methods of Engineering Rock Mass”. The average uniaxial compressive strength of rock samples at different sampling locations was calculated according to the failure stress after multiple groups of tests, as shown in Table 5.
The average uniaxial compressive strength of rock samples at different sampling locations was calculated according to the failure stress after multiple groups of tests to the method suggested by the International Society for Rock Mechanics (ISRM) [46], as shown in Table 5.
According to the results of uniaxial compressive strength testing, the strength of rocks at all four locations has decreased to varying degrees compared to the original rock sample. The strength of rock samples near the borehole wall has decreased by 13% compared to the original rock sample, while the proportion of rock samples far from the borehole wall has decreased by only about 5%. The strength of the rock sample at the orifice decreased by about 20%, while the strength at the bottom of the borehole decreased by 28%.
The strength of the rock samples near the borehole wall decreased significantly compared to those far from the borehole wall, and the impact damage effect was more substantial. The average strength of the granite decreased by 16.5%. Due to the strong impact on the rock samples at the bottom of the hole, the analysis shows that, due to the high efficiency and fast drilling of the impact, most of the rock samples at the mouth of the hole develop lateral and radial cracks. However, the position of the bottom of the hole is continuously affected during the early impact, resulting in more damage to the rock samples at the bottom. Further proving that the damaging effect of impact on the wellbore rock is pronounced.

3.3.2. Permeability Testing

The average permeability values of rock samples at different sampling positions obtained from permeability tests after multiple sets of experiments to the method suggested by the International Society for Rock Mechanics (ISRM) [46] are shown in Table 6.
According to the permeability test results, it can be observed that the permeability near the borehole wall has significantly improved compared to the original permeability. Overall, regardless of the distance from the borehole wall or the depth at which it is located, except for the permeability improvement of only 7% at the far borehole wall position, the permeability improvement of the remaining rock samples is 30% at the mid borehole position, 60% at the near borehole wall position, and more than 100% at the pore mouth. The porosity of granite has increased by an average of 9.5%, and the permeability has increased by an average of 63.3%. The results indicate that the impact has a significant enhancing effect on the development of cracks at the wellbore location.

3.4. Numerical Analysis of Impact Stress Waves

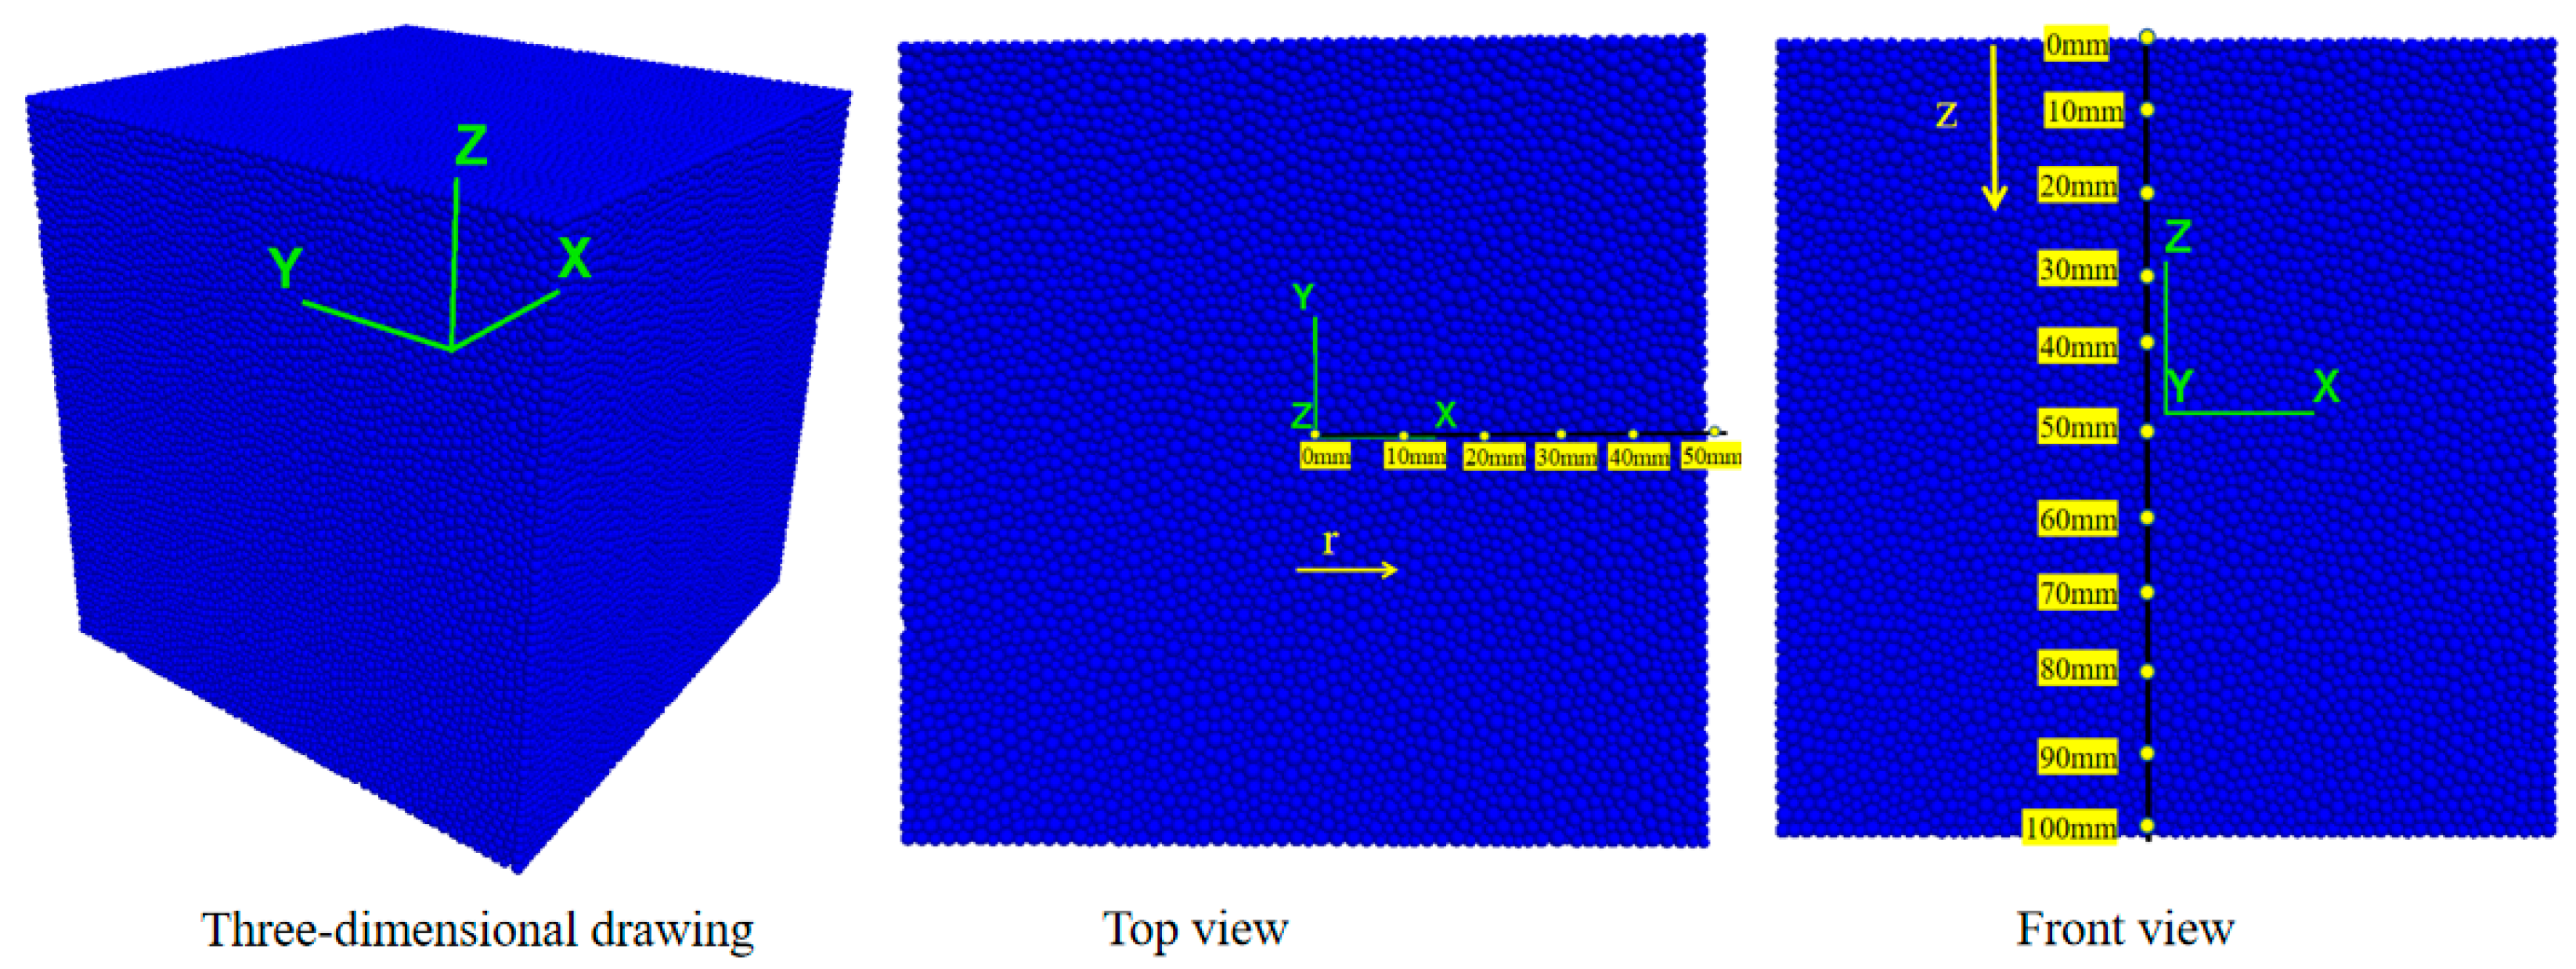
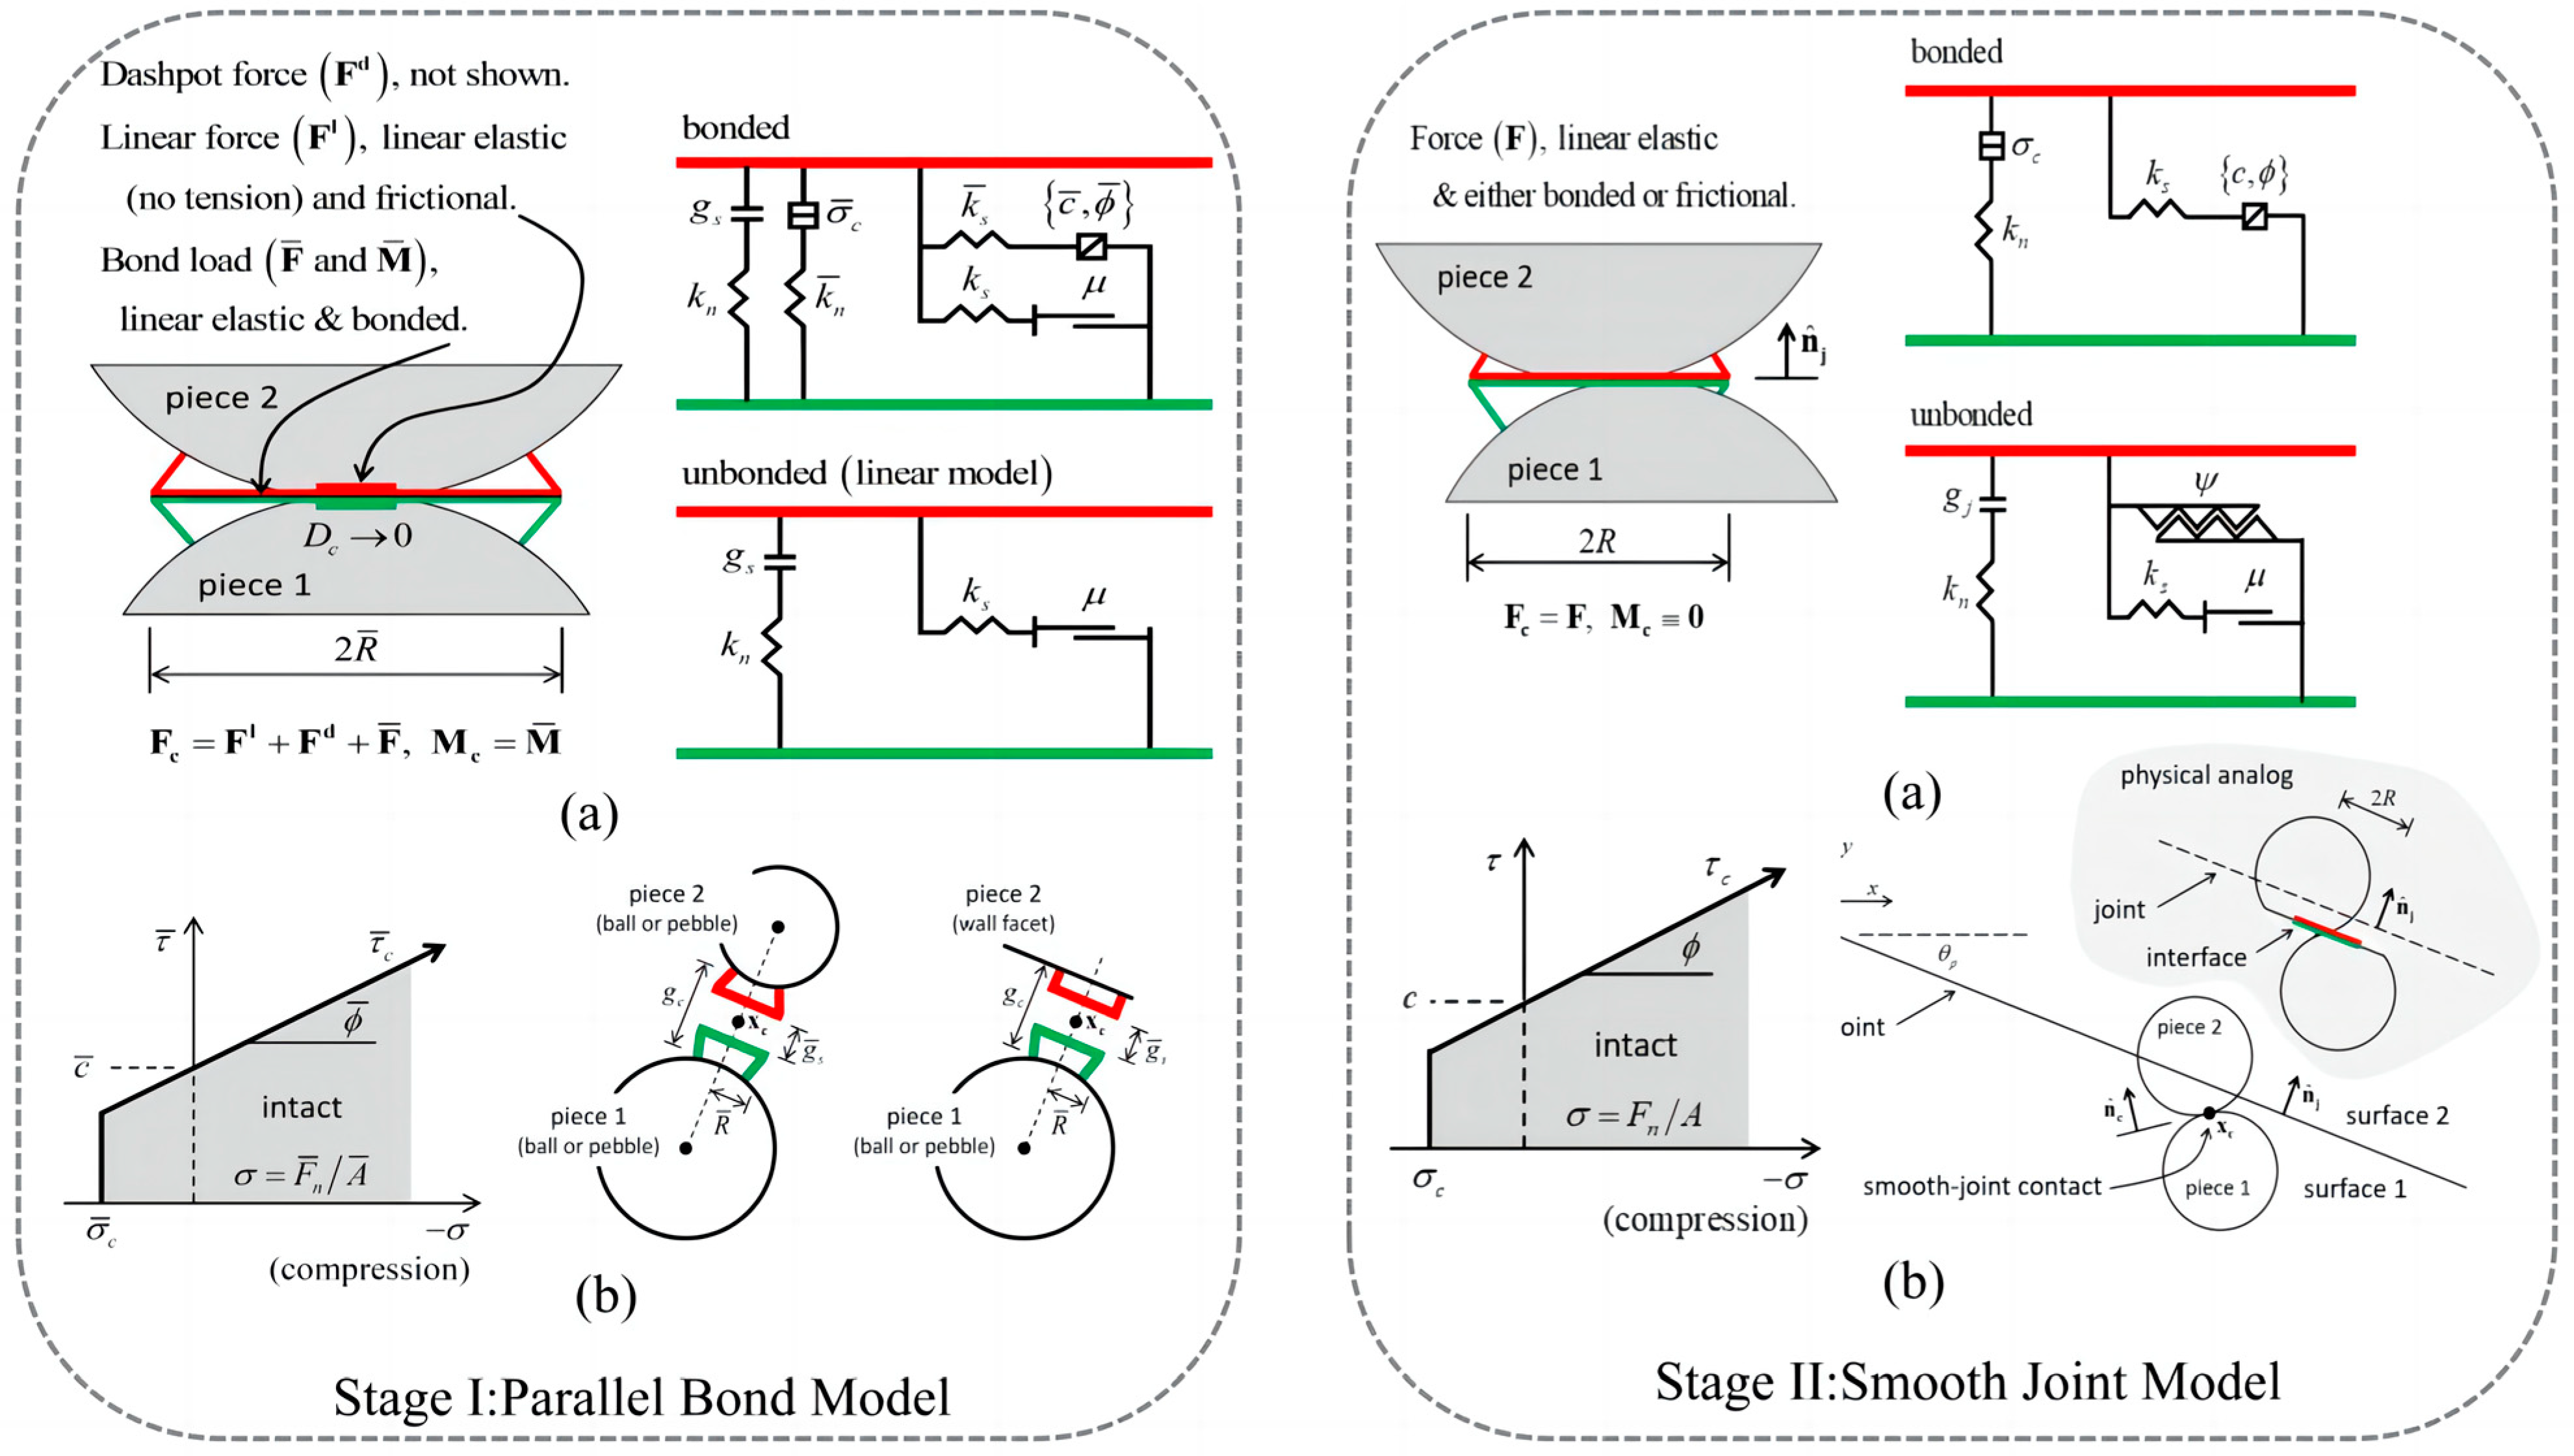
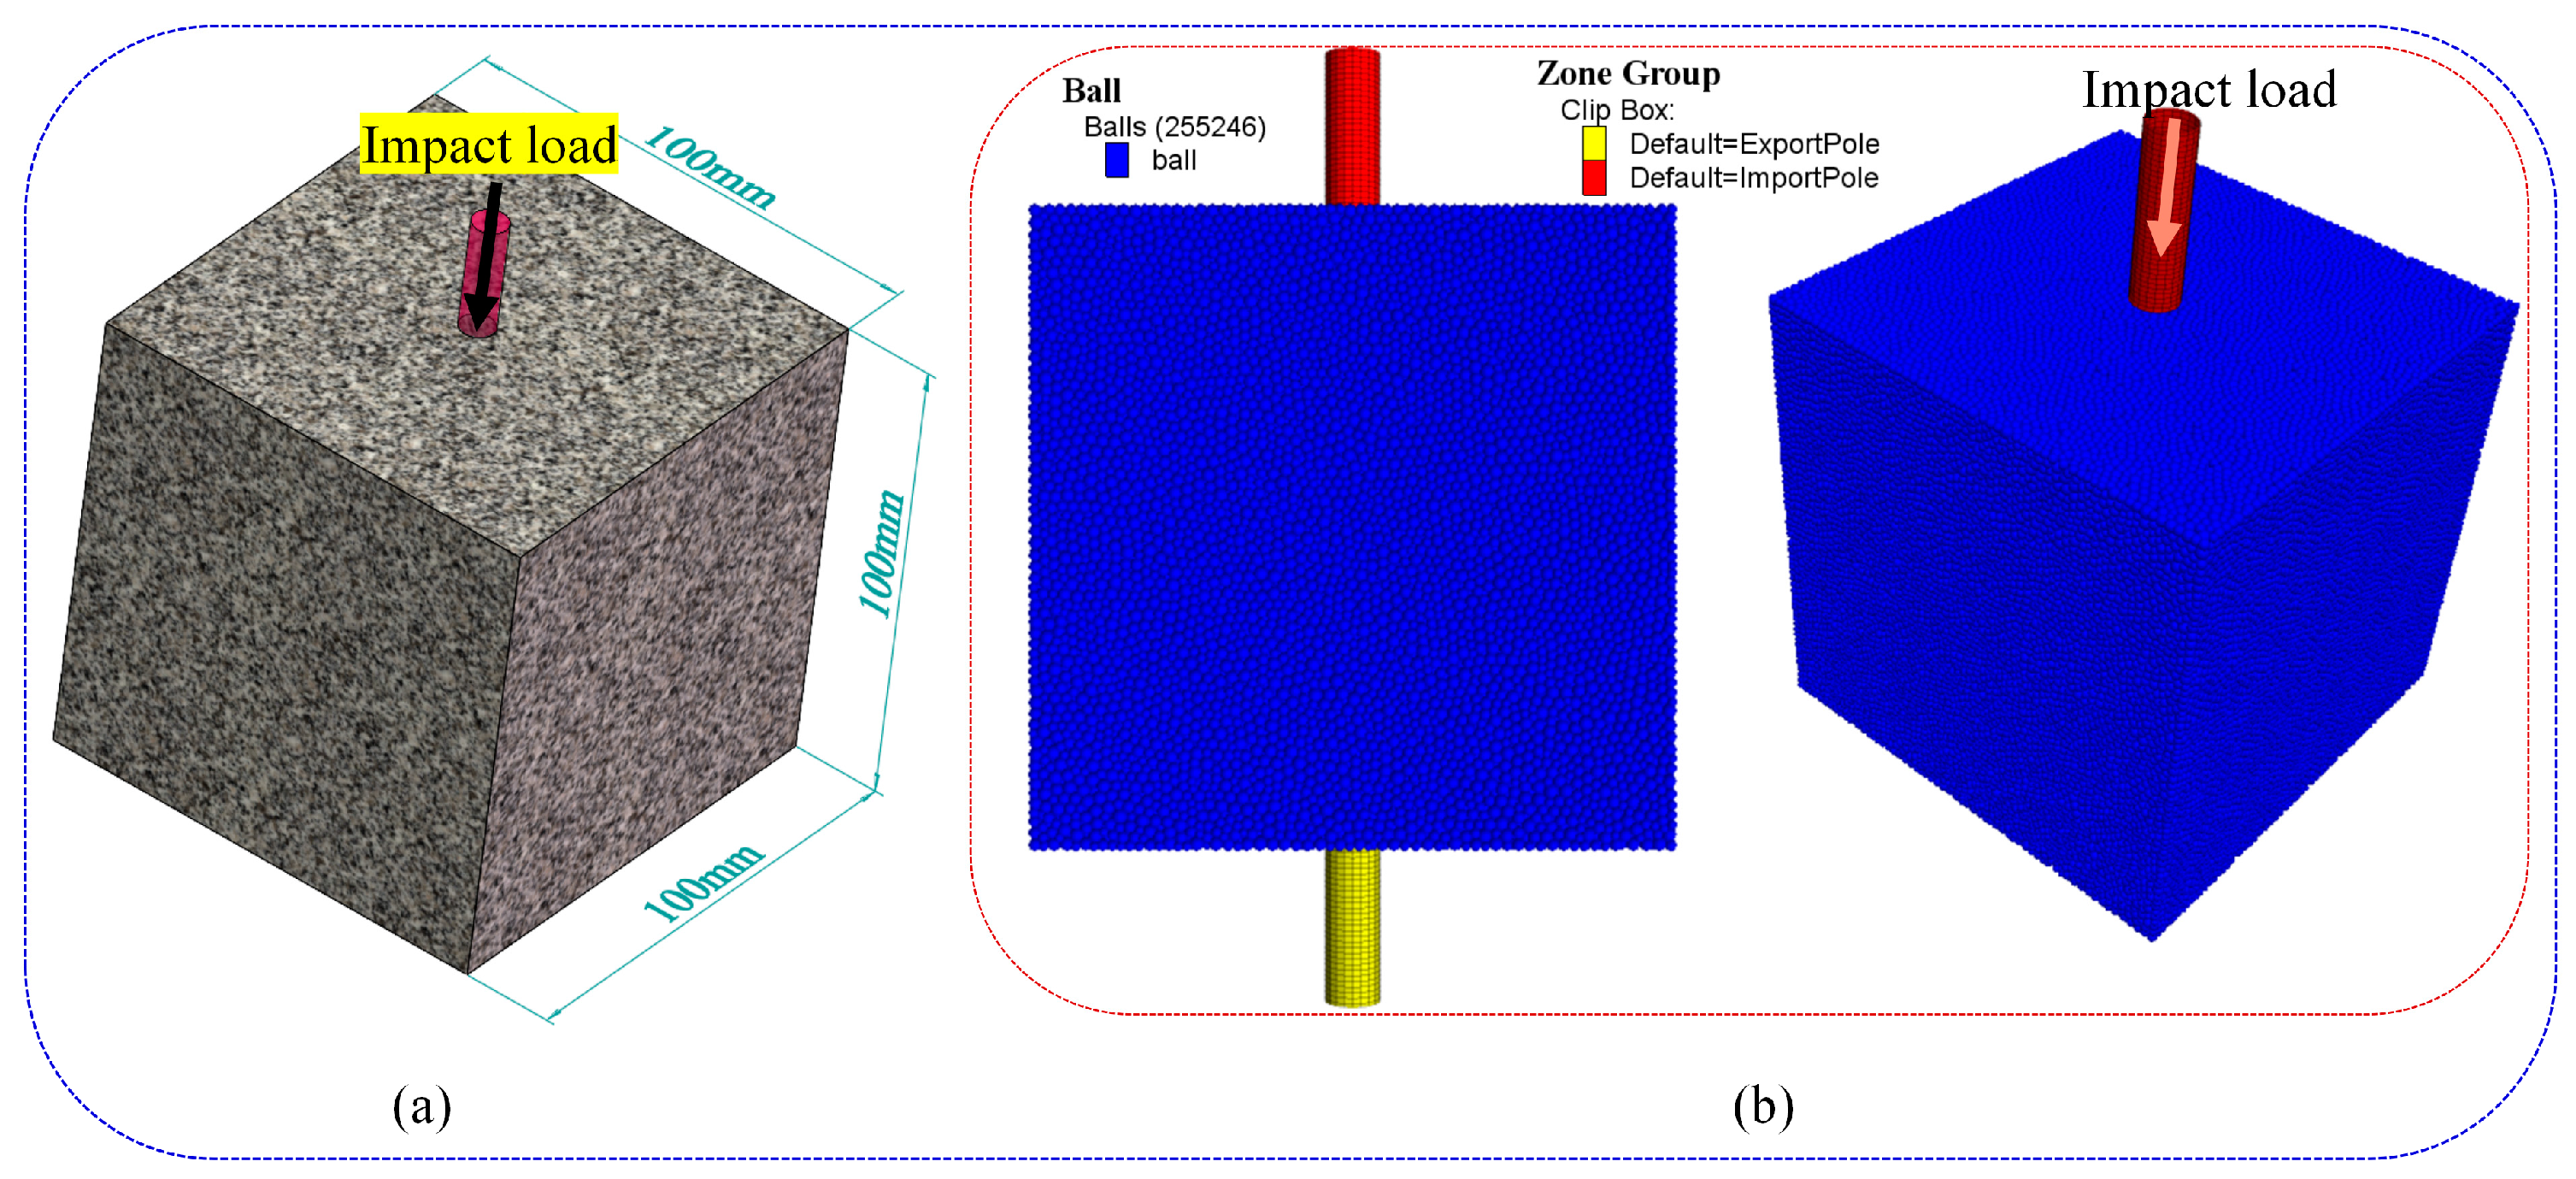
3.4.1. PFC3D-GBM Establishment Method Based on the Real Mineral Composition of Granite

The grain-based model (GBM) based on the discrete element method (DEM) is a powerful approach to representing the deformable and breakable micromechanical characteristics of a grain-based rock such as granite, marble, and salt rock. Until now, several different grain-based models based on different DEM 2022 R2.0 software have been proposed for 2D and 3D simulations, such as UDEC-GBM, 3DEC-GBM, PFC2D-GBM, and PFC3D-GBM. Mineral composition and grain distribution characteristics play a key role in the mechanical and failure characteristics of grain-based rocks. In this paper, a PFC3D-GBM model is generated based on the real mineral composition of the granite in the test. The particles were contacted through a linear parallel bond model (see Figure 15), and the microscopic parameters used in the model are shown in Table 7. This model is then followed by uniaxial compression and Brazilian splitting tests. The numerical simulation results agree closely with the experimental results, with an error of about 5%, as shown in Table 8. Therefore, the calibrated parameters can simulate the mechanical behavior of granite.

3.4.2. Simulation Process

Simulate the impact stress wave of granite using the commercial software PFC3D6.0 to explain the distribution of cracks. This article simulates granite rocks’ transient wave propagation characteristics under short-term surface impact force. The following model is established using the microscopic parameters in Section 3.4.1. As shown in Figure 16, the geometric shape of the model is a cube. In order to improve computational efficiency, a side length of 100 mm was taken, consisting of 255,246 particles with particle sizes between 0.6 mm and 1 mm. Subsequently, a fixed constraint wall is applied at the bottom, and the upper surface is treated as a free surface. The mechanical relationship between the zone and the ball is achieved through wall zone coupling in the software to apply the impact load. That is, a stress of 250 MPa is specified at the end of the incident rod (see Figure 15(b)), lasting for 200 μs, and then 1000 μs is calculated after contacting the boundary conditions. The propagation characteristics of waves in the block through transient research, the stress propagation curve in the rock was obtained (see Figure 17) and the displacement cloud map of the rock were simulated (see Figure 18). At the same time, select particles at different positions in the model and arrange the particle positions as shown in Figure 19. Record their motion displacement characteristics in the Z-axis direction (see Figure 20 and Figure 21).

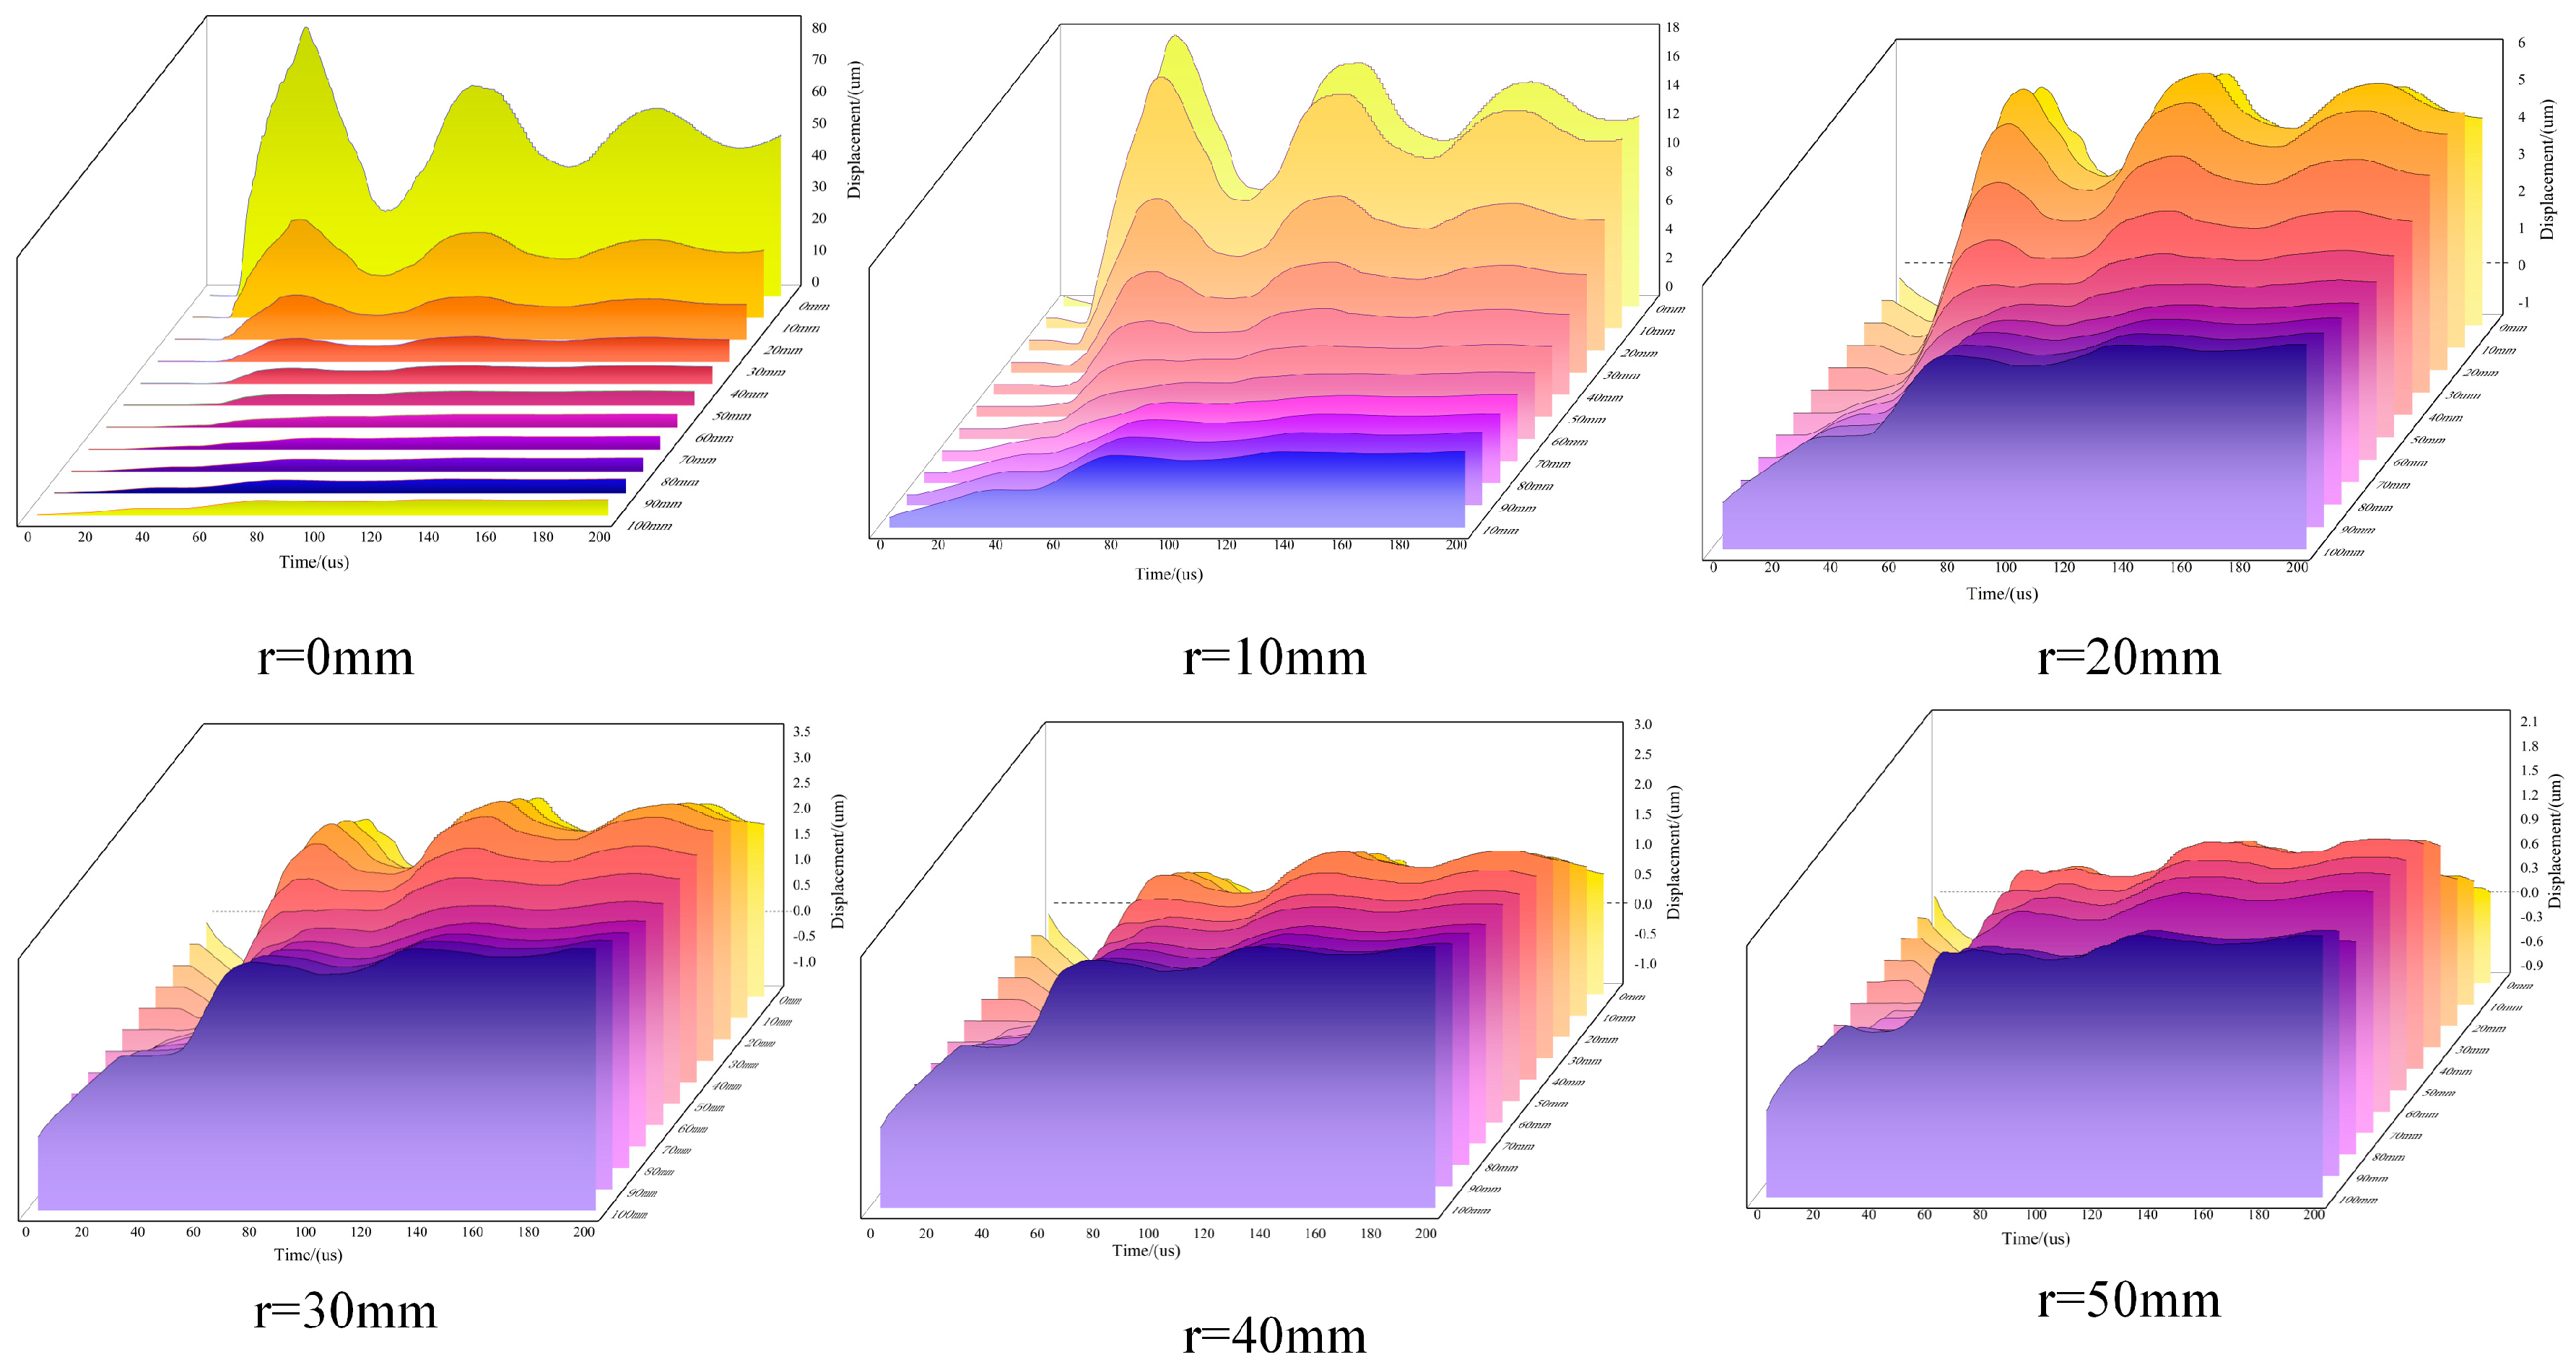
3.4.3. Simulation Result Analysis

During the impact process, the shock force generates a stress wave at the impact location. As can be seen from the stress curve in Figure 17, the output stress value is far less than the input stress value. The propagation mode of the shock wave can be seen from the displacement cloud map of rock mass in Figure 18. The stress wave will constantly diffuse and change in the rock mass but will gradually weaken with the diffusion effect and show the characteristics of regional expansion. It can be seen from the particle displacement curves at different positions in Figure 20 that along the impact force z-axis, the particle displacement gradually decreases when the area radius r = 0–20 mm; the particle displacement maximizes at z = 0 mm, r = 0 mm, and is about 80 μm; when the area radius r = 30–50 mm, the particle displacement gradually increases. At z = 100 mm and r = 30 mm, the particle displacement is the largest, about 2.8 μm. It can be seen from Figure 21 that in the direction perpendicular to the impact force, the displacement of the particle gradually decreases, and the displacement of the particle is the largest at z = 0 mm and r = 0 mm, which is about 80 microns. At z = 100 mm and r = 50 mm, the particle displacement is the smallest, about 0.5 μm. The above phenomena indicate that stress waves propagate to the granite rock mass in an approximate spherical waveform in a very short time. The motion displacement characteristic curves of particles at different positions in Figure 20 and Figure 21 prove the above phenomenon from a microscopic perspective. The displacement curve characteristics of particles are consistent with the stress curve characteristics of rocks (see Figure 17), indicating that stress waves cause a certain degree of displacement damage and deformation on the rock surface.
During the actual impact drilling process, rock pressure is overlying the rock’s surface. Usually, the deformation of this part of the rock mass is relatively small, and the energy carried by these stress waves will lead to internal failure and fracture of the rock mass. The simulation results indicate that over time, the energy of stress waves decreases with the distance from the impact location, and the energy propagates faster along the impact direction compared to perpendicular to the impact direction. The failure of the rock mass also exhibits a regional pattern. The stress wave area in the simulation results agrees with the experimental crack distribution area (see Figure 22). By combining the experimental results with numerical simulation, the propagation of stress waves in rocks was evaluated, revealing the rationality of the crack zoning distribution in the experiment.

4. Conclusions

This article conducted a full-scale drill bit impact rock fragmentation test. It analyzed the actual crack situation quantitatively through staining tests, CT scanning, 3D rock reconstruction, mechanical tests, and numerical simulation analysis. The following conclusions are drawn from the study:
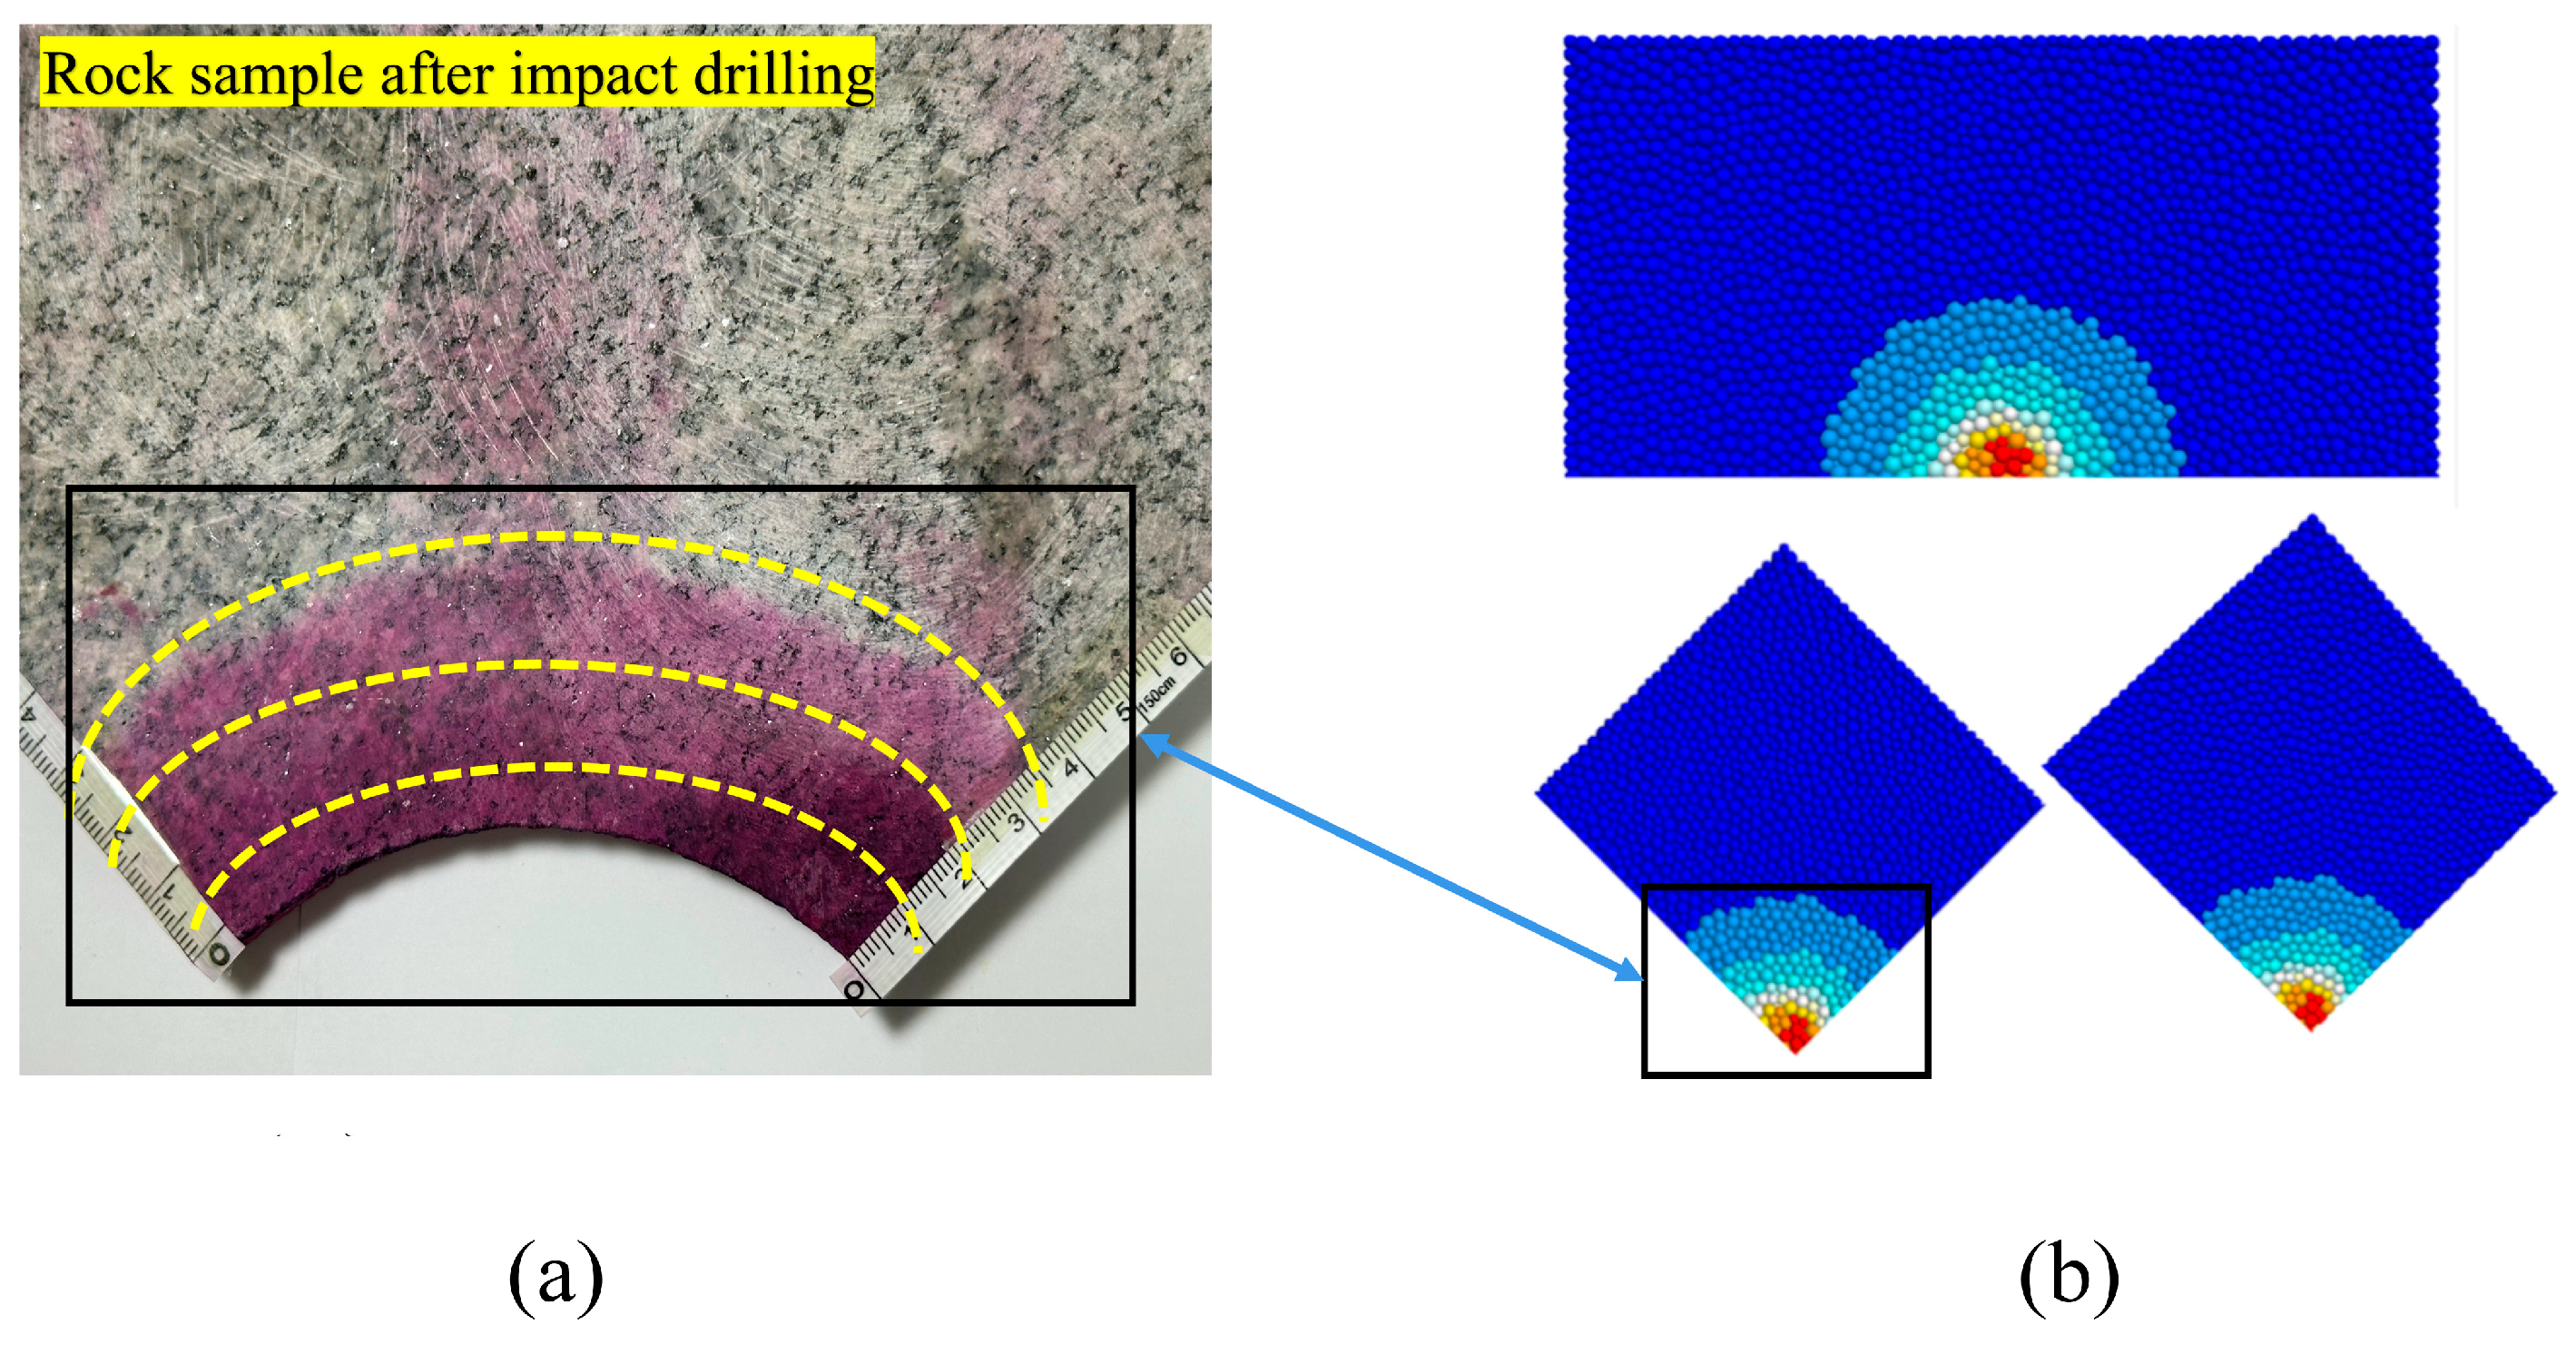
  • The dyeing test and CT results indicate that air DTH hammer drilling can increase wellbore cracks, and the distribution of cracks has a regional feature. Microcracks are distributed from near to far on the borehole wall and bottom, mainly related to the attenuation of impact stress waves. According to the analysis of the three-dimensional reconstruction results, the porosity of the granite block has increased from 0.0025% to 0.03%, and the porosity has increased by about 12 times.
  • The results of mechanical and permeability testing experiments show that the air DTH hammer impact drilling process can reduce the strength of granite around the hole wall and increase porosity and permeability. The average strength of the granite has decreased by 16.5%, from 148.65 MPa to 124.81 MPa. The porosity has increased by 9.5%, from 1.127% to 1.234%. The permeability rate increased by 63.3%, from 0.0546 mD to 0.0891 mD. This further verifies the feasibility of this process for increasing permeability in geothermal mining.
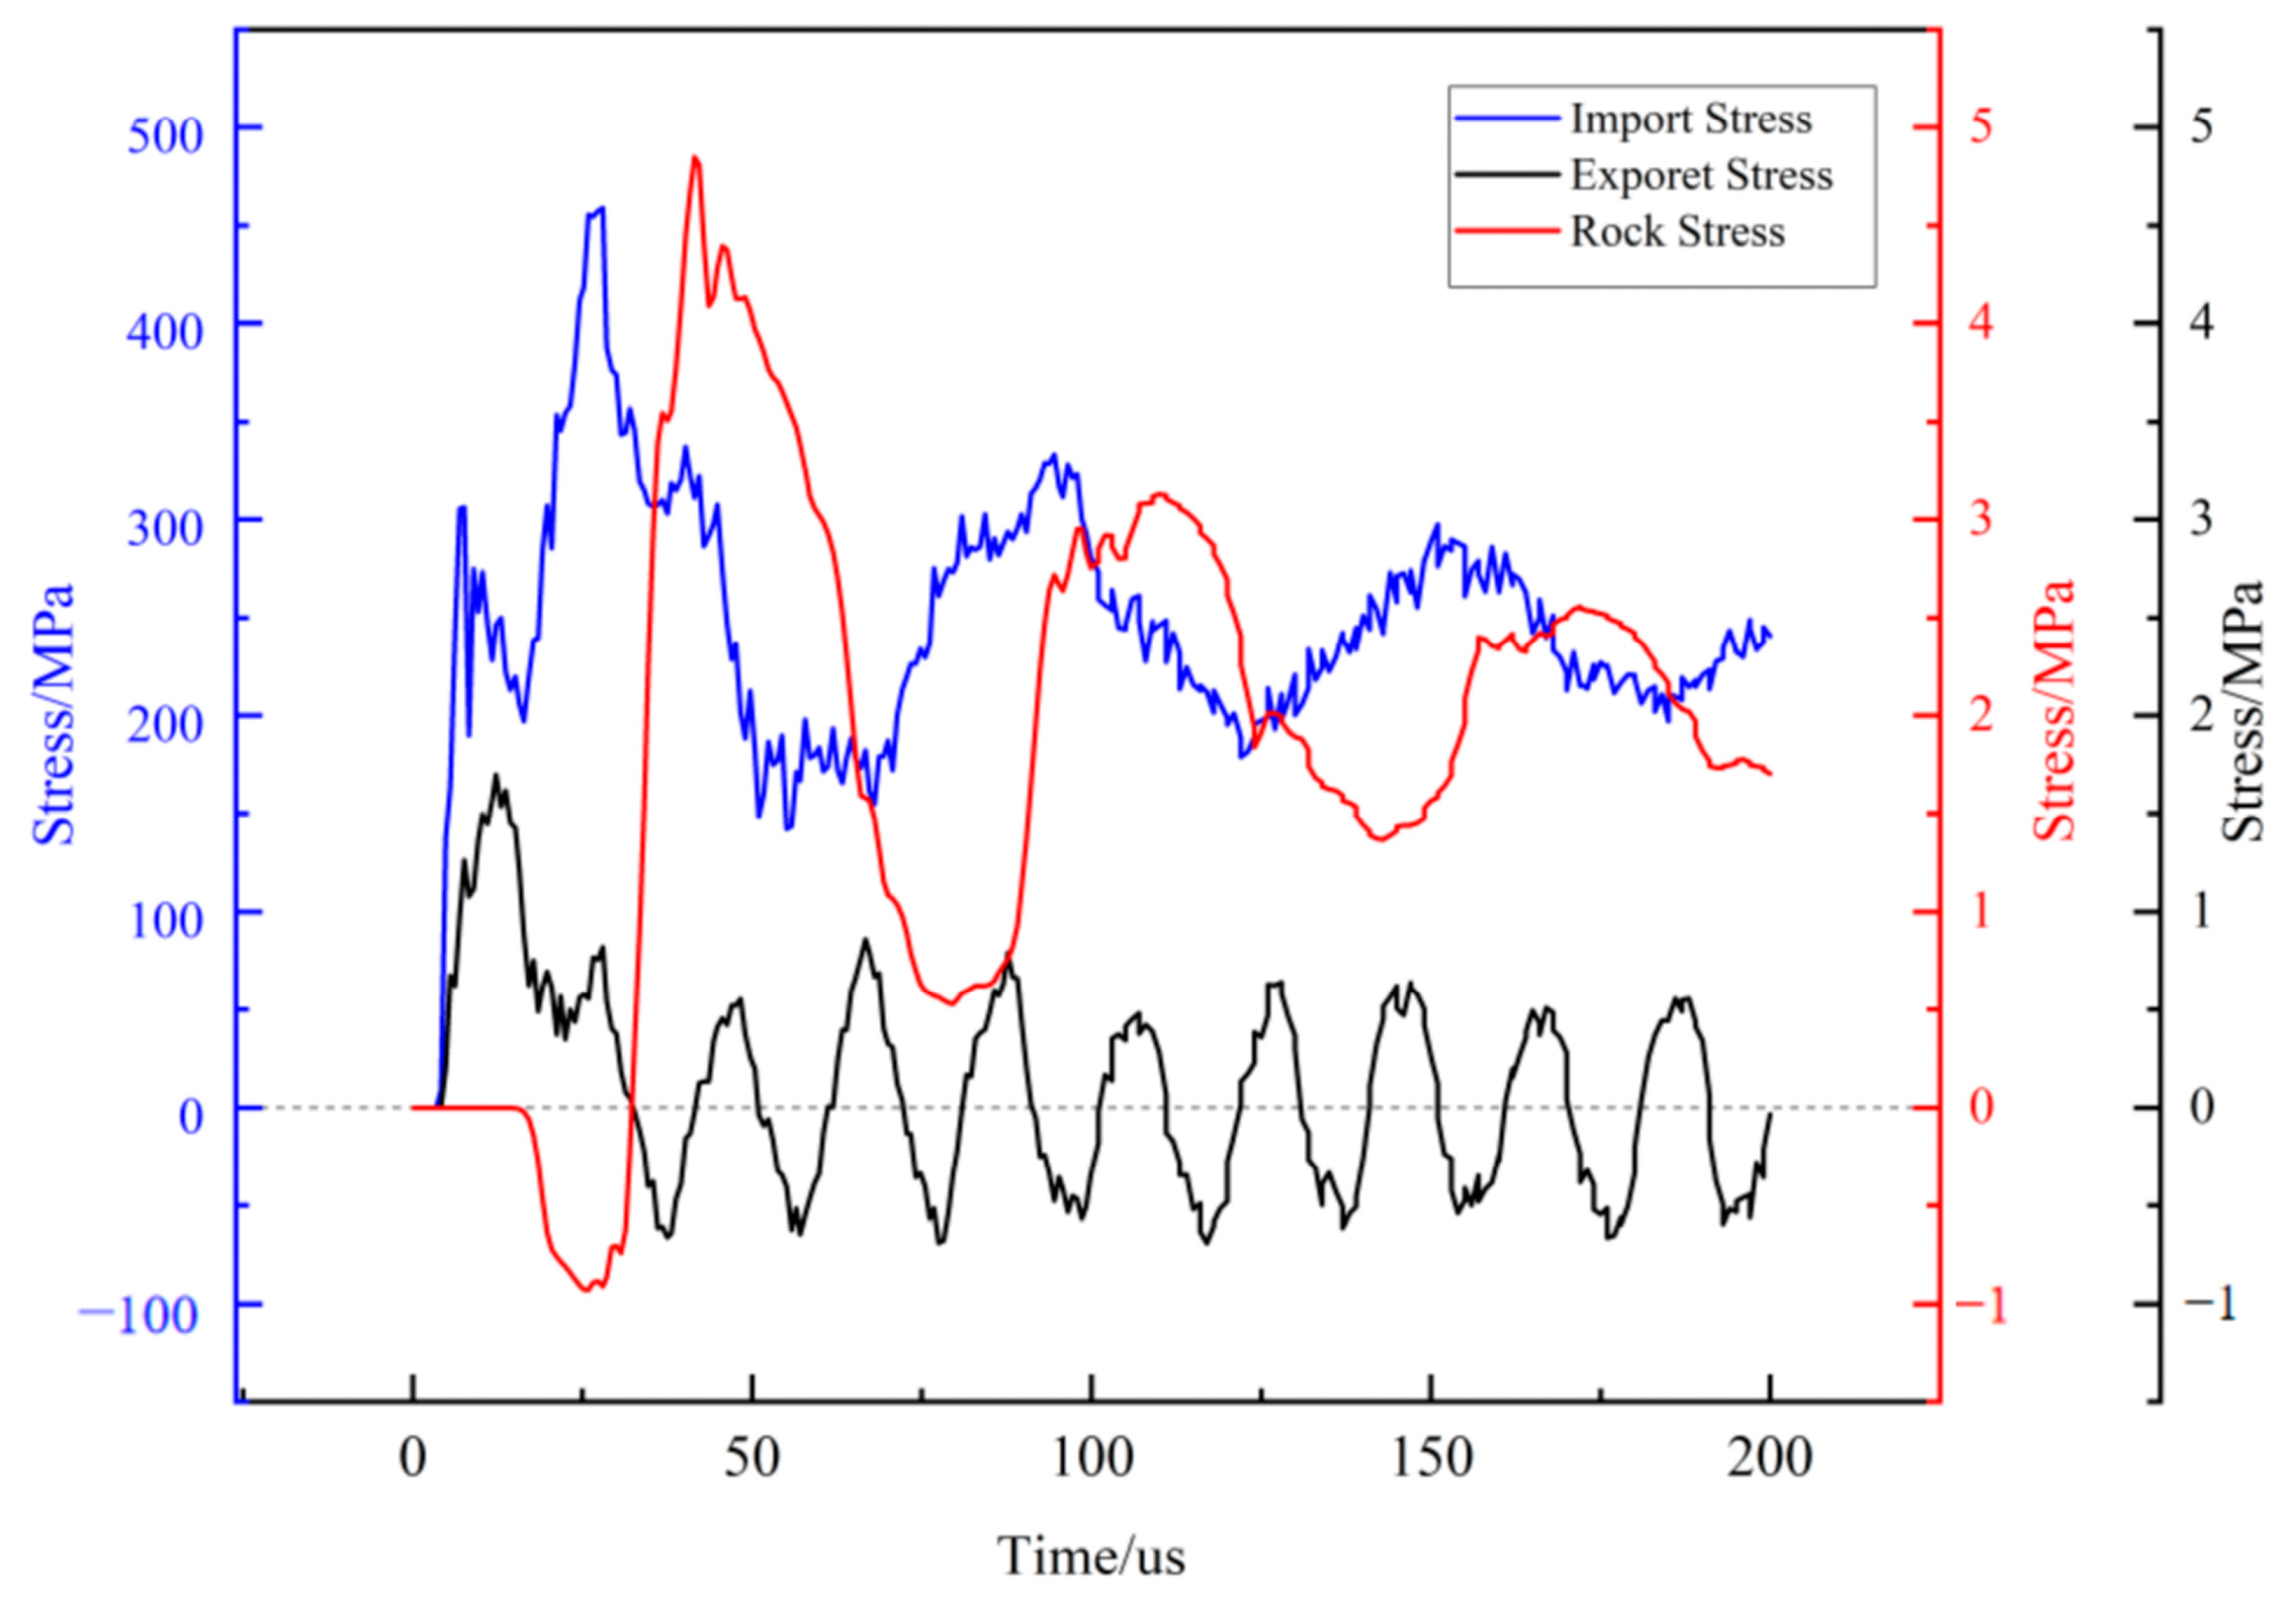
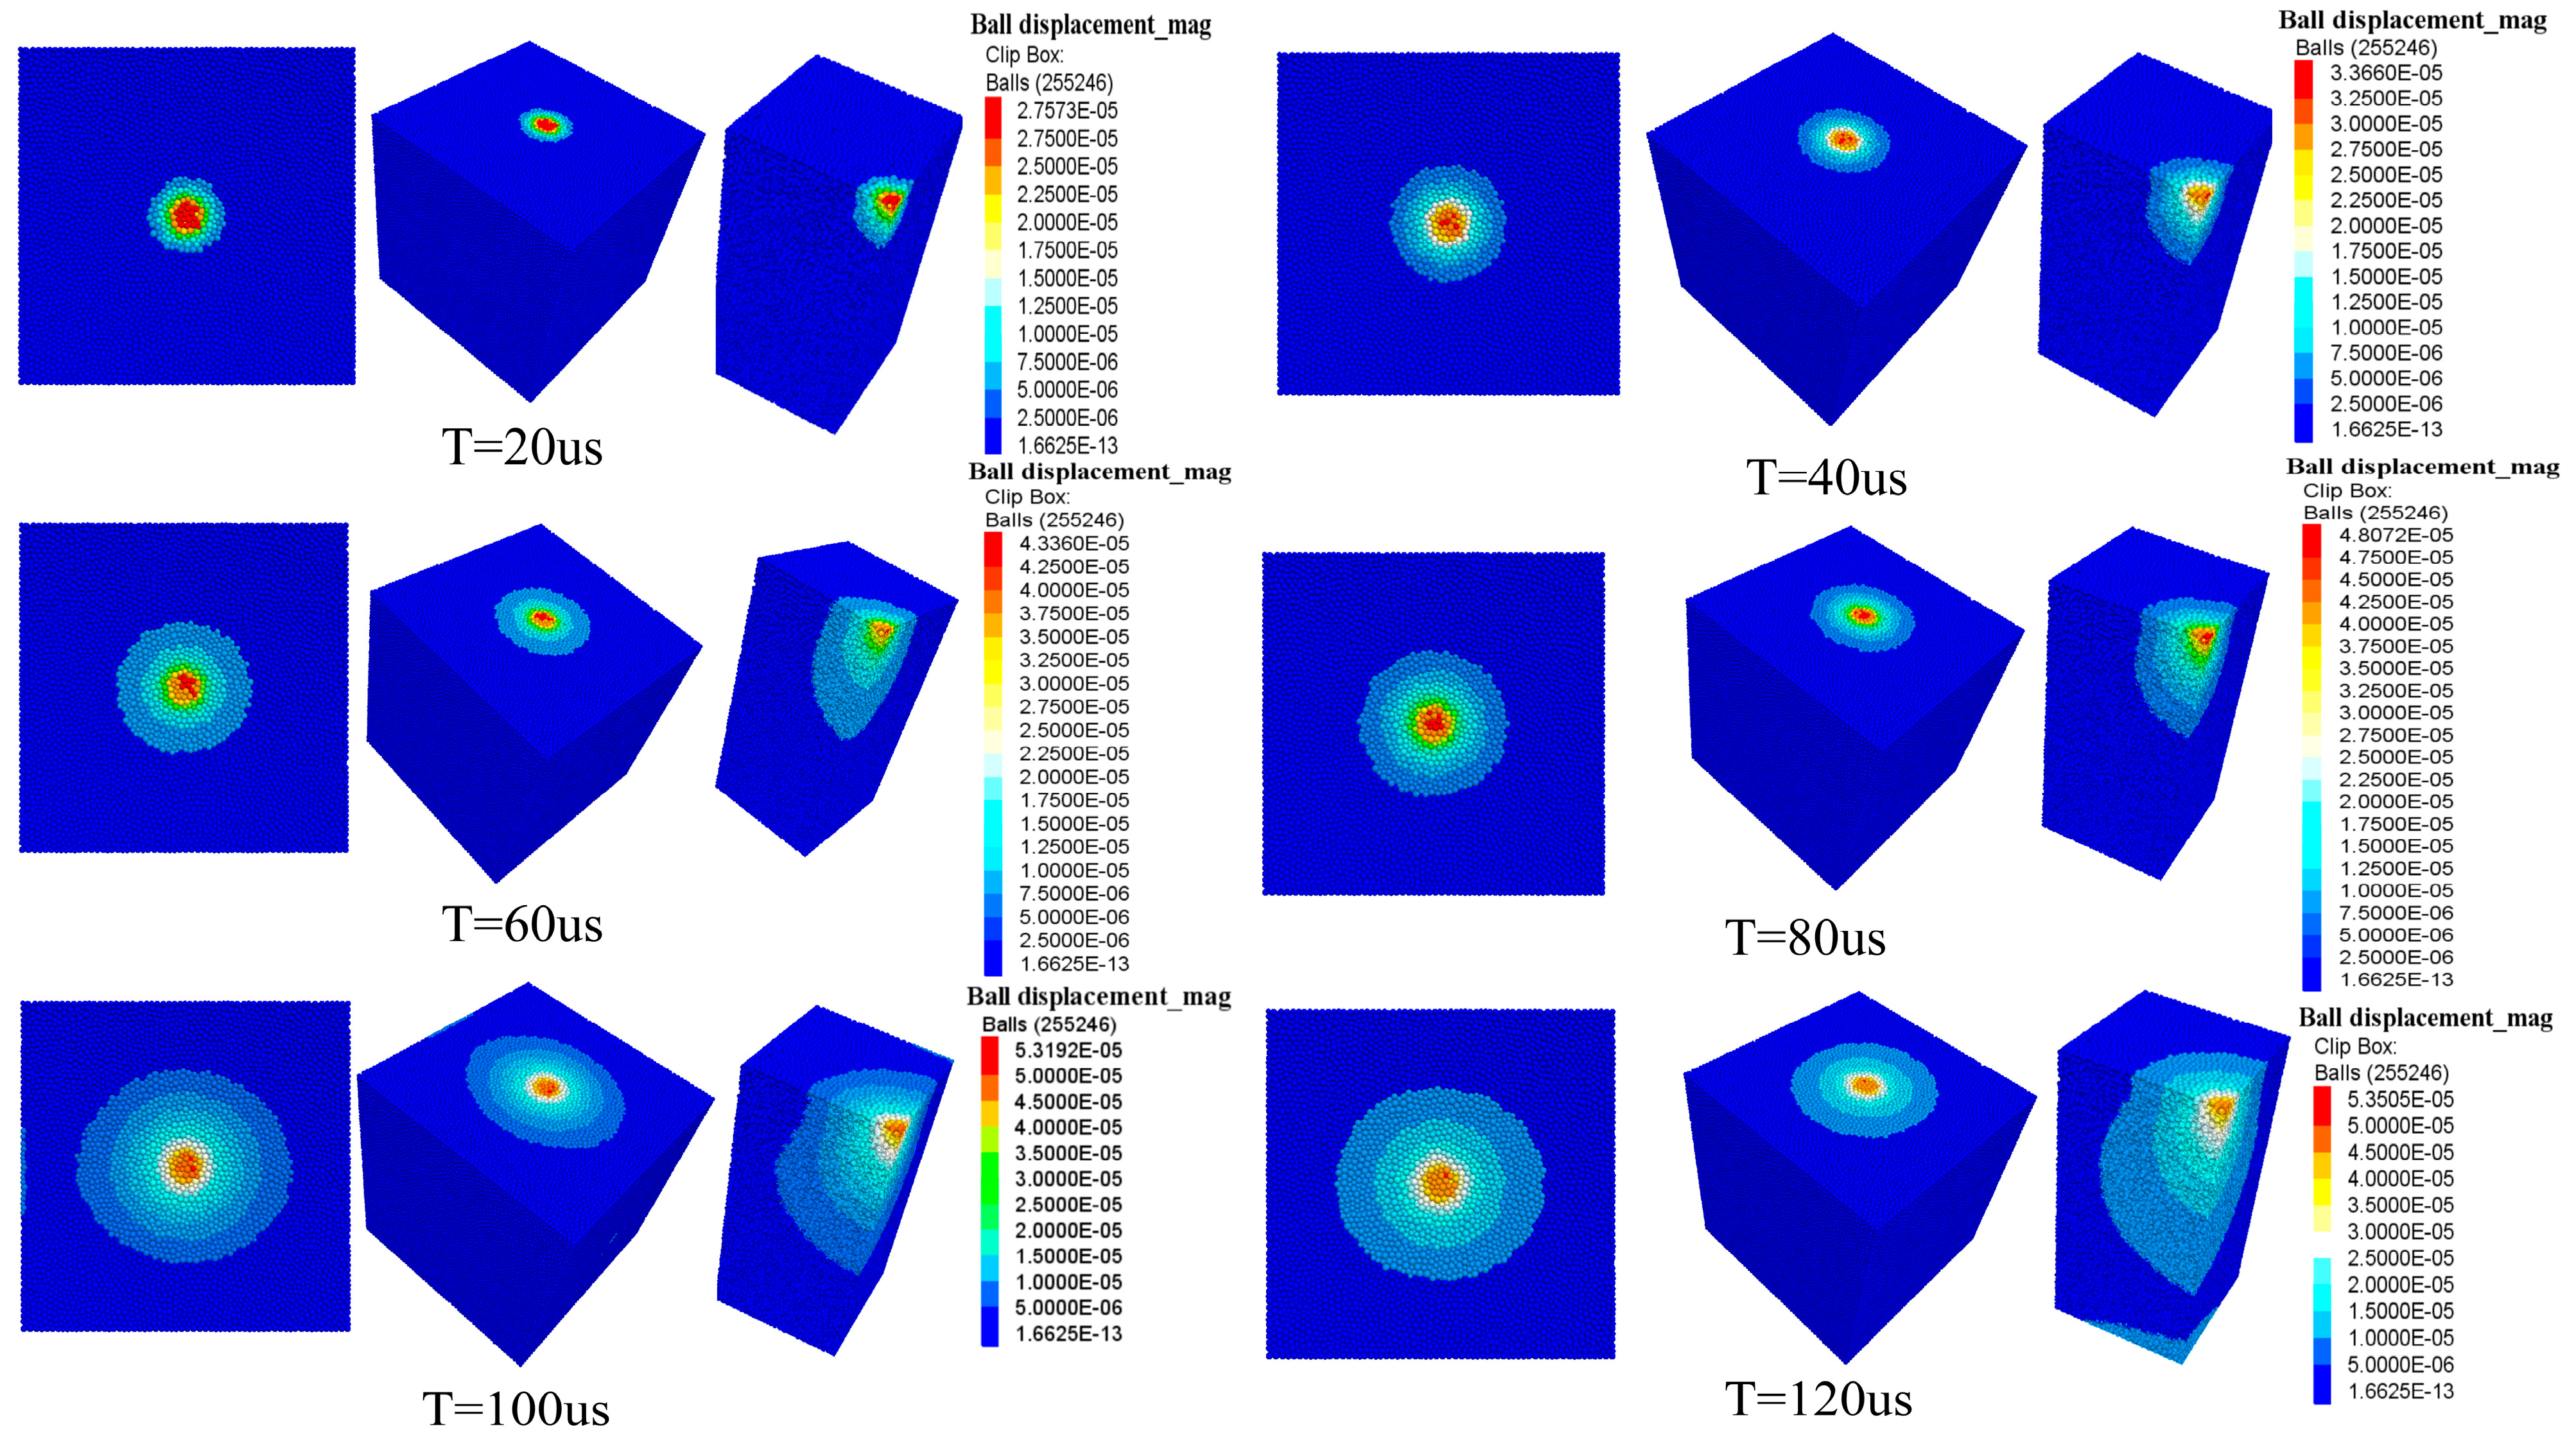
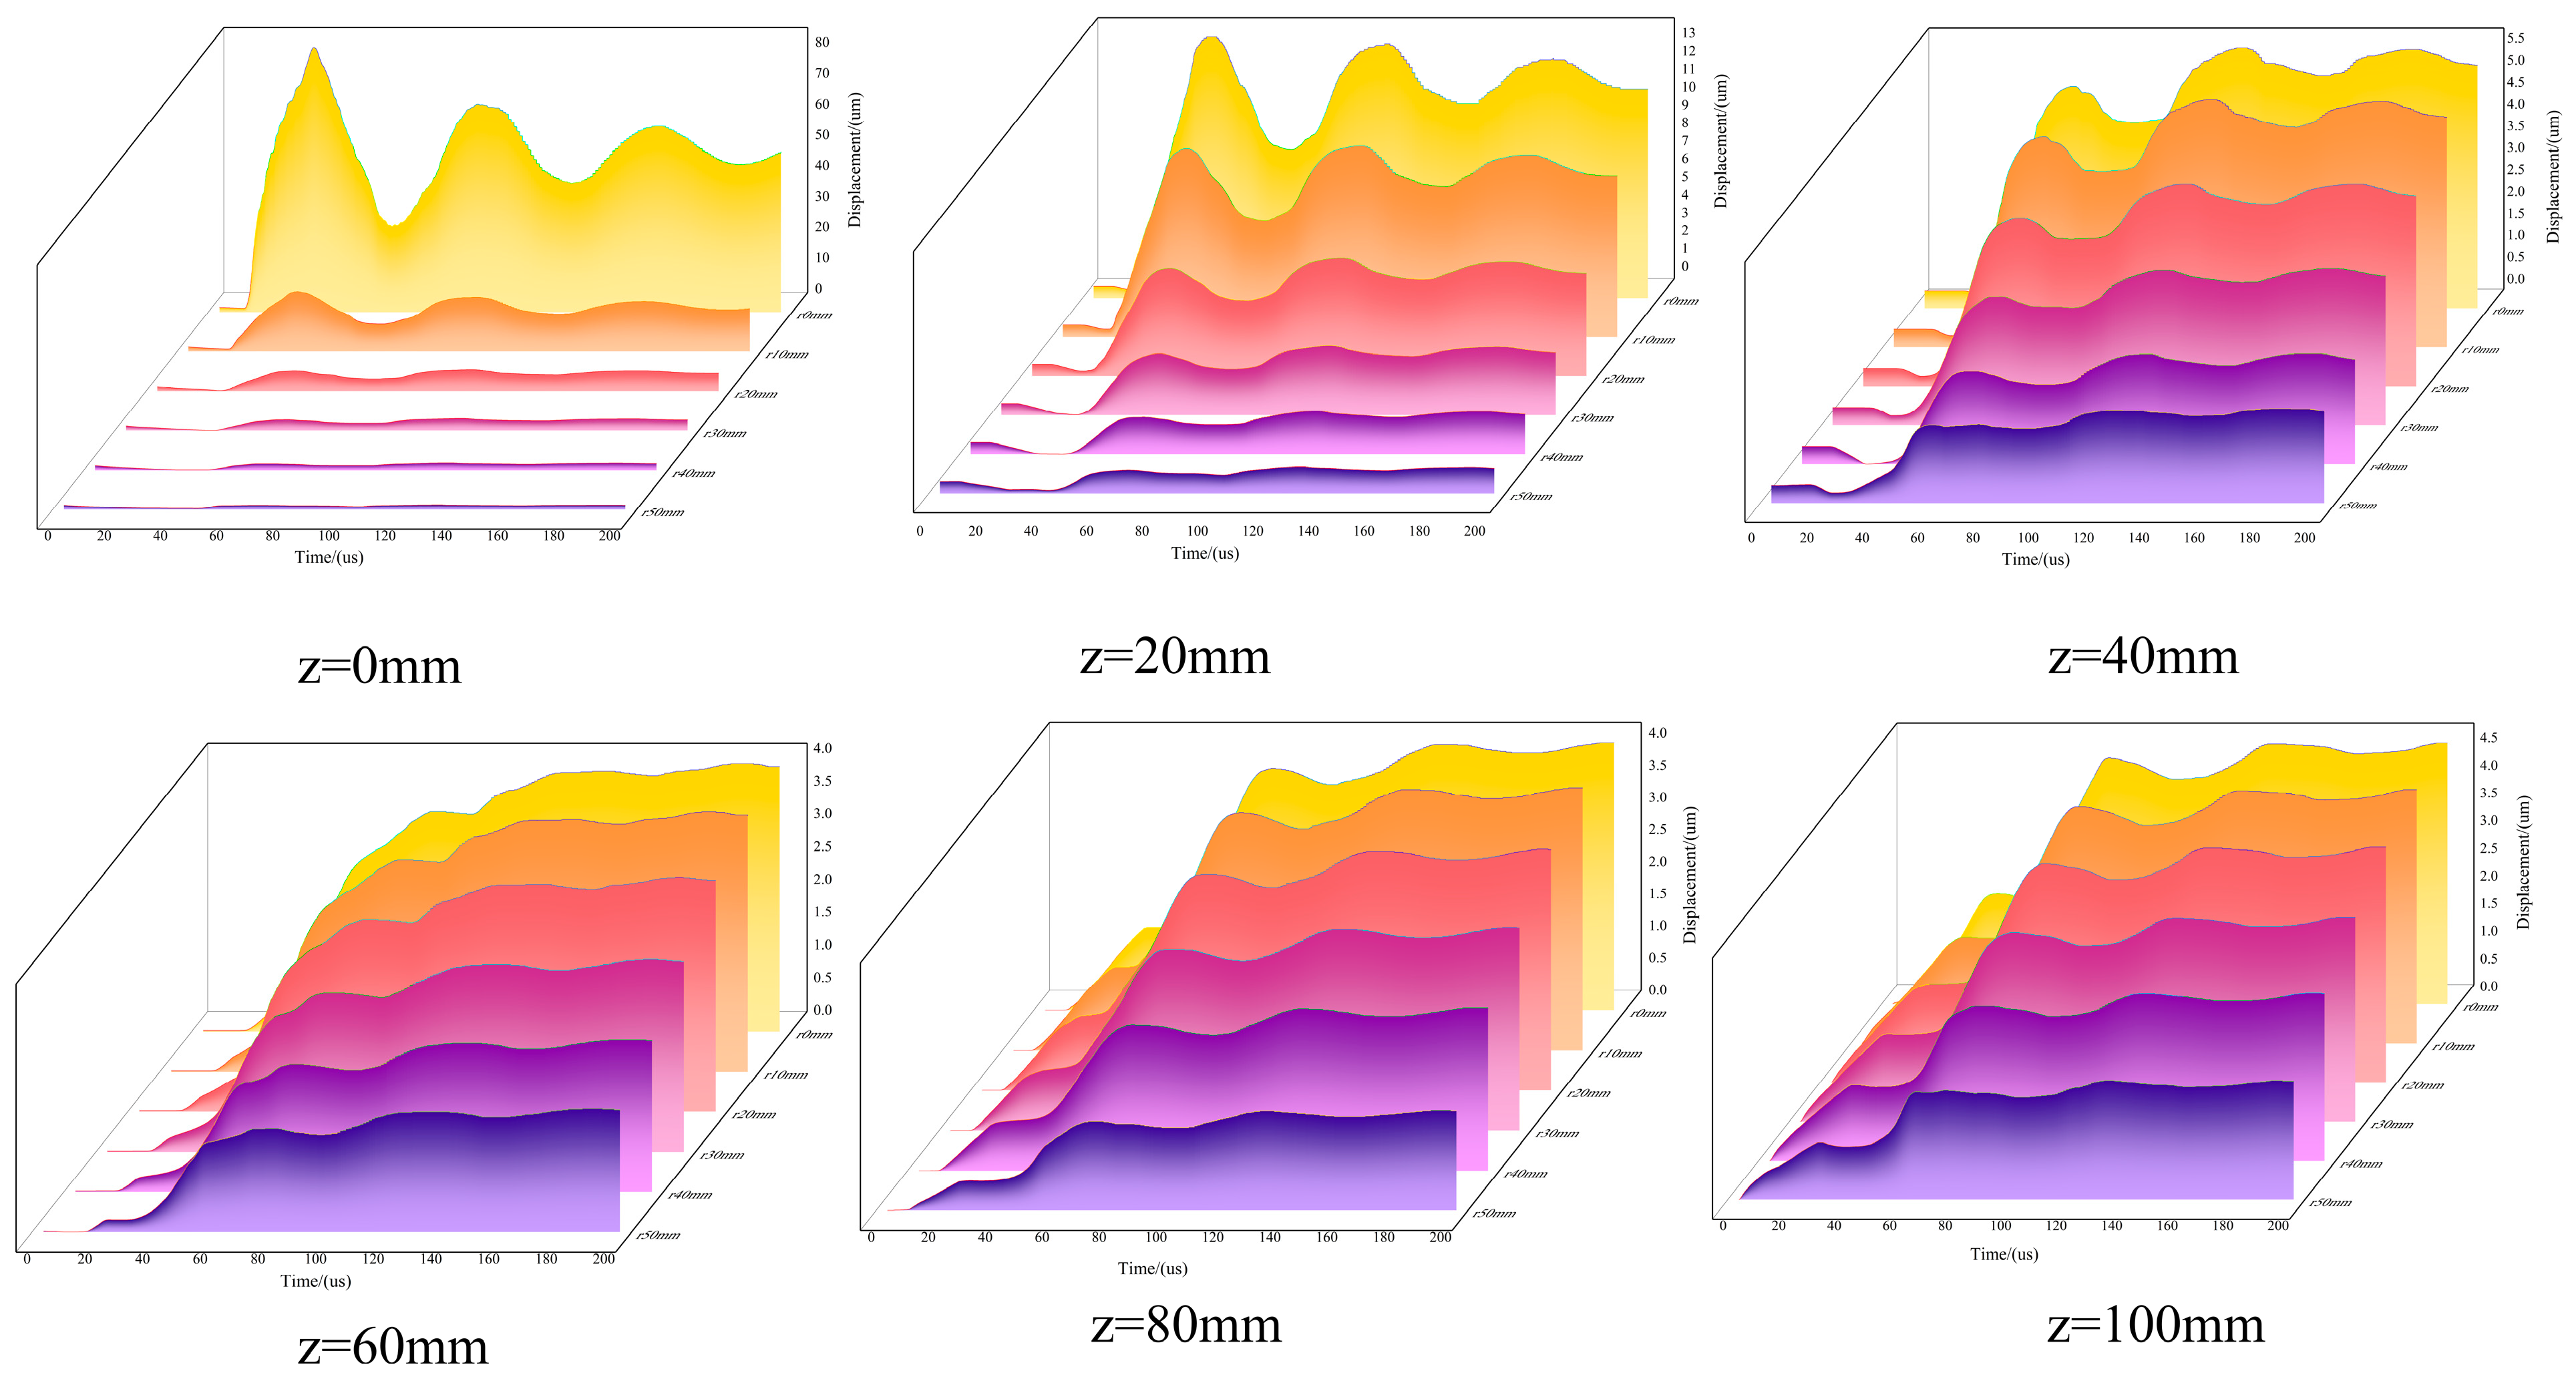
  • The numerical results are consistent with the experimental results. The results indicate that over time, the energy of stress waves decreases with the distance from the impact location, and the energy propagates faster along the impact direction compared to perpendicular to the impact direction. The failure of the rock mass also exhibits a regional pattern. The stress wave area in the simulation results agrees with the experimental crack distribution area, revealing the rationality of crack zoning distribution in the experiment.
  • The next step is to study the air DTH hammer drilling mechanism to create fractures and increase permeability in thermal storage environments (high temperature and pressure). By changing the parameters of impact drilling, more impact fractures can be obtained to assist in developing and utilizing geothermal resources.

Author Contributions

Conceptualization, L.T. and X.Y.; methodology, L.T. and X.Y.; software, L.T. and R.Z.; validation, L.T., R.Z., and K.Z.; formal analysis, K.Z. and O.J.; investigation, L.T., R.Z. and K.Z.; resources, X.Y. and X.Z.; data curation, L.T. and K.Z.; writing—original draft preparation, L.T.; writing—review and editing, L.T., R.Z. and R.Z.; visualization, L.T. and O.J.; supervision, X.Y. and X.Z.; project administration, X.Z.; funding acquisition, X.Z. All authors have read and agreed to the published version of the manuscript.

Funding

This research was funded by Project 2022XAGG0500, supported by the Xiong’an New Area Science and Technology Innovation Special Project of the Ministry of Science; Project (42172342) supported by the National Natural Science Foundation of China.

Data Availability Statement

Data are contained within the article.

Conflicts of Interest

The authors declare no conflicts of interest.

References

  1. Geertjan, O.; Bob, H.; Volkert, R. From gas to geothermal, an overview from the Netherlands. In Proceedings of the World Geothermal Congress 2020+1, Reykjavik, Iceland, 24–27 October 2021. [Google Scholar]
  2. Inga, M.; Rolf, B.; Josef, W. The energy transition from fossil fuels to geothermal energy–A German case study. In Proceedings of the World Geothermal Congress 2020+1, Reykjavik, Iceland, 24–27 October 2021. [Google Scholar]
  3. Kumari, W.; Ranjith, P.; Perera, M.; Li, X.; Li, L.; Chen, B.; Isaka, B.A.; De Silva, V. Hydraulic fracturing under high temperature and pressure conditions with micro CT applications: Geothermal energy from hot dry rocks. Fuel 2018, 230, 138–154. [Google Scholar] [CrossRef]
  4. Tester, W.; Anderson, J.; Batchelor, S. The Future of Geothermal Energy–Impact of Enhanced Geothermal Systems (EGS) on the United States in the 21th Century; Massachusetts Institute of Technology: Boston, MA, USA, 2006. [Google Scholar]
  5. Pang, Z.; Kong, Y.; Shao, H.; Kolditz, O. Progress and perspectives of geothermal energy studies in China: From shallow to deep systems. Environ Earth. Sci. 2018, 77, 580. [Google Scholar] [CrossRef]
  6. Xu, T.F.; Hu, Z.X.; Li, S.H.; Jiang, Z.J.; Hou, Z.Y.; Li, F.Y.; Liang, X.; Feng, B. Enhanced geothermal systems: International research progress and research status in China. Acta Geol. Sin. 2018, 92, 1936–1947. [Google Scholar]
  7. Huang, W.; Cao, W.; Li, T.; Jiang, F. Numerical simulation and economic analysis of heat recovery system of thermal gravity heat pipe in dry hot rock. Acta Chemolog. Sin. 2021, 72, 1302–1313. [Google Scholar]
  8. Jeanne, V.; Albert, G.; Carole, G.; Régis, H.; Nicolas, C.; Clément, B. Temperature signature of permeable fracture zones in geothermal wells of Soultz-sous-Forêts in the Upper Rhine Graben. GRC Trans. 2018, 42, 18. [Google Scholar]
  9. Zhou, Z.; Jin, Y.; Zeng, Y.; Youn, D. Experimental study of hydraulic fracturing in Enhanced Geothermal System. In Proceedings of the 52nd US Rock Mechanics/Geomechanics Symposium, Seattle, WA, USA, 17–20 June 2018; American Rock Mechanics Association: Seattle, WA, USA, 2018. [Google Scholar]
  10. Lepillier, B.; Daniilidis, A.; Doonechaly Gholizadeh, N.; Bruna, P.O.; Kummerow, J.; Bruhn, D. A fracture flow permeability and stress dependency simulation applied to multi-reservoirs, multi-production scenarios analysis. Geotherm. Energy 2019, 7, 24. [Google Scholar] [CrossRef]
  11. Lepillier, B.; Yoshioka, K.; Parisio, F.; Bakker, R.; Bruhn, D. Variational Phase-Field Modeling of Hydraulic Fracture Interaction with Natural Fractures and Application to Enhanced Geothermal Systems. J. Geophys. Res. Solid Earth 2020, 125, e2020JB019856. [Google Scholar] [CrossRef]
  12. Glowka, A.; Schafer, M.; Wright, K.; Whitlow, L.; Bates, W. Status of Lost Circulation Research. In Proceedings of the Transactions, DOE Geothermal Program Review XI, Berkeley, CA, USA, 27–28 April 1993; Available online: https://www.osti.gov/servlets/purl/10160249 (accessed on 7 February 2024).
  13. Pollack, A.; Horne, R.; Mukerji, T. What are the challenges in developing enhanced geothermal systems (EGS) observations from 64 EGS sites. In Proceedings of the World Geothermal Congress 2020+1, Reykjavik, Iceland, 24–27 October 2021; Available online: https://api.semanticscholar.org/CorpusID:211051245 (accessed on 15 February 2024).
  14. Fan, S.; Yan, J.; Zhou, D. Drilling Fluid Completion Fluid and Oil-Gas Reservoir Protection Technology; University of Petroleum Press: Beijing, China, 1996. [Google Scholar]
  15. Hogarth, R.; Holl, H.G. Lessons learned from the Habanero EGS project. GRC Trans. 2017, 41, 1–14. [Google Scholar]
  16. Deichmann, N.; Giardini, D. Earthquakes induced by the stimulation of an enhanced geothermal system below Basel (Switzerland). Seismol. Res. Lett. 2009, 80, 784–798. [Google Scholar] [CrossRef]
  17. Olivier, Z.; Peter, M. Summary of the investigations conducted following the November 2017 earthquake in Pohang, South Korea, and implications for the Haute-Sorne multi-stage-stimulation EGS project, Switzerland. GRC Trans. 2019, 43, 525–538. [Google Scholar]
  18. Ernst, H.; Justyna, E.; Sören, W. Demonstration of soft stimulation treatments in geothermal reservoirs. In Proceedings of the World Geothermal Congress 2020+1, Reykjavik, Iceland, 24–27 October 2021. [Google Scholar] [CrossRef]
  19. Pang, Z.; Luo, J.; Cheng, Y.; Duan, Z.; Tian, J.; Kong, Y.; Li, Y.; Hu, S.; Wang, J. Evaluation of geological conditions for deep geothermal energy exploitation in China. Earth Sci. Front. 2020, 27, 134–151. [Google Scholar] [CrossRef]
  20. Reeves, R.; Weida, W. Application of New and Novel Fracture Stimulation Technologies to Enhance the Deliverability of Gas Storage Wells; Technical Report; Advanced Resources International, Inc.: Arlington, VA, USA, 1995. [Google Scholar] [CrossRef]
  21. Li, Y.; Duan, C.; Zheng, X. Best practices for high-temperature geothermal drilling. Geol. Explor. 2016, 52, 173–182. [Google Scholar]
  22. Gunnar, K.; Ingólfur, T.; Thomas, R. Radial jet drilling stimulation in a low-temperature geothermal well in Iceland. In Proceedings of the World Geothermal Congress 2020+1, Reykjavik, Iceland, 24–27 October 2021. [Google Scholar]
  23. Leeuwenburgh, O.; Peters, E.; Troost, D. Optimal well design for stimulation of geothermal wells with radial jet drilling. In Proceedings of the World Geothermal Congress 2020+1, Reykjavik, Iceland, 24–27 October 2021. [Google Scholar]
  24. Song, G.; Song, X.; Li, G. Simulation modeling of hydrothermal energy extraction with two-layer multilateral horizontal wells. In Proceedings of the World Geothermal Congress 2020+1, Reykjavik, Iceland, 24–27 October 2021. [Google Scholar]
  25. David, L.; Alexandros, S.; Herbert, H. Potential of multilateral wells for geothermal projects in the South German Molasse Basin. In Proceedings of the World Geothermal Congress 2020+1, Reykjavik, Iceland, 24–27 October 2021. [Google Scholar]
  26. Kang, L.; Michael, B.; Julia, D. The use of advanced percussion drilling to improve subsurface permeability for enhanced geothermal systems. GRC Trans. 2019, 43, 58–75. Available online: https://api.semanticscholar.org/CorpusID:134381217 (accessed on 15 March 2024).
  27. Li, Y.L.; Peng, J.M.; Huang, C.; Lian, M.; Xu, T.; Zhang, Y.; Bo, K.; Feng, B.; Zhou, J. Multi-fractured stimulation technique of hydraulic fracturing assisted by the DTH-hammer-induced impact fractures. Geothermics 2019, 82, 63–72. [Google Scholar] [CrossRef]
  28. Wittig, V.; Bracke, R.; Hyun-Ick, Y. Hydraulic DTH fluid/mud hammers with recirculation capabilities to improve ROP and hole cleaning for deep, hard rock geothermal drilling. In Proceedings of the World Geothermal Congress, Melbourne, Australia, 16–24 April 2015; Available online: https://api.semanticscholar.org/CorpusID:55343643 (accessed on 7 February 2024).
  29. Finger, J.; Blankenship, D. Handbook of Best Practices for Geothermal Drilling; Sandia National Laboratories: Albuquerque, NM, USA, 2012. [Google Scholar] [CrossRef]
  30. Jiann, S.; David, W. Advanced Percussive Drilling Technology for Geothermal Exploration and Development DE-FOA-EE0005502. GRC Trans. 2017, 41, 100–125. [Google Scholar] [CrossRef]
  31. Franca, L.F. A bit–rock interaction model for rotary–percussive drilling. Int. J. Rock Mech. Min. Sci. 2011, 48, 827–835. [Google Scholar] [CrossRef]
  32. Shadrina, A.; Kabanova, T.; Krets, V.; Saruev, L. A study of specific fracture energy at percussion drilling. IOP Conf. Ser. Earth Environ. Sci. 2014, 21, 012036. Available online: https://api.semanticscholar.org/CorpusID:108463449 (accessed on 1 March 2024). [CrossRef]
  33. Fourmeau, M.; Kane, A.; Hokka, M. Experimental and numerical study of drill bit drop tests on Kuru granite. Philos. Trans. Ser. A Math. Phys. Eng. Sci. 2017, 375, 20160176. [Google Scholar] [CrossRef] [PubMed]
  34. Saksala, T.; Gomon, D.; Hokka, M.; Kuokkala, V.-T. Numerical and experimental study of percussive drilling with a triple-button bit on Kuru granite. Int. J. Impact Eng. 2014, 72, 56–66. [Google Scholar] [CrossRef]
  35. Jiang, H.; Cai, Z.; Wang, O.; Meng, D. Experimental and numerical investigation of hard rock breakage by indenter impact. Shock. Vib. 2020, 2020, 2747830. [Google Scholar] [CrossRef]
  36. Li, Y.; Peng, J.; Zhang, G.; Yang, Z.; Li, K. Study on perforation performance of abrasive water jet enhanced by percussive drilling. J. Pet. Sci. Eng. 2020, 192, 107259. [Google Scholar] [CrossRef]
  37. Li, Y.; Peng, J.; Bo, K.; Huang, C.; Zhang, Y.; Zhang, P. Analysis on the mechanical properties of granite rock near the wellbore after percussive drilling and AWJ perforation. J. Pet. Sci. Eng. 2020, 184, 106489. [Google Scholar] [CrossRef]
  38. Li, Y.; Peng, J.; Li, K.; Bo, K.; Wang, M.; Zhang, P. An abrasive water jet assisted back reaming technique based on percussion drilling for reducing non-production time in geothermal energy development. Geothermics 2020, 89, 101967. [Google Scholar] [CrossRef]
  39. Li, Y.; Peng, J.; Zhang, L.; Zhou, J.; Huang, C.; Lian, M. Quantitative evaluation of impact cracks near the borehole based on 2D image analysis and fractal theory. Geothermics 2022, 100, 102335. [Google Scholar] [CrossRef]
  40. Yin, L.J.; Gong, Q.M.; Ma, H.S.; Zhao, J.; Zhao, X.B. Use of indentation tests to study the influence of confining stress on rock fragmentation by a TBM cutter. Int. J. Rock Mech. Min. 2014, 72, 261–276. [Google Scholar] [CrossRef]
  41. Liu, J.; Cao, P.; Li, K. A study on isotropic rock breaking with TBM cutters under different confining stresses. Geotech. Geol. Eng. 2015, 33, 1379–1394. [Google Scholar] [CrossRef]
  42. Johnson, K.L. Contact Mechanics; University Press: Cambridge, UK, 1985. [Google Scholar] [CrossRef]
  43. Liu, J.; Cao, P.; Han, D. The influence of confining stress on optimum spacing of TBM cutters for cutting granite. Int. J. Rock Mech. Min. Sci. 2016, 88, 165–174. [Google Scholar] [CrossRef]
  44. Alehossein, H.; Detournay, E.; Huang, H. An analytical model for the indentation of rocks by blunt tools. Rock Mech. Rock Eng. 2000, 33, 267–284. [Google Scholar] [CrossRef]
  45. Zhang, X.X.; Zhang, S.H.; Luo, Y.J.; Wu, D. Experimental study and analysis on a fluidic hammer—An innovative rotary-percussion drilling tool. J. Pet. Sci. Eng. 2018, 173, 362–370. [Google Scholar] [CrossRef]
  46. Fairhurst, C.E.; Hudson, J.A. Draft ISRM suggested method for the complete stress–strain curve for intact rock in uniaxial compression. Int. J. Rock Mech. Min. Sci. 1999, 36, 279–289. [Google Scholar] [CrossRef]
Figure 1. Drilling process flow chart of an air DTH hammer.
Processes 12 00758 g001
Figure 2. XRD test diffraction spectra.
Processes 12 00758 g002
Figure 3. Downhole hammer drill bit used in the experiment.
Processes 12 00758 g003
Figure 4. A schematic diagram of the plastic zone produced by the buttons on the bit.
Processes 12 00758 g004
Figure 5. Schematic diagram of percussion drilling equipment: (a) air impact drilling schematic; (b) air impact drilling test platform.
Processes 12 00758 g005
Figure 6. Preparation of stained granite blocks: (a) original sample; (b) borehole; (c) slicing; (d) stained block; and (e) stained block.
Processes 12 00758 g006
Figure 7. Preparation of granite blocks by CT scanning.
Processes 12 00758 g007
Figure 8. Preparation of rock blocks for uniaxial compression testing of granite: (a) near-hole wall and far-hole wall; (b) hole opening; and (c) hole bottom.
Processes 12 00758 g008
Figure 9. Preparation of experimental rock mass for granite permeability test: (a) near-hole wall (H1–H3) and far-hole wall (G1–G3); (b) hole opening (J1–J3); and (c) hole bottom (K1–K3).
Processes 12 00758 g009
Figure 10. Dyeing test results: (1) the staining results of rock block 1; (2) the staining results of rock block 2; (3) the staining results of rock block 3; (4) the staining results of rock block 4; (5) the staining results of impact drilling; and (6) the staining results of rotary drilling.
Processes 12 00758 g010
Figure 11. CT scan: (a) CT image of rock sample before; (b) CT image of rock sample after drilling.
Processes 12 00758 g011
Figure 12. Three-dimensional reconstruction of internal pores of rock blocks: (a) CT three-dimensional model; (b) three-dimensional reconstruction model; (c) rocky portion; (d) borehole space; and (e) three-dimensional void model.
Processes 12 00758 g012
Figure 13. Pore distribution direction diagram: (a) rocky portion; (b) three-dimensional void model.
Processes 12 00758 g013
Figure 14. Histogram of the distribution of various indicators in the three-dimensional pore model.
Processes 12 00758 g014
Figure 15. Parallel bond model.
Processes 12 00758 g015
Figure 16. (a) Geometric model diagram; (b) PFC3D modeling diagram.
Processes 12 00758 g016
Figure 17. Stress curve with time.
Processes 12 00758 g017
Figure 18. Cloud maps of rock displacement over different time periods.
Processes 12 00758 g018
Figure 19. Particle position diagram.
Processes 12 00758 g019
Figure 20. Time displacement curve of particles at the same r and different z-axis positions.
Processes 12 00758 g020
Figure 21. Time displacement characteristics of particles at the same z-axis position and different r.
Processes 12 00758 g021
Figure 22. Comparison between staining results and simulation results: (a) staining area; (b) simulated displacement cloud map.
Processes 12 00758 g022
Table 1. Mineralogy of rock specimens.
Main MineralsQuartzPotassium FeldsparAlbiteMica
Content28%36%31%5%
Table 2. Mechanical properties of rock specimens.
Mechanical PropertiesValues
Density, (kN/m3)26.3
Young’s modulus, E (GPa)35.6
Poisson s   ratio ,   v 0.23
Tensile strength, σt (MPa)8.91
Uniaxial compressive strength, σc (MPa)148
Friction angle, Φ (deg)57
Porosity, %1.127
Permeability, (mD)0.0546
Table 3. Calculation table for the volume effect of granite samples.
Drill Diameter (mm)Edge Tooth Diameter (mm)Minimum Wall Thickness (mm)Minimum Side Length (mm)
1401844.82229.64
Table 4. Percussive drilling parameters.
Wellbore DiameterWellbore
Depth
Weight of BitWeight of DTHPump PressureInput FlowRotation RateRate of PenetrationImpact EnergyImpact Frequency
140 mm260 mm15.3 kg70 kg1.0 MPa7000 L/min30 r/min10.4 m/h4546.52 J30 Hz
Table 5. Uniaxial compressive strength at different positions.
Location of Rock SamplesSample NumberLength (cm)Diameter (cm)Average Compressive Strength (MPa)
Original rock sampleA1–A1010050148.653
Near-borehole wall rock sampleB1–B1010050129.680
Distant-borehole wall rock sampleC1–C1010050142.027
Orifice rock sampleD1–D810050118.990
Borehole bottom rock sampleF1–F810050108.525
Table 6. Porosity and permeability of rock samples at different positions.
Location of Rock SamplesSample NumberLength (cm)Diameter (cm)Average Porosity (%)Average Permeability (Md)
Original rock sampleA1–A34.9992.4571.1270.0546
Near-borehole wall rock sampleG1–G34.9892.4451.2180.0911
Distant-borehole wall rock sampleH1–H34.9902.4651.1560.0589
Orifice rock sampleJ1–J35.4912.4501.1910.1107
Borehole rock sampleK1–K34.9872.4601.3700.0716
Table 7. The calibrated microscopic parameters of granite.
Micro-ParametersValue
Mineral PropertiesQuartzPotassium FeldsparAlbiteMica
Content28%36%31%5%
Minimum particle radius, mm0.060.060.060.06
Particle-size ratio1.661.661.661.66
Particle density, kN/m326.326.326.326.3
Contact normal to shear
Stiffness ratio (kn/ks)
1.51.51.51.5
Particle–particle contact modulus, GPa49392919
Particle friction coefficient1.21.21.21.2
Radius multiplier1.51.51.51.5
Parallel bond normal to shear
stiffness ratio
1.02.02.01.5
Parallel bond modulus, GPa19161510
Parallel bond tensile strength, MPa25232120
Parallel bond cohesion, MPa53474540
Table 8. Comparison between experimental results and simulation results.
ParametersExperimental ValueSimulation ValueError, %
Tensile strength, MPa8.939.395.2
UCS, MPa148153.64.6
Elastic modulus, GPa20.320.892.9
Disclaimer/Publisher’s Note: The statements, opinions and data contained in all publications are solely those of the individual author(s) and contributor(s) and not of MDPI and/or the editor(s). MDPI and/or the editor(s) disclaim responsibility for any injury to people or property resulting from any ideas, methods, instructions or products referred to in the content.

