Article

An Experimental Study on the Seepage Characteristics of Rough Fractures in Coal under Stress Loading

1
State and Local Joint Engineering Laboratory for Gas Drainage & Ground Control of Deep Mines, Henan Polytechnic University, Jiaozuo 454003, China
2
Work Safety Key Lab on Prevention and Control of Gas and Roof Disasters for Southern Coal Mines, Hunan University of Science and Technology, Xiangtan 411201, China
*
Author to whom correspondence should be addressed.
Processes 2024, 12(4), 757; https://doi.org/10.3390/pr12040757
Submission received: 7 March 2024 / Revised: 1 April 2024 / Accepted: 3 April 2024 / Published: 9 April 2024
(This article belongs to the Section Energy Systems)

Abstract

:
Fracture and stress environments significantly affect the flow of coalbed methane. Under stress, fracture deformation and damage occur, which change the original fracture characteristics and lead to changes in gas flow characteristics. The change in gas pressure gradient makes the fluid flow obviously nonlinear. Using linear flow theory to describe the fracture flow leads to a large error in predicting coalbed methane productivity. In this study, seepage tests on fractured coal are carried out under different stresses and gas pressure gradients, the nonlinear flow and changes in related parameters are analyzed, and the applicability of the nonlinear flow equation is evaluated. The resulting seepage of the gas flow in the fracture under stress is obviously nonlinear, which gradually increases with increasing effective stress and gas pressure gradient. When the Forchheimer equation is used to characterize the nonlinear seepage in fractures, the coefficients increase with increasing effective stress. The permeability, nonlinear factor, and critical Reynolds number decrease with increasing effective stress. When the Izbash equation is used for this case, the linear coefficient ranges from 1015 to 1016, and the nonlinear coefficient ranges from 1.064 to 1.795. The coefficients are related to the effective stress through a power function. Both the Forchheimer and Izbash equations can characterize the flow in rough fractures in coal during stress loading. However, the Forchheimer equation better reveals the mechanism of flow transformation from linear to nonlinear in fractures.

1. Introduction

Coalbed methane (CBM) is a type of unconventional clean energy with abundant reserves that is attracting global attention for its environmental benefits compared with traditional energy sources [1,2]. A coal body is a typical fractured porous medium. CBM seepage mainly occurs in the fracture network, and its seepage capacity is mainly affected by the gas pressure gradient, external load, and fracture structure characteristics [3,4,5]. Therefore, exploring the seepage characteristics of coalbed methane in fractures has important engineering practical significance for efficient extraction of coalbed methane.
As the basic unit of a fracture network, a single fracture is the basis of exploring the seepage mechanism of a fractured rock mass [6,7]. To study the fluid flow in fractures, Boussinesq assumed that the flow in smooth parallel plates was laminar and derived the relationship between fluid flow in fractures and the cubic power of the aperture according to the Navier–Stokes equation [8]. The theory is widely used to analyze laboratory seepage and predict reservoir permeability. With continuous improvement in research methods, it has been found that fractures in an actual rock mass are not smooth. The structural characteristics of fractures in a rock mass and the combined influence of environmental factors cause a tortuous flow path, resulting in a complicated and changeable fluid flow state [9,10,11]. Guo et al. [12] have carried out experimental flow tests on shale fractures, and the results show that as the fracture roughness increases, the aperture widens and the seepage capacity increases. When the upper and lower fracture surfaces are misaligned, the seepage capacity increases by one to two orders of magnitude. Javadi et al. [13] analyzed the nonlinear fluid flow law by changing the fracture aperture and contact area. The above studies show that the fracture characteristics affect the flow capacity.
The flow in a fractured rock mass is not only affected by the fracture characteristics but also by the stress state of the rock mass and the fluid pressure gradient. Singh KK et al. [14] studied nonlinear fluid flow in granite under high confining pressure and high inlet pressure. Su et al. [15] carried out a flow test on marble fractures under different effective stresses and found nonlinear fluid flow under high confining pressure. Li et al. [16] analyzed the nonlinear flow characteristics of methane gas in shale fractures by conducting shale fracture seepage tests under stress loading and unloading paths. Xia et al. [17] conducted differential tests on the nonlinear seepage of sandstone under acidic and saturated environments during stress loading and unloading and found that the nonlinear seepage characteristics of sandstone fractures after acidification were more obvious.
The existing literature is mostly focused on nonlinear fluid seepage through fractured rock masses in sandstone, shale, and marble, whereas seepage in rough fractures in coal is rarely studied in terms of the influence of fracture structure, environmental factors, and fluid properties. In addition, field tests, laboratory tests, and simulations have found that the nonlinear aspects of flows can be described by the Forchheimer equation [18] and Izbash equation [19], but the scope of application of both has not been clarified [20,21,22].
This study carries out seepage tests under different effective stresses and gas pressure gradients for rough fractures in coal. We analyze the variation in the equivalent hydraulic fracture aperture and nonlinear factor with effective stress, and evaluate the applicability of the nonlinear flow equation and variational laws of related parameters. The nonlinear flow through a single fracture is characterized under varying stress loading and gas pressure gradients.

2. Seepage Test on Rough Fractures in Coal under Stress Loading

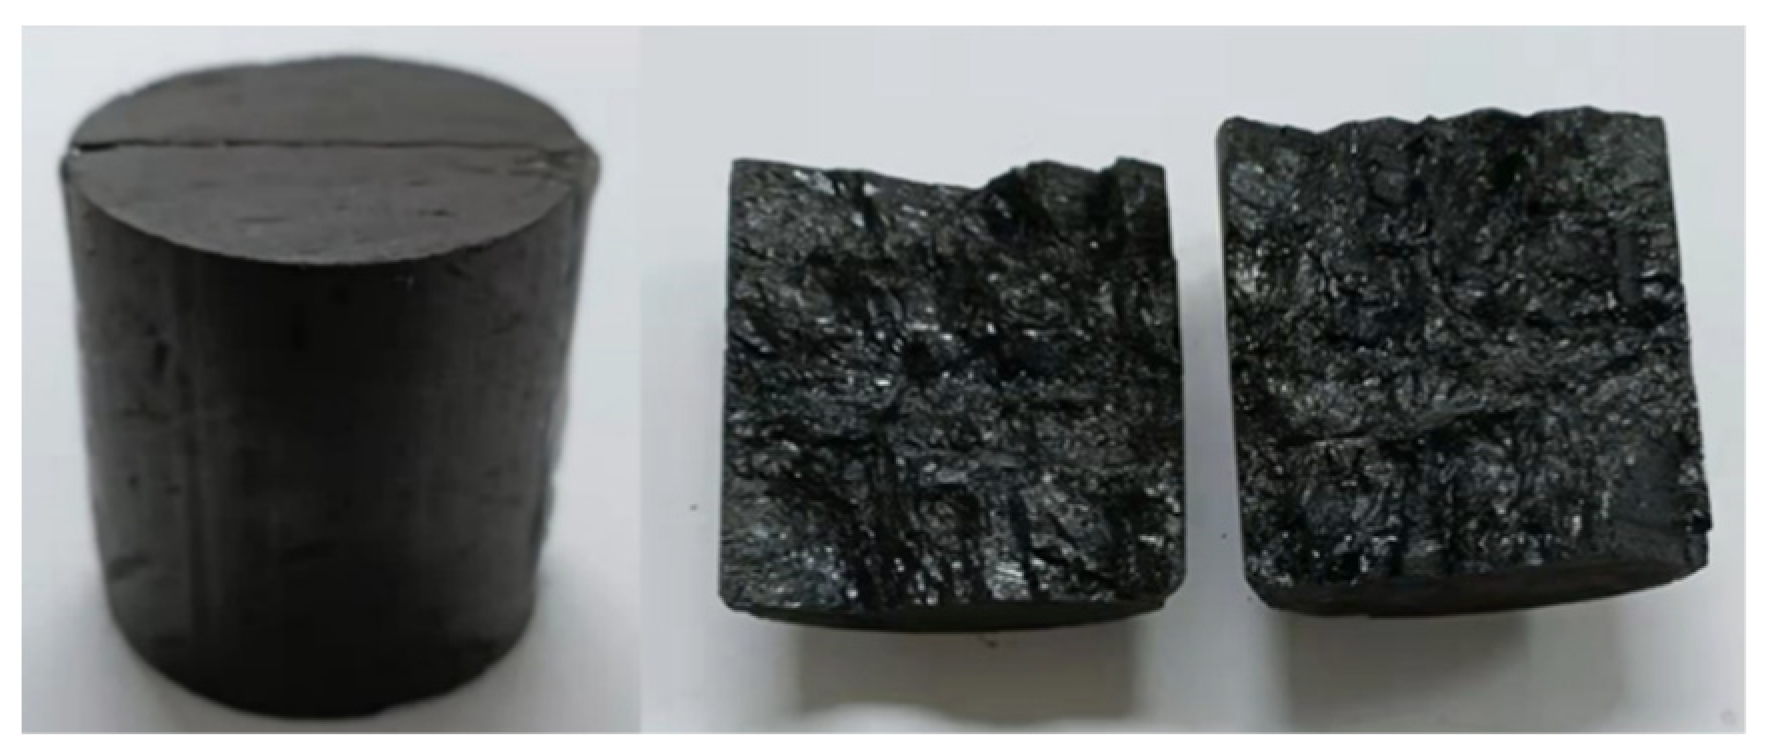
2.1. Sample Preparation

The test sample was taken from a large coal block with good integrity in the Xichenzhuang Coal Mine, Jincheng City, China. By using the X-ray diffraction method to analyze the mineral components in coal, it was found that the selected coal samples are mainly composed of minerals such as kaolin, illite, pyrite, calcite, and dolomite. The proportion of each mineral component is in the following order: kaolin (64.96%) > illite (16.22%) > quartz (9.11%) > dolomite (5.71%) > calcite (2.7%) > pyrite (1.3%). A ZS-100 rock coring machine was used to extract the core along the bedding direction of the raw coal sample, and a cylindrical sample with a size of 50 × 50 × 50 mm was obtained. This was cut and polished into a standard cylindrical sample with an unevenness of less than 0.05 mm at both ends. A coal sample with a rough fracture surface was prepared through the method used by Li et al. [17] to obtain a rough fracture surface in shale. The polished coal sample was placed horizontally between the base wedge supports of a self-made Brazilian splitting device, and the tool was aligned with the central axis of the sample. Then, the Brazilian splitting device was placed on the loading test bench, and an appropriate loading speed was selected to make the tool gradually increase its contact with the sample until the specimen was split. The coal sample with prepared rough fractures is shown in Figure 1.

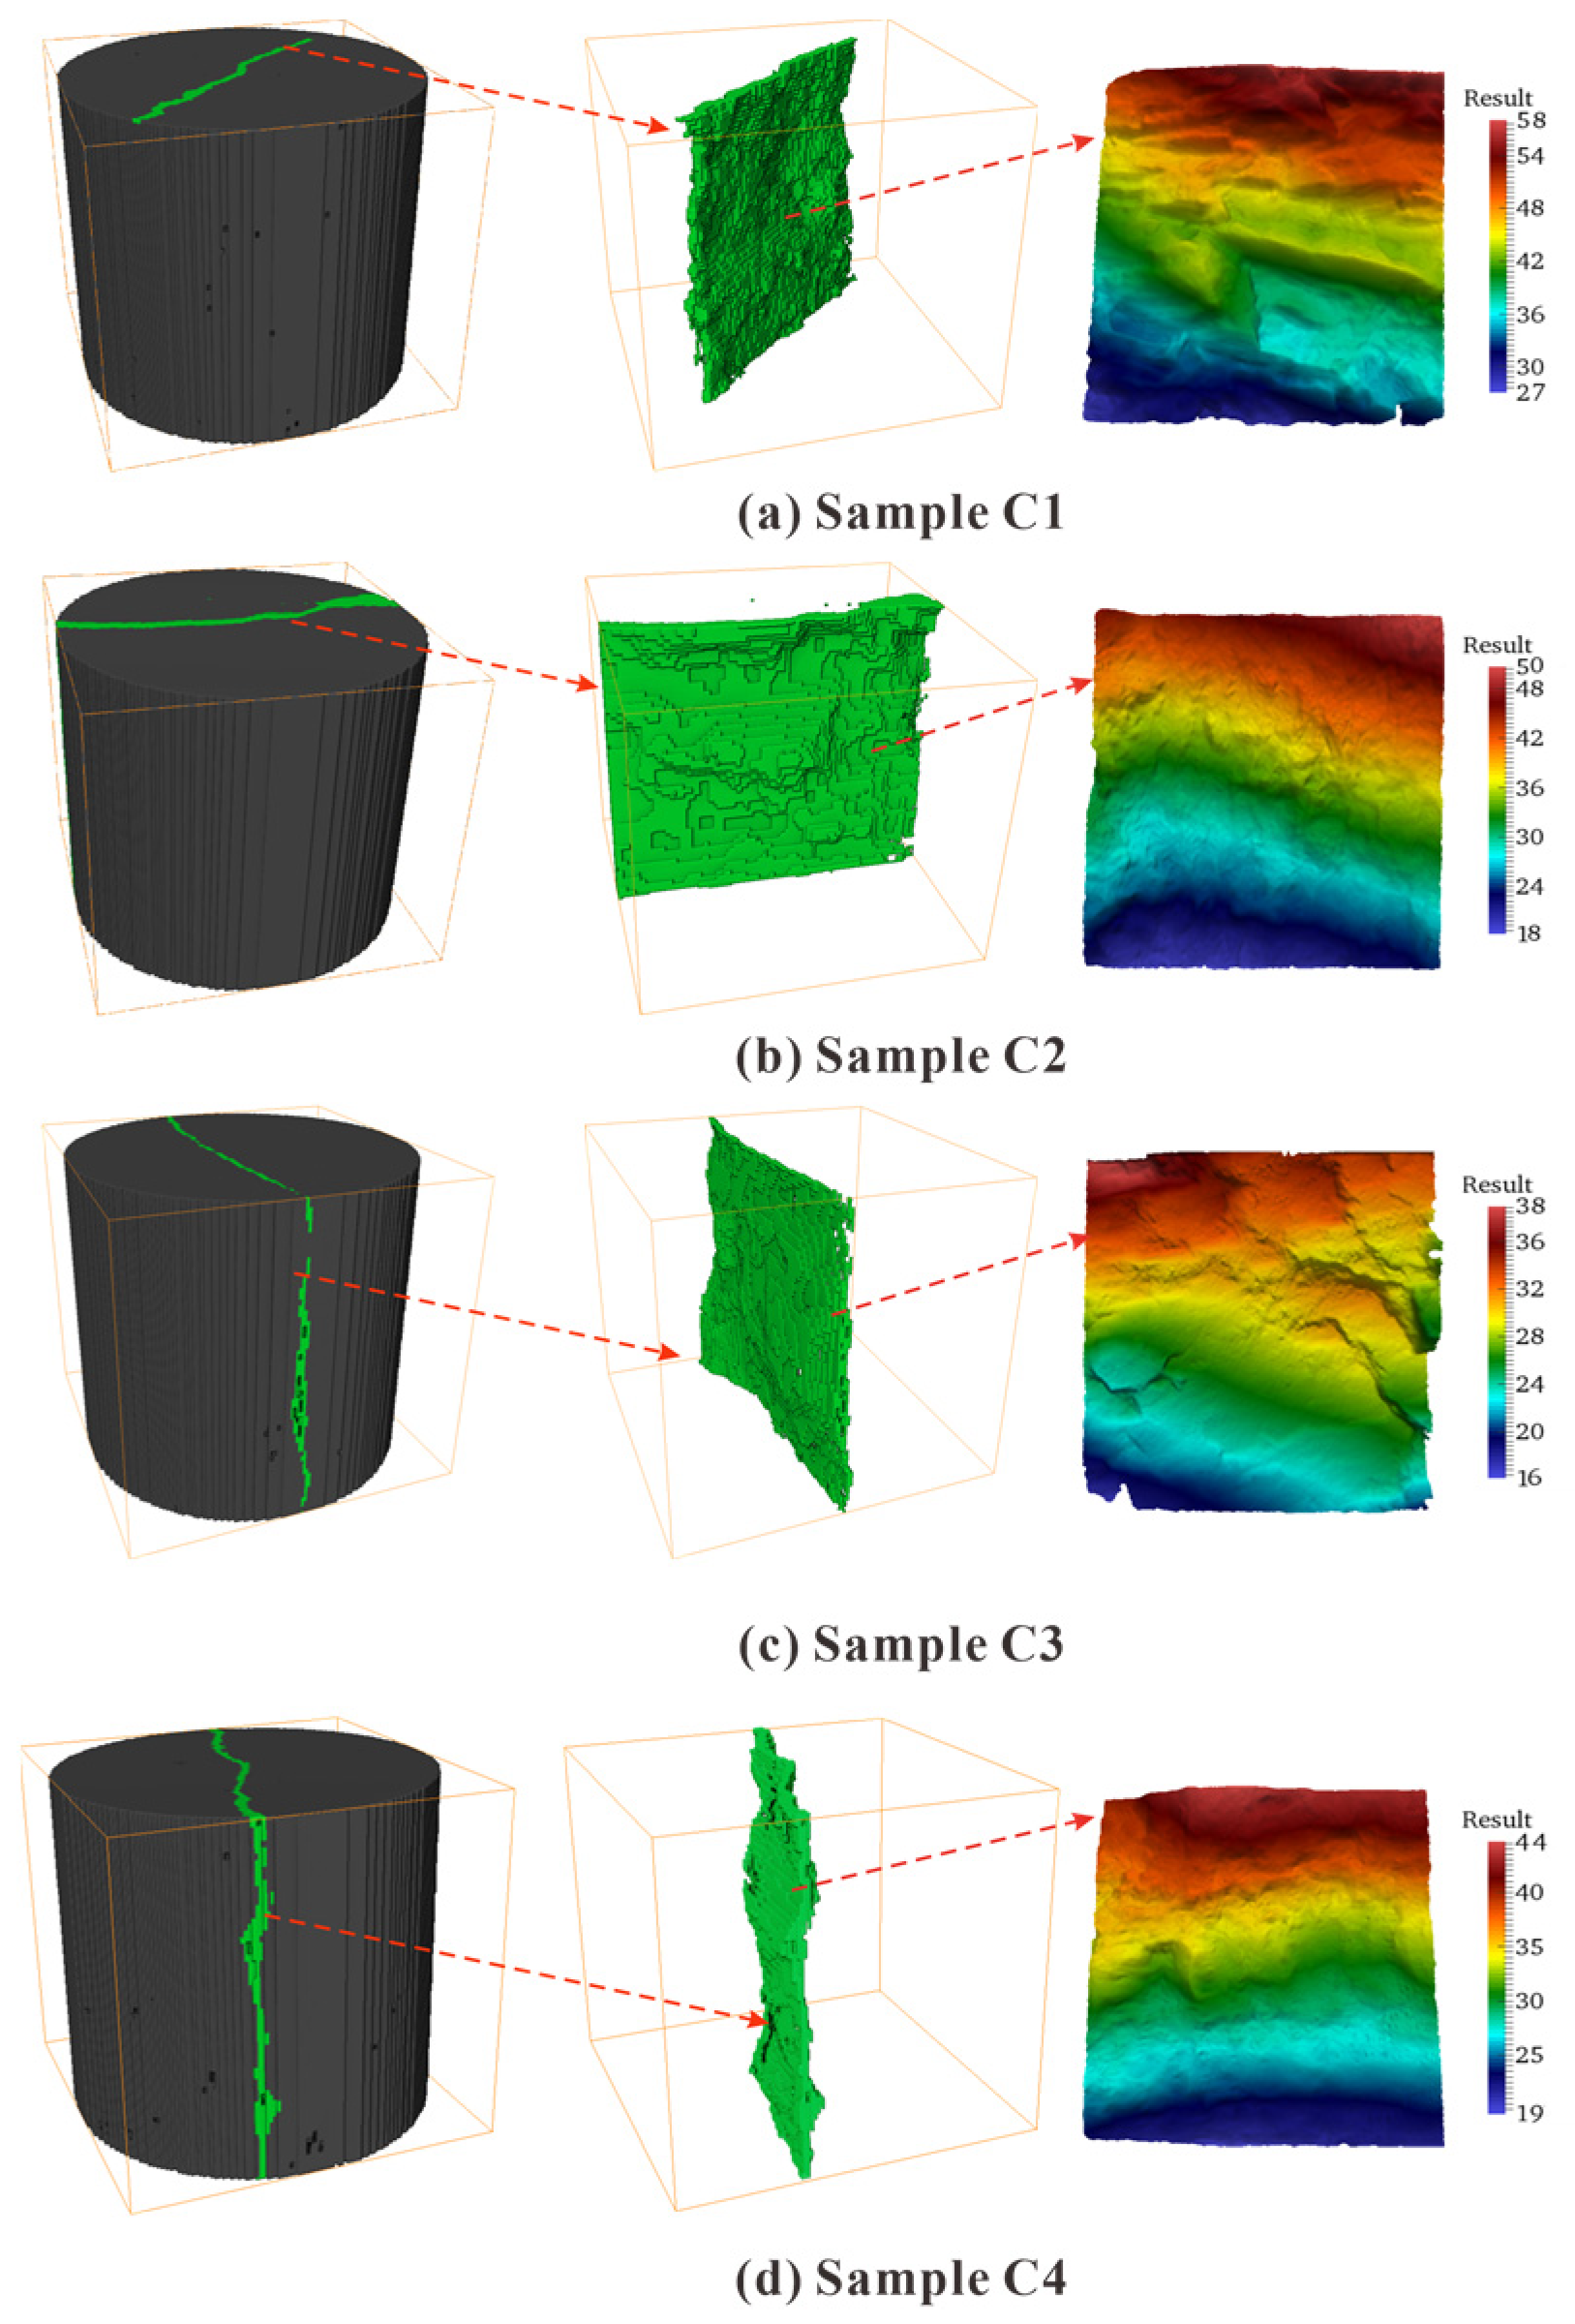
2.2. Fracture Structure of the Sample
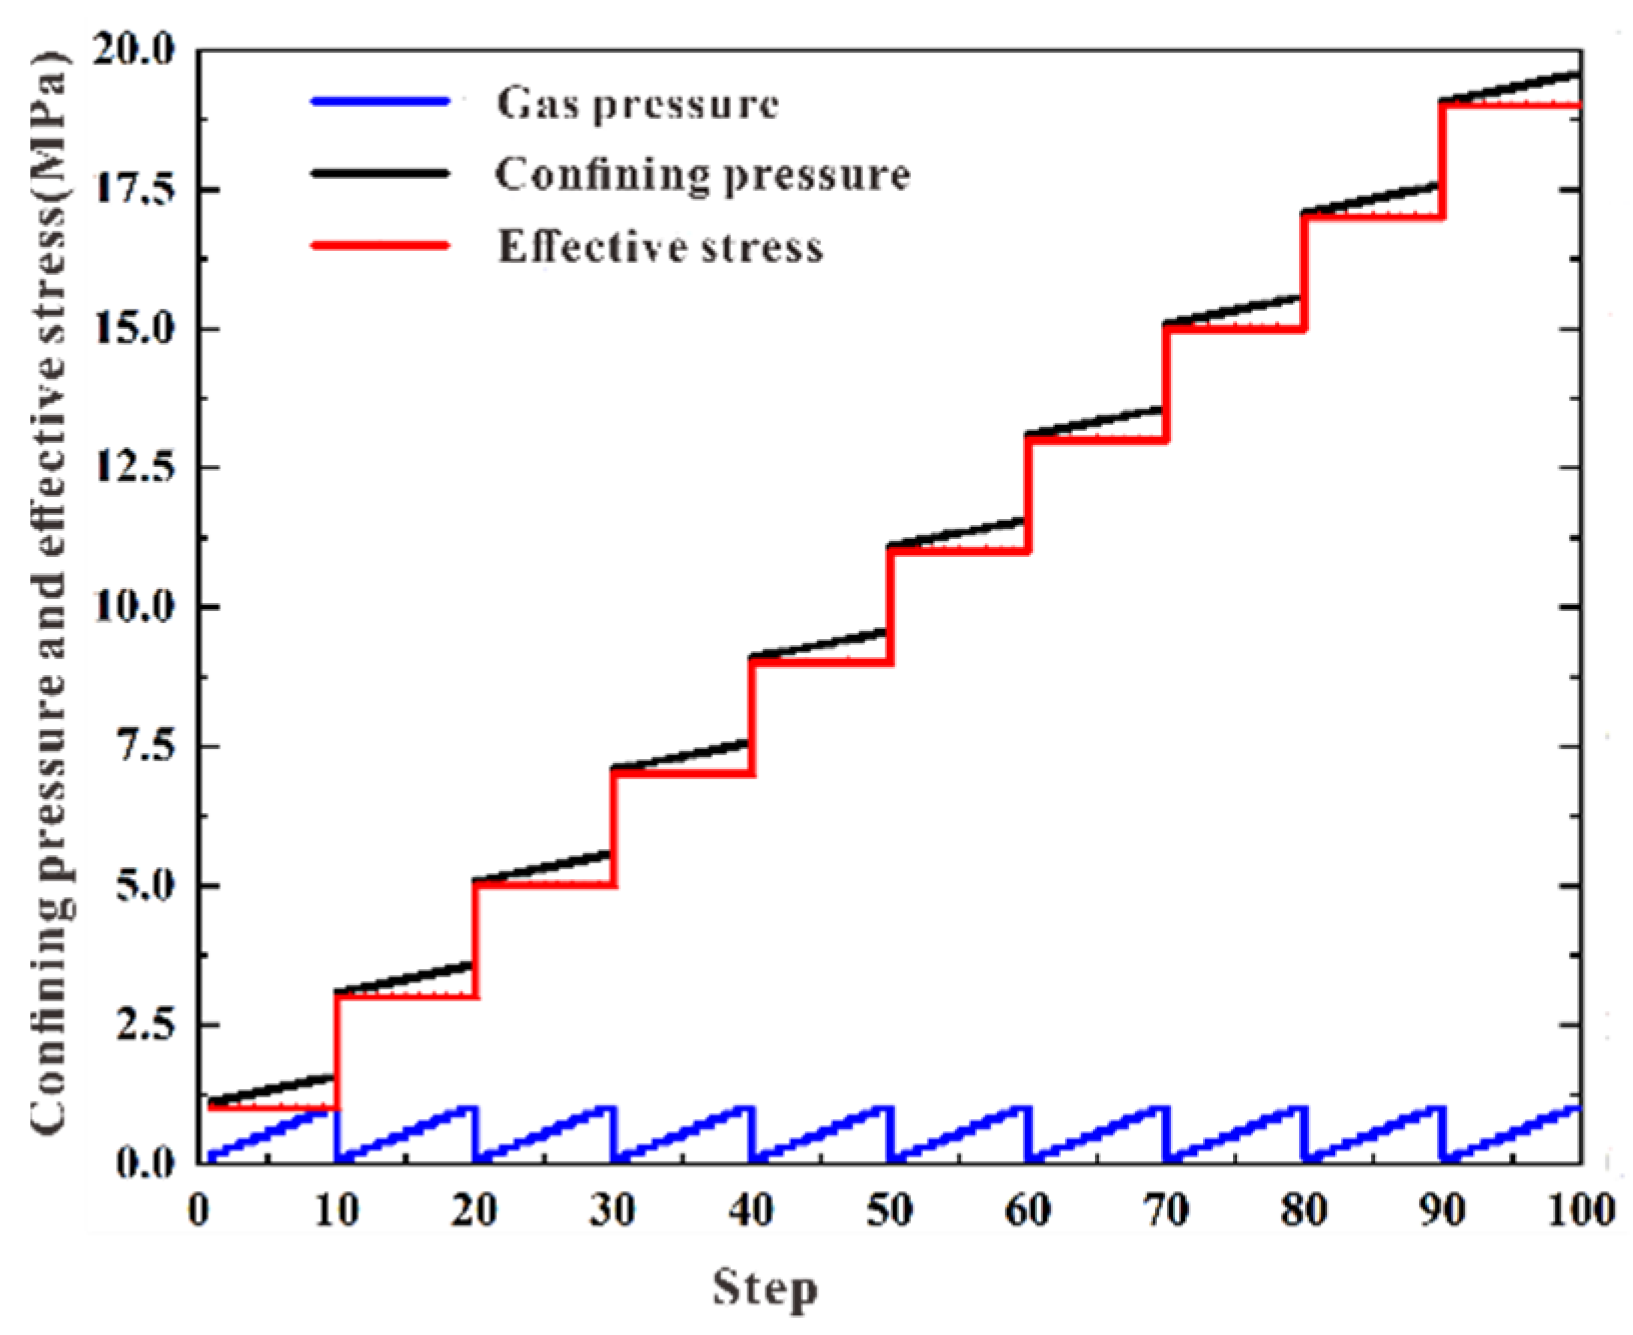
The fractures in an actual coal rock mass are often uneven and have a certain roughness, which further affect the mechanics and seepage characteristics of the coal rock mass [23,24,25]. At present, researchers often use the joint roughness coefficient (JRC) to describe the roughness of rock fractures. This parameter was first proposed by Barton [26] through extensive observation of contour lines in rough rock, and 10 standard contour lines were provided (with the JRC range of 0–20). Subsequent researchers have usually extracted and compared the actual fractures in coal and rock bodies with these 10 standard JRC contour lines to determine the JRCs of fractures (joints). This method has been widely applied in the study of rock joints, and many empirical equations for calculating rock parameters have been developed on the basis of JRC curve fitting [27,28,29,30].
To obtain the morphology of rough fracture surfaces in coal, a high-precision 3D morphology scanner was used to scan and denoise the upper and lower surfaces of the sample. Then, the scanned data were imported into the visualization software Paraview 4.3.1, and the fracture surface morphology was reconstructed using Delaunay filters (Figure 2). An internal interception function was used to obtain 10 contour lines evenly distributed on the fracture surfaces, and feature contour line data were saved. The fracture surface JRCs of four coal samples were calculated using the empirical JRC equation proposed by Jang et al. [29]. The results showed that the fracture surface of sample C1 was the roughest among the four samples, with a JRC of 29.957, followed by samples C2 and C4 at 28.604 and 27.262, and finally sample C3 at 25.988, indicating the smoothest surface.

2.3. Test Scheme

By carrying out mechanical tests under triaxial stresses, Biot [31] found that the effective stress obtained under high pore-water pressure was lower than that in an actual situation. Consequently, the effective stress coefficient α was introduced by Terzaghi [32] to obtain the modified effective stress expression applicable to a fractured rock mass:
σ = σ α P
where σ′ is the effective stress (MPa), and σ is the confining pressure applied to the sample (MPa).
When the influence of fracture structure is considered, the effective stress can be taken as the macroscopic average for the fractured rock mass, and the effective stress coefficient α can be regarded as 1 for simplicity. The gas flow pressure in the fracture can be regarded as the average of the inlet pressure and outlet pressure [22],
P = 1 2 ( P i n + P o u t )
where Pin is the gas pressure at the inlet of the sample (MPa), and Pout is the gas pressure at the outlet of the sample (MPa).
When Equation (2) is substituted into Equation (1), the effective stress expression can be written as
σ = σ 1 2 ( P i n + P o u t ) .
The rough fracture seepage test for coal was carried out using an RLW-2000M multi-field rock seepage test device produced by DOLI Company in Germany. Before the test, the upper and lower surfaces of the sample should be spliced together and placed between the upper and lower pressure heads with permeable pores. It is necessary to ensure close contact between the indenter and the end face of the specimen and to cover it with a heat-sensitive heat shrink tube. Using a high-temperature hair dryer, tightly wrap the heat shrink tubing around the specimen and pressure head to prevent gas from being transported out from the side during the test process. Finally, the process is finished by placing the sample into the cavity of the seepage testing device.
Experimental errors can be minimized owing to the stable nature of nitrogen at room temperature and its difficulty in adsorbing onto the coal matrix. Therefore, nitrogen was used as the test gas in this study. In order to explore the flow characteristics in rough fractures in coal under different effective stresses and gas pressure gradients, each experiment was conducted under 10 different effective stresses (1–19 MPa). Under each effective stress, the inlet gas pressure was gradually increased from 0.1 MPa to a certain value, as shown in Figure 3. During the test, in order to prevent gas from seeping into the hydraulic oil, it is necessary to ensure that the confining pressure is always greater than the gas pressure.

3. Analysis of Test Results

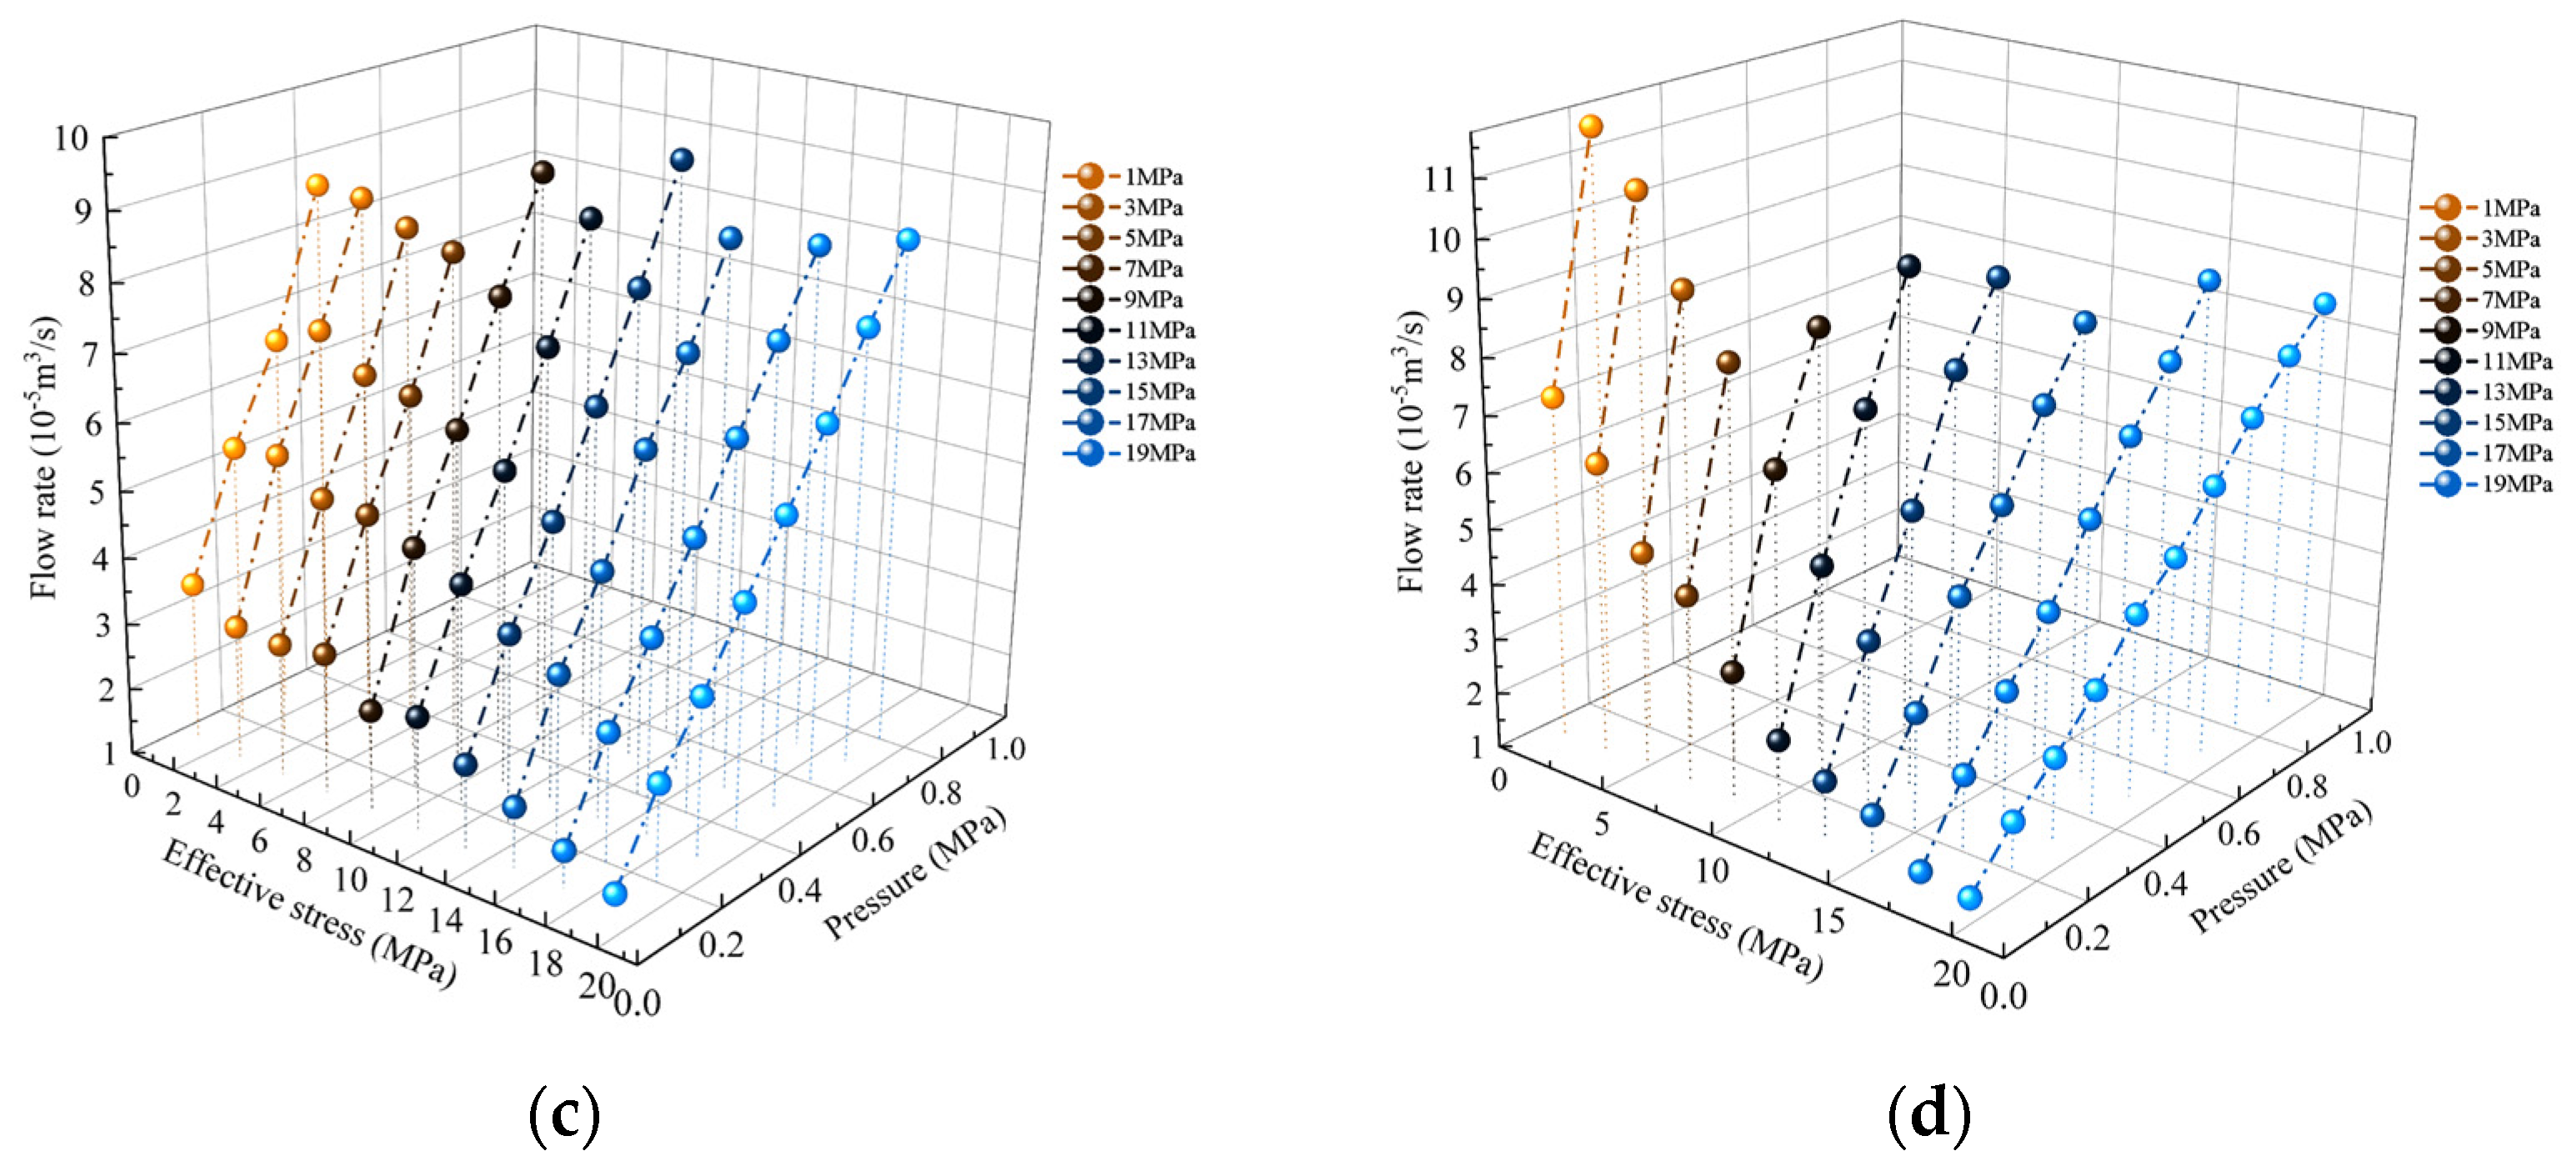
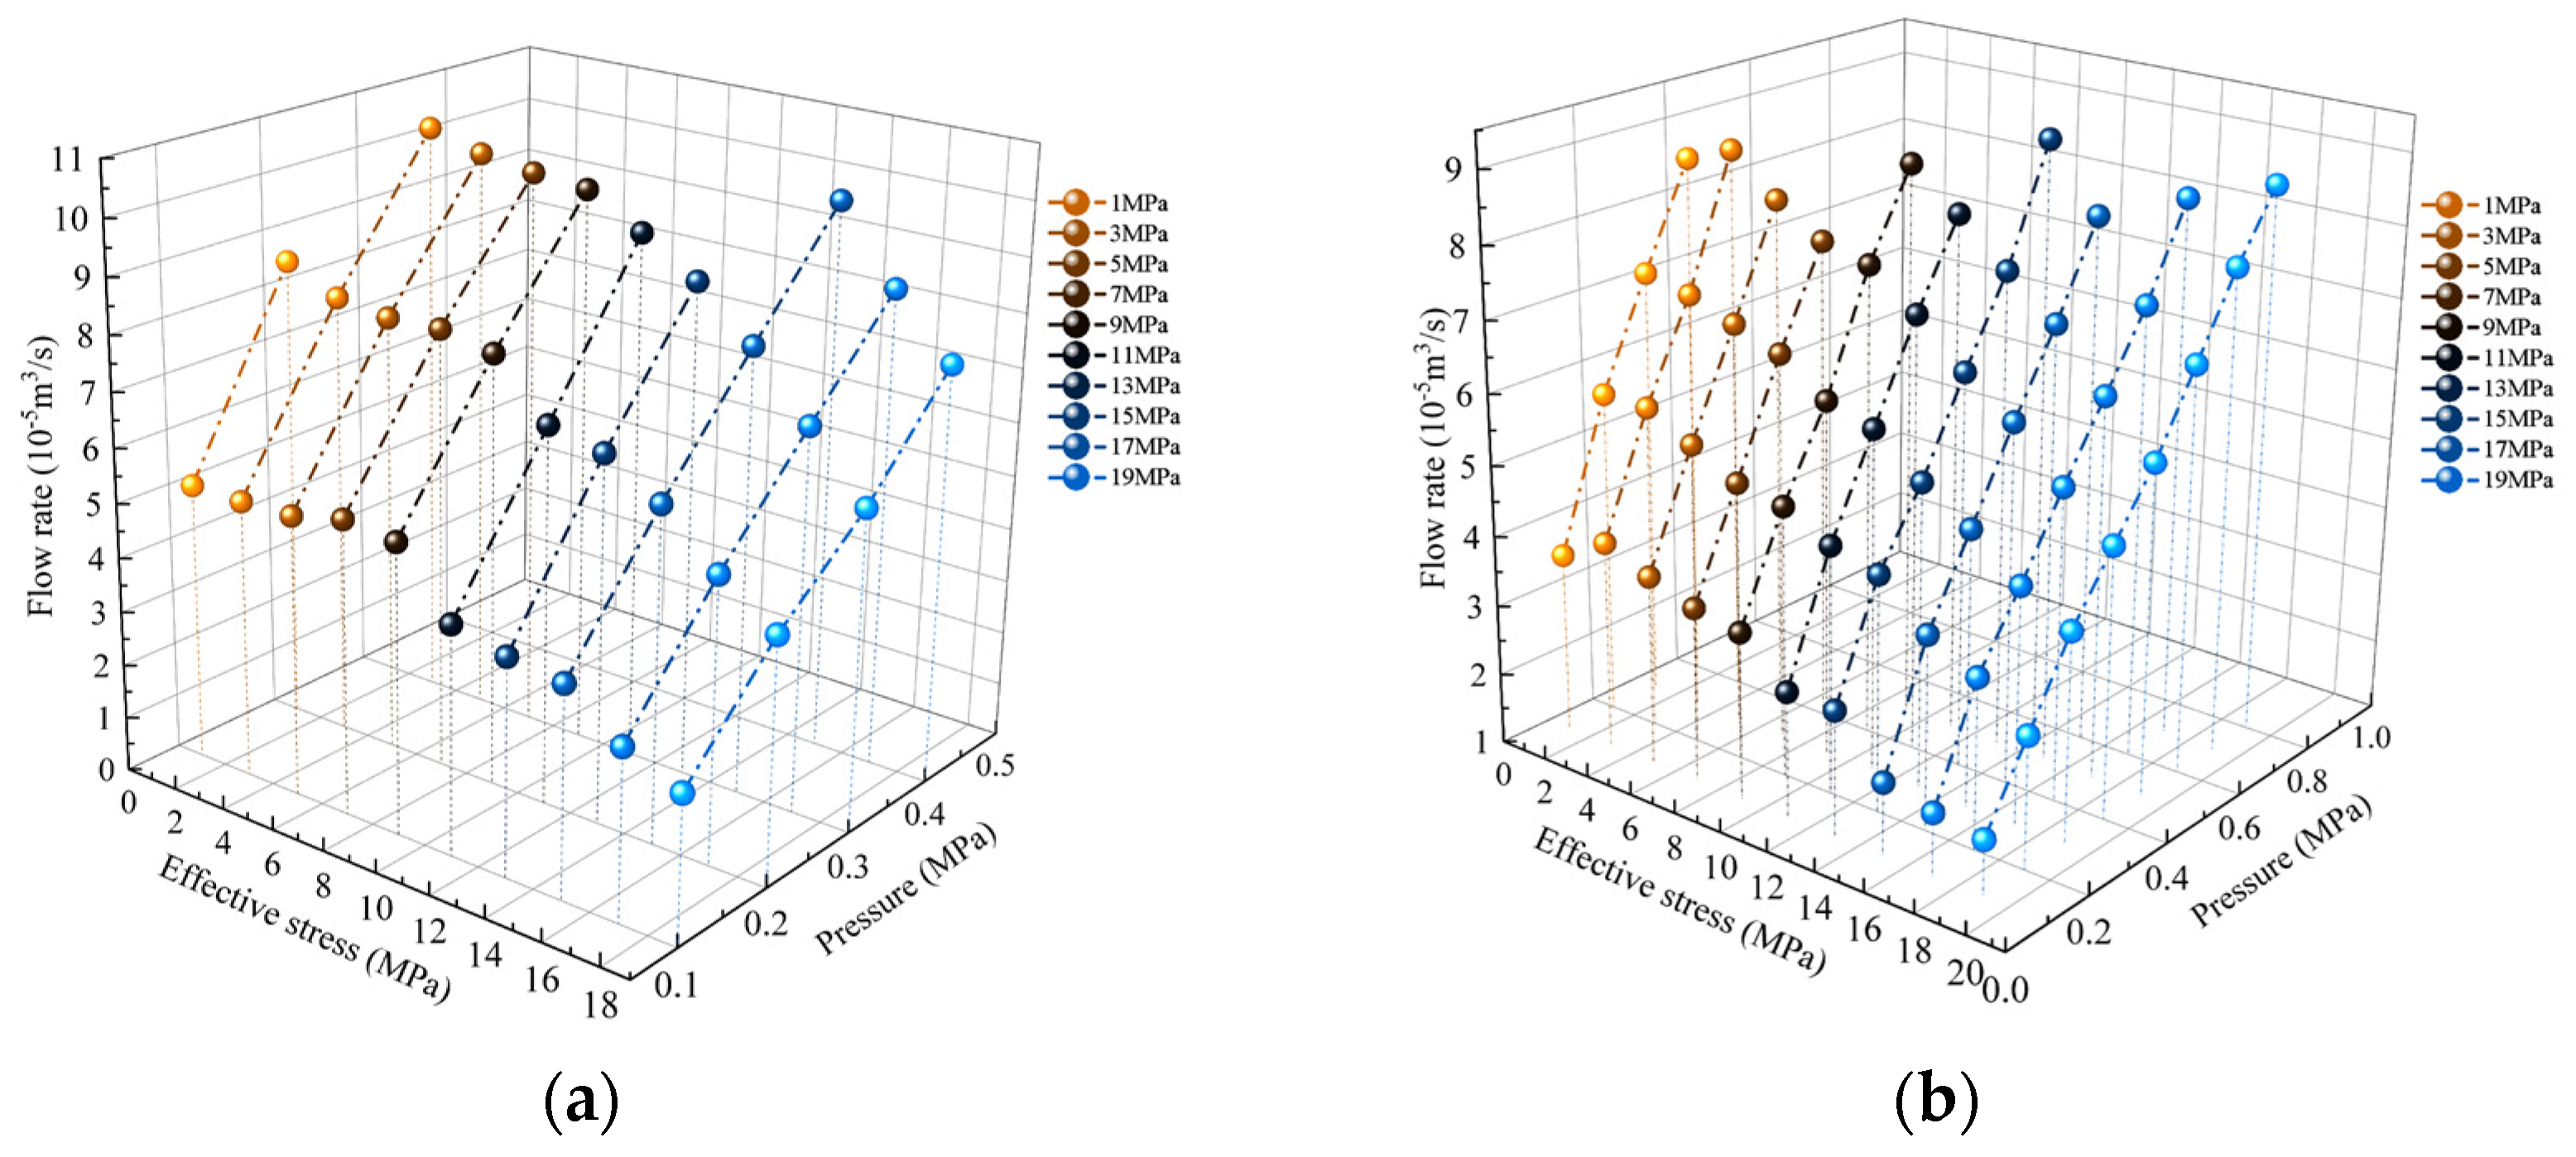
3.1. Flow–Pressure Gradient Curve

Because of the compressibility of gas, the volume of gas at different pressures is different. In this study, the gas is assumed to conform to Boyle’s law, the temperature is constant, and the average gas flow in the fracture is obtained from the gas state equation.
Figure 4 shows the relationship between the gas flow, effective stress, and gas pressure gradient. When the effective stress is constant, the gas flow in the fracture gradually increases with increasing gas pressure, but its growth rate decreases, and the gradients of fluid flow and fluid pressure significantly deviate from the linear growth law. This does not meet the linear trend of Darcy’s law, indicating that nonlinear flow occurs in the fracture. When the gas pressure is constant, the gas flow in the fracture gradually decreases with increasing effective stress, but its decrease rate decreases mainly because the fracture is gradually closed under the effective stress, resulting in an increase in the contact area and a significant change in the flow path.
By comparing the flow rate changes of the four coal samples, it can be seen that under the same effective stress and gas pressure condition, the gas flow rate of coal sample C1 is always the largest, followed by sample C2, C4, and C3. This is because the fracture flow capacity is positively correlated with the initial roughness of the fracture surface. In addition, Figure 4 also shows that all four coal samples have better flow capacity under lower effective stress. Meanwhile, as the gas pressure gradually increases, the gas flow in the fracture deviates from linear growth, showing strong nonlinearity. When the effective stress is high, the continuous increase in effective stress causes the equivalent hydraulic aperture of the fracture to close rapidly, the contact areas of the upper and lower fracture surfaces to increase rapidly, the number of flow channels to decrease substantially, the flow channel to become more tortuous, the flow capacity to decrease significantly, and the degree of nonlinearity to increase.

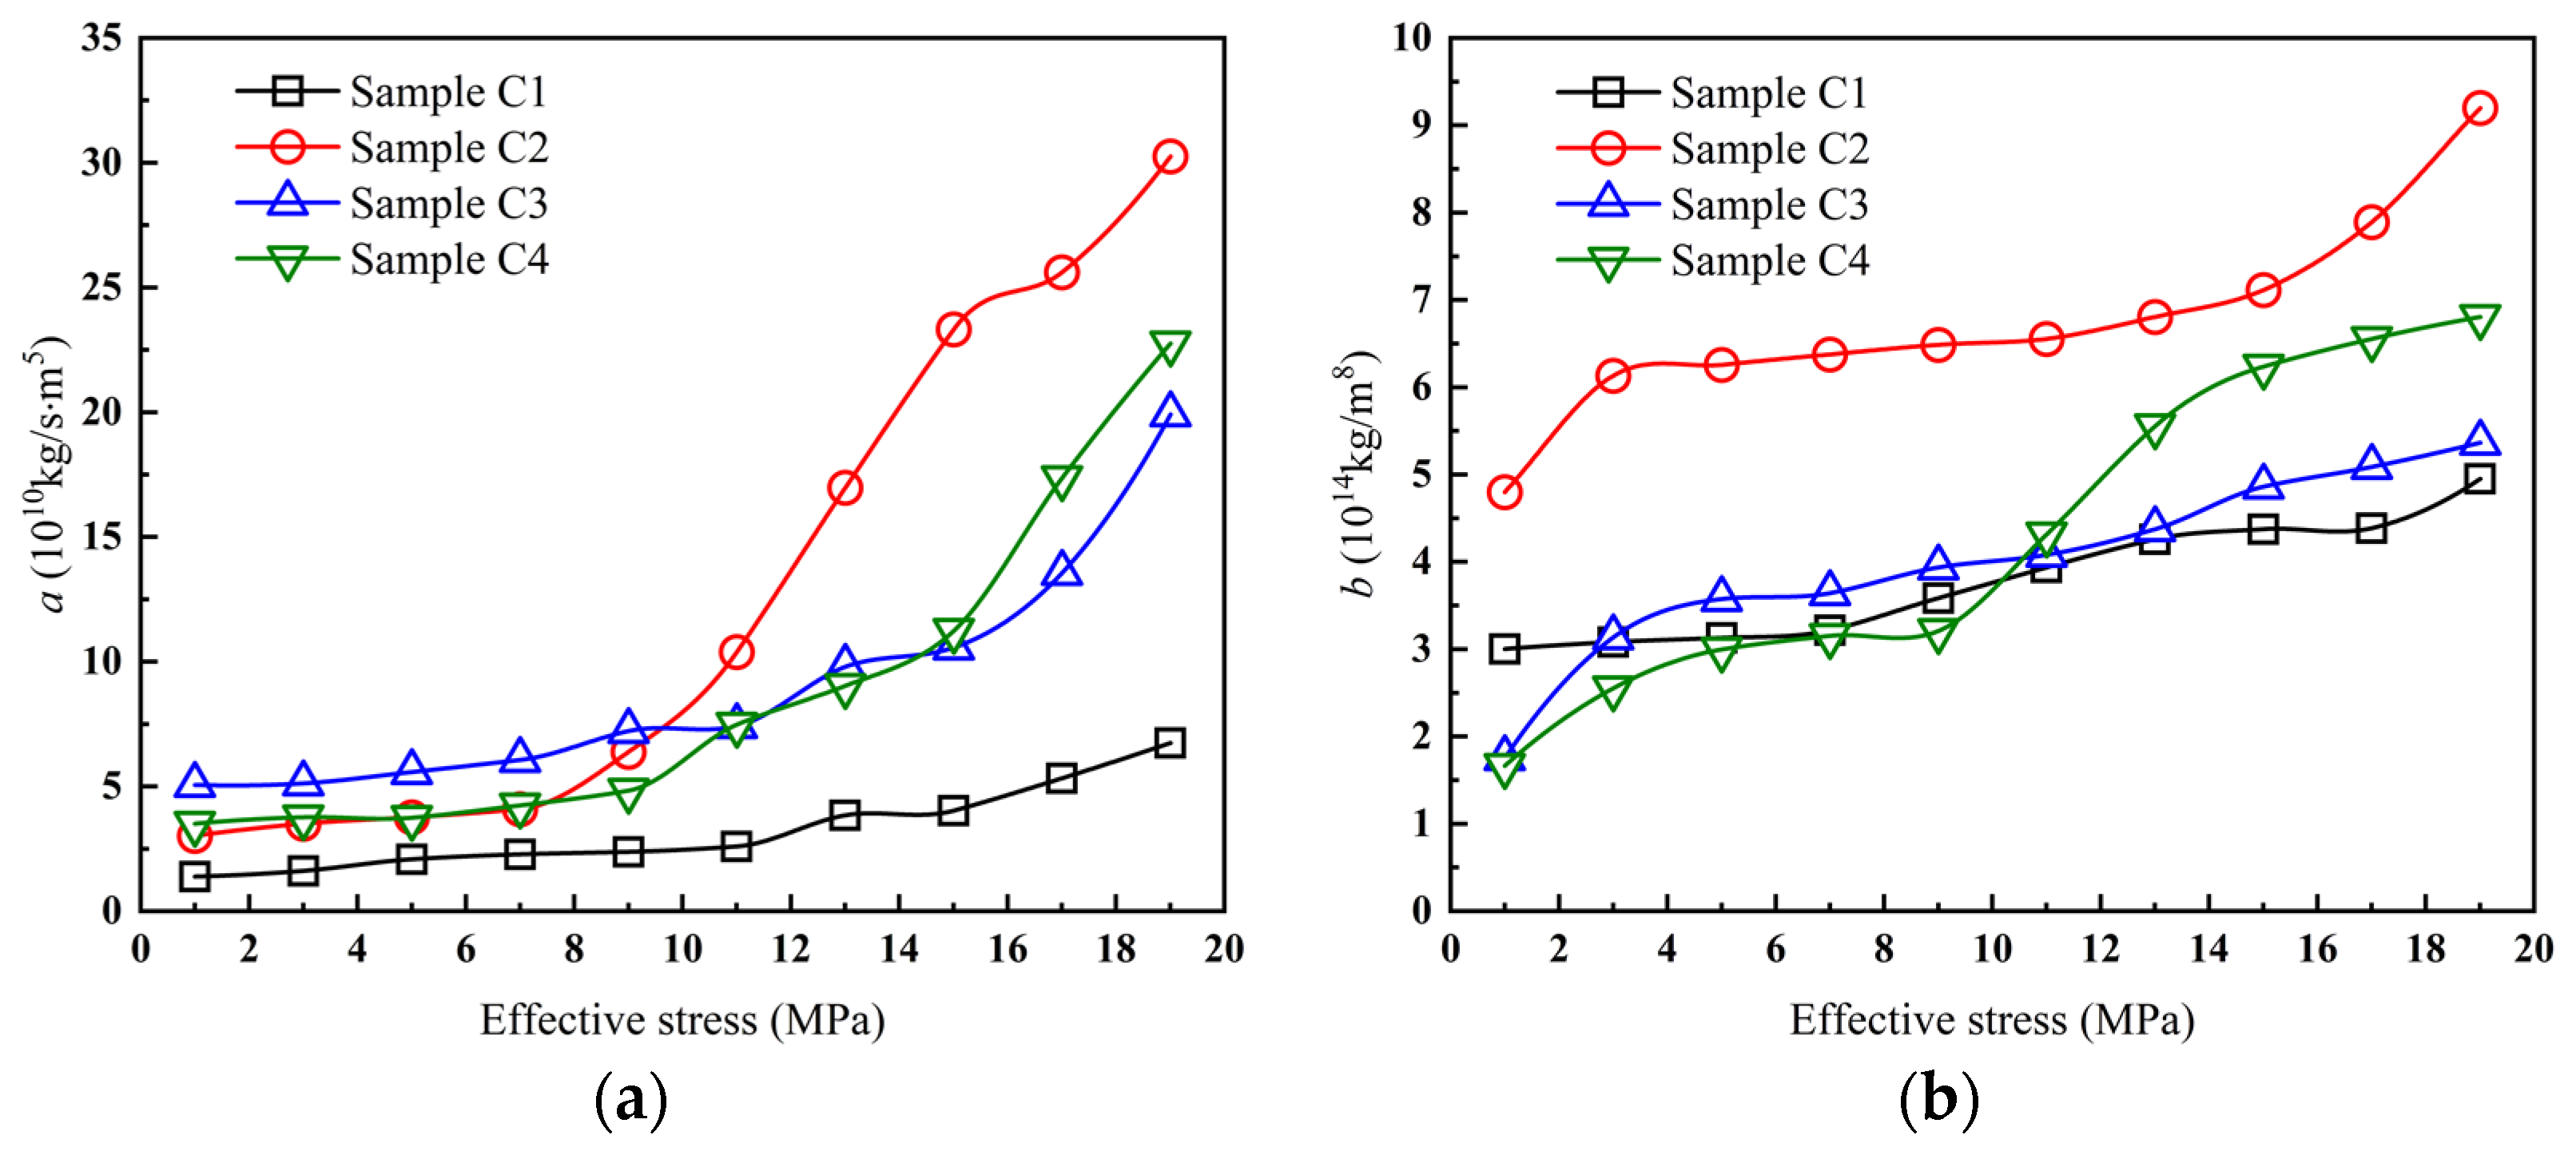
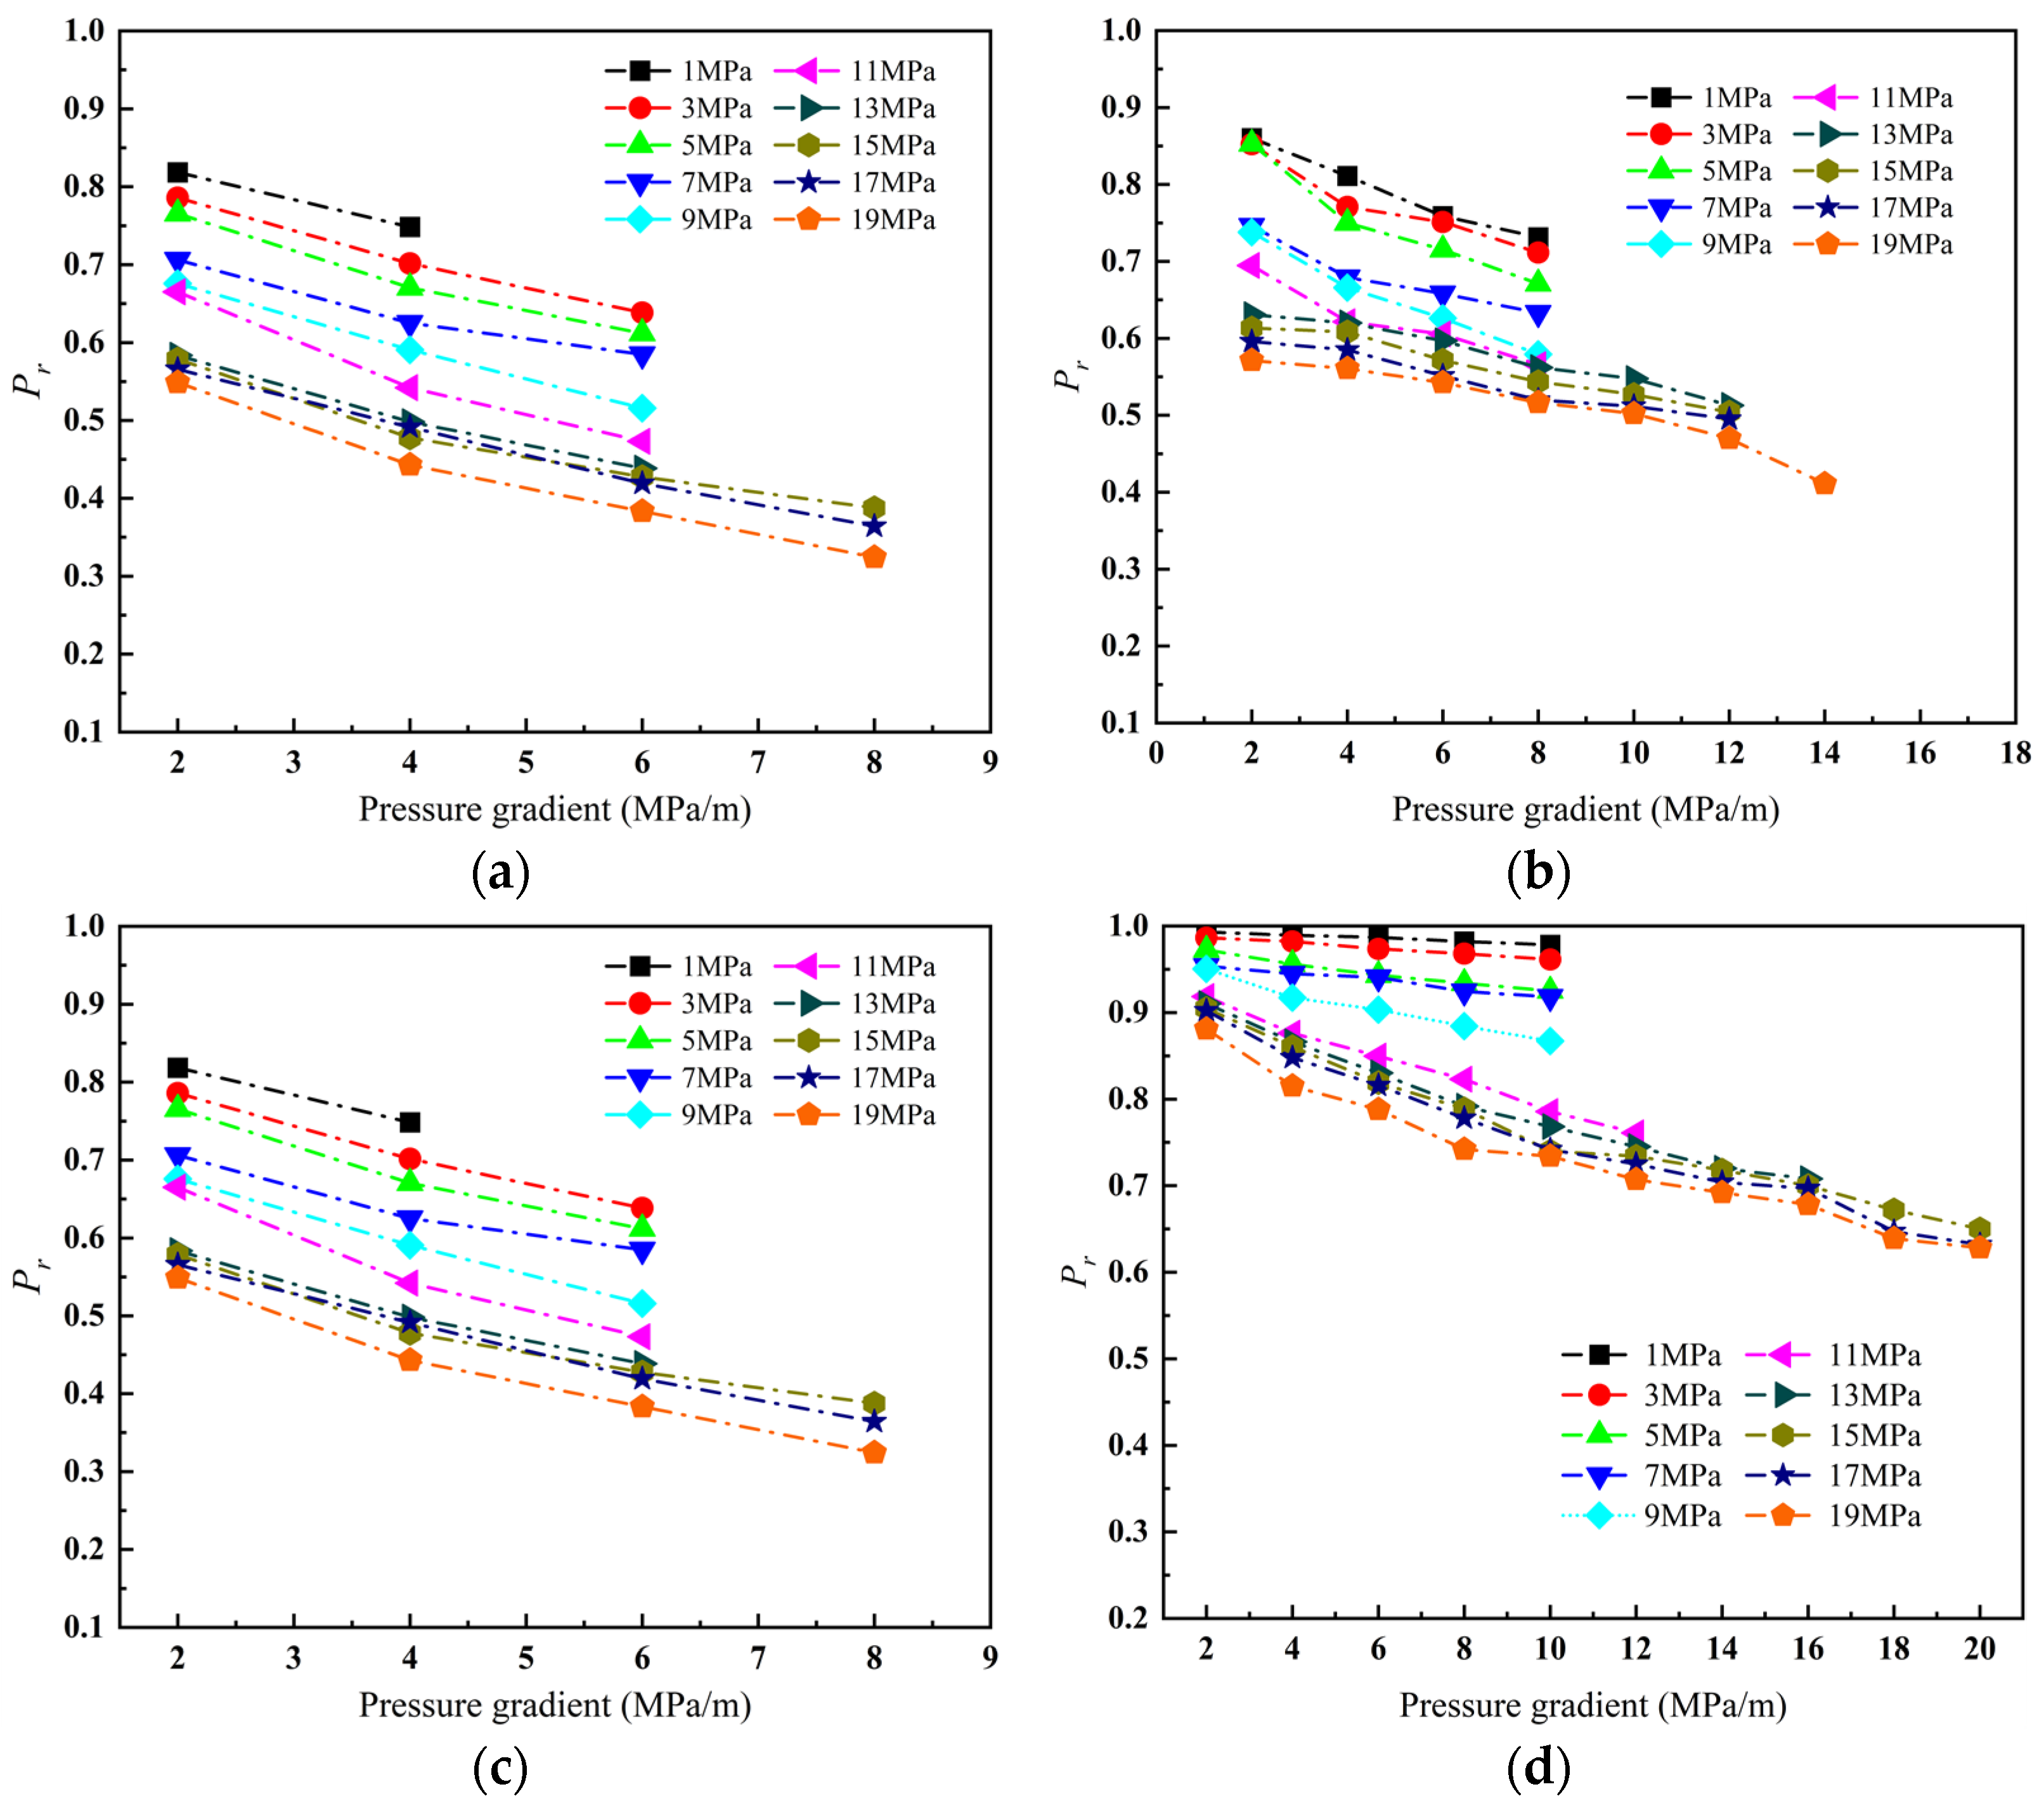
3.2. Nonlinear Seepage Characteristics Based on the Forchheimer Equation

The experimental results show that the variation in gas flow rate with effective stress and gas pressure gradient is not only linear, but also significantly nonlinear. This is because Darcy’s law is based on a linear relationship between seepage velocity and pressure drop in porous media. It is reliable for low flow rates or simplified parallel smooth plate models, for which the relationship between gas flow rate and gas pressure gradient is linear, but cannot describe nonlinear flow. For rough fractures and high gas pressure conditions, the flow will have nonlinear characteristics, and Darcy’s law is not suitable in this case. In past engineering practice, the linear Darcy law has often been used to estimate gas flow growth, which leads to overestimation and a lack of accuracy. Therefore, this study focuses on nonlinear seepage to provide theoretical guidance for engineering practice.
At present, the Forchheimer equation and Izbash equation are often used to describe the nonlinear flow in fractures [20,33,34], namely,
d P d l = ( a Q + b Q 2 )
a = μ k A h , b = β ρ A h 2 ,
where a and b are fitting parameters, with a being the pressure drop due to linear effects (kg·s−1·m−5) and b the pressure drop due to nonlinear effects (kg·m−8); k is the initial permeability of the fracture (m2); Ah is the flow area of the fracture (m2); β is the inertia coefficient; and μ is the dynamic viscosity (Pa·s).
Figure 5 shows the relationship between the fitting coefficients a and b and the effective stress. Both a and b increase with increasing effective stress, indicating that the change in effective stress has a significant impact on both the linear and nonlinear components.
To quantify the degree of nonlinear flow in rough fractures in coal under effective stress and a gas pressure gradient, the ratio of the linear term to the nonlinear term in the Forchheimer equation is defined as the nonlinear factor Pr:
P r = a Q a Q + b Q 2 = 1 1 + b Q / a
When Pr is less than 0.9, Equation (6) indicates that the flow has changed from linear to nonlinear. When Pr = 0.9–1, the fluid motion is close to linear Darcy flow, and the nonlinear effect can be ignored [35].
The relationship between the nonlinear factor and the gas pressure gradient is shown in Figure 6 for each of the four single fracture coal samples. The trends of the four nonlinear factors with changing gas pressure are basically consistent, as follows: ① Under the same effective stress, the nonlinear factor decreases with increasing gas pressure gradient, indicating that the degree of nonlinearity gradually increases. ② In the initial stage of stress loading, the nonlinear factor decreases significantly with increasing pressure gradient, and eventually becomes stable. The reason is that in the initial loading stage, the fracture roughness is higher and the initial fracture surface area is larger. Therefore, under stress, the contact area of the upper and lower fracture surfaces is still small, there are more flow channels, and the degree of nonlinearity is low. ③ When the stress load reaches a higher level, the nonlinear factor decreases significantly with increasing pressure gradient. The reason for this may be that under the high effective stress, the local stress of the fracture surface is high enough, and the contact area of the upper and lower fracture surfaces is large, resulting in significantly fewer flow channels, more tortuous flow channels, and more obvious nonlinear effects. This is consistent with the conclusion of Xia et al. [36] based on their experiments. The above analysis shows that the pressure drop due to nonlinearity cannot be ignored under effective stress with a high gas pressure gradient. Therefore, the fluid motion in this case cannot be described only by the Darcy equation.
The Reynolds number Rec is commonly used to distinguish the gas flow pattern in fractures when transitioning from linear to nonlinear flow [37]:
Re = ρ Q μ w
To accurately calculate the critical Reynolds number when the gas flow in the fracture begins to change from linear to nonlinear, the nonlinear factor Pr = 0.9 is taken as the threshold for dividing linear and nonlinear flow, and the corresponding Reynolds number is the critical Reynolds number:
Re c = a ρ ( 1 P r ) b μ w P r
Figure 7 shows the curve of the critical Reynolds number changing with effective stress. The calculated critical Reynolds number Rec is in the range of 3.59–28.96 and decreases with increasing effective stress. As the effective stress increases, the flow in the fracture changes more easily from laminar to turbulent, and the nonlinear component increases.
The geometry of the fracture surface is closely related to the flow capacity, and the aperture is the most intuitive parameter for measuring the flow capacity of the fracture. However, the cubic flow calculation is not accurate owing to the roughness, the contact between the upper and lower fracture surfaces, and the uneven mechanical pore size distribution. Therefore, a nonlinear correction factor f is usually introduced to describe the contact between broken surfaces, rough protrusions, and fluid properties. This expands the application of the cubic law [38,39]:
Q = w e h 3 12 μ 1 f d P d l
where eh is the mechanical hydraulic aperture.
Combining the modified cubic law with the Forchheimer equation yields the equivalent hydraulic aperture, considering the roughness of the fracture surface and the nonlinear effect on the gas [38]:
e h = ( 12 μ w a ) 1 / 3
Figure 8 shows the relationship between the equivalent hydraulic aperture and effective stress. The equivalent hydraulic aperture of each of the four coal samples is inversely proportional to the effective stress. In the initial stage of effective stress loading, the difference between the peak and valley of the fracture surface is relatively large, and it is sensitive to effective stress. When the effective stress on a coal specimen is loaded to a certain value (9–11 MPa for C1, 5–7 MPa for C2, 7–9 MPa for C3, and 7–9 MPa for C4), the equivalent hydraulic aperture decreases more rapidly. This is the critical value for effective stress sensitivity. With the gradual loading of the effective stress, the contact area of the fracture surface of each sample increases significantly, and the decrease rate of the equivalent hydraulic aperture decreases gradually. The influence of stress on the fracture flow capacity was evaluated according to the damage rate of the equivalent hydraulic aperture defined by Li [40]. The calculated damage rates were 42.03% for sample C1, 53.61% for C2, 36.67% for C3, and 45.61% for C4.
Figure 9 shows the relationship between coal sample permeability and effective stress. During effective stress loading, the permeability of the four coal samples is inversely proportional to the effective stress, that is, the permeability decreases gradually with increasing effective stress. When the effective stress is 1 MPa, C1 has the highest permeability, followed by C2, C4, and C3 in descending order. When the effective stress rises to 19 MPa, C1 has the highest permeability, followed by C3, C4, and C2.

3.3. Nonlinear Seepage Characteristics Based on the Izbash Equation

The Izbash equation is based on the premise that an actual engineering situation involves a power relationship between the fluid pressure gradient in the fracture and the fluid flow rate [41,42]:
d P d l = λ Q m ,
where λ and m are empirical constants. When 1 < m ≤ 2, the fluid motion in the fracture changes from linear to nonlinear. When m = 1, the fluid motion is linear Darcy flow, the nonlinear effect can be ignored, and Equation (11) can be considered the linear Darcy law [43].
The experimental data were fitted using the Izbash equation, and the fitting results are shown in Table 1. The R2 values are greater than 0.95, showing that the Izbash equation also well describes nonlinear flow in fractures.
According to the Izbash equation, the coefficient m represents the degree of deviation from linearity of the gas flow. The closer m is to 1, the closer the degree of nonlinearity of the fluid flow is to Darcy’s law. Therefore, to better show the influence of the change in effective stress on the coefficient m, we fitted the test data with the Izbash equation, as shown in Figure 10. We can see from Figure 10 that the coefficient m changes basically in the same way with the effective stress for all four coal samples and increases with increasing effective stress. When the effective stress is 7–9 MPa for C1 and C2, 3–5 MPa for C3, and 9–11 MPa for C4, the coefficient m increases significantly with increasing effective stress, and the degree of nonlinearity is significantly enhanced.
Figure 11 shows the fitting curve between coefficient λ and effective stress. The number λ increases gradually with increasing effective stress. Among the four coal samples, λ for sample C2 has the highest growth rate of 86.85, followed by that of C4 at 61.86, C1 at 56.98, and C3 with the lowest growth rate of 52.02. The reason may be that the flow capacity of the fracture depends on the geometry of the fracture surface. In the initial stage of effective stress loading, the peak–valley difference of the fracture sample is large, the contact area of the upper and lower fracture surfaces is small, and the flow capacity is still large. With further increases in the effective stress, the fracture surface closes quickly, and the flow capacity decreases significantly.
Figure 12 depicts the relationship between the equivalent hydraulic aperture and effective stress. During gradual loading of effective stress, the equivalent hydraulic aperture has a monotonically inverse relationship with the effective stress for all four coal samples. The damage rates of the equivalent hydraulic aperture are 63.27% for sample C2, followed by 53.22% for C4, 46.95% for C1, and 40.57% for C3.

3.4. Discussion

The Forchheimer equation can be derived from the Navier–Stokes equation, which has a clear theoretical basis, and each parameter has a clear physical significance. In addition, the Forchheimer equation can indirectly obtain the permeability at all levels of effective stress and determine the magnitudes of nonlinear flow parameters. The Izbash equation is an empirical fitting equation established on the basis of many experiments. It lacks the subtle characterization of nonlinear flow parameters and is used more in engineering practice. The coefficients of the Forchheimer and Izbash equations correspond to the nonlinear flow in rough fractures in coal. In the Forchheimer equation, Pr < 0.9 corresponds to m > 1 in the Izbash equation, which indicates that fluid flow in the fracture is nonlinear, while Pr = 0.9–1 corresponds to m = 1, indicating that the fluid motion in the fracture is close to linear Darcy flow. From the data fitting in Figure 13, we can see that the fluctuation range of R2 for the Izbash equation is larger than that of the Forchheimer equation. Therefore, the Forchheimer equation is more suitable than the Izbash equation for describing nonlinear flow in rough fractures. In general, both the Forchheimer and Izbash equations can characterize the nonlinear flow in rough fractures in coal during stress loading, but the Forchheimer equation better reveals the cause of nonlinear flow when determining the degree of nonlinearity.
However, there are still some shortcomings in the current research study. Due to the limitations of the experimental equipment, the research results ignore the influence of intermediate principal stress on the nonlinear seepage law of rough fractures and cannot truly reflect the stress environment on site. Our future research work will focus on the mechanism of nonlinear flow formation in rough fractures under true triaxial stress conditions and the measurement of the degree of nonlinear flow.

4. Conclusions

The flow characteristics of coalbed methane are significantly affected by fracture morphology and stress environment. This study carried out seepage tests in rough fractures under different effective stresses and gas pressure gradients, and analyzed the gas flow variation in rough fractures and the evolution from linear to nonlinear seepage. This revealed the mechanism of generation of nonlinear flow in rough fractures in coal during stress loading. The main findings and conclusions are as follows:
(1)
Under stress loading, the gas flow patterns in rough fractures in coal show obvious nonlinear seepage characteristics, and the nonlinearity gradually increases with increasing effective stress and gas pressure gradient.
(2)
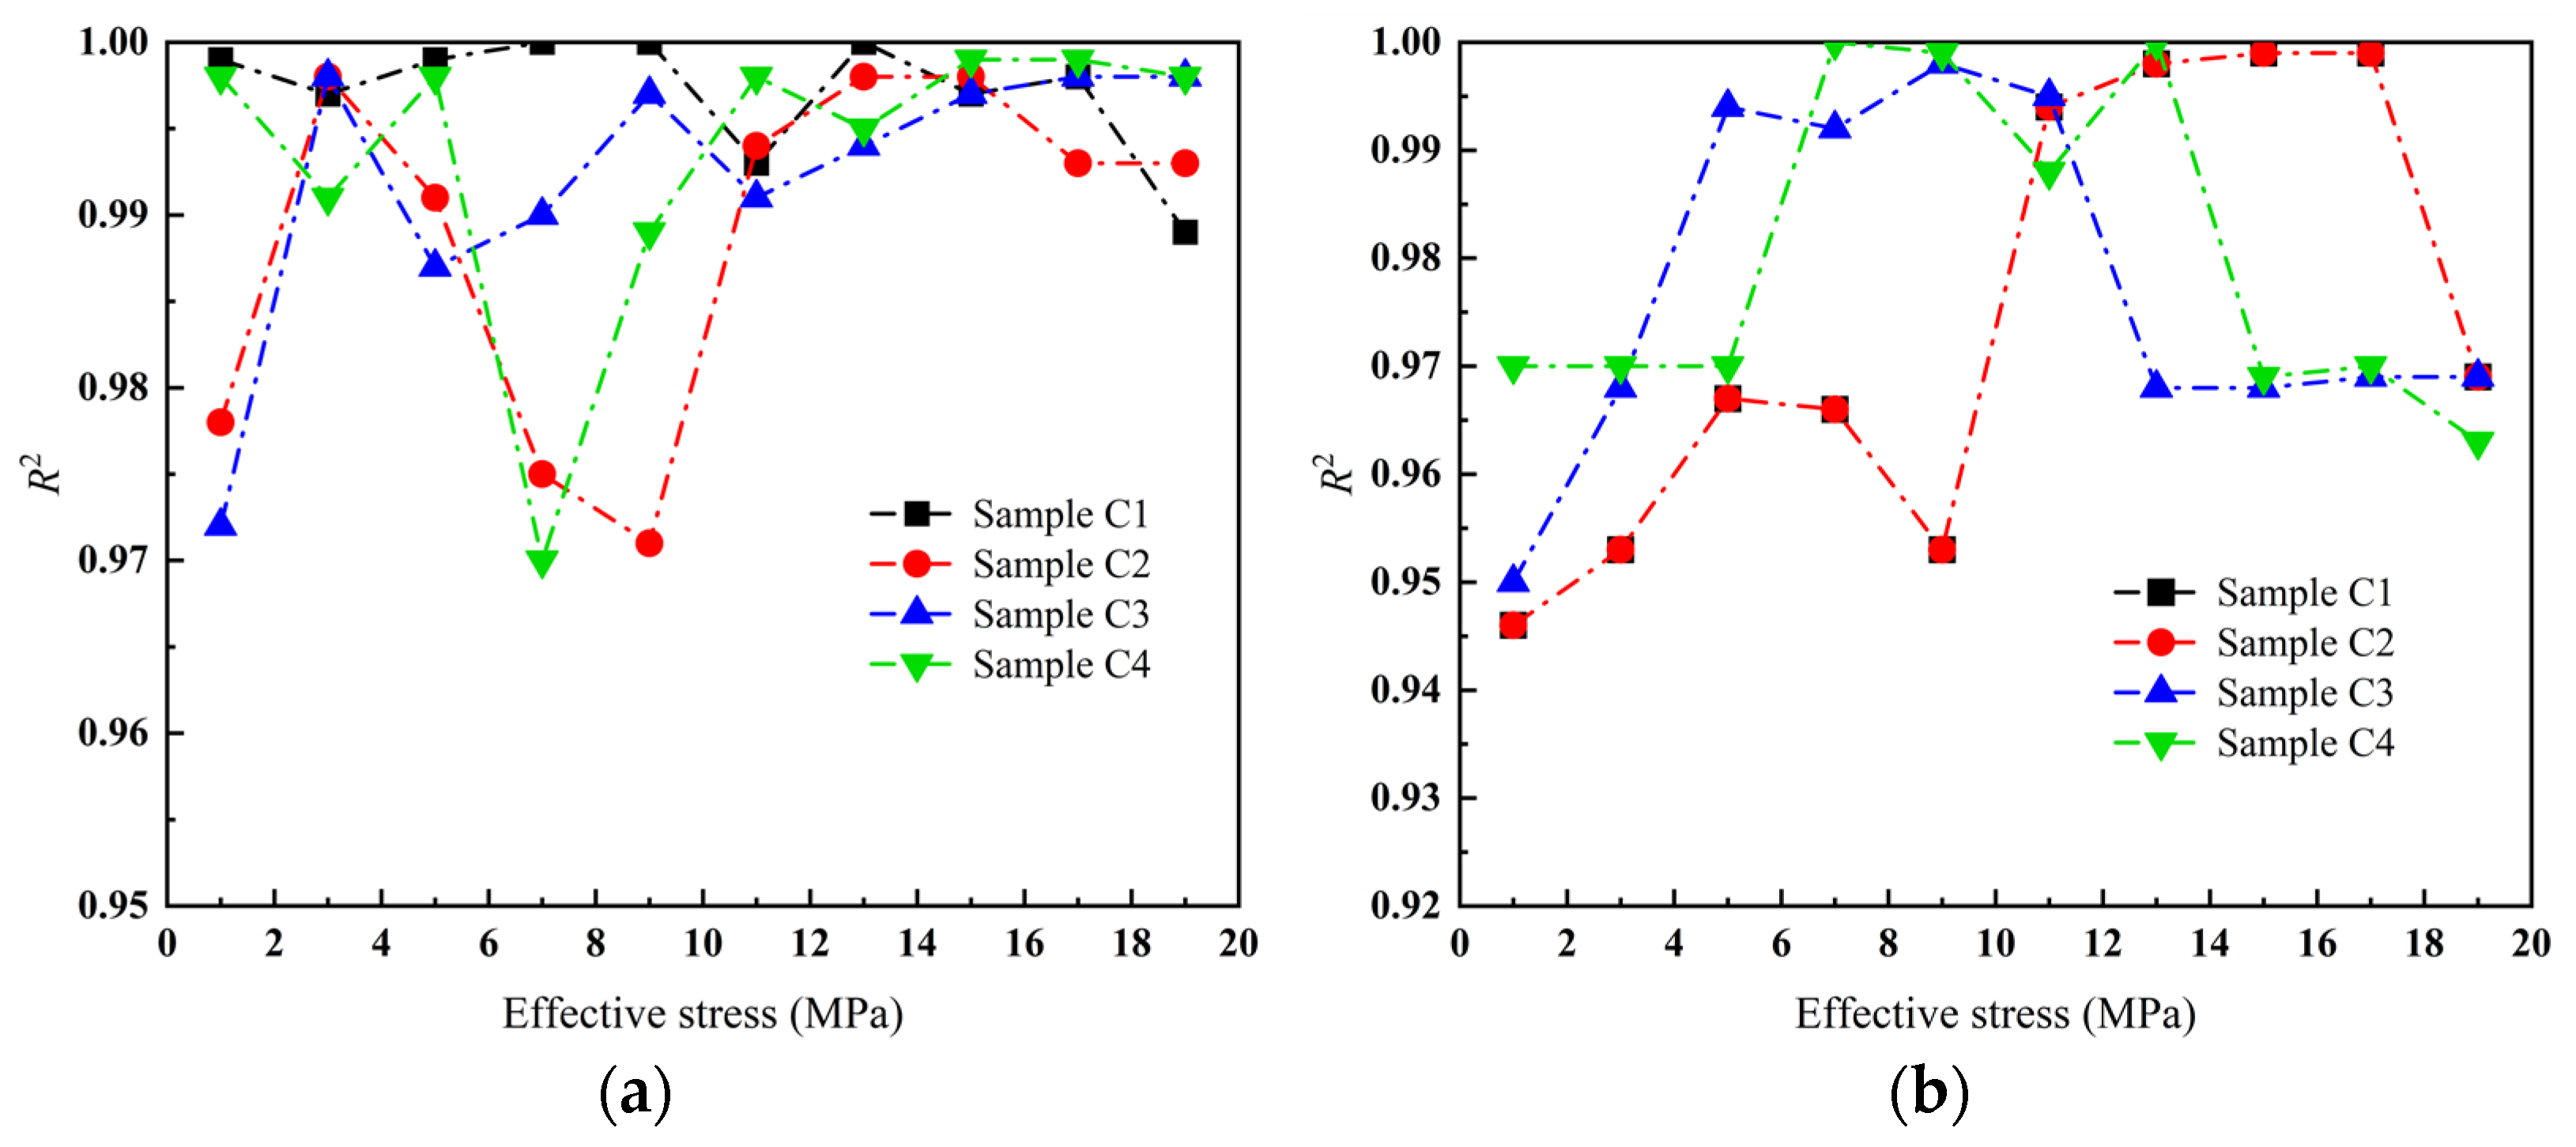
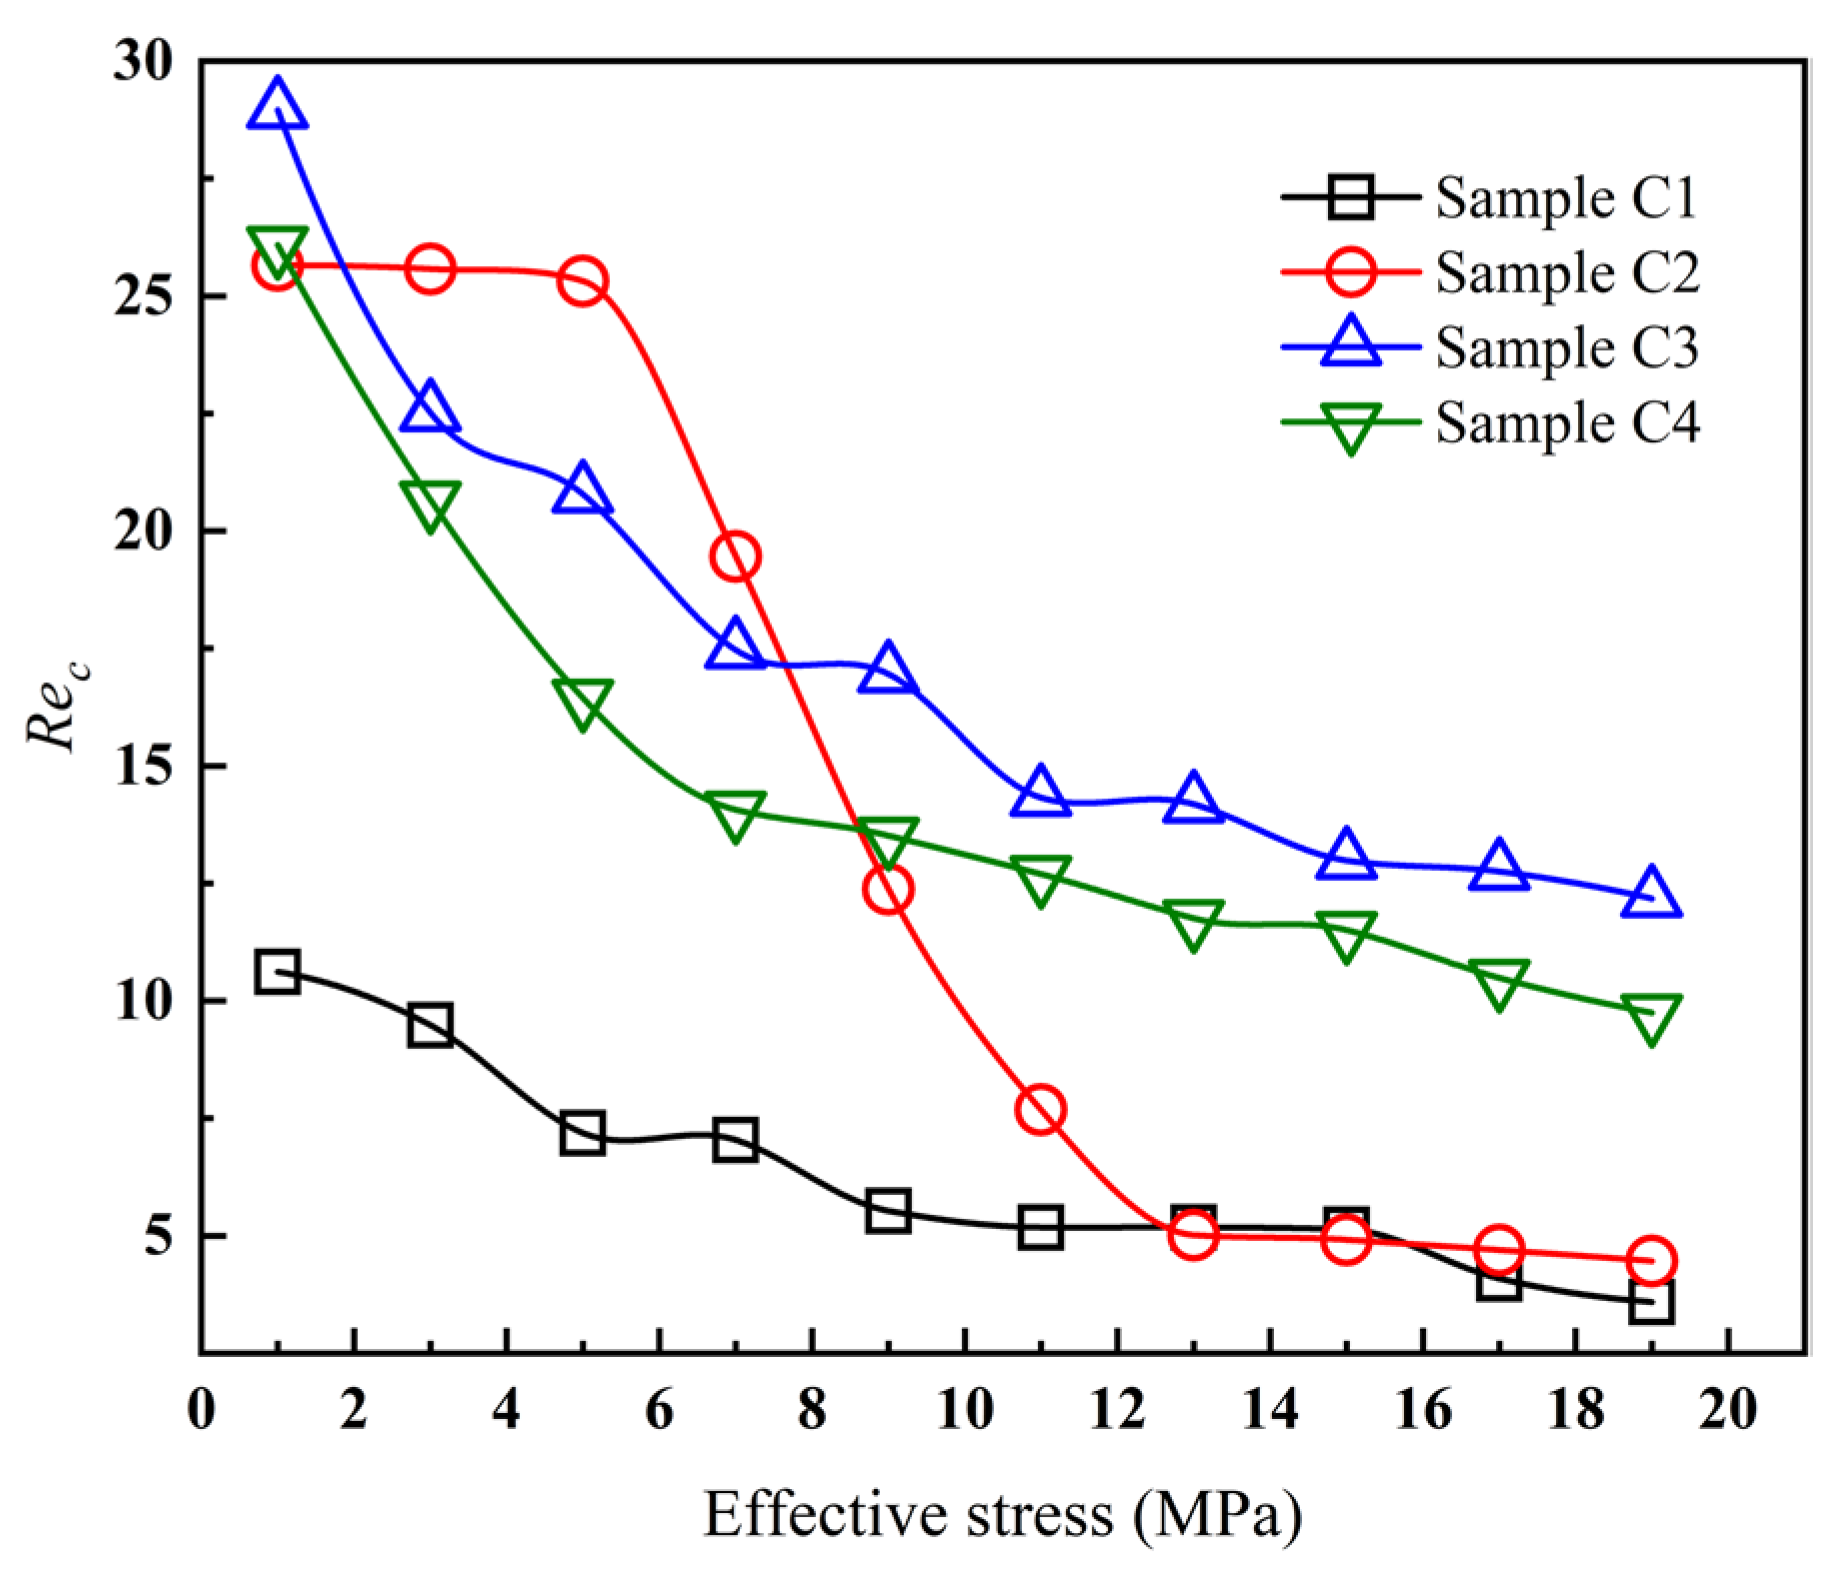
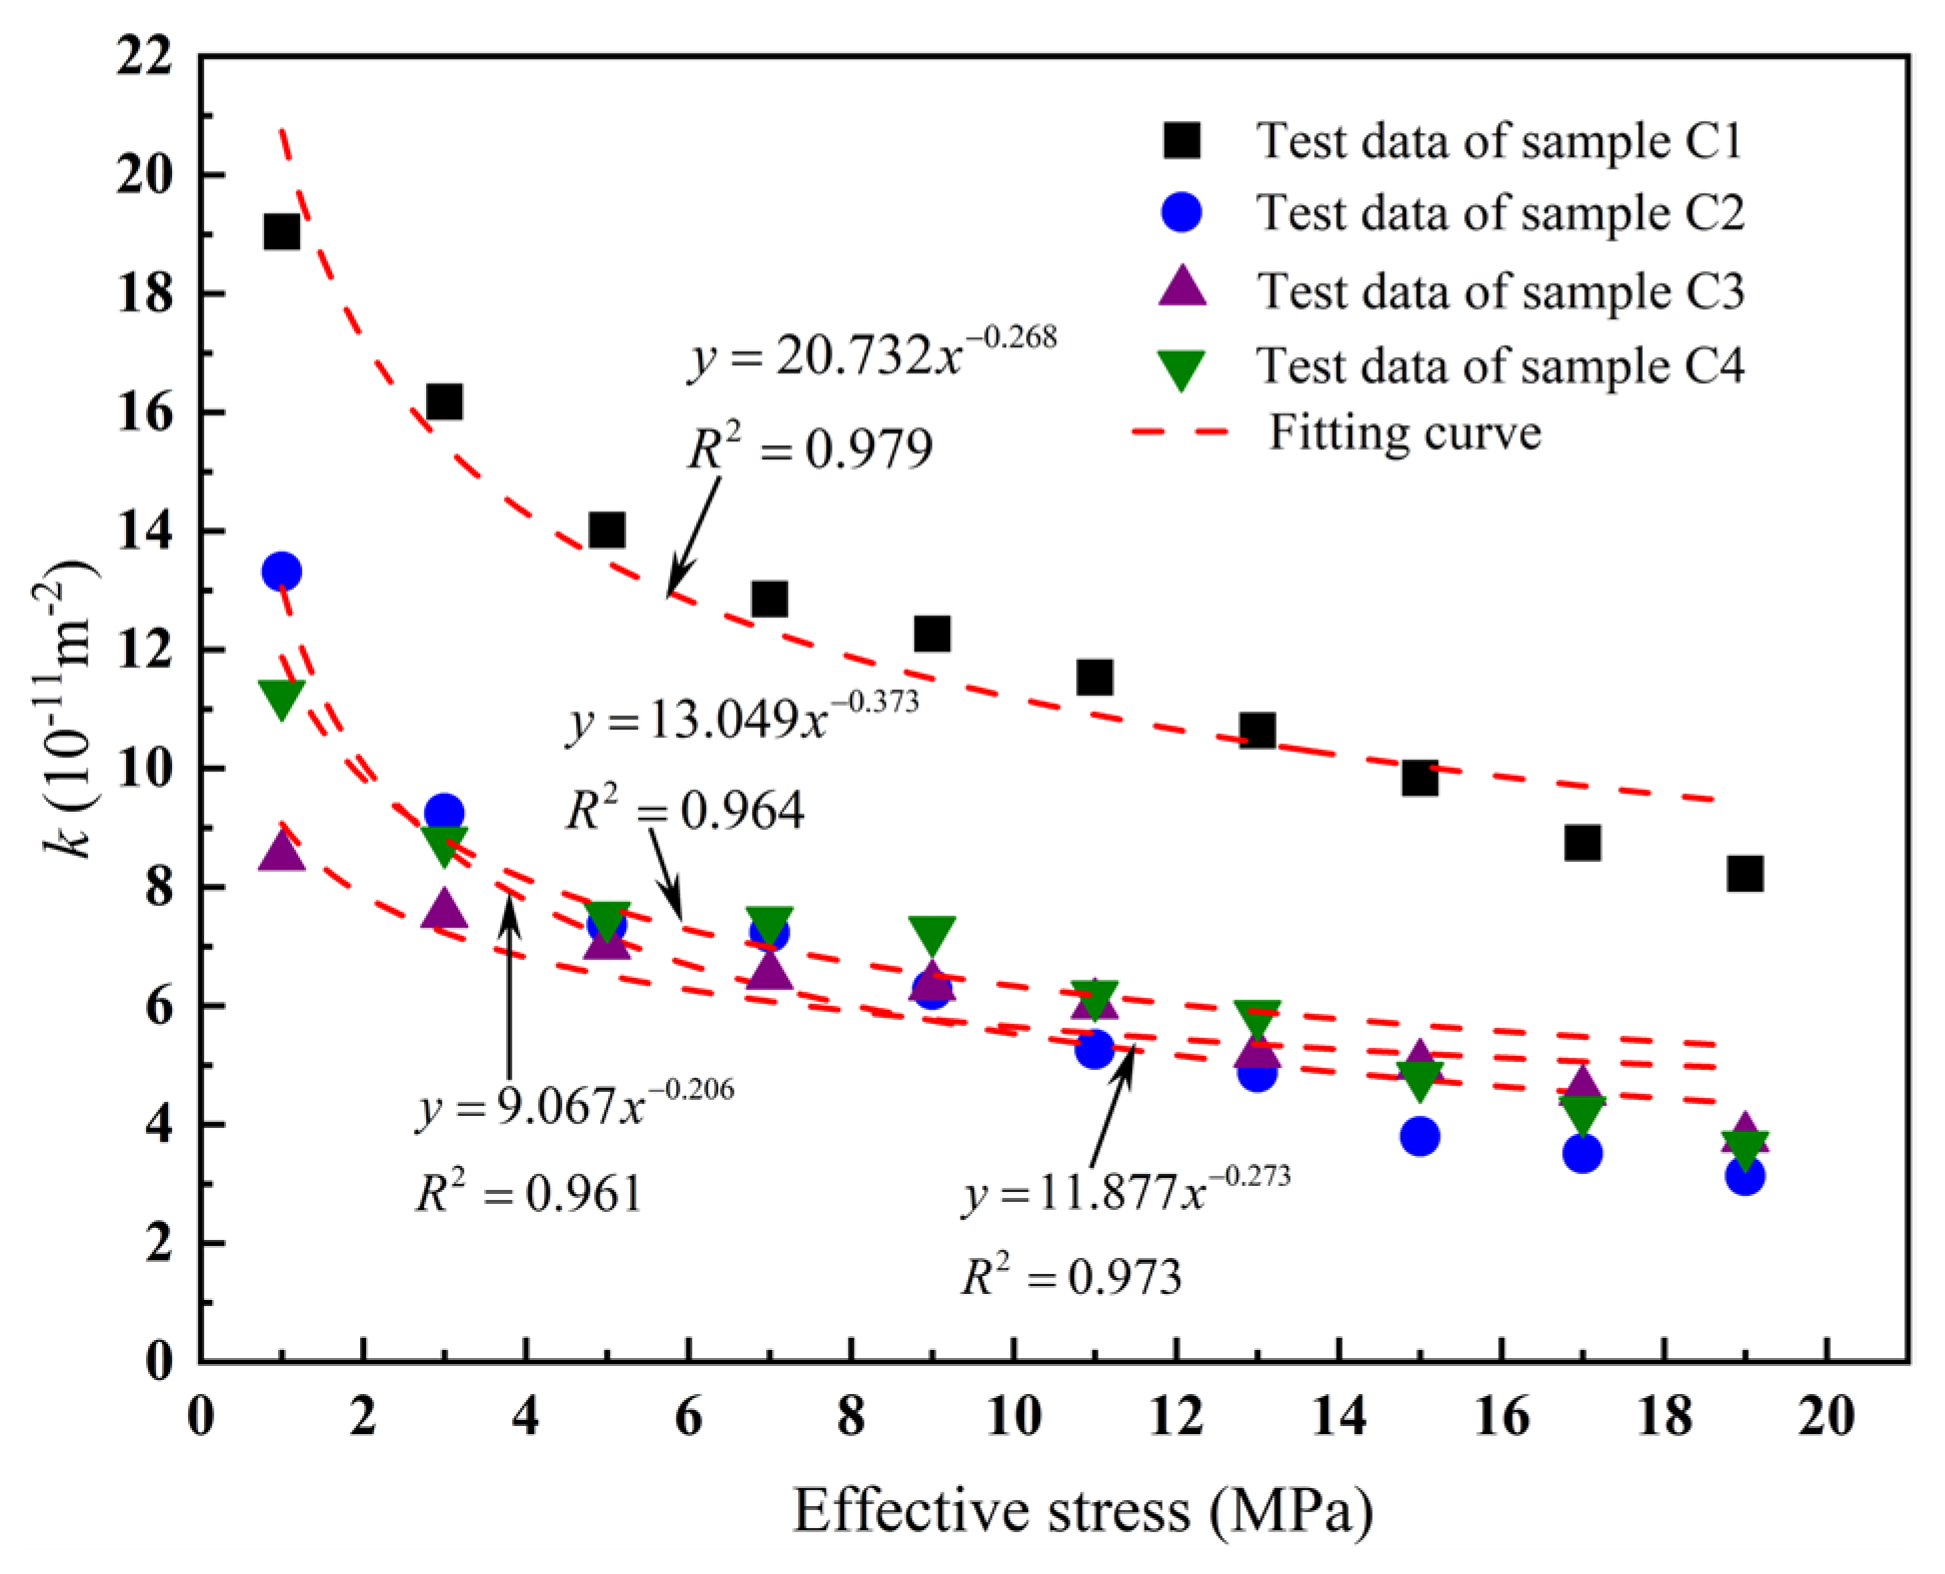
When the Forchheimer equation is used to characterize gas transport in the rough fracture, the coefficients a and b increase gradually with increasing effective stress, and the relationship between the permeability and the effective stress is a monotonically inverse power function. The nonlinear factor Pr and critical Reynolds number Rec can effectively determine the degree of nonlinear flow due to inertial effects, and both gradually decrease with increasing effective stress.
(3)
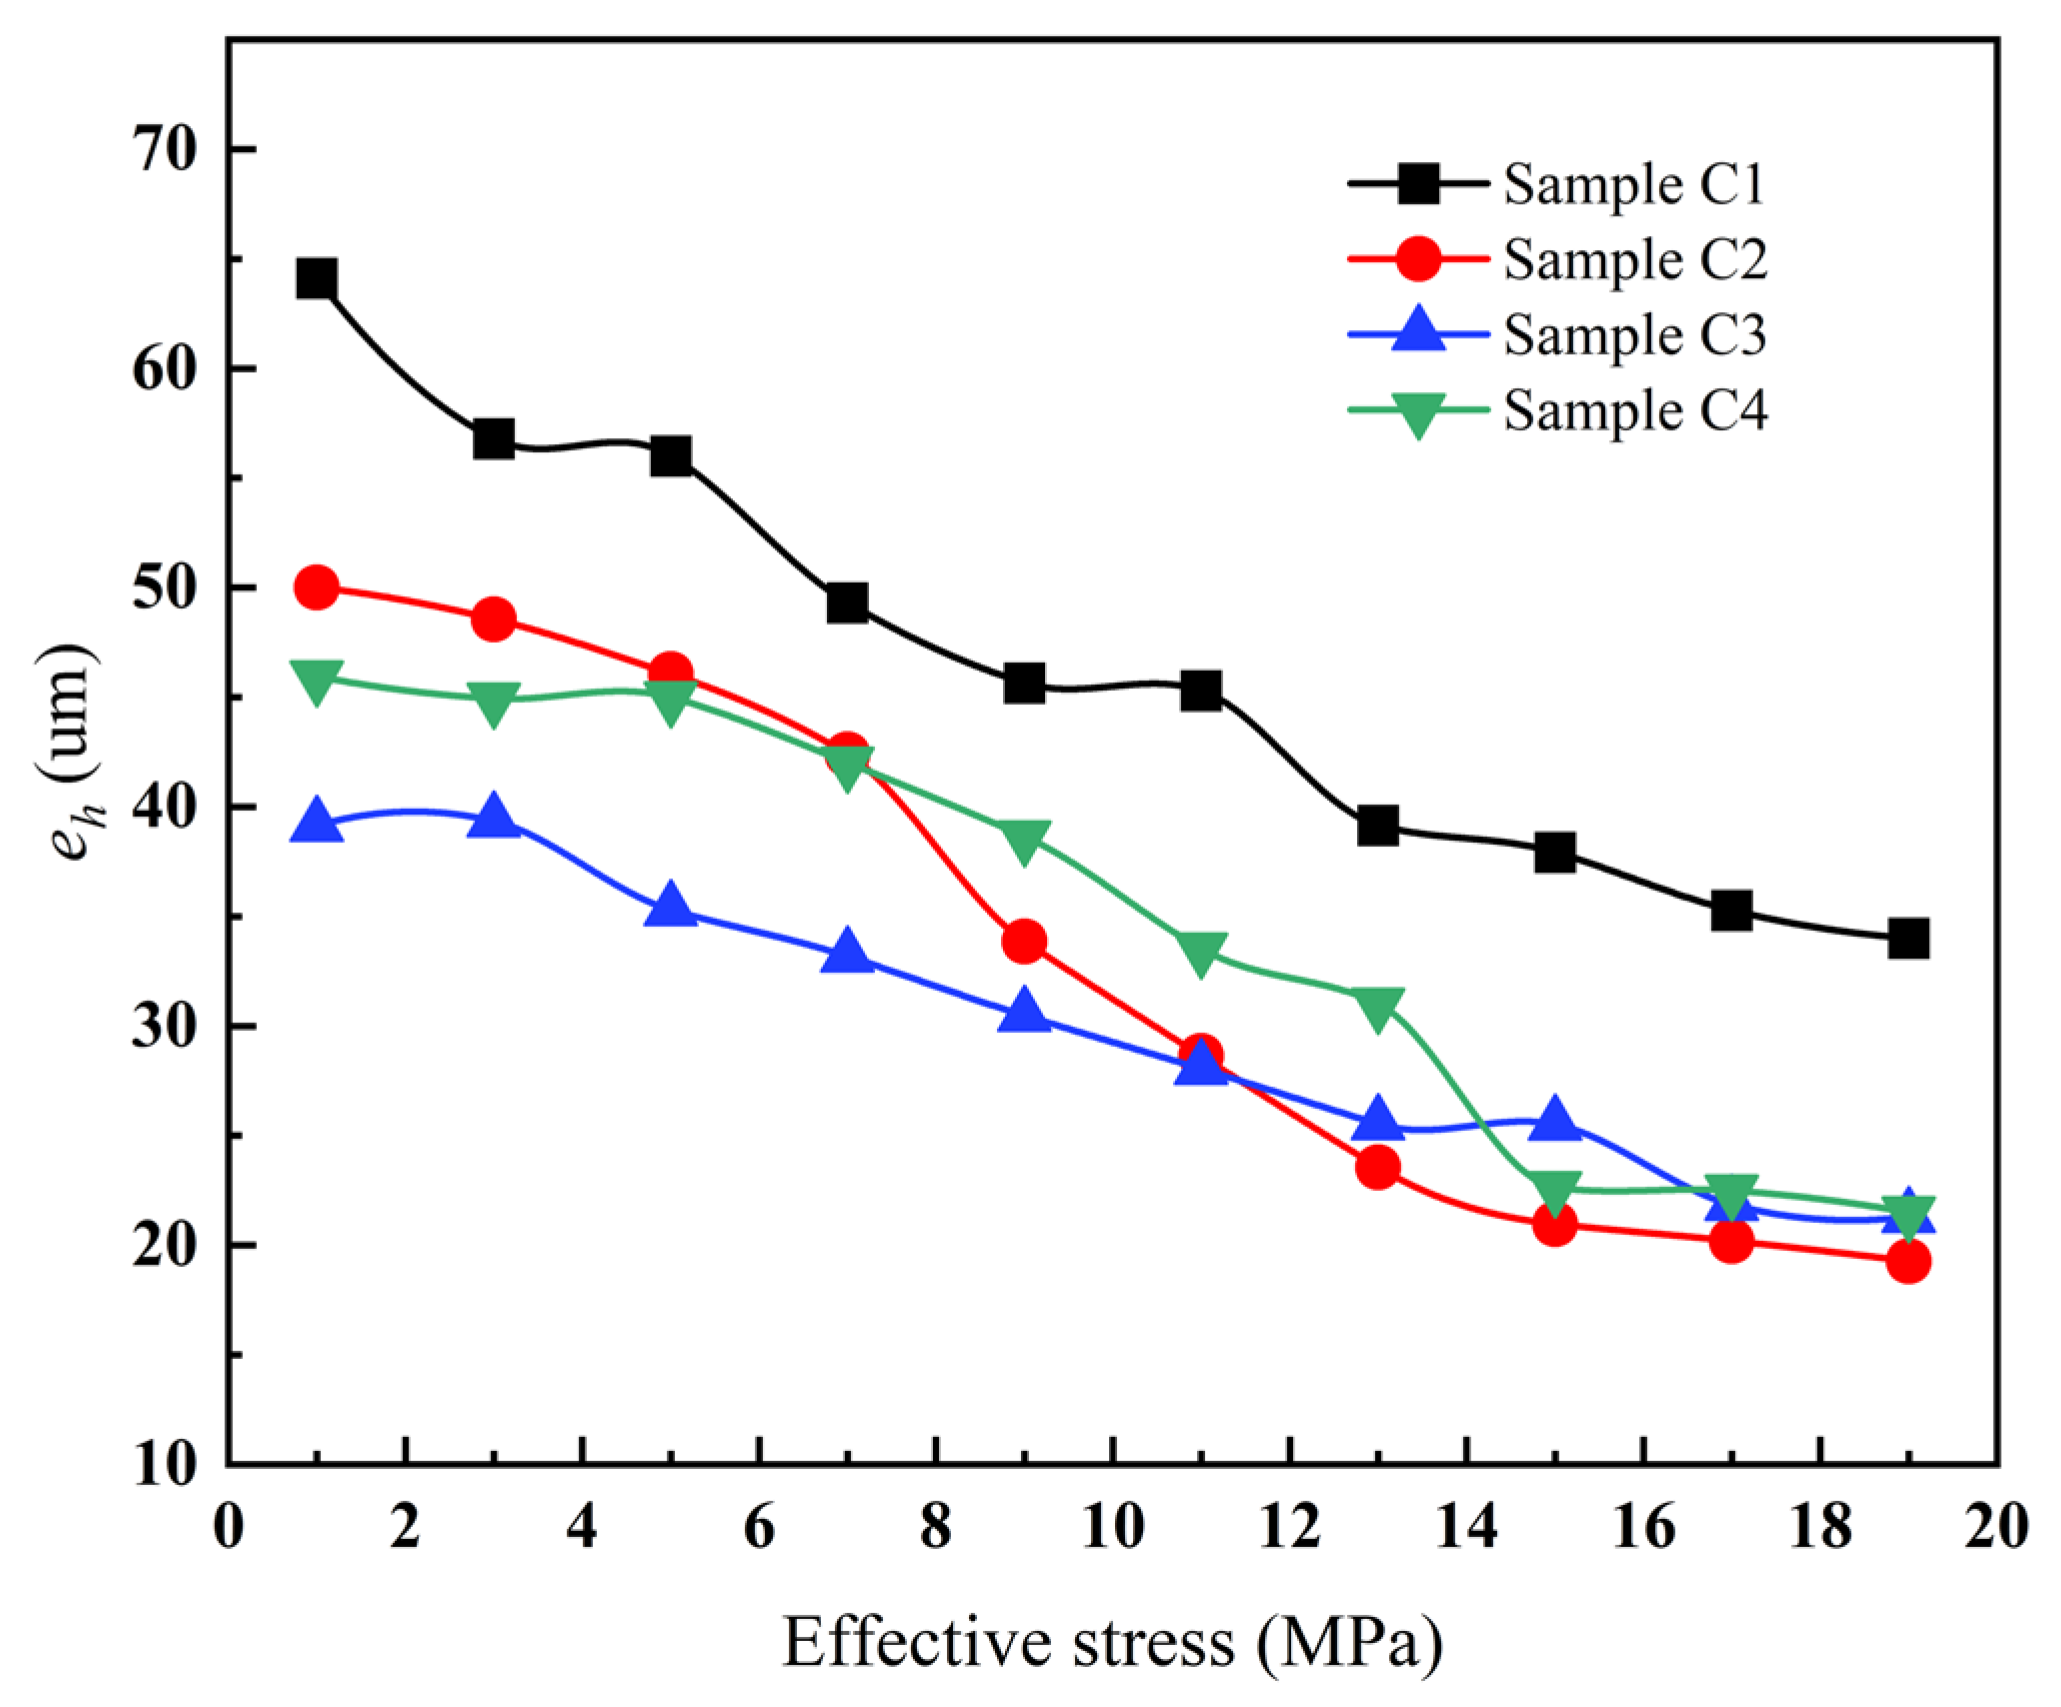
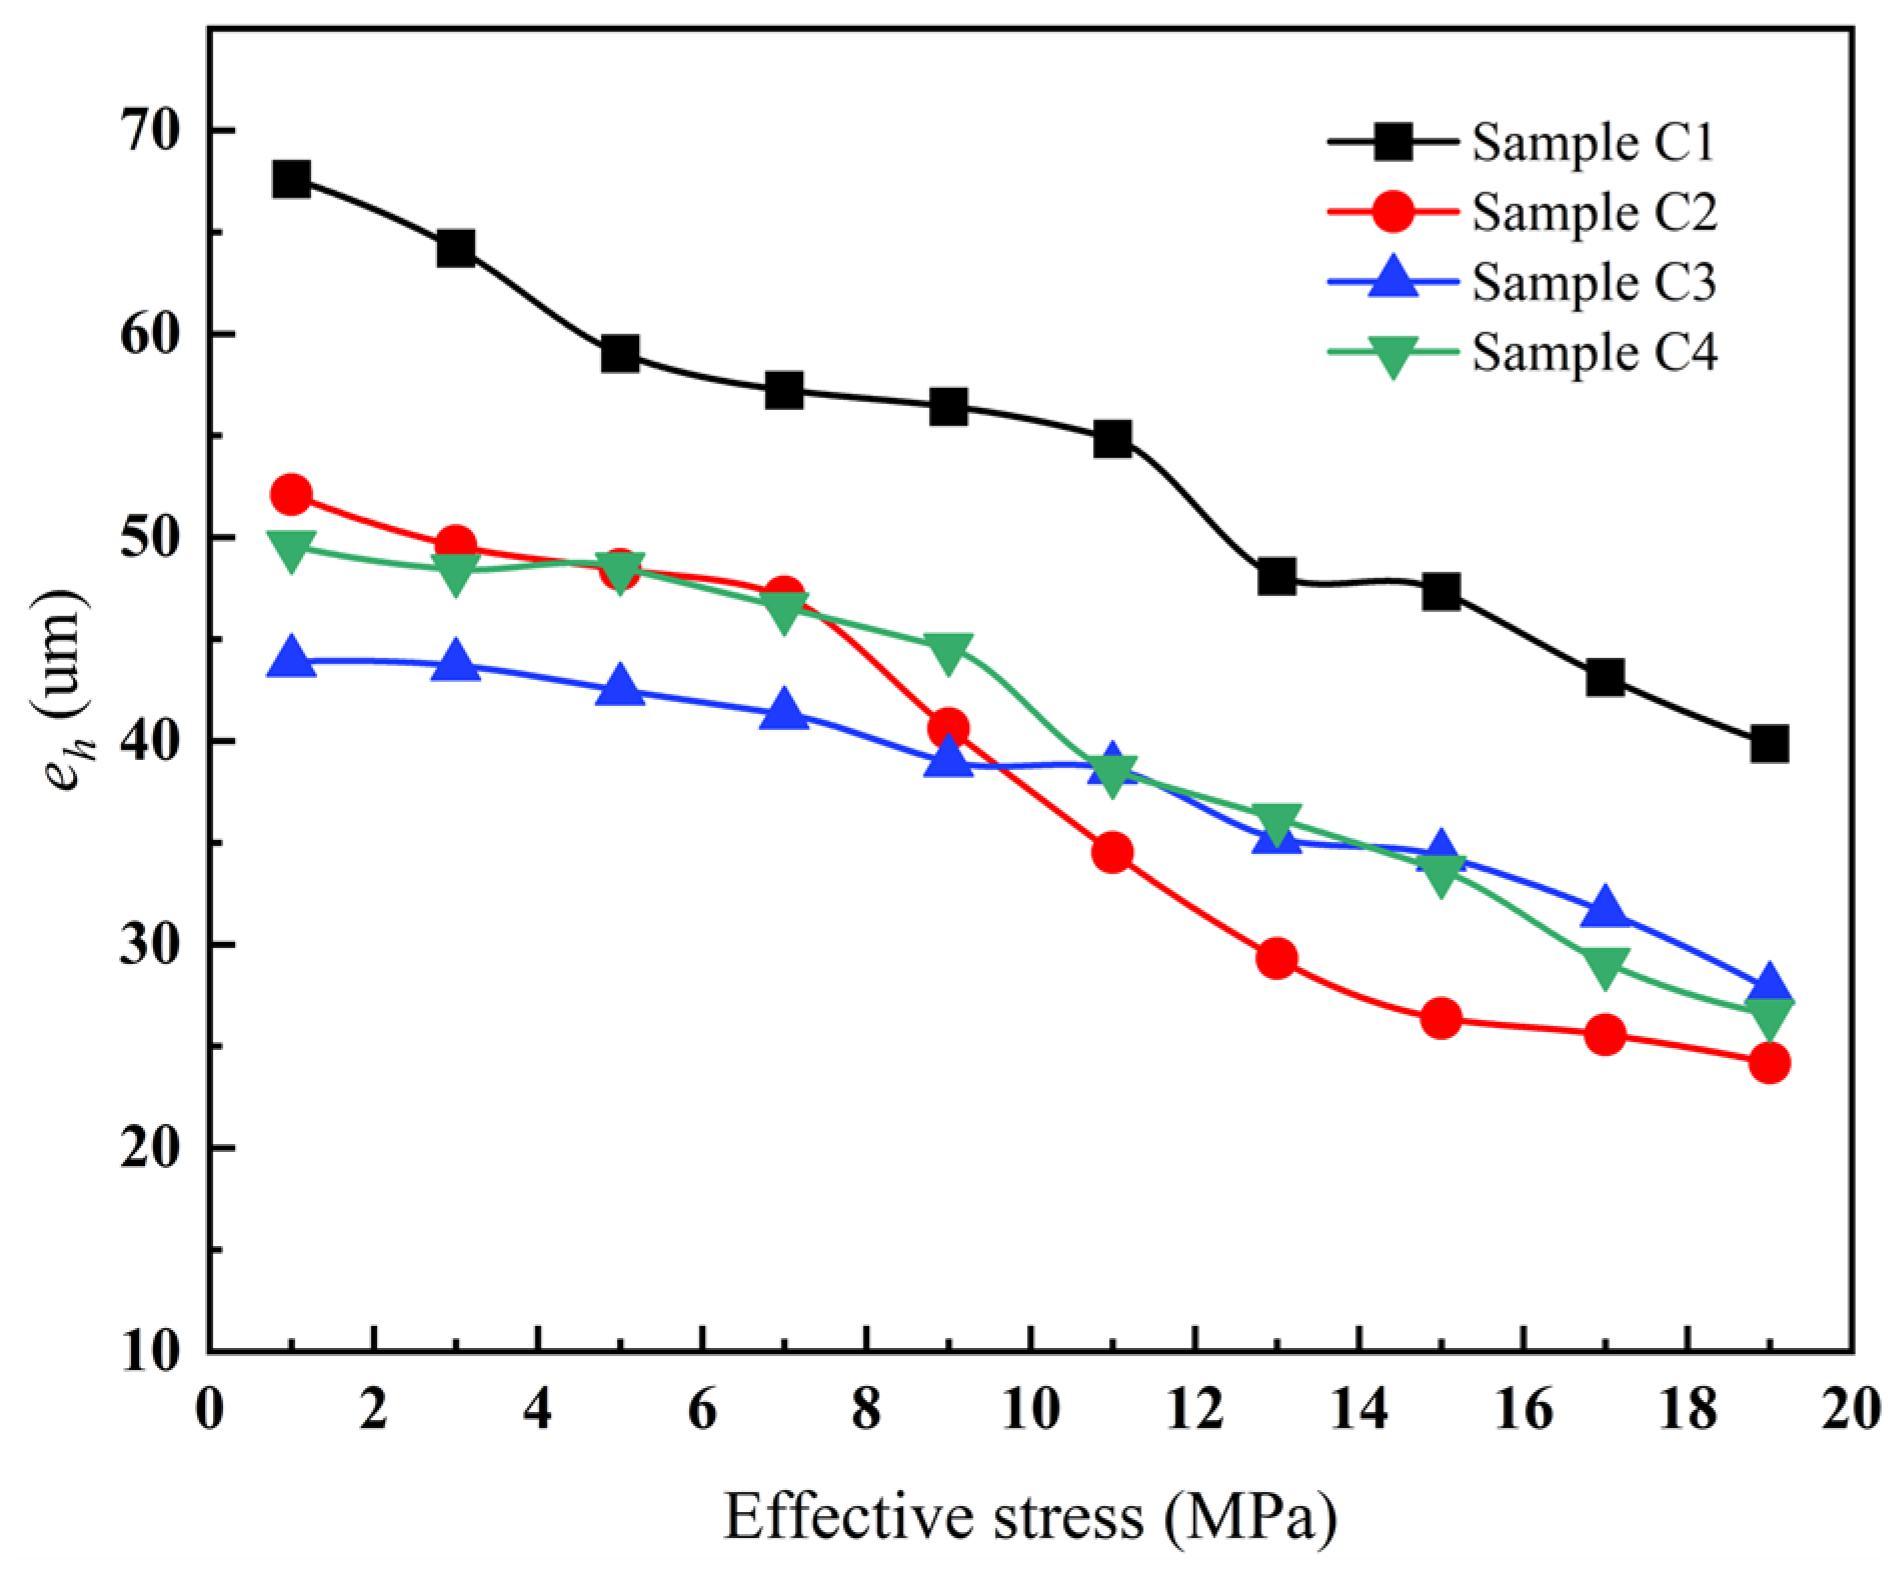
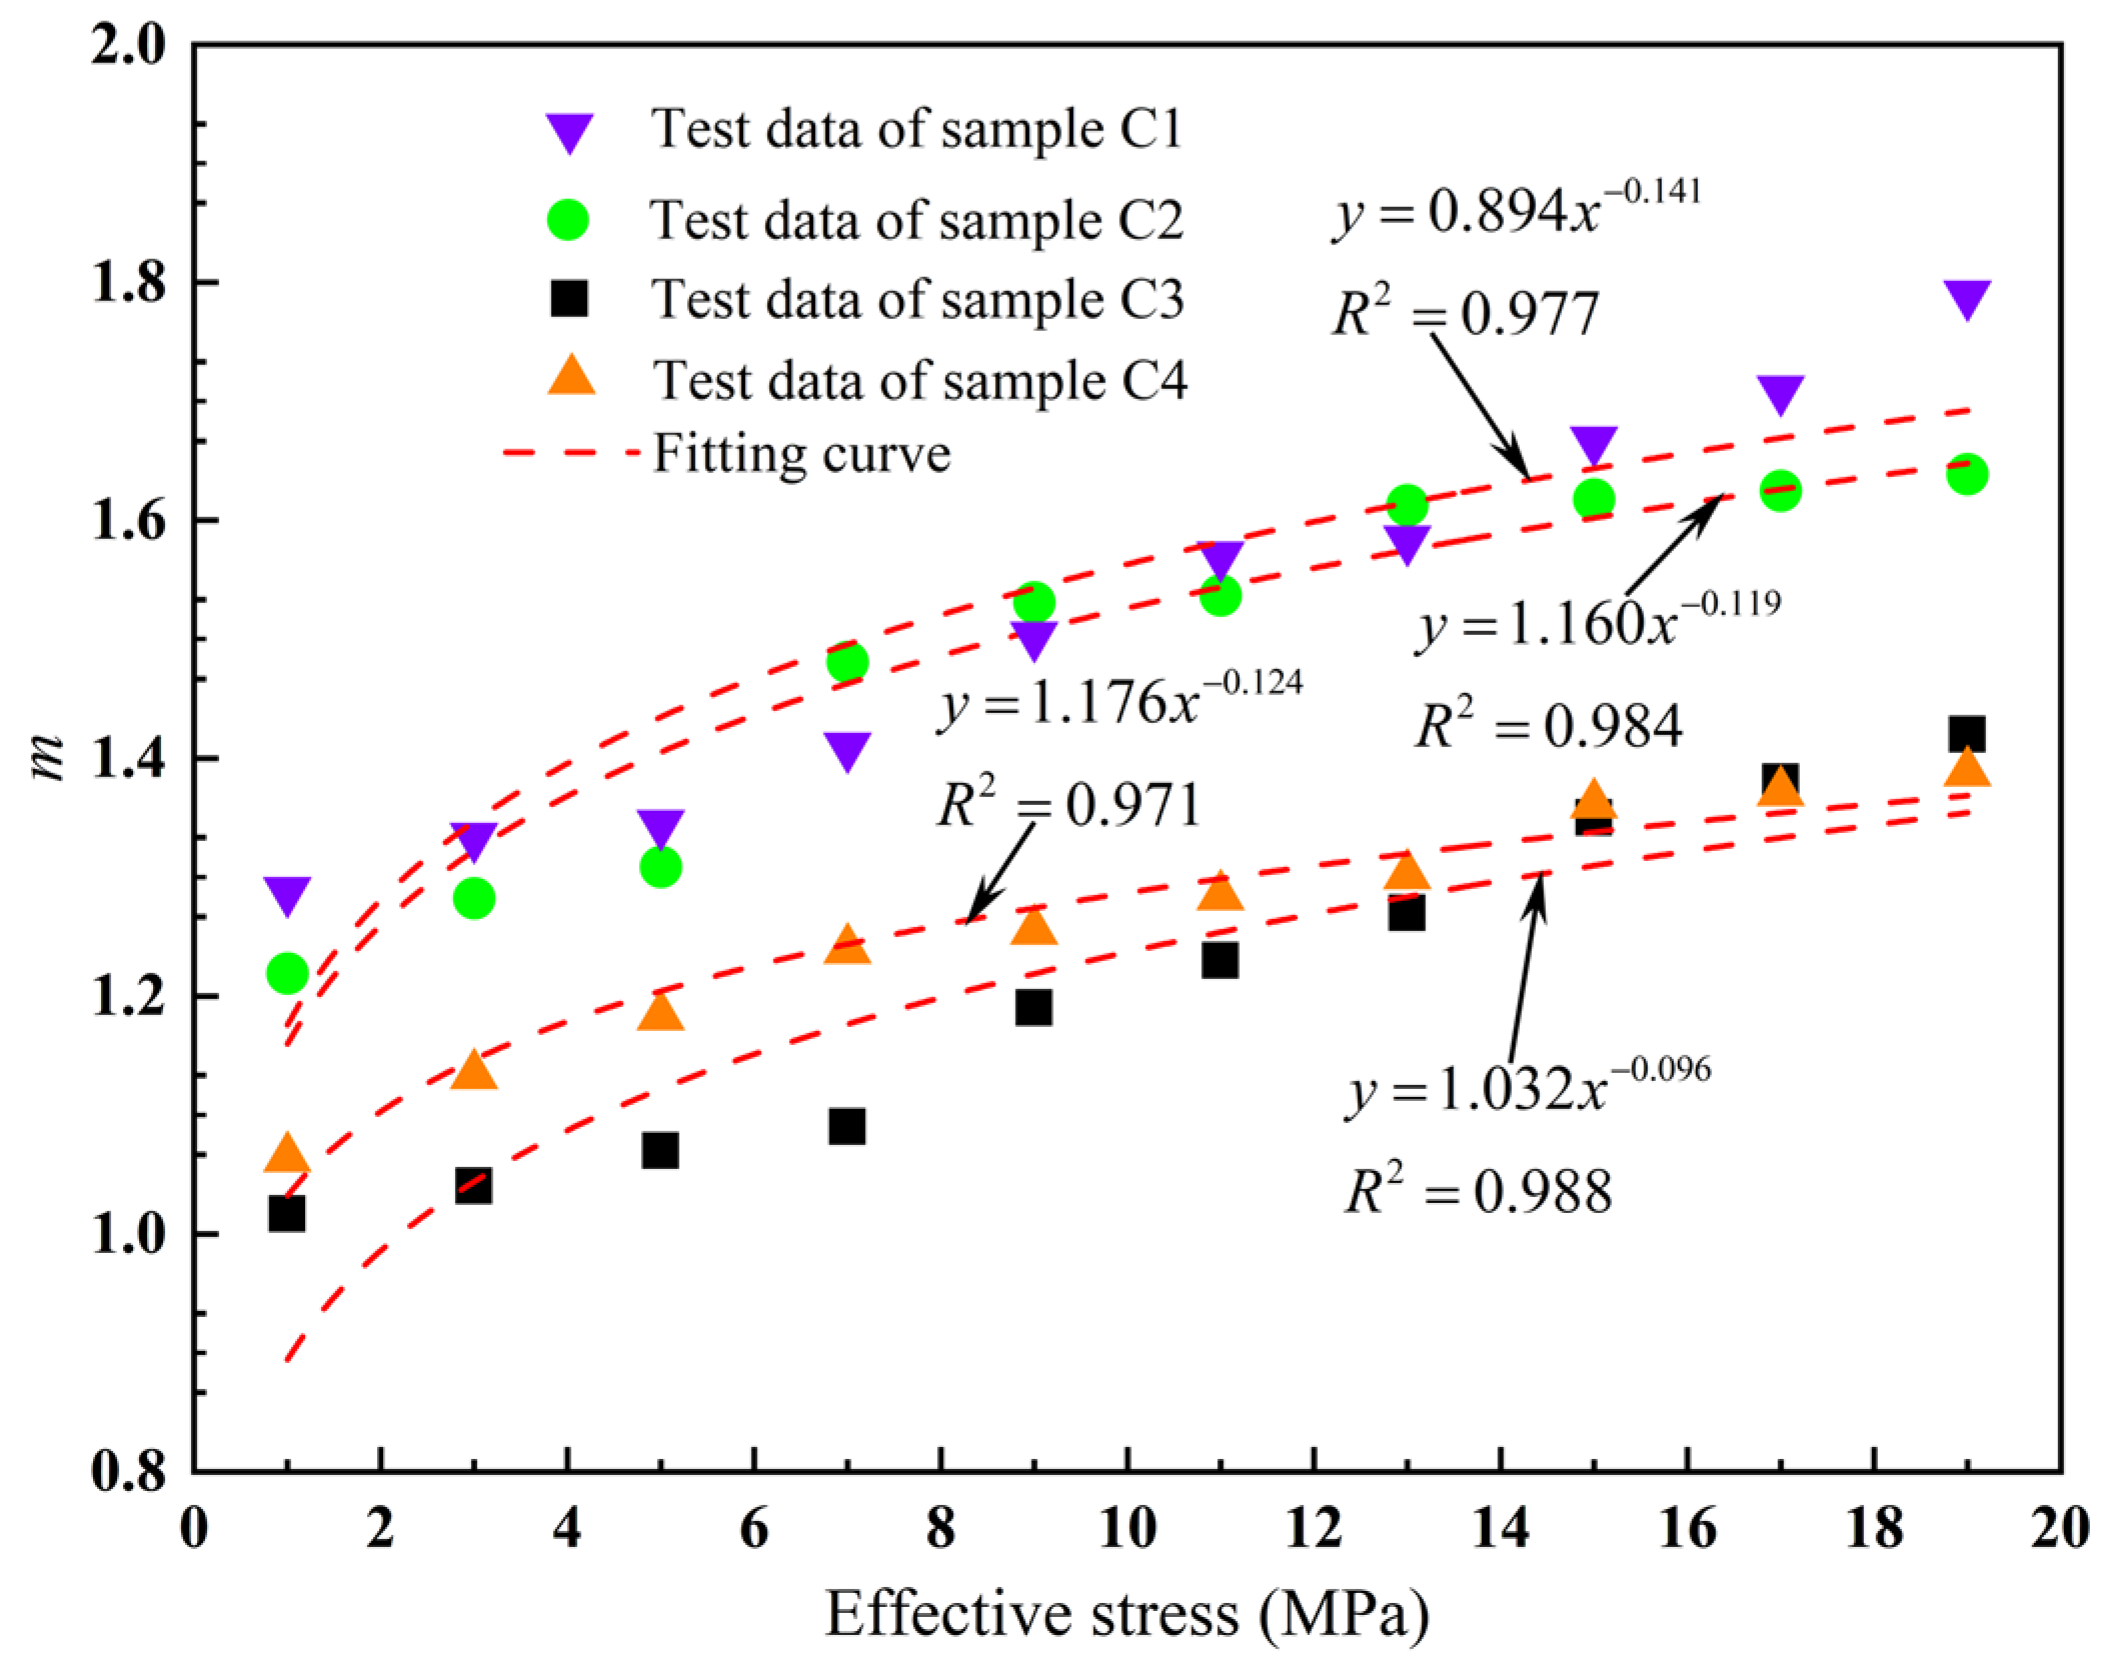
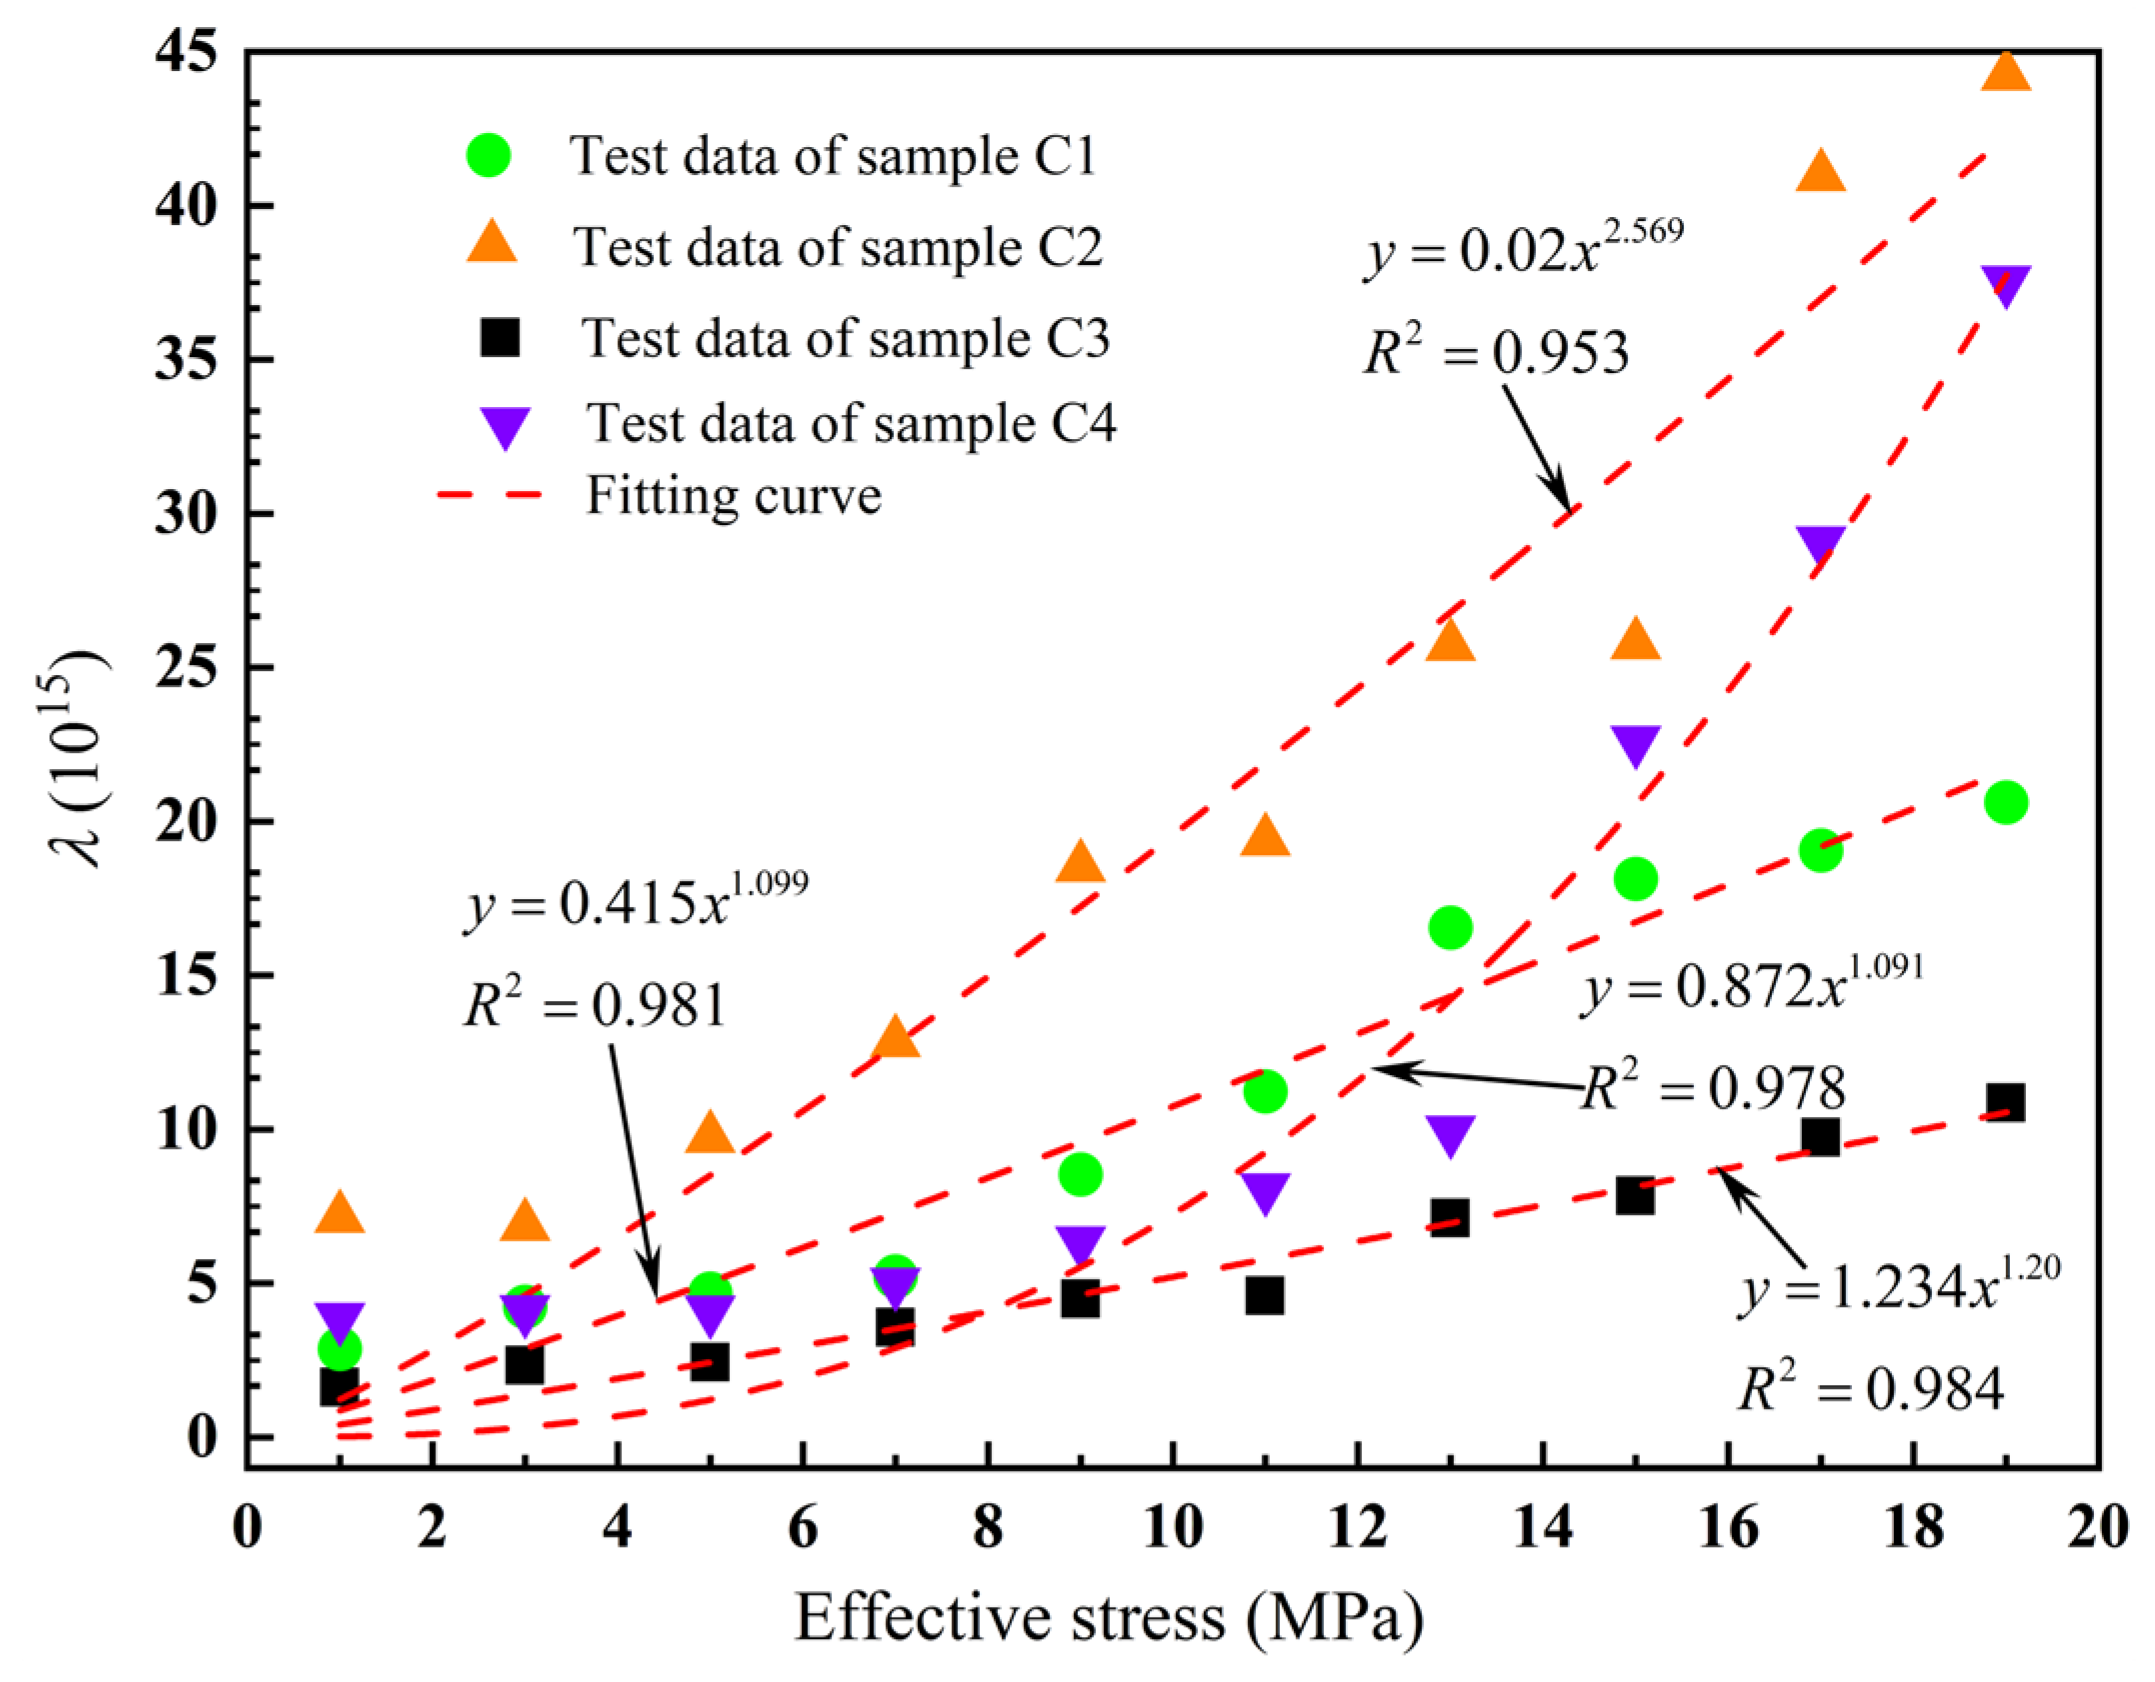
The Izbash equation was used to characterize the gas transport in the rough fractures. The linear coefficient λ ranged from 1015 to 1016 for the four samples, and the nonlinear coefficient m ranged from 1.064 to 1.795. This coefficient had a power relationship with the effective stress. When the effective stress was gradually loaded, the equivalent hydraulic aperture of the four coal samples was inversely proportional to the effective stress.
(4)
Both the Forchheimer and Izbash equations can characterize the flow in rough fractures in coal during stress loading. However, the Forchheimer equation better reveals the mechanism of transformation of fluid flow from linear to nonlinear in rough fractures when determining the degree of nonlinearity.

Author Contributions

Y.L.: Conceptualization (lead); Writing—original draft (lead); Writing—review & editing (equal). Y.Z.: Data curation (equal); Funding acquisition (equal). F.H.: Funding acquisition (equal); Supervision (equal). All authors have read and agreed to the published version of the manuscript.

Funding

This work was supported by the National Natural Science Foundation of China (Grant No. 52304214), the Natural Science Foundation of Hunan Province (Grant No. 2023JJ40287), and the Research Fund of State and Local Joint Engineering Laboratory for Gas Drainage and Ground Control of Deep Mines Henan Polytechnic University (Grant No. SJF2202).

Data Availability Statement

All data included in this study are available upon request by contacting the corresponding author.

Conflicts of Interest

The authors declare no conflict of interest.

References

  1. Luo, Y.; Xia, B.; Li, H.; Hu, H.; Wu, M.; Ji, K. Fractal permeability model for dual-porosity media embedded with natural tortuous fractures. Fuel 2021, 295, 120610. [Google Scholar] [CrossRef]
  2. Wang, Z.; Fu, X.; Pan, J.; Deng, Z. Effect of N2/CO2 injection and alternate injection on volume swelling/shrinkage strain of coal. Energy 2023, 275, 127377. [Google Scholar] [CrossRef]
  3. Li, Q.; Wang, F.; Wang, Y.; Forson, K.; Cao, L.; Zhang, C.; Zhou, C.; Zhao, B.; Chen, J. Experimental investigation on the high-pressure sand suspension and adsorption capacity of guar gum fracturing fuid in low-permeability shale reservoirs: Factor analysis and mechanism disclosure. Environ. Sci. Pollut. Res. 2022, 29, 53050–53062. [Google Scholar] [CrossRef] [PubMed]
  4. Chen, L.; Zhao, M.; Li, X.; Liu, Y. Impact research of CH4 replacement with CO2 in hydrous coal under high pressure injection. Min. Miner. Depos. 2022, 16, 121–126. [Google Scholar] [CrossRef]
  5. Mi, W.; Wen, H.; Fan, S.; Wang, S.; Wu, X.; Wei, G.; Liu, B.; Li, R.; Cheng, X.; Liu, M. Correlation analysis of injection parameters for low-medium pressure injection of liquid CO2 for CH4 displacement in coal seams. Energy 2023, 278, 127760. [Google Scholar] [CrossRef]
  6. Li, Q.; Liu, J.; Wang, S.; Guo, Y.; Han, X.; Li, Q.; Cheng, Y.; Dong, Z.; Li, X.; Zhang, X. Numerical insights into factors affecting collapse behavior of horizontal wellbore in clayey silt hydrate-bearing sediments and the accompanying control strategy. Ocean Eng. 2024, 297, 117029. [Google Scholar] [CrossRef]
  7. Niya, S.M.R.; Selvadurai, A.P.S. Correlation of joint roughness coefficient and permeability of a fracture. Int. J. Rock Mech. Min. Sci. 2019, 113, 150–162. [Google Scholar] [CrossRef]
  8. Klimczak, C.; Schultz, R.A.; Reeves, P.D.M. Cubic law with aperture-length correlation: Implications for network scale fluid flow. Hydrogeol. J. 2010, 18, 851–862. [Google Scholar] [CrossRef]
  9. Zou, L.; Jing, L.; Cvetkovic, V. Roughness decomposition and nonlinear fluid flow in a single rock fracture. Int. J. Rock Mech. Min. Sci. 2015, 75, 102–118. [Google Scholar] [CrossRef]
  10. Yin, Q.; He, L.; Jing, H.; Zhu, D. Quantitative Estimates of Nonlinear Flow Characteristics of Deformable Rough-Walled Rock Fractures with Various Lithologies. Processes 2018, 6, 149. [Google Scholar] [CrossRef]
  11. Valdez, A.V.; Morel, S.; Marache, A.; Hinojosa, M.; Riss, J. Influence of fracture roughness and micro-fracturing on the mechanical response of rock joints: A discrete element approach. Int. J. Fract. 2018, 213, 87–105. [Google Scholar] [CrossRef]
  12. Guo, T.; Zhang, S.; Gao, J.; Zhang, J.; Yu, H. Experimental Study of Fracture Permeability for Stimulated Reservoir Volume (SRV) in Shale Formation. Transp. Porous Media 2013, 98, 525–542. [Google Scholar] [CrossRef]
  13. Javadi, M.; Sharifzadeh, M.; Shahriar, K.; Mitani, Y. Critical Reynolds number for nonlinear flow through rough-walled fractures: The role of shear processes. Water Resour. Res. 2014, 50, 1789–1804. [Google Scholar] [CrossRef]
  14. Singh, K.K.; Singh, D.N.; Ranjith, P.G. Laboratory Simulation of Flow through Single Fractured Granite. Rock Mech. Rock Eng. 2014, 48, 987–1000. [Google Scholar] [CrossRef]
  15. Su, X.; Zhou, L.; Li, H.; Xia, B.; Shen, Z.; Lu, Y. Experimental and Numerical Modelling of Nonlinear Flow Behavior in Single Fractured Granite. Geofluids 2019, 2019, 1–20. [Google Scholar] [CrossRef]
  16. Li, H.; Lu, Y.; Zhou, L.; Tang, J.; Han, S.; Ao, X. Experimental and Model Studies on Loading Path-Dependent and Nonlinear Gas Flow Behavior in Shale Fractures. Rock Mech. Rock Eng. 2017, 51, 227–242. [Google Scholar] [CrossRef]
  17. Xia, B.; Ji, K.; Luo, Y.; Liu, S.; Hu, H. Nonlinear gas flow characteristics of acidified and water-saturated sandstone. Arab. J. Geosci. 2021, 14, 2260. [Google Scholar] [CrossRef]
  18. Forchheimer, P.H. Wasserbewegung durch boden. Z. Des Vereines Dtsch. Ing. 1901, 49, 1736–1749. [Google Scholar]
  19. Irmay, S. On the theoretical derivation of Darcy and Forchheimer formulas. Trans. Am. Geophys. Union. 1958, 39, 702–907. [Google Scholar]
  20. Chen, Y.; Zhou, J.; Hu, S.; Hu, R.; Zhou, C. Evaluation of Forchheimer equation coefficients for non-Darcy flow in deformable rough-walled fractures. J. Hydrol. 2015, 529, 993–1006. [Google Scholar] [CrossRef]
  21. Qian, X.; Xia, C.; Gui, Y. Quantitative Estimates of Non-Darcy Groundwater Flow Properties and Normalized Hydraulic Aperture through Discrete Open Rough-Walled Joints. Int. J. Geomech. 2018, 18, 04018099. [Google Scholar] [CrossRef]
  22. Shen, Z.; Zhou, L.; Su, X.; Li, H.; Tang, J.; Zheng, X. An experimental investigation of the nonlinear gas flow and stress-dependent permeability of shale fractures. Energy Sci. Eng. 2020, 8, 2808–2822. [Google Scholar] [CrossRef]
  23. Oda, M. An equivalent continuum model for coupled stress and fluid flow analysis in jointed rock masses. Water Resour. Res. 1986, 22, 1845–1856. [Google Scholar] [CrossRef]
  24. Luo, Y.; Zhu, Y.; Huang, F.; Xia, B. Experimental study on nonlinear seepage characteristics of coal under true triaxial stress loading. Phys. Fluids 2023, 35, 023111. [Google Scholar] [CrossRef]
  25. Wang, F.; Cheng, H. A fractal permeability model for 2D complex tortuous fractured porous media. J. Pet. Sci. Eng. 2020, 188, 106938. [Google Scholar] [CrossRef]
  26. Barton, N.; Choubey, V. The shear strength of rock joints and practice. Rock Mech. 1977, 10, 1–54. [Google Scholar] [CrossRef]
  27. Li, Y.; Zhang, Y. Quantitative estimation of joint roughness coefficient using statistical parameters. Int. J. Rock Mech. Min. Sci. 2015, 77, 27–35. [Google Scholar] [CrossRef]
  28. Luo, Y.; Wang, Y.; Guo, H.; Liu, X.; Luo, Y.; Liu, Y. Relationship between joint roughness coefficient and statistical roughness parameters and its sensitivity to sampling interval. Sustainability 2022, 14, 13597. [Google Scholar] [CrossRef]
  29. Jang, H.; Kang, S.; Jang, B. Determination of joint roughness coefficients using roughness parameters. Rock Mech. Rock Eng. 2014, 47, 2061–2073. [Google Scholar] [CrossRef]
  30. Yong, R.; Ye, J.; Liang, Q.; Huang, M.; Du, S. Estimation of the joint roughness coefficient (JRC) of rock joints by vector similarity measures. Bull. Eng. Geol. Environ. 2017, 77, 735–749. [Google Scholar] [CrossRef]
  31. Biot, M.A. General theory of three-dimensional consolidation. J. Appl. Phys. 1941, 12, 155–164. [Google Scholar] [CrossRef]
  32. Terzaghi, K.T. Theoretical Soil Mechanics; John Wiley & Sons, Inc.: Hoboken, NJ, USA, 1943. [Google Scholar]
  33. Crandall, D.; Bromhal, G.; Karpyn, Z.T. Numerical simulations examining the relationship between wall-roughness and fluid flow in rock fractures. Int. J. Rock Mech. Min. Sci. 2021, 47, 784–796. [Google Scholar] [CrossRef]
  34. Zhang, Z.; Nemcik, J. Fluid flow regimes and nonlinear flow characteristics in deformable rock fractures. J. Hydrol. 2013, 477, 139–151. [Google Scholar] [CrossRef]
  35. Zimmerman, R.W.; Bodvarsson, G.S. Hydraulic conductivity of rock fractures. Transp. Porous Media 1994, 23, 1–30. [Google Scholar]
  36. Xia, Z.; Zhang, X.; Yao, C.; Chen, H.; Yang, J.; Jiang, Q.; Zhou, C. Experimental studies on seepage characteristics during the loading and unloading confining pressure of post-peak fractured rock. J. China Coal Soc. 2019, 44, 3379–3387. [Google Scholar]
  37. Konzuk, J.S.; Kueper, B.H. Evaluation of cubic law based models describing single-phase flow through a rough-walled fracture. Water Resour. Res. 2004, 40. [Google Scholar] [CrossRef]
  38. Zhang, Y.; Chai, J. Effect of surface morphology on fluid flow in rough fractures: A review. J. Nat. Gas Sci. Eng. 2020, 79, 103343. [Google Scholar] [CrossRef]
  39. Zhang, Z.; Nemcik, J.; Qiao, Q.; Geng, X. A model for water flow through rock fractures based on friction factor. Rock Mech. Rock Eng. 2014, 48, 559–571. [Google Scholar] [CrossRef]
  40. Li, H.; Tang, J.; Lu, Y.; Zhou, L.; Han, S.; Dai, R. Experimental measurements of shale fracture conductivity under cyclic loading. Arab. J. Sci. Eng. 2017, 43, 6315–6324. [Google Scholar] [CrossRef]
  41. Chen, Y.; Liu, M.; Hu, S.; Zhou, C. Non-Darcy’s law-based analytical models for data interpretation of high-pressure packer tests in fractured rocks. Eng. Geol. 2015, 199, 91–106. [Google Scholar] [CrossRef]
  42. Chen, Y.; Hu, S.; Hu, R.; Zhou, C. Estimating hydraulic conductivity of fractured rocks from high-pressure packer tests with an Izbash’s law-based empirical model. Water Resour. Res. 2015, 51, 2096–2118. [Google Scholar] [CrossRef]
  43. Wen, Z.; Huang, G.; Zhan, H. Non-Darcian flow in a single confined vertical fracture toward a well. J. Hydrol. 2006, 330, 698–708. [Google Scholar] [CrossRef]
Figure 1. Coal sample with rough fracture surface.
Processes 12 00757 g001
Figure 2. Three-dimensional cloud image of fracture surface.
Processes 12 00757 g002
Figure 3. Test scheme.
Processes 12 00757 g003
Figure 4. Relationship between gas flow, effective stress, and gas pressure gradient. (a) sample C1; (b) sample C2; (c) sample C3; (d) sample C4.
Processes 12 00757 g004aProcesses 12 00757 g004b
Figure 5. Relation between fitting coefficients a and b and effective stress in the Forchheimer equation. (a) Linear coefficient a; (b) nonlinear coefficient b.
Processes 12 00757 g005
Figure 6. Relationship between nonlinear factor and pressure gradient. (a) Sample C1; (b) sample C2; (c) sample C3; (d) sample C4.
Processes 12 00757 g006
Figure 7. Relationship between critical Reynolds number and effective stress.
Processes 12 00757 g007
Figure 8. Relationship between equivalent hydraulic aperture and effective stress based on Forchheimer equation.
Processes 12 00757 g008
Figure 9. Relationship between coal sample permeability and effective stress.
Processes 12 00757 g009
Figure 10. Fitting curve between coefficient m of Izbash equation and effective stress.
Processes 12 00757 g010
Figure 11. Fitting curve between coefficient λ of Izbash equation and effective stress.
Processes 12 00757 g011
Figure 12. Relationship between equivalent hydraulic aperture and effective stress based on Izbash equation.
Processes 12 00757 g012
Figure 13. Fitting correlation coefficients of Forchheimer and Izbash equations. (a) Forchheimer equation; (b) Izbash equation.
Processes 12 00757 g013
Table 1. Fitting parameters of nonlinear coefficients of Izbash equation.
Sample NumberEffective Stress/MPaλ (1015)mR2
C113.8781.2880.950
34.1361.3340.968
54.1181.3450.994
75.0151.410.992
96.3691.5030.998
118.0881.5710.995
139.9641.5840.968
1522.6171.6670.968
C212.8681.2190.969
34.2381.2820.983
54.6711.3090.994
75.2321.4810.996
98.5371.5370.962
1111.2331.5310.970
1316.5481.6180.965
1518.1351.6130.968
C317.1311.0640.946
36.8611.1330.953
59.7281.1830.967
712.8351.2390.966
918.5231.2550.953
1119.3681.2840.994
1325.7031.3020.998
1525.7541.3610.999
C411.6221.0170.970
32.3321.040.970
52.4331.0720.970
73.5671.0911.000
94.4931.1920.999
114.5961.2350.988
137.1151.2731.000
1510.8641.4290.963
Disclaimer/Publisher’s Note: The statements, opinions and data contained in all publications are solely those of the individual author(s) and contributor(s) and not of MDPI and/or the editor(s). MDPI and/or the editor(s) disclaim responsibility for any injury to people or property resulting from any ideas, methods, instructions or products referred to in the content.

