
Determination of Wax Deposition Rate Model of Blended Oils with Different Blending Ratios

 ,
,
Abstract
:1. Introduction
2. Materials and Methods
2.1. Crude Oil Sample
2.2. Methods
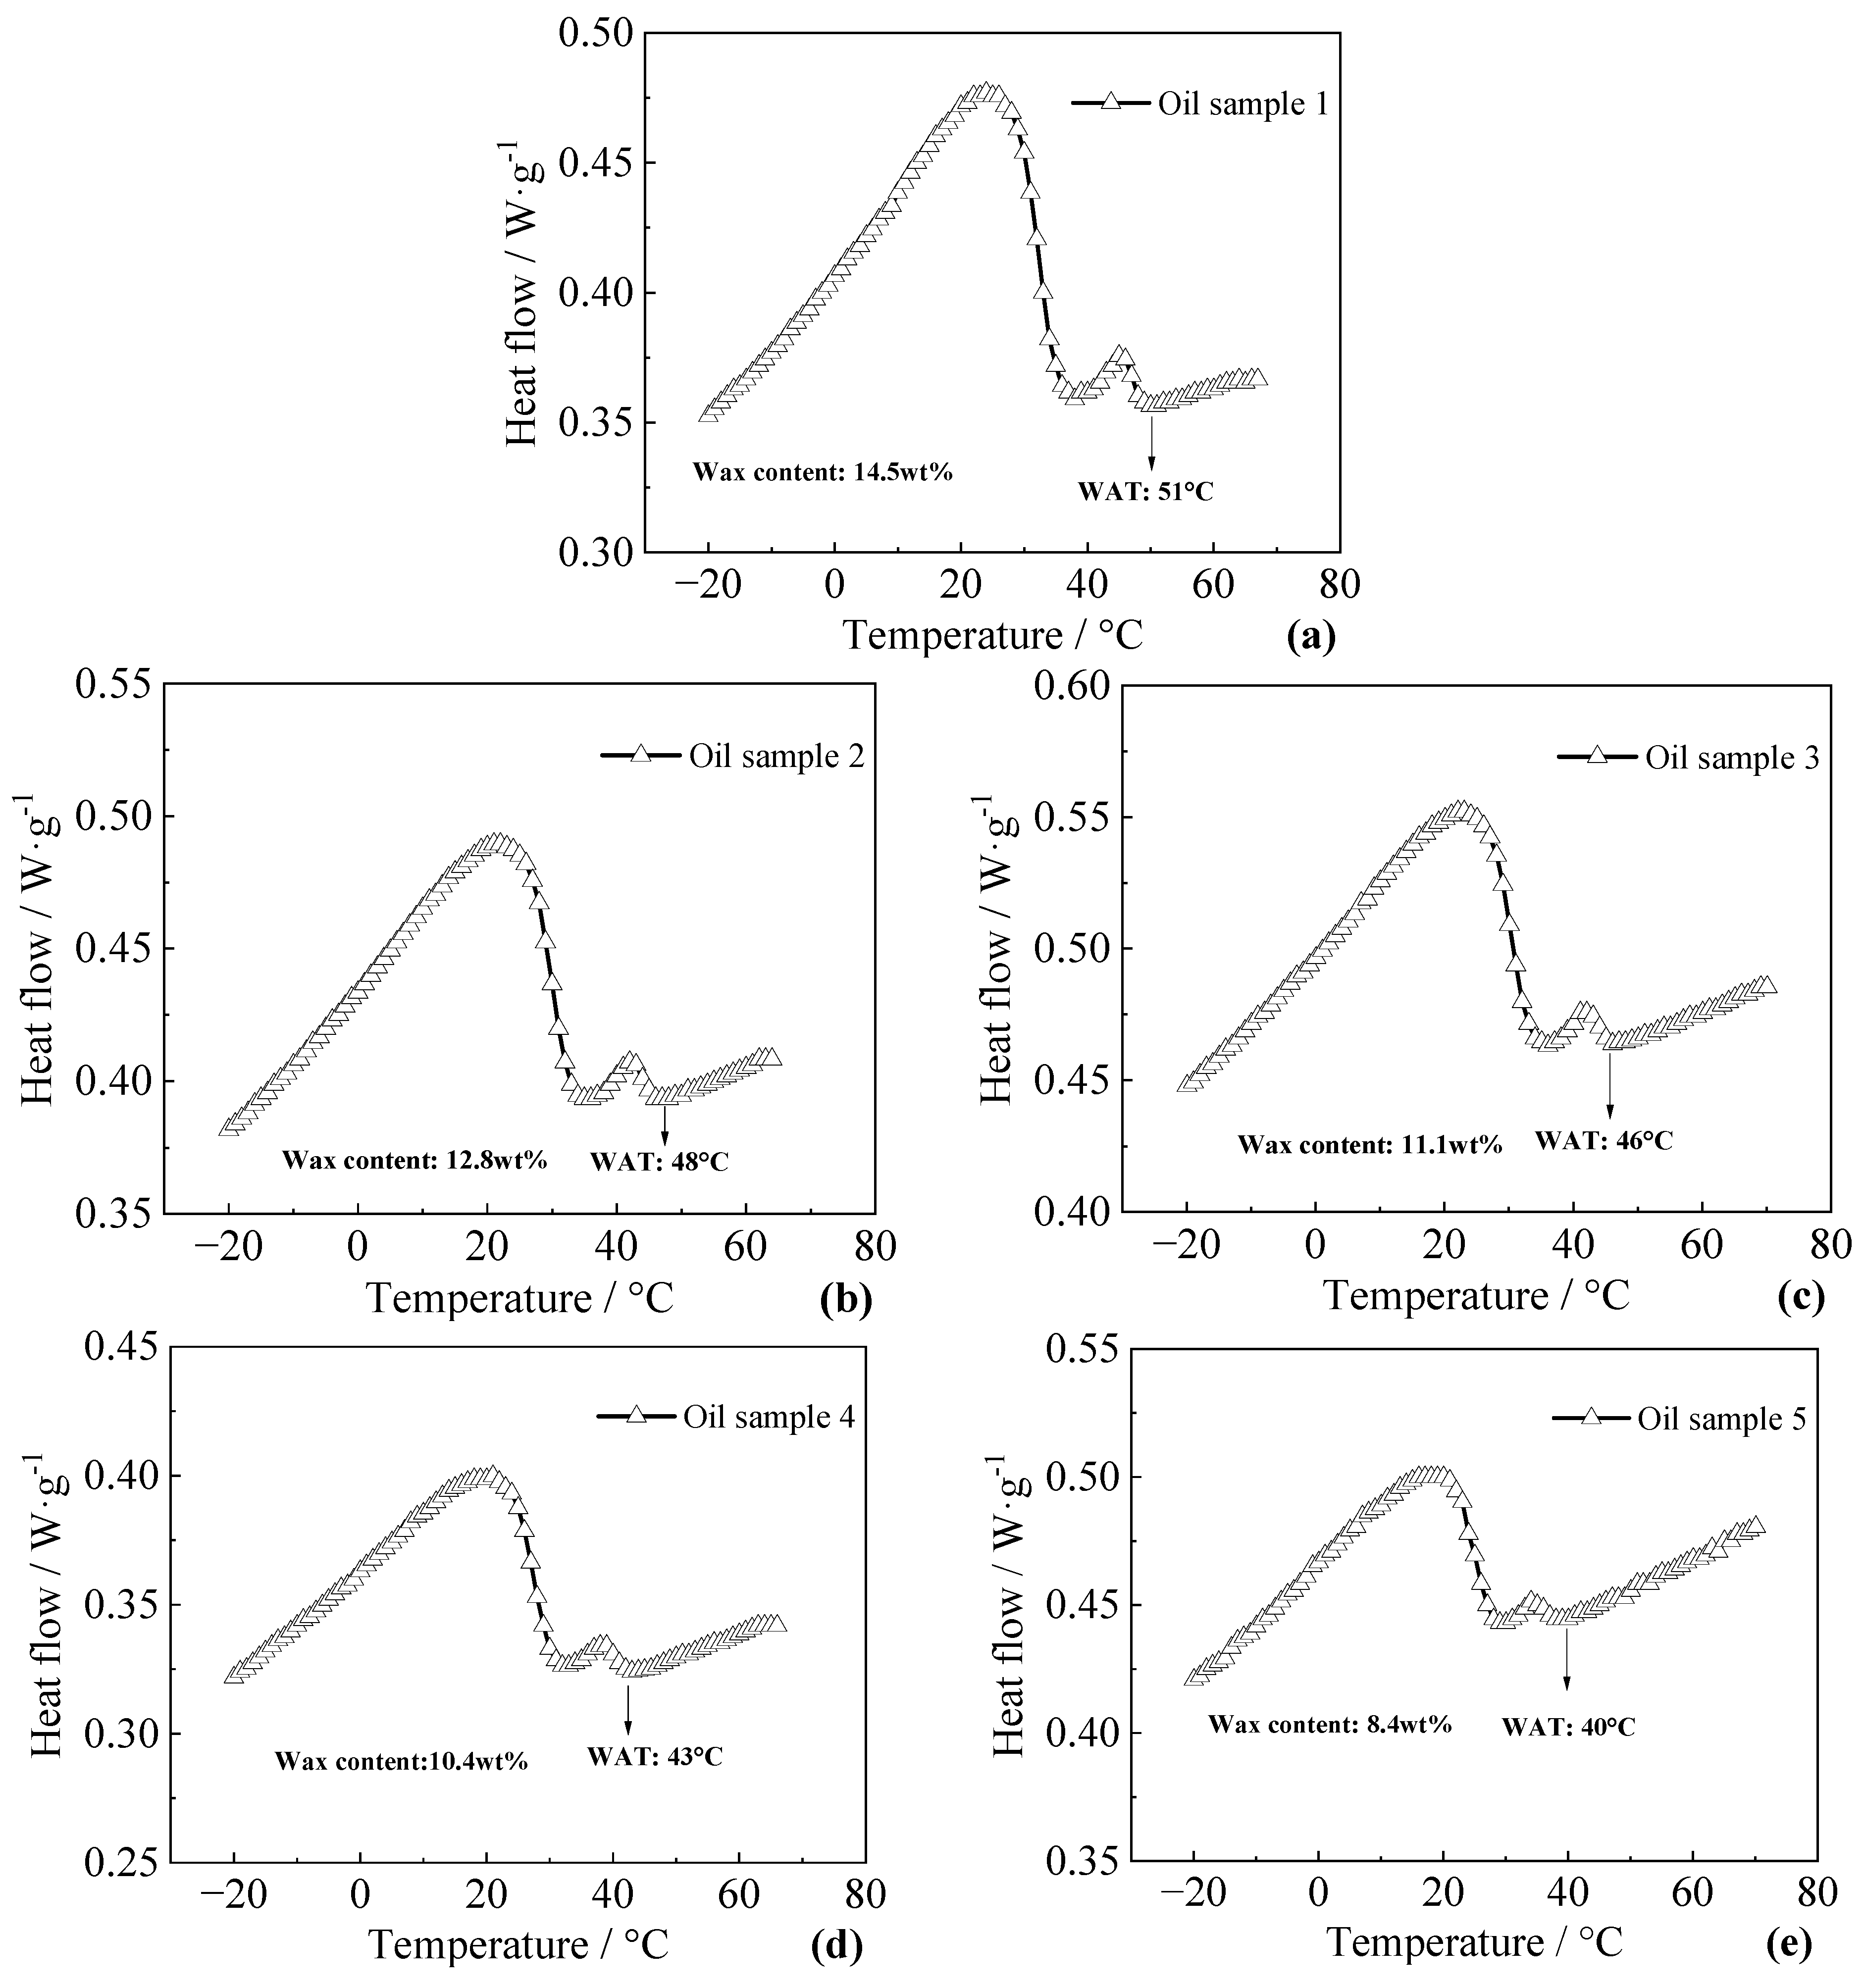
2.2.1. DSC Test
2.2.2. Pour Point Test
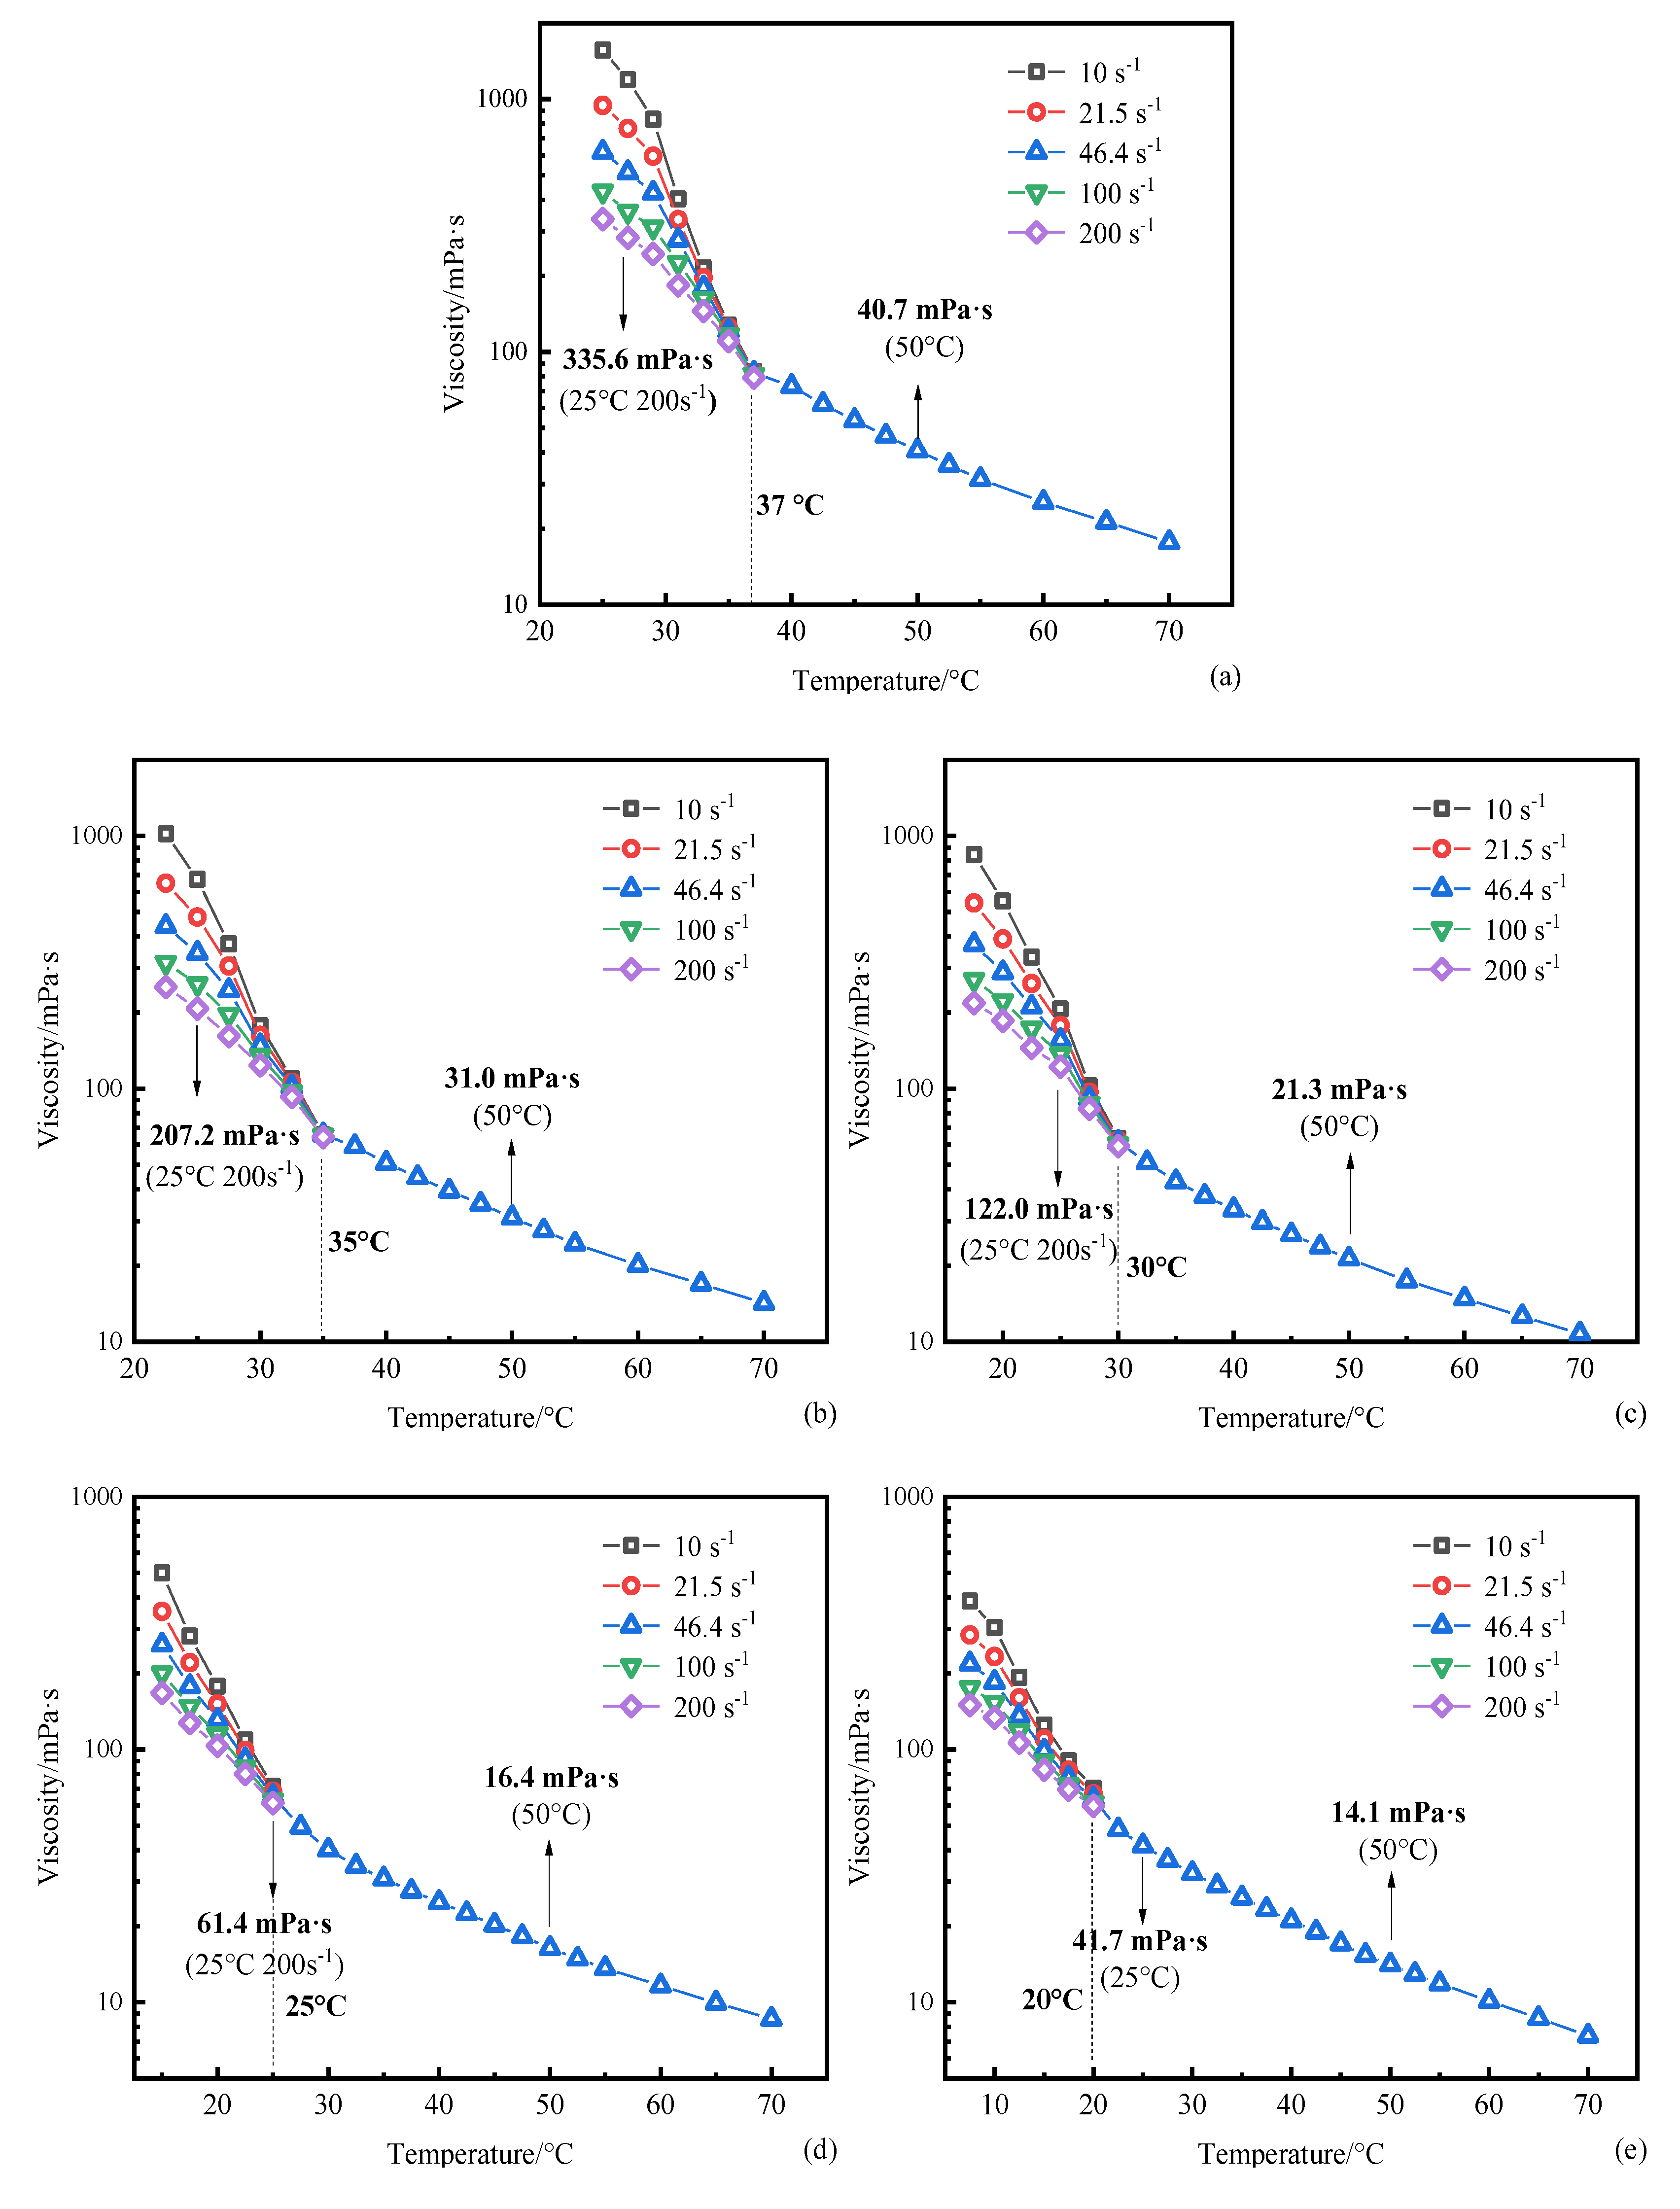
2.2.3. Rheological Test
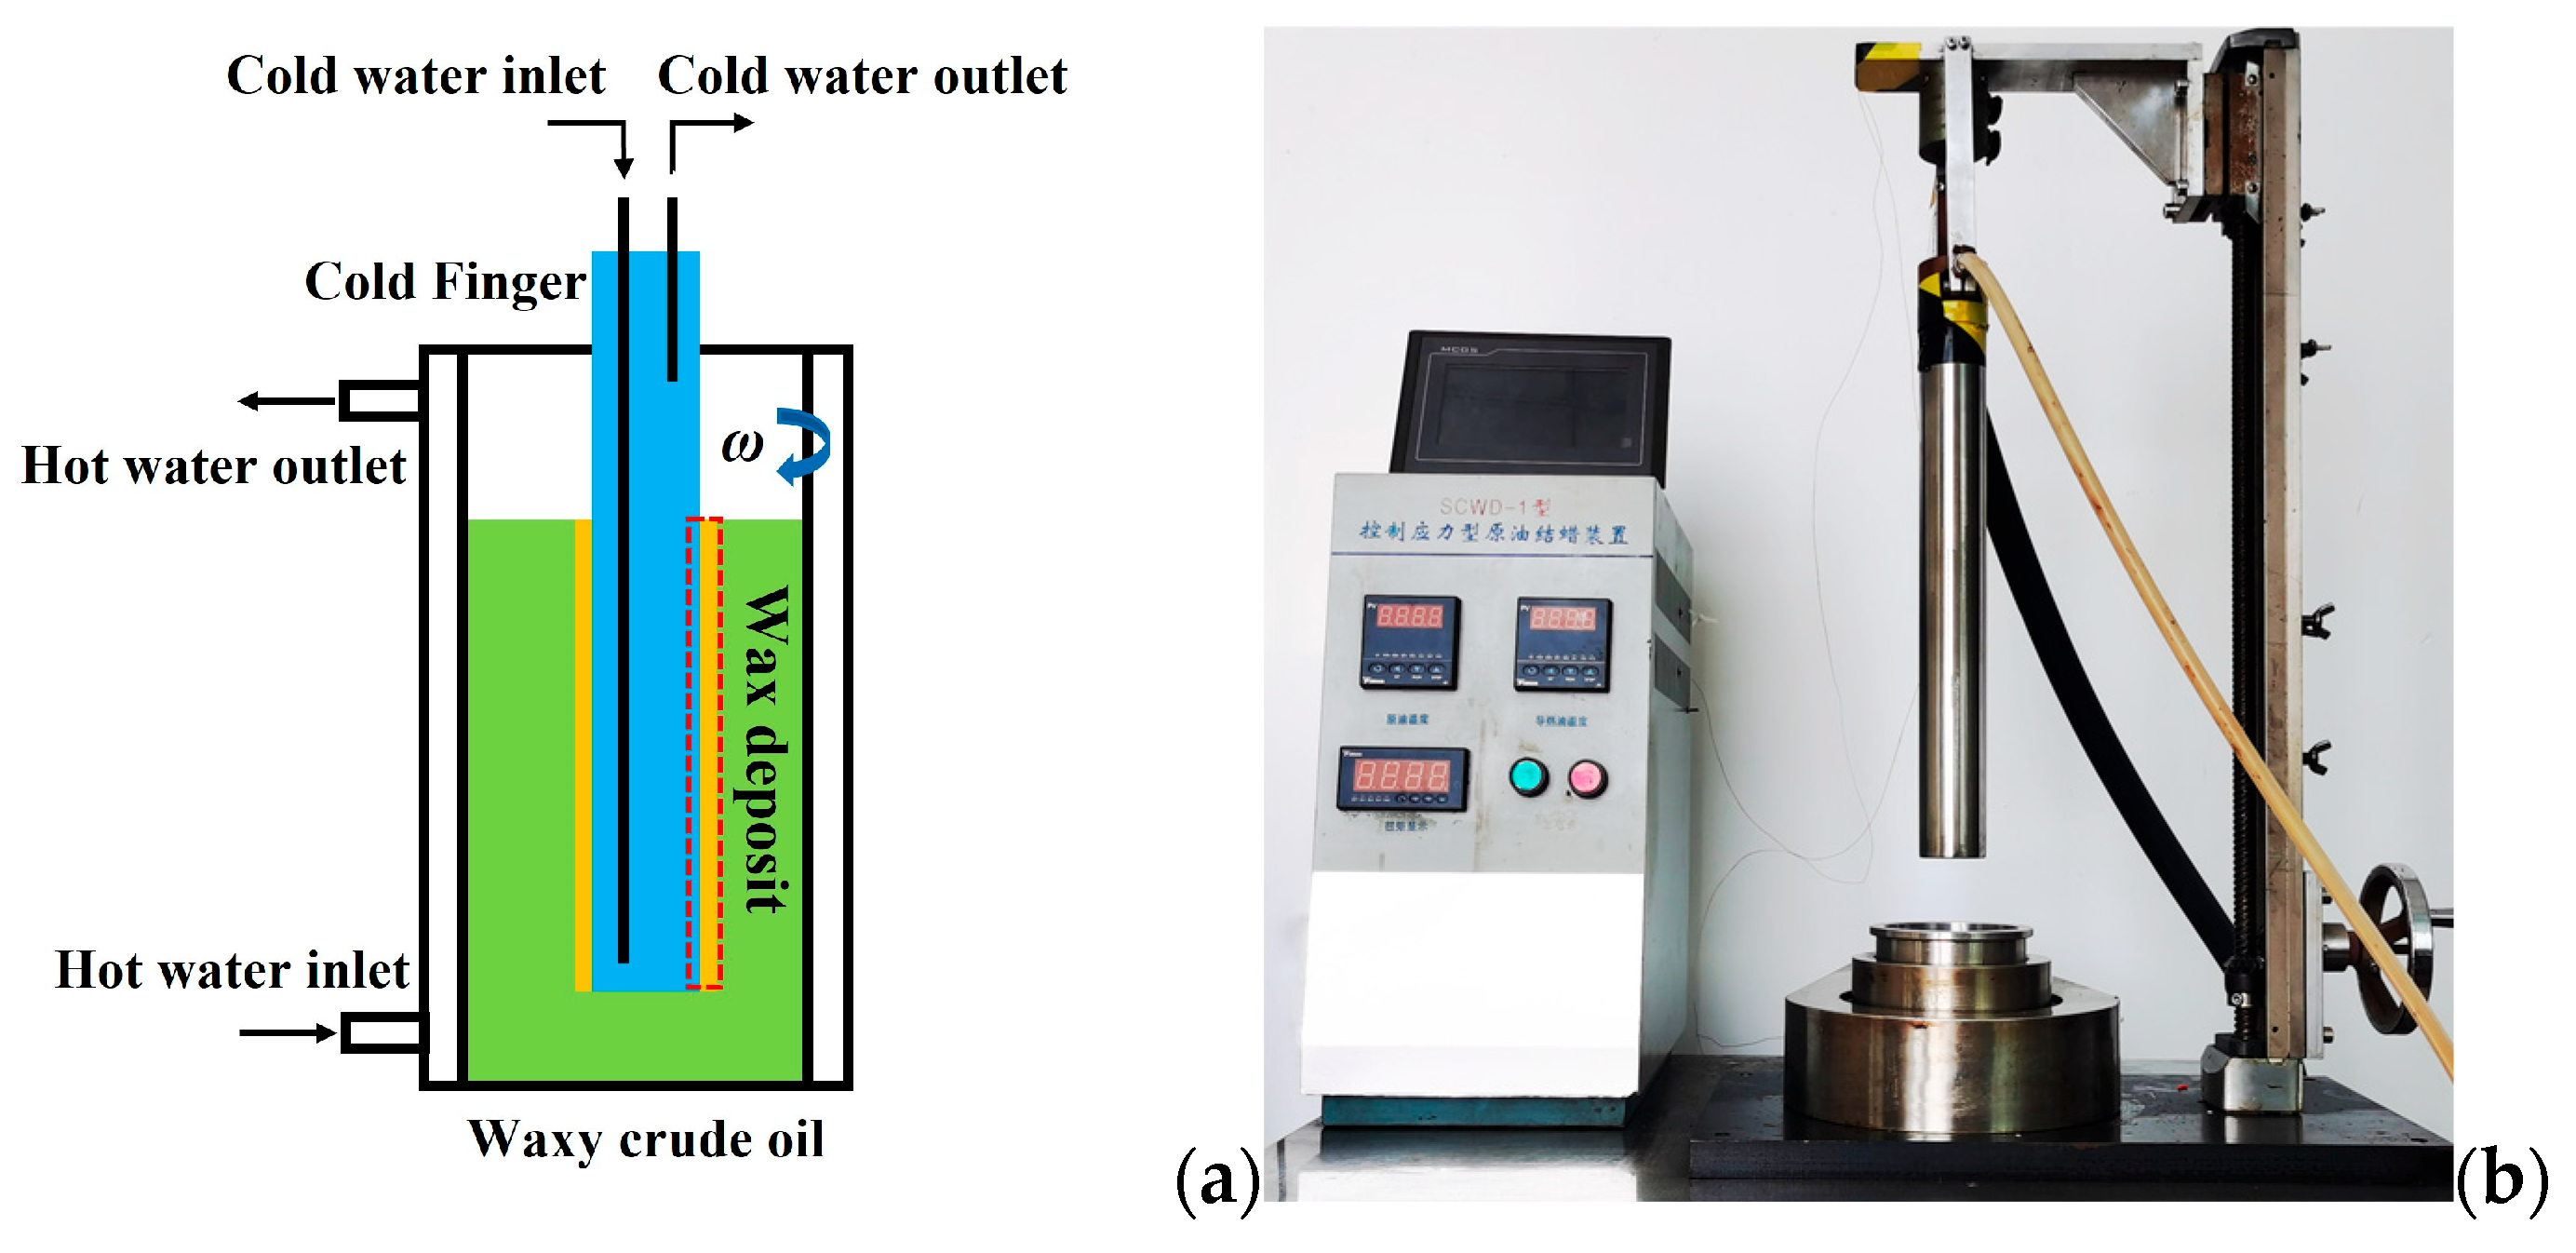
2.2.4. Wax Deposition Experiment
3. Results
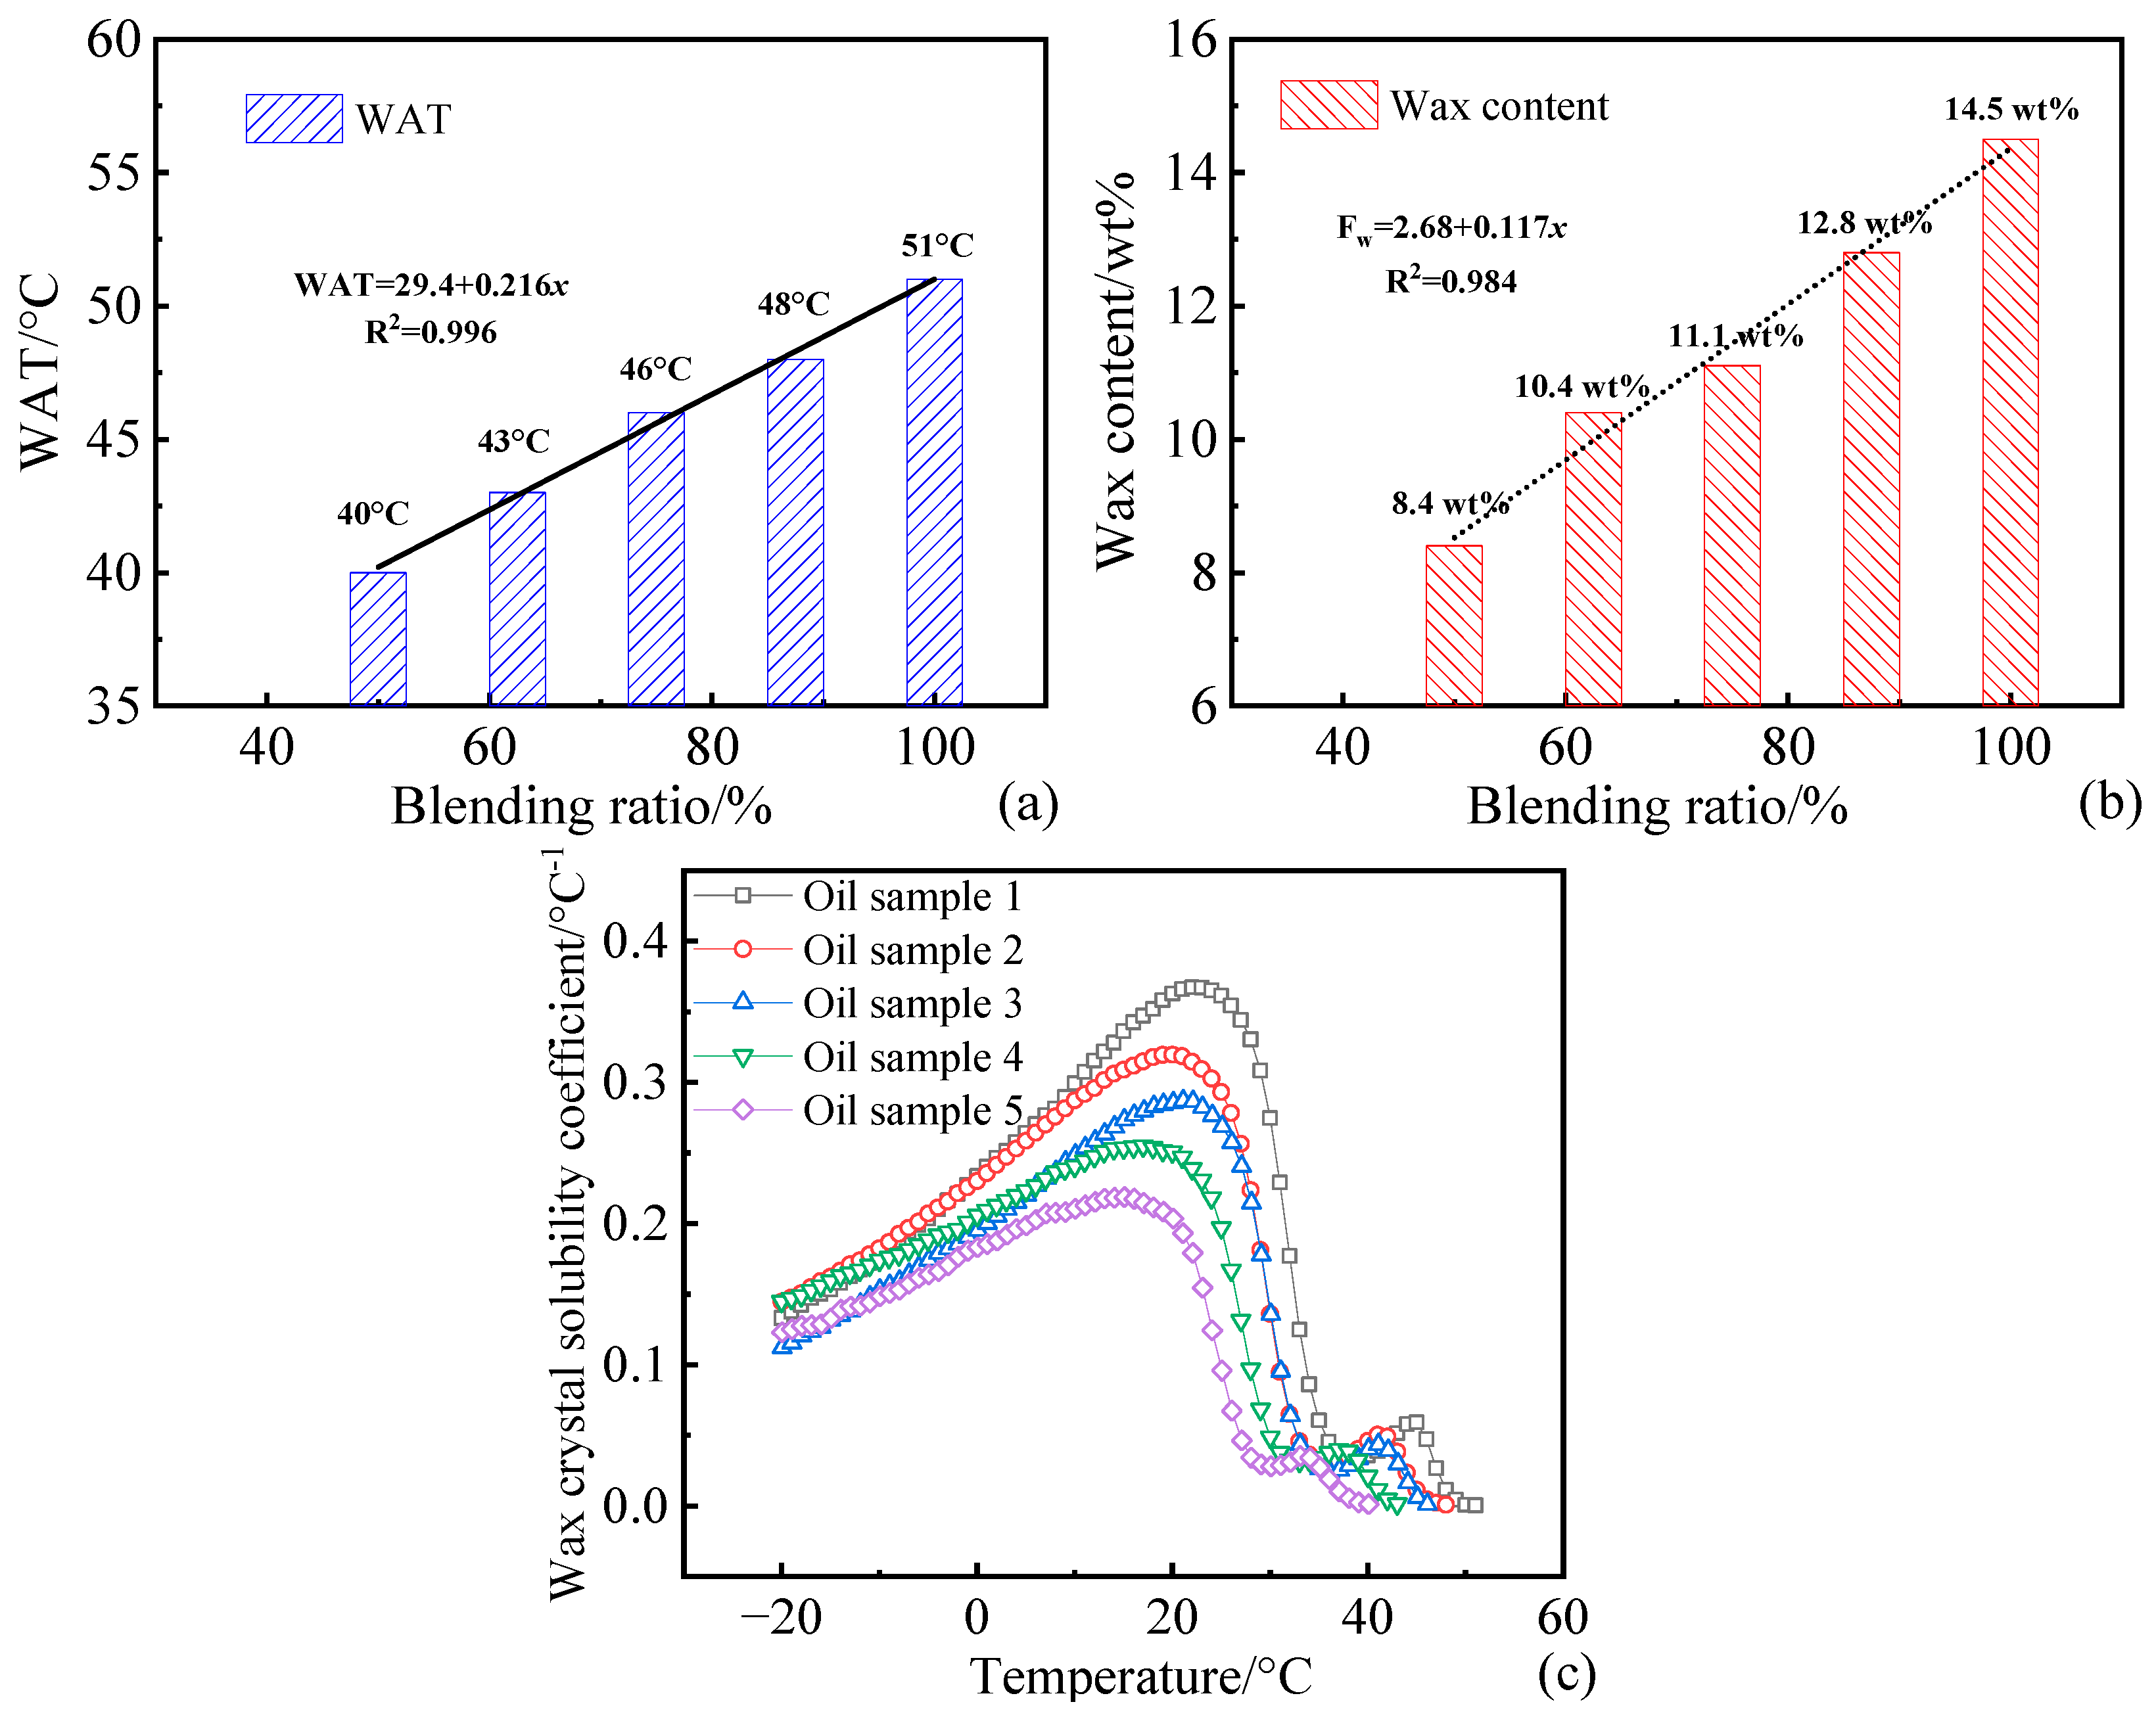
3.1. Thermal Physical Parameters of Blended Oil
3.2. Flow Characteristic Parameters of Blended Oil
3.3. Gelation Behavior of Blended Oil
3.4. Wax Deposition Characteristics of Blended Oil
3.5. Discussion on the Flowability and Wax Deposition Characteristics of Blended Oils
4. Conclusions
- (1)
- An increase in the blending ratio does not change the shape of the DSC curves, while the WAT and wax content of crude oil linearly decrease.
- (2)
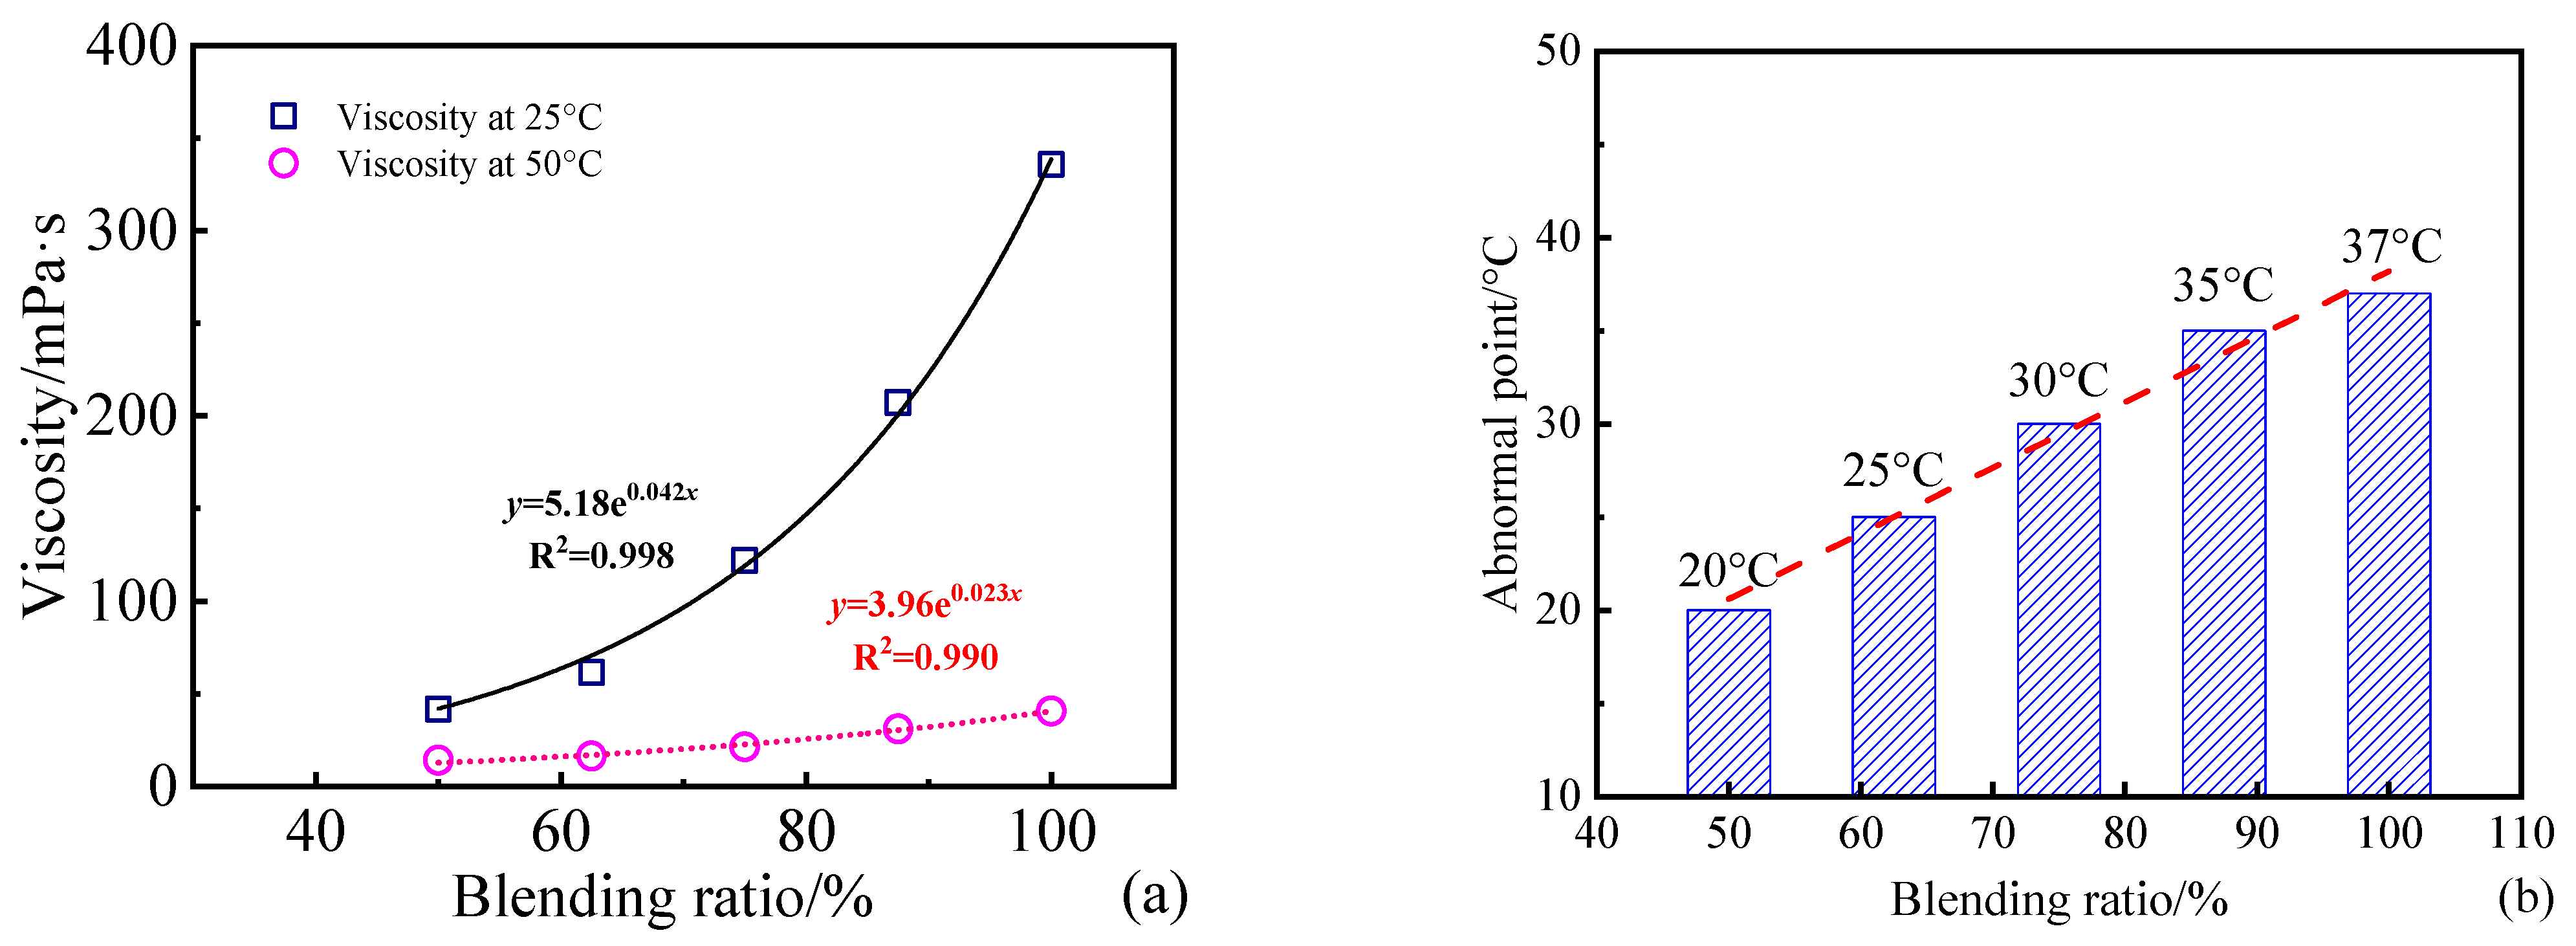
- With an increase in the blending ratio, the oil viscosity and abnormal point decrease, which shows that the crude oil flowability improves macroscopically.
- (3)
- The thermal treatment effect still exists in the blended crude oil, and the rheological properties of the blended crude oil gradually improve with an increase in the thermal treatment temperature.
- (4)
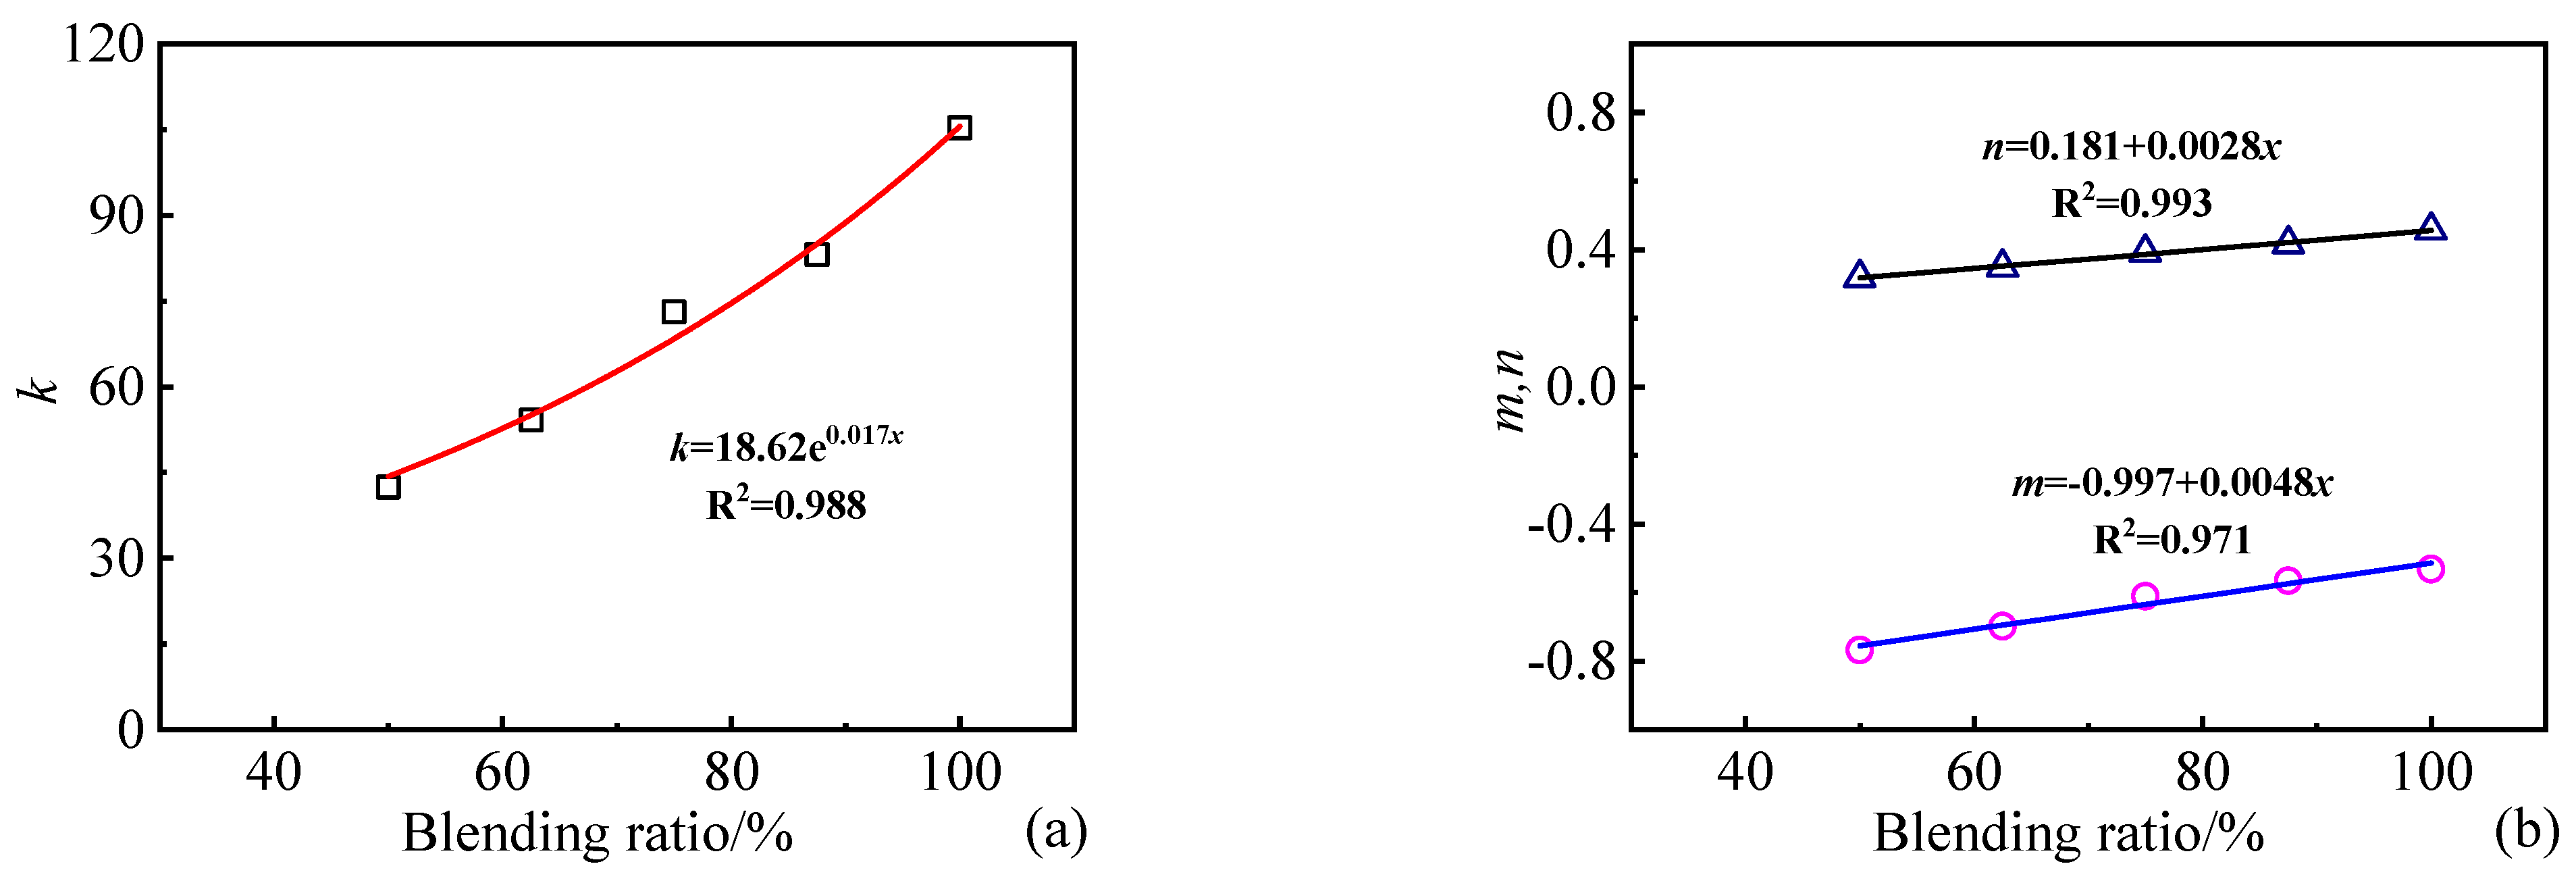
- With an increase in the blending ratio of crude oil, the wax deposition rate model parameters of crude oil gradually change. k gradually decreases, indicating that the wax deposition rate shows a decreasing trend. The absolute value of m increases gradually, and the value of n decreases gradually, indicating that the sensitivity of the wax deposition rate to the shear stress of the pipe wall increases, and the sensitivity to temperature gradient decreases.
Supplementary Materials
Author Contributions
Funding
Data Availability Statement
Conflicts of Interest
References
- Alnaimat, F.; Ziauddin, M. Wax deposition and prediction in petroleum pipelines. J. Pet. Sci. Eng. 2020, 184, 106385. [Google Scholar] [CrossRef]
- Liu, Z.; Li, Y.; Wang, W.; Song, G.; Lu, Z.; Ning, Y. Wax and wax-hydrate deposition characteristics in single-, two-, and three-phase pipelines: A review. Energy Fuels 2020, 34, 13350–13368. [Google Scholar] [CrossRef]
- Ruwoldt, J.; Kurniawan, M.; Oschmann, H. Non-linear dependency of wax appearance temperature on cooling rate. J. Pet. Sci. Eng. 2018, 165, 114–126. [Google Scholar] [CrossRef]
- Van der Geest, C.; Melchuna, A.; Bizarre, L.; Bannwart, A.C.; Guersoni, V.C. Critical review on wax deposition in single-phase flow. Fuel 2021, 293, 120358. [Google Scholar] [CrossRef]
- Visintin, R.F.; Lapasin, R.; Vignati, E.; D’Antona, P.; Lockhart, T.P. Rheological behavior and structural interpretation of waxy crude oil gels. Langmuir 2005, 21, 6240–6249. [Google Scholar] [CrossRef]
- Zhu, H.; Lei, Y.; Li, C.; Yao, B.; Yang, F.; Li, S.; Peng, H.; Yu, P. Experimental and mechanism investigation on flowability and wax deposition of waxy crude oil with dissolved CH4 by pressurized laboratory apparatus. Fuel 2023, 343, 127907. [Google Scholar] [CrossRef]
- Yang, F.; Zhao, Y.; Sjöblom, J.; Li, C.; Paso, K.G. Polymeric wax inhibitors and pour point depressants for waxy crude oils: A critical review. J. Dispers. Sci. Technol. 2015, 36, 213–225. [Google Scholar] [CrossRef]
- Martínez-Narro, G.; Pozos-Vázquez, C.; Núñez-Delgado, A.; Morán-Medellín, D.; Lara-Zárate, V.E. Heavy crude oil viscosity reduction by dilution with hydrocarbons obtained via pyrolysis of polypropylene and polystyrene. Pet. Sci. Technol. 2020, 38, 651–658. [Google Scholar] [CrossRef]
- Ding, J.; Liu, D.; Tang, S.; Ren, S.; Yu, H. Study on temperature field reconstruction of cold and hot crude oil transportation. J. Liaoning Univ. Pet. Chem. Technol. 2017, 37, 34. [Google Scholar]
- Yao, B.; Li, C.; Yang, F.; Sun, G.; Xia, X.; Ashmawy, A.M.; Zeng, H. Advances in and Perspectives on Strategies for Improving the Flowability of Waxy Oils. Energy Fuels 2022, 36, 7987–8025. [Google Scholar] [CrossRef]
- Al-Mishaal, O.F.; Suwaid, M.A.; Al-Muntaser, A.A.; Khelkhal, M.A.; Varfolomeev, M.A.; Djimasbe, R.; Zairov, R.R.; Saeed, S.A.; Vorotnikova, N.A.; Shestopalov, M.A.; et al. Octahedral cluster complex of molybdenum as oil-soluble catalyst for improving in situ upgrading of heavy crude oil: Synthesis and application. Catalysts 2022, 12, 1125. [Google Scholar] [CrossRef]
- Tajik, A.; Farhadian, A.; Khelkhal, M.A.; Rezaeisadat, M.; Petrov, S.M.; Eskin, A.A.; Vakhin, A.V.; Golafshani, M.B.; Lapuk, S.E.; Buzurov, A.E.; et al. Sunflower oil as renewable biomass source to develop highly effective oil-soluble catalysts for in-situ combustion of heavy oil. Chem. Eng. J. 2023, 453, 139813. [Google Scholar] [CrossRef]
- Liu, Y.; Shi, S.; Wang, Y.; Feng, Y.; Luo, C. Calculation of heavy oil viscosity based on an Arrhenius model. Pet. Sci. Technol. 2017, 35, 1196–1202. [Google Scholar] [CrossRef]
- Mohammadi, S.; Sobati, M.A.; Sadeghi, M. Viscosity reduction of heavy crude oil by dilution methods: New correlations for the prediction of the kinematic viscosity of blends. Iran. J. Oil Gas Sci. Technol. 2019, 8, 60–77. [Google Scholar]
- Ding, H.; Wang, C.; Zhu, X. Estimation of the kinematic viscosities of bio-oil/alcohol blends: Kinematic viscosity-temperature formula and mixing rules. Fuel 2019, 254, 115687. [Google Scholar] [CrossRef]
- Hernández, E.A.; Sánchez-Reyna, G.; Ancheyta, J. Evaluation of mixing rules to predict viscosity of petrodiesel and biodiesel blends. Fuel 2021, 283, 118941. [Google Scholar] [CrossRef]
- Jing, J.; Yin, R.; Yuan, Y.; Shi, Y.; Sun, J.; Zhang, M. Determination of the transportation limits of heavy crude oil using three combined methods of heating, water blending, and dilution. ACS Omega 2020, 5, 9870–9884. [Google Scholar] [CrossRef] [PubMed]
- Gao, X.; Dong, P.; Cui, J.; Gao, Q. Prediction model for the viscosity of heavy oil diluted with light oil using machine learning techniques. Energies 2022, 15, 2297. [Google Scholar] [CrossRef]
- Zhang, J.; Zhao, T.; Wu, H. Addition of a Heavy Crude May Facilitate Pipelining of Some Waxy Crudes; UNITAR: New York, NY, USA, 1995. [Google Scholar]
- Yang, F.; Zhu, H.; Li, C.; Yao, B.; Wang, F.; Chen, J.; Sun, G. Investigation on the mechanism of wax deposition inhibition induced by asphaltenes and wax inhibitors. J. Pet. Sci. Eng. 2021, 204, 108723. [Google Scholar] [CrossRef]
- Lei, Y.; Li, S.; Liu, X.; Wang, H.; Zhu, H.; Gao, Y.; Peng, H.; Yu, P. Effect of existence state of asphaltenes on microstructure of wax crystals: Fractal dimension and unit cell structure. J. Mol. Liq. 2022, 365, 120132. [Google Scholar] [CrossRef]
- Lei, Y.; Yu, P.; Ni, W.; Peng, H.; Liu, Y.; Lv, X.; Zhao, H. Study on the kinetic process of asphaltene precipitation during crude oil mixing and its effect on the wax behavior of crude oil. ACS Omega 2021, 6, 1497–1504. [Google Scholar] [CrossRef]
- Zhu, H.; Li, C.; Yang, F.; Liu, H.; Liu, D.; Sun, G.; Yao, B.; Liu, G.; Zhao, Y. Effect of thermal treatment temperature on the flowability and wax deposition characteristics of Changqing waxy crude oil. Energy Fuels 2018, 32, 10605–10615. [Google Scholar] [CrossRef]
- Li, C.; Zhu, H.; Yang, F.; Liu, H.; Wang, F.; Sun, G.; Yao, B. Effect of asphaltene polarity on wax precipitation and deposition characteristics of waxy oils. Energy Fuels 2019, 33, 7225–7233. [Google Scholar] [CrossRef]
- Yang, J.; Lu, Y.; Daraboina, N.; Sarica, C. Wax deposition mechanisms: Is the current description sufficient? Fuel 2020, 275, 117937. [Google Scholar] [CrossRef]
- Huang, Z.; Zheng, S.; Fogler, H.S. Wax Deposition: Experimental Characterizations, Theoretical Modeling, and Field Practices; CRC Press: Boca Raton, FL, USA, 2016. [Google Scholar]
- Mahir, L.H.A.; Vilas Bôas Fávero, C.; Ketjuntiwa, T.; Fogler, H.S.; Larson, R.G. Mechanism of wax deposition on cold surfaces: Gelation and deposit aging. Energy Fuels 2018, 33, 3776–3786. [Google Scholar] [CrossRef]
- Janamatti, A.; Lu, Y.; Ravichandran, S.; Sarica, C.; Daraboina, N. Influence of operating temperatures on long-duration wax deposition in flow lines. J. Pet. Sci. Eng. 2019, 183, 106373. [Google Scholar] [CrossRef]
- Li, R.; Huang, Q.; Huo, F.; Fan, K.; Li, W.; Zhang, D. Effect of shear on the thickness of wax deposit under laminar flow regime. J. Pet. Sci. Eng. 2019, 181, 106212. [Google Scholar] [CrossRef]
- Mahir, L.H.A.; Lee, J.; Fogler, H.S.; Larson, R.G. An experimentally validated heat and mass transfer model for wax deposition from flowing oil onto a cold surface. AIChE J. 2021, 67, e17063. [Google Scholar] [CrossRef]
- Huang, Z.; Lee, H.S.; Senra, M.; Scott Fogler, H. A fundamental model of wax deposition in subsea oil pipelines. AIChE J. 2011, 57, 2955–2964. [Google Scholar] [CrossRef]
- Li, R.; Huang, Q.; Zhang, D.; Zhu, X.; Shan, J.; Wang, J. An aging theory-based mathematic model for estimating the wax content of wax deposits using the Fick’s second law. AIChE J. 2020, 66, e16892. [Google Scholar] [CrossRef]
- Ji, Z.; Li, C.; Yang, F.; Cai, J.; Cheng, L.; Shi, Y. An experimental design approach for investigating and modeling wax deposition based on a new cylindrical Couette apparatus. Pet. Sci. Technol. 2016, 34, 570–577. [Google Scholar] [CrossRef]
- Huang, Q.; Li, Y.; Zhang, J. Unified wax deposition model. Acta Pet. Sin. 2008, 29, 459. [Google Scholar] [CrossRef]
- Li, C.; Cai, J.; Yang, F.; Zhang, Y.; Bai, F.; Ma, Y.; Yao, B. Effect of asphaltenes on the stratification phenomenon of wax-oil gel deposits formed in a new cylindrical Couette device. J. Pet. Sci. Eng. 2016, 140, 73–84. [Google Scholar] [CrossRef]
- Yang, F.; Cheng, L.; Liu, H.; Yao, B.; Li, C.; Sun, G.; Zhao, Y. Comb-like polyoctadecyl acrylate (POA) wax inhibitor triggers the formation of heterogeneous waxy oil gel deposits in a cylindrical couette device. Energy Fuels 2018, 32, 373–383. [Google Scholar] [CrossRef]


| Thermal Treatment Temperature/°C | 50 | 60 | 70 | 80 |
|---|---|---|---|---|
| Oil sample 1 | 30 | 28 | 27 | 24 |
| Oil sample 2 | 27 | 25 | 24 | 23 |
| Oil sample 3 | 24 | 21 | 20 | 19 |
| Oil sample 4 | 20 | 16 | 15 | 14 |
| Oil sample 5 | 17 | 13 | 11 | 10 |
| Oil Temperature /°C | Wall Temperature /°C | Rotation Speed /(r·min−1) | Wall Shear Stress /Pa | Oil Viscosity /Pa·s | Wax Crystal Solubility Coefficient ×10−4/°C | Temperature Gradient /°C·m−1 | Wax Deposition Rate /g·m−2·h−1 |
|---|---|---|---|---|---|---|---|
| 42 | 32 | 150 | 3.576 | 0.207 | 17.70 | 579.0 | 9.14 |
| 45 | 35 | 150 | 2.717 | 0.127 | 6.07 | 578.8 | 4.96 |
| 48 | 38 | 150 | 2.246 | 0.088 | 3.47 | 578.9 | 5.56 |
| 51 | 41 | 150 | 1.885 | 0.068 | 3.88 | 576.8 | 7.89 |
| 55 | 45 | 150 | 1.508 | 0.054 | 5.93 | 574.3 | 16.26 |
| 58 | 48 | 150 | 1.291 | 0.046 | 1.15 | 573.6 | 4.01 |
| 37 | 32 | 150 | 4.874 | 0.193 | 17.70 | 291.4 | 5.21 |
| 47 | 32 | 150 | 2.847 | 0.217 | 17.70 | 867.6 | 10.55 |
| 52 | 32 | 150 | 2.329 | 0.226 | 17.70 | 1152.0 | 12.25 |
| 50 | 45 | 150 | 1.757 | 0.054 | 5.93 | 288.4 | 11.33 |
| 60 | 45 | 150 | 1.317 | 0.054 | 5.93 | 859.3 | 24.22 |
| 65 | 45 | 150 | 1.167 | 0.054 | 5.93 | 1143.0 | 25.44 |
| 55 | 45 | 50 | 0.503 | 0.054 | 5.93 | 574.3 | 29.75 |
| 55 | 45 | 100 | 1.005 | 0.054 | 5.93 | 574.3 | 19.93 |
| 42 | 32 | 50 | 1.231 | 0.272 | 17.7 | 579.0 | 12.10 |
| 42 | 32 | 100 | 2.414 | 0.229 | 17.7 | 579.0 | 9.98 |
| Oil Sample | Wax Deposition Model |
|---|---|
| Oil sample 1 | |
| Oil sample 2 | |
| Oil sample 3 | |
| Oil sample 4 | |
| Oil sample 5 |
Disclaimer/Publisher’s Note: The statements, opinions and data contained in all publications are solely those of the individual author(s) and contributor(s) and not of MDPI and/or the editor(s). MDPI and/or the editor(s) disclaim responsibility for any injury to people or property resulting from any ideas, methods, instructions or products referred to in the content. |
© 2024 by the authors. Licensee MDPI, Basel, Switzerland. This article is an open access article distributed under the terms and conditions of the Creative Commons Attribution (CC BY) license (https://creativecommons.org/licenses/by/4.0/).
Share and Cite
Han, Z.; Ma, L.; Li, X.; Zhu, H.; Li, W.; Xia, X.; Zhang, X.; Guo, R. Determination of Wax Deposition Rate Model of Blended Oils with Different Blending Ratios. Processes 2024, 12, 772. https://doi.org/10.3390/pr12040772
Han Z, Ma L, Li X, Zhu H, Li W, Xia X, Zhang X, Guo R. Determination of Wax Deposition Rate Model of Blended Oils with Different Blending Ratios. Processes. 2024; 12(4):772. https://doi.org/10.3390/pr12040772
Chicago/Turabian StyleHan, Zhuo, Lihui Ma, Xiaowei Li, Haoran Zhu, Wei Li, Xiaohang Xia, Xiaohan Zhang, and Rui Guo. 2024. "Determination of Wax Deposition Rate Model of Blended Oils with Different Blending Ratios" Processes 12, no. 4: 772. https://doi.org/10.3390/pr12040772
APA StyleHan, Z., Ma, L., Li, X., Zhu, H., Li, W., Xia, X., Zhang, X., & Guo, R. (2024). Determination of Wax Deposition Rate Model of Blended Oils with Different Blending Ratios. Processes, 12(4), 772. https://doi.org/10.3390/pr12040772