Article

A Study on the Adsorption of Methylene Blue by Acid-Modified Coal Measures Kaolin

1
School of Chemical & Environment Engineering, China University of Mining and Technology-Beijing, Beijing 100083, China
2
Chengde Xinglong Mining Co., Ltd., Chengde 067300, China
3
Ningxia Survey and Monitor Institute of Land and Resources, Yinchuan 750002, China
4
School of Chemistry and Materials Engineering, Liupanshui Normal University, Liupanshui 553004, China
*
Author to whom correspondence should be addressed.
Processes 2024, 12(4), 773; https://doi.org/10.3390/pr12040773
Submission received: 10 March 2024 / Revised: 4 April 2024 / Accepted: 8 April 2024 / Published: 12 April 2024
(This article belongs to the Section Chemical Processes and Systems)

Abstract

:
In this paper, coal measure kaolin after flotation decarburization was made into an adsorbent by ball milling and acid modification to absorb methylene blue in water, achieving the treatment of waste with waste. The objective of this paper is to expand the application of coal measure kaolin, reduce its stock, and lower the raw material cost of adsorbents while treating wastewater containing methylene blue. The optimum milling time, acid boiling conditions, and adsorption conditions were investigated. Furthermore, the adsorption mechanism was investigated by kinetic calculation. The results show that the optimum milling time is 7 h. Relatively good acid modification conditions include a boiling temperature of 100 °C, a stirring time of 135 min, a stirring speed of 1000 r·min−1, and a concentration of hydrochloric acid of 8 mol·L−1. When 0.05 g of flotation kaolin adsorbent was used to adsorb the solution with pH 12 and a methylene blue concentration of 100 mg·L−1, the optimal adsorption conditions were a 38.05 °C adsorption temperature, a 160 r·min−1 stirring speed, and a 31.02 min stirring time. Under these optimal conditions, the adsorption quantity reached 39.92 mg·g−1. The adsorption process involves physical adsorption and spontaneous adsorption. The adsorption type is known as the quasi-second-order adsorption kinetic model. The adsorption form is heterogeneous adsorption in which a monolayer and a multi-molecular layer coexist.

1. Introduction

Methylene blue, as a cationic organic dye, is widely applied in various industries. It exerts a substantial impact on water. Specifically, it dissolves in water and colors it blue, which affects the photosynthesis in the water, resulting in hypoxia and influencing the survival of aquatic organisms. It can react with metal ions and organic matter in water, forming some complexes and increasing the difficulty and pressure to the self-purification of water supply. It exerts toxic effects on aquatic animals, causing death or mutation. Additionally, it causes adverse reactions and even illness after entering the human body through water consumption [1,2,3,4]. In short, methylene blue exhibits an oxidation-reducing property and can react with biological, organic, and metal ions in water, thereby changing water quality indicators such as color, odor, and biochemical oxygen demand. Consequently, methylene blue demonstrates a significant effect on water, necessitating treatment.
Methylene blue can be treated by absorption. To reduce the treatment cost of adsorbing methylene blue, kaolin is often used instead of expensive activated carbon. There are many studies in this field. For instance, Khalil A M et al. mixed kaolin and polystyrene (EPS), a type of packaging waste, to generate a porous ceramic membrane at 1000 °C and found that the formed membrane with 20% EPS exhibited the best adsorption performance for methylene blue [5]. Ghosh D et al. compared the adsorption effects of kaolin raw material, calcined kaolin, and sodium hydroxide (NaOH) on methylene blue. They found that kaolin raw material possessed a good adsorption effect, calcined kaolin reduced the adsorption quantity because of decreased active sites, and NaOH-treated kaolin improved the adsorption effect due to the increased active sites. Furthermore, they observed that the adsorption rate of raw kaolin to methylene blue solution was 65%, and NaOH-treated kaolin, among the six kaolin adsorption materials, demonstrated the highest adsorption rate, reaching 85% [6]. Harris R G et al. reported that the adsorption between cationic dyes (such as methylene blue) and kaolinite is mainly electrostatic, and the silica surface in kaolinite is negatively charged [7]. Furthermore, Nwosu F O et al. compared the adsorption effects of non-coal measure kaolin raw materials, acid-modified kaolin, and alkali-modified kaolin on methylene blue. Their observations revealed that there are well-developed irregular pores on the surface of modified kaolin, and the adsorption effect of modified kaolin was better than that of unmodified kaolin. Regarding the removal of different sizes of molecules in gas, small or large molecules in pollutants also exhibit a good effect, and the surface of modified kaolin can be positively or negatively charged based on the pH condition, so the cation or anion in the dye can be removed effectively [8]. De Alencar P et al. pressed waste red mud and clay into a film, and then dried and calcined it at different temperatures to form a ceramic film. They demonstrated that the ceramic film calcined at 950 °C presented the highest adsorption capability when used for methylene blue [9]. In addition, Xu Hongliang et al. synthesized magnetic kaolin from magnetite and stripped nano-kaolin. Their findings unveiled that the adsorption quantity of 10 mg·L−1 of methylene blue solution was 35.91 mg·g−1 at 25 °C and pH = 7.18 [10].
Based on the above results, many scholars want to substitute non-coal measure kaolin with coal gangue so as to expand raw material sources of adsorption materials for methylene blue. More importantly, coal gangue, as a solid waste, will be well utilized [11] to respond to the policy of “treating waste with waste and turning waste into treasure”. There are few studies on the use of coal gangue as an adsorptive material for dye wastewater. For example, Wang Huijuan et al. modified coal gangue with alkali and cooked the coal gangue and NaOH at 1:10 for 1.5 h. Their results disclosed that the modified coal gangue increased the methylene blue adsorption rate from 45.45% to 96.87% [12]. Moreover, Xie Xiaokang et al. modified coal measure kaolin with hydrochloric acid and reported a good adsorption capacity of the modified kaolin, with an adsorption quantity of 244 mg·g−1 [13]. Gao Jida et al. first removed the organic matters in the coal gangue by calcination and then produced ZSM-5 zeolite by carrying out acid leaching and alkali melting on the calcined coal gangue in turn. The zeolite samples formed regular polygons, and its methylene blue adsorption quantity reached 118.34 mg·g−1 [14].
Consequently, coal gangue can be used as an adsorbent, and coal gangue modified by acid and alkali exhibits greatly improved adsorption performance. In addition, the current research results explicate that calcination is commonly used to remove carbon in coal gangue, but it is characterized with high energy consumption and pollution, and only calcined unmodified kaolin holds poorer adsorbability than raw materials [6]. Therefore, it is of high significance to investigate the effectiveness of coal gangue decarburized by the non-calcination method and then made into an adsorbent material. Specifically, the removal of carbon components in coal gangue without calcination can reduce heat consumption, thus decreasing calcination-induced atmospheric pollution. After the removal of carbon impurities from coal gangue, kaolin components are further enriched and modified by acid to adsorb dyes in wastewater with a higher adsorption rate. Finally, the purpose of treating wastewater with coal gangue as solid waste is realized. To address this, kaolin enrichment resulting from coal gangue flotation after the removal of carbon components was employed as the experimental raw material, without calcination, as a high-energy modification process, to explore the effectiveness of flotation kaolin. (To clarify, kaolin enrichment after coal gangue flotation was named flotation kaolin.) Furthermore, the best ball milling parameters, the best conditions for acid modification, and the best conditions for adsorption were explored. Additionally, the adsorption mechanism was determined through kinetic calculation.

2. Experimental Raw Materials, Reagents, and Methods

2.1. Experimental Raw Materials

Coal gangue refers to the coal measure kaolin with the largest output, which was selected as an adsorption material in this paper. The burning loss of coal gangue raw material is 30%. Due to a high carbon content, the carbon component has to be removed by flotation. The specific flotation process [11] can be briefly described as follows: The coal gangue was pulverized and stirred with water at 60 g·L−1 in a flotation cell of 1 L, followed by the introduction of 0.3 g of hydrophobic kerosene, 0.06 g of sec-octyl alcohol, and gas. Then, the carbon products floated up with bubbles in the tank, and those remaining in the slurry were kaolin enrichment, which is called flotation kaolin in this paper. After flotation, the combustion loss of coal gangue is reduced to less than 15%, significantly reducing the carbon content.

2.2. Experimental Reagents

(1) HCl (37%, 12 mol·L−1, AR);
(2) NaOH (≧96%, AR);
(3) A methylene blue solution was configured to simulate wastewater [15]. Specifically, a methylene blue solution with varying concentrations (0.1 mg·L−1, 0.2 mg·L−1, 0.3 mg·L−1, 0.5 mg·L−1, 0.7 mg·L−1, 1 mg·L−1, 5 mg·L−1, and 10 mg·L−1) was prepared to detect the absorbances using an ultraviolet visible spectrophotometer. Meanwhile, the accurate relationship between the solution concentration and absorbance was analyzed by plotting two diagrams. One was for lower solution concentrations ranging from 0.1 mg·L−1 to 0.7 mg·L−1 (Figure 1), and the other was for higher concentrations ranging from 0.7 mg·L−1 to 10 mg·L−1 (Figure 2).
The line in Figure 1 was fitted, with the formula being y = 0.12879x + 0.00603 and the degree of fitting, R2, being 0.99901. This formula was adopted to calculate the concentration of solutions with absorbance below 0.1 L·g−1·cm−1.
Similarly, the line in Figure 2 was fitted with the formula of y = 0.17993x − 0.04773 and an R2 value of 0.99929. This formula was used to calculate the concentration of solutions with absorbance above 0.1 L·g−1·cm−1.

2.3. Experimental Method

Absorbing methylene blue using coal gangue mainly involves three links, namely ball milling, acid modification, and adsorption, and the corresponding experiments are described in the following sections.

2.3.1. Ball Mill

Ball milling serves as the first step of producing an adsorbent after crushing raw materials, and the ball milling time is the most important factor affecting the adsorption experiment. To explore the changes in the particle size of materials at different milling times, 1 h, 4 h, 7 h, and 10 h were selected. In this paper, a planetary grinding machine and a dry laser particle size analyzer were employed to grind coal gangue and detect the particle size distribution of coal gangue after grinding, respectively. The particle size distribution is summarized in Table 1.
The results in the above table suggest that after the material is subjected to ball milling for 1 h, its average particle size becomes significantly smaller. With the increase in the ball milling time, the average particle size shows a decreasing trend, and the reduction range also keeps becoming smaller. Notably, the particle size distribution at 7 h and 10 h of ball milling was relatively close, the volume ratio of the material and the grinding ball was 1:1, the speed of the ball milling was set to 650 r·min−1, and the grinding direction was positive for 5 min and then reversed for 2 min so as to create a cycle until the total rotation time was reached. The particle size of the material reached about 625 mesh. Herein, the ball milling time of 7 h was selected for the experiment based on a comprehensive consideration of energy consumption, time efficiency, and material particle size.

2.3.2. Orthogonal Experiment of Acid Modification

Acid boiling stands as a production link of raw materials after ball milling. Specifically, 3 g of flotation kaolin and hydrochloric acid at a specified concentration was put into a flask, which was connected to make a heating reflux device. Subsequently, the flask was placed on the magnetic stirrer for stirring for a certain duration, which was determined by the set stirring temperature and speed. The reflux device and magnetic stirrer are shown in Figure 3 below.
Acid modification can influence the adsorption experiment in terms of the hydrochloric acid concentration, stirring time, stirring temperature, and stirring speed. In this case, orthogonal experiments with four factors and three levels were arranged to compare the primary and secondary orders of these four factors, and the results are presented in Table 2 below.
The above table suggests that, among the four influencing factors, the acid concentration exerts the most influential effect, followed by the stirring speed, stirring temperature, and stirring time, respectively. Moreover, the influence of the acid concentration and stirring speed is far greater than that of the stirring temperature and stirring time, while that of the stirring temperature and stirring time is close. In addition, if the three experimental conditions of the above four influential factors are completed, there will be 64 groups of experiments. The best experimental conditions are concluded as follows: 135 min for the stirring time, 100 °C for the stirring temperature, 1000 r·min−1 for the stirring speed, and 8 mol·L−1 for the acid concentration.

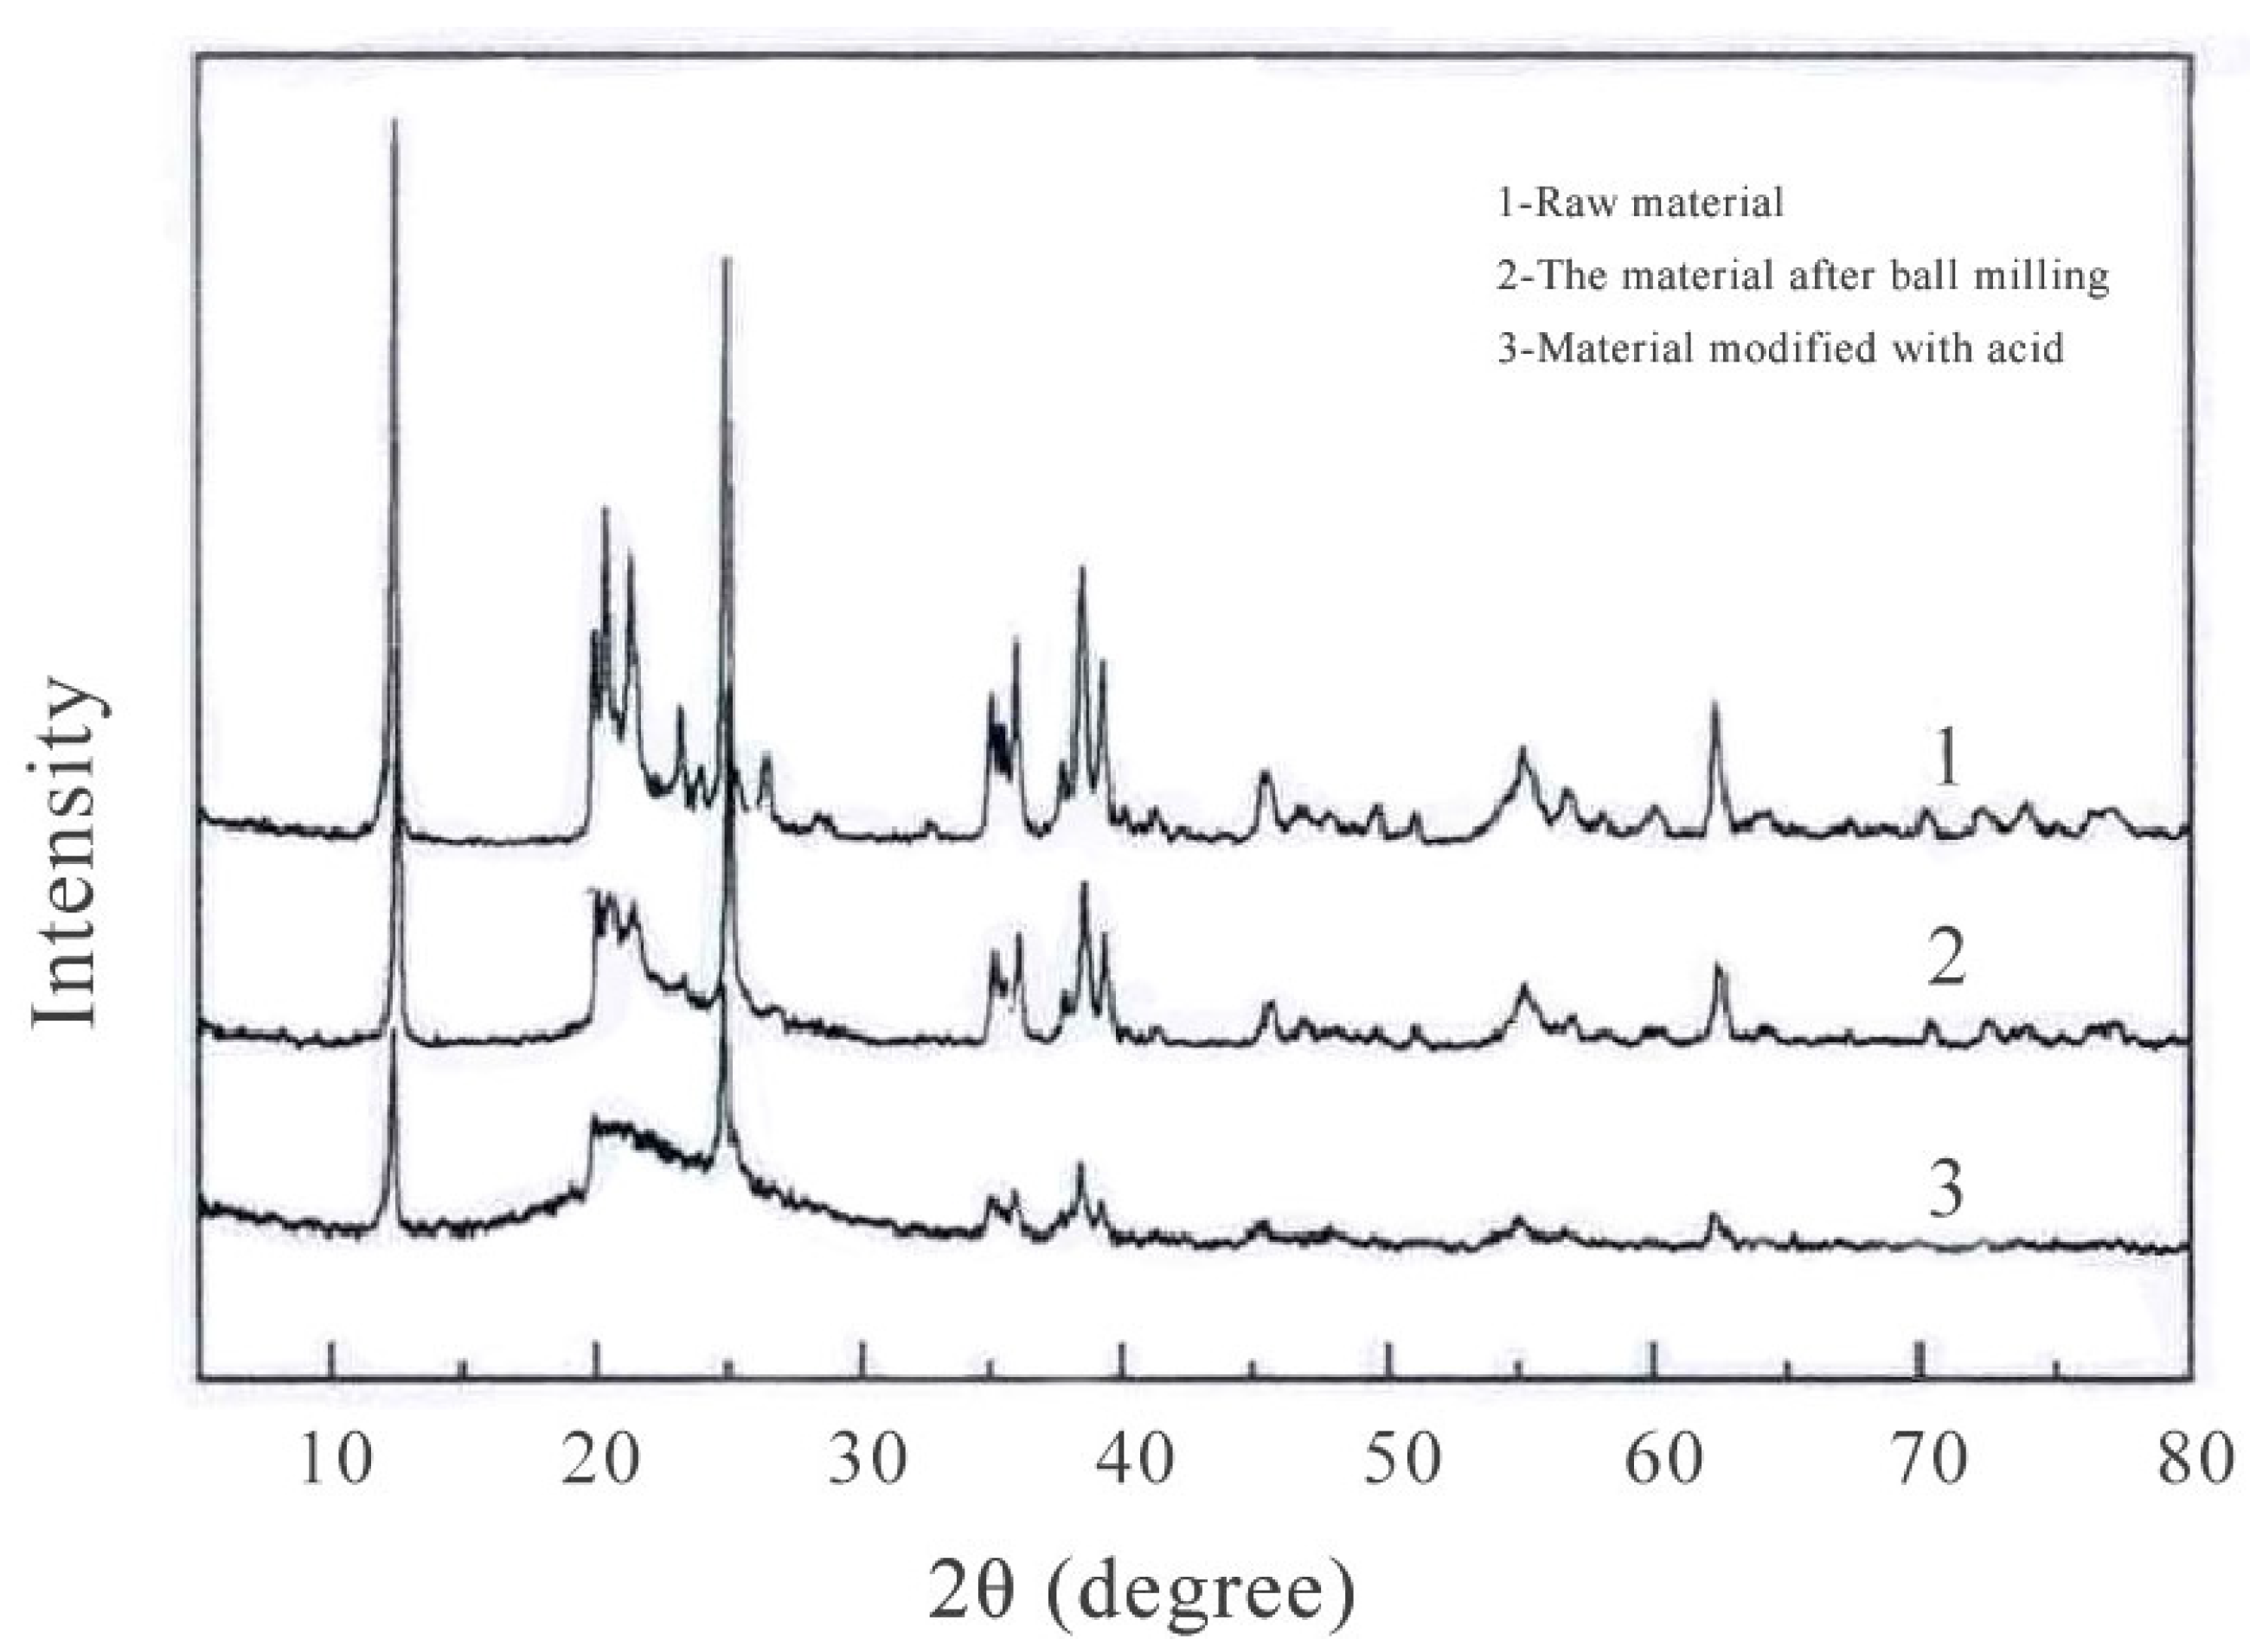
2.3.3. The Property Change in the Raw Material after Ball Milling and Acid Modification

In order to understand the changes in the specific surface area and pores of the material after ball milling and acid modification, the material was tested, and the results are shown in Table 3 below.
As can be seen in Table 3 above, after ball milling and acid modification, the specific surface area and pores of the material gradually increase, and the micropores, mesoporous, and full pores all show an increasing trend. The increase in pores increases the adsorption points of the adsorbent and enhances the adsorption capacity.
The raw materials, the materials after ball milling, and the materials after acid modification were tested by XRD, and the results are shown in Figure 4 below.
As can be seen in Figure 4, after the raw material was ball ground, its crystal diffraction peak was weaker than before. After the ball milling material was modified by acid, the crystal diffraction peak was somewhat weakened, but the weakening degree was not large. Therefore, after the ball milling and acid modification of the raw material, the crystal structure underwent some changes, and the active point of the material increased.

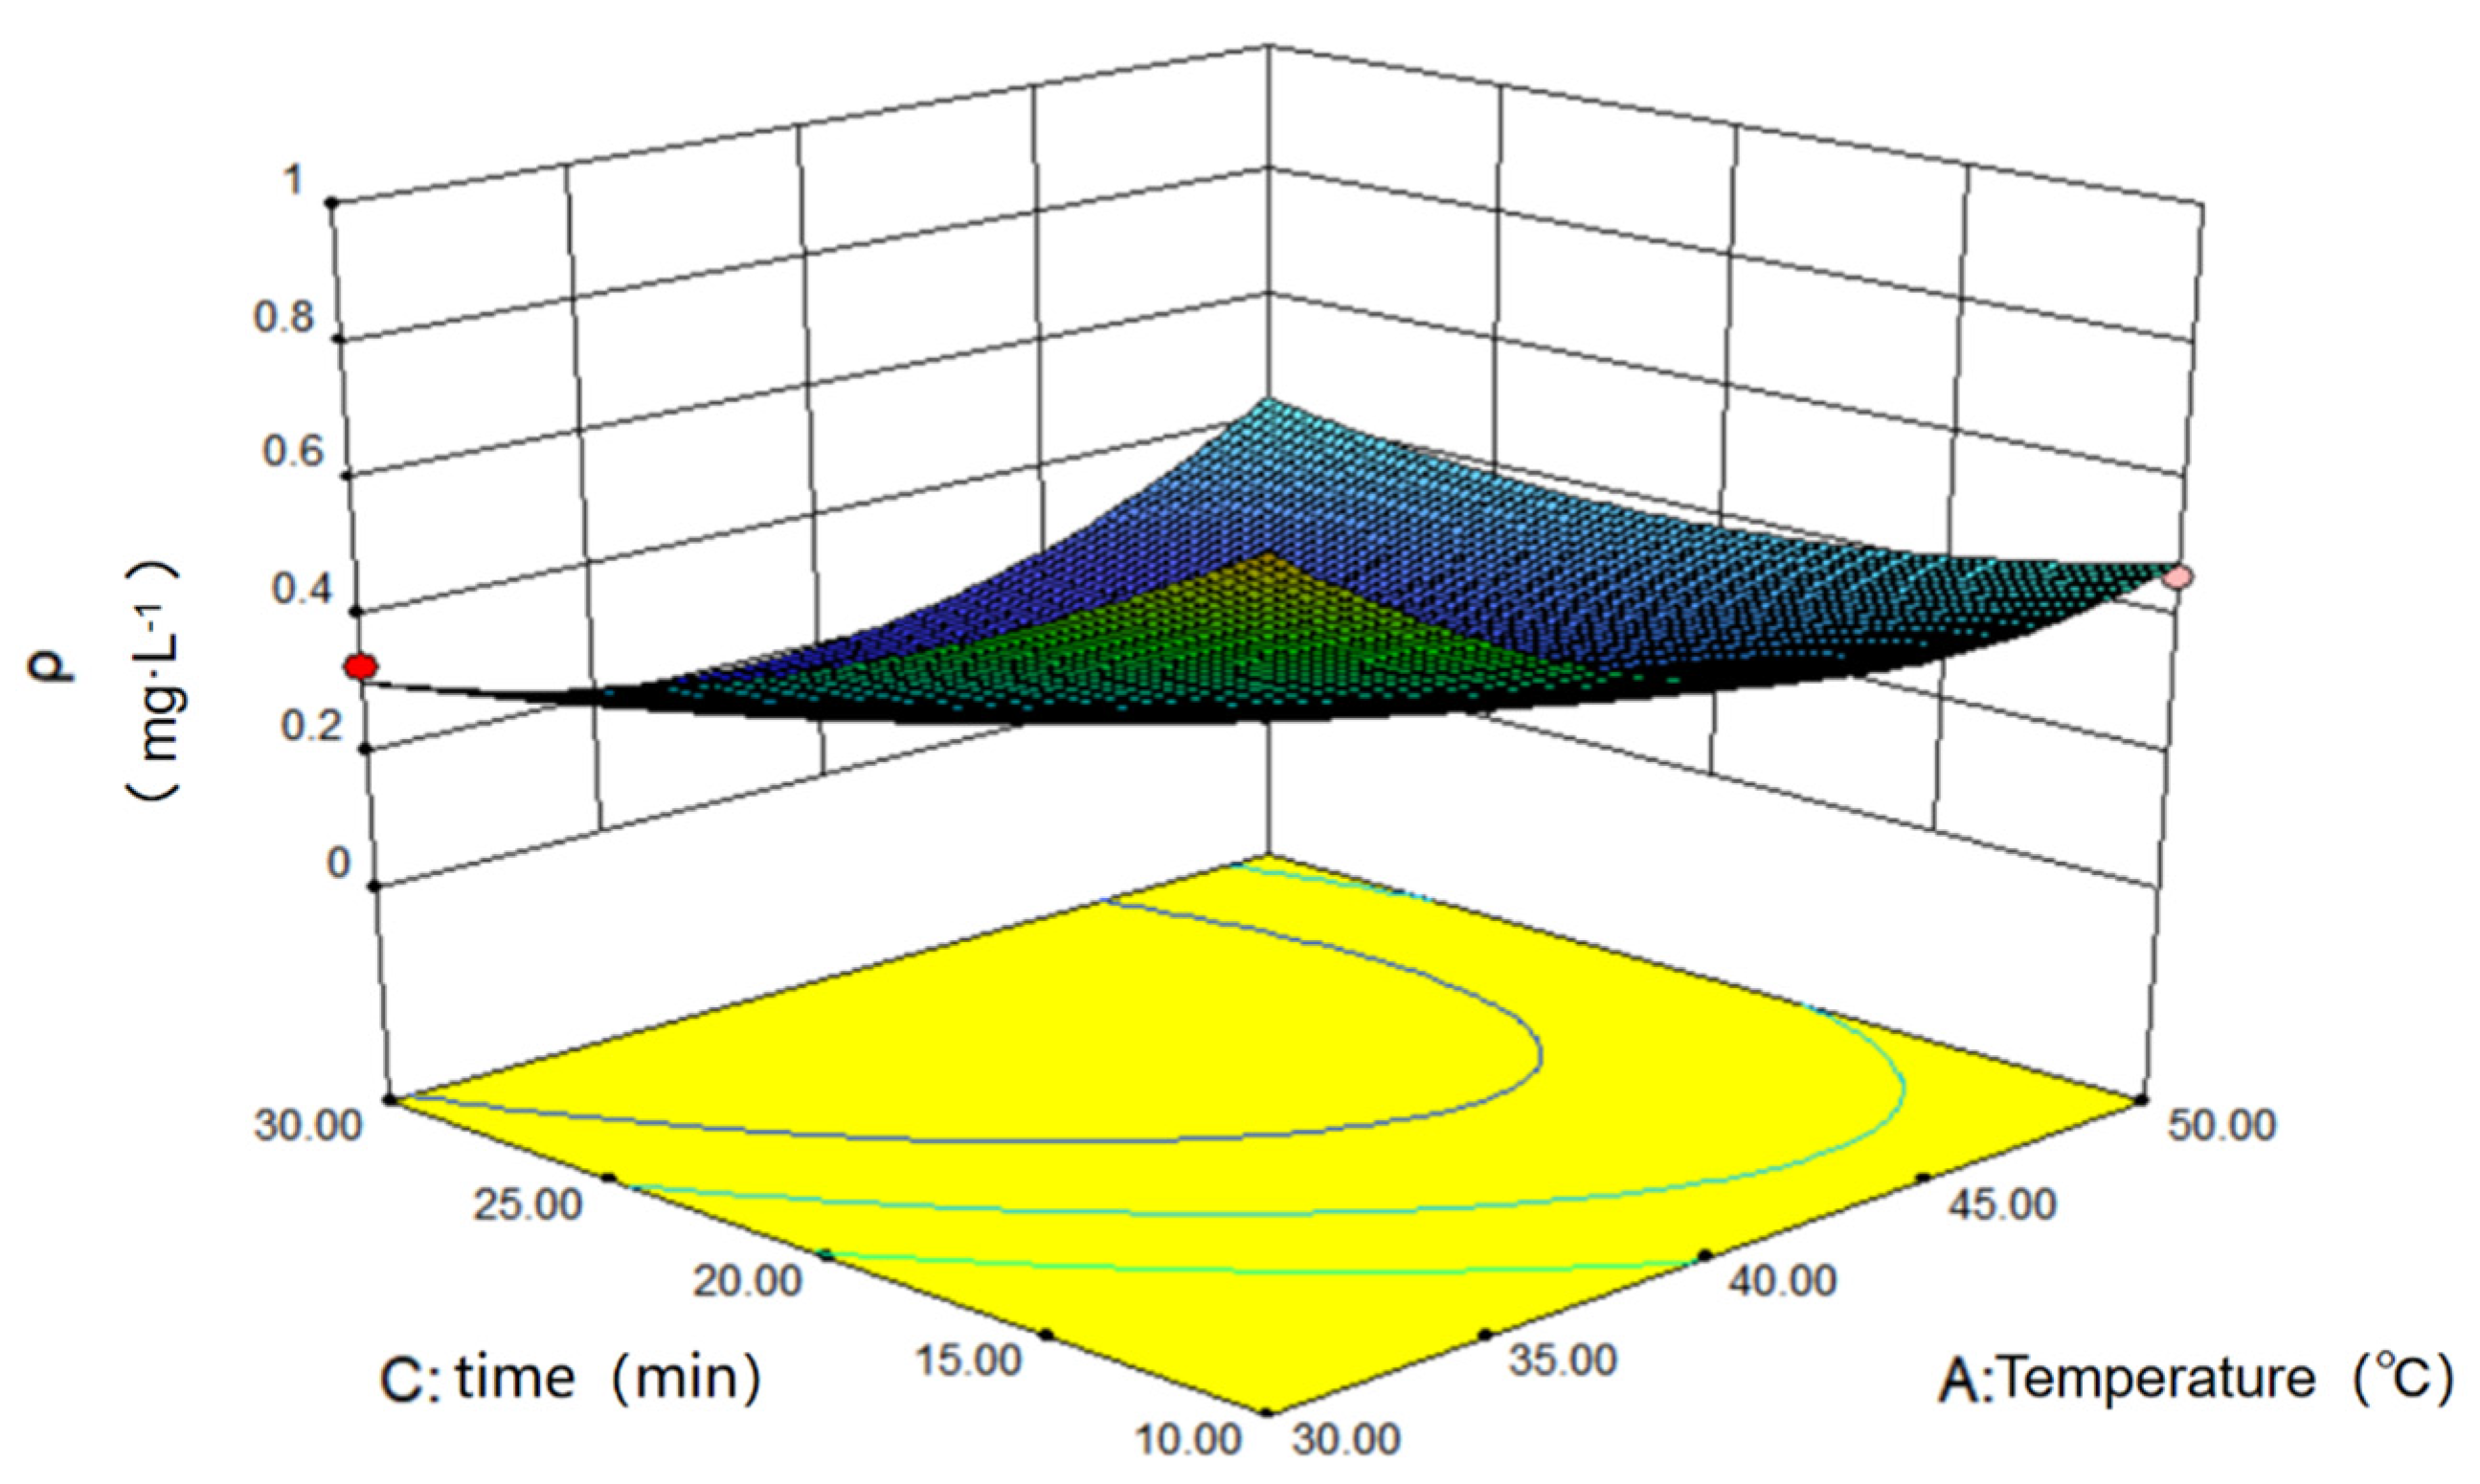
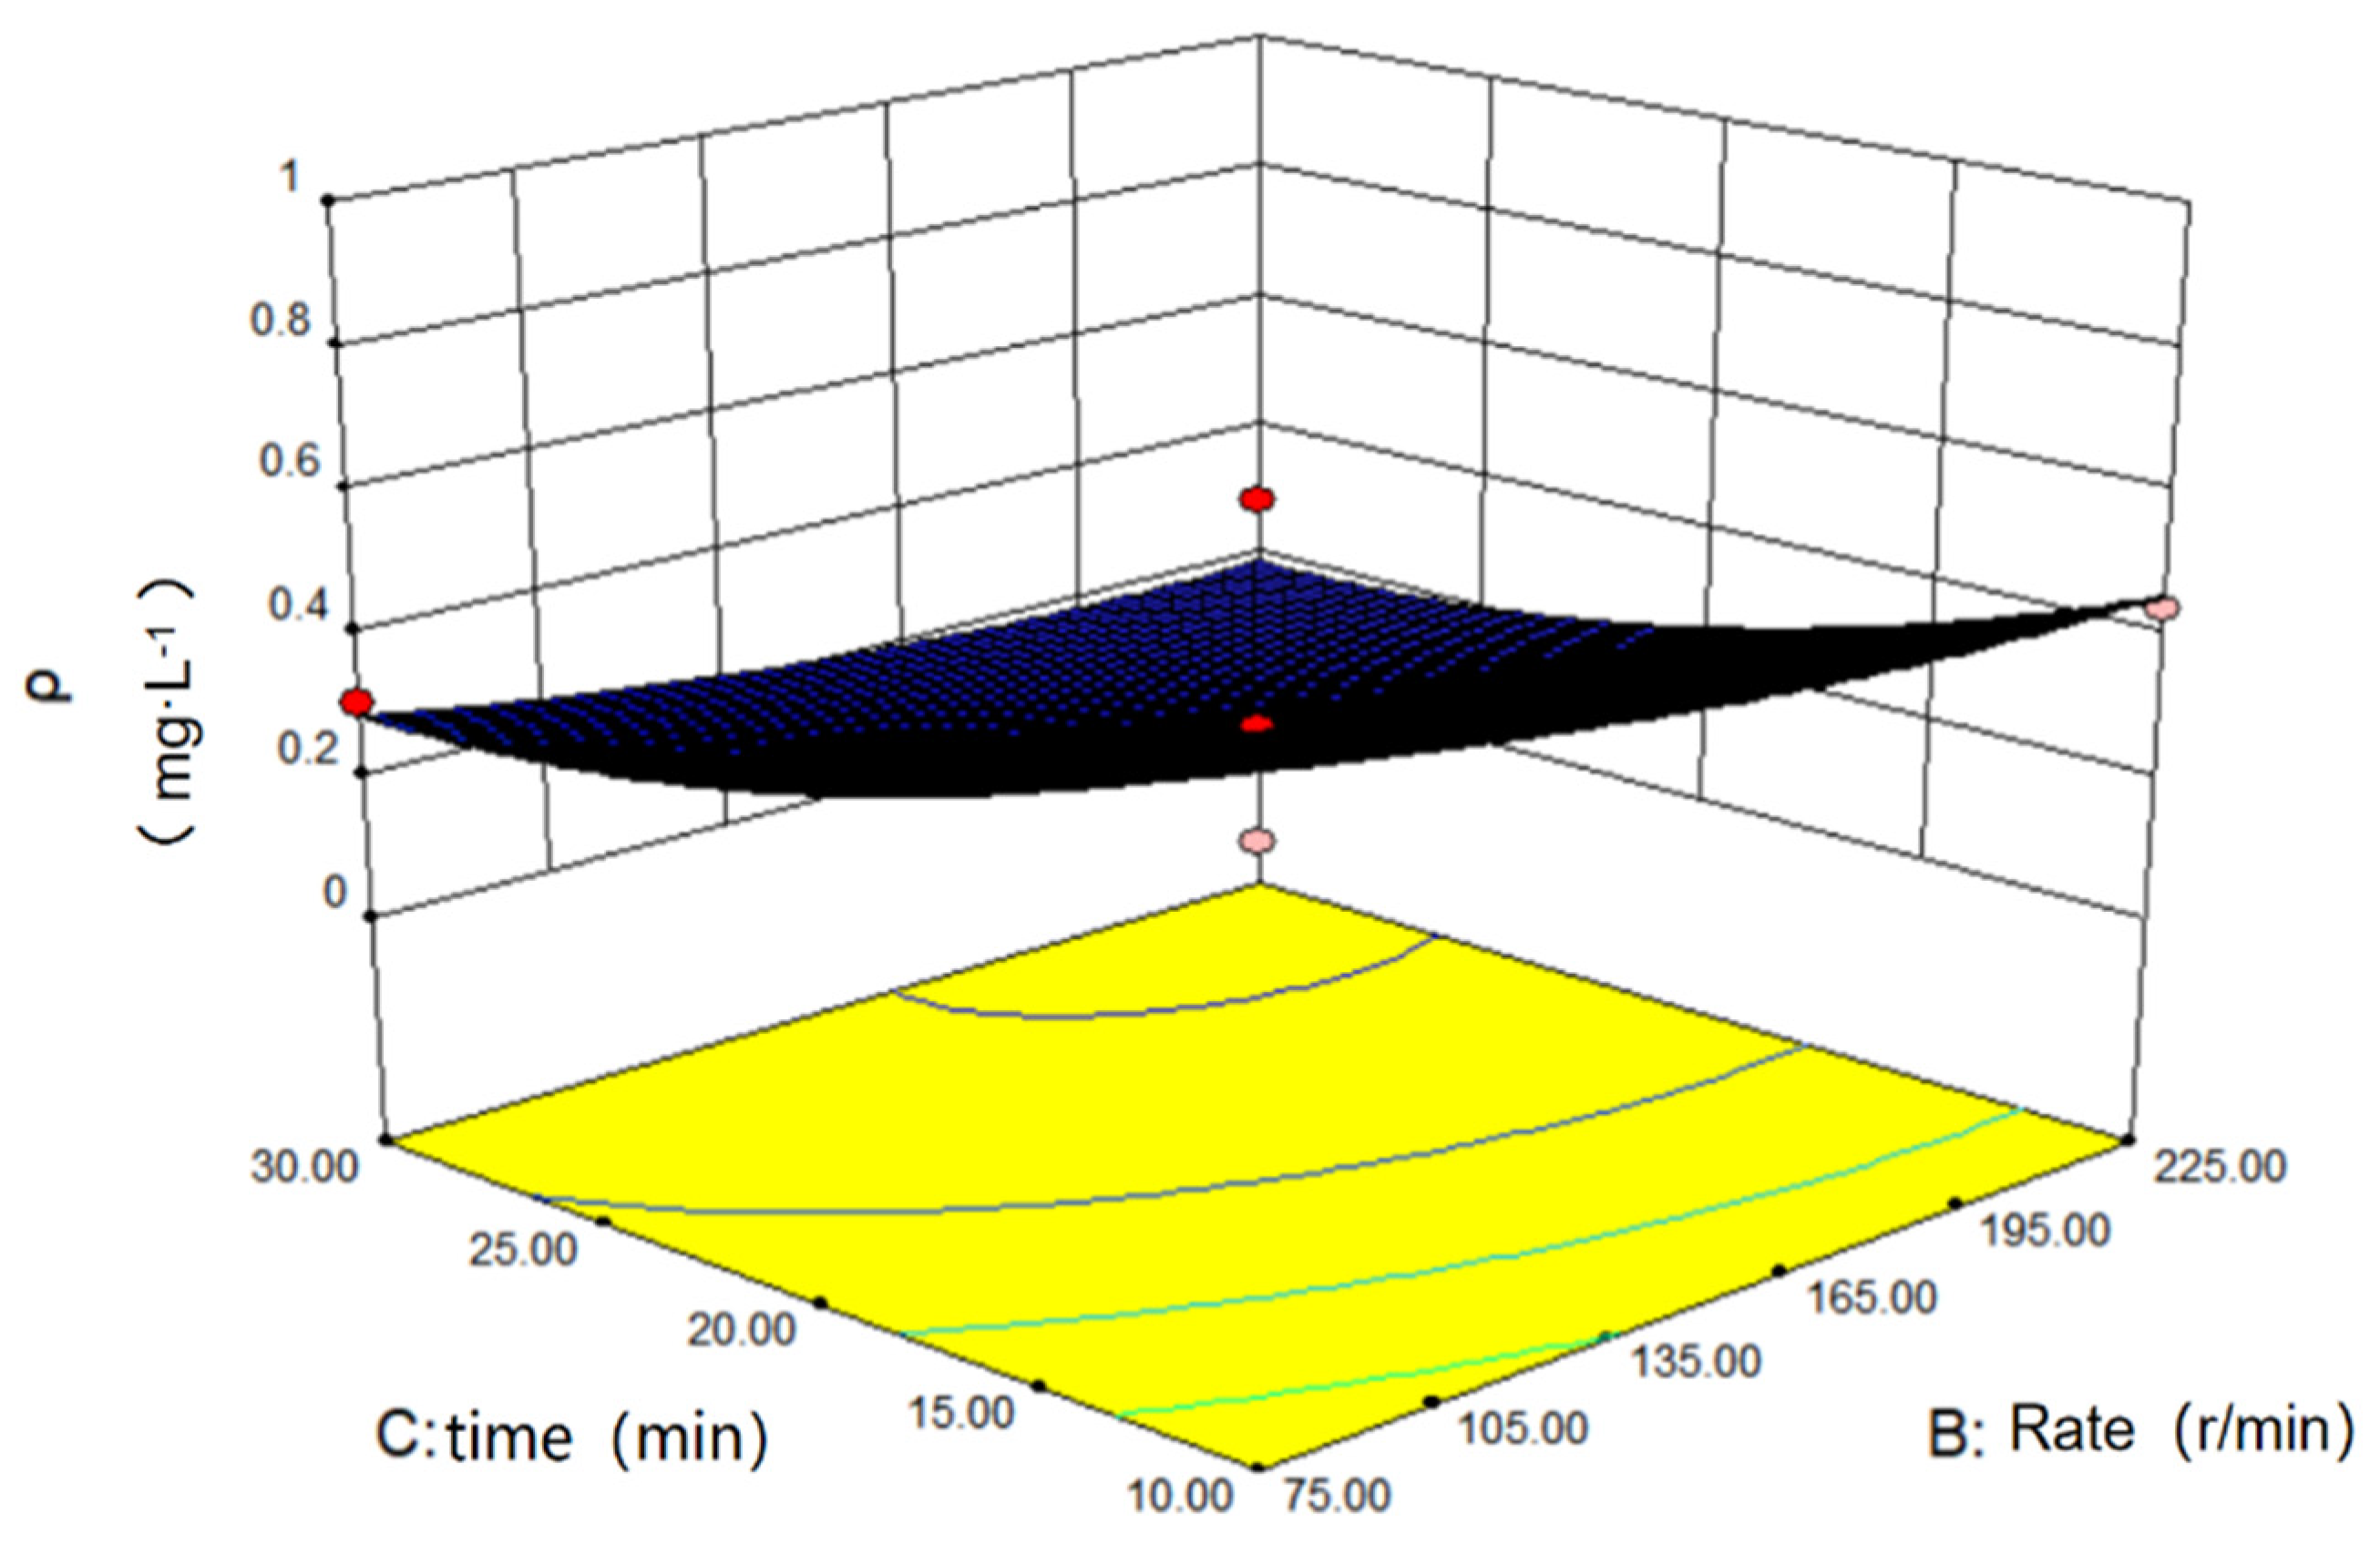
2.3.4. Response Surface Optimization Experiment of Adsorption

The adsorption process is subjected to many influencing factors, including the amount of adsorbent, initial concentration and pH value of the adsorbed solution, the oscillation adsorption time, as well as the oscillation speed and the temperature. The methylene blue solution concentration, pH value, and the amount of flotation kaolin adsorbent should be fixed first to compare and optimize the oscillating adsorption time, speed, and temperature. After the experiments, the optimal experimental conditions for these three factors are explored below.
For comparisons, different amounts of adsorbent (0.01 g, 0.03 g, 0.05 g, 0.08 g, and 0.1 g), concentrations of methylene blue solution (25 mg·L−1, 75 mg·L−1, 100 mg·L−1, 150 mg·L−1, and 200 mg·L−1), and pH values (9.5, 10.5, 11.5, 12, and 12.5) were assigned. The selection ranges of distinct oscillation times, temperatures, and speed were approximately from 10–30 min, from 30–50 °C, and from 75–225 r·min−1, respectively. To facilitate the comparison experiment, the temperature was fixed at 30 °C first, and the other factors were constant at the middle value of the planned comparison range. The following describes, in turn, the research on each influencing factor when other parameters are unchanged. In this paper, the adsorption process of coal gangue adsorbent and methylene blue was carried out in a water bath oscillator, and the concentration of methylene blue solution before and after adsorption was measured using an ultraviolet visible spectrophotometer.
(1)
Single Factor Experiment of Methylene Blue Solution Configuration Parameters and Optimal Amount of Adsorbent
(I).
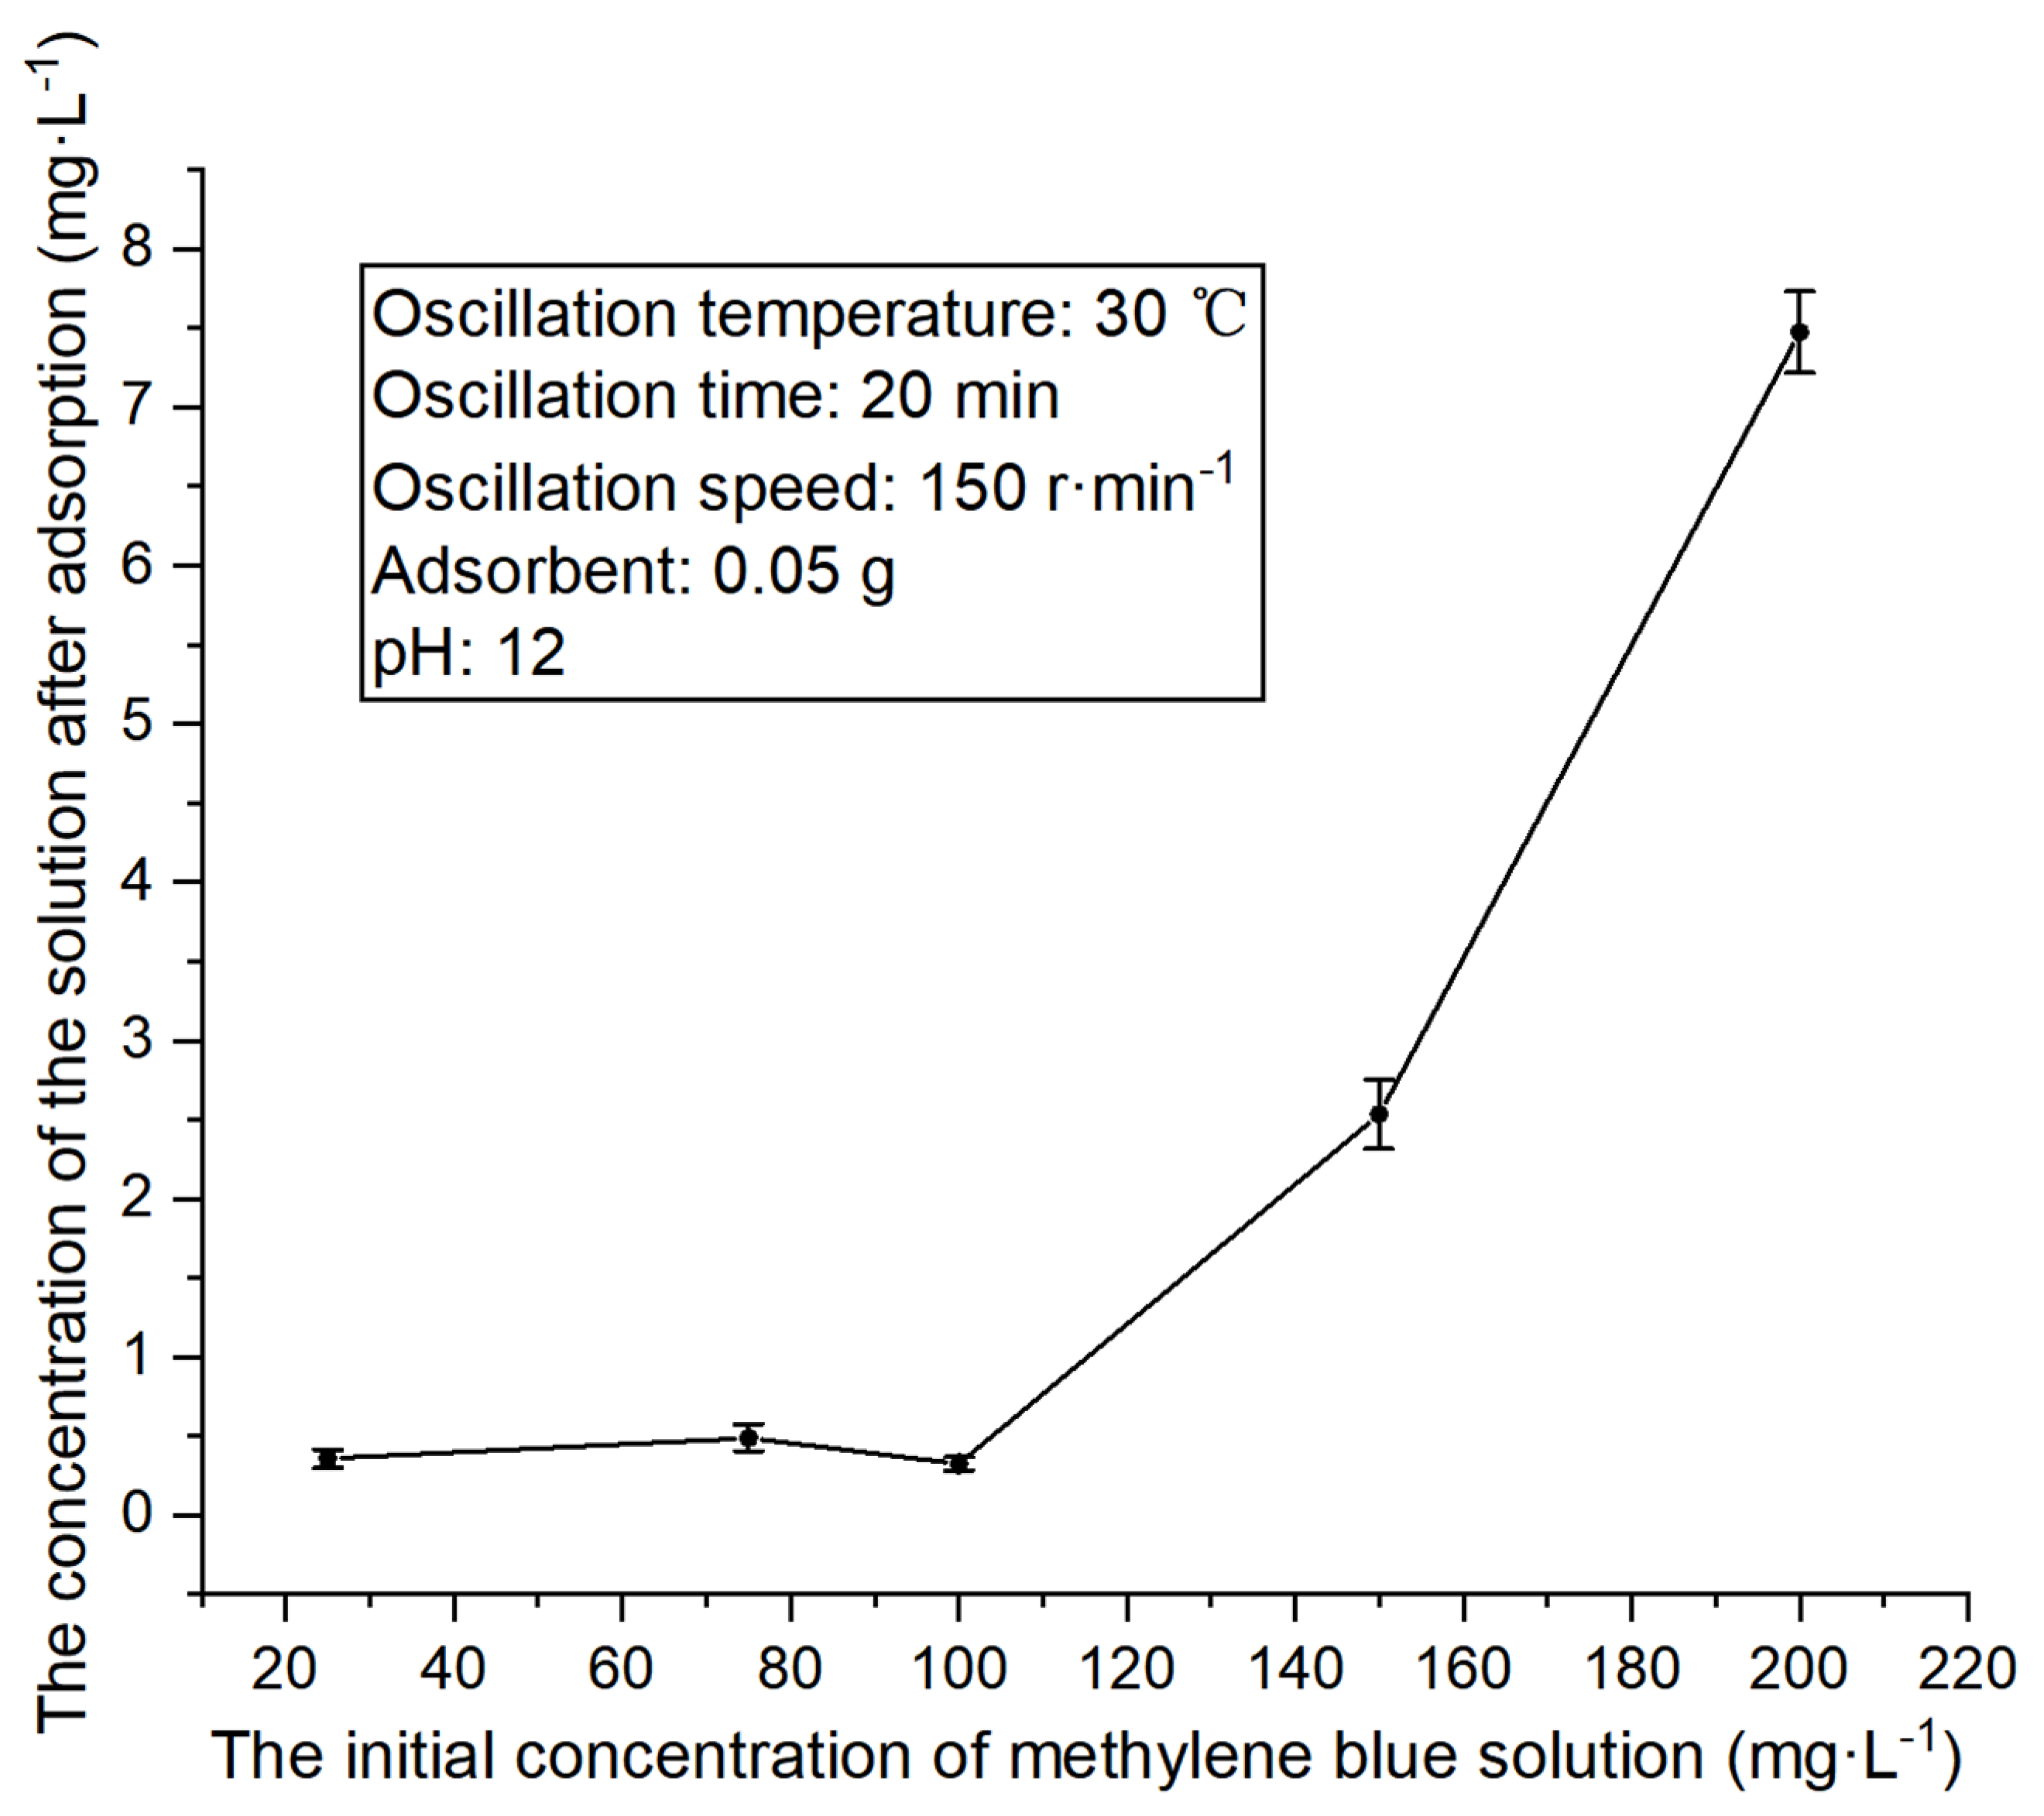
Influence of different initial concentrations of methylene blue solution on adsorption effect
First, other experimental conditions were maintained at constant values, that is, the temperature was close to the normal temperature (30 °C), and the other conditions were set to the middle values. Specifically, the oscillation time was 20 min, the oscillation speed was 150 r·min−1, the amount of adsorbent was 0.05 g, and the pH of methylene blue solution was 12. Under these conditions, the adsorption effects of methylene blue solutions with varying initial concentrations were compared, with the results demonstrated in Figure 5 below.
When the amount of adsorbent was fixed and the other experimental conditions were fixed, the concentration of methylene blue solution after adsorption rose as the initial concentration of methylene blue solution increased. When the initial concentration of solution was 100 mg·L−1 or below, the adsorption effect remained stable; in contrast, it increased substantially when the initial concentration continued to increase. Therefore, the initial concentration of 100 mg·L−1 was selected in the subsequent comparative experiment in this paper.
  •  
    (II).
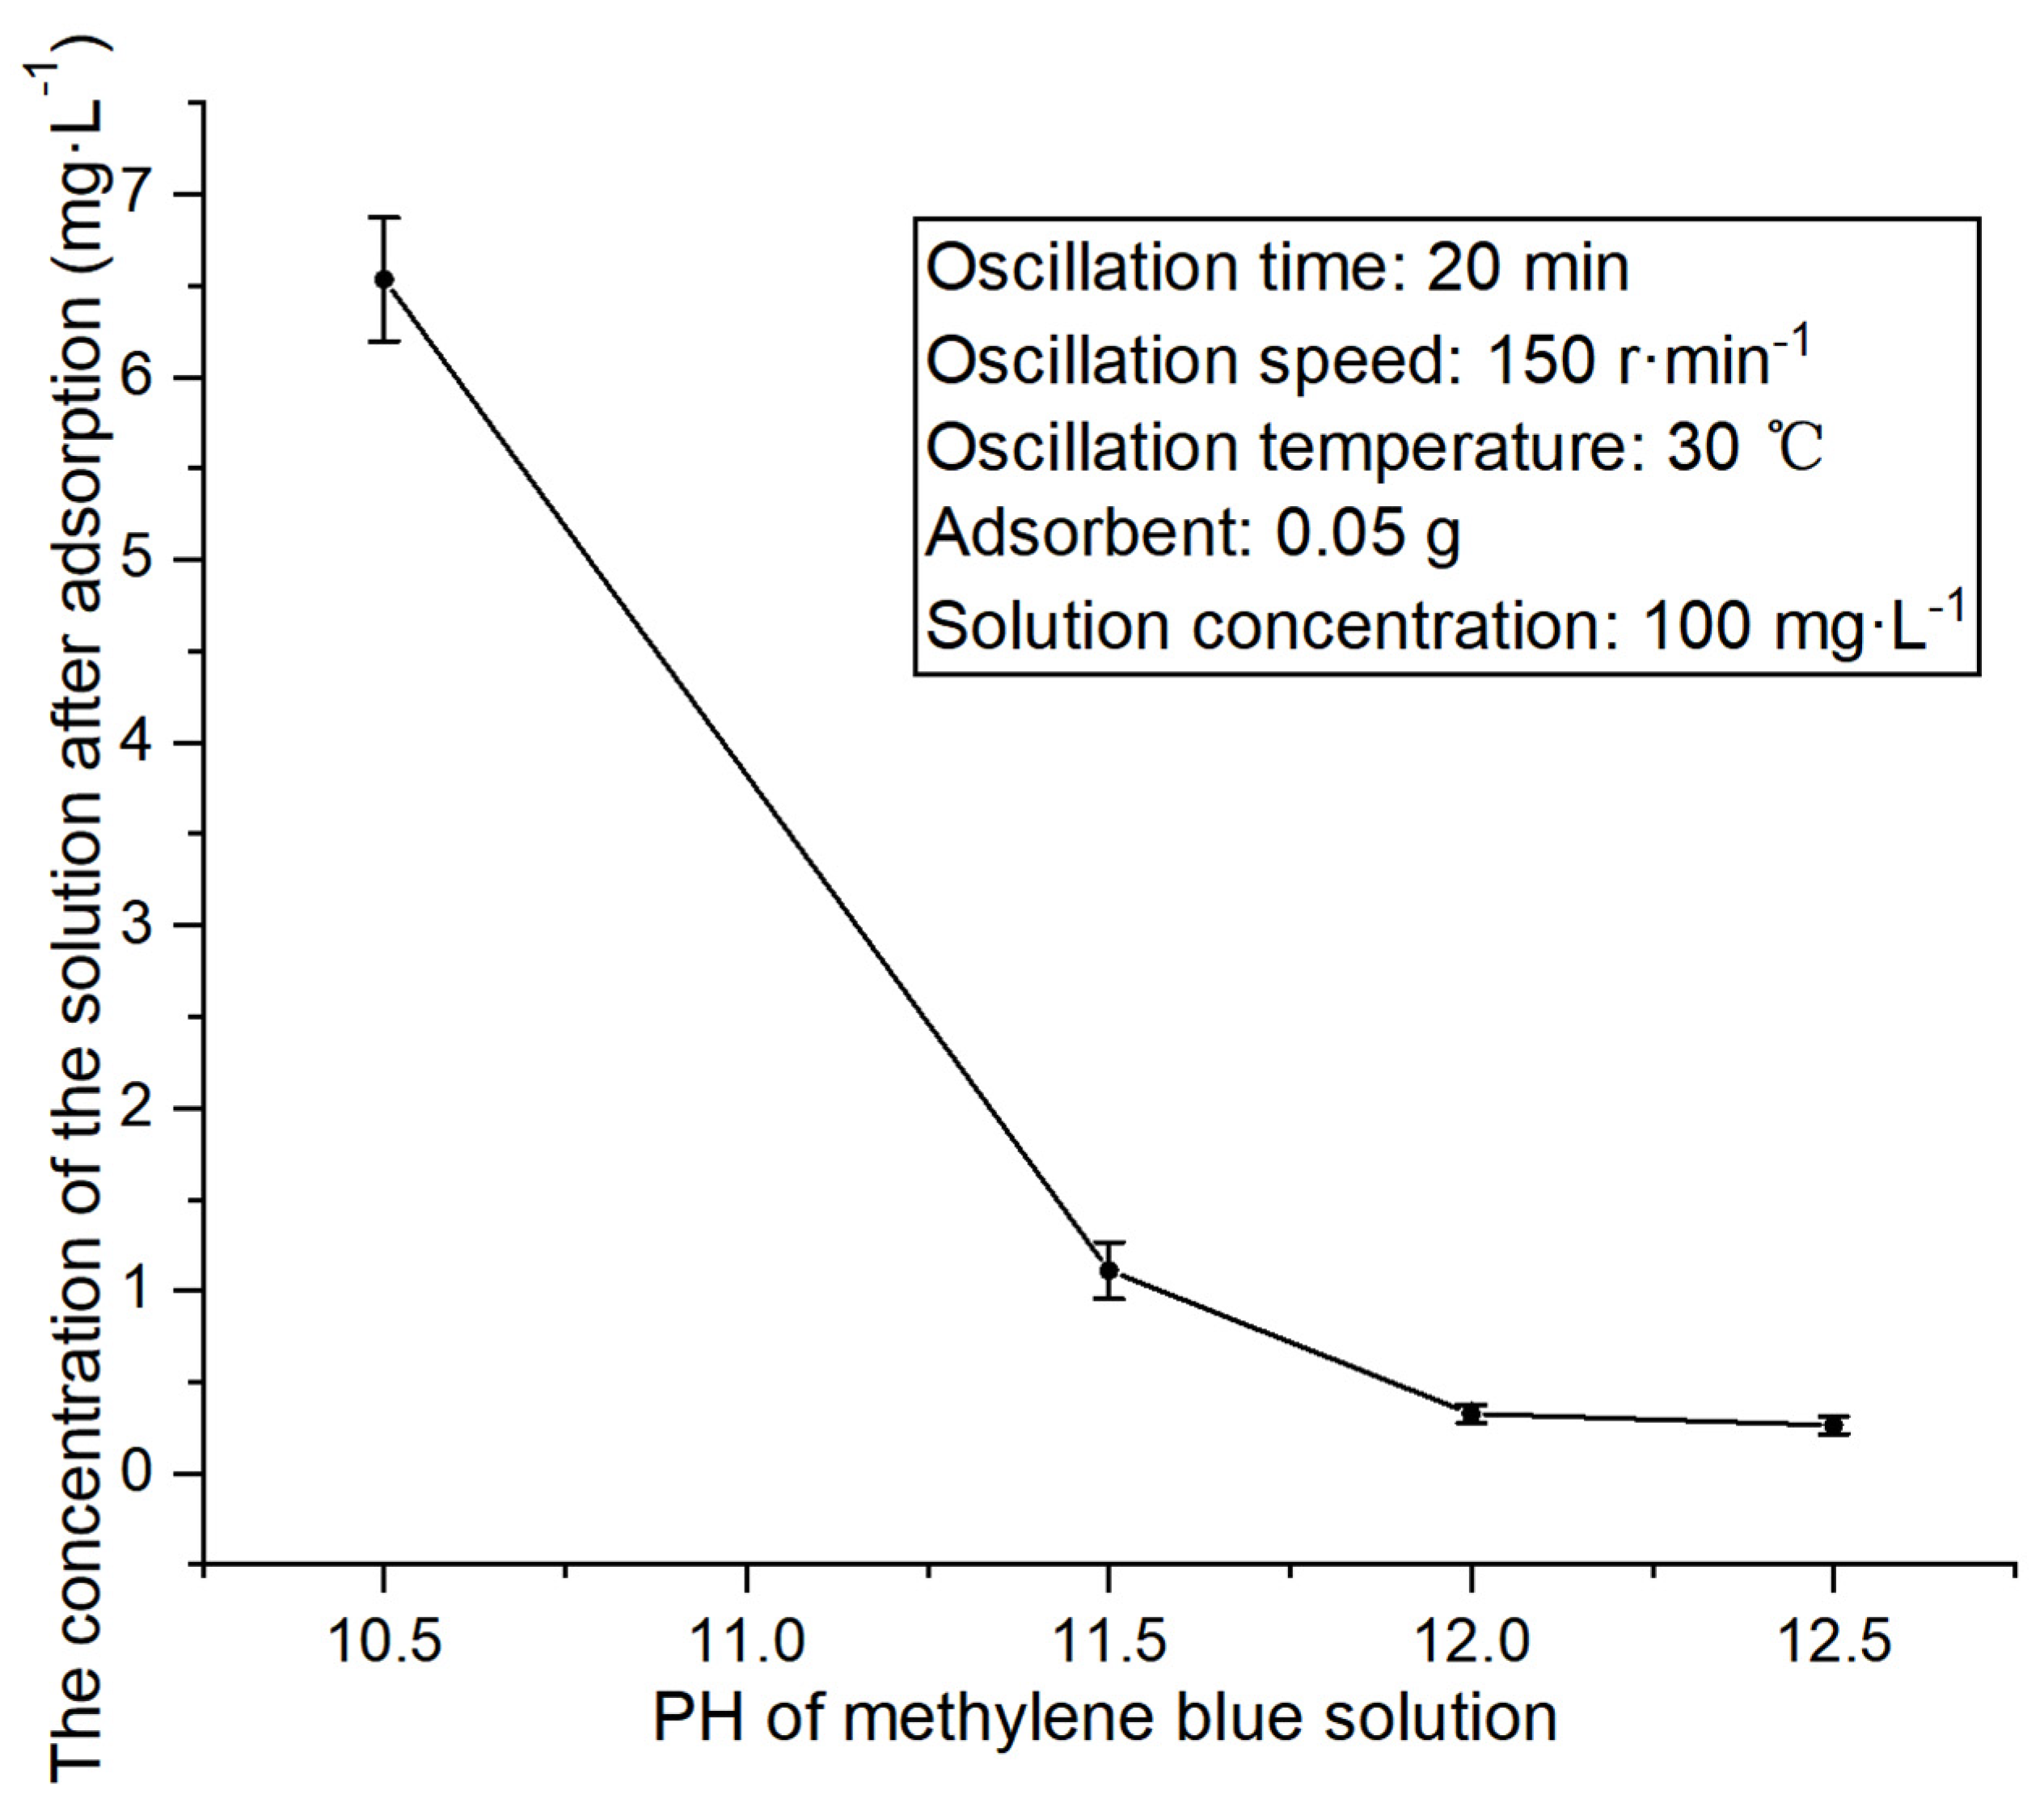
    Influence of different pH values of methylene blue solution on adsorption effect
Other experimental conditions were fixed with the same values as above to compare the adsorption effect of methylene blue solutions with different pH values. The experimental results are explicated in Figure 6 below.
The above figure signifies that with the increase in the initial pH value of the solution, the concentration of the solution after adsorption first exhibits a substantial decrease and then little change. This stems from the increase in pH, which enables a more negative charge in the kaolin structure, more electrostatic interaction with the methylene blue cation, and a higher adsorption capacity. Notably, a further increase in the pH value facilitates the fact that the negative charge in kaolin tends to be carried at a full load, so the adsorption amount fluctuates slightly. In addition, the experiment revealed that when the pH is above 12, every increase of 0.5 requires twice the amount of strong alkali solution, showing that a solution with a higher pH is not prepared. In this paper, the pH was determined as 12 after a comprehensive consideration of the adsorption effect, adsorption cost, and operation safety.
  •  
    (III).
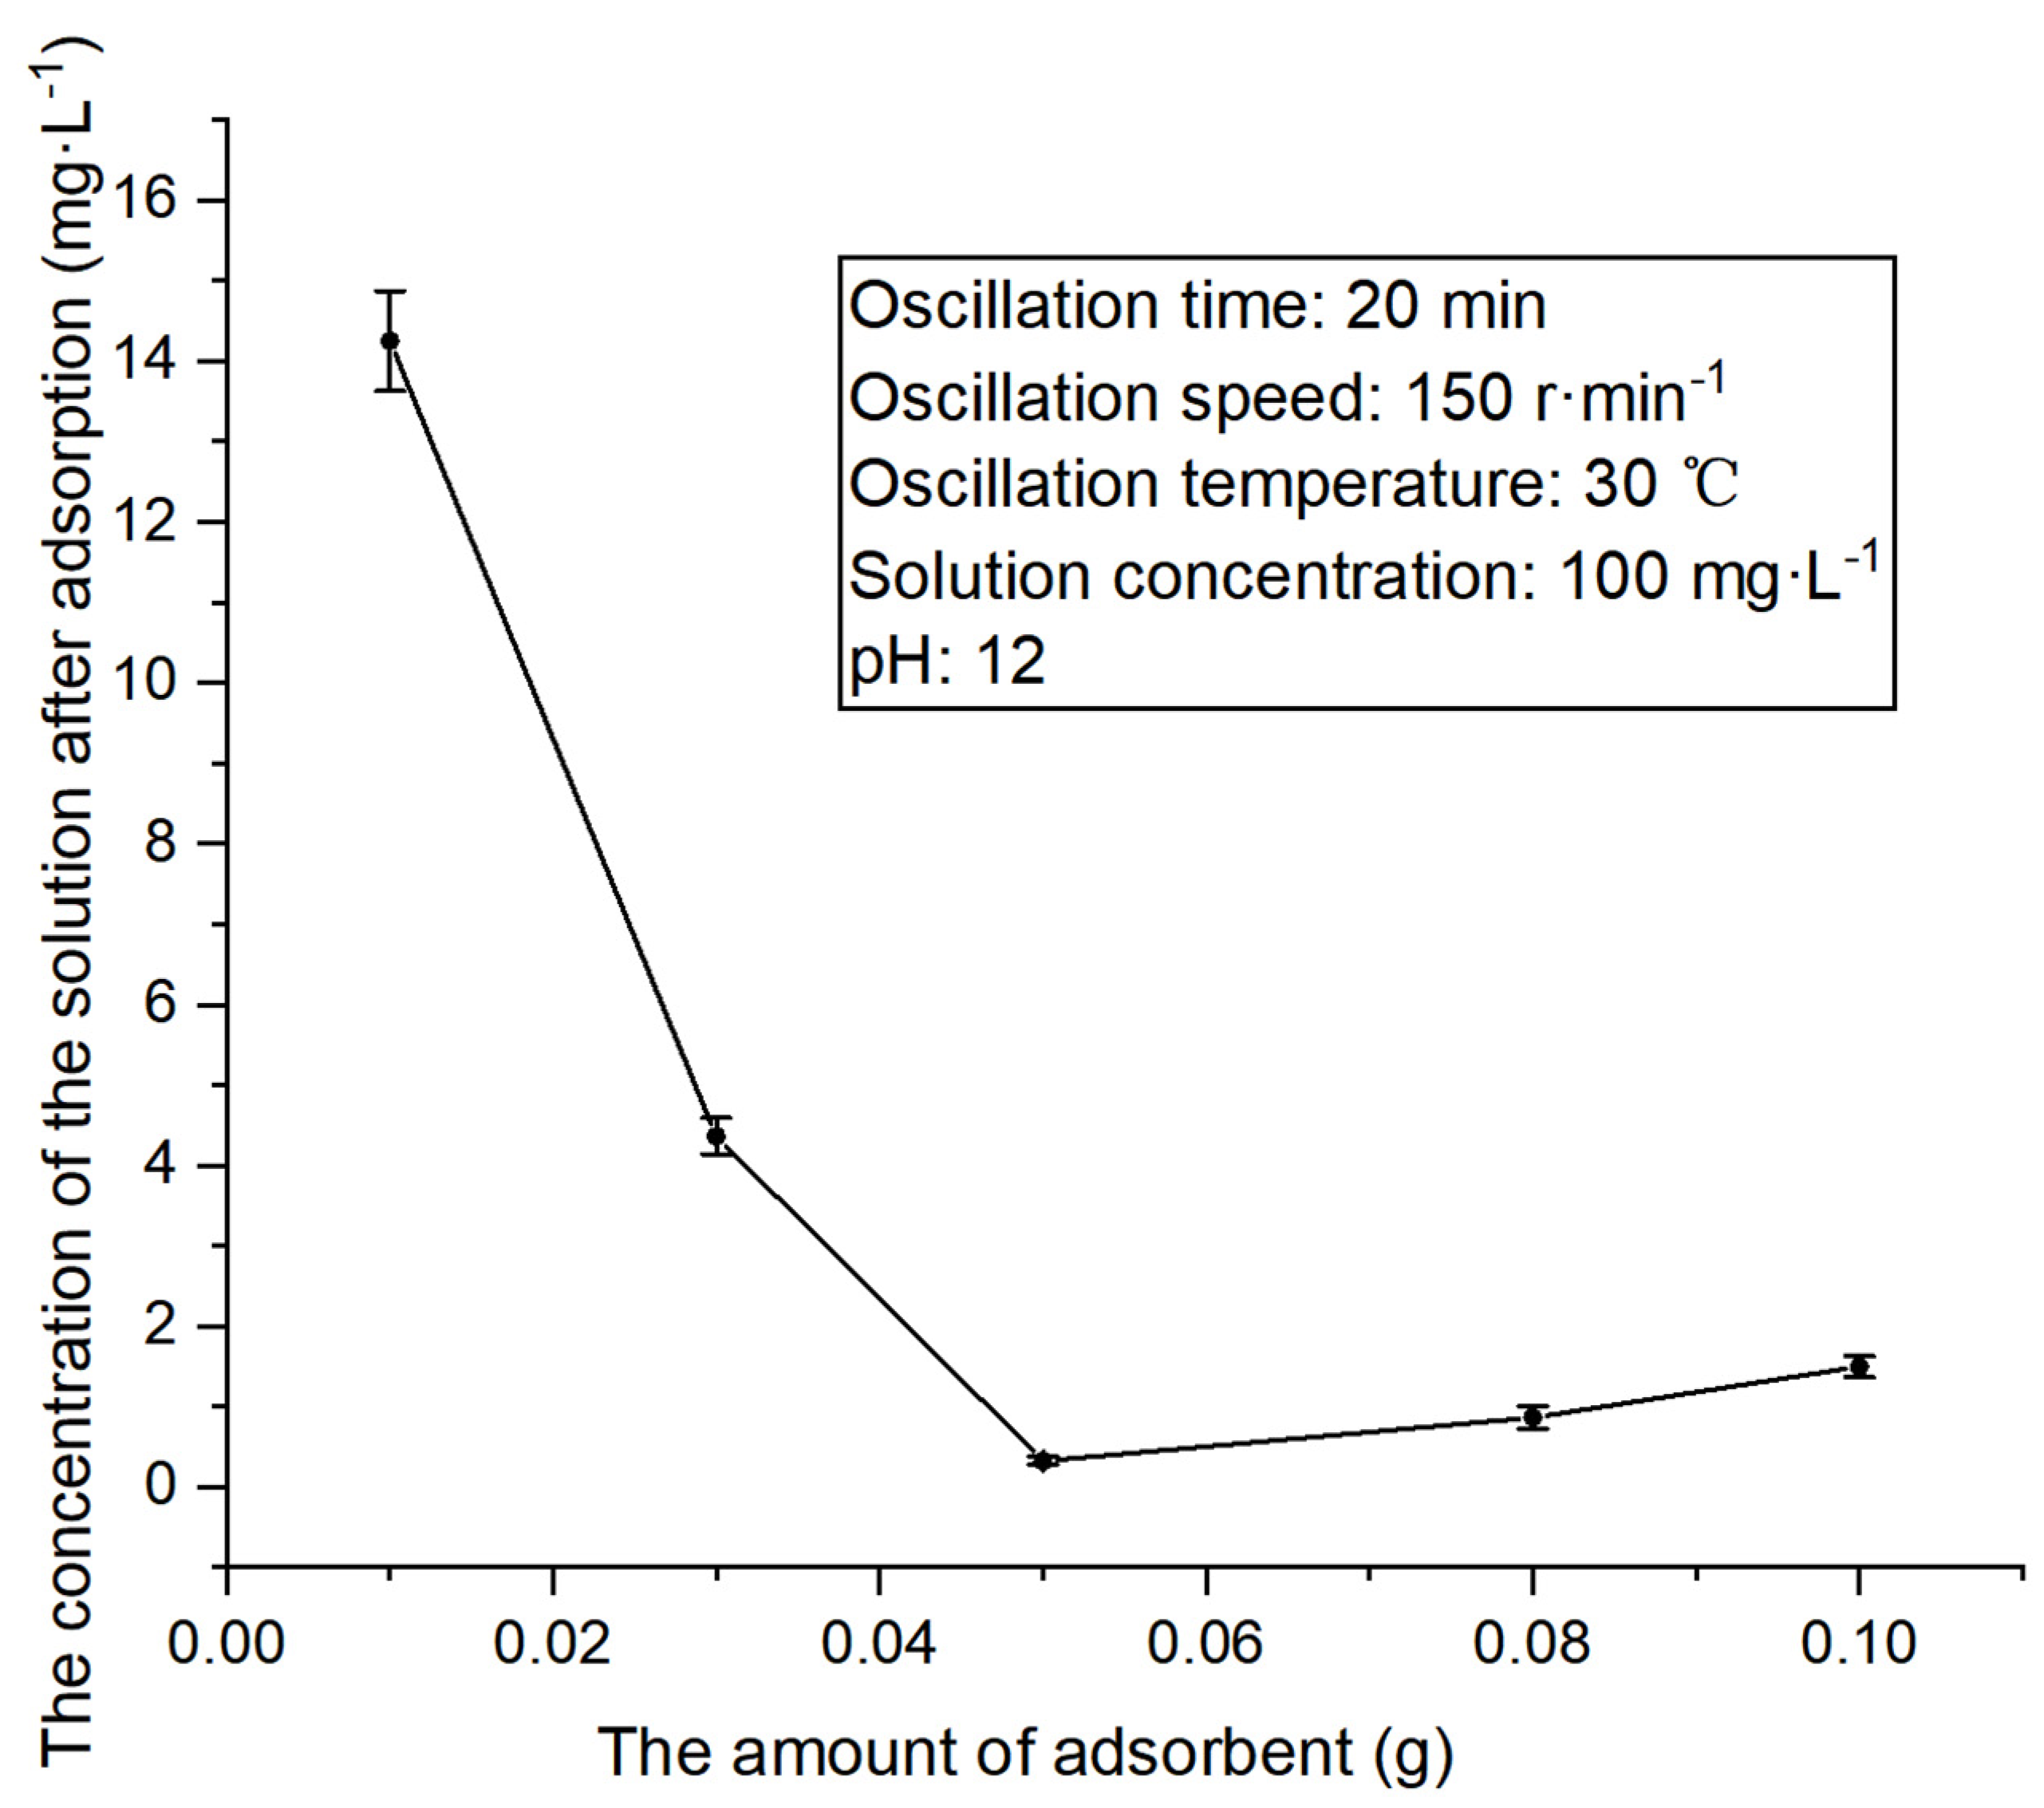
    Influence of varying amounts of adsorbents on adsorption effect
To compare the adsorption effect of different amounts of adsorbent, other experimental conditions were fixed with the same values as the above for the experiments. The results are specified in Figure 7 below.
The above figure reveals that the fixed concentration of methylene blue solution first decreases and then rises with the increase in the amount of adsorbent. A sharp decrease is initially observed before the amount of adsorbent reaches 0.05 g, where the solution concentration is the lowest. This may be attributed to the increase in the amount of adsorbent, which enhances the adsorption of methylene blue. Later, the solution concentration conversely shows an upward trend. This is because when the amount of adsorbent meets the adsorption point required for methylene blue at a certain concentration, excessive adsorbent increases the solution concentration. Similarly, the experiment unveils that with the increase in the amount of adsorbent, the solution concentration is increased, changing the color of methylene blue from blue to light black, which is the color of the adsorbent.
(2)
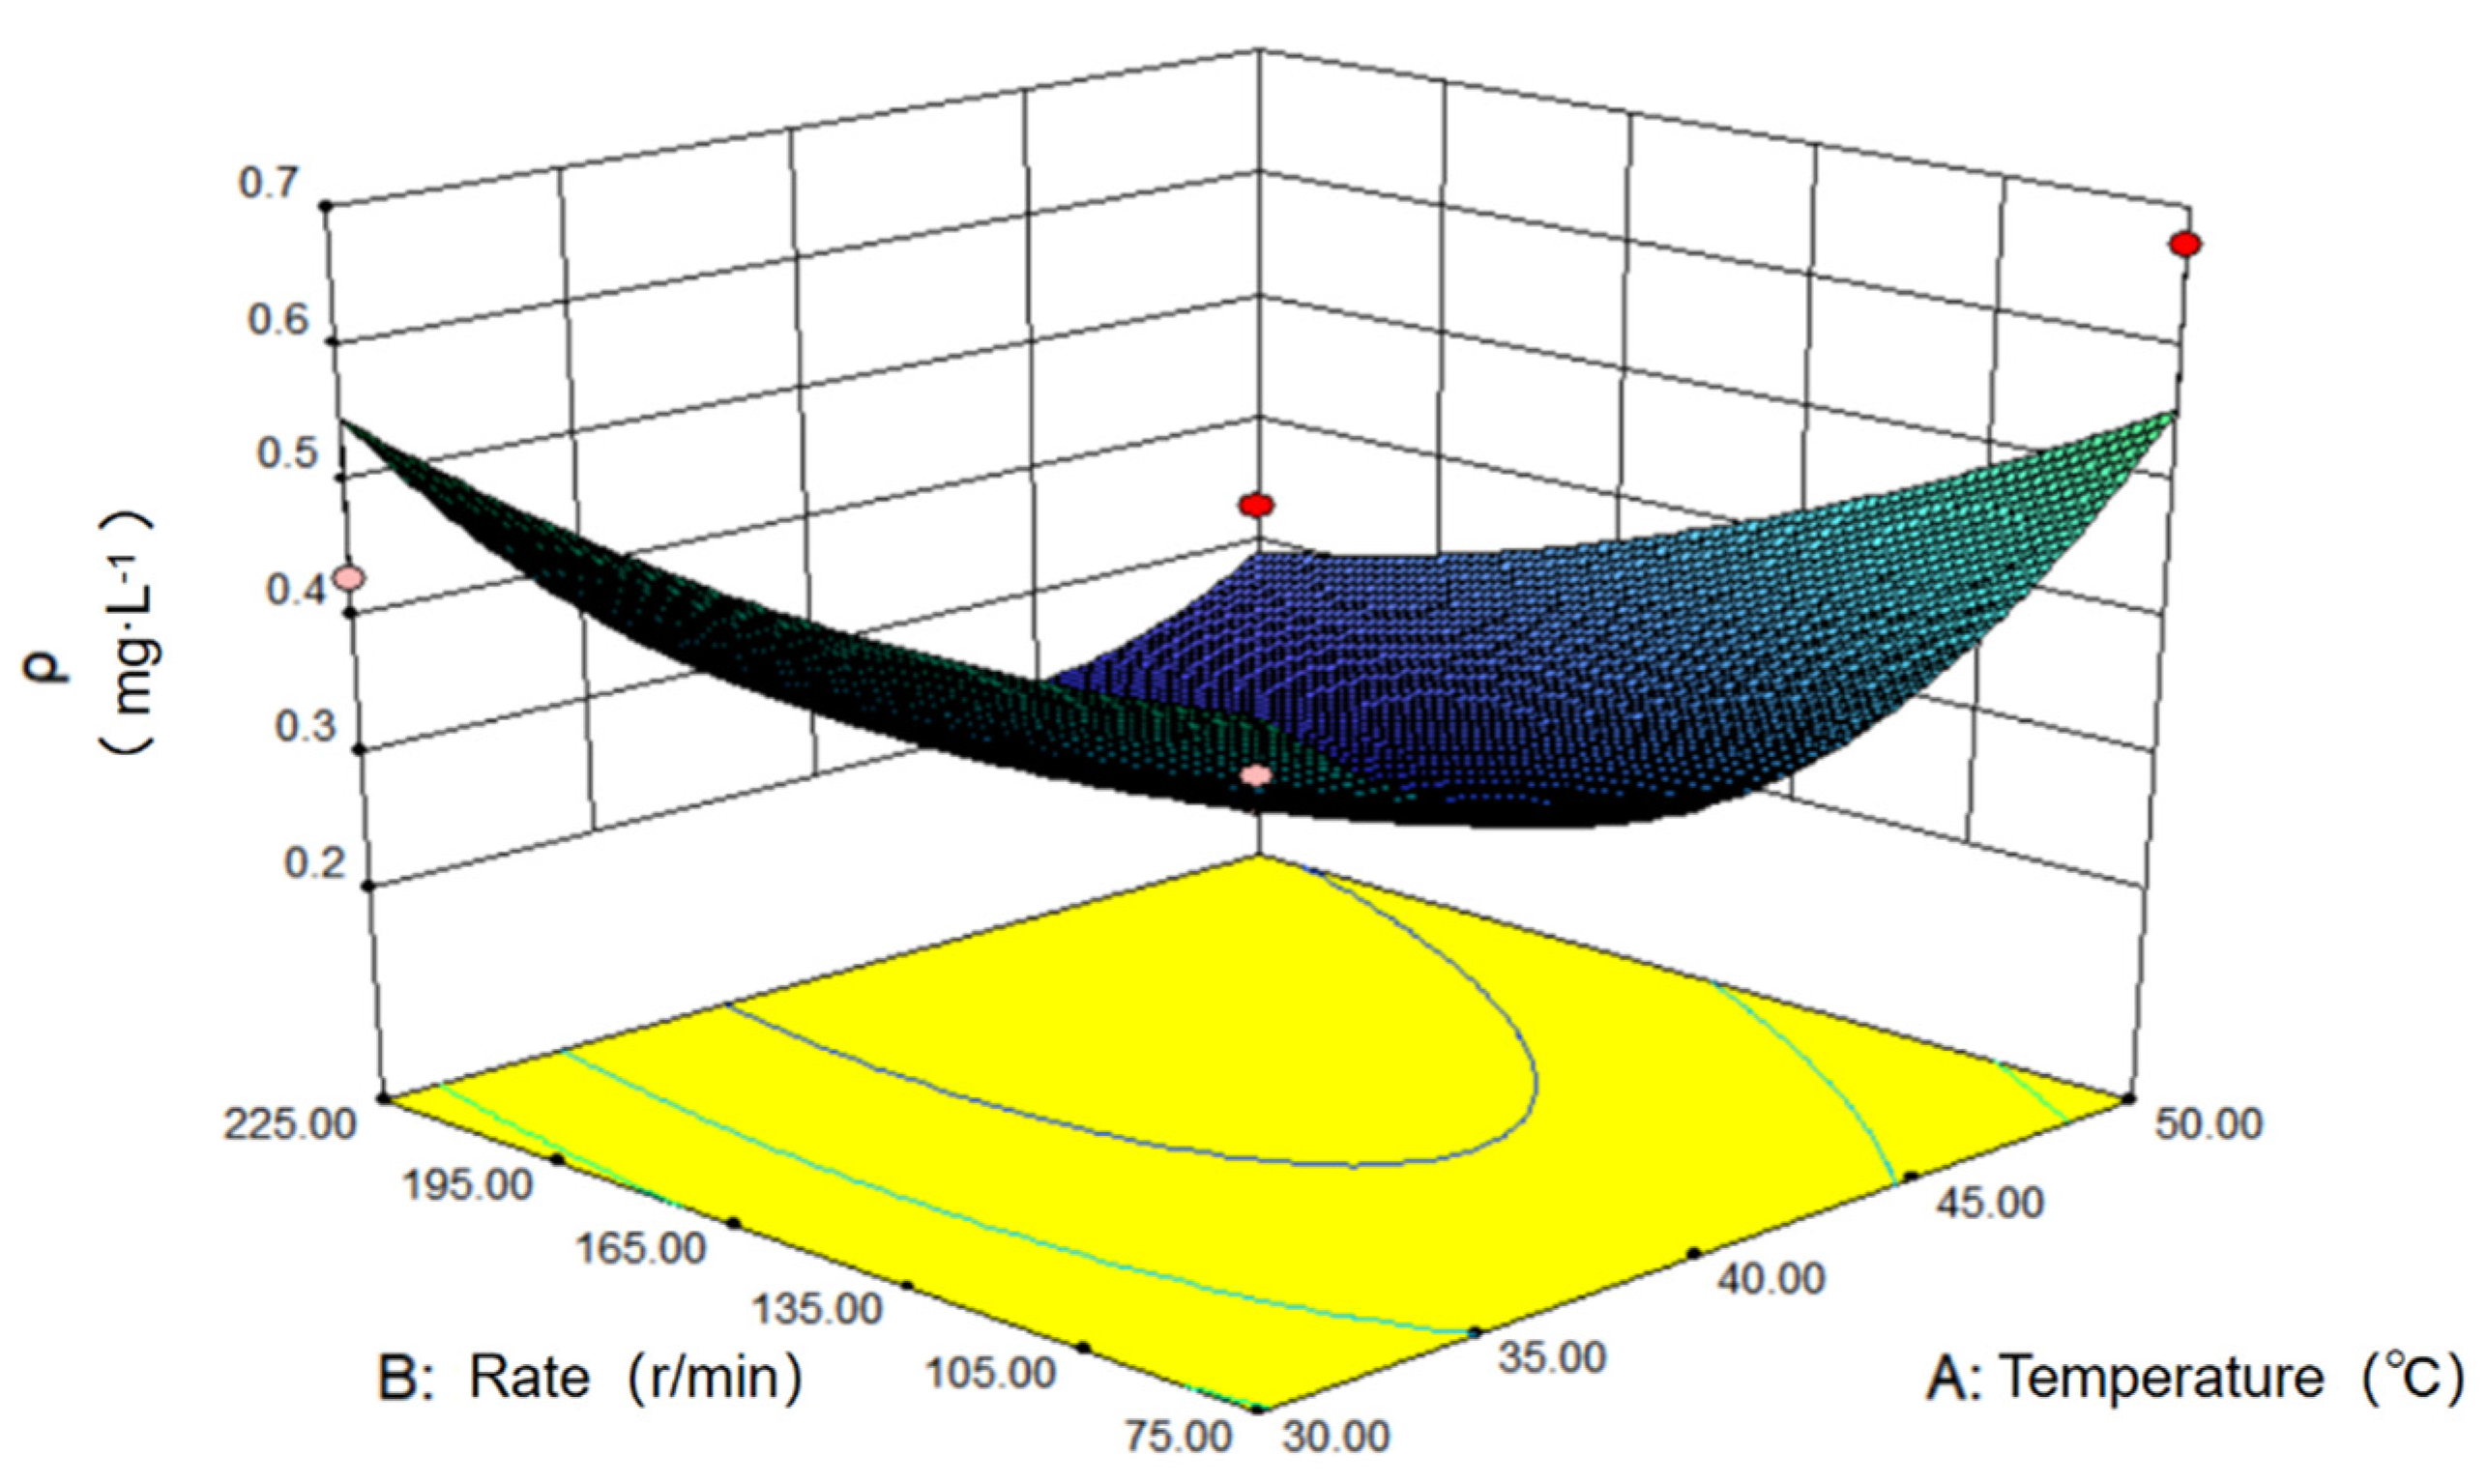
Response Surface Optimization Experiment of Oscillating Adsorption
The preliminary exploratory experiments indicate that the adsorption rate approaches the maximum value at an adsorption time of about 20 min, a temperature of around 40 °C, and a velocity of 150 r·min−1. Herein, a response surface experiment was designed to further explore the optimal adsorption conditions, evaluate the primary and secondary orders of influencing factors, and obtain the regression equation between the influencing factors and the target value. The experimental factors, parameter values, and experimental results are summarized in Table 4.
A regression analysis was performed on the results in the above table, and the results are shown in Table 5.
As indicated and based on the principle of significance [14], only C can be deemed as a significant influencing factor. According to the F value, the primary variable factors with the largest effect to the smallest effect can be ranked as follows: oscillation time, speed, and temperature. Therefore, these data reflect that the concentration response value is regressively fitted with three variable factors, with the following regression equation:
ρ = 4.34875 − 0.0908t + 0.0011625Tt + 0.000007vt + 0.0007325t2
To analyze the difference between the calculated values obtained with the model and the true values, the normal plot of residuals and correlation curve between the calculated value and the true value are plotted. The two figures are shown below.
As can be seen in Figure 8, the normal probability distribution of the residual is close to the straight line. As can be seen in Figure 9, the colored points are very close to the line, and the value calculated by the model is very close to the real value. Therefore, the model has good adaptability.
The interaction between the influencing factors and solution concentration can be visually illustrated through a 3D diagram, as demonstrated in Figure 10, which is the response surface diagram of the oscillating speed and temperature to the concentration of the solution after adsorption. Generally, when the speed is greater than the intermediate value and the temperature has a higher intermediate value, the concentration of methylene blue solution after adsorption is lower. The lowest point of the surface corresponds to the optimal matching condition of the speed and temperature.
Figure 11 below serves as the response surface diagram of the oscillation time and temperature to the concentration of the solution after adsorption. As it shows, the surface exhibits the lowest point, and the concentration is low when the time and temperature are near the intermediate values, suggesting the existence of the optimal matching condition for time and temperature.
Figure 12 below displays the response surface diagram of the oscillation time and speed to the concentration of the solution after adsorption. In general, when the time and speed are greater than their intermediate values, a low concentration is observed, and the surface experiences a gentle fluctuation.
The above analysis results indicate that while ensuring the lowest temperature and speed are as far as possible (i.e., the lowest energy consumption), the calculated experimental conditions for the lowest concentration of the solution after adsorption are as follows: 38.05 °C, 160 r·min−1, and 31.02 min. Under these optimal conditions, the adsorption quantity reaches 39.92 mg·g−1.

3. Adsorption Study

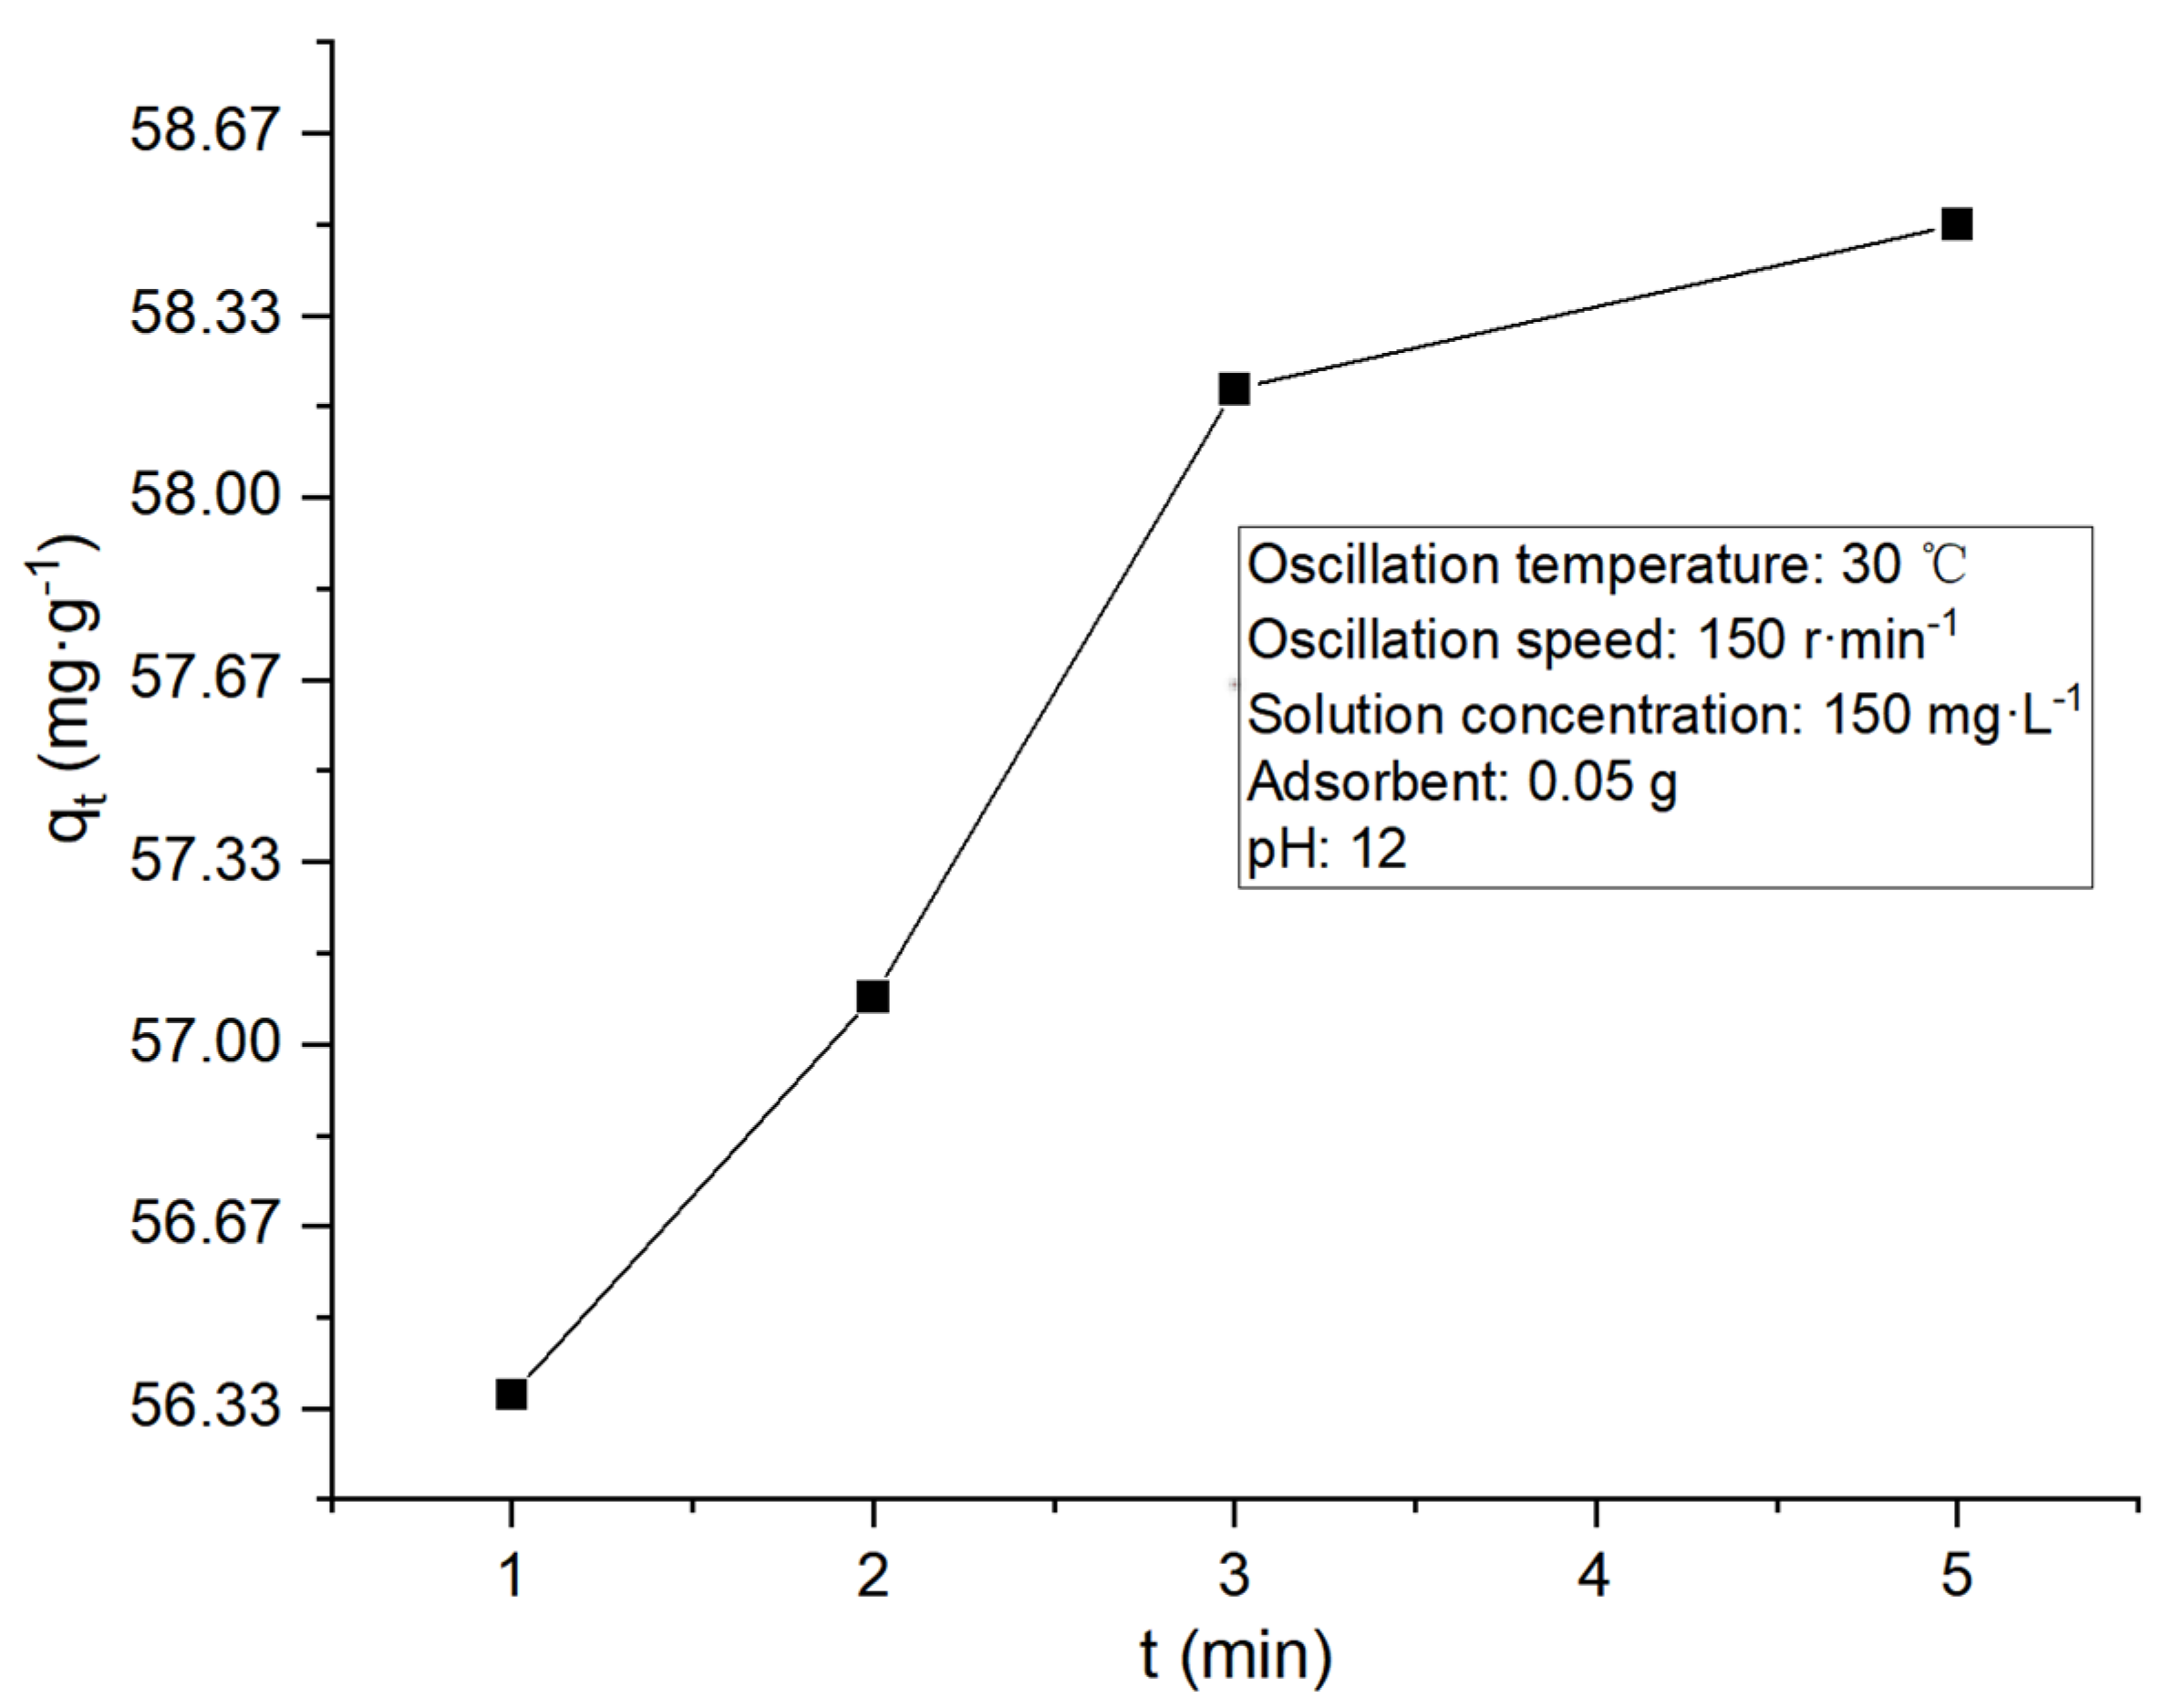
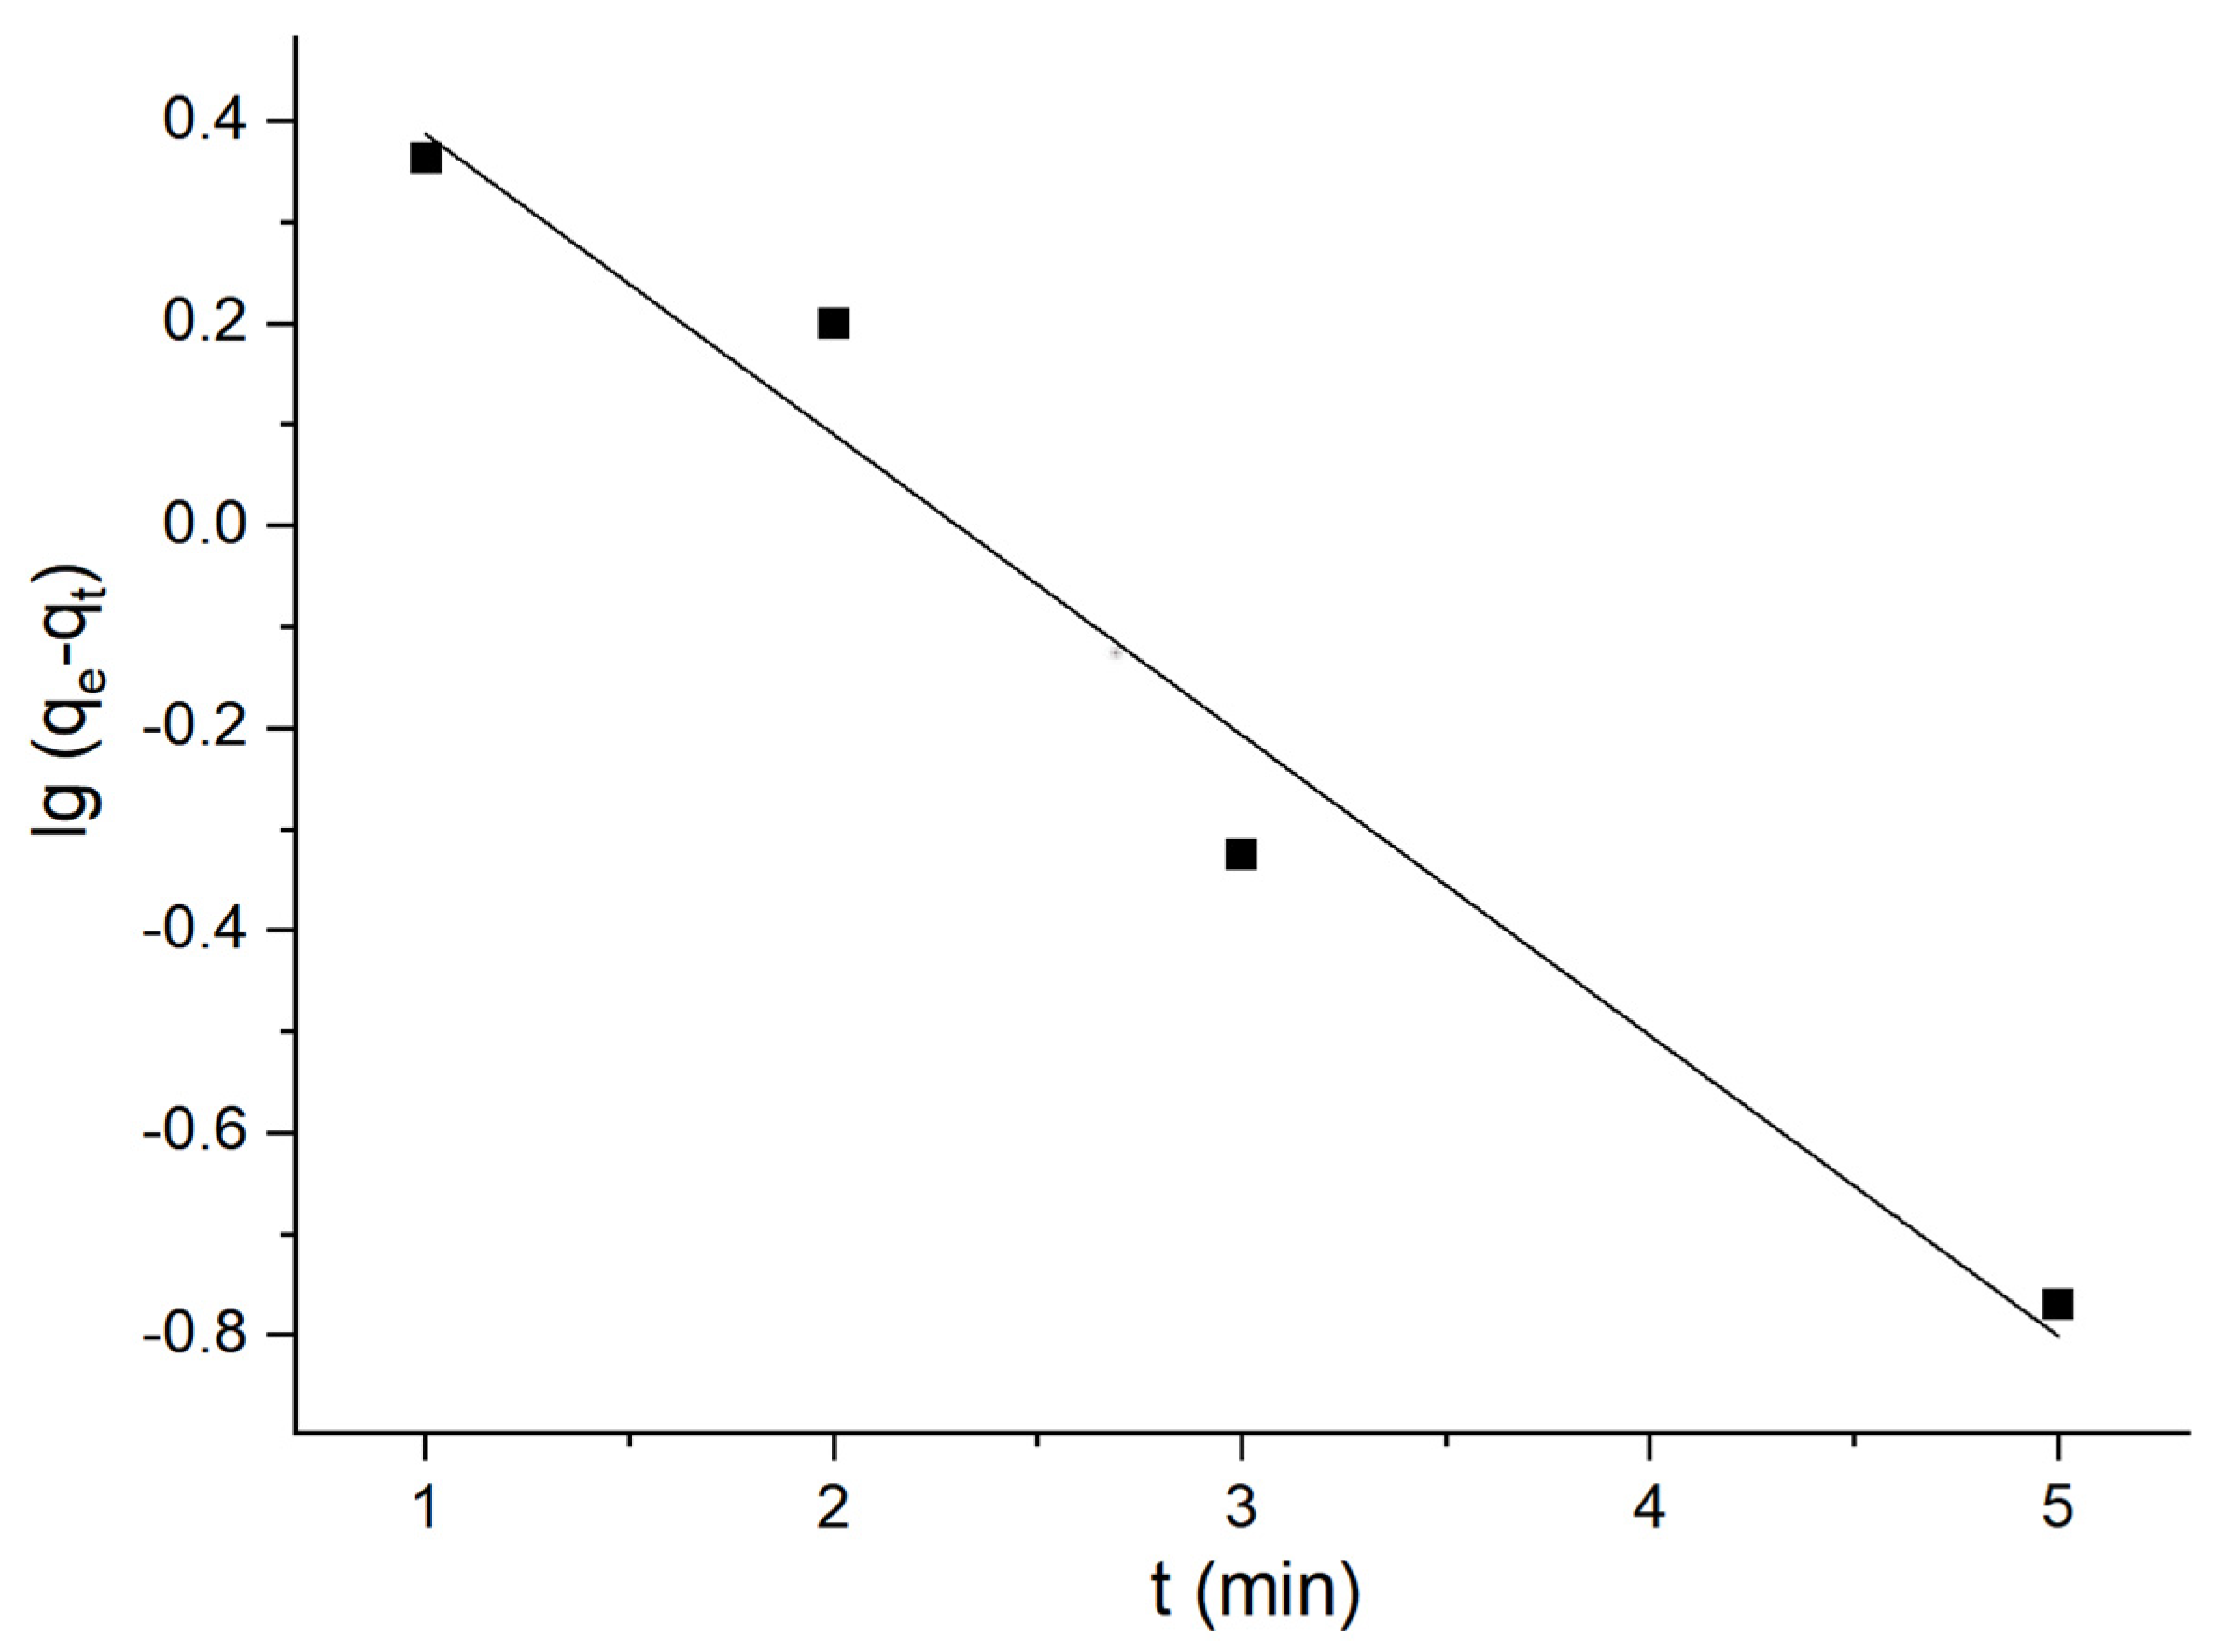
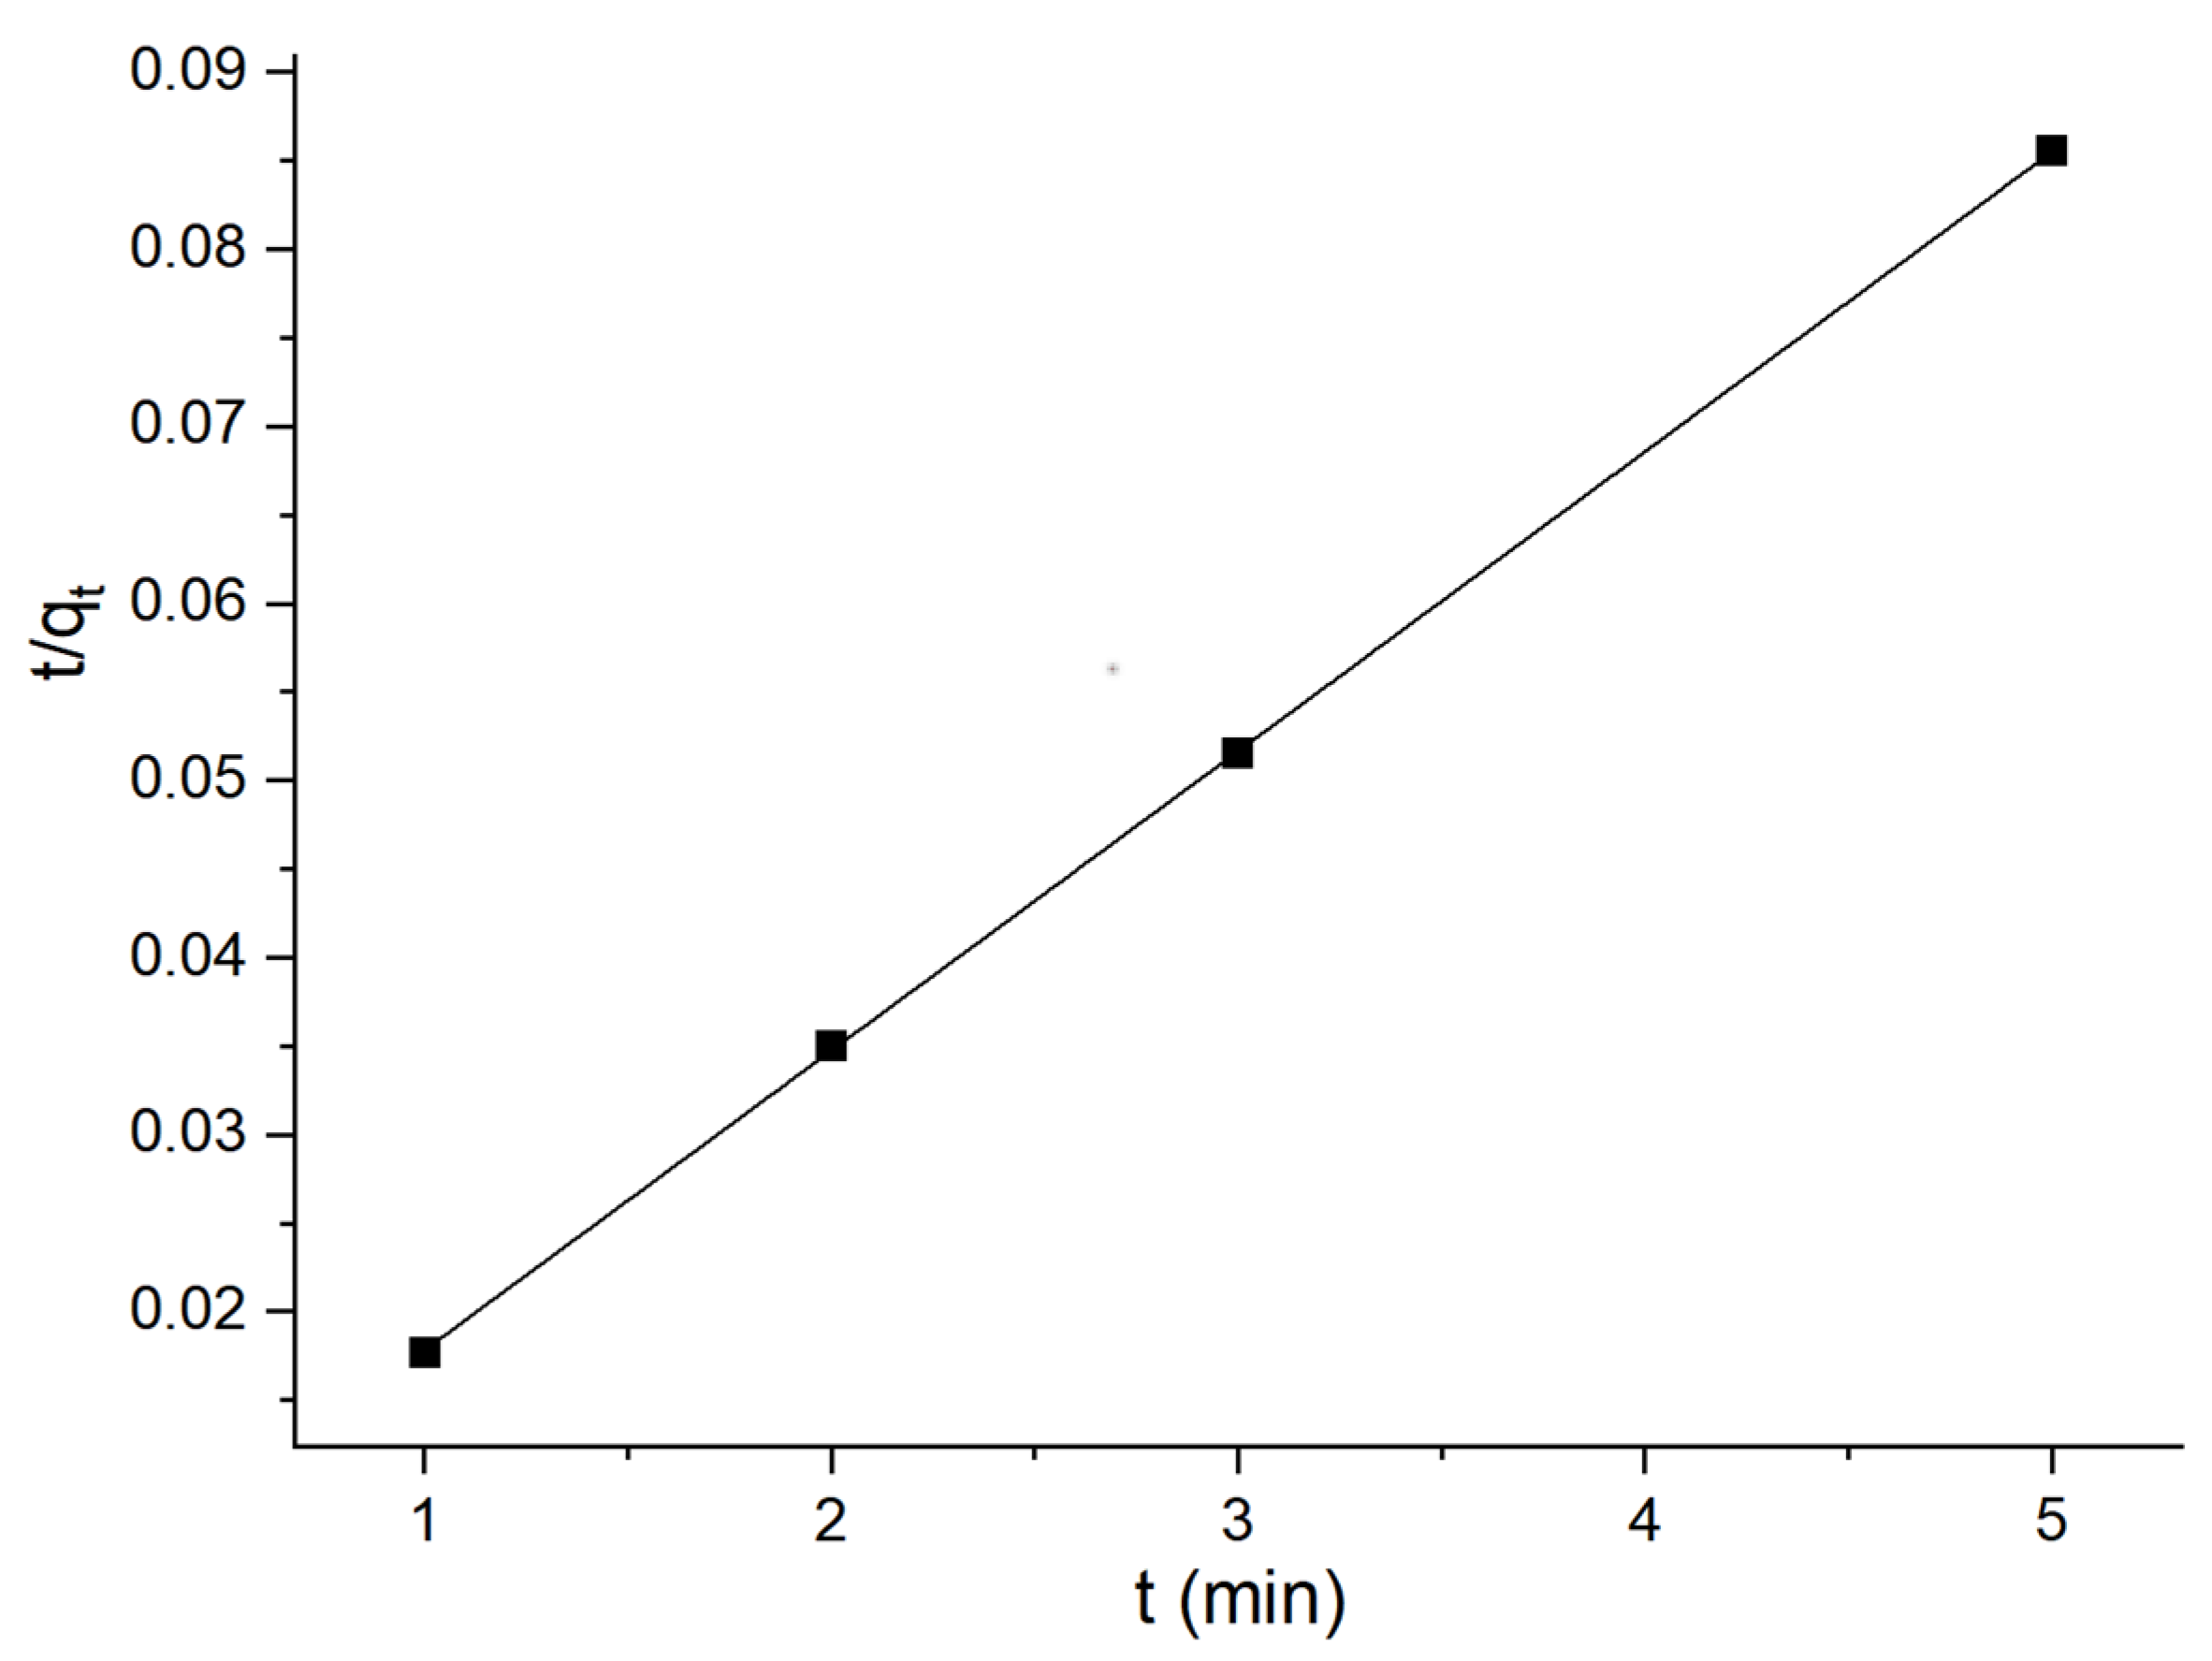
3.1. Adsorption Kinetics Study

To judge the order of kinetic reaction, the curve of adsorption quantity changing with the adsorption time was plotted, as shown in Figure 13 below.
The quasi-first-order kinetic Equation (1) and quasi-second-order kinetic Equation (2) were used to fit and analyze the experimental data in the figure above [16,17,18].
lg ( q e q t ) = lg q e k 1 × t / 2.303
t / q t = 1 / ( k 2 × q e 2 ) + t / q e
where k1 and k2 are the quasi-first-order and quasi-second-order kinetic rate constants, respectively; qe is the equilibrium adsorption quantity (mg·g−1); t is the time (min); and qt is the instantaneous adsorption quantity (mg·g−1).
Consequently, the quasi-first-order and quasi-second-order adsorption kinetic models of flotation kaolin adsorbent could be acquired based on the above calculation, as illustrated in Figure 14 and Figure 15.
According to Figure 14 above, the line fit R2 of the figure is 0.948. According to Figure 15 above, the line fitting degree R2 of the figure is 0.999. It is obvious that the adsorption process belongs to a quasi-second-order kinetic model.

3.2. Adsorption Thermodynamics Study

In order to judge the adsorption type of methylene blue solution by flotation kaolin, the adsorption capacity of the adsorbent at different temperatures is first listed. as shown in Table 6 below.
According to the data in the above table, and according to the calculation formula below, the thermodynamic parameters of the adsorption process can be calculated.
ln K c =   Δ H 0 R T + Δ S 0 R
Δ G 0 = - R T ln K c
K c = q e C e
In the above formula, ΔH0, ΔG0, and ΔS0 represent the enthalpy change, free energy change, and entropy change, respectively; T refers to the absolute temperature (K); qe is the equilibrium adsorption quantity (mg·g−1); R stands for the ideal gas constant (8.314 J·K−1·mol−1); Kc signifies the equilibrium constant; and Ce is the solution equilibrium concentration (mg·L−1). Thermodynamic parameters are calculated as shown in Table 7.
As displayed in Table 7 above, ΔG0 < 0, and the adsorption process is spontaneous. In addition, ΔG0 is −20~0 KJ·mol−1, so the adsorption of methylene blue solution by flotation kaolin shows a physical property; ΔH0 > 0, indicating that the adsorption process is endothermic, and ΔS0 > 0, suggesting that the confusion increases during adsorption.

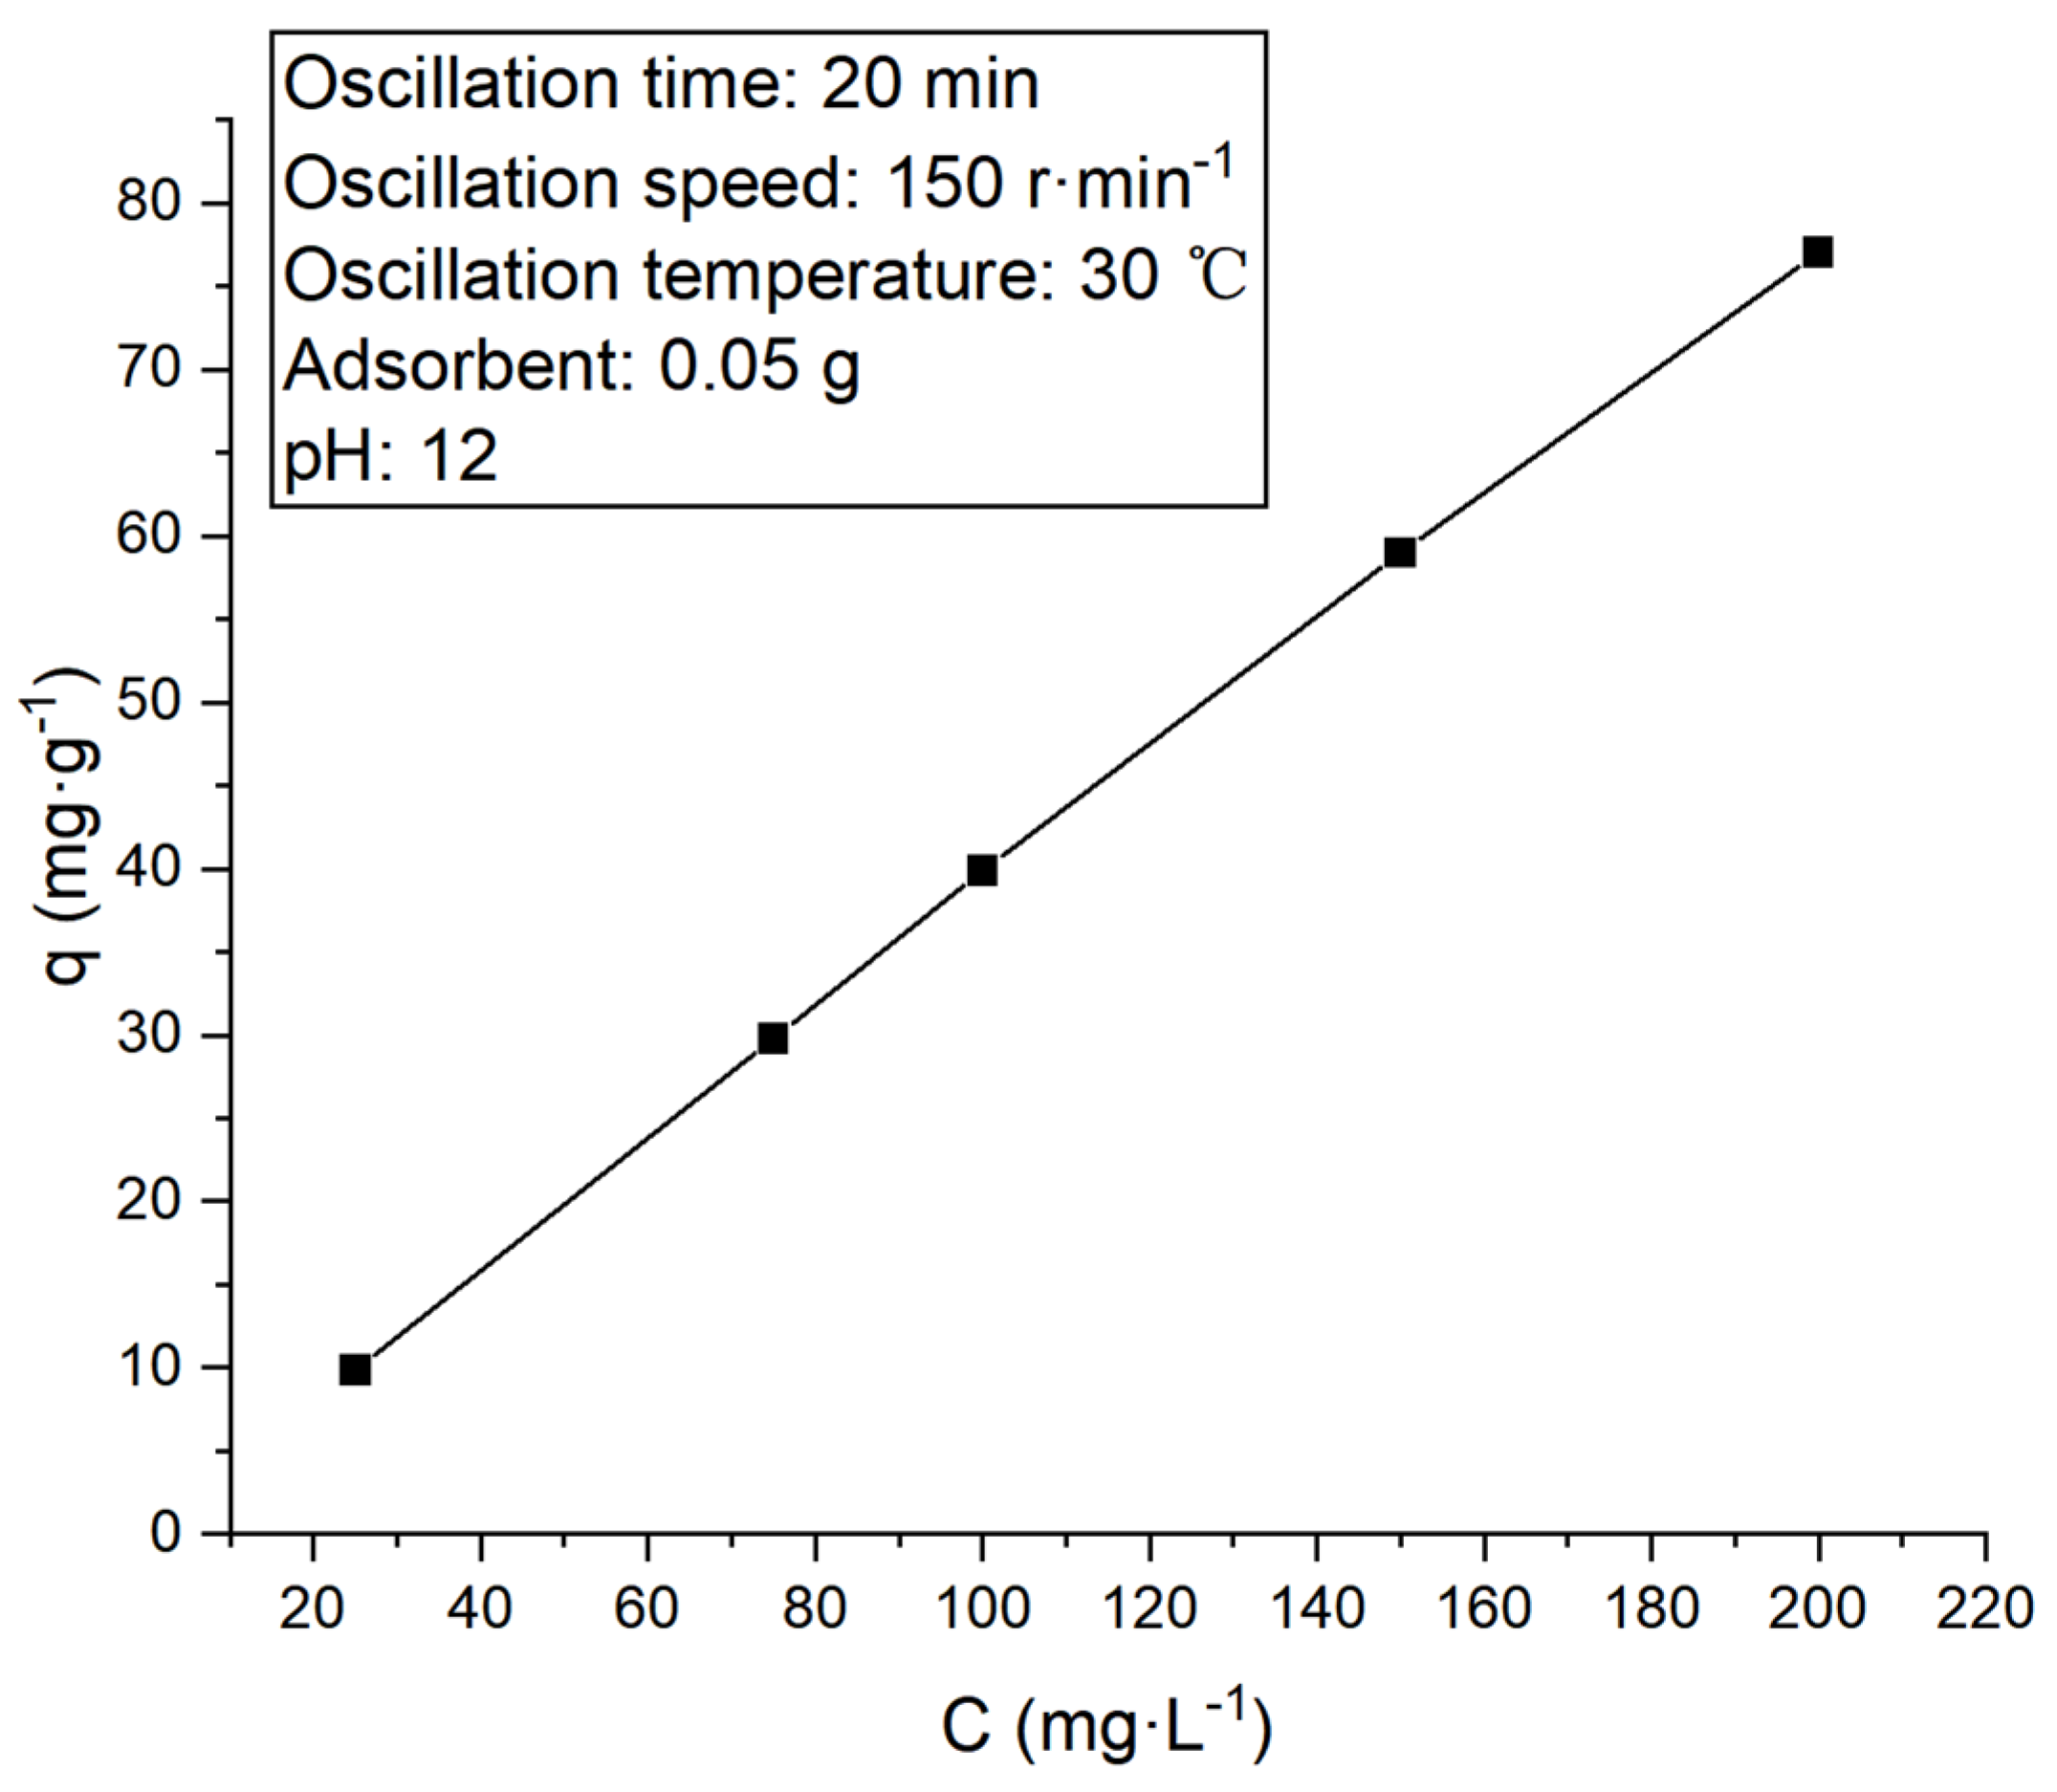
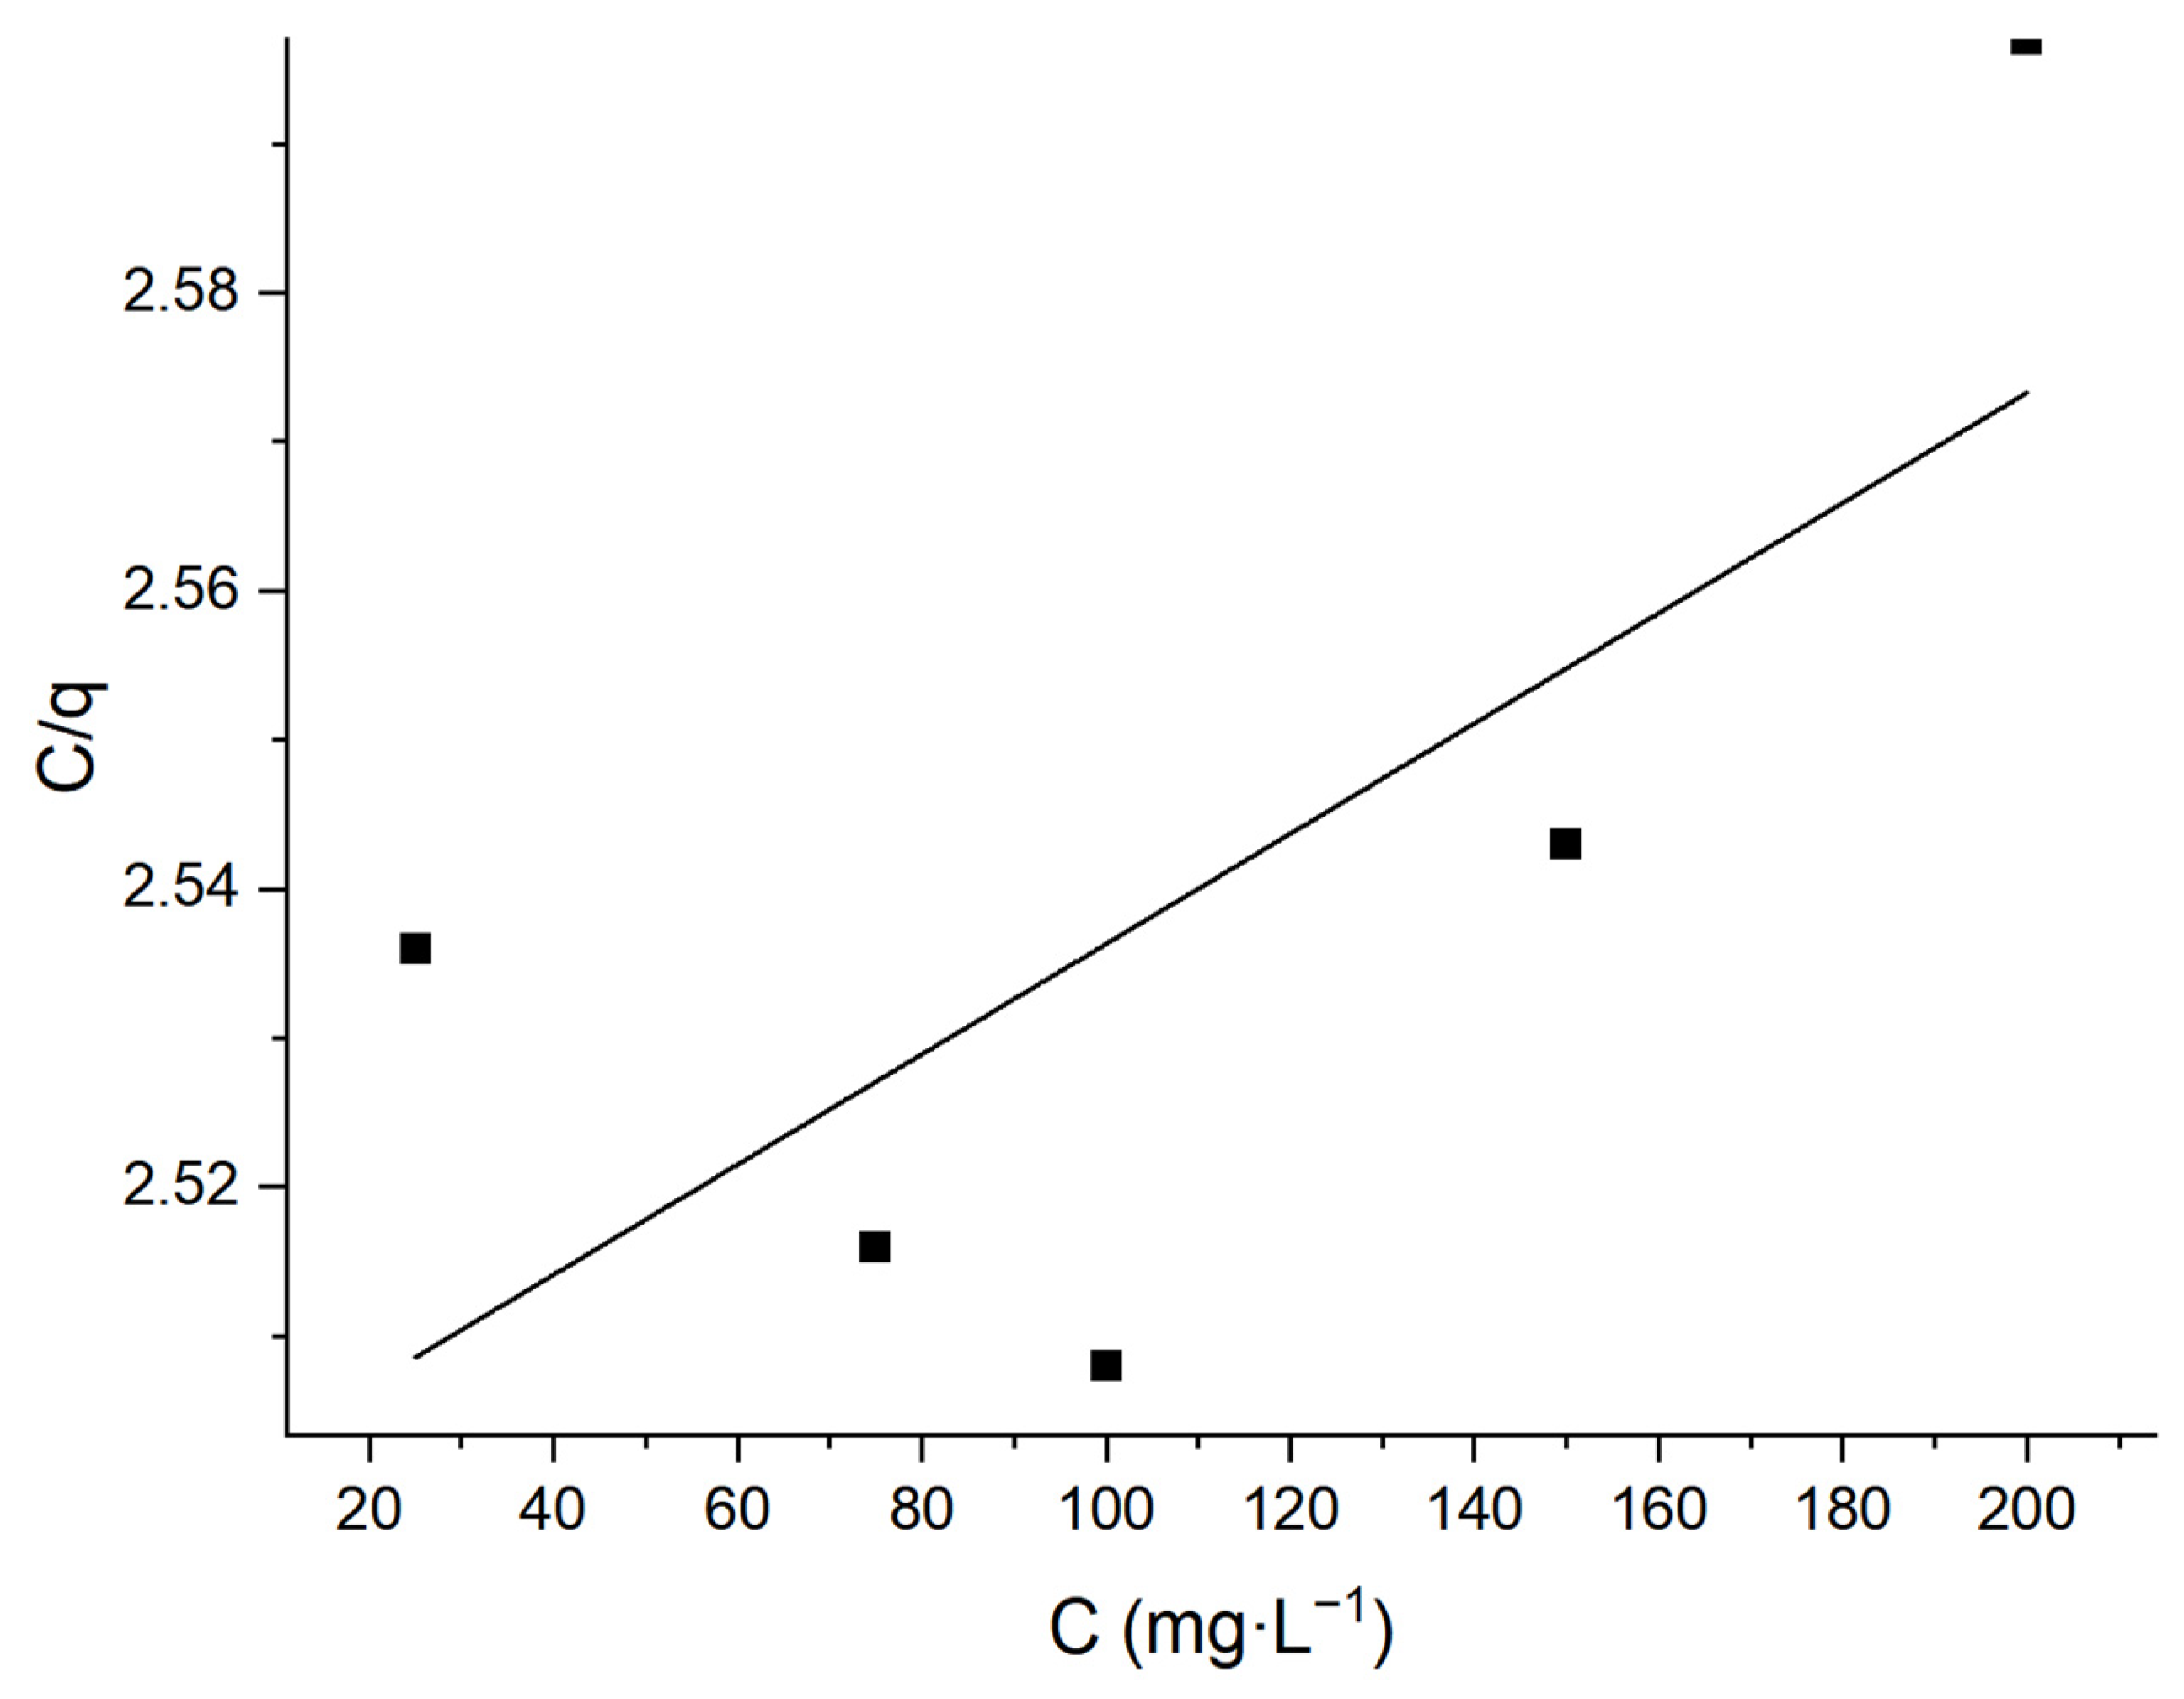
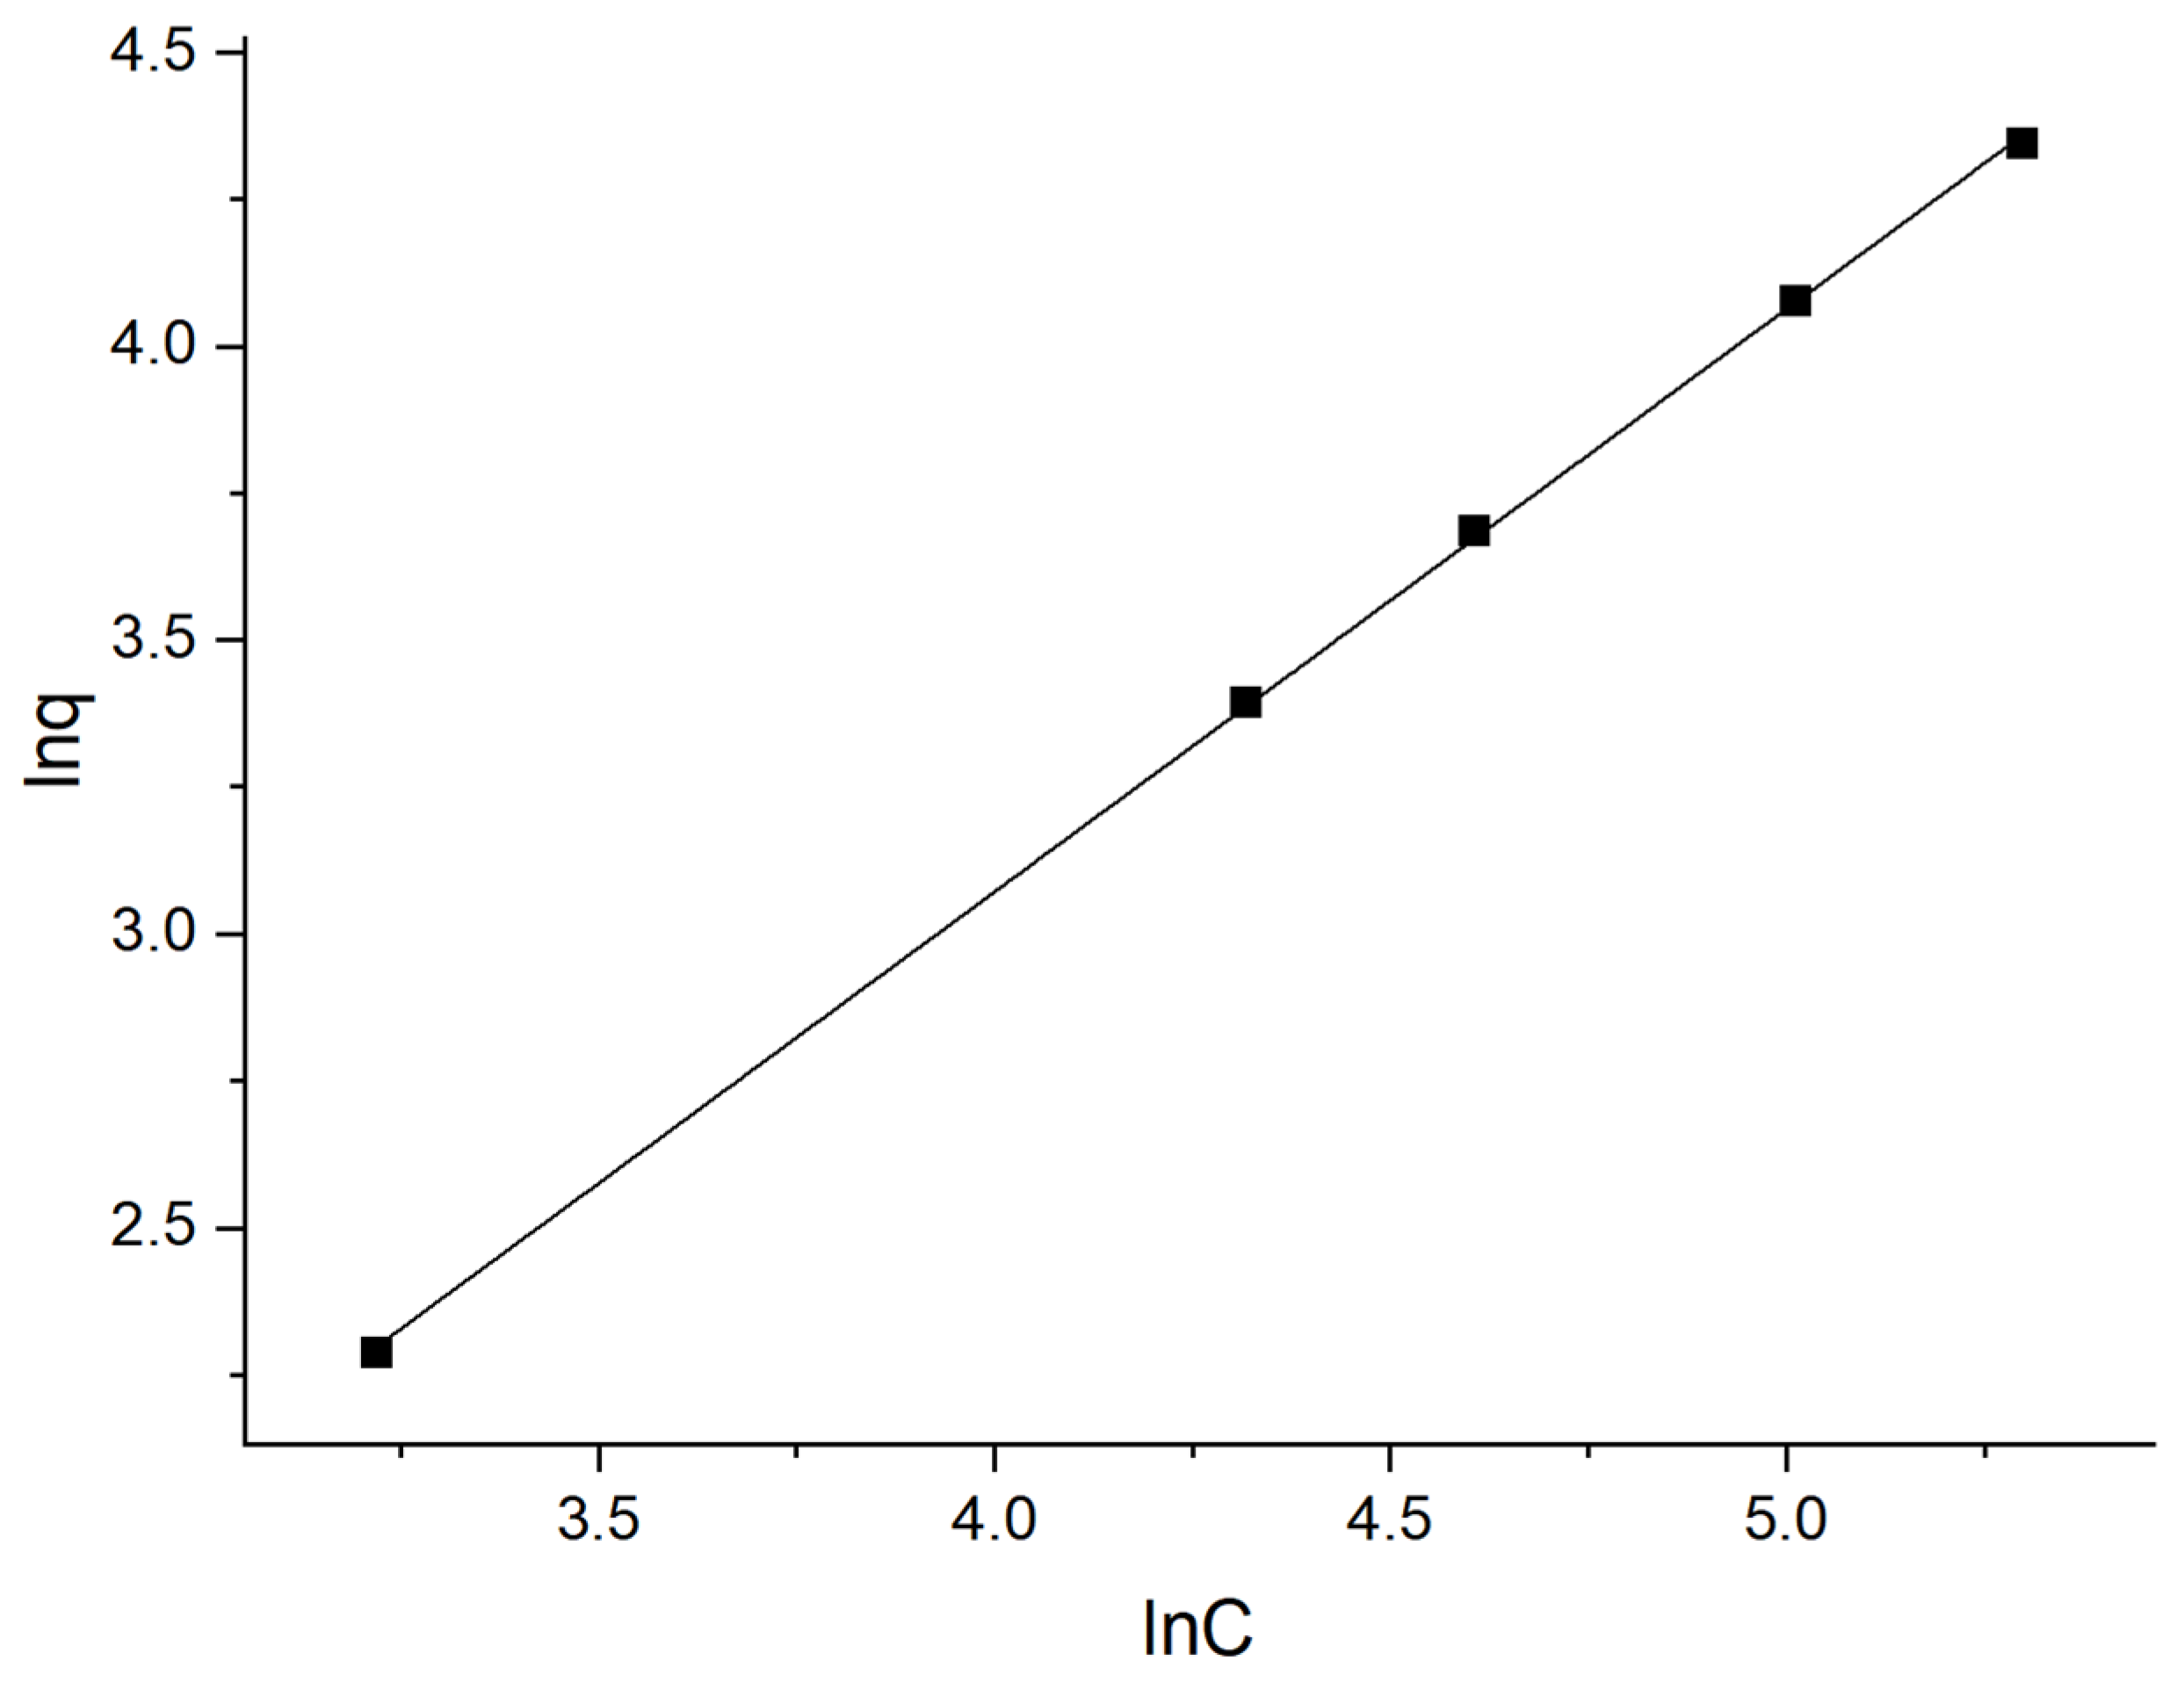
3.3. Adsorption Isotherms

To investigate the adsorption mechanism of flotation kaolin on methylene blue, the changes in the adsorption quantity of flotation kaolin adsorbent on solutions with different concentrations were observed and are presented in Figure 16 below.
The above signifies that with the increase in the concentration of methylene blue solution, the adsorption quantity of the adsorbent shows a constantly increasing trend, indicating that the active adsorption site of the adsorbent can accommodate more methylene blue molecules. For a better understanding of the adsorption mechanism, the commonly used Langmuir equation (Equation (6)) and Freundlich equation (Equation (7)) were employed herein to analyze the adsorption layer.
The Langmuir adsorption isotherm equation is as follows:
C / q = C / q + 1 / ( k L × q )
In the above equation, q is the adsorption quantity (mg·g−1), C is the solution concentration (mg·L−1), q is the limiting adsorption quantity (mg·g−1), and kL is the equilibrium constant.
The Freundlich isotherm equation is as follows [19]:
ln q = ln k F + ln C / n
In the above equations, q is the adsorption quantity (mg·g−1), C refers to the solution concentration (mg·L−1), kF is the equilibrium constant. When 1/n is between 0.1 and 0.5, adsorption is easier.
Additionally, linear fitting was performed using the experimental data, yielding the adsorption isotherm diagram of Langmuir and Freundlich.
According to Figure 17, q is 2703.7 mg·g−1, kL is 1.48 × 10⁻⁴, and R2 is 0.34963. Figure 18 suggests that n is 1.008, kF is 0.408, and R2 is 0.99969. Obviously, the adsorption process conforms to the Freundlich adsorption isotherm, that is, the adsorption is a complex involving both a monolayer and a multi-molecular layer, with the latter being the primary form.

4. Conclusions

The enriched product of kaolin after the flotation of coal gangue can be adopted to generate a methylene blue adsorbent, during which the optimum milling time is 7 h. Relatively good acid modification conditions include a boiling temperature of 100 °C, a stirring time of 135 min, a stirring speed of 1000 r·min−1, and a concentration of hydrochloric acid of 8 mol·L−1. When 0.05 g of flotation kaolin adsorbent was applied to adsorb the methylene blue solution with a pH of 12 and a concentration of 100 mg·L−1, the optimal adsorption conditions were determined as follows: 38.05 °C, 160 r·min−1, and 31.02 min. Under these conditions, the adsorption quantity reached 39.92 mg·g−1. The main effects of the adsorption conditions on the target value, can be ranked from the largest effect to the smallest as follows: oscillation time, speed, and temperature. The regression equation between the target value and the three adsorption variables is as follows: ρ = 4.34875 − 0.0908t + 0.0011625Tt + 0.000007vt + 0.0007325t2.
An analysis of the adsorption mechanism through a kinetic calculation signified that using flotation kaolin to adsorb methylene blue solution conforms to the quasi-second-order adsorption kinetic model. The adsorption is a physical, spontaneous, and endothermic process with an entropy greater than 0. In addition, it is a complex process involving both a monolayer and a multi-molecular layer, with latter being the primary form.

Author Contributions

Software, Y.X.; Data curation, W.G.; Writing—original draft, X.R.; Writing—review & editing, X.S. and P.L. All authors have read and agreed to the published version of the manuscript.

Funding

This research received no external funding.

Data Availability Statement

Data are contained within the article.

Conflicts of Interest

Author Weiguo Geng was employed by the company Chengde Xinglong Mining Co., Ltd. The remaining authors declare that the research was conducted in the absence of any commercial or financial relationships that could be construed as a potential conflict of interest.

References

  1. Nandi, B.K.; Goswami, A.; Purkait, M.K. Removal of cationic dyes from aqueous solutions by kaolin: Kinetic and equilibrium studies. Appl. Clay Sci. 2009, 42, 583–590. [Google Scholar] [CrossRef]
  2. Zhu, H.Y.; Jiang, R.; Xiao, L. Adsorption of an anionic azo dye by chitosan/kaolin/γ-Fe2O3 composites. Appl. Clay Sci. 2010, 48, 522–526. [Google Scholar] [CrossRef]
  3. Kiani, A.; Haratipour, P.; Ahmadi, M.; Zare-Dorabei, R.; Mahmoodi, A. Efficient removal of some anionic dyes from aqueous solution using a polymer-coated magnetic nano-adsorbent. J. Water Supply Res. Technol.—AQUA 2017, 66, 239–248. [Google Scholar] [CrossRef]
  4. Ghafourian, N.; Hosseini, S.N.; Mahmoodi, Z.; Masnabadi, N.; Thalji, M.R.; Abhari, A.R.; Al Zoubi, W.; Chong, K.F.; Ali, G.A.; Bakr, Z.H. TiO2-Mica 450 composite for photocatalytic degradation of methylene blue using UV irradiation. Emergent Mater. 2023, 6, 1527–1536. [Google Scholar] [CrossRef]
  5. Khalil, A.M.; Kenawy, S.H. Hybrid Membranes Based on Clay-Polymer for Removing Methylene Blue from Water. Acta Chim. Slov. 2020, 67, 96–104. [Google Scholar] [CrossRef] [PubMed]
  6. Ghosh, D.; Bhattacharyya, K.G. Adsorption of methylene blue on kaolinite. Appl. Clay Sci. 2002, 20, 295–300. [Google Scholar] [CrossRef]
  7. Harris, R.G.; Johnson, B.B.; Wells, J.D. Studies on the adsorption of dyes to kaolinite. Clays Clay Miner. 2006, 54, 435–448. [Google Scholar] [CrossRef]
  8. Nwosu, F.O.; Ajala, O.J.; Owoyemi, R.M.; Raheem, B.G. Preparation and characterization of adsorbents derived from bentonite and kaolin clays. Appl. Water Sci. 2018, 8, 195. [Google Scholar] [CrossRef]
  9. De Alencar, P.; Brasil, D.; Auzier, V.; Homci, R.; Bittencourt, K. Evaluation of the Kinetics of Adsorption of Methylene Blue Dye on Low Cost Ceramic Membranes Characterized with Waste from the Bayer Process. ChemRxiv 2023. [Google Scholar] [CrossRef]
  10. Xu, H.; Liu, J.; Chen, P.; Shao, G.; Fan, B.; Wang, H.; Chen, D.; Lu, H.; Zhang, R. Preparation of magnetic kaolinite nanotubes for the removal of methylene blue from aqueous solution. J. Inorg. Organomet. Polym. Mater. 2018, 28, 790–799. [Google Scholar] [CrossRef]
  11. Ren, X.; Shu, X.; Xu, H.; Huang, G.; Yuan, N.; Wen, B.; Cui, M.; Zhou, H.; Liu, X.; Li, J. Research on the Preparation of Kaolin from Coal Gangue by Flotation Decarburization with Different Collectors. Processes 2023, 11, 3075. [Google Scholar] [CrossRef]
  12. Wang, H.J.; Wang, X.L.; Wang, L.X. Adsorption Performance of Methylene Blue on Modified Coal Gangue. Adv. Mater. Res. 2013, 807, 521–525. [Google Scholar] [CrossRef]
  13. Niu, S.; Xie, X.; Wang, Z.; Zheng, L.; Gao, F.; Miao, Y. Enhanced removal performance for Congo red by coal-series kaolin with acid treatment. Environ. Technol. 2021, 42, 1472–1481. [Google Scholar] [CrossRef] [PubMed]
  14. Gao, J.; Lin, Q.; Yang, T.; Bao, Y.C.; Liu, J. Preparation and characterization of ZSM-5 molecular sieve using coal gangue as a raw material via solvent-free method: Adsorption performance tests for heavy metal ions and methylene blue. Chemosphere 2023, 341, 139741. [Google Scholar] [CrossRef] [PubMed]
  15. Barracco, F.; Parisi, E.; Pipitone, G.; Simone, E.; Bensaid, S.; Fino, D. Valorization of pyrolytic plastic-derived char for adsorption of wastewater contaminants: A kinetic and thermodynamic investigation. Int. J. Environ. Sci. Technol. 2024, 21, 6513–6530. [Google Scholar] [CrossRef]
  16. Flilissa, A.; Laouameur, K.; Hammoudl, N.E.; Tamam, N.; Yadav, K.K.; Achouri, B.; Alyami, A.Y.; Flilissa, O.; Algethami, J.S.; Abbas, M.; et al. Bentonite SDBS-loaded composite of methylene blue removal from wastewater: An experimental and theoretical investigation. Environ. Res. 2024, 241, 117544. [Google Scholar] [CrossRef] [PubMed]
  17. Mahnaz, S.T.; Zare-Dorabei, R. Competitive removal of hazardous dyes from aqueous solution by MIL-68(Al): Derivative spectrophotometric method and response surface methodology approach. Spectrochim. Acta Part A Mol. Biomol. Spectrosc. 2016, 60, 8–18. [Google Scholar]
  18. Seyed, H.M.; Zare-Dorabei, R.; Mohammad, B. Microwave-assisted synthesis of metal-organic framework MIL-47 for effective adsorptive removal of dibenzothiophene from model fuel. J. Iran. Chem. Soc. 2021, 18, 709–717. [Google Scholar]
  19. Fang, Y.; Zhao, G.; Dai, W.; Ma, L.; Ma, N. Enhanced adsorption of rubidium ion by a phenol@MIL-101(Cr) composite material. Microporous Mesoporous Mater. 2017, 251, 51–57. [Google Scholar] [CrossRef]
Figure 1. Absorbance of methylene blue solutions at lower concentrations.
Processes 12 00773 g001
Figure 2. Absorbance of methylene blue solutions at higher concentrations.
Processes 12 00773 g002
Figure 3. Experimental device for acid modification.
Processes 12 00773 g003
Figure 4. XRD analysis results of raw material before and after modification.
Processes 12 00773 g004
Figure 5. Concentration changes in methylene blue solutions with different initial concentrations after adsorption.
Processes 12 00773 g005
Figure 6. Concentration changes in methylene blue solution at different pH values after adsorption.
Processes 12 00773 g006
Figure 7. The concentration changes in methylene blue solution treated with different amounts of adsorbent.
Processes 12 00773 g007
Figure 8. Normal plot of residuals.
Processes 12 00773 g008
Figure 9. Corresponding relation diagram between predicted value and actual value.
Processes 12 00773 g009
Figure 10. Influence of oscillating temperature and velocity on adsorption.
Processes 12 00773 g010
Figure 11. Influence of oscillating temperature and time on adsorption.
Processes 12 00773 g011
Figure 12. Influence of oscillation speed and time on adsorption.
Processes 12 00773 g012
Figure 13. Changes in adsorption quantity with adsorption time.
Processes 12 00773 g013
Figure 14. Quasi-first-order adsorption kinetics.
Processes 12 00773 g014
Figure 15. Quasi-second-order adsorption kinetics.
Processes 12 00773 g015
Figure 16. Adsorption quantity of methylene blue solution with different concentrations of flotation kaolin adsorbent.
Processes 12 00773 g016
Figure 17. Langmuir adsorption isotherm.
Processes 12 00773 g017
Figure 18. Freundlich adsorption isotherm.
Processes 12 00773 g018
Table 1. Particle size distribution of coal gangue under different milling times.
Particle Size IndexParticle Size of
Coal Gangue Raw Materials
(μm)
Particle Size of Ball Milling 1 h
(μm)
Particle Size of Ball Milling 4 h
(μm)
Particle Size of Ball Milling 7 h
(μm)
Particle Size of Ball Milling 10 h
(μm)
mean particle size138.6913.2710.396.225.79
D5053.667.785.944.243.93
D97581.6645.5937.3621.6020.77
Notes: In the table above, D50 and D70 represent 50% and 70% granularity less than the value, respectively.
Table 2. Orthogonal experiment of hydrochloric acid modification.
NumberTime
(min)
Temperature
(°C)
Rate
(r·min−1)
Acid Concentration
(mol·L−1)
Absorbance
(L·g−1·cm−1)
Solution Concentration
after Adsorption
(mg·L−1)
1302520020.2171.471
2305060050.151.099
330100100080.0580.404
41352560080.0950.691
513550100020.1431.060
613510020050.1681.199
724025100050.1050.849
82405020080.1210.938
924010060020.1781.255
K12.9743.0113.6083.786
K22.9503.0973.0443.147
K33.0412.8572.3122.032
K 1 ¯ 0.9911.0041.2031.262
K 2 ¯ 0.9831.0321.0151.049
K 3 ¯ 1.0140.9520.7710.677
R0.0300.0800.4320.585
Table 3. Changes in specific surface area and pores of raw material after ball milling and acid boiling of flotation kaolin.
SampleBET Specific
Surface Area (m2·g−1)
Micropore
Volume (ml·g−1)
Total Pore
Volume (ml·g−1)
Remark
<0.5 mm raw material12.76960.000210.02465micropore < 1.483 nm;
total pore ≦ 172.079 nm
materials after ball milling for 7 h16.36120.00660.0579micropore ≦ 1.93 nm;
total pore ≦ 142.86 nm
acid-modified material29.93980.01230.0712micropore ≦ 1.91 nm;
total pore ≦ 121.86 nm
Table 4. Experiments on optimization of adsorption conditions.
NumberOscillation
Temperature (°C)
Oscillation Rate
(r·min−1)
Oscillation Time
(min)
Absorbance
(L·g−1·cm−1)
Solution Concentration after Adsorption (mg·L−1)
130150100.1240.956
240225300.0430.287
34075300.0460.308
440150200.0400.264
530225200.0620.432
640225100.0630.442
75075200.0930.673
840150200.0420.279
950225200.0490.331
103075200.0660.468
1150150100.0660.463
1240150200.0410.274
134075100.0680.484
1430150300.0490.331
1540150200.0400.264
1650150300.0450.303
1740150200.0410.274
Table 5. Results of regression analysis.
Sources of VariationQuadratic SumDegree of FreedomMean Sum of SquareF Valuep ValueSignificance
Regression model0.4490.0493.910.0429Significant
A(T)0.02210.0221.750.2280Non-significant
B(v)0.02410.0241.950.2051Non-significant
C(t)0.1610.1612.500.0095Significant
AB0.02310.0231.880.2127Non-significant
AC0.05410.0544.340.0757Non-significant
BC0.000110310.00011030.0088530.9277Non-significant
A20.1210.129.660.0171Non-significant
B20.00545710.0054570.440.5292Non-significant
C20.02310.0231.810.2200Non-significant
Pure error0.0001840.000045
Total deviation0.5316
Table 6. The adsorption capacity of the adsorbent at different temperatures.
T (°C)Solution Concentration after
Adsorption (mg·L−1)
Adsorption Capacity
qe (mg·g−1)
303.150.32639.870
308.150.28739.885
313.150.24839.901
343.150.22539.870
Table 7. Thermodynamic parameters of methylene blue solution adsorbed by flotation kaolin.
T
(°C)
ΔG0
(KJ·mol−1)
ΔH0
(KJ·mol−1)
ΔS0
(J·mol−1·K−1)
303.15−12.11519.72740.03
308.15−12.641
313.15−13.225
343.15−14.774
Disclaimer/Publisher’s Note: The statements, opinions and data contained in all publications are solely those of the individual author(s) and contributor(s) and not of MDPI and/or the editor(s). MDPI and/or the editor(s) disclaim responsibility for any injury to people or property resulting from any ideas, methods, instructions or products referred to in the content.

