
Interdependent Expansion Planning for Resilient Electricity and Natural Gas Networks


Abstract
1. Introduction
- (1)
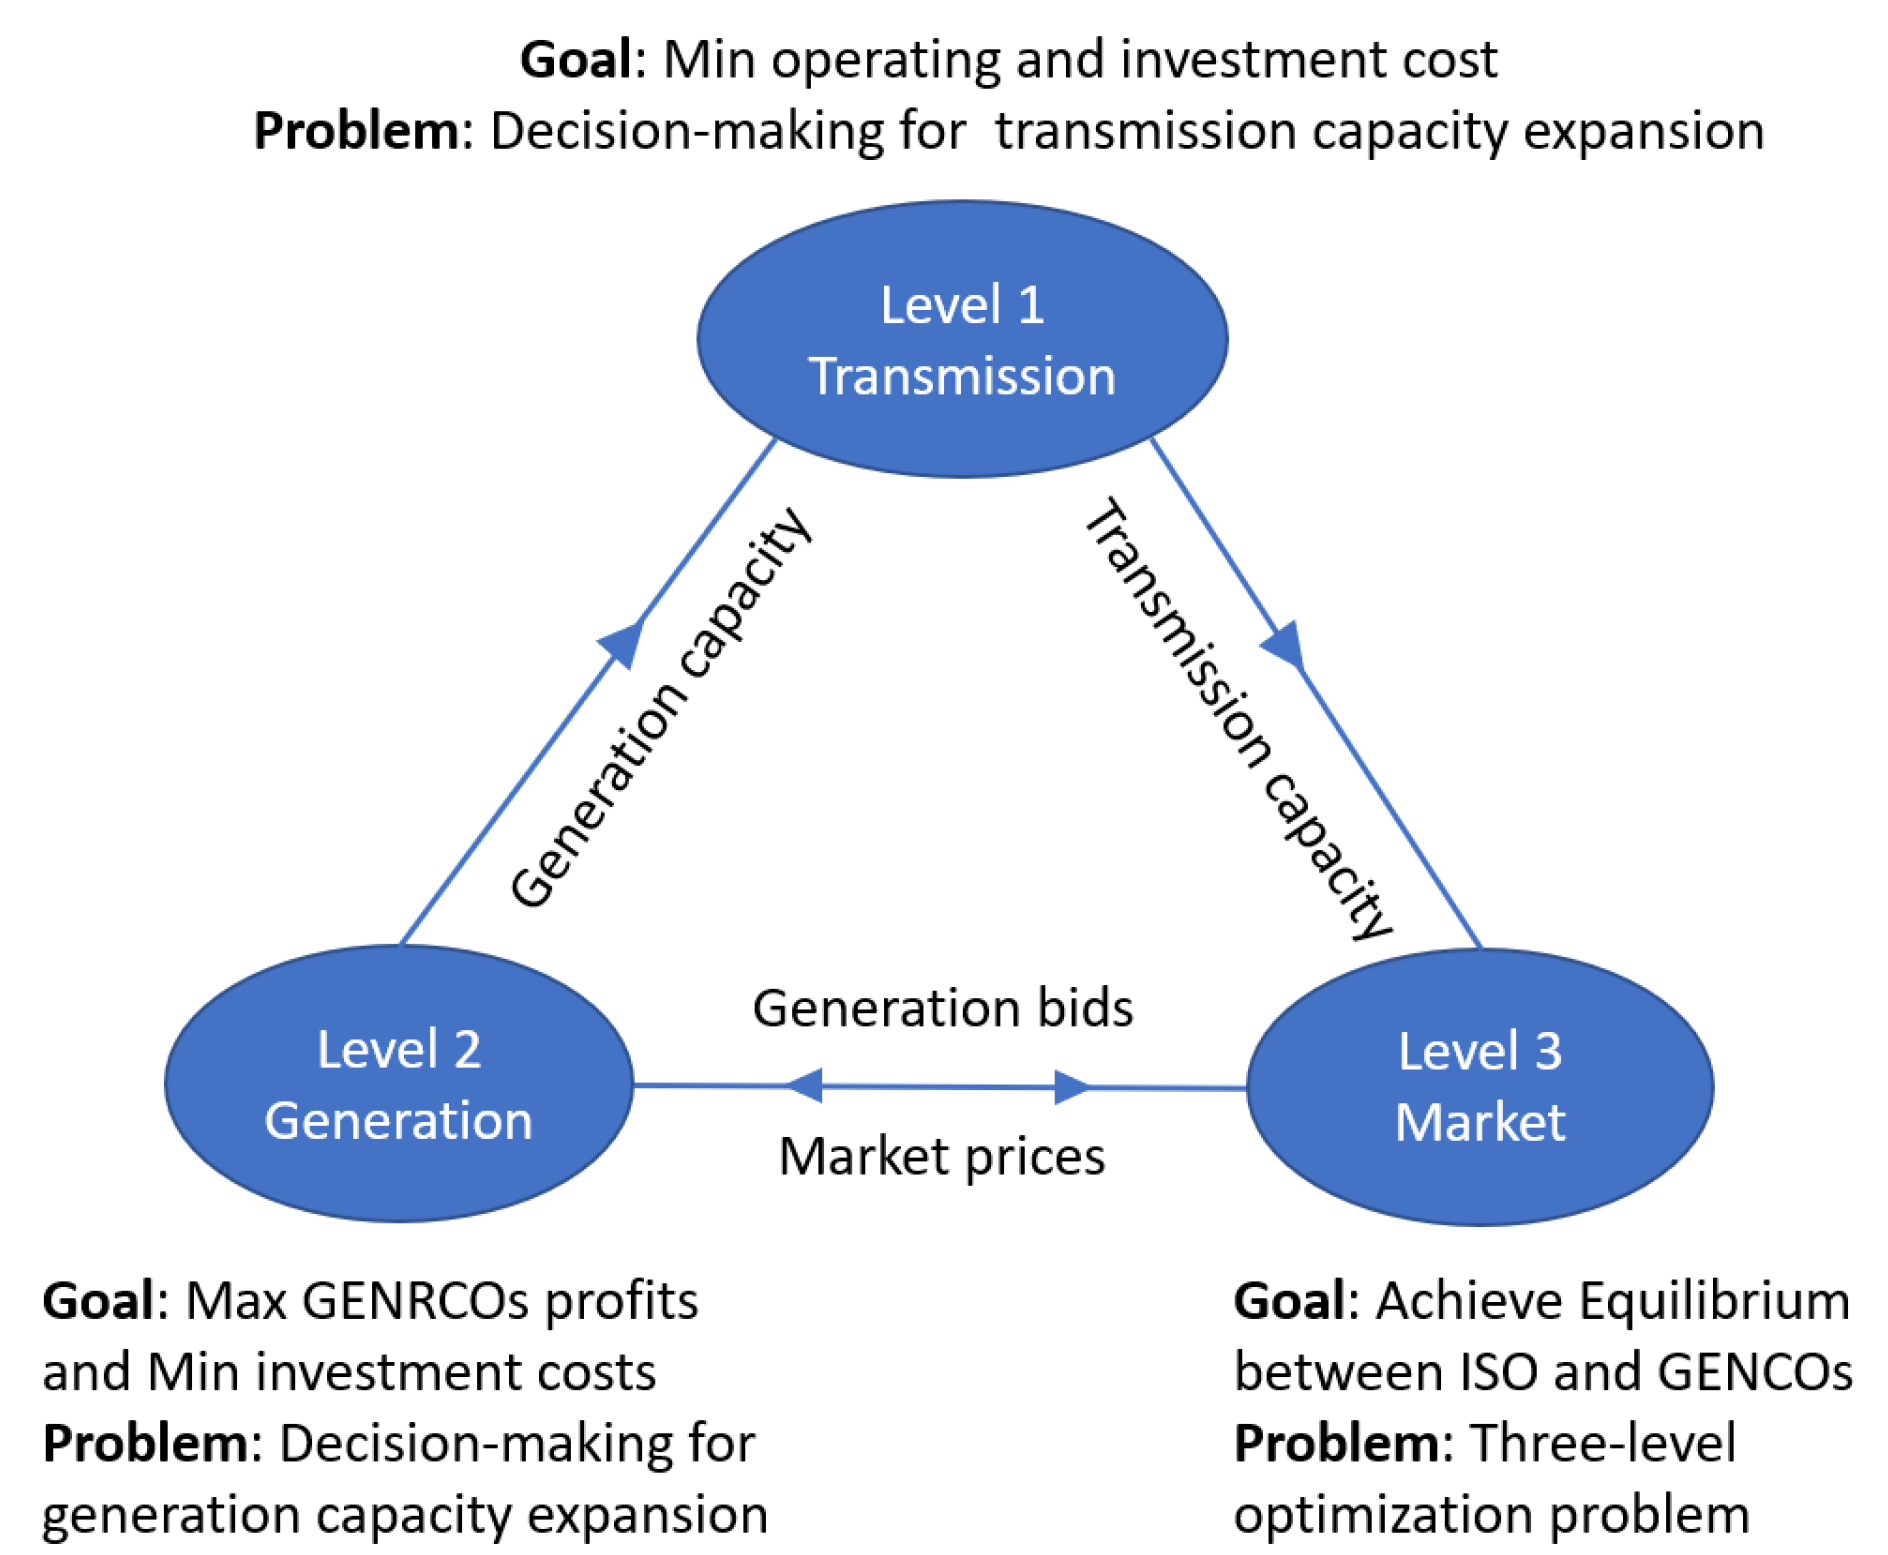
- A novel framework of centralized transmission planning with decentralized generation planning is proposed. It is formulated as an integrated resource tri-level optimization model in a deregulated market environment.
- (2)
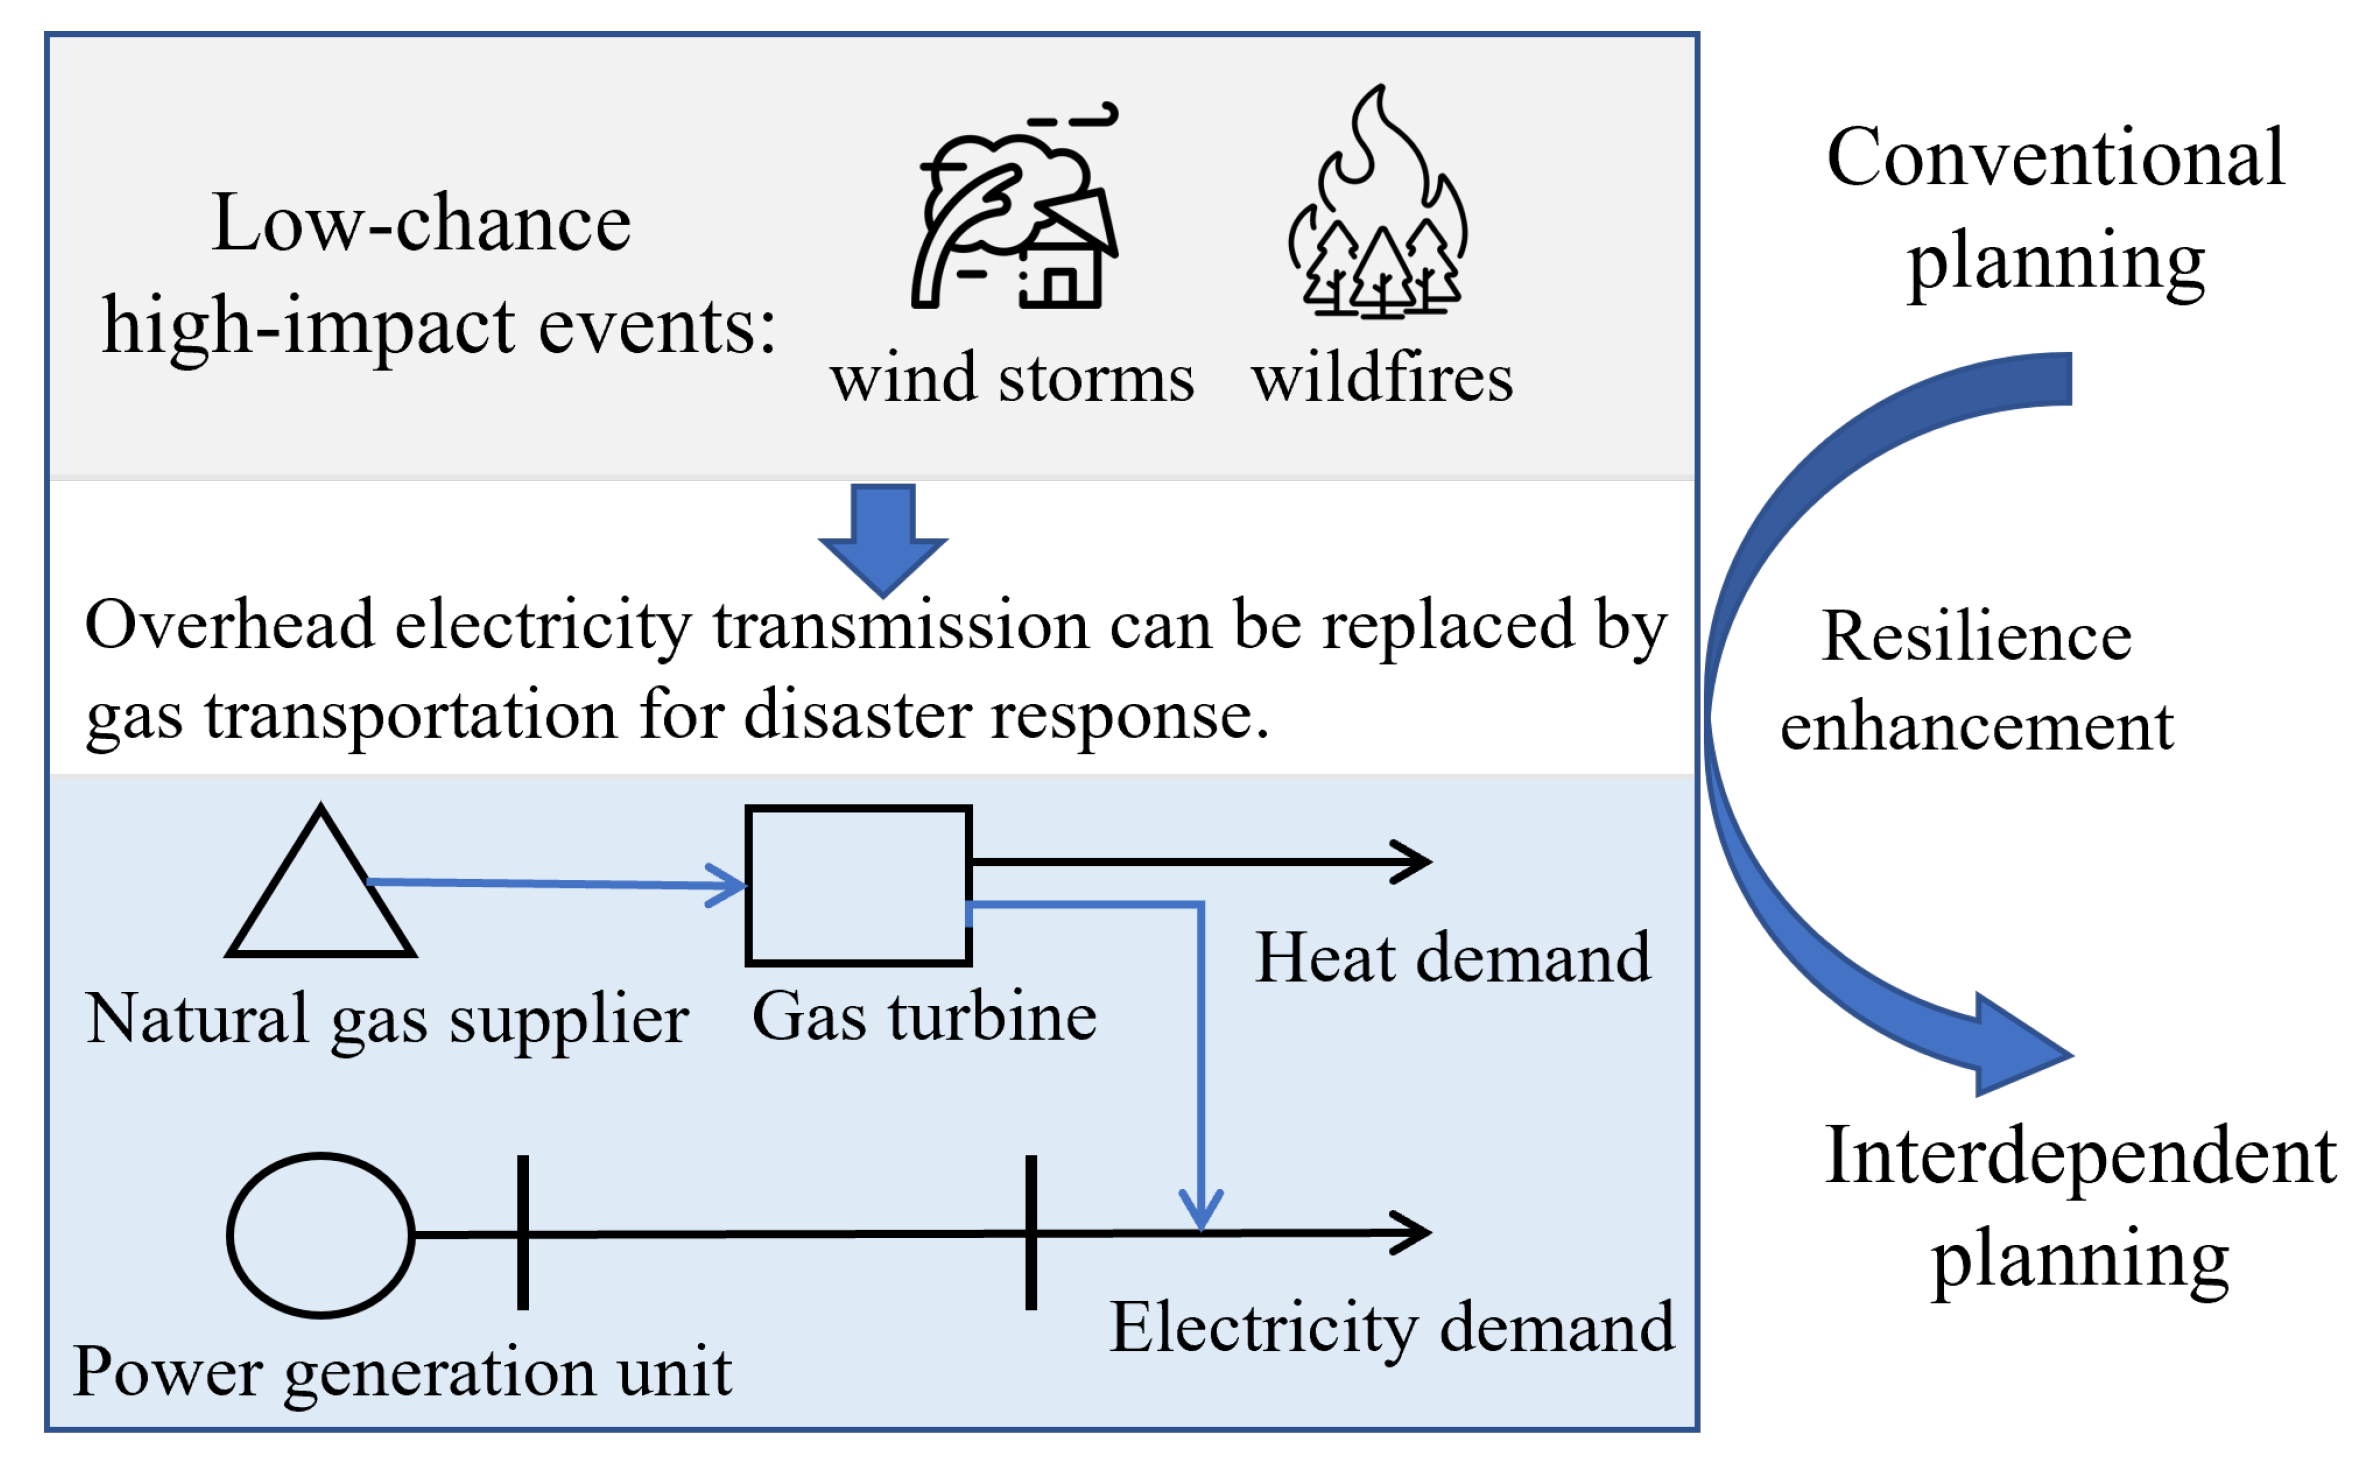
- Detailed profiles, constraints, and market dynamics are considered in the interdependent expansion planning of energy systems to enhance its resilience.
- (3)
- To identify promising expansion plans, a Complementary Problem (CP) reformulation is employed to address the original tri-level programming expansion challenge, while a decomposition method is applied to manage the two-stage resilience problem.
2. Problem Description
- The initial planning stage conceptualizes a typical hour of operation, setting the groundwork for further detailed scenario analysis in subsequent stages. This approach allows for the possibility of expanding the model to encompass various time frames and stochastic scenarios, including renewable energy outputs and demand variability.
- This work focuses on expanding the capacity of existing lines rather than constructing new ones, assuming constant impedance for any such expansions to simplify the analysis.
- Cost functions for both transmission and generation expansion are assumed as linear to minimize the computational complexity.
- Within the competitive electricity market, Generation Companies (GENCOs) are modeled to make strategic and reasonable decisions. Although each GENCO is initially represented by a single unit for simplicity, the model allows for extension to more complex configurations involving multiple units per GENCO.
- The model presumes a perfectly competitive electricity market, with the capability for all buses to support both load and generation.
- The market equilibrium is simultaneously solved through ISO’s market clearing process, and the GENCOs can bid in the market.
- For Case 7 in the analysis, the installed capacities of the candidate transmission lines are set 20% lower than in Case 1.
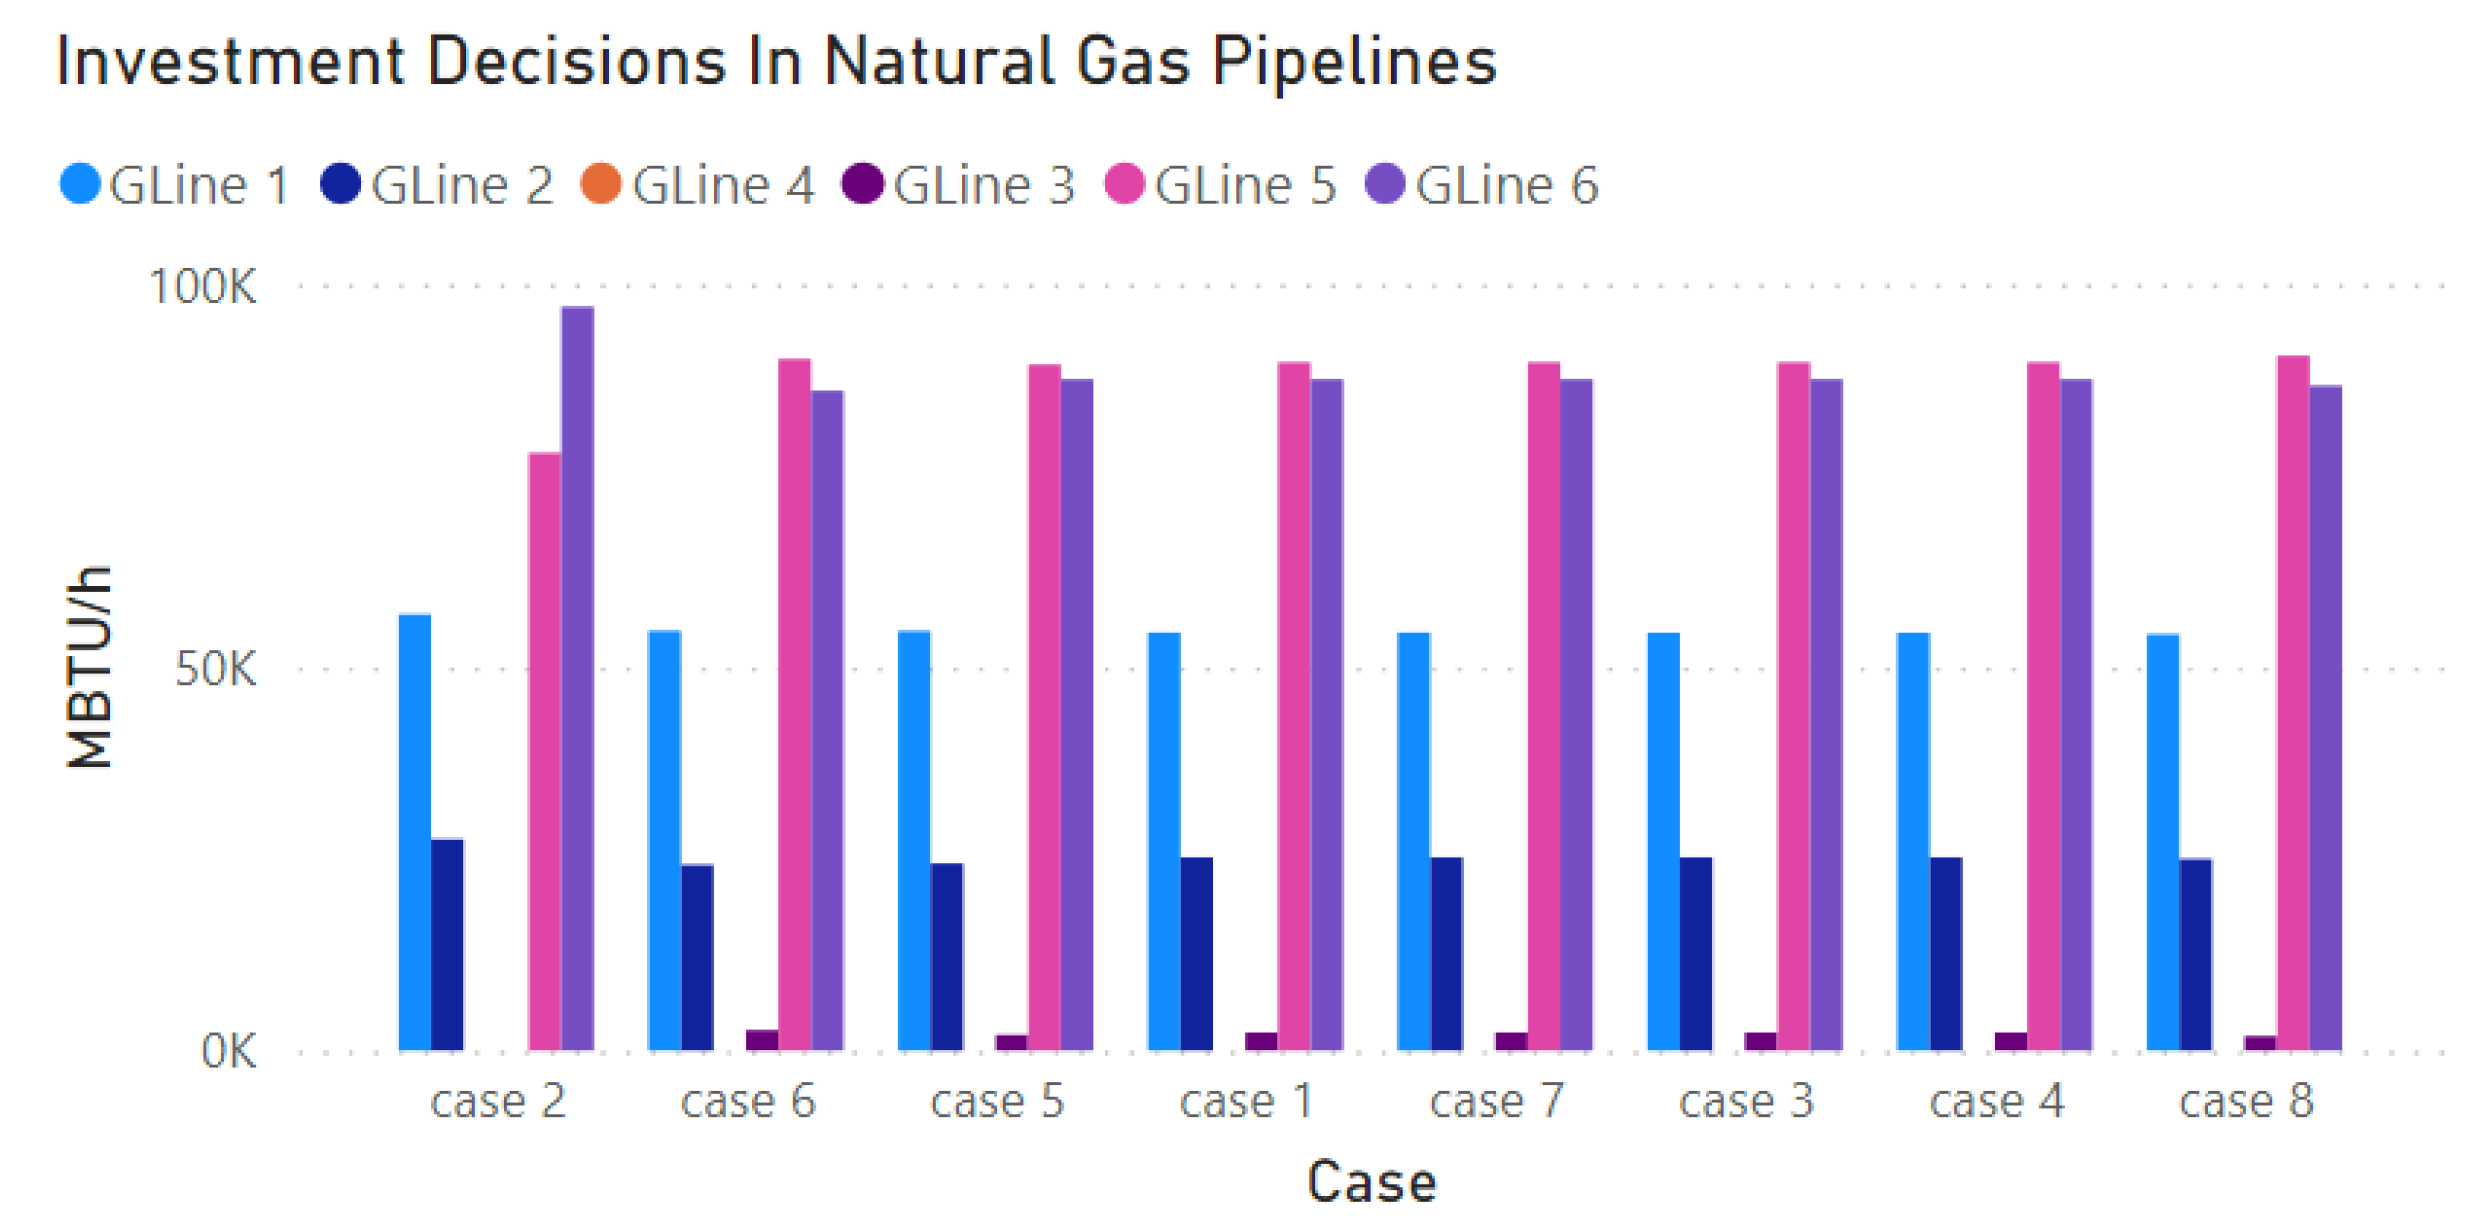
- The scope of this study is confined to considering expansions in the natural gas transportation system’s pipeline infrastructure.
3. Model Formulation
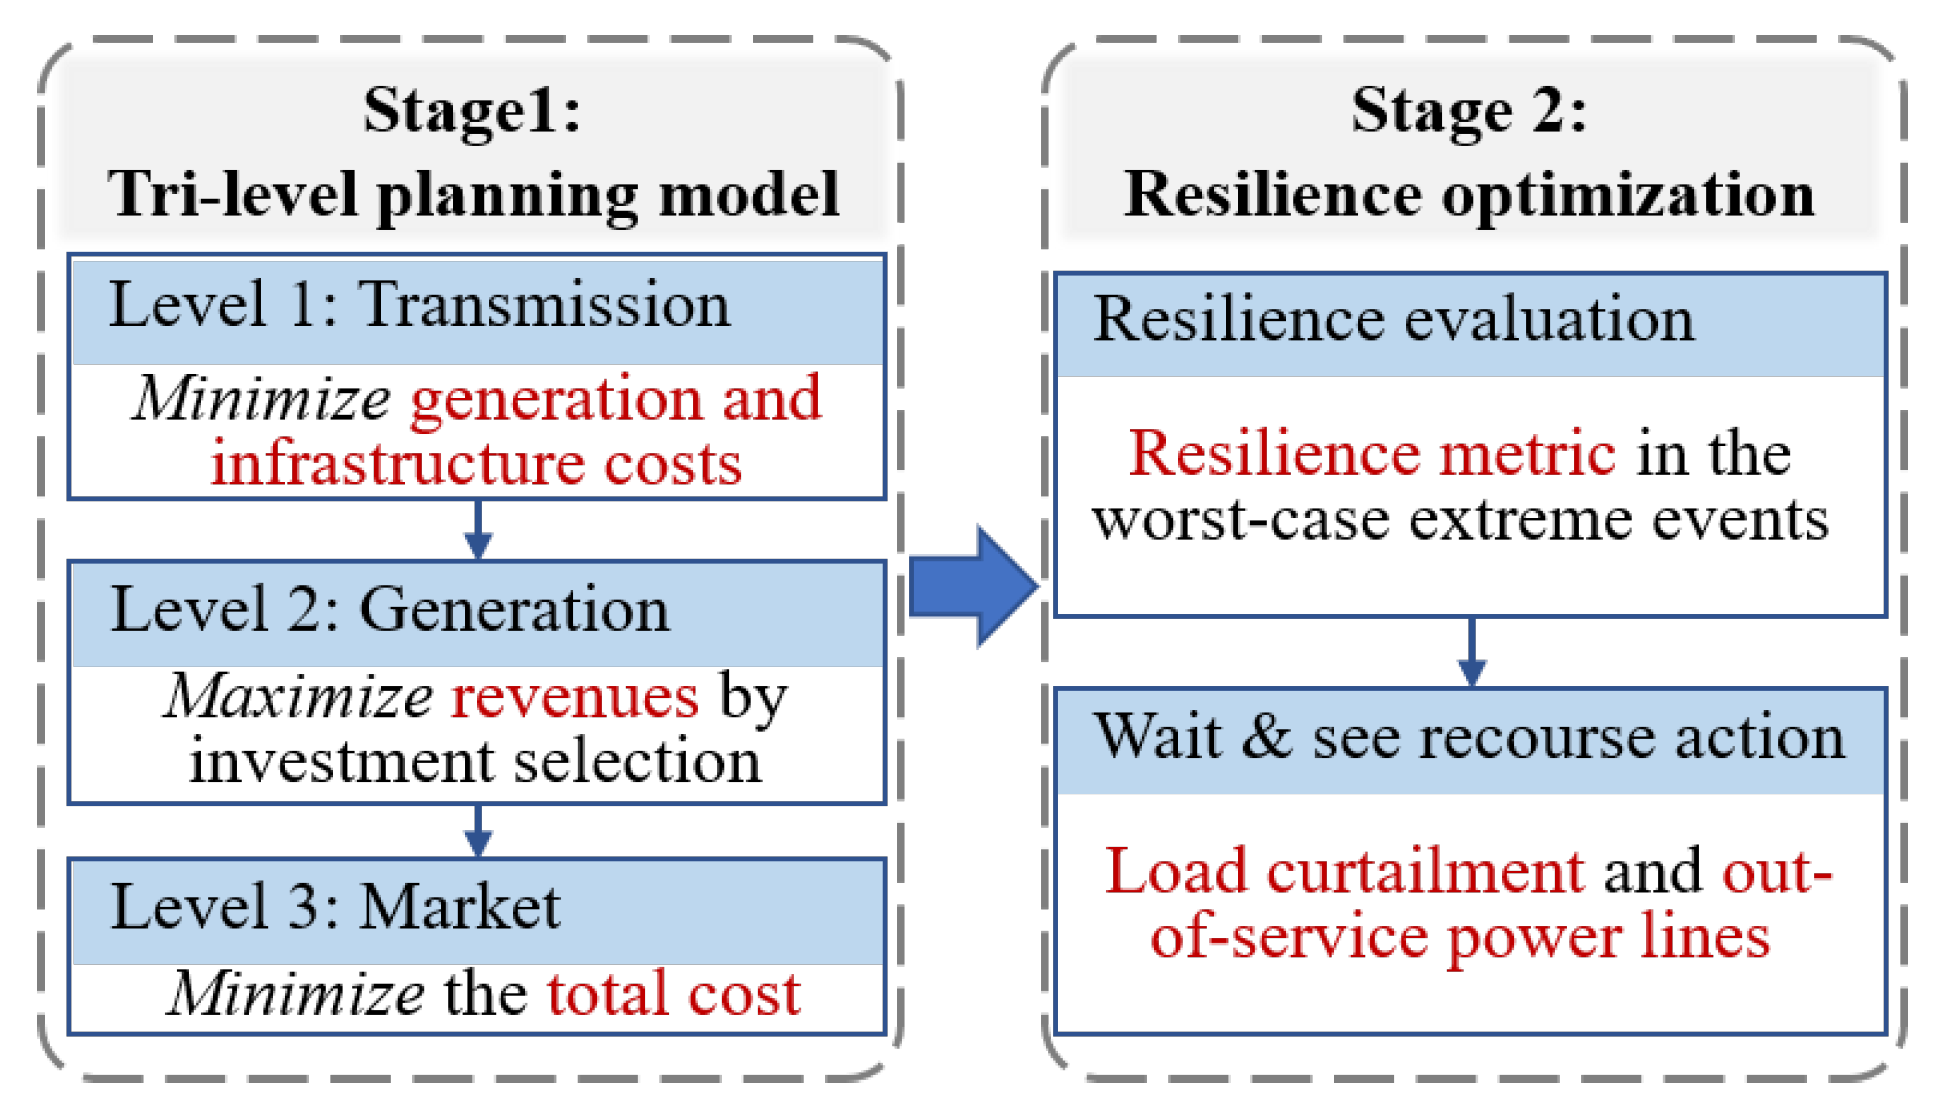
3.1. Stage-1: Planning Strategy Development
3.1.1. Level-1: Transmission Expansion Planning
3.1.2. Level-2: Generation Expansion Equilibrium
3.1.3. Level-3: Market Clearing Process
3.2. Stage-2: Resilience Optimisation
3.3. Problem Formulation and Solution
| Algorithm 1 Two-stage resilient planning. |
|
4. Case Studies
4.1. System Settings
4.2. General Analysis
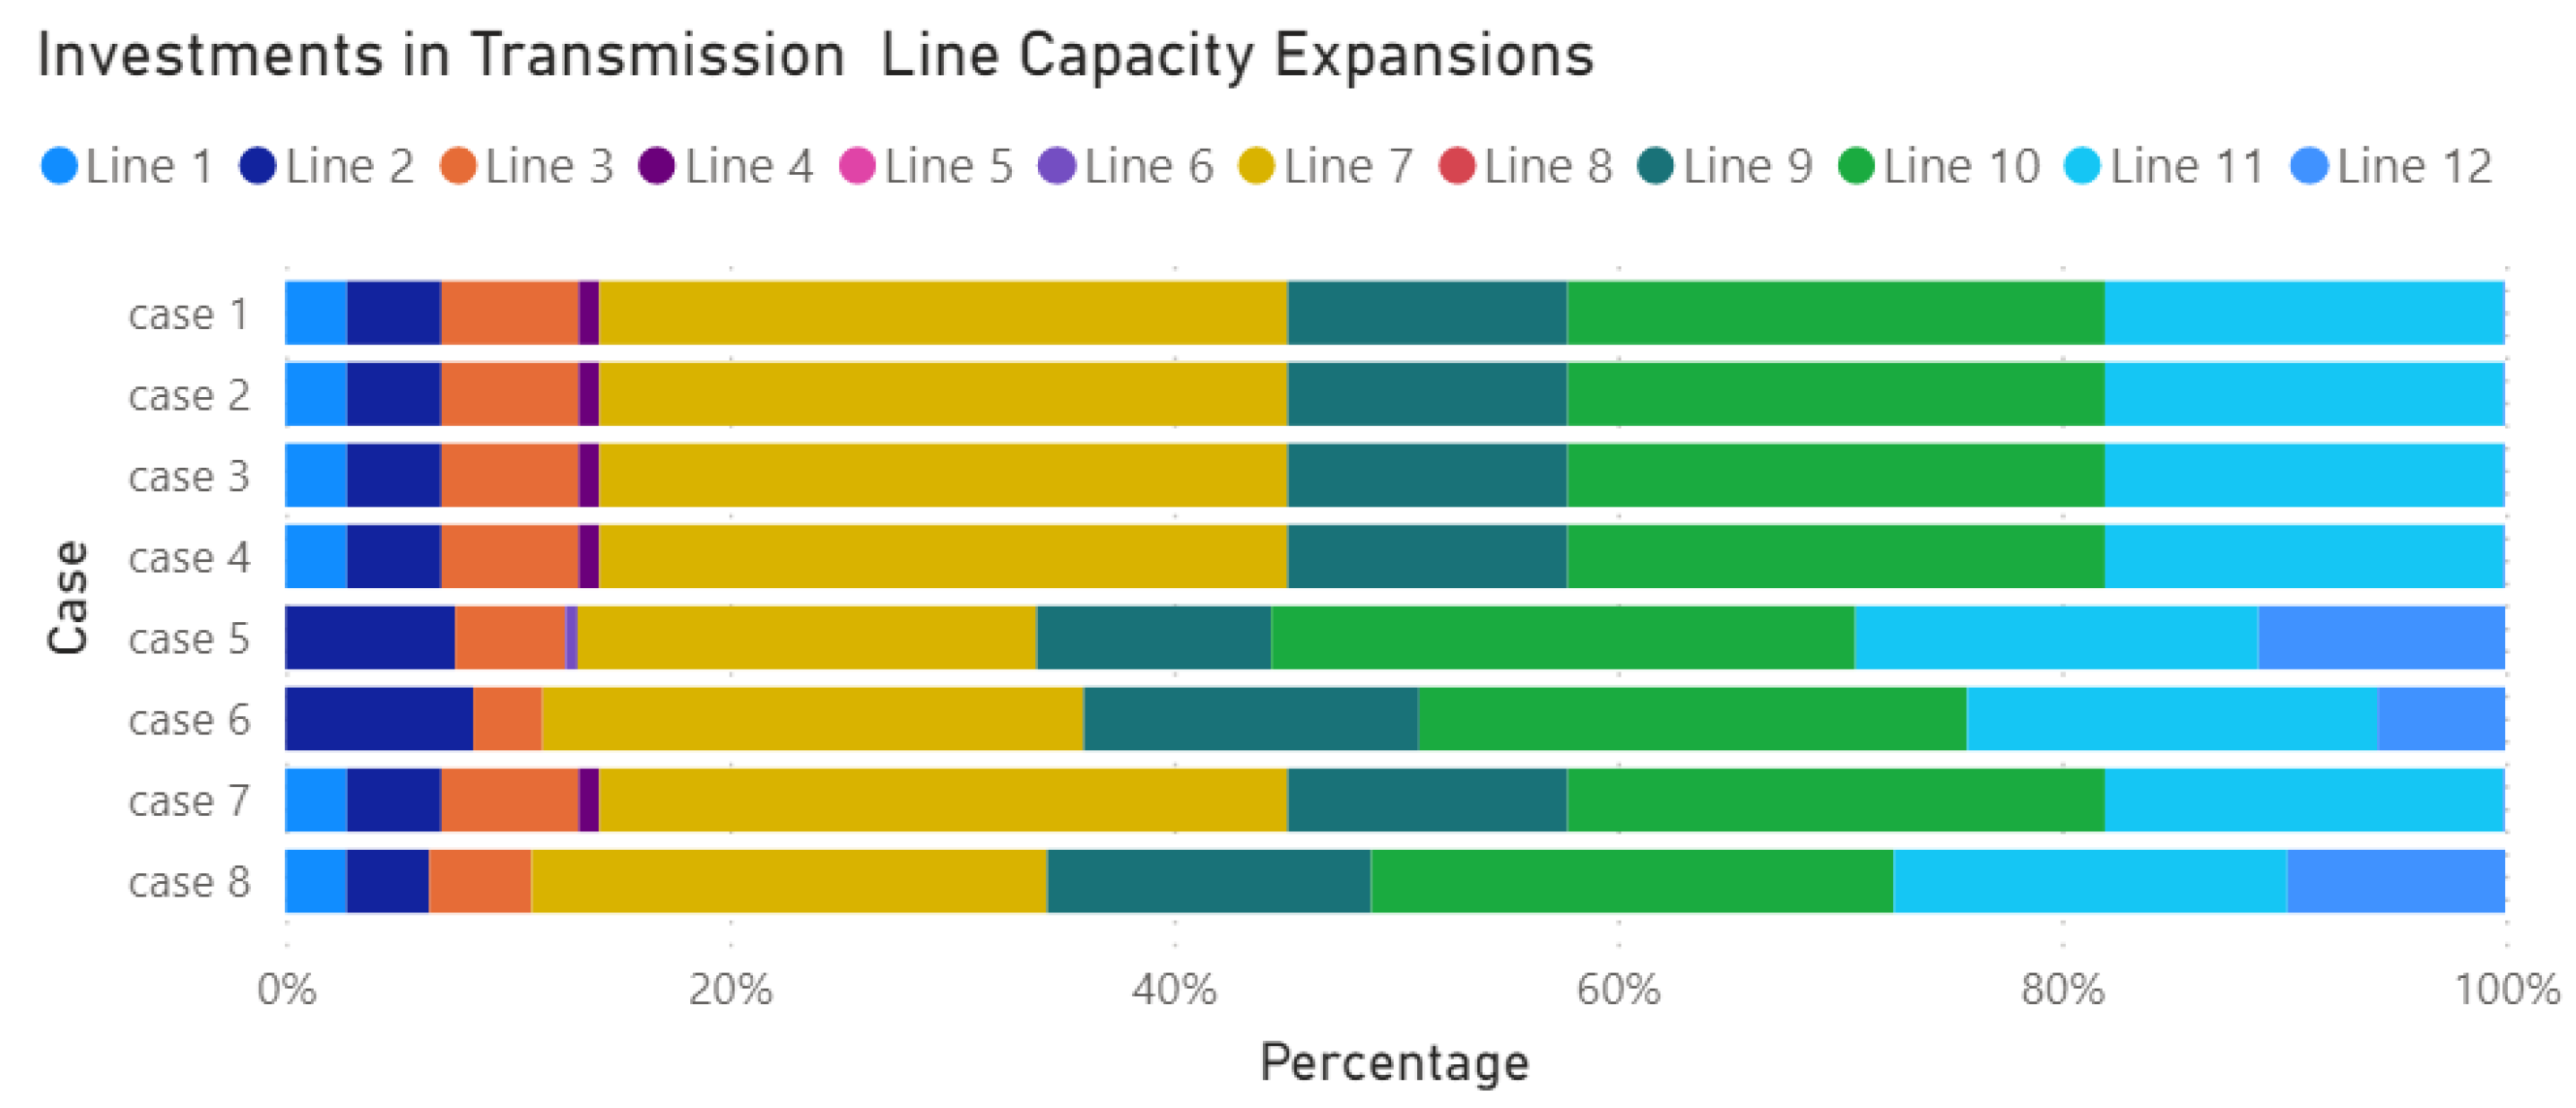
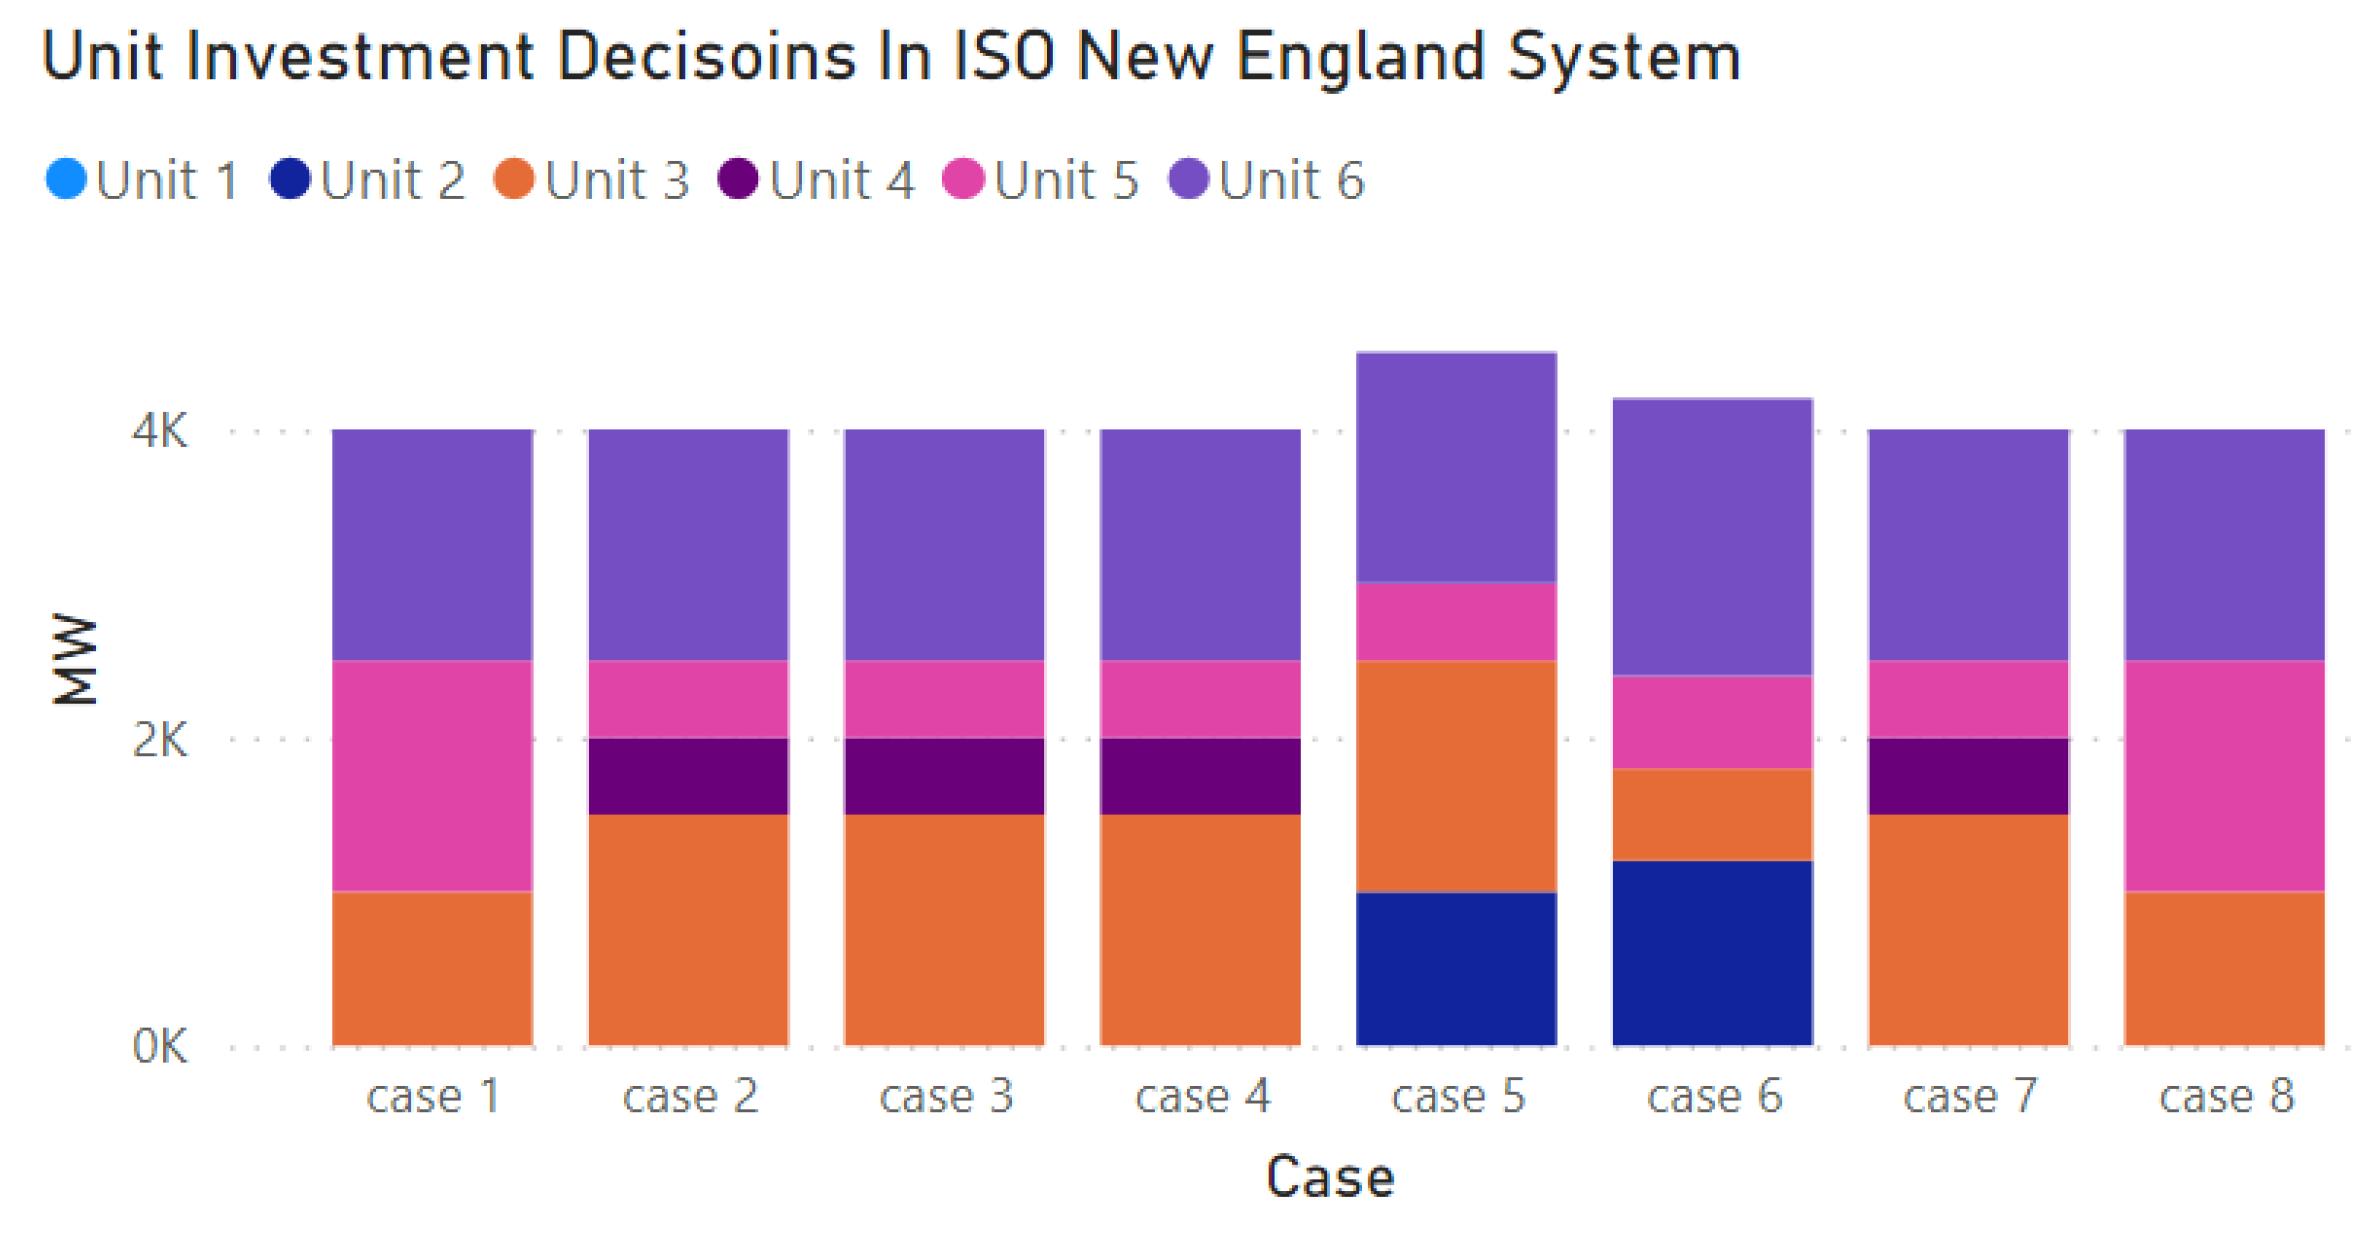
- Case 1 (Benchmark): the data summarized in Section 4.1 were used to form the benchmark case.
- Case 2: the investment costs of a natural gas pipeline capacity expansion are set 50% lower than in Case 1.
- Case 3: the investment costs of a resource capacity expansion are set 50% higher than in Case 1.
- Case 4: the investment costs of a transmission line capacity expansion are set 50% higher than in Case 1.
- Case 5: the installed capacities of the candidate natural gas pipelines are set 10% lower than in Case 1.
- Case 6: the installed capacities of the candidate generation units are set 20% higher than in Case 1.
- Case 7: the installed capacities of the candidate transmission lines are set 20% lower than in Case 1.
- Case 8: in Stage-1, the simulated loss of transmission lines is reduced by 66%.
4.3. Cost Sensitivity Analysis
4.4. Capacity Sensitivity Analysis
4.5. Load Curtailment Sensitivity
4.6. Operational Implications and Strategic Insights
5. Conclusions
Author Contributions
Funding
Data Availability Statement
Conflicts of Interest
Nomenclature
| Indices | |
| e | Index of existing generation units. |
| i | Index of candidate generation units. |
| j | Index of natural gas pipelines. |
| l | Index of transmission lines. |
| m | Index of natural gas system nodes. |
| n | Index of power system buses. |
| G | Index of generation companies. |
| Sets | |
| Set of candidate generation units. | |
| Set of fixed generation units. | |
| Set of candidate transmission lines. | |
| Set of candidate gas pipelines. | |
| Constants | |
| Parameters of the candidate generation operational cost function of unit i. | |
| Generation capacity of unit i available before Level-2. | |
| Annual unit cost of investment in capacity expansion for candidate generation unit i. | |
| Annual unit cost of investment in capacity expansion for gas pipeline j. | |
| Annual unit cost of investment in capacity expansion for transmission line l. | |
| Initial/maximum capacity of transmission line l. | |
| Initial/maximum capacity of gas pipeline j. | |
| M | Large constant. |
| Power transfer distribution factor associated with line l with respect to unit injection/withdrawal at bus n. | |
| Size of the step used to discretize generation capacity i. | |
| Inelastic demand at bus n. | |
| Parameter used to the discretize generation capacity expansion associated with the number of binary variables. The total number of binary variables is . | |
| Variables | |
| Thermal capacity limit of transmission line after decisions have been made at Level-1. This remains constant for Level-2 and Level-3. | |
| Capacity limit of gas pipeline after decisions have been made at Level-1. This remains constant for Level-2 and Level-3. | |
| Generation capacity available at node after decisions have been made at Level-2. | |
| Power generated by existing generation units. | |
| Power generated by candidate generation units. | |
| Import/export power from/to bus i. | |
| Natural gas extracted from node m. | |
| Natural gas flow through pipeline j. | |
| Expansion equilibrium strategies for all GENCOs. | |
| Each equilibrium strategy renders more revenue than any other one. | |
| Other GENCOs are considered constants in their equilibrium strategies. | |
| Dual Variables | |
| Dual variable related to constraint . | |
| Dual variable related to the nodal natural gas flow balance constraint. | |
| Dual variable of the thermal capacity bounds of transmission line l. | |
| Dual variable of the capacity bounds of gas pipeline j. | |
| Dual variable of the operating range for existing unit e. | |
| Dual variable of the gas balance equation at node m. | |
| Locational marginal price reflecting the dual variable of the electricity balance equation at bus n. | |
| Dual variable of the production capacity for gas source m. | |
| Dual variable of the production operating range for candidate resource i. | |
| Ancillary Variables | |
| Binary variables from the Fortuny-Amat linearization at Level-3. | |
| Binary variable that is equal to 1 if the kth step of the discretization of is considered and is equal to 0 otherwise. | |
| Product of by . | |
| Product of by . |
Appendix A
References
- Wang, C.; Ju, P.; Wu, F.; Pan, X.; Wang, Z. A systematic review on power system resilience from the perspective of generation, network, and load. Renew. Sustain. Energy Rev. 2022, 167, 112567. [Google Scholar] [CrossRef]
- Xu, Y.; Huang, C.; Li, X.; Li, F. A Novel Automatic Generation Control for Thermal and Gas Power Plants. In Proceedings of the 2018 IEEE Power Energy Society General Meeting (PESGM), Portland, OR, USA, 5–10 August 2018; pp. 1–5. [Google Scholar]
- Wang, X.; McDonald, J.R. Modern Power System Planning; McGraw-Hill: NewYork, NY, USA, 1994. [Google Scholar]
- Yao, Y.; Edmunds, T.; Papageorgiou, D.; Alvarez, R. Trilevel Optimization in Power Network Defense. IEEE Trans. Syst. Man Cybern. Part C Appl. Rev. 2007, 37, 712–718. [Google Scholar] [CrossRef]
- Zhang, X.; Shahidehpour, M.; Alabdulwahab, A.; Abusorrah, A. Security-constrained co-optimization planning of electricity and natural gas transportation infrastructures. IEEE Trans. Power Syst. 2015, 30, 2984–2993. [Google Scholar] [CrossRef]
- Zhang, X.; Che, L.; Shahidehpour, M.; Alabdulwahab, A.; Abusorrah, A. Reliability-Based Optimal Planning of Electricity and Natural Gas Interconnections for Multiple Energy Hubs. IEEE Trans. Smart Grid 2017, 8, 1658–1667. [Google Scholar] [CrossRef]
- Zhang, X.; Che, L.; Shahidehpour, M.; Alabdulwahab, A.; Abusorrah, A. Electricity-Natural Gas Operation Planning with Hourly Demand Response for Deployment of Flexible Ramp. IEEE Trans. Sustain. Energy 2016, 7, 996–1004. [Google Scholar] [CrossRef]
- Kamalinia, S.; Wu, L.; Shahidehpour, M. Stochastic Midterm Coordination of Hydro and Natural Gas Flexibilities for Wind Energy Integration. IEEE Trans. Sustain. Energy 2014, 5, 1070–1079. [Google Scholar] [CrossRef]
- He, C.; Wu, L.; Liu, T.; Shahidehpour, M. Robust Co-Optimization Scheduling of Electricity and Natural Gas Systems via ADMM. IEEE Trans. Sustain. Energy 2017, 8, 658–670. [Google Scholar] [CrossRef]
- Fang, J.; Zeng, Q.; Ai, X.; Chen, Z.; Wen, J. Dynamic Optimal Energy Flow in the Integrated Natural Gas and Electrical Power Systems. IEEE Trans. Sustain. Energy 2018, 9, 188–198. [Google Scholar] [CrossRef]
- Nourollahi, R.; Gholizadeh-Roshanagh, R.; Feizi-Aghakandi, H.; Zare, K.; Mohammadi-Ivatloo, B. Power distribution expansion planning in the presence of wholesale multimarkets. IEEE Syst. J. 2022, 17, 1684–1693. [Google Scholar] [CrossRef]
- Hakimi, S.M.; Hasankhani, A.; Shafie-khah, M.; Catalão, J.P. Stochastic planning of a multi-microgrid considering integration of renewable energy resources and real-time electricity market. Appl. Energy 2021, 298, 117215. [Google Scholar] [CrossRef]
- Jin, S.; Ryan, S.M. A Tri-Level Model of Centralized Transmission and Decentralized Generation Expansion Planning for an Electricity Market—Part I. IEEE Trans. Power Syst. 2014, 29, 132–141. [Google Scholar] [CrossRef]
- Gómez, S.; Olmos, L. Coordination of generation and transmission expansion planning in a liberalized electricity context—coordination schemes, risk management, and modelling strategies: A review. Sustain. Energy Technol. Assessments 2024, 64, 103731. [Google Scholar] [CrossRef]
- Asgharian, V.; Abdelaziz, M. A low-carbon market-based multi-area power system expansion planning model. Electr. Power Syst. Res. 2020, 187, 106500. [Google Scholar] [CrossRef]
- Dini, A.; Azarhooshang, A.; Pirouzi, S.; Norouzi, M.; Lehtonen, M. Security-Constrained generation and transmission expansion planning based on optimal bidding in the energy and reserve markets. Electr. Power Syst. Res. 2021, 193, 107017. [Google Scholar] [CrossRef]
- Maliszewski, P.J.; Perrings, C. Factors in the resilience of electrical power distribution infrastructures. Appl. Geogr. 2012, 32, 668–679. [Google Scholar] [CrossRef]
- Daeli, A.; Mohagheghi, S. Power grid infrastructural resilience against extreme events. Energies 2022, 16, 64. [Google Scholar] [CrossRef]
- He, C.; Zhang, X.; Liu, T.; Wu, L. Distributionally Robust Scheduling of Integrated Gas-Electricity Systems With Demand Response. IEEE Trans. Power Syst. 2019, 34, 3791–3803. [Google Scholar] [CrossRef]
- Fortuny-Amat, J.; McCarl, B. A representation and economic interpretation of a two-level programming problem. J. Oper. Res. Soc. 1981, 32, 783–792. [Google Scholar] [CrossRef]
- IBM. Getting Started with CPLEX for MATLAB Version 12.4; IBM Corp.: Armonk, NY, USA, 2014. [Google Scholar]
- Chen, Z.; Wu, M.; Zhao, Z. Evaluations of Aggregators and DERs in Distribution System Operations with Uncertainties. In Proceedings of the 2018 IEEE International Conference on Probabilistic Methods Applied to Power Systems (PMAPS), Boise, ID, USA, 24–28 June 2018; pp. 1–6. [Google Scholar] [CrossRef]
- Kazempour, S.J.; Conejo, A.J.; Ruiz, C. Strategic Bidding for a Large Consumer. IEEE Trans. Power Syst. 2015, 30, 848–856. [Google Scholar] [CrossRef]
- Pereira, M.V.; Granville, S.; Fampa, M.H.; Dix, R.; Barroso, L.A. Strategic bidding under uncertainty. IEEE Trans. Power Syst. 2005, 20, 180–188. [Google Scholar] [CrossRef]
- Zeng, B.; Zhao, L. Solving two-stage robust optimization problems using a column-and-constraint generation method. Oper. Res. Lett. 2013, 41, 457–461. [Google Scholar] [CrossRef]
- Eight Zone Test Bed. Available online: https://bitbucket.org/kdheepak/eightbustestbedrepo/src/master/ (accessed on 11 April 2024).
- Zhao, B.; Conejo, A.J.; Sioshansi, R. Coordinated Expansion Planning of Natural Gas and Electric Power Systems. IEEE Trans. Power Syst. 2018, 33, 3064–3075. [Google Scholar] [CrossRef]
- Energy, Load, and Demand Reports. Available online: https://www.iso-ne.com/isoexpress/web/reports/load-and-demand/-/tree/zone-info (accessed on 11 April 2024).
- Natural Gas Consumption by End Use. Available online: https://www.eia.gov/dnav/ng/ng_cons_sum_a_EPG0_vgt_mmcf_m.htm (accessed on 11 April 2024).


| Objective Function Value [USD Billion] | Investment Cost [USD Billion] | Operating Cost [USD Million] | |
|---|---|---|---|
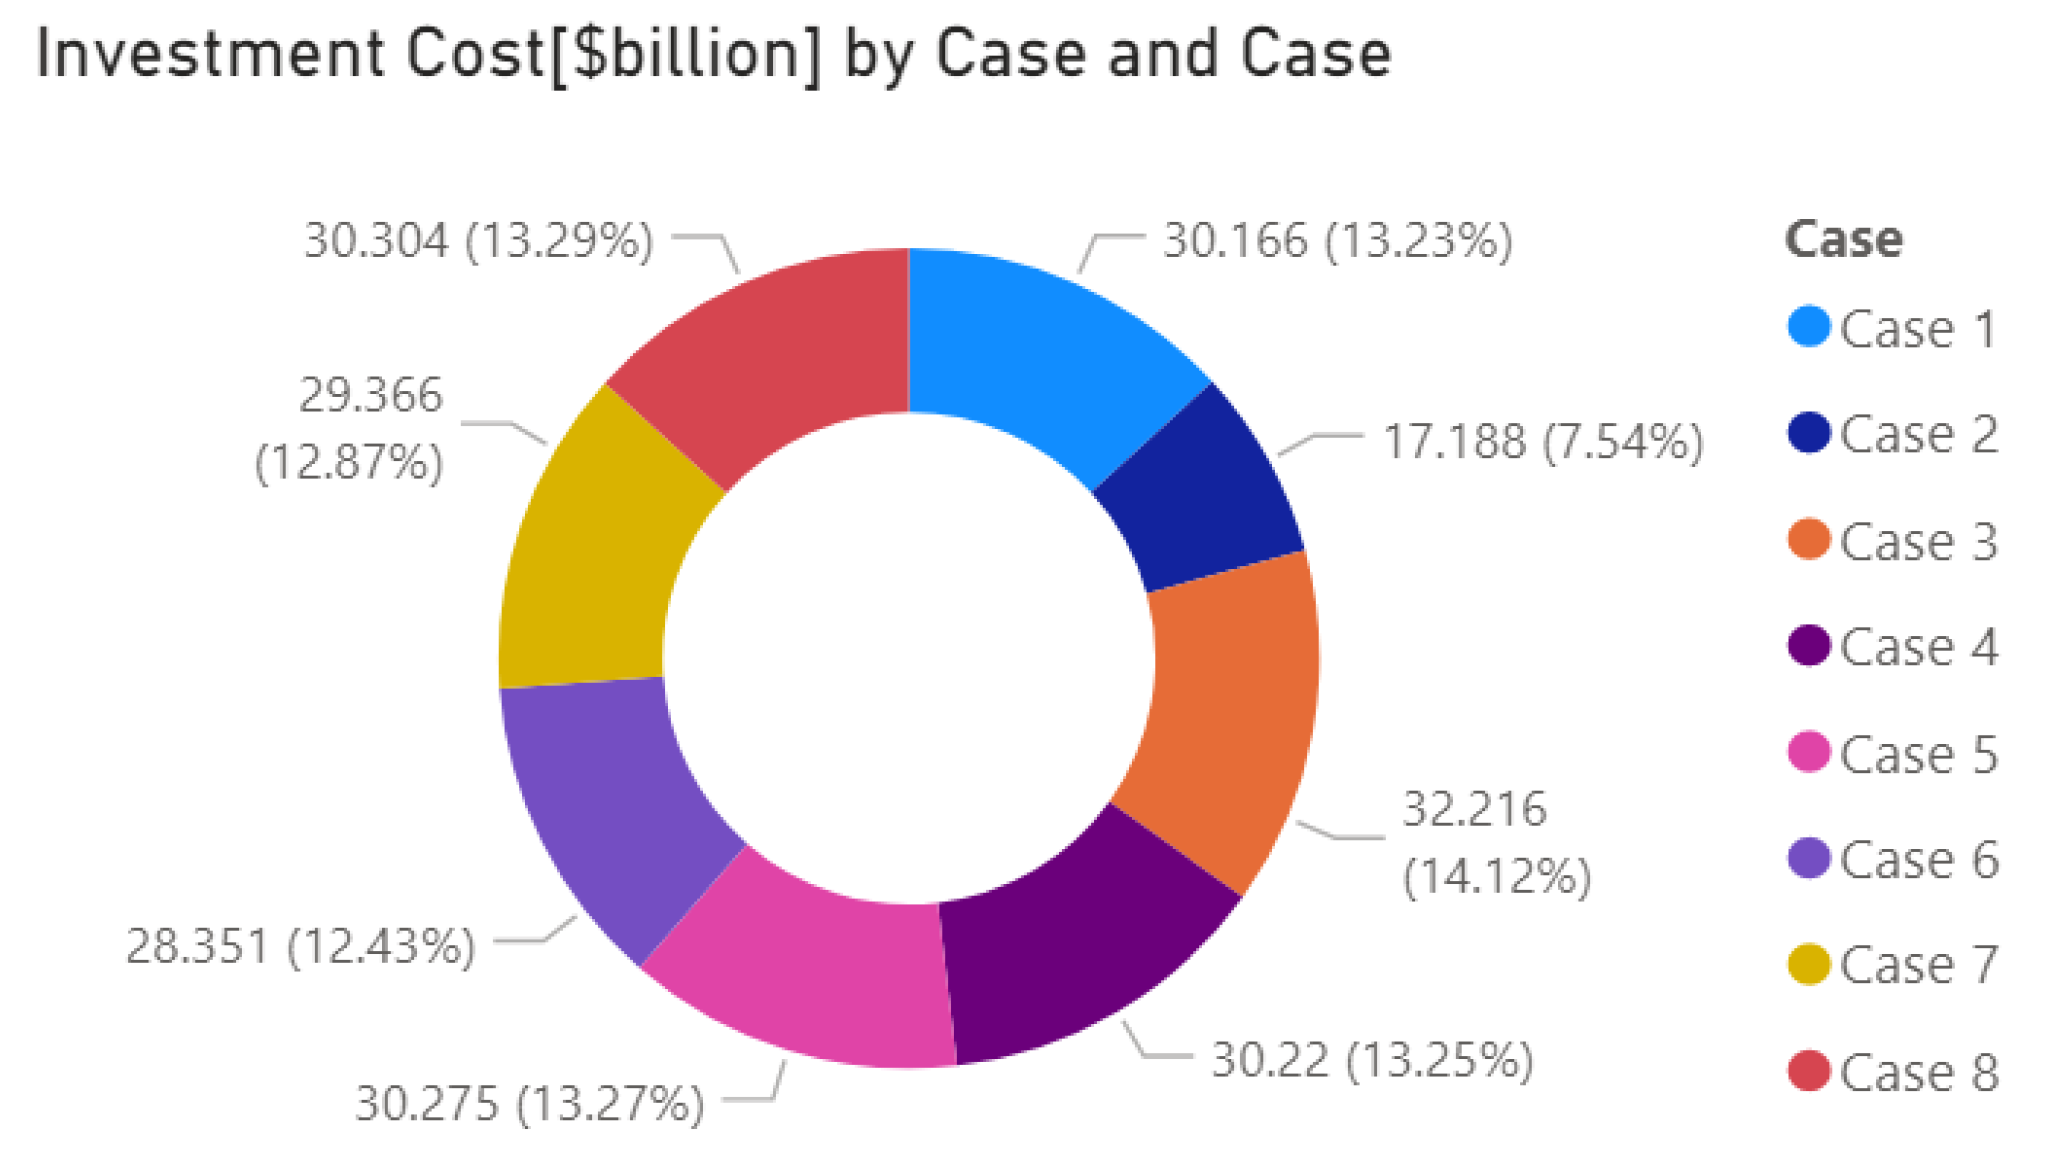
| Case 1 | 30.167 | 30.166 | 1.343 |
| Case 2 | 17.189 | 17.188 | 1.343 |
| Case 3 | 32.217 | 32.216 | 1.343 |
| Case 4 | 30.222 | 30.22 | 1.343 |
| Case 5 | 30.276 | 30.275 | 1.283 |
| Case 6 | 28.352 | 28.351 | 1.383 |
| Case 7 | 29.367 | 29.366 | 1.343 |
| Case 8 | 30.305 | 30.304 | 1.303 |
Disclaimer/Publisher’s Note: The statements, opinions and data contained in all publications are solely those of the individual author(s) and contributor(s) and not of MDPI and/or the editor(s). MDPI and/or the editor(s) disclaim responsibility for any injury to people or property resulting from any ideas, methods, instructions or products referred to in the content. |
© 2024 by the authors. Licensee MDPI, Basel, Switzerland. This article is an open access article distributed under the terms and conditions of the Creative Commons Attribution (CC BY) license (https://creativecommons.org/licenses/by/4.0/).
Share and Cite
Pan, W.; Li, Y.; Guo, Z.; Zhang, Y. Interdependent Expansion Planning for Resilient Electricity and Natural Gas Networks. Processes 2024, 12, 775. https://doi.org/10.3390/pr12040775
Pan W, Li Y, Guo Z, Zhang Y. Interdependent Expansion Planning for Resilient Electricity and Natural Gas Networks. Processes. 2024; 12(4):775. https://doi.org/10.3390/pr12040775
Chicago/Turabian StylePan, Weiqi, Yang Li, Zishan Guo, and Yuanshi Zhang. 2024. "Interdependent Expansion Planning for Resilient Electricity and Natural Gas Networks" Processes 12, no. 4: 775. https://doi.org/10.3390/pr12040775
APA StylePan, W., Li, Y., Guo, Z., & Zhang, Y. (2024). Interdependent Expansion Planning for Resilient Electricity and Natural Gas Networks. Processes, 12(4), 775. https://doi.org/10.3390/pr12040775