Article

Development and Process Optimization of a Steamed Fish Paste Cake Prototype for Room Temperature Distribution

1
Department of Seafood Science and Technology, Institute of Marine Industry, Gyeongsang National University, Tongyeong 53064, Republic of Korea
2
Seafood Research Center, IACF, Silla University, Busan 49277, Republic of Korea
3
Samjin Food Co., Ltd., Busan 49036, Republic of Korea
4
Department of Food Science and Culinary Arts, College of Health and Welfare, Silla University, Busan 46958, Republic of Korea
5
German Engineering Research and Development Center for Life Science Technologies in Medicine and Environment, Busan 46742, Republic of Korea
*
Authors to whom correspondence should be addressed.
These authors contributed equally to this work.
Processes 2024, 12(4), 795; https://doi.org/10.3390/pr12040795
Submission received: 18 March 2024 / Revised: 9 April 2024 / Accepted: 12 April 2024 / Published: 15 April 2024
(This article belongs to the Section Food Process Engineering)

Abstract

:
Surimi-based products typically demand cold storage and a cold chain distribution system, which not only affects their physical properties and flavor but also escalates production costs. In this study, we introduced a novel high-temperature and high-pressure retort processing method to enable room temperature storage and distribution of a surimi-based product, a fish paste cake. Our optimization efforts focused on refining the processing conditions for the fish paste cake. This included incorporating transglutaminase, sugar additives, natural herbal or seaweed extracts, and optimizing retort processing conditions to enhance textural properties, minimize browning and off flavor, and extend the shelf-life of the product. Our results demonstrated that the addition of 0.3% ACTIVA TG-K, 1.0% trehalose, and 0.5% sea tangle extract during the production process significantly enhanced the gel strength, minimized browning, and improved the overall flavor of the fish paste cake prototype. Importantly, the developed prototype exhibited favorable biochemical, textual, nutritional, and sensory properties, extending the shelf-life up to 160 days without compromising physical, chemical, or sensory attributes. In addition, the developed prototype exhibited improved elasticity, compared to control groups. The innovative process not only facilitates room temperature storage and distribution of surimi-based products but also holds potential for generating additional profits.

1. Introduction

Fish-paste products, also known as fish cakes or fish paste cakes, are produced from frozen surimi, a refined fish myofibrillar protein, popular in Korea, Japan, and China [1]. Surimi undergoes various processing steps, including heading, filling, mincing, washing, de-watering, refining, mixing with cryoprotectants, freezing, and metal detection for Hazard Analysis Critical Control Point (HACCP) compliance [2]. Its excellent gelling properties make it an ideal ingredient for products like fish cakes [1,3]. Recently, fish paste cake has emerged as a representative Korean food product (K-food), poised to drive growth in the domestic and international fishery industry markets. The Korean domestic fish paste cake market reached approximately KRW 1 trillion in 2018, with steady growth in retail store sales and anticipated increases in exports [4]. However, challenges persist in expanding both domestic and international markets, due to the short shelf-life of non-thermally sterilized fish cake products. Non-sterilized fish paste cakes typically have a distribution period of up to 10 days and require refrigerated transportation, limiting distribution channels (personal communication, Yongjoon Park, CEO Samjin Co., Ltd., Busan, Republic of Korea), and as it is an item that requires the application of the Cold Chain System (refrigerated distribution), there are many restrictions on distribution. Exporting these products requires freezing, which can lead to texture issues, such as sponginess during storage and dripping upon thawing [5,6]. Efforts have been made to develop room temperature-stable products through high-temperature and high-pressure sterilization processes [7,8,9]. However, such processes often result in softening and rapid browning of fish paste cakes, compromising sensory qualities. Furthermore, thawed fish cake products may experience nutrient loss, textural changes, and alterations in taste and appearance [10].
High-temperature and high-pressure sterilization can extend the shelf-life of cooked foods packed in retort pouches by 1 to 2 years, depending on the product [11,12]. Transglutaminase (TGs) enhances food texture by facilitating deamination, amine incorporation, and protein cross-linking [13]. Previous studies have utilized TGs to improve the gel strength and water-binding capacity of canned fish balls retorted at 116 °C for 30 min [14,15]. Panelists generally rated the appearance, color, flavor, texture, and overall liking of these products at a moderate level [15,16]. Notably, Muoi et al. [17] found that the addition of 0.7% TGs significantly enhanced the gel properties of fried fish cakes made from frozen snakehead fish surimi, while dos Santos et al. [18] reported improved textural and sensory properties in soy-based hybrid sausages with the addition of 0.25% TGs. In this study, we aimed to enhance the storage characteristics of fish paste cake using high-temperature and high-pressure processing, while minimizing associated decreases in physical properties by incorporating edible TGs. Additionally, we sought to optimize sterilization conditions to minimize damage to actomyosin, a key protein in fish cake products.
Maillard reactions during food processing can alter protein digestibility, functionality, and organoleptic properties, affecting food color [19]. Controlling Maillard reactions is crucial for maintaining desirable food quality, especially during production and storage. Sugar additives, such as glucose, sucrose, and trehalose, are commonly added during high-pressure processing to prevent discoloration and extend shelf-life [19,20]. Trehalose, in particular, is favored for its superior stabilization properties [21,22,23]. As a non-reducing disaccharide composed of two glucose molecules linked by an α, α-1,1 linkage [24], trehalose serves as a stabilizer and protectant against protein denaturation caused by various stress conditions [25,26]. To prevent browning of steamed fish paste cake during high-temperature and high-pressure treatment, we opted for trehalose instead of sucrose.
Off flavors and odors in food products, induced by factors such as heat, desiccation, and oxidation, can compromise sensory properties, nutritional aspects, and overall food quality. Yamazawa et al. [27] observed browning and off-flavors in Kamaboko, a processed seafood product, when retorted at temperatures exceeding 115 °C. Driven by consumer preferences, interest in natural additives derived from herbs and seaweed is growing [1,28,29]. Therefore, we incorporated various herbal and seaweed extracts during fish cake processing, to mitigate off-flavors and enhance overall sensory perception.
In this study, we developed a prototype of steamed fish paste cake suitable for room temperature distribution. By utilizing TGs to maintain elasticity, trehalose to prevent browning, and herbal extracts to enhance flavor, we aimed to address the deterioration of physical properties associated with high-temperature and high-pressure processing, while improving sensory attributes.

2. Materials and Methods

2.1. Materials

Basil and bay leaf were sourced from Solpyofood Co., Ltd., Namyangju, Republic of Korea. Coriander was purchased from Dobe Co., Ltd., Gunpo, Republic of Korea. Green tea powder was purchased from Danongwon Co., Ltd., Eumseong, Republic of Korea. Dried sea tangle (Saccharina japonica) was purchased from Jeilmulsan Co., Ltd., Wando, Republic of Korea. Frozen Alaska Pollock (Gadus chalcogrammus) surimi (AA grade) was procured from Westward seafood Inc., Bellevue, WA, USA. Refined salt was purchased from Solar salt Co., Ltd., Gwangju, Republic of Korea. Sugar was purchased from Cheil Jedang Co., Ltd., Seoul, Republic of Korea. Potato starch was purchased from Dongafood Co., Ltd., Ulsan, Republic of Korea. Tapioca starch was purchased from Moafood Co., Ltd., Gwangju, Republic of Korea. Fish meat extract was procured from Jinsung FM Co., Hwaseong, Republic of Korea. Sodium glutamate was purchased from Cheil Jedang, Jakarta, Indonesia. Egg white powder was purchased from Eurovo SRL Co., Ltd., Emilia-Romagna, Italy. Glycine was purchased from Hebei huayang biological technology Co., Ltd., Hengshui, China. Phosphate complex was purchased from Polymix, Seodo bni Co., Ltd., Hwaseong, Republic of Korea. ACTIVA TG-K was purchased from Ajinomoto, Tokoy, Japan. Trehalose was purchased from Tongliao meihua biological technology Co., Ltd., Langfang, China; glucose from Q-1 Co., Ltd., Seoul, Republic of Korea; D-xylose from Healtang biotech Co., Ltd., Jinan, China; and sucrose from Cheil Jedang Co., Ltd., Seoul, Republic of Korea. The plain film used for measuring gel strength was purchased from Type-EDL Clear, Krehalon Flim, KUREHA Corporation, Tokyo, Japan. Materials for gel electrophoresis were purchased from Bio-Rad, Hercules, CA, USA. Dry films for bacterial analysis were sourced from 3 M Co., Ltd., Saint Paul, MN, USA. Sasa-kamaboko (ささ-かまぼこ in Japanese; Sanriku Fish Paste Co., Ltd., Kesennuma, Japan) and the steam fish original (Daekwang F & C Co., Ltd., Busan, Republic of Korea) were used as control 1 and 2, respectively.

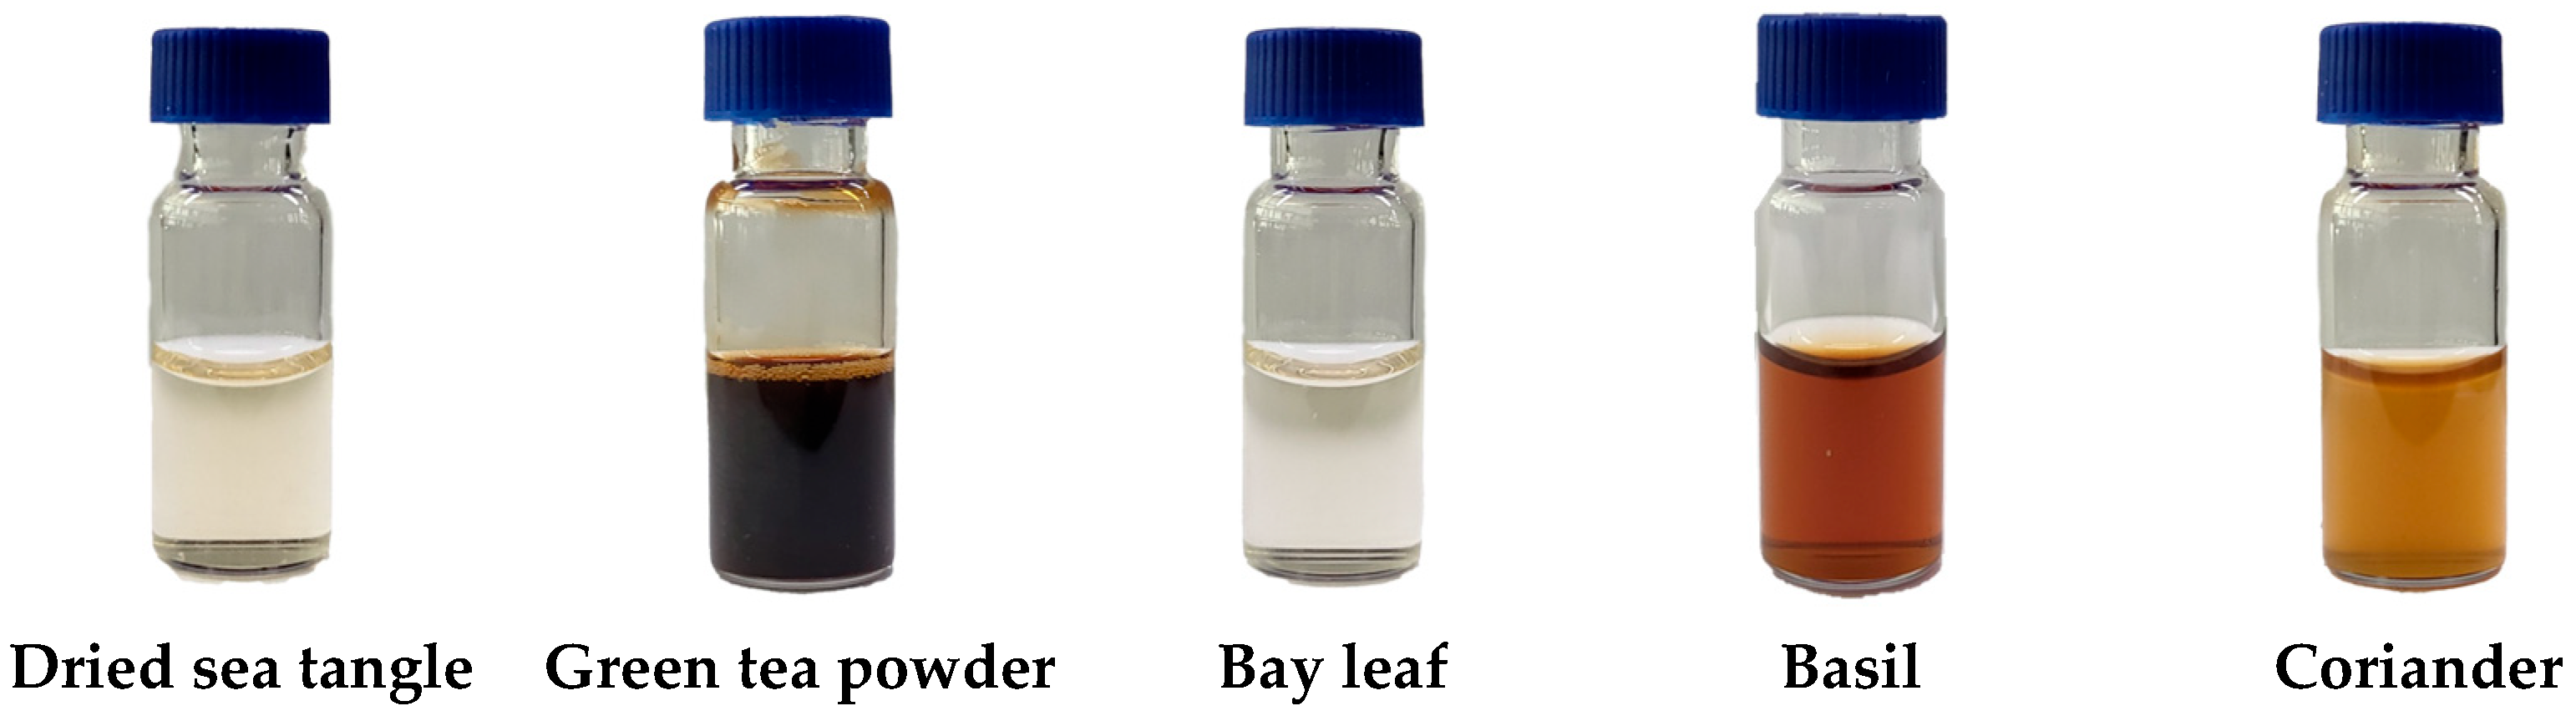
2.2. Manufacturing Herbal Extracts

Each herb (basil, bay leaf, or coriander), or seaweed (dried sea tangle) was mixed with drinking water at a ratio of 1:3 and cooked in an induction cooktop (IH101PIN01; Rinnai Co., Ltd., Incheon, Republic of Korea) for 10 min at 100 °C. In the case of herbal extract using green tea powder, the mixture was cooked at 80 °C instead of 100 °C. The extracts were cooled to room temperature, and then filtered through a 10-mesh sieve before use.

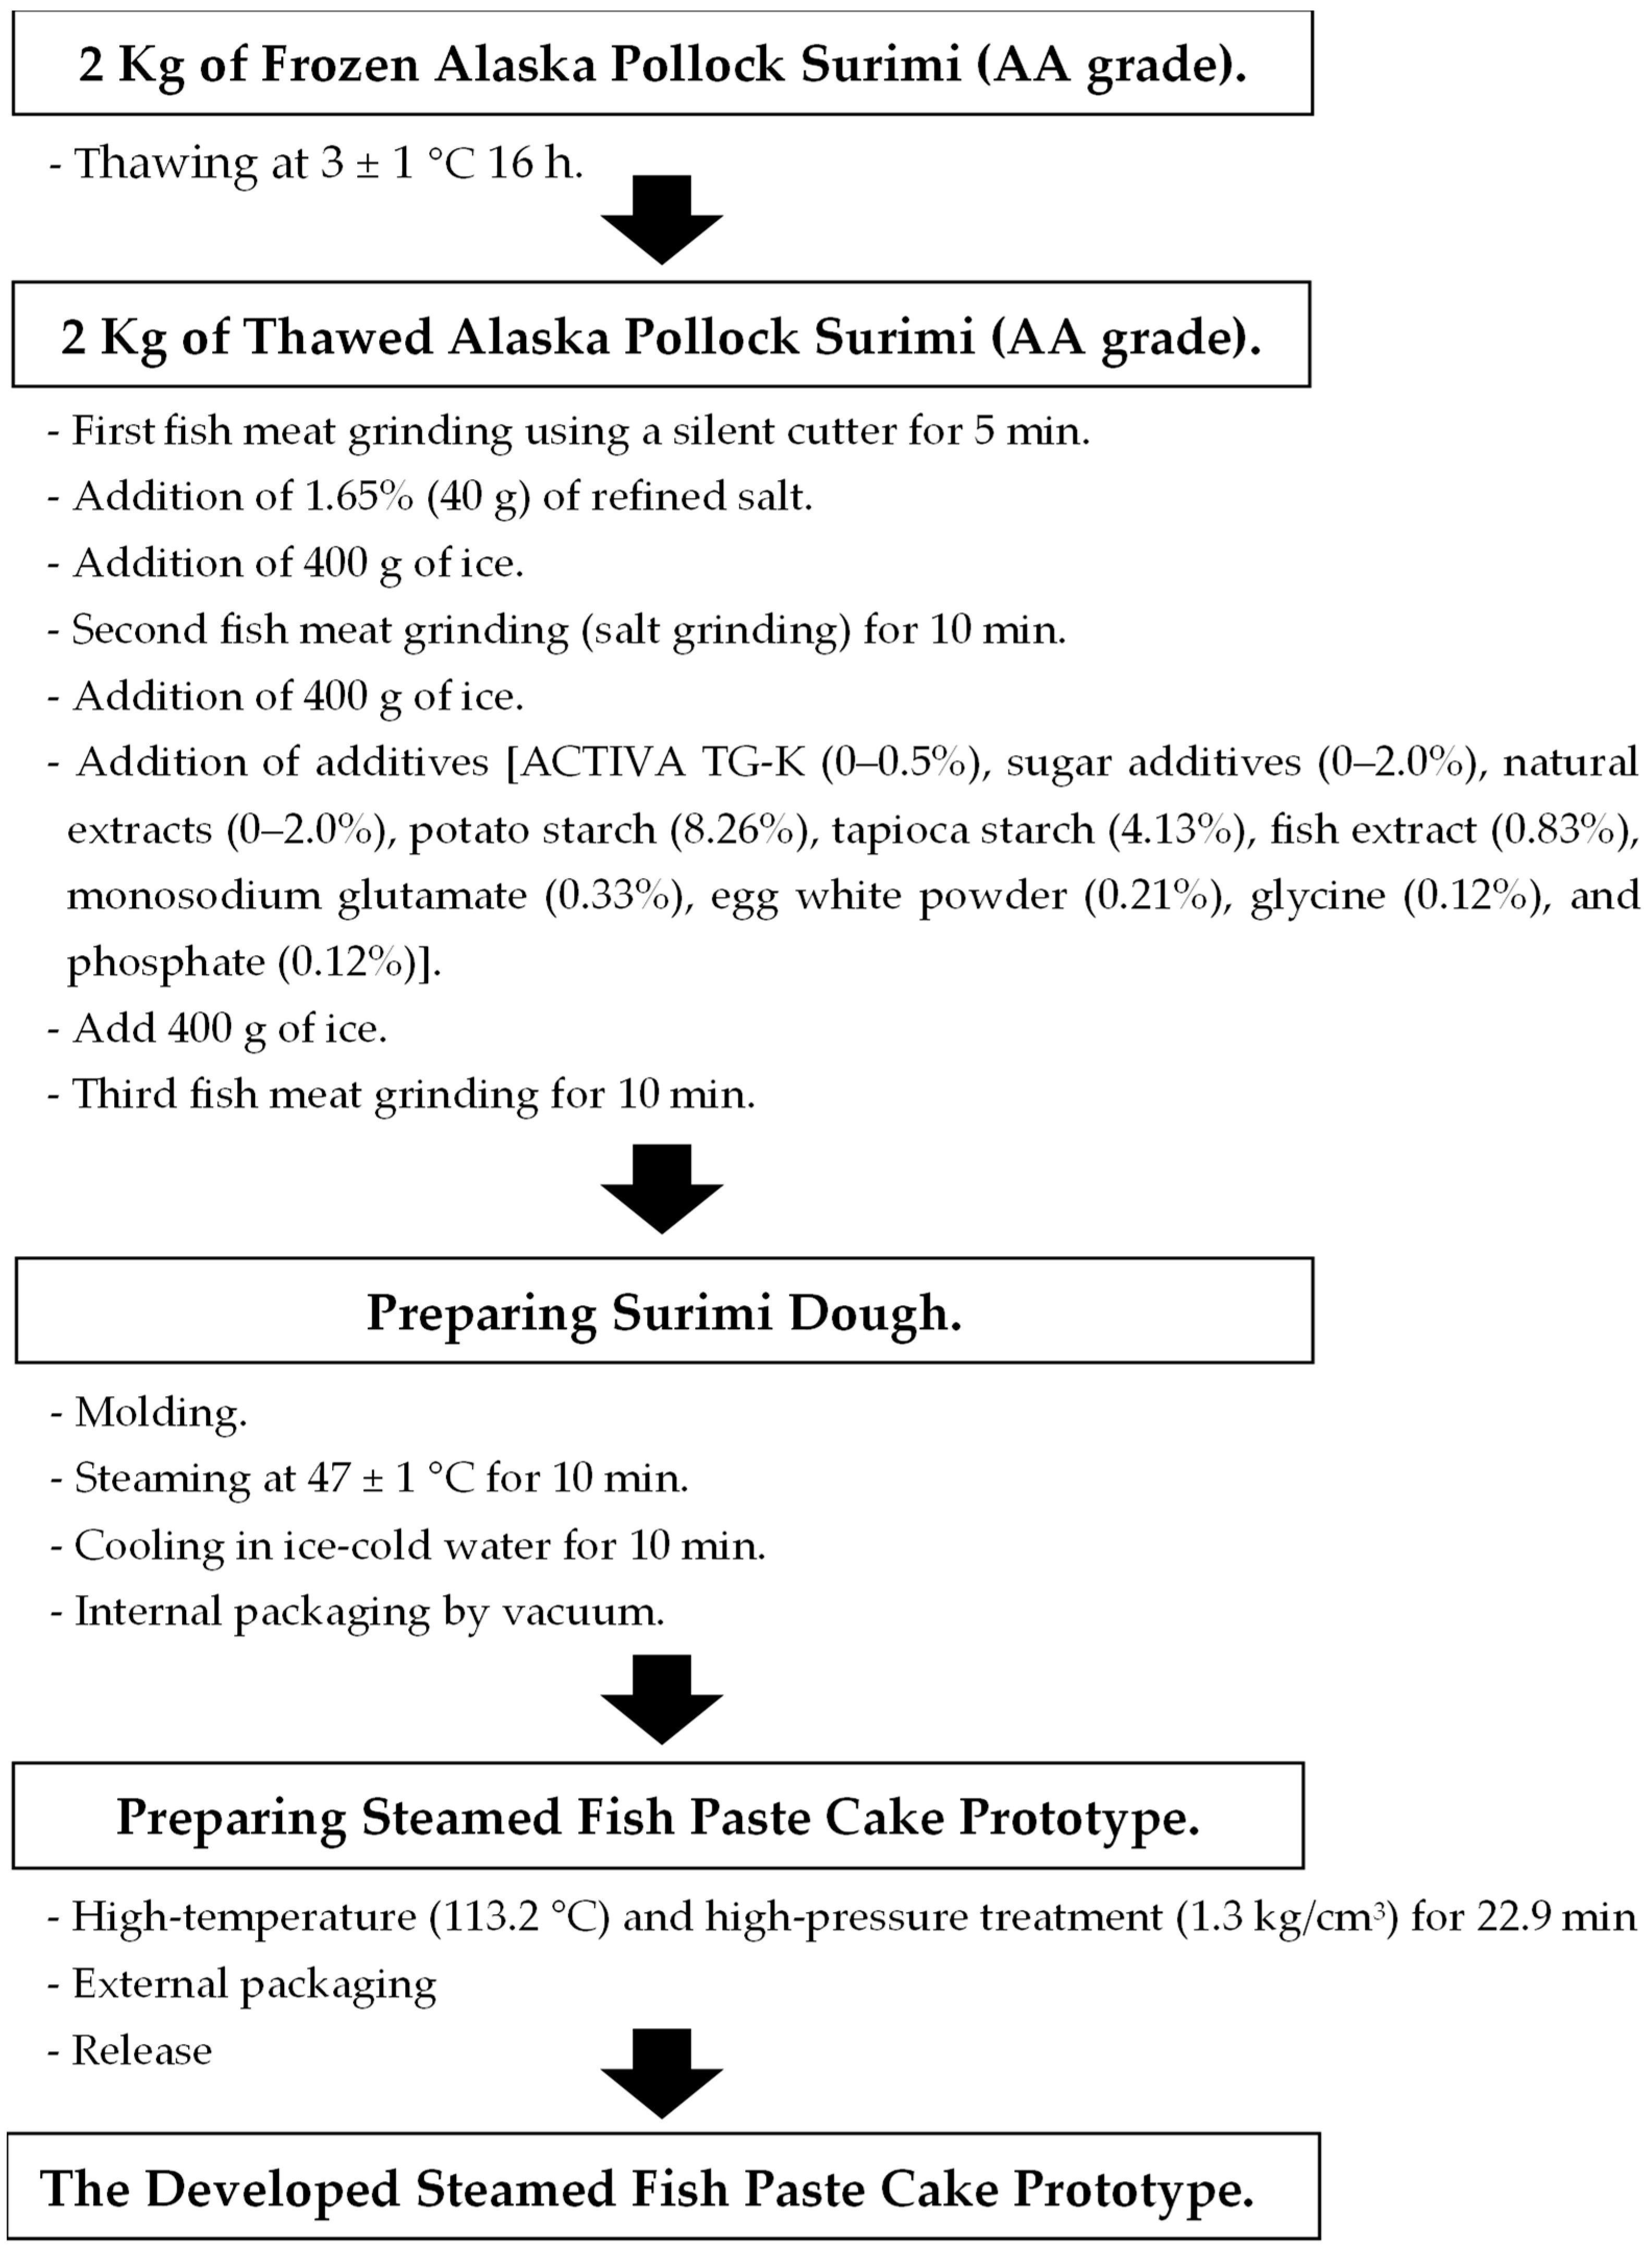
2.3. Manufacturing Steamed Fish Paste Cake

Steamed fish paste cakes were prepared following the procedure depicted in Figure 1. Alaska Pollock surimi served as the primary ingredient for preparing the fish cakes. These cakes were steamed using a steamer machine (CHDC–500, Chungha Machinery Co., Ltd., Busan, Republic of Korea), then vacuum packed utilizing a vacuum packer (TPS-V75, MAPPACK, Hwaseong, Gyeonggi-do, Republic of Korea), and finally subjected to retort sterilization (Retort sterilization, PRS-06-I, KYUNGHAN Co., Ltd., Gyeongsan, Republic of Korea) at high temperatures, ranging from 107.9–122.1 °C, along with pressures of 1.3 kg/cm2, for a duration spanning 22.9 to 37.1 min.

2.4. Optimization of Fish Paste Cake Processing Conditions

2.4.1. Texture Improvement by Optimizing the Amount of Edible TGs

In a preliminary experiment, the fish meat paste was mixed with 0.3% of ACTIVA TG-K, TG-K, or TG-BH, the commercially available transglutaminases (TGs), during the third grinding process, and their textural properties were assessed. ACTIVA TG-K demonstrated superior textural properties, compared to other TGs (data not shown). Based on this result, the fish paste cake prototype exhibiting best textural properties was chosen for further experimentation, incorporating ACTIVA TG-K at concentrations of 0.0%, 0.1%, 0.3%, and 0.5%. The mixed fish meat paste was shaped into sausages, steamed, and retorted. The gel strength of each steamed fish paste cake prototype containing different concentrations of ACTIVA TG-K was measured using a texture analyzer (CT3-1000, AMETEK Brookfield, Middleboro, MA, USA). The optimal concentration of ACTIVA TG-K, providing the desired elasticity (gel strength), was selected for the preparation of the steamed fish paste cake prototype.

2.4.2. Minimizing Browning by Optimizing Selection and Mixing Ratio of Sugars

The retort process of steamed fish paste cake generally causes browning due to the Maillard reaction [30,31,32]. To minimize the browning phenomenon, 0.7% of trehalose, glucose, D-xylose, or sucrose, was added in the steamed fish paste and a steamed fish paste cake prototype was prepared, as illustrated in Figure 1. Color of each steamed fish paste cake prototype containing different sugar additives was monitored using color difference meter (CM-700d Spectrophotometer; Konica Minolta Sensing, Inc., Tokyo, Japan). The prototype showing better color change suppression effect was further prepared, adding the respective sugar additive at a concentration of 0.0%, 0.5%, 1.5%, and 2.0%. Among these, the sample showing best color change suppression effect and elasticity was selected and used for further experiments.

2.4.3. Reducing Off-Flavor by Optimizing Mixing Conditions for Natural Extracts

Each natural herbal (basil, Bay leaf, coriander, or green tea) or seaweed (sea tangle) extract was added to the steamed fish paste at a concentration of 2.0% (w/w), as shown in Figure 1, and the color and off-flavor (sensory properties) of prepared fish cake prototypes were investigated. Among these, the herbal or seaweed extract showing best off-flavor suppression and sensory properties was further supplemented to the fish paste cakes at concentrations of 0.0%, 0.5%, 1.0%, 1.5%, and 2.0%, and the best appropriate concentration of the respective extract for the final fish paste cake prototype was checked by sensory evaluation.

2.4.4. Optimizing Retort Processing Conditions

To check the effect of retort process on shelf-life extension of the steamed fish paste cake prototype, temperature (X1: 107.9–122.1 °C) and time (X2: 22.9–37.1 min) of the retort process was decided according to the central composite design, as shown in Table S1. A total of eleven samples, as shown in Table S2, were randomly selected by coding in five stages. The retort sterilization of the fish paste cake was done using the high-temperature and high-pressure retort sterilizer (PRS-06-1, Kyunghan Co., Ltd., Changwon, Republic of Korea).

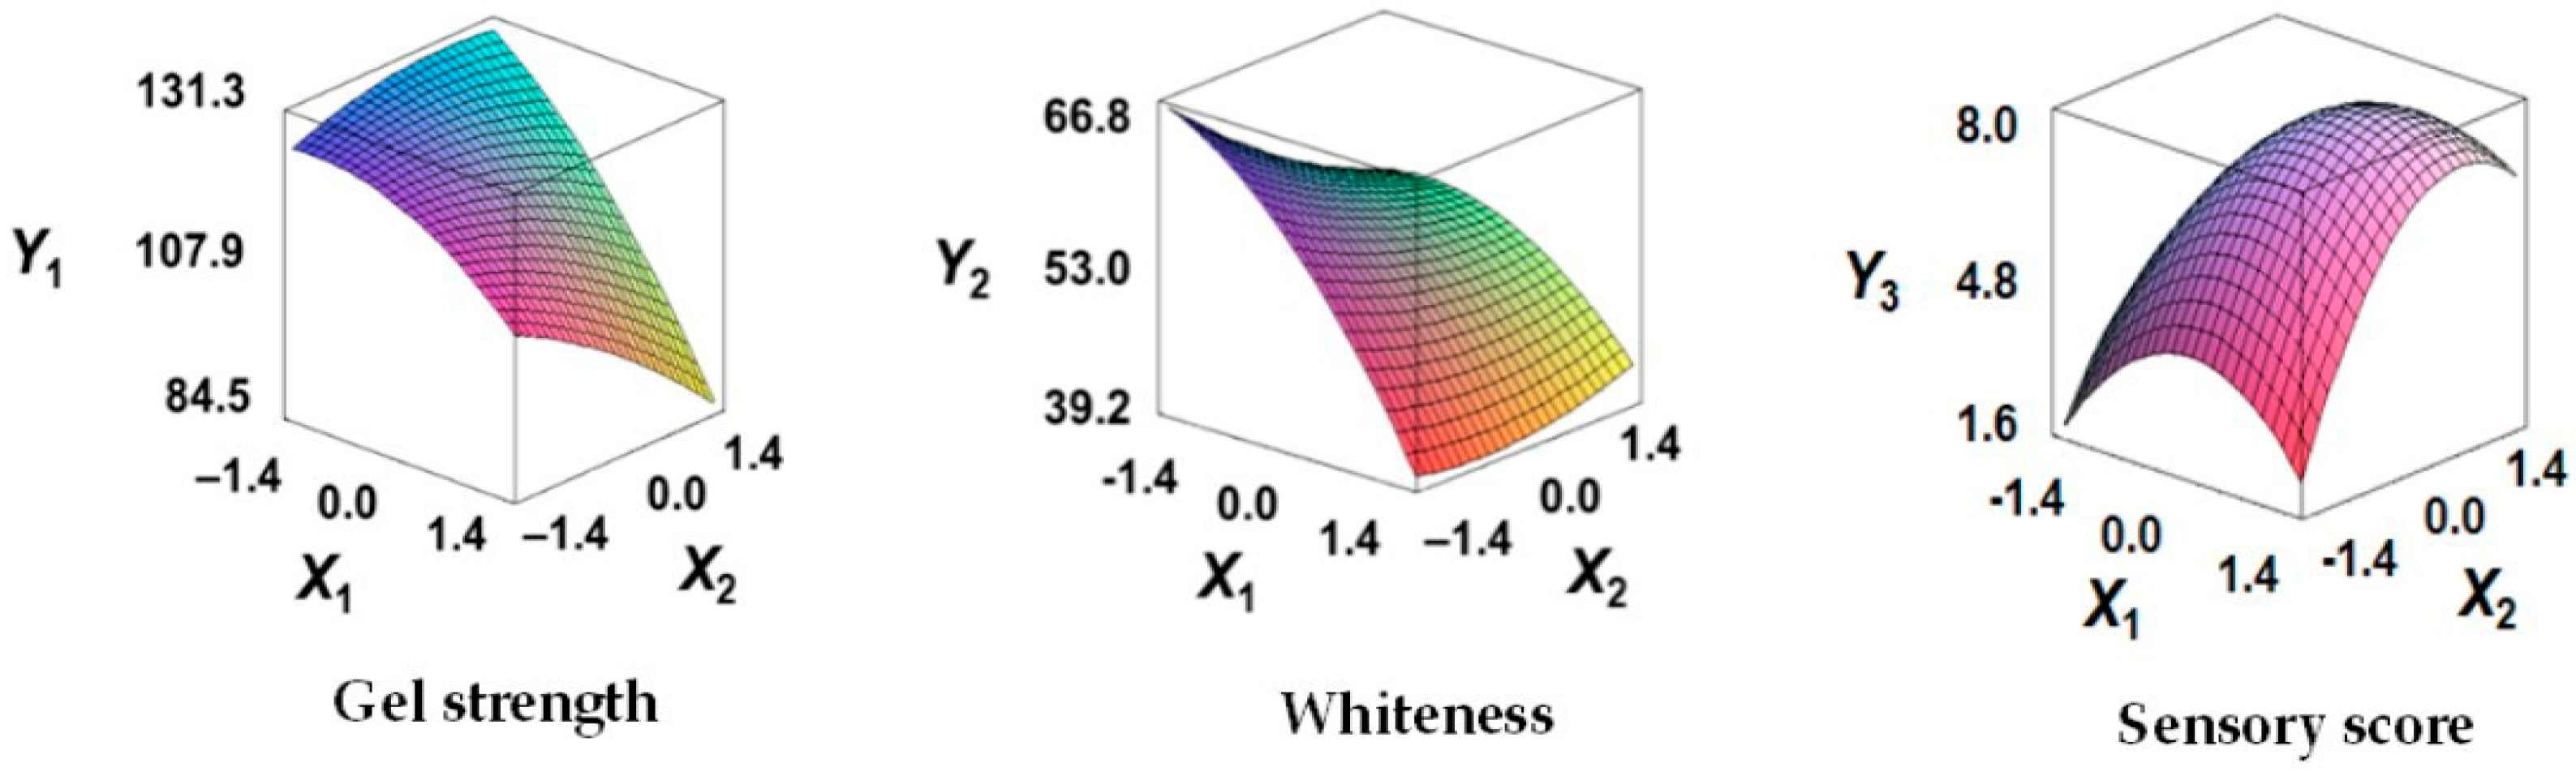
2.5. Response Surface Regression Analysis

The dependent variables for the optimal retort conditions of the steamed fish paste cake prototype were set as gel strength (Y1) to verify elasticity; whiteness (Y2) to verify color change; and sensory evaluation parameters (Y3) to verify fish odor and taste. Regression analysis was performed with the data of these dependent variables. Optimal prediction and confirmation of the retort processing conditions of the steamed fish paste cake prototype were performed using the MINITAB statistical program (MINITAB Ver. 14, MINITAB, State College, PA, USA), and the relationship between the independent and dependent variables was confirmed using MAPLE software (MAPLE Ver. 12, Maple Soft, Waterloo, ON, Canada). The experimental results of randomly prepared sample groups were used for the response surface regression analysis. The linear, quadratic, cross-product, or lack of fit significance (p value) of each model was recognized (p < 0.05), based on the results of the response surface regression coefficient and variance analysis, presented according to the relationship between the independent variable and the dependent variable. The coefficient of determination (R2) was used to calculate the optimal conditions [33], and the suitability of the independent or dependent variable design model was checked by setting each target value for the dependent variable, using the response optimization tool. The actual values were obtained by converting the coded values calculated in the statistical program, and the experimental values obtained through the actual experiment were compared and analyzed.
Optimization of the manufacturing conditions of the steamed fish paste cake prototype was achieved through the response optimizer of the MINTAB statistical program. In addition, the values of the estimated dependent variables were verified through comparison with the dependent variables, measured through actual experiments, according to the statistically estimated optimal conditions [34]. By substituting the values of the constant, linear term, quadratic term, and cross term, which are the results of the regression equation derived from the regression analysis result, into MAPLE software version 12 (Waterloo), the expression expressing the relationship between the independent variable and the dependent variable is shown in Equation (1).
Y = β 0 + i = 1 3 β i X i + i = 1 3 β i i X 2 i + i = 1 2   j = i + 1 3 β i j X i X j
here, Y is the dependent variable, β0 is a constant, βi, βii, and βij are regression coefficients, and Xi and Xj are independent variables.

2.6. Quality Characteristics of Prepared Fish Paste Cake Prototype

2.6.1. General Parameters and Energy

For general ingredients, moisture was measured by the atmospheric heat drying method, crude protein by the semi-micro Kjeldahl method, crude fat by the Soxhlet method, and ash by the dry ashing method, according to the methods mentioned in the Food Codex [35]. Carbohydrates were calculated as 100 − (moisture + crude protein + crude fat + ash content). Energy was calculated by applying the FAO/WHO energy conversion coefficient [(protein × 4.0) + (fat × 9.0) + (carbohydrate × 4.0)], based on the content of general components [36].

2.6.2. pH

For pH measurement, nine times (v/w) distilled water was added to 5 g of the steamed fish paste cake prototype, and homogenized using a homogenizer (SHG-15D, SciLab, Seoul, Republic of Korea). The homogenate was centrifuged (Centrifuge Fleta 5, Hanil Scientific Inc., Gimpo, Republic of Korea; 3000 rpm for 20 min), to separate the supernatant. The pH of the supernatant was measured with a pH meter (Ohaus Starter 2100, Ohaus Corporation, Parsippany, NJ, USA).

2.6.3. Volatile Basic Nitrogen

Volatile base nitrogen (VBN) values were measured according to the method mentioned in the Food Codex [35]. For the pre-treatment, 25 mL of distilled water was added to 5 g of steamed fish paste cake prototype, homogenized using a homogenizer (SciLab), centrifuged (Hanil Science; 3000 rpm for 10 min), and then filtered. One milliliter of pre-treated sample solution was added into the outer chamber of the Conway unit to the left, 1 mL of saturated potassium carbonate to the right, and 1 mL of 0.01 N H2SO4 and 2–3 drops of indicator to the inner chamber. The Conway unit was sealed with a glycerin-coated lid, shaken carefully, and incubated at 37 °C for 120 min. After the reaction was completed, the solution in the inner chamber of the diffuser was titrated with 0.01 N sodium hydroxide solution, and VBN content was calculated according to the Equation (2).
VBN (mg %) = 0.14 × {(sample titration − control titration) × f}/W × 100 × 5

2.6.4. Odor Intensity

Odor intensity was measured according to the method of Bashir et al. [37]. Briefly, 5 g of the steamed fish paste cake prototype was added into a 50 mL conical tube (SPL Life Science Co., Ltd., Pocheon, Republic of Korea), sealed with parafilm to prevent volatilization of the smell and the odor intensity was measured using an Odor concentration meter (XP-329R, New Cosmos Electric Co., Ltd., Osaka, Japan). At this time, the measurement mode was set to batch, and the odor intensity unit was expressed as a level.

2.6.5. Thiobarbituric Acid Reactive Substances

The thiobarbituric acid reactive substances (TBARS) value was measured according to the method of Buege and Aust [38]. Briefly, 12.5 mL of 20% trichloroacetic acid (TCA), prepared in 2 M phosphoric acid, was added to 5 g of milled steamed fish paste cake, and homogenized with a homogenizer (SciLab). The volume was adjusted to a final volume of 25 mL, and supernatant was separated after centrifugation at 1500 rpm, 4 °C for 15 min. Two milliliters of 0.005 M thiobarbituric acid (TBA) solution was added into 2 mL of the supernatant, mixed, and heated in a water bath (JSWB-22TL, JSR, Gongju, Republic of Korea) at 95 °C for 30 min, and cooled to room temperature. Absorbance of the samples was measured at 530 nm using a spectrophotometer (Microplate readers, SPECTRO star-nano, BMG Labtech, Ortenberg, Germany), and the TBARS values were calculated using the Equation (3).
TBARS (MDA mg/kg) = (Sample absorbance − Blank) × 5.2

2.6.6. Color Characteristics

To calculate Hunter color parameters, lightness (L), redness (a), and yellowness (b) of the steamed fish paste cake prototype were measured using a color difference meter (CM-700d Spectrophotometer; Konica Minolta Sensing, Inc., Tokyo, Japan). The color difference (ΔE) was estimated using the Equation (4). At this time, the L value of the standard white board was 20.69, the a value was −4.59, the b value was −9.01, and the ΔE value was 12.05.
To measure whiteness, the inner part of the steamed fish paste cake prototype was cut into sizes of 1 cm (length × width) and the L and b values of the cut part were measured using a color difference meter (Konica Minolta Sensing). After measuring L and b values, the result calculated with L-3b using Equation (4) was used as the whiteness value [15].
ΔE = [(ΔL)2 + (Δa)2 + (Δb)2]1/2

2.6.7. Textural Analysis

The texture, hardness, and gel strength of the fish paste cakes were measured under each experimental condition using a texture analyzer (CT3-1000, AMETEK Brookfield, Middleboro, MA, USA). Samples for hardness measurement were prepared by cutting the developed steamed fish paste cake prototype into sizes of 10 × 10 × 4 mm, and then measured using a circular plunger with a diameter of 14 mm. At this time, the measurement conditions of the texture analyzer were set to distance 1.5 mm, trigger load 4.0 g, and test speed 0.5 mm/s.
To prepare samples for measuring gel strength, a plain film with a folding width (the width of the wrapping fish cake folded in two) of 48 mm (diameter 30 mm) was filled with the ground meat dough to a thickness of 20 cm with a filler. The filled dough was steamed and cooled for 10 min in a constant temperature using a water bath (JSR) at 50 ± 3 °C. After retort treatment (107.9–122.1 °C for 22.9–37.1 min), fish cakes were cut into a height of 25 mm, and gel strength was measured using a spherical plunger having a diameter of 5 mm. At this time, hardness and depth (deformation at hardness) were measured, and the gel strength was calculated by multiplying them. The measurement conditions of the texture analyzer were at a distance of 2.0 mm, a trigger load of 7 g, and a plunger speed of 1 mm/s.

2.7. Gel Electrophoresis

Electrophoresis was performed using sodium dodecyl sulfate polyacrylamide gel electrophoresis (SDS–PAGE), according to the method described by Bashir et al. [37]. Protein samples (100 μg protein/lane) were loaded on precast 4–20% Mini-PROTEAN® TGX™ bis-Tris gels and run in Tris/glycine/SDS running buffer in a Mini-PROTEAN tetra cell at 100 V. Precision plus protein dual color marker was used as a molecular weight reference standard. The electrophoresed gels were stained with Coomassie brilliant blue R-250 staining solution for 1 h, destained with Coomassie brilliant blue R-250 destaining solution for 3–4 h, and the protein bands were observed using ViewOne Lablite (EmbiTec, San Diego, CA, USA).

2.8. Scanning Electron Microscopy

The microstructure of the steamed fish paste cake prototypes was analyzed by scanning electron microscopy, as described by Park et al. [39]. The cross-section of each fish paste cake sample was cut into thin slices of 0.7 × 0.7 × 0.2 cm, freeze-dried, and coated with gold ions using the ion sputtering system (E-1010; Hitachi Instrument Inc., San Jose, CA, USA). The structures of the pre-treated fish paste cake samples were observed using a scanning electron microscope (SEM; JSM-6490LV; JEOL, Tokyo, Japan). Images were obtained with an electron acceleration voltage of 15 kV, and the shape and form were observed using sigma-scan pro version 5 (Systat Software Inc., San Jose, CA, USA) image analysis software, while moving at low magnification (100×) and high magnification (400×).

2.9. Total Amino Acid Analysis

Total amino acids in the steamed fish paste cake prototype were analyzed using the method described in the Food Standards Code [35]. Briefly, 20 µL of the pre-treated sample was analyzed using an automatic amino acid analyzer (Pharmacia Biotech Biochrom 30; Biochrom Ltd., Waterbeach, Cambridge, UK), and the total amino acids in fish paste cake were identified and quantified.

2.10. Mineral Analysis

The minerals (calcium, phosphorus, iron, potassium, and magnesium) contained in the developed fish paste cake prototype were measured by preparing each test solution according to the method described in the Food Standards Codex [35]. The mineral composition analysis of the fish paste cake was performed using an Inductively Coupled Plasma Optical Emission Spectrometry (ICP-OES: AVIO2000, Agilent, Santa Clara, CA, USA), according to the method of Deshwal et al. [40].

2.11. Sensory Evaluation

Sensory evaluation of the steamed fish paste cake prototypes was conducted through preference evaluation and descriptive analysis during the prototype production process. The sensory evaluation for appearance, odor, flavor, and overall acceptance of the prepared fish paste cakes was conducted by 21 trained and certified panelists aged between 20-and 30-years-old (4 men and 17 women). The panelists were researchers at the industry-Academic Cooperation Foundation, Silla University, Busan, Republic of Korea. The preference evaluation for optimizing the heating process to prepare steamed fish paste cakes and optimizing sea tangle addition was done by giving a numerical score for each group. A 9-point hedonic scale was used, with 9 indicating the extremely liked and 1 indicating the extremely disliked; a value of 5 was considered as the threshold value, and a sample value less than 5 was considered unacceptable [41].
For the descriptive analysis, panel selection and descriptive terms were developed according to the method suggested by N’Kouka et al. [42], and strength of the prepared steamed fish paste cakes was evaluated using a 5-point preference scale method [43]. Descriptive analysis was performed by 5 trained descriptive analysts (3 men and 2 women) and researchers at the Industry–Academic Cooperation Foundation, Silla University Busan, Republic of Korea. Terms related to the prepared fish paste cakes were derived and created, and each table score was agreed upon by the panelists, as shown in Table S3.

2.12. Viable Bacterial Count

For general bacteria, approximately 10 g of the prepared fish paste cake sample was aseptically collected in a sterilization pack, according to the method mentioned in the Food Codex [35], mixed with 90 mL of sterilized saline solution, and homogenized (WES-400; Daihan Scientific Co., Ltd., Wanju, Republic of Korea) for 2 min. For coliform and Escherichia coli, the homogenized samples were serial diluted, and incubated at 35 ± 1 °C for 24 ± 2 h. For checking the growth of heat resistant bacteria, the homogenized fish paste cake sample was heated at 100 °C using a water bath (JSR) for 10 min and cooled to room temperature. The cooled homogenate was inoculated on a 3M dry film and incubated at 35 ± 1 °C for 48 ± 2 h, to calculate the number of heat-resistant bacteria colonies.
In addition, the growth of anaerobic bacteria was tested according to the bacterial growth test of the Food Standards Codex [35]. Briefly, five tubes containing heat-sterilized fish paste cake samples were stored at 36 ± 1 °C for ten days, and the samples with expanded glass containers were considered positive for bacterial growth. The negative sample were stored at room temperature for one additional day and then tested for anaerobic bacterial growth. A total of 25 g of the above prepared fish paste cake prototype was mixed with 225 mL of sterilized saline solution, homogenized (Daihan) for 2 min, diluted to 1:9 ratio with sterilized saline solution, and used as a test sample. A total of one milliliter of the prepared test sample was inoculated into five thioglycolate media and incubated at 36 ± 1 °C for 48 ± 3 h. After culturing, if bacterial growth was confirmed in any of the five glass containers, it was considered positive.

2.13. Shelf-Life Analysis

The shelf-life of the prepared fish paste cake prototype was evaluated using Visual Shelf-Life Simulator for Foods (VSLSF), an online program provided by the Korean Ministry of Food and Drug Safety to calculate the shelf-life of food products [35]. When conducting accelerated experiments, three storage temperatures (25 °C, 35 °C, and 45 °C) were used for accurate prediction of the shelf-life. The shelf-life was calculated by multiplying the safety factor (0.8), with the predicted expiration date obtained after inputting the results of quality indicators, such as general bacterial count, VBN, pH, and sensory evaluation, into the program. In addition, to mitigate unforeseen circumstances during food product manufacturing, the shelf-life values were not used directly. Instead, a value indicating 20% less than the actual value was considered, and was achieved by multiplying by 0.8.

2.14. Statistical Analysis

All experimental analyses were performed at least three times. The results are expressed as the means ± standard error (S.E.). One-way analysis of variance (ANOVA) and student t-test were employed using IBM SPSS Statistics ver. 23.0 (IBM Corp., Armonk, NY, USA), and the experimental results were considered statistically significant at p < 0.05.

3. Results

3.1. Optimal Ratio of TGs, Sugar Additives, and Natural Extracts for Preparing Steamed Fish Paste Cake Prototype

3.1.1. Texture Improvement Effect by TGs

To optimize the mixing ratio of ACTIVA TG-K, the gel strength of the steamed fish paste cake prototype with varying concentrations (0.0%, 0.1%, 0.3%, and 0.5%) of ACTIVA TG-K was analyzed. Gel strength increased with higher concentrations of ACTIVA TG-K (Table 1). However, comparing the results of 0.3% and 0.5% ACTIVA TG-K, which showed the highest gel strength measurement, the increase was not significant. Thus, considering the manufacturing cost of fish paste cakes, the optimal ratio of ACTIVA TG-K addition was determined to be 0.3%.

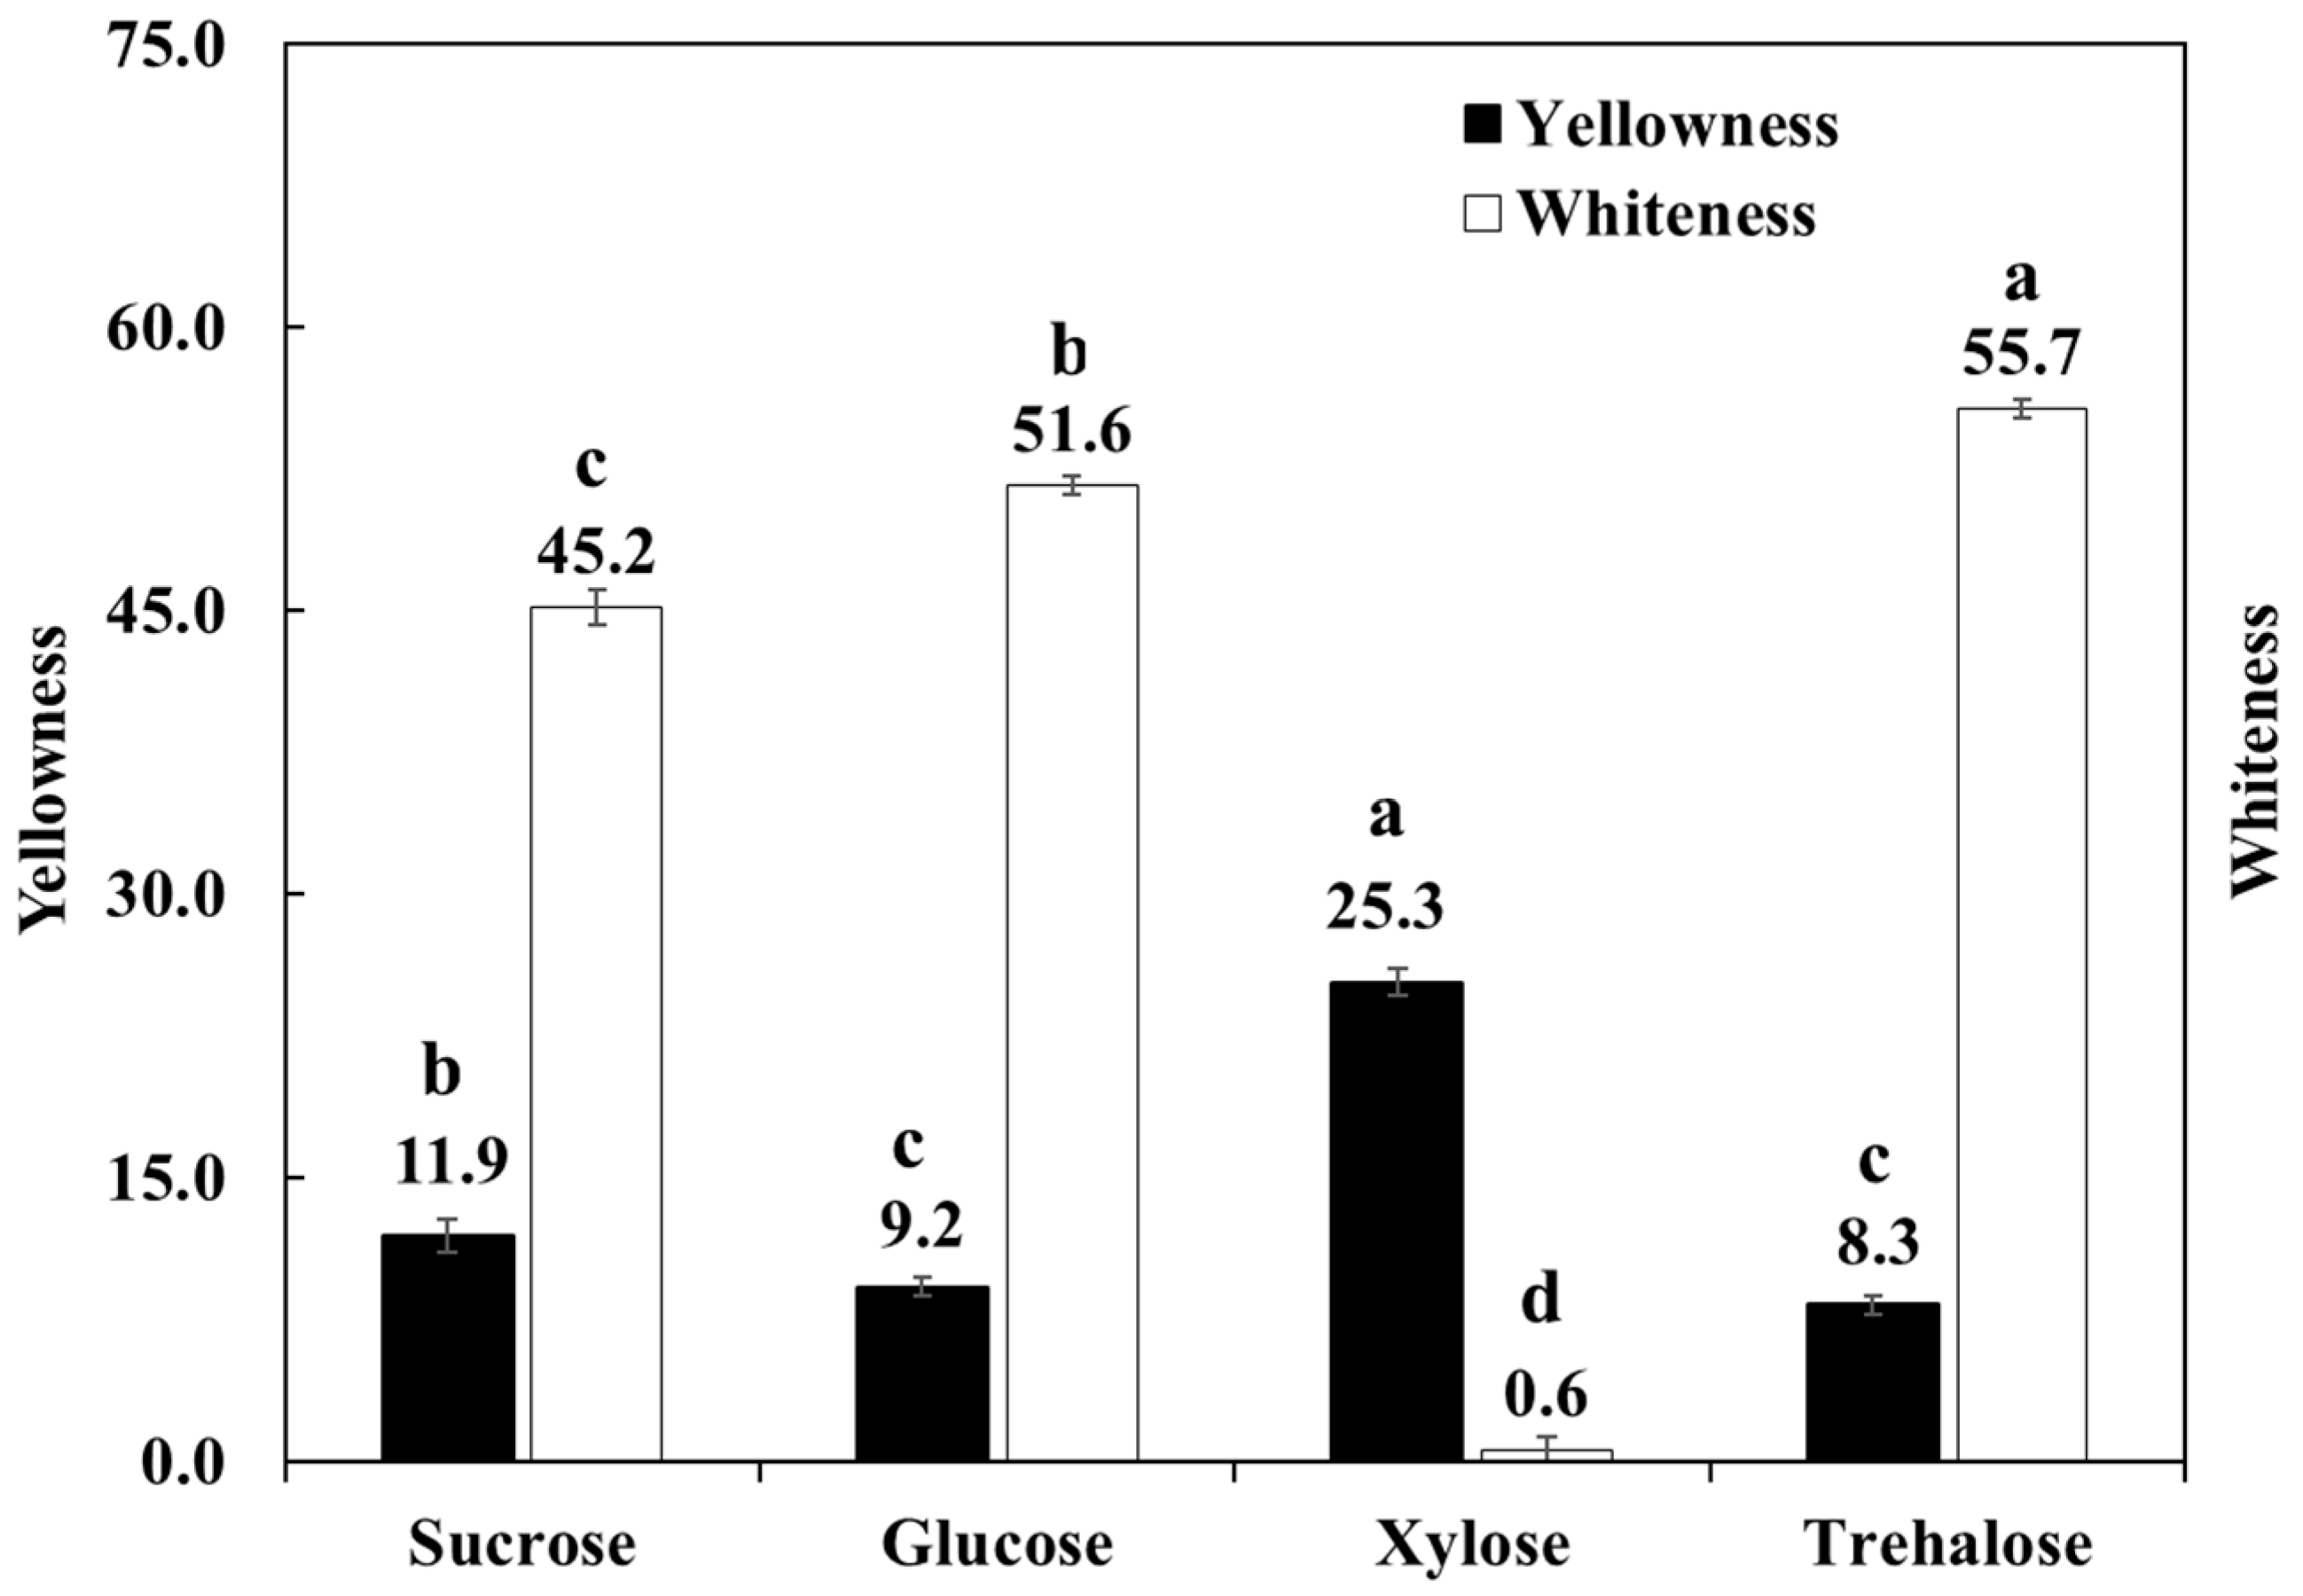
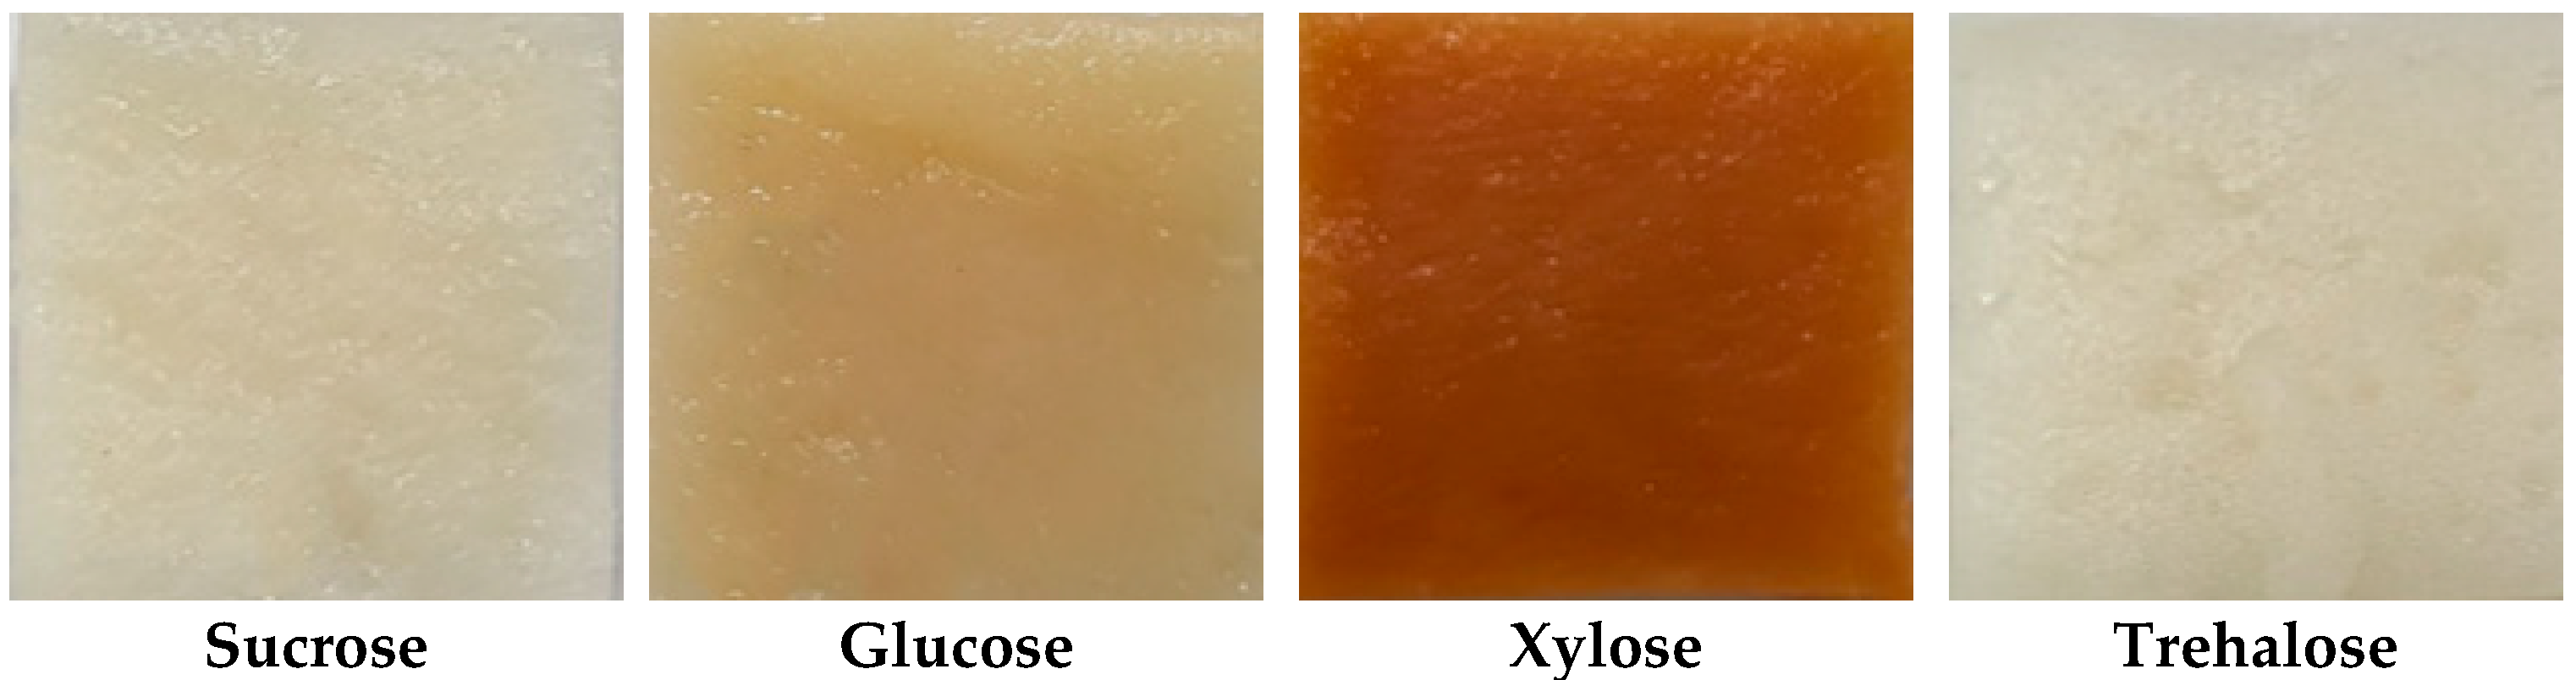
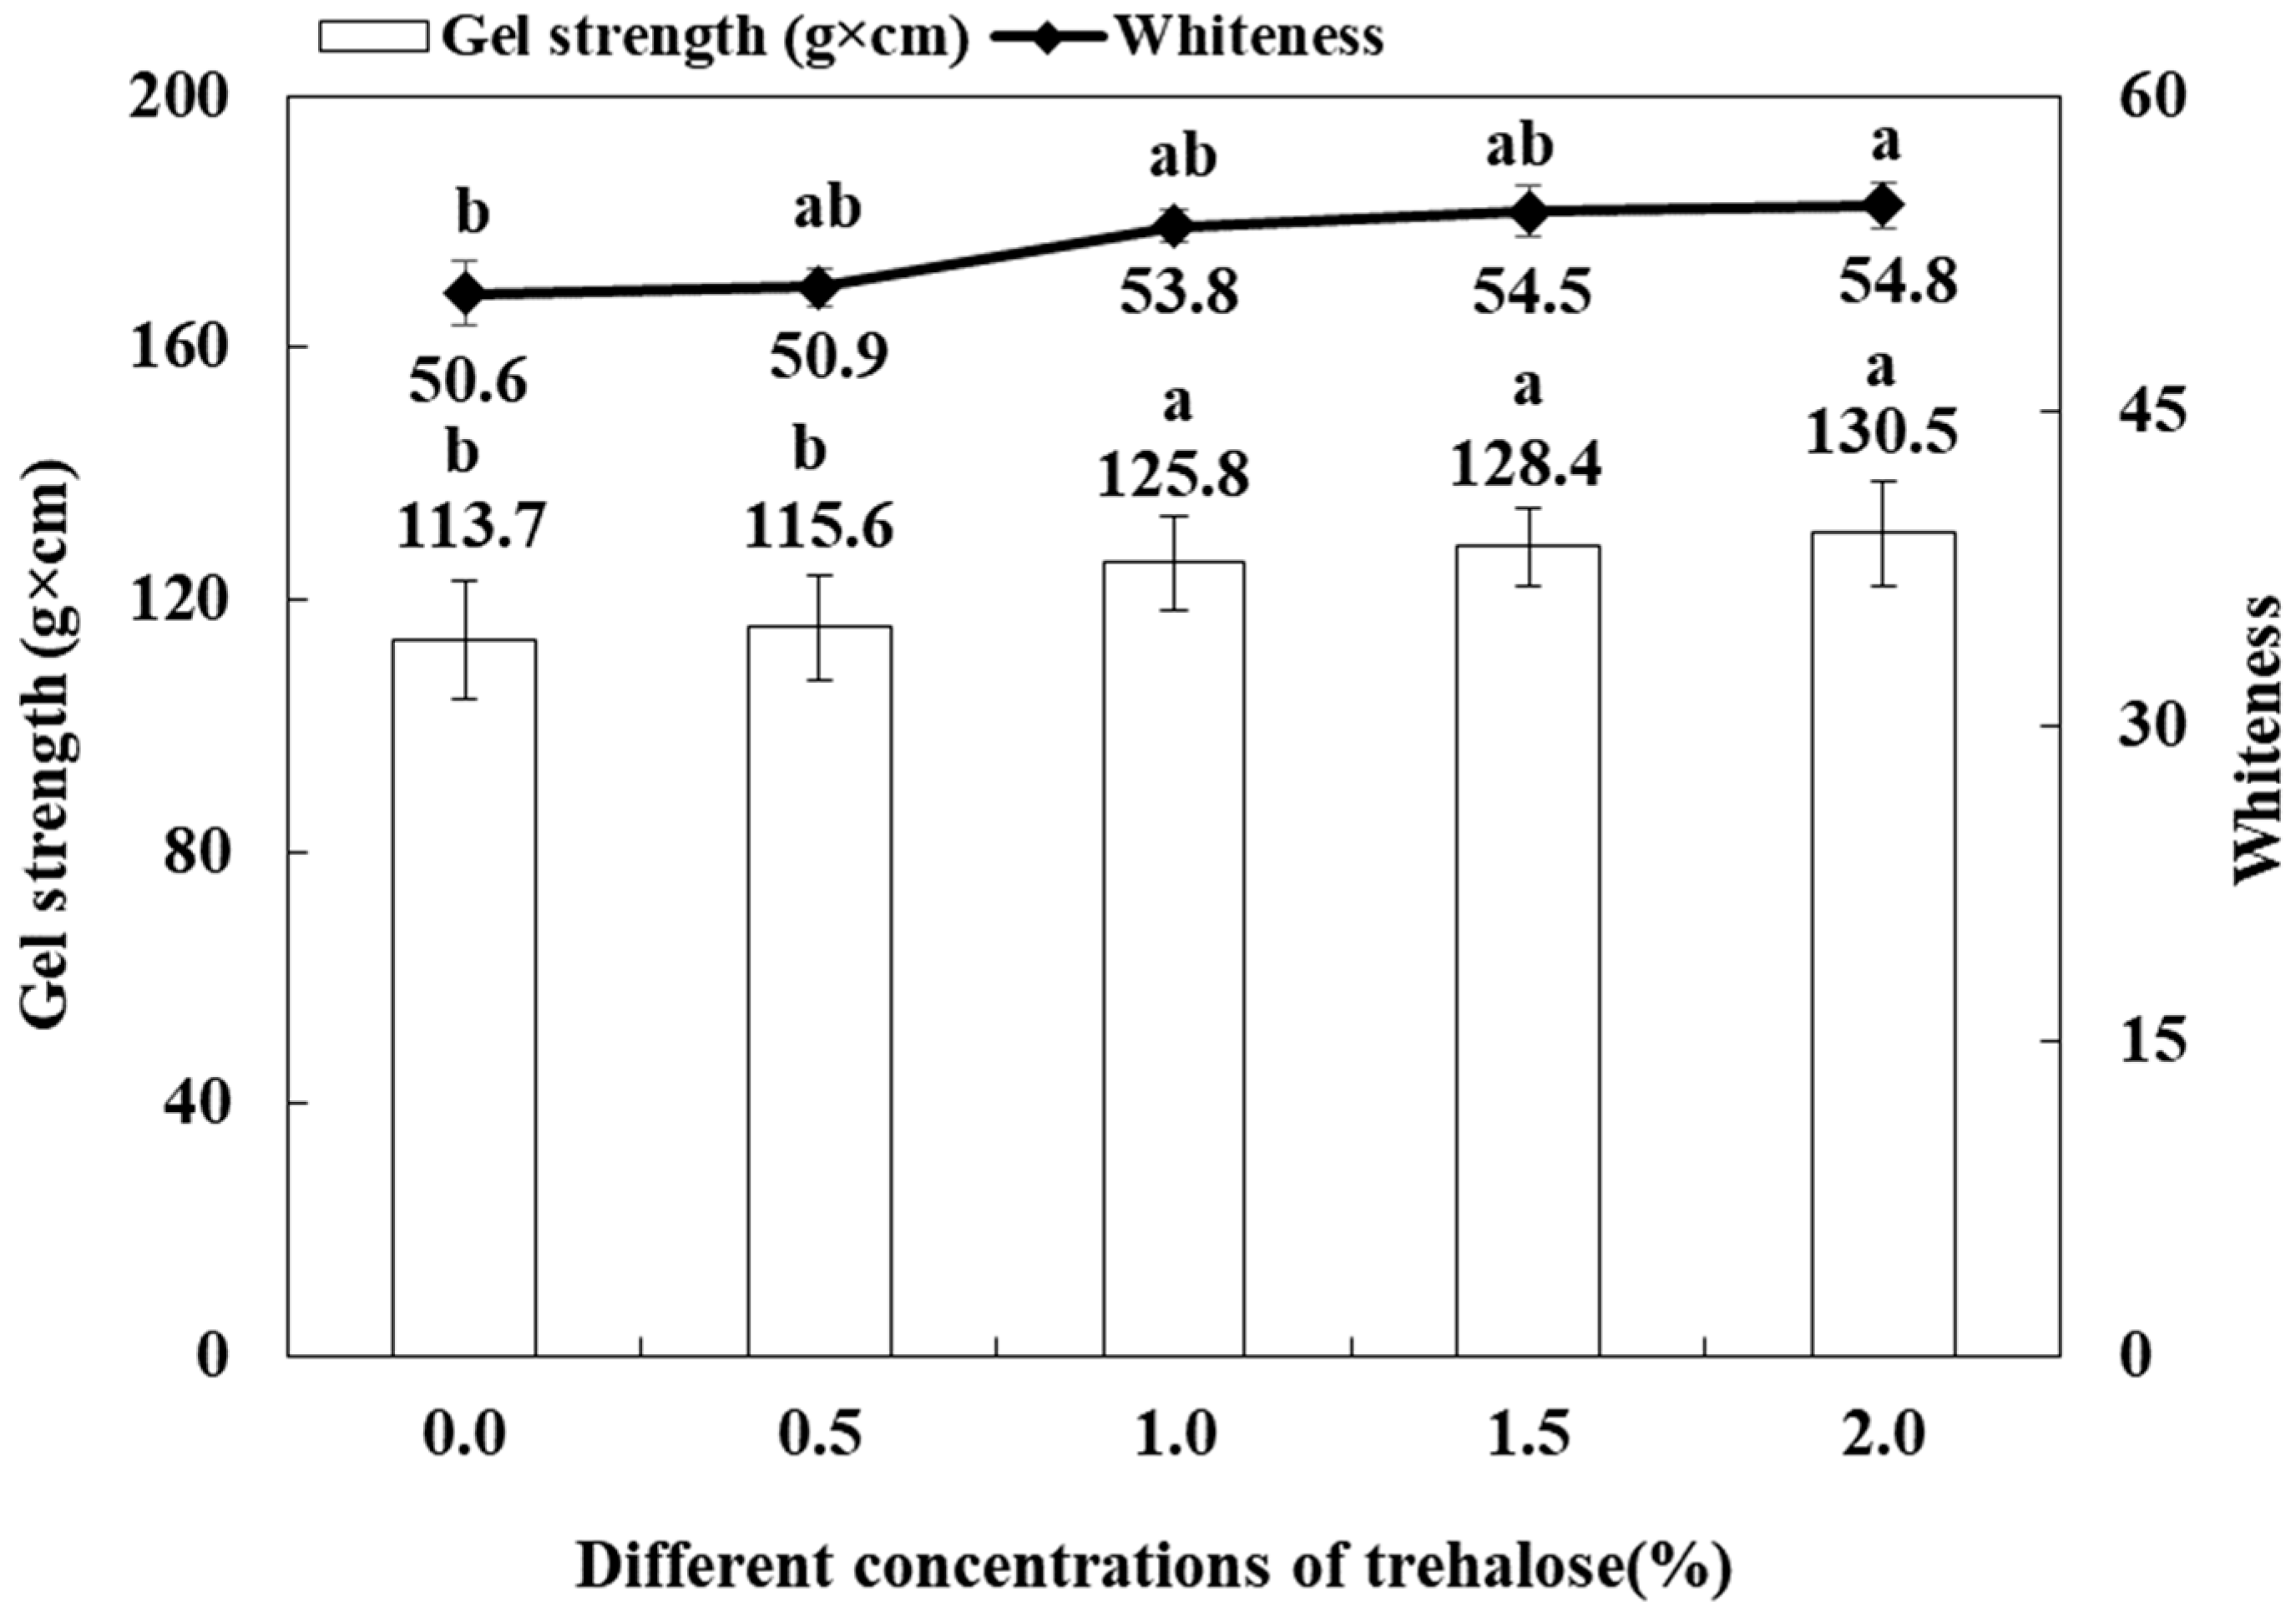
3.1.2. Color Changing Effects Due to Sugar Additives

Among the studied sugar additives, the fish paste cake prototype supplemented with xylose had the highest yellowness (25.3), while the prototype with trehalose had the lowest (9.2; Figure 2). For whiteness, the prototype with trehalose had the highest value, at 55.7, while the one supplemented with xylose had the lowest, at 0.6 (Figure 2). The color changes in the steamed fish paste cake prototypes supplemented with different sugar additives are shown in Figure 3.
To determine the optimal mixing ratio of trehalose, the gel strength and whiteness of the fish cake, prototypes supplemented with trehalose were measured. From 0.0% to 1.0% of trehalose, the gel strength of the fish cake prototype increased by about 9.7%, with no significant difference observed from 1.0% to 2.0% trehalose addition (Figure 4).

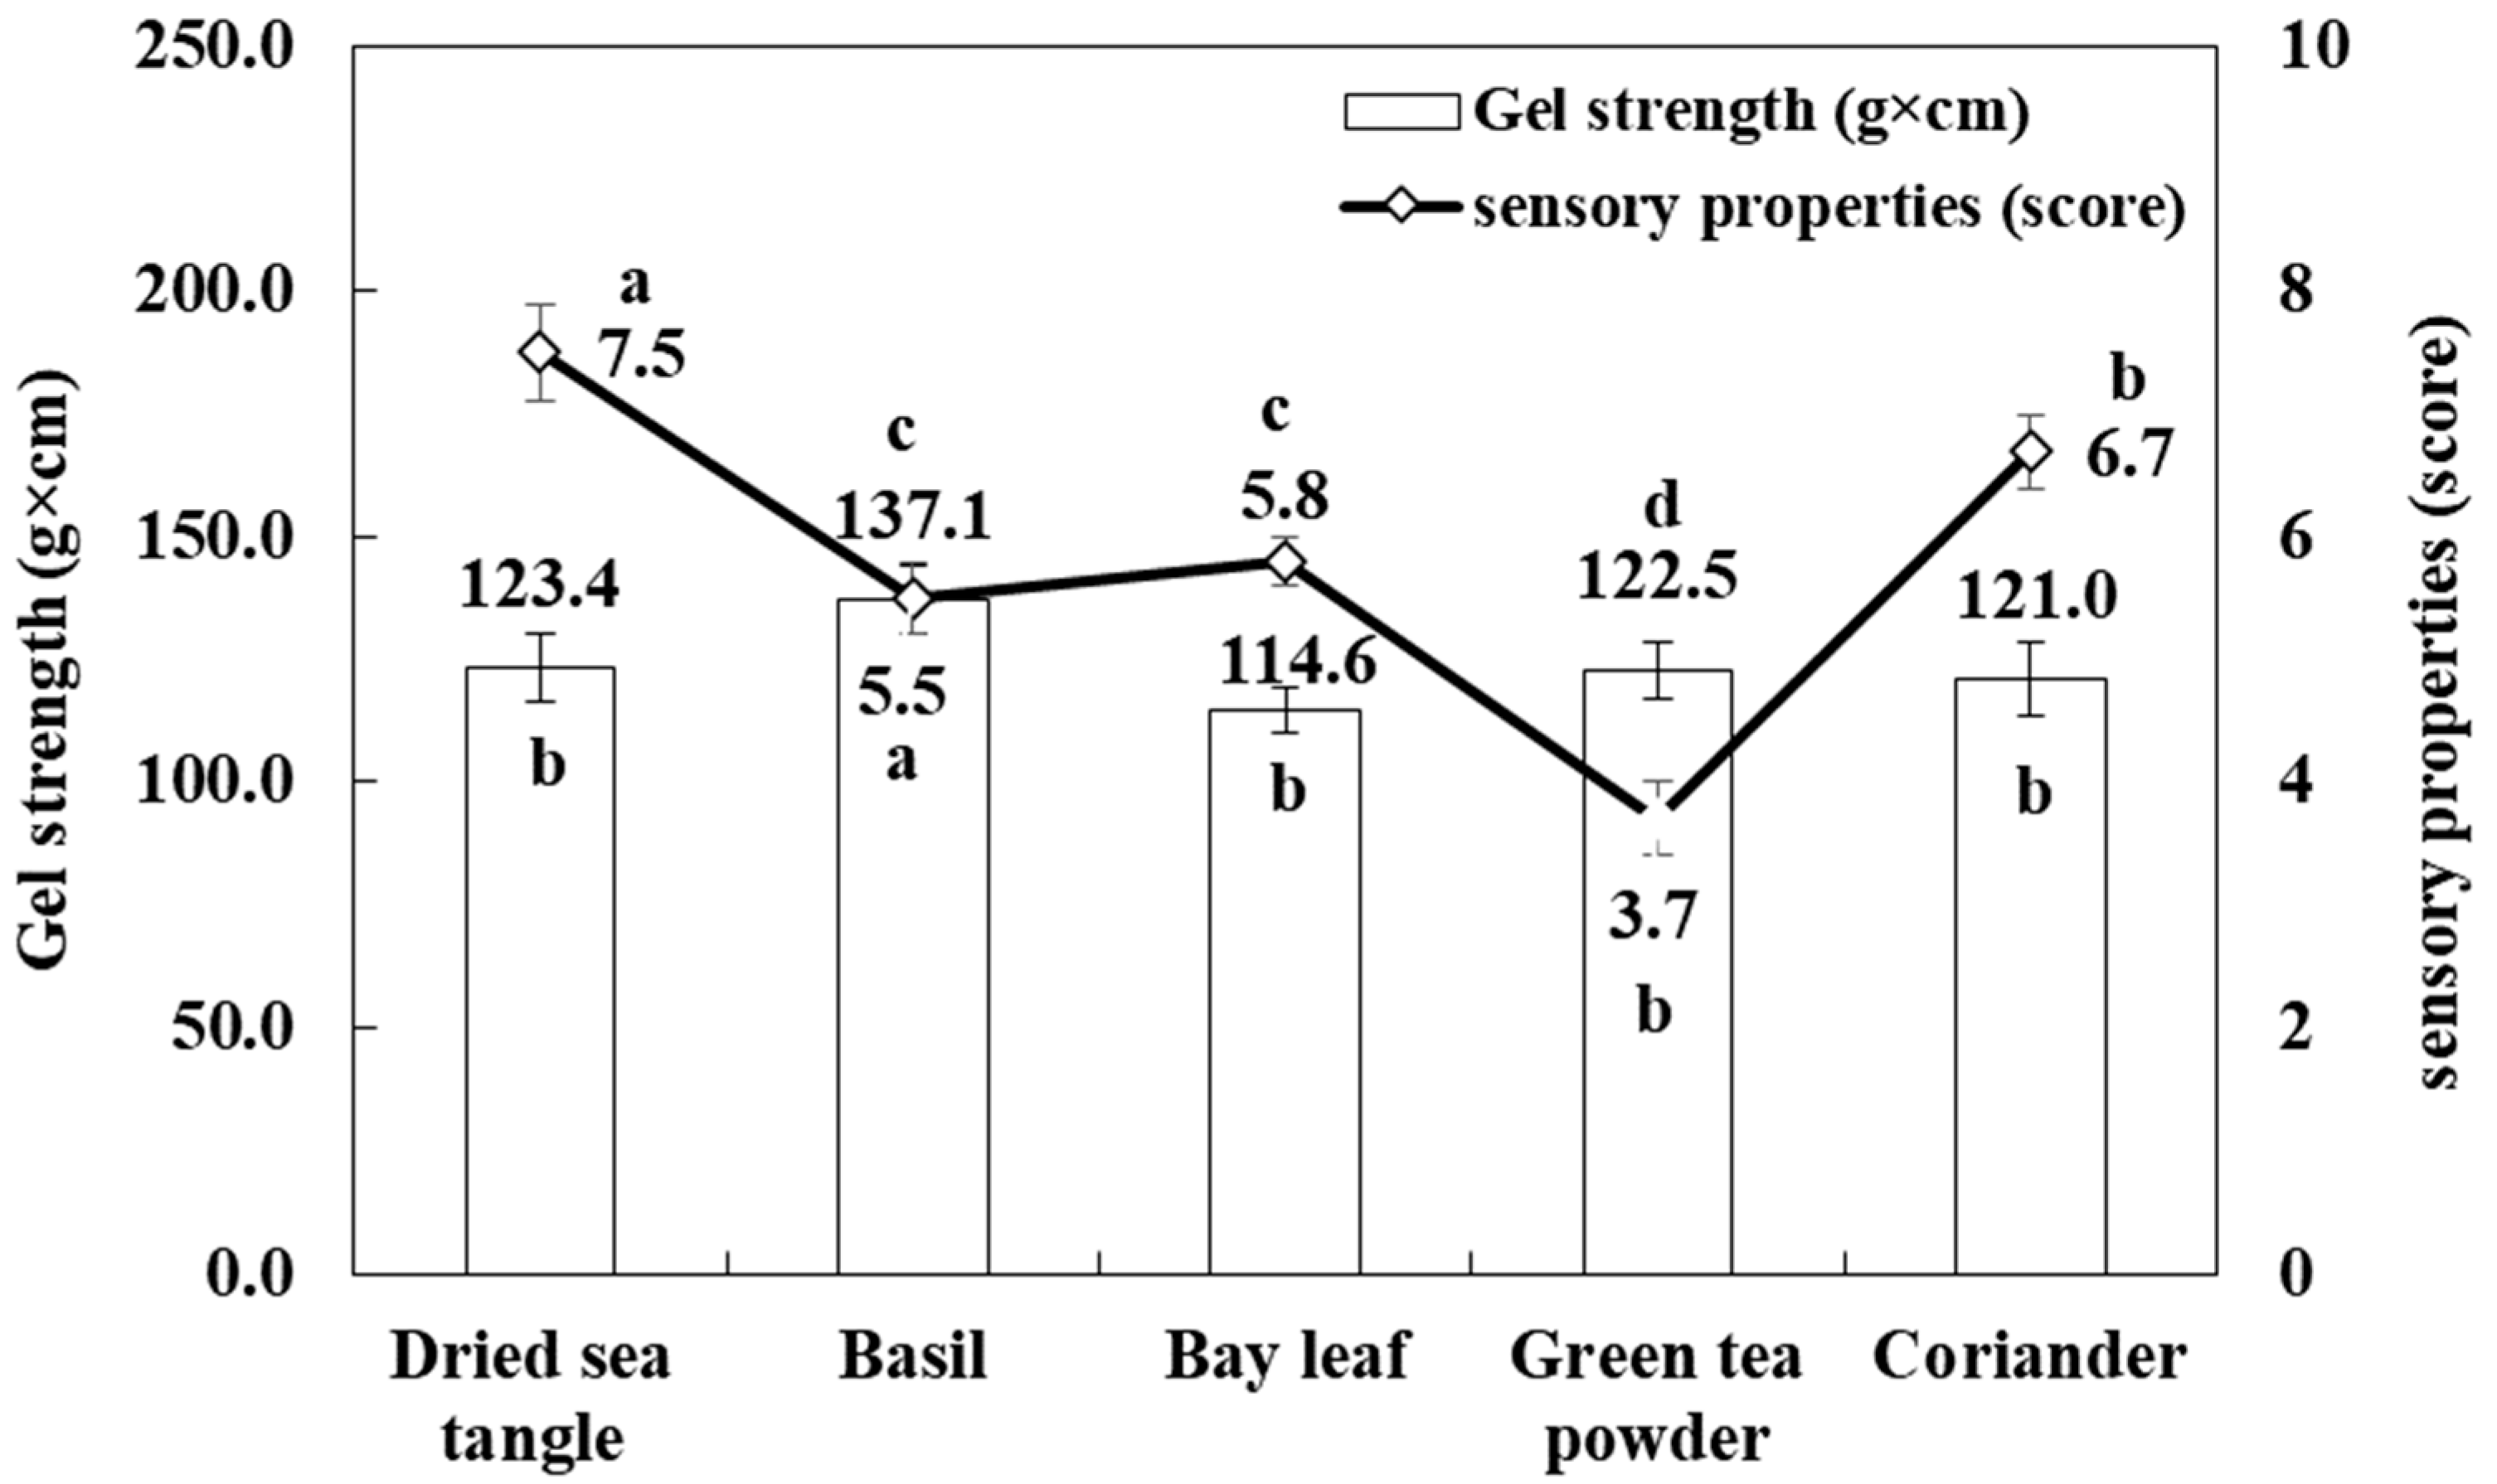
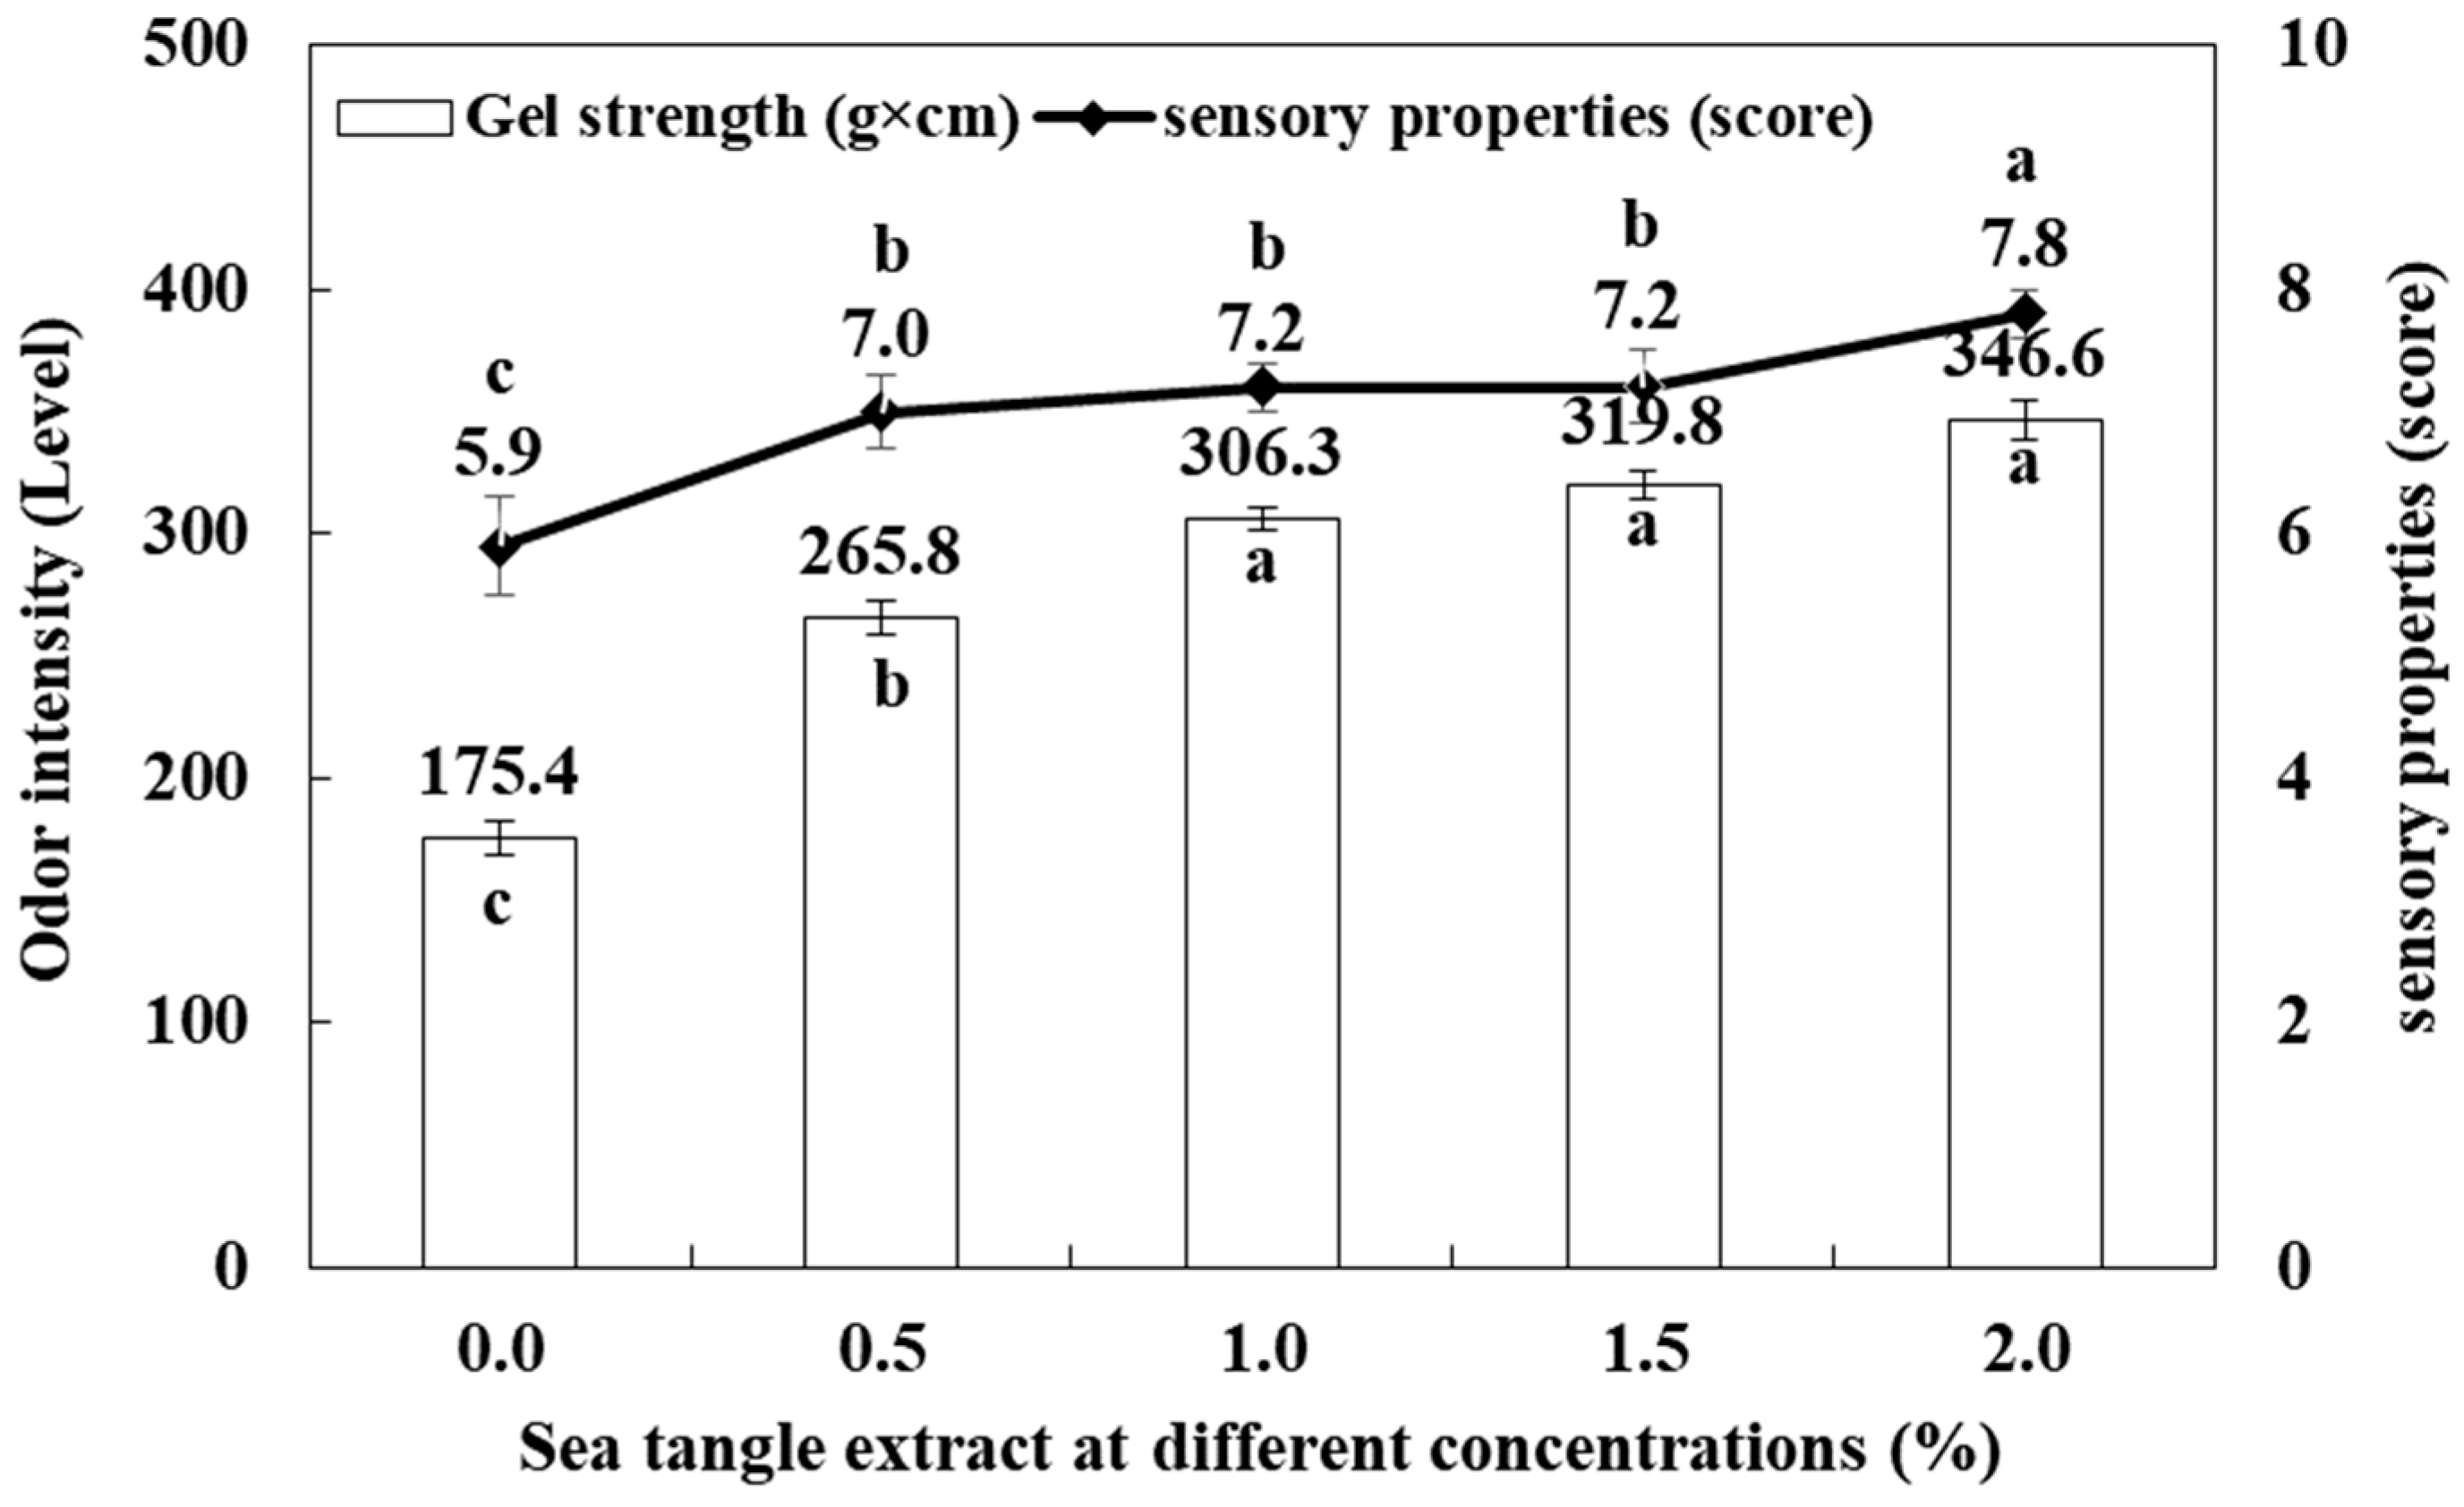
3.1.3. Off-Flavor Reduction Effect by Herbal and Seaweed Extracts

Among the steamed fish paste cake prototypes, those supplemented with green tea extract showed a dark brown color, while those with basil extract appeared brown. Those with sea tangle, bay leaf, and coriander extracts had a light brown color (Figure 5). Regarding the gel strength of the steamed fish paste cake prototype with herbal extracts, fish cakes with basil (137.12 g × cm) showed the highest value, while those with bay leaf (114.64 g × cm) showed the lowest. During sensory evaluation, fish cakes with sea tangle showed the highest value (7.5 points), whereas those with green tea had the lowest (3.7 points). The results of measuring the gel strength and sensory evaluation (odor intensity) of the steamed fish paste cake prototype containing herbal and seaweed extract are shown in Figure 6.
The odor intensity (VCI) and sensory evaluation scores of the steamed fish paste cake prototypes supplemented with 0.0% to 2.0% sea tangle extract increased by approximately 49.4% and 24.4%, respectively (Figure 7). Conversely, addition of sea tangle extract at 0.0% to 0.5% increased the odor intensity and sensory evaluation score of the steamed fish paste cake prototype by 34.2% and 15.7%, respectively. At 0.5% addition of sea tangle extract, the odor intensity and sensory evaluation score of the fish cake prototype increased the most. As the amount of added sea tangle extract increased, the odor intensity and sensory evaluation value of the fish cake product increased. However, considering economic feasibility, subsequent experiments were conducted with a fish cake prototype containing 0.5% sea tangle extract.

3.2. Optimal Retort Processing Conditions for Preparing Steamed Fish Paste Cake Prototype

To optimize the high-temperature and high-pressure treatment conditions (temperature and time) for the steamed fish paste cake prototype, 11 samples were prepared according to the central synthesis plan and treated at each high-temperature and high-temperature condition. The dependent variables (gel strength, whiteness, and sensory score) of these samples were measured (Table S4). At this time, the high pressure was at 1.3 kg/cm2 and all samples were treated at the same conditions.
The relationship between the two independent variables and the dependent variables was analyzed by least-squares regression (RSREG) function of the MINITAB version 14, and diagrammed in a three-dimensional (3D) graph using Maple software version 12 (Figure 8). Gel strength (Y1), the dependent variable of the steamed fish paste cake prototype, tended to decrease as both X1 (high-temperature) and X2 (high-temperature and treatment time) moved from −1.414 to +1.414. A more rapidly decreasing tendency was observed in X1, compared to X2. Whiteness (Y2), the dependent variable, tended to decrease as it moved from −1.414 to +1.414 for both X1 and X2. The sensory evaluation scores, which are dependent variables, showed a tendency to increase from −1.414 to +0.4508 and −1.414 to +0.4819 for both X1 and X2, respectively, and from +0.4819 to +1.414, both X1 and X2 tended to decrease.
The coefficients of quadratic regression equations (response model equations) were examined using RSREG of the MINITAB statistical program version 14, and their significance was estimated (Table S5). In general, the quadratic regression equation consists of various terms when the significance of the constituent terms is not considered, thus it is necessary to organize only the terms whose significance is recognized [33]. Therefore, the significance of each item examined using the analyzed data was confirmed as follows; in the case of gel strength (Y1), two types of linear terms X1 and X2, and in the case of whiteness (Y2), three types of linear terms X1; In the case there were four types of terms: linear terms X1 and X2, and quadratic terms X12 and X22. The remaining terms were not recognized as significant. The results expressed in a concise equation considering the significance of the response model equation of the dependent variable are shown in Table 2. The results of an ANOVA analysis of the correlation between independent variables and dependent variables for optimal manufacturing conditions of the steamed fish paste cake prototype are presented in Table S6.
The optimal condition prediction values of the independent variables were obtained, and the results are presented in Table S7. Considering the target values for the independent variables of the steamed fish paste cake prototype, the optimal values of gel strength were 0.00 and −0.25 for the code value, respectively, and 115.0 °C and 28.8 min for the actual value, respectively. The optimal values of whiteness (Y2) were 0.00 and –0.88 for the code value, respectively, and 115.0 °C and 25.6 min for the actual value, respectively. Whereas the optimal values of the sensory score (Y3) were 0.21 and 0.40 for the code value, respectively, and 118.2 °C and 33.9 min for the actual value, respectively. The sign values of the optimal high-temperature and high-pressure treatment temperature and time that could satisfy all these dependent variables were −0.2796 and −0.1853, and the actual values were 113.2 °C and 29.9 min. The gel strength and whiteness of the steamed fish paste cake prototype manufactured under these optimal conditions (113.2 °C and 29.9 min) were 121.4 ± 2.7 g × cm and 53.8 ± 1.6, respectively (Table 3).

3.3. Optimal Manufacturing Process of Steamed Fish Paste Cake Prototype

Based on the results of the optimal mixing ratios of additives (ACTIVA TG-K, trehalose, and sea tangle extract), optimal processing conditions were set for manufacturing steamed fish paste cake prototype. A total of two kilograms of frozen surimi, cut to a certain size, and first fish meat grinding was done for 5 min. Subsequently, 1.65% (40 g) of refined salt was added to the surimi dough, and second fish meat grinding was performed for 10 min. Next, additives, including ACTIVA TG-K (0.30%), trehalose (1.00%), sea tangle extract (0.5%), potato starch (8.26%; 200 g), tapioca starch (4.13%; 100 g), fish extract (0.83%; 20 g), sodium glutamate (0.33%; 8 g), egg white powder (0.21%; 5 g), glycine (0.12%; 3 g), and complex phosphate (0.12%; 3 g), were added to the surimi dough, and third fish meat grinding was performed for 10 min. At this time, to prevent protein denaturation that may occur during fish meat grinding, 1200 g of ice (60.0% of surimi) was added in three parts, 400 g each, and the temperature of the dough was maintained below 7 °C. After obtaining the ground fish meat dough, it was steamed in a steamer at 47 ± 1 °C for 10 min, and then cooled in ice water for 10 min. The cooled steamed fish paste cake prototype was vacuum-packed and subjected to high-temperature and high-pressure treatment at 113.2 °C for 22.9 min. At this time, the pressure was set to 1.3 kg/cm2.

3.4. Quality Characteristics of Steamed Fish Paste Cake Prototype

The quality characteristics, including proximate composition, pH value, energy, odor, color, texture, mineral composition, amino acid content, and protein content, of the steamed fish paste cake prototype manufactured under the above optimal conditions, and two commercially available products (control 1 and control 2), were investigated.

3.4.1. Proximate Composition, pH, and Energy

The proximate composition, pH, and energy of the steamed fish paste cake prototype and control groups 1 and 2 are shown in Table 4. The proximate composition showed 66.2%, 62.7%, and 69.3% water content, 9.1%, 13.2%, and 11.4% protein content, 0.1%, 0.2%, and 0.3% fat content, 11.2%, 14.3%, and 6.2% ash content, and 13.4%, 9.6%, and 12.8% carbohydrate content, respectively. The moisture content was highest in control 2, protein content was highest in control 1, and carbohydrate content was highest in the developed steamed fish paste cake prototype. The pH of the developed steamed fish paste cake prototype, control 1, and control 2, was 7.28, 7.33, and 7.36, respectively, which did not differ significantly among the samples.

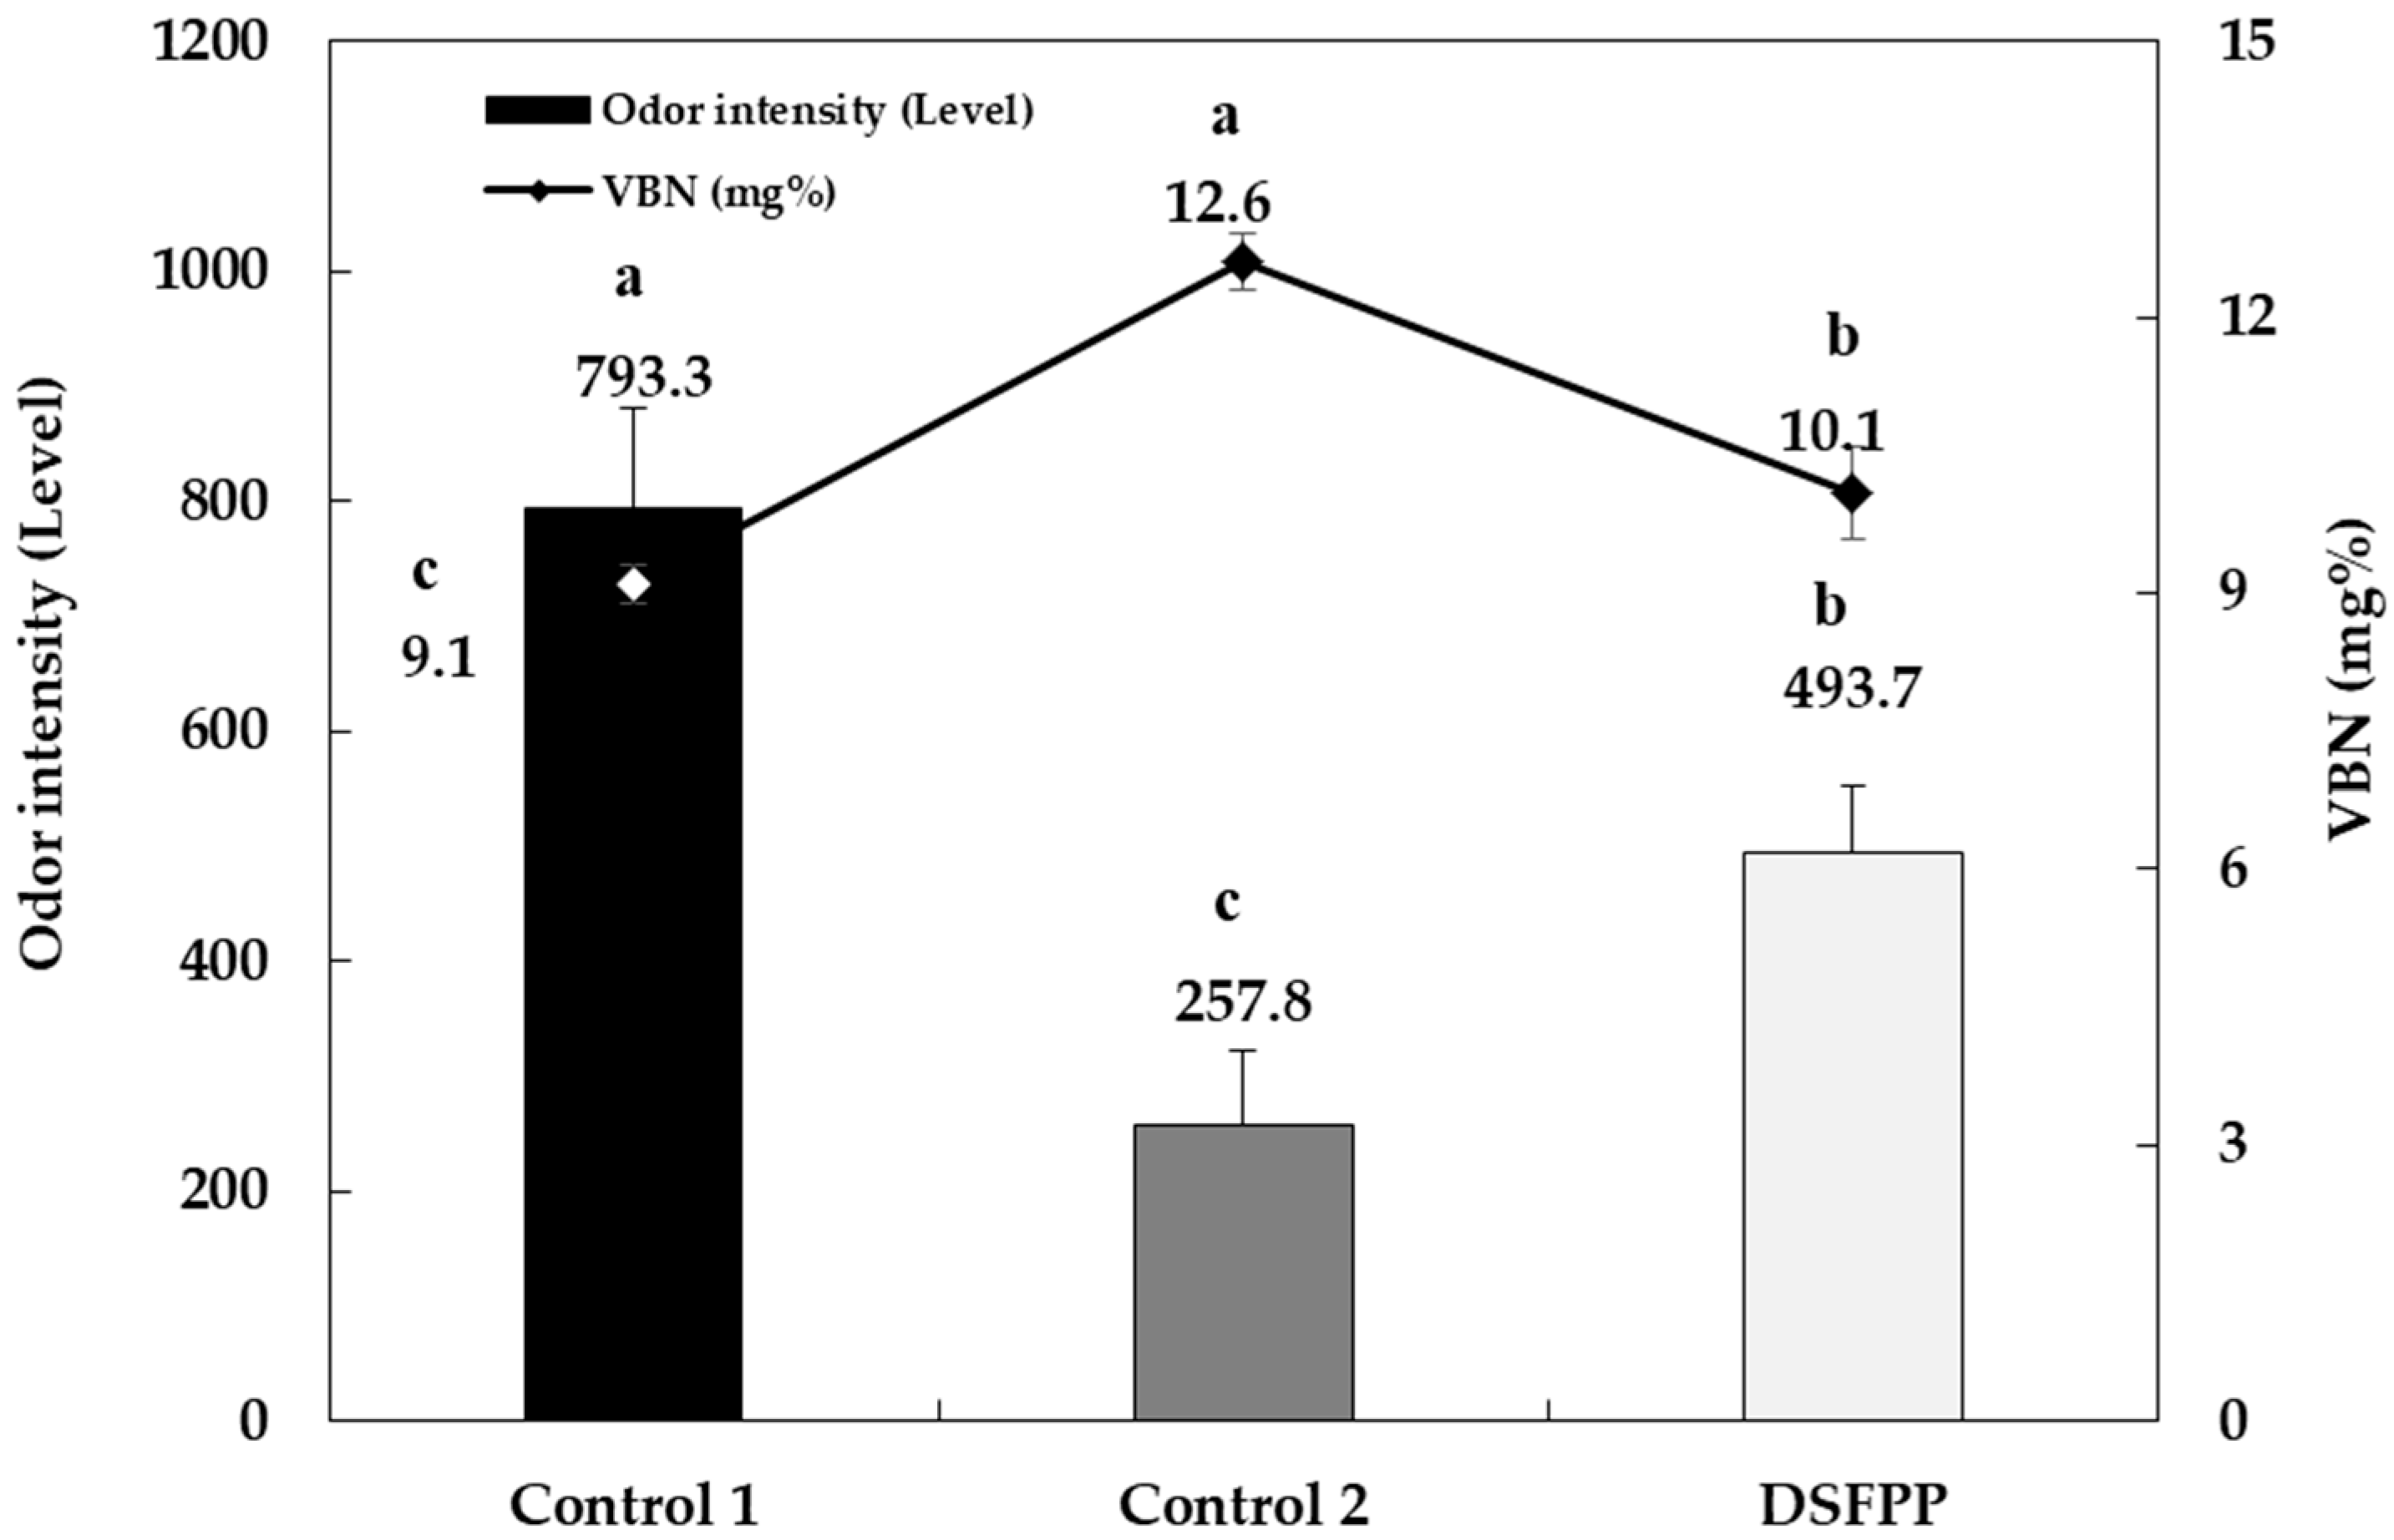
3.4.2. Odor Intensity and Volatile Base Nitrogen

The estimated VCI and VBN values of the developed steamed fish paste cake prototype and the controls are shown in Figure 9. Control 1 exhibited the highest VCI value of 793.3, while control 2 showed the lowest VCI value of 257.8. On the other hand, control 2 exhibited the highest VBN value of 12.6 mg/100 g, whereas control 1 showed the lowest VBN value of 9.1 mg/100 g.

3.4.3. Hunter Color Parameters

Hunter color parameters of the developed steamed fish paste cake prototype and the control groups are shown in Table 5. The L value was higher in the order of control 1, control 2, and the developed steamed fish paste cake prototype. The a value was higher in the odor of control 1, control 2, and the developed steamed fish paste cake prototype. The b value was higher in the order of the developed steamed fish paste cake prototype, control 2, and control 1, and the ΔE value (color difference) was higher in the order of control 1, control 2, and the developed steamed fish paste cake prototype.

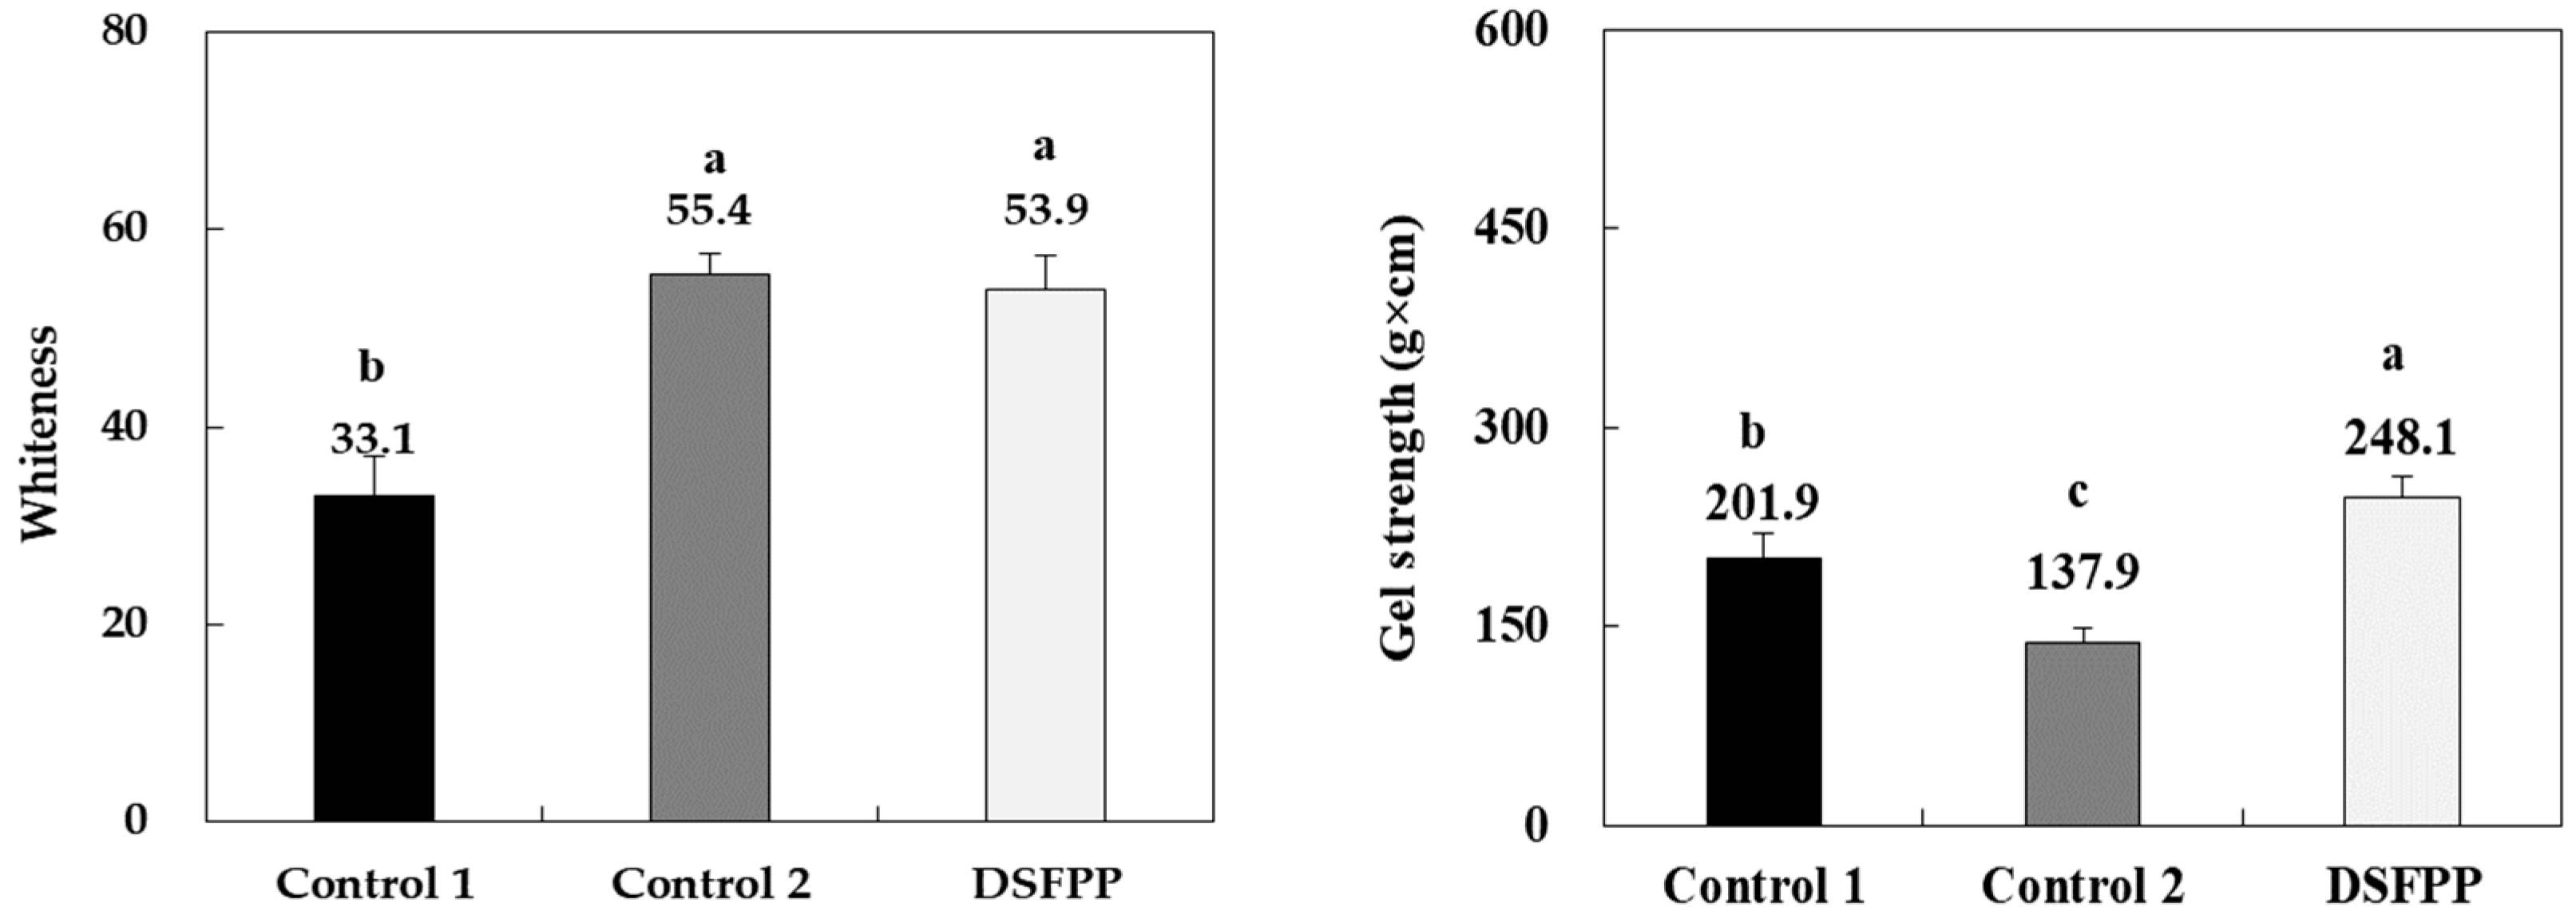
3.4.4. Whiteness and Gel Strength

The results of the whiteness and gel strength of the developed steamed fish paste cake prototype and the control groups are shown in Figure 10. The whiteness of the developed steamed fish paste cake prototype, control 1, and control 2 were 53.9, 33.1, and 55.4, respectively. The gel strength of the developed steamed fish paste cake prototype, control 1, and control 2 were 248.1, 201.9, and 137.9 g × cm. The gel strength was highest in the order of steamed fish paste cake prototype, the control 1, and control 2.

3.4.5. Descriptive Analysis

Results of the descriptive analysis of the developed steamed fish paste cake prototype are shown in Table 6. The developed steamed fish paste cake prototype showed an umami taste with 3.0 points, which was higher than the results of 5% monosodium glutamate (MSG), and lower than the 10% MSG, vegetable fish paste cake, and fish paste cake bars.

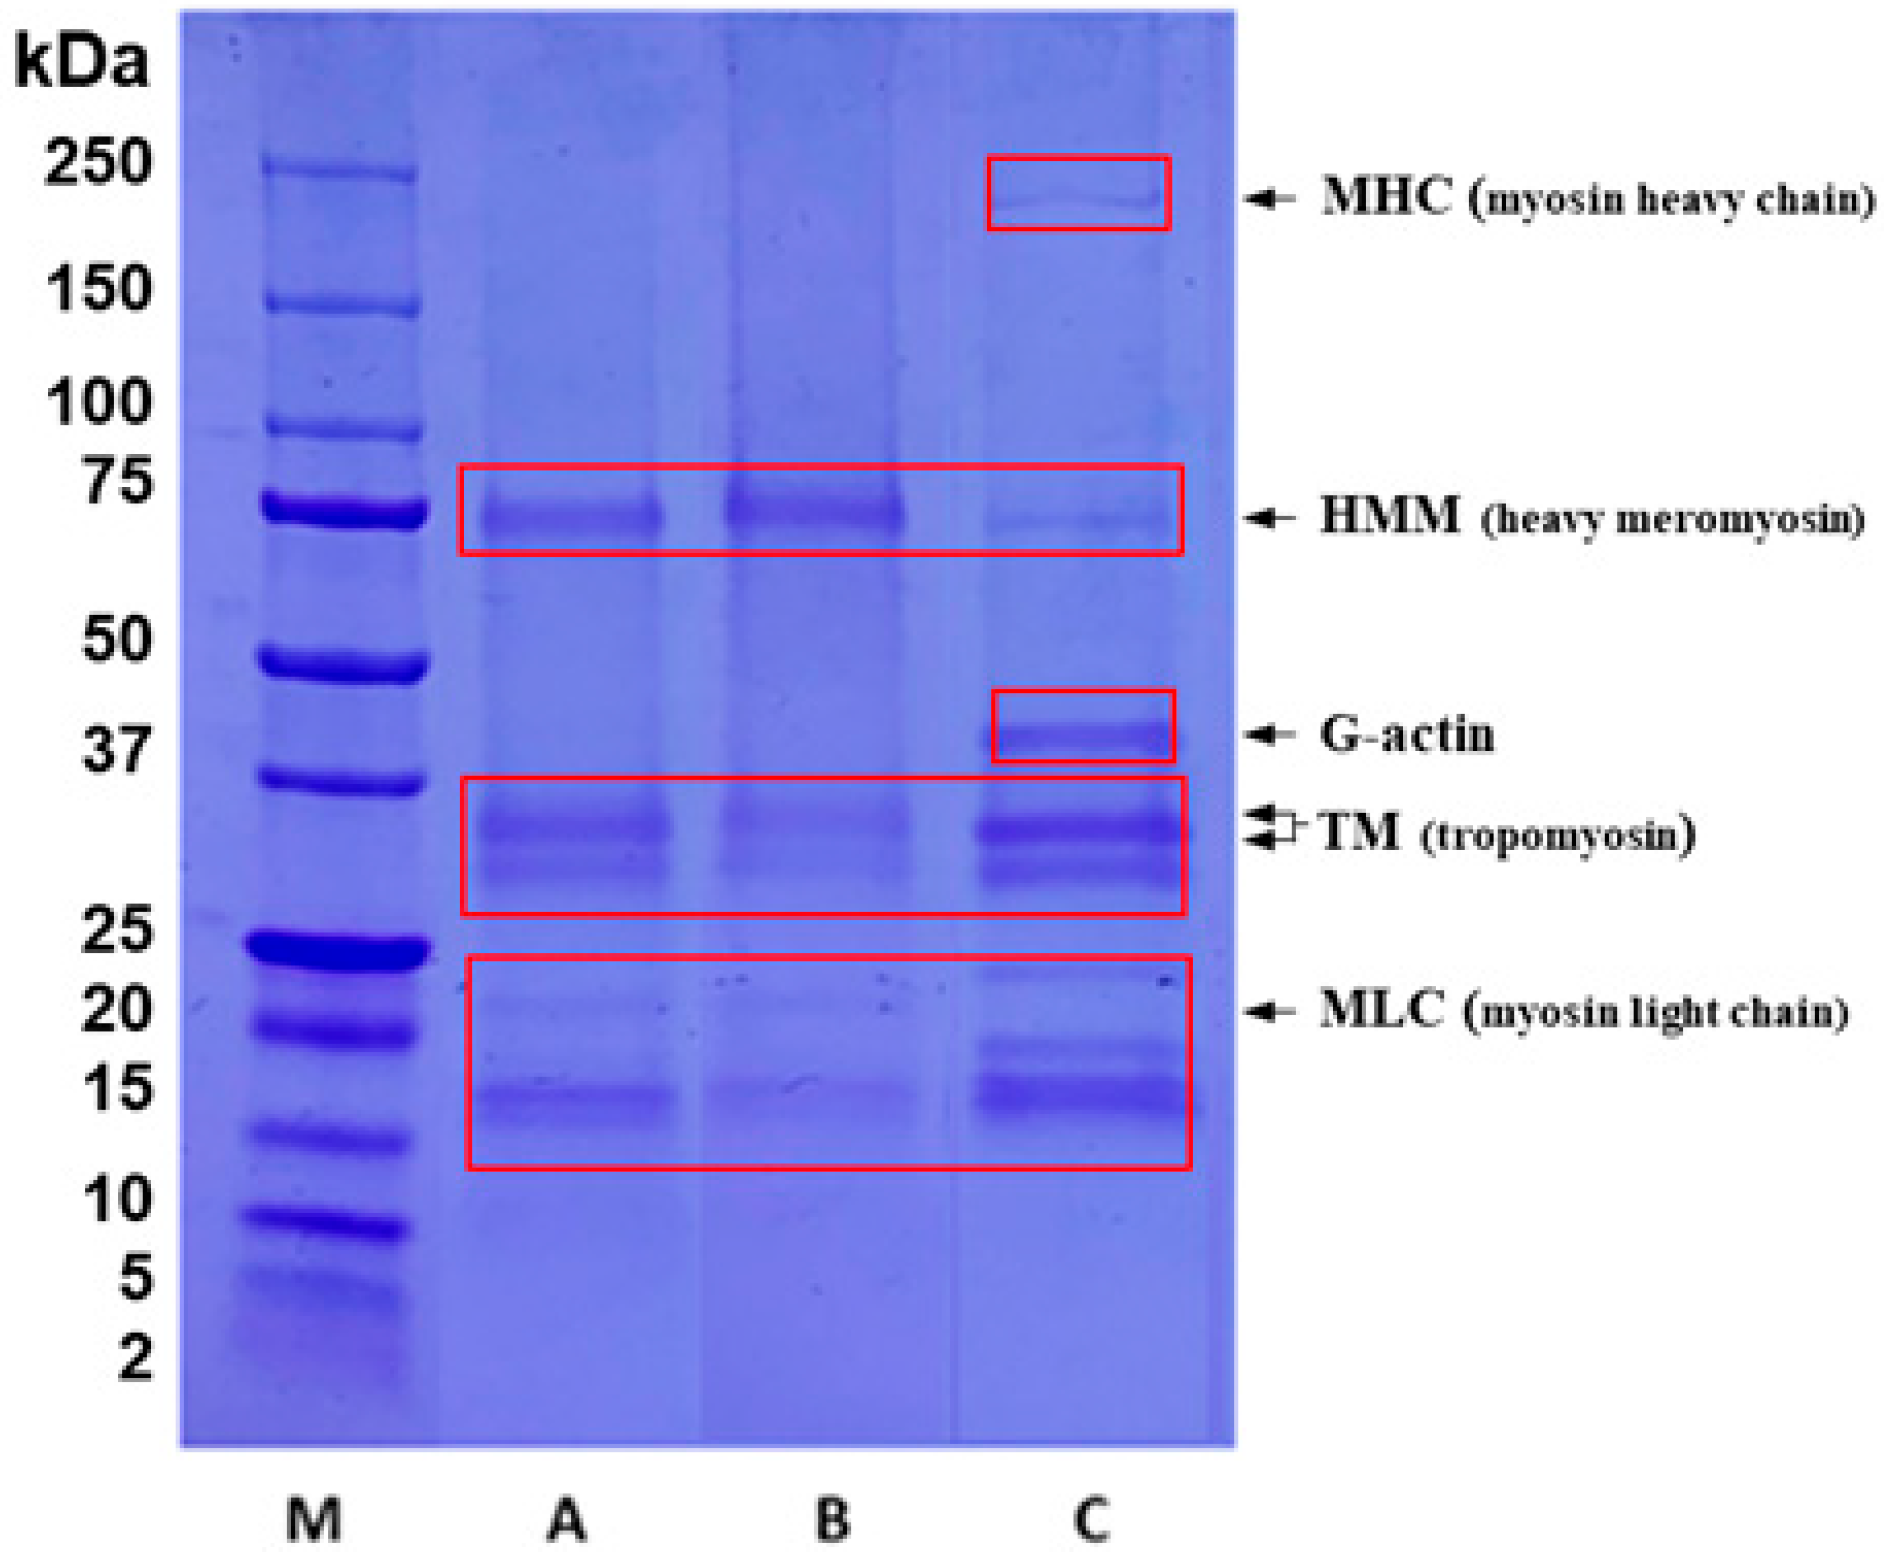
3.5. Electrophoresis

The electrophoresed protein patterns of the developed steamed fish paste cake prototype and the controls are shown in Figure 11. The myosin light chain (15 kDa) was most clearly identified in control 2 (C), followed by thinner bands in the developed steamed fish paste cake prototype (A) and control 1 (B). The α-tropomyosin (20–25 kDa) was most clearly identified in control 2, followed by thinner bands in the developed steamed fish paste cake prototype and control 1. The β-tropomyosin (25–37 kDa) was most clearly identified in control 2, followed by thinner bands in the developed steamed fish paste cake prototype and control 1. The G-actin (75–100 kDa) was only observed in control 1, and the developed steamed fish paste cake prototype showed heavy meromyosin bands. The most abundant peptide bands appeared in a molecular weight around 37 kDa, and the control 2 (C) seemed to have many peptides in this range. Different protein bands observed in the developed steamed fish paste cake prototype and the controls could be due to different processing conditions for each sample.

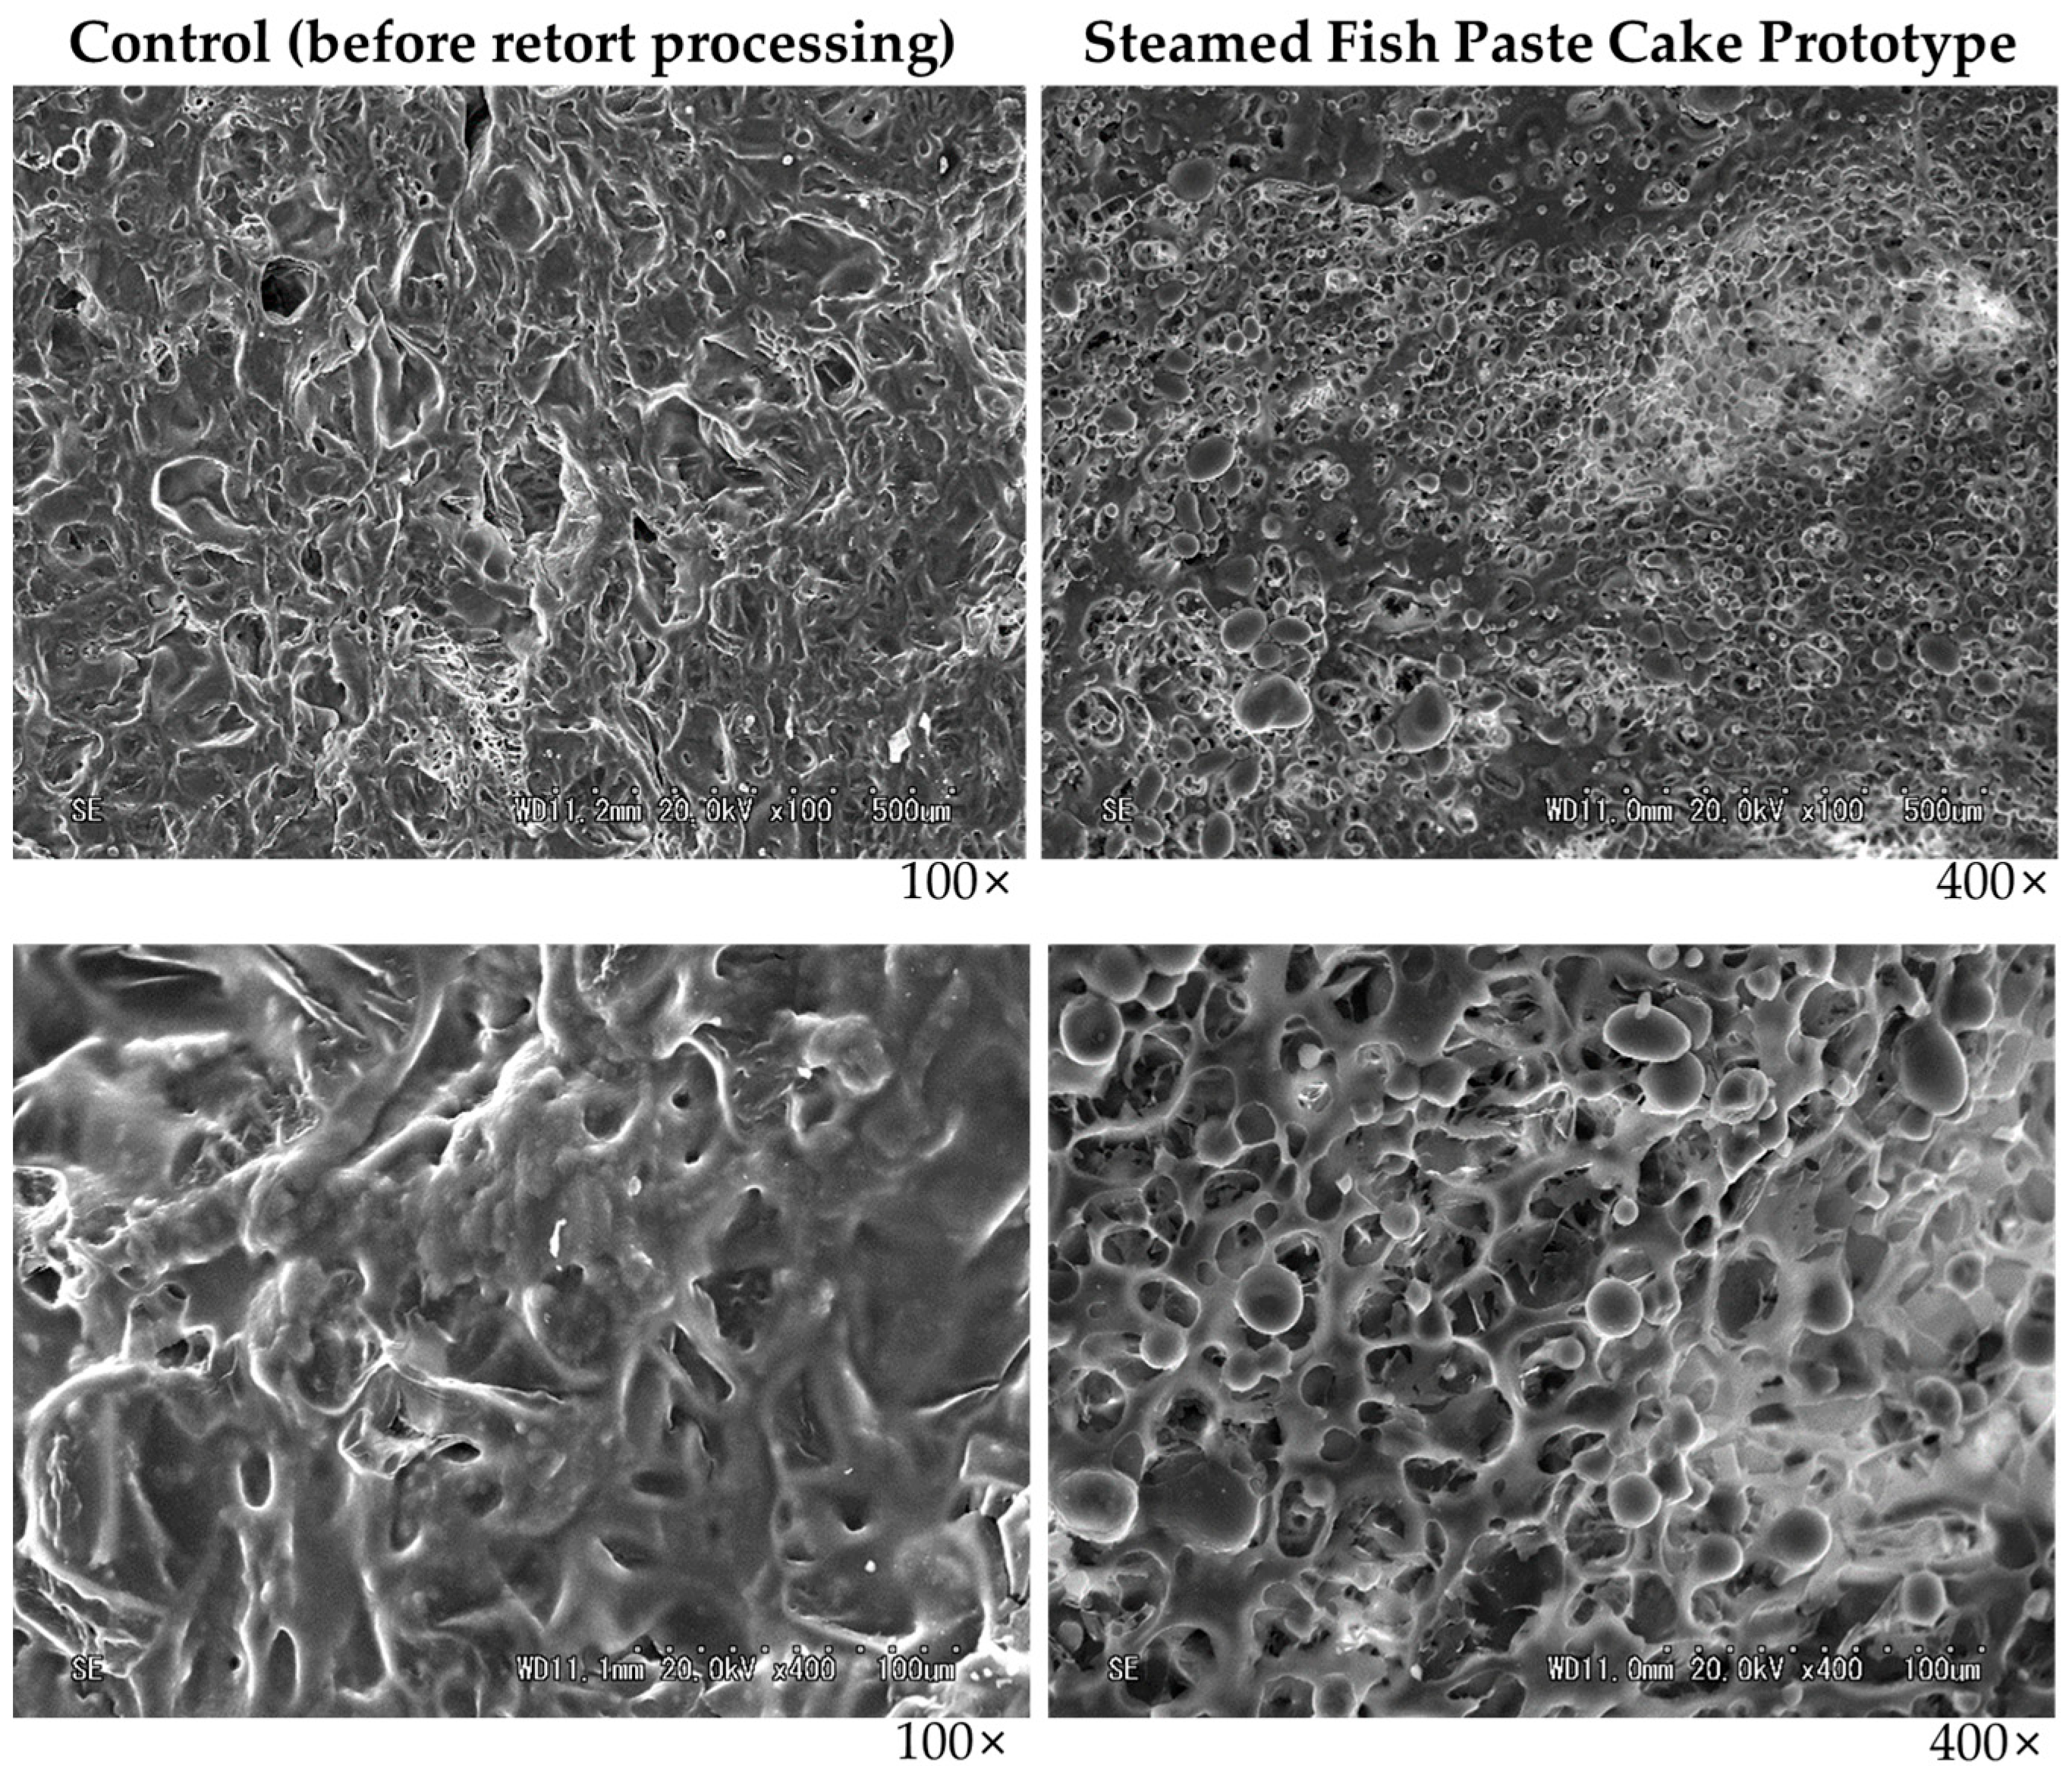
3.6. Scanning Electron Microscopy

When comparing the cross sections of each sample at 100× magnifications, the developed steamed fish paste cake prototype showed a dense network structure of actomyosin without large pores (Figure 12). However, control (fish meat paste before retort processing) had large pores and a rough cross section, which could be due to ice crystals formed during the freezing process. When each sample was examined at 400× magnifications, control showed larger pores, and the developed steamed fish paste cake prototype showed tighter pores and a smoother cross section than the control. This difference was assumed to be due to differences in the manufacturing processes of each product.

3.7. Total Amino Acid Content

The amino acids, excluding tryptophan, observed in the steamed fish paste cake prototype and the control groups are listed in Table 7. The total amino acid content of the developed steamed fish paste cake prototype and control groups 1 and 2 were 8.73, 12.28, and 10.59 g/100 g, respectively, of which the essential amino acid content was 4.10 g/100 g (46.8%) and 5.88 g/100 g (47.8%) and 5.03 g/100 g (47.7%), respectively.

3.8. Mineral Composition

The developed steamed fish paste cake prototype, control 1, and control 2 showed 35.23, 10.51, and 40.27 mg/100 g of calcium, 104.57, 120.17, and 114.80 mg/100 g of phosphorus, 122.63, 137.40, and 149.83 mg/100 g of potassium, 2.86, 2.14, and 2.59 mg/100 g of iron, and 15.19, 21.30, and 22.87 mg/100 g of magnesium, respectively (Table 8).

3.9. Shelf-Life Setting for the Steamed Fish Paste Cake Prototype

The microbial growth, VBN content, TBARS content, and sensory attributes of the developed steamed fish paste cake prototype and the control groups were investigated at different storage temperatures (25–45 °C) for a period of 160 days to estimate the shelf-life, and the results are presented in Table 9. Interestingly, no bacterial colony was detected in any samples tested during the storage period. Furthermore, during the experimental period, all samples were negative for E. coli, regardless of the storage temperature and period. The VBN content ranged from 8.78 to 12.02 mg/100 g for samples stored at 25 °C, from 8.78 to 12.25 mg/100 g for samples stored at 35 °C, and from 8.78 to 12.48 mg/100 g for samples stored at 45 °C. The lipid peroxide (TBARS) production in the developed steamed fish paste cake prototype during storage ranged from 0.52 to 0.61 MDA mg/kg at 25 °C, from 0.50 to 0.57 MDA mg/kg at 35 °C, and from 0.45 to 0.58 MDA mg/kg at 45 °C. The hygiene table of the overall preference was adopted, which is a sensory evaluation criterion of foods considering 5.0 points or more as an appropriate quality standard [41]; an overall preference score of more than six was observed in all tested samples, as shown in Table 9.

4. Discussion

Enhancement in the textural properties of surimi or surimi-based products using various protein additives has been extensively reported [1,32,44,45,46]. Here, we used ACTIVA TG-K to improve the textural properties of the developed steamed fish paste cake prototype as it facilitates deamidation, amine incorporation, and protein cross-linking [13]. ACTIVA TG-K acts as texture enhancer by forming the ε-(γ-glutamyl) lysine crosslinking of myosin heavy chain during the setting of salted fish paste, thereby contributing to a firmer and more cohesive texture [47]. Similar to previous studies on the use of TGs for improving gel strength [13,14,15,16,17,18], we observed an increase in the gel strength of the developed fish paste cake prototype containing 0.3% and 0.5% ACTIVA TG-K. Even though ACTIVA TG-K improved gel strength at both 0.3% and 0.5% concentrations, considering the manufacturing cost of the fish paste cakes, the optimal ratio of ACTIVA TG-K addition was decided at 0.3%.
High-temperature and high-pressure sterilization conditions cause softening and rapid browning of the fish paste cake, which decreases the sensory characteristics of the product. When a fish cake is heated, the amino group of fish cake protein reacts with the carbonyl group of sucrose, glucose, and xylose, producing the pigment melanoidin [48]. In other words, due to the Maillard reaction, the degree of browning of the fish cake prototype increases [49]. Therefore, to avoid the browning effect in the developed fish paste cake prototype, we studied the effect of different sugar additives. Xylose, a 5-carbon sugar with a highly reactive reducing group, compared to other saccharides [50], showed a rapid browning reaction in fish cake, resulting in a stronger yellowness than the fish cake supplemented with other sugars. In the case of trehalose, a non-reducing disaccharide having two glucose molecules in which the carbonyl groups are bonded to each other in an α-1,1 glucoside bond structure [51], the Maillard reaction does not occur because the amino group and carbonyl group do not react [49]. Therefore, it is assumed that the whiteness of the fish paste cake prototype supplemented with trehalose was relatively high.
Overall, with the increasing ratio of trehalose in the fish paste cake prototypes, the gel strength showed an increasing trend. This could be due to the fact that trehalose stabilizes protein molecules, resulting in an overall increase in the gel strength of the produced fish cake [52]. When the trehalose ratio increased from 0.0% to 2.0%, a 7.7% increase in whiteness of the fish cake prototype was observed, whereas an increase in whiteness of 5.4% was observed when the trehalose ratio increased from 0.5% to 1.0%. Based on the observed whiteness values, the most efficient amount of trehalose for fish cake processing was decided to be 1.0%. Furthermore, in the case of currently marketed steamed fish cakes (Samjin Food Co., Ltd.; Busan, Republic of Korea) in the Republic of Korea, xylose at a ratio of 0.7% was added, showing an appropriate level of sweetness in existing steamed fish cakes. Xylose has a sweetness of about 60% of sucrose, and trehalose has a sweetness of about 45% [53,54]. Therefore, if the optimal addition ratio of trehalose to fish cake is determined for sweetness, about 1.0% of trehalose is judged to be the optimal ratio for the required sweetness.
Thawed fish cake products may show destruction of nutrients, loss of texture, changes in physicochemical composition and taste, or be off-flavor or discolored [8]. Thus, to avoid these effects, we supplemented the developed fish paste cakes with different herbal or seaweed extracts. The steamed fish paste cake supplemented with basil extract showed the highest gel strength; however, the sensory evaluation results for flavor were not favorable. In the case of the fish cake supplemented with sea tangle extract, which had the highest score in the sensory evaluation, the gel strength was average, compared to other samples, but the flavor matched best with steamed fish paste cake and had a better umami taste than the steamed fish paste cake of other samples. This is believed to be due to the MSG contained in sea tangle [55]. At a 0.5% addition of sea tangle extract, the odor intensity and sensory evaluation score of the fish cake prototype increased the most. As the amount of added sea tangle extract increased, the odor intensity and sensory evaluation value of the fish cake product increased. However, considering economic feasibility, subsequent experiments were conducted with a fish cake prototype containing 0.5% sea tangle extract.
Control 2 showed a high b value (yellowness); this could be due to the Maillard reaction occurring during the manufacturing process, including a roasting process. In addition, the ΔE value of the developed steamed fish paste cake prototype showed a small difference in color, which is believed to be due to the lower b values (yellowness) due to the addition of trehalose. In general, a fish cake product with high whiteness is recognized as an excellent product [27]. Accordingly, the high whiteness values in the developed steamed fish paste cake prototype were due to the added trehalose to increase whiteness, and due to the optimized processing conditions. The whiteness of the developed steamed fish paste cake prototype was approximately 40% higher than the control 1, but there was no significant difference from the frozen steamed fish paste cake product (control 2). Frozen steamed fish paste cake product is only produced through the steaming process and is not sterilized through high-temperature and high-pressure treatment. Hence, even though the whiteness is high, it is judged to not be significantly different from the whiteness of the developed steamed fish paste cake product.
Gel strength (g × cm), a texture characteristic, is a major determinant of quality and price of the fish paste cake product [1,56,57]. It is calculated by multiplying indentation strength (g) with the depth (cm), where indentation refers to the pressing force, and depth refers to the distance until the pressing force reaches its maximum [58]. Accordingly, higher indentation strength generally shows food with hard physical properties and, when the depth is high, the force continues to drop without interruption and shows high elasticity. The average values of the indentation strength of the developed steamed fish paste cake prototype and control groups 1 and 2 were 364.0, 334.7, and 864.4 g, respectively, and the average values of the depth were 0.68, 0.60, and 0.61 cm, respectively. Consequently, control 2 had the highest gel strength, but was in the form of a hard fish paste cake with high indentation strength and low depth. In comparison, the gel strength of the developed steamed fish paste cake prototype was about 50% that of control 2, but it was in the form of a highly elastic fish paste cake with a high depth.
In the case of adapting high-temperature and high-pressure processing conditions for the steamed fish paste cake prototype, several problems, such as deterioration of the quality of the steamed fish paste cake and increase in unit price due to excessive energy consumption, may occur. Taking these aspects into consideration, an appropriate range of time and temperature is needed to manufacture steamed fish paste cake with high quality and excellent safety. Therefore, to determine optimal high-temperature and high-pressure treatment operating conditions for processing fish paste cakes, we used RSREG analysis. The design model was suitable for the lack of fit test, which indicates the suitability of the response model equation of the dependent variable [59], as the p value was found to be close to 1, at 0.103 and 0.062 for gel strength (Y1) and whiteness (Y2), respectively. In the case of sensory test (Y3), it was 0.005, which is lower than 0.05. Thus, the design model was not complete. However, the R2 value was 83.8%, which was close to 1, and the model value was lower than 0.05, indicating that it was suitable as a design model. Therefore, the target values of dependent variables [gel strength (Y1), whiteness (Y2), and sensory score (Y3)] were set at 120 g × cm, 55, and a score of 9 points, referring to the preliminary experiment results. The results of the RSREG analysis confirmed that the difference between the predicted value and the actual value was not large. Therefore, the response surface model for the manufacturing conditions (high-temperature and high-pressure treatment and time) of the steamed fish paste cake prototype derived from the above results was judged to be the optimal model.
The descriptive analysis of the developed fish paste cake product showed that the vegetable fish paste cake and fish paste cake bars had higher taste values than the 5% MSG. However, as these are fried products, they show a higher umami flavor when eaten. In addition, it is believed that the currently developed steamed fish paste cake prototype is a basic fish paste cake product not having any additional auxiliary ingredients with strong taste characteristics (vegetables, cheese, etc.), and thus its taste can be diversified by adding desirable auxiliary ingredients, even with strong taste characteristics. Consequently, it is judged that the umami taste of the developed fish paste cake prototype will be superior to the control. The odor (fishy odor) score of the developed fish paste cake prototype was 3.5 points, which was higher than that of grilled mackerel, grilled Spanish mackerel, grilled flounder, and canned sardines, and lower than that of vegetable fish paste cake and fish paste cake bars. However, the vegetable fish paste cake and fish paste cake bars have a strong savory smell due to the addition of secondary ingredients and the frying process, and thus it was judged that the developed fish paste cake prototype has a lower fishy odor score than the vegetable fish paste cake and fish paste cake bars. The appearance (color) score of the developed fish paste prototype was four-and-a-half, a color close to Munsell Table white. Trehalose showed high score for whiteness; thus, it was judged that the trehalose had an excellent effect on suppressing color change. The texture (elasticity) score of the developed fish paste cake prototype was four points, which was higher than acorn jelly, vegetable fish paste cake, konjac, and fish paste cake bar, and lower than grape-flavored jelly, which is believed to be a positive result through the addition of TGs and optimization of high-temperature and high-pressure processing conditions.
The amino acid analysis of the developed fish paste cake prototype and the control groups showed aspartic acid, glutamic acid, leucine, and lysine to be major amino acids (accounting for more than eight percent of total amino acids). There was a slight difference in the amino acid content of the studied samples. However, the difference in the total amino acid content between the developed steamed fish paste cake prototype and the control groups 1 and 2 is presumed to be due to the difference in protein content, according to the surimi mixing ratio of each product, and there was no significant difference in their amino acid composition. Furthermore, the differences in proximate composition of the developed fish paste prototype and the controls were estimated to be due to the differences in surimi content of the studied samples, and due to the differences in the mixing ratio of auxiliary ingredients.
Mineral composition of surimi and the fish paste cakes is an important quality criterion of surimi products, and it directly affects the choices of consumers [60]. In the present study, there was no significant difference observed in mineral composition and mineral content among the studied samples, except for calcium. There may be differences, depending on the type and grade of surimi, which is the main ingredient of fish paste cake, and the particularly high calcium content observed in control 2 is believed to be due to the addition of calcium carbonate in control 2 to strengthen protein. In addition, the relatively higher calcium content observed in the developed steamed fish paste cake prototype, compared to the control 1, could be due to the addition of ACTIVA TG-K to increase the elasticity of the fish paste cake prototype, which contains calcium lactate. A high calcium content observed in the developed steamed fish paste cake prototype reflects that the developed product could be a good source of calcium, which is an important mineral for human health [61].
Interestingly, the developed steamed fish paste cake prototype showed no bacterial growth during the study period of 160 days, at different storage temperatures of 25 °C to 45 °C. An average VBN content of 10.35 mg/100 g was observed during the storage period. Overall, when the storage period elapsed, regardless of the storage temperature, all samples showed a gradually increasing tendency for VBN, and the rate was more noticeable at higher storage temperatures (45 °C). The maximum lipid peroxide (TBARS) production of 0.60 MDA mg/kg was observed at 25 °C. Overall, when the storage period elapsed, regardless of the storage temperature, all samples first showed a gradually increasing tendency for TBARS, and then later a decreasing trend. The sensory attributes of the developed steamed fish paste cake prototype, depending on different storage temperatures, showed an overall preference score ranging from 7.3 to 8.8 points at 25 °C, from 7.1 to 8.8 points at 35 °C, and from 6.8 to 8.8 points at 45 °C.

5. Conclusions

While the use of surimi and the development of surimi-based products have roots in ancient times, the contemporary market, driven by quality-conscious consumers, has witnessed a surge in demand for high-quality and nutritionally rich surimi products. In response to this evolving landscape, our study focuses on the development of a steamed fish paste cake prototype capable of room temperature storage and distribution. The resulting fish paste cake prototype exhibited favorable biochemical, microbiological, textual, nutritional, and sensory properties. Notably, our innovative process enables the storage of the fish paste cake at room temperature for an impressive period of 160 days without compromising its physical, chemical, or sensory attributes. What sets our developed process apart is its ability to not only preserve the authentic flavor of surimi but also enhance the nutritional content and overall flavor of the manufactured fish paste cake prototype. This study holds promise for the broader development of fish paste cakes and other surimi-based products, catering to the increasing demand for quality and nutrition among discerning consumers.

Supplementary Materials

The following supporting information can be downloaded at: https://www.mdpi.com/article/10.3390/pr12040795/s1, Figure S1. Schematic diagram showing the optimized processing conditions for preparing the steamed fish paste cake prototype; Table S1: Signs of independent variables presented by central synthesis plan, their codes, and actual values; Table S2: Codes and actual values of samples used for optimizing processing conditions of independent variables based on central synthesis plan; Table S3: Attributes, descriptors, definitions, and standard point criteria for descriptive analysis; Table S4: Dependent variables for optimizing manufacturing conditions of steamed fish paste cake prototype; Table S5: Estimation coefficient and p value of quadratic regression equation for optimizing manufacturing conditions of steamed fish paste cake prototype; Table S6: Correlation between independent and dependent variables for the reaction model equation of steamed fish paste cake prototype optimal manufacturing conditions; Table S7: Predicted optimal conditions for manufacturing steamed fish paste cake prototype using MINITAB statistical program.

Author Contributions

Conceptualization, K.M.I.B. and J.-S.C.; methodology, J.-H.L., S.M., I.L., D.Y.K., Y.Y.K., Y.P., J.-H.S., K.M.I.B. and J.-S.C.; software, K.M.I.B. and J.-S.C.; validation, J.-H.S., K.M.I.B. and J.-S.C.; formal analysis, J.-H.L., S.I.K., S.M., I.L., D.Y.K., Y.Y.K. and Y.P.; investigation, S.M., J.-H.S., K.M.I.B. and J.-S.C.; resources, J.-S.C.; data curation, J.-H.L., S.I.K., S.M., I.L., D.Y.K., Y.Y.K. and Y.P.; writing—original draft preparation, J.-H.L., S.I.K., S.M., K.M.I.B. and J.-S.C.; writing—review and editing, S.M., J.-H.S., K.M.I.B. and J.-S.C.; visualization, J.-H.S., K.M.I.B. and J.-S.C.; supervision, J.-S.C.; project administration, J.-S.C.; funding acquisition, J.-S.C. All authors have read and agreed to the published version of the manuscript.

Funding

This research was supported by the Korea Institute of Marine Science & Technology Promotion (KIMST), and was funded by the Ministry of Oceans and Fisheries (20220272).

Data Availability Statement

Data supporting the reported results are contained within the article.

Conflicts of Interest

Authors Do Youb Kim, Ye Youl Kim and Yongjoon Park were employed by the company Samjin Food Co., Ltd. The remaining authors declare that the research was conducted in the absence of any commercial or financial relationships that could be construed as a potential conflict of interest.

References

  1. Bashir, K.M.I.; Kim, J.S.; An, J.H.; Sohn, J.H.; Choi, J.S. Natural food additives and preservatives for fish-paste products: A review of the past, present, and future states of research. J. Food Qual. 2017, 2017, 9675469. [Google Scholar] [CrossRef]
  2. Park, J.W.; Nozaki, H.; Suzuki, T.; Beliveau, J.L. Historical review of surimi technology and market developments. In Surimi and Surimi Seafood; Park, J.W., Ed.; CRC Press: New York, NY, USA, 2013; pp. 3–24. [Google Scholar]
  3. Ramírez, J.A.; Díaz-Sobac, R.; Morales, O.G.; Vázquez, M. Evaluation of freeze-dried surimi from tilapia and fat sleeper as emulsifiers [Evaluaci´on de surimi liofilizado de tilapia y dormidor como emulsificantes evaluaci´on de surimi liofilizado de tilapia e dormidor como emulsificantes]. CYTA-J. Food 2009, 2, 210–214. [Google Scholar]
  4. Ministry of Oceans and Fisheries. 2018. Available online: https://www.mof.go.kr/doc/ko/selectDoc.do?menuSeq=971&bbsSeq=10&docSeq=24208 (accessed on 30 August 2023).
  5. Iacovino, S.; Trivisonno, M.C.; Messia, M.C.; Cuomo, F.; Lopez, F.; Marconi, E. Combination of empirical and fundamental rheology for the characterization of dough from wheat flours with different extraction rate. Food Hydrocoll. A 2024, 148, 109446. [Google Scholar] [CrossRef]
  6. Yi, J.; Kerr, W.L. Combined effects of freezing rate, storage temperature and time on bread dough and baking properties. LWT Food Sci. Technol. 2009, 42, 1474–1483. [Google Scholar] [CrossRef]
  7. Wilson, D.R.; Dabrowski, L.; Stringer, S.; Moezelaar, R.; Brocklehurst, T.F. High pressure in combination with elevated temperature as a method for the sterilisation of food. Trends Food Sci. Technol. 2008, 19, 289–299. [Google Scholar] [CrossRef]
  8. Chiozzi, V.; Agriopoulou, S.; Varzakas, T. Advances, applications, and comparison of thermal (pasteurization, sterilization, and aseptic packaging) against non-thermal (ultrasounds, UV radiation, ozonation, high hydrostatic pressure) technologies in food processing. Appl. Sci. 2022, 12, 2202. [Google Scholar] [CrossRef]
  9. Koutsoumanis, K.; Alvarez-Ordóñez, A.; Bolton, D.; Bover-Cid, S.; Chemaly, M.; Davies, R.; De Cesare, A.; Herman, L.; Hilbert, F.; Lindqvist, R.; et al. The efficacy and safety of high-pressure processing of food. EFSA J. 2022, 20, e07128. [Google Scholar] [PubMed]
  10. Abraha, B.; Admassu, H.; Mahmud, A.; Tsighe, N.; Shui, X.W.; Fang, y. Effect of processing methods on nutritional and physico-chemical composition of fish: A review. MOJ Food Process Technol. 2018, 6, 376–382. [Google Scholar] [CrossRef]
  11. Cruz-Romero, M.C.; Kerry, J.P. Packaging of cooked meats and muscle-based, convenience-style processed foods. In Processed meats; Kerry, J.F., Ed.; Woodhead Publishing: Cambridge, UK, 2011; Chapter 26; pp. 666–705. [Google Scholar]
  12. Fardella, M.; Ramírez, C.; Caballero, E.; Sánchez, E.; Pinto, M.; Núñez, H.; Valencia, P.; Almonacid, S.; Simpson, R. Variable retort temperature profiles (VRTPs) and retortable pouches as tools to minimize furan formation in thermally processed food. Foods 2021, 10, 2205. [Google Scholar] [CrossRef] [PubMed]
  13. Kuraishi, C.; Yamazaki, K.; Susa, Y. Transglutaminase: Its utilization in the food industry. Food Rev. Int. 2007, 17, 221–246. [Google Scholar] [CrossRef]
  14. Runglerdkriangkrai, J.; Banlue, K.; Raksakulthai, N. High temperature tolerant fish protein gel using transglutaminase and sodium ascorbate. Kasetsart J. Nat. Sci. 2006, 40, 84–90. [Google Scholar]
  15. Xu, Y.; Lv, Y.; Yin, Y.; Zhao, H.; Li, X.; Yi, S.; Li, J. Improvement of the gel properties and flavor adsorption capacity of fish myosin upon yeast β-glucan incorporation. Food Chem. 2022, 397, 133766. [Google Scholar] [CrossRef] [PubMed]
  16. Monteiro, M.L.G.; Mársico, E.T.; Lázaro, C.A.; da Silva Canto, A.C.V.C.; da Costa Lima, B.R.C.; da Cruz, A.G.; Conte-Júnior, C.A. Effect of transglutaminase on quality characteristics of a value-added product tilapia wastes. J. Food Sci. Technol. 2015, 52, 2598–2609. [Google Scholar] [CrossRef] [PubMed]
  17. Muoi, N.V.; Truc, T.T.; Ngan, V.H. The influence of additives on frozen snakehead fish surimi and the application of transglutaminase to fish cakes. Acta Sci. Pol. Technol. Aliment. 2019, 18, 125–133. [Google Scholar] [CrossRef] [PubMed]
  18. dos Santos, M.; Ribeiro, W.O.; Monteiro, J.d.S.; dos Santos, B.A.; Campagnol, P.C.B.; Pollonio, M.A.R. Effect of transglutaminase treatment on the structure and sensory properties of rice- or soy-based hybrid sausages. Foods 2023, 12, 4226. [Google Scholar] [CrossRef] [PubMed]
  19. Lund, M.N.; Ray, C.A. Control of Maillard reactions in foods: Strategies and chemical mechanisms. J. Agric. Food Chem. 2017, 65, 4537–4552. [Google Scholar] [CrossRef] [PubMed]
  20. Aganovic, K.; Hertel, C.; Vogel, R.F.; Johne, R.; Schlüter, O.; Schwarzenbolz, U.; Jäger, H.; Holzhauser, T.; Bergmair, J.; Roth, A.; et al. Aspects of high hydrostatic pressure food processing: Perspectives on technology and food safety. Compr. Rev. Food Sci. Food Saf. 2021, 20, 3225–3266. [Google Scholar] [CrossRef] [PubMed]
  21. Olsson, C.; Swenson, J. Structural comparison between sucrose and trehalose in aqueous solution. J. Phys. Chem. B 2020, 124, 3074–3082. [Google Scholar] [CrossRef]
  22. Chen, A.; Tapia, H.; Goddard, J.M.; Gibney, P.A. Trehalose and its applications in the food industry. Compr. Rev. Food Sci. Food Saf. 2022, 21, 5004–5037. [Google Scholar] [CrossRef] [PubMed]
  23. Xu, S.; Li, P.; Han, F.; Zhou, H.; Zhou, K.; Wang, Y.; Cai, K.; Li, C.; Xu, B. Myofibrillar protein interacting with trehalose elevated the quality of frozen meat. Foods 2022, 11, 1041. [Google Scholar] [CrossRef] [PubMed]
  24. Elbein, A.D.; Pan, Y.T.; Pastuszak, I.; Carroll, D. New insights on trehalose: A multifunctional molecule. Glycobiology 2003, 13, 17R–27R. [Google Scholar] [CrossRef]
  25. Jain, N.K.; Roy, I. Effect of trehalose on protein structure. Protein Sci. 2009, 18, 24–36. [Google Scholar] [CrossRef] [PubMed]
  26. Brom, J.A.; Petrikis, R.G.; Pielak, G.J. How sugars protect dry protein structure. Biochemistry 2023, 62, 1044–1052. [Google Scholar] [CrossRef] [PubMed]
  27. Yamazawa, M.; Murase, M.; Shiga, I. Improvement of the quality of retorted Kamaboko-I. Influence of heating conditions on the quality of Kamaboko. Bull. Jpn. Soc. Sci. Fish. 1979, 45, 187–192. [Google Scholar] [CrossRef]
  28. Gupta, S.; Abu-Ghannam, N. Recent developments in the application of seaweeds or seaweed extracts as a means for enhancing the safety and quality attributes of foods. Innov. Food Sci. Emerg. Technol. 2011, 12, 600–609. [Google Scholar] [CrossRef]
  29. Afrin, F.; Islam, M.M.; Rasul, M.G.; Sarkar, M.S.I.; Yuan, C.; Shah, A.K.M.A. Effects of seaweed extracts on the quality and shelf life of Nile tilapia (Oreochromis niloticus) fillets during frozen storage. Food Chem. Adv. 2023, 3, 100388. [Google Scholar] [CrossRef]
  30. Eskin, N.A.M.; Ho, C.-T.; Shahidi, F. Browning reactions in foods. In Biochemistry of Foods, 3rd ed.; Academic Press: San Diego, CA, USA, 2013; Chapter 6; pp. 245–289. [Google Scholar]
  31. Tamanna, N.; Mahmood, N. Food processing and Maillard reaction products: Effect on human health and nutrition. Int. J. Food Sci. 2015, 2015, 526762. [Google Scholar] [CrossRef] [PubMed]
  32. Benjakul, S.; Chantakun, K.; Karnjanapratum, S. Impact of retort process on characteristics and bioactivities of herbal soup based on hydrolyzed collagen from seabass skin. J. Food Sci. Technol. 2018, 55, 3779–3791. [Google Scholar] [CrossRef] [PubMed]
  33. Chicco, D.; Warrens, M.J.; Jurman, G. The coefficient of determination R-squared is more informative than SMAPE, MAE, MAPE, MSE and RMSE in regression analysis evaluation. PeerJ Comput. Sci. 2021, 7, e623. [Google Scholar] [CrossRef]
  34. Bezerra, M.A.; Santelli, R.E.; Oliveira, E.P.; Villar, L.S.; Escaleira, L.A. Response surface methodology (RSM) as a tool for optimization in analytical chemistry. Talanta 2008, 76, 965–977. [Google Scholar] [CrossRef] [PubMed]
  35. MFDS—Ministry of Food and Drug Safety. Food Codex. In 6th General Analysis Method. Foodcode (Sik-Poom-Gong-Jeon); MFDS: Cheongju, Republic of Korea, 2023; Available online: https://various.foodsafetykorea.go.kr/fsd/#/ext/Document/FC (accessed on 31 August 2023).
  36. FAO. Guidelines on Nutrition Labeling, CXG 2-1985, Adopted in 1985 and Amended in 2021, CODEX Alimentarius, International Food Standards, Food and Agricultural Organization of the United Nations, pp. 1–12. Available online: https://www.fao.org/fao-who-codexalimentarius/sh-proxy/en/?lnk=1&url=https%253A%252F%252Fworkspace.fao.org%252Fsites%252Fcodex%252FStandards%252FCXG%2B2-1985%252FCXG_002e.pdf (accessed on 29 November 2023).
  37. Bashir, K.M.I.; Park, Y.J.; An, J.H.; Choi, S.J.; Kim, J.H.; Baek, M.K.; Kim, A.; Sohn, J.H.; Choi, J.S. Antioxidant properties of Scomber japonicus hydrolysates prepared by enzymatic hydrolysis. J. Aquat. Food Prod. Technol. 2018, 27, 107–121. [Google Scholar] [CrossRef]
  38. De Leon, J.A.D.; Borges, C.R. Evaluation of oxidative stress in biological samples using the thiobarbituric acid reactive substances assay. J. Vis. Exp. 2020, 159, e61122. [Google Scholar] [CrossRef]
  39. Park, J.-R.; Kim, E.-G.; Jang, Y.-H.; Kim, K.-M. Screening and identification of genes affecting grain quality and spikelet fertility during high-temperature treatment in grain filling stage of rice. BMC Plant Biol. 2021, 21, 263. [Google Scholar] [CrossRef] [PubMed]
  40. Deshwal, G.K.; Gómez-Mascaraque, L.G.; Fenelon, M.; Huppertz, T. Determination of minerals in soft and hard cheese varieties by ICP-OES: A comparison of digestion methods. Molecules 2023, 28, 3988. [Google Scholar] [CrossRef] [PubMed]
  41. Sutikno, L.A.; Bashir, K.M.I.; Kim, H.; Park, Y.; Won, N.E.; An, J.H.; Choi, J.S. Improvement in physicochemical, microbial, and sensory properties of common Squid (Todarodes pacificus Steenstrup) by superheated steam roasting in combination with smoking treatment. J. Food Qual. 2019, 2019, 8721725. [Google Scholar] [CrossRef]
  42. N’Kouka, K.D.; Klein, B.P.; Lee, S.H. Developing a lexicon for descriptive analysis of soymilks. J. Food Sci. 2006, 69, 259–263. [Google Scholar] [CrossRef]
  43. Hildebrandt, G.; Schneider-Häder, B. Sensory Analysis: Overview of Methods and Fields of Application—DLG-Sensory Testing; DLG-Expert report 2/2009; DLG e.V.: Frankfurt, Germany, 2009; pp. 1–6. [Google Scholar]
  44. Jang, J.A.; Kim, H.A.; Choi, S.K. Quality characteristics of fish cake made with silver pomfret (Pampus argenteus) with added wasabi powder. J. East. Asian Soc. Diet. Life 2010, 20, 103–112. [Google Scholar]
  45. Kim, H.J.; Lee, Y.Y.; Lee, B.W.; Woo, K.S.; Cho, J.H.; Lee, J.; Lee, B. Quality characteristics of fish cakes containing flour derived from eight rice varieties. Korean J. Crop Sci. 2020, 65, 40–46. [Google Scholar]
  46. Liu, Y.; Huang, Y.; Wang, Y.; Zhong, J.; Li, S.; Zhu, B.; Dong, X. Application of cod protein-stabilized and casein-stabilized high internal phase emulsions as novel fat substitutes in fish cake. LWT 2023, 173, 114267. [Google Scholar] [CrossRef]
  47. Santhi, D.; Kalaikannan, A.; Malairaj, P.; Arun Prabhu, S. Application of microbial transglutaminase in meat foods: A review. Crit. Rev. Food Sci. Nutr. 2017, 57, 2071–2076. [Google Scholar] [CrossRef] [PubMed]
  48. Gao, Y.; Shi, H.; Xiong, Q.; Wu, R.; Hu, Y.; Liu, R. A novel strategy for inhibiting AGEs in fried fish cakes: Grape seed extract surimi slurry coating. Food Control 2023, 154, 109948. [Google Scholar] [CrossRef]
  49. Teramoto, N.; Sachinvala, N.D.; Shibata, M. Trehalose and trehalose-based polymers for environmentally benign, biocompatible and bioactive materials. Molecules 2008, 13, 1773–1816. [Google Scholar] [CrossRef] [PubMed]
  50. Alam, Y.H.; Kim, R.; Jang, C. Metabolism and health impacts of dietary sugars. J. Lipid Atheroscler. 2022, 11, 20–38. [Google Scholar] [CrossRef] [PubMed]
  51. Kuttel, M.M.; Naidoo, K.J. Free energy surfaces for the α (1→4)-glycosidic linkage: Implications for polysaccharide solution structure and dynamics. J. Phys. Chem. B 2005, 109, 7468–7474. [Google Scholar] [CrossRef] [PubMed]
  52. Jain, N.K.; Roy, I. Trehalose and protein stability. Curr. Protoc. Protein Sci. 2010, 59, 4–9. [Google Scholar] [CrossRef] [PubMed]
  53. Jun, Y.J.; Lee, J.; Hwang, S.; Kwak, J.H.; Ahn, H.Y.; Bak, Y.K.; Koh, J.; Lee, J.H. Beneficial effect of xylose consumption on postprandial hyperglycemia in Korean: A randomized double-blind, crossover design. Trials 2016, 17, 139. [Google Scholar] [CrossRef] [PubMed]
  54. Schiraldi, C.; Di Lernia, I.; De Rosa, M. Trehalose production: Exploiting novel approaches. Trends Biotechnol. 2002, 20, 420–425. [Google Scholar] [CrossRef] [PubMed]
  55. Figueroa, V.; Farfán, M.; Aguilera, J.M. Seaweeds as novel foods and source of culinary flavors. Food Rev. Int. 2023, 39, 1–26. [Google Scholar] [CrossRef]
  56. Benjakul, S.; Visessanguan, W.; Chantarasuwan, C. Effect of high temperature setting on gelling characteristics of surimi from some tropical fish. Int. J. Food Sci. Tech. 2004, 39, 671–680. [Google Scholar] [CrossRef]
  57. Minh, N.P.; Nga, N.H. Different conditions impacting to physicochemical properties and sensory characteristics of bronze featherback sausage. Int. J. Appl. Eng. Res. 2018, 13, 1328–1331. [Google Scholar]
  58. Kang, S.I.; Kim, J.S.; Park, S.Y.; Cho, H.J.; Jang, M.S.; Oh, J.Y.; Choi, J.S. Development and quality attributes of paste sausage supplemented with common squid (Todarodes pacifics) tailored for the elderly. Appl. Sci. 2023, 13, 10735. [Google Scholar] [CrossRef]
  59. Hou, P.Z.; Regenstein, J.M. Optimization of extraction conditions for Pollock skin gelatin. J. Food Sci. 2006, 69, C393–C398. [Google Scholar] [CrossRef]
  60. Li, W.; Wen, L.; Xiong, S.; Xiao, S.; An, Y. Investigation of the effect of chemical composition of surimi and gelling temperature on the odor characteristics of surimi products based on gas chromatography-mass spectrometry/olfactometry. Food Chem. 2023, 420, 135977. [Google Scholar] [CrossRef] [PubMed]
  61. Jaziri, A.Z.; Shapawi, R.; Mokhtar, R.A.M.; Noordin, W.N.M.; Huda, A.N. Chemical composition of lizardfish surimi by-product: Focus on macro and micro-minerals contents. Curr. Res. Nutr. Food Sci. 2021, 9, 52–61. [Google Scholar] [CrossRef]
Figure 1. Schematic diagram for steamed fish paste cake prototype manufacturing process.
Processes 12 00795 g001
Figure 2. Yellowness and whiteness of steamed fish paste cake prototypes supplemented with different sugar additives. Values are means ± S.E. Different superscript letters (a–d) indicate significant differences among means by Duncan’s test (p < 0.05).
Processes 12 00795 g002
Figure 3. Color changes in steamed fish paste cake prototype supplemented with different sugar additives.
Processes 12 00795 g003
Figure 4. Gel strength and whiteness of steamed fish paste cake prototype supplemented with different concentrations of trehalose. Values are means ± S.E. Different superscript letters (a, b) indicate significant differences among means by Duncan’s test (p < 0.05).
Processes 12 00795 g004
Figure 5. Room temperature steamed fish cake samples containing natural herbal or seaweed extract.
Processes 12 00795 g005
Figure 6. Gel strength and sensory properties of steamed fish paste cake prototype supplemented with natural herbal or seaweed extracts. Values are means ± S.E. Different superscript letters (a–d) indicate significant differences among means by Duncan’s test (p < 0.05).
Processes 12 00795 g006
Figure 7. Odor intensity and sensory properties of steamed fish paste cake prototype supplemented with sea tangle extract at different concentrations. Values are means ± S.E. Different superscript letters (a–c) indicate significant differences among means by Duncan’s test (p < 0.05).
Processes 12 00795 g007
Figure 8. 3D response table graph showing correlation between the independent variables (X1 and X2) and dependent variables (Y1, Y2, and Y3). X1: High-temperature processing temperature, °C; X2: High-temperature and high-pressure treatment time, min; Y1: Gel strength, g × cm; Y2: Whiteness; Y3: Sensory score.
Processes 12 00795 g008
Figure 9. Odor intensity and VBN content of the steamed fish paste cake prototype and control groups. Values are means ± S.E. VBN: Volatile basic nitrogen; DSFPP: The developed room temperature steamed fish cake product. Different superscript letters (a–c) indicate significant differences among means by Duncan’s test (p < 0.05).
Processes 12 00795 g009
Figure 10. Whiteness and gel strength of the steamed fish paste cake prototype and the control groups. Values are means ± S.E. DSFPP: The developed room temperature steamed fish cake product. Different superscript letters (a–c) indicate significant differences among means by Duncan’s test (p < 0.05).
Processes 12 00795 g010
Figure 11. SDS–PAGE electrophoresed protein patterns of the developed steamed fish paste cake prototype and the control groups. M: Marker; A: The developed steamed fish paste cake prototype; B: Control 1; C: Control 2.
Processes 12 00795 g011
Figure 12. Scanning electron microscope observation of the fish paste cake before retort processing and after retort processing (the developed fish paste cake prototype) at magnifications of 100× (left) and 400× (right).
Processes 12 00795 g012
Table 1. Gel strength of the steamed fish paste cake prototype at different ACTIVA TG-K concentrations.
ACTIVA TG-K Ratio
(%)
Indentation Strength
(g)
Depth
(cm)
Gel Strength
(g × cm)
0.0116.40.6879.27 ± 4.78
0.1196.70.65107.24 ± 9.32
0.3186.40.82123.35 ± 7.10
0.5243.00.69127.63 ± 6.30
ACTIVA TG-K: ACTIVA transglutaminase-K.
Table 2. Concise equation and R2 and p value with considerable significance (p < 0.05) among the reaction model equations.
Dependent VariableResponse Model EquationR2p Value
Y1119.11 − 11.60X1 − 3.75X294.2%0.001
Y252.63 − 6.98X1 − 2.09X2 − 1.79X395.5%0.001
Y37.70 + 0.56X1 + 0.78X2 − 0.68X12 − 1.03X2292.4%0.001
Y1: Gel strength (g × cm); Y2: Whiteness; Y3: Sensory score; R2: Coefficient of determination. X1: High-temperature processing temperature, °C; X2: High-temperature and high-pressure treatment time, min.
Table 3. Predicted and actual values of dependent variables derived under optimal conditions.
Dependent VariablePredicted ValueActual Value
Y1123.1121.4 ± 2.7
Y255.053.8 ± 1.6
Y1: Gel strength (g × cm); Y2: Whiteness.
Table 4. Proximate composition, pH, and energy of the steamed fish paste cake prototype and the controls.
SampleProximate Composition (g/100 g)pHEnergy (2)
(kcal/100 g)
MoistureProteinLipidsAsh (1)Carbohydrates
Control 162.713.20.214.39.67.3393.0
Control 269.311.40.36.212.87.3699.5
Fish paste cake prototype66.29.10.111.213.47.2890.9
(1) Ash = 100 − (Moisture + Protein + Lipids + Carbohydrates); (2) Energy = [(Protein × 4.0) + (Lipids × 9.0) + (Carbohydrates × 4.0)] × 0.5.
Table 5. Hunter color values of the steamed fish paste cake prototype and the control groups.
ProductHunter Values
LabΔE
Control 169.84 ± 0.052 b−2.32 ± 0.13 ab10.82 ± 0.57 c53.05 ± 1.07 b
Control 271.3 ± 0.99 b−2.44 ± 0.05 b4.19 ± 0.86 b52.35 ± 1.62 b
Fish paste cake prototype61.24 ± 0.79 a−2.56 ± 0.06 a2.11 ± 0.54 a42.1 ± 1.23 a
Values are means ± S.E. L: Lightness; a: Redness; b: Yellowness; ΔE: Color difference. Different superscript letters (a–c) in each column indicate significant differences among means by Duncan’s test (p < 0.05).
Table 6. Descriptive analysis of the steamed fish paste cake prototype and the control groups.
ProductSensory Evaluation
UmamiOdorApperanceTexture
Control 14.59 ± 0.51 b4.18 ± 0.39 a3.65 ± 0.49 ab1.65 ± 0.49 a
Control 24.29 ± 0.47 b4.12 ± 0.33 a3.29 ± 0.47 ab3.59 ± 0.51 b
Fish paste cake prototype3.29 ± 0.47 a3.41 ± 0.51 a4.41 ± 0.51 b4.12 ± 0.49 b
Values are means ± S.E. Different superscript letters (a,b) in each column indicate significant differences among means by Duncan’s test (p < 0.05).
Table 7. Total amino acid content of fish paste cake steamed at room temperature and the control groups.
Amino Acids (g/100 g)DFPCPControl 1Control 2
Alanine0.50 (5.8)0.72 (5.9)0.62 (5.8)
Aspartic acid0.91 (10.5)1.30 (10.6)1.13 (10.7)
Cysteine0.05 (0.6)0.09 (0.7)0.06 (0.5)
Glutamic acid1.91 (21.9)2.51 (20.5)2.09 (19.7)
Glycine0.38 (4.4)0.44 (3.6)0.54 (5.1)
Proline0.25 (2.8)0.37 (3.0)0.32 (3.0)
Serine0.37 (4.3)0.53 (4.3)0.47 (4.4)
Tyrosine0.26 (3.0)0.44 (3.6)0.33 (3.1)
Non-essential amino acids–total4.63 (53.3)6.40 (52.2)5.56 (52.3)
Arginine0.52 (6.0)0.75 (6.1)0.65 (6.2)
Histidine0.18 (2.0)0.27 (2.2)0.22 (2.1)
Isoleucine0.40 (4.6)0.59 (4.8)0.50 (4.8)
Leucine0.71 (8.1)1.02 (8.3)0.88 (8.3)
Lysine0.85 (9.7)1.17 (9.5)1.03 (9.7)
Methionine0.28 (3.2)0.40 (3.3)0.34 (3.2)
Phenylalanine0.33 (3.8)0.51 (4.1)0.41 (3.9)
Threonine0.40 (4.5)0.56 (4.5)0.48 (4.6)
Valine0.43 (4.9)0.61 (5.0)0.52 (4.9)
Essential amino acids–total4.10 (46.8)5.88 (47.8)5.03 (47.7)
Total amino acids content8.73 (100.1)12.28 (100.0)10.59 (100.0)
DFPCP: The developed fish paste cake product.
Table 8. Mineral content of fish paste cake prototype steamed at room temperature and the control groups.
SampleMineral Content (mg/100 g)
CaPKFeMg
Control 110.51 ± 1.38 c120.17 ± 4.60 a137.40 ± 4.33 a2.14 ± 0.27 b21.30 ± 2.62 a
Control 240.27 ± 3.62 a114.80 ± 4.03 a149.83 ± 5.15 a2.59 ± 0.44 ab22.87 ± 1.56 a
Fish paste cake prototype33.23 ± 3.45 b104.57 ± 4.08 a122.63 ± 5.10 a2.86 ± 0.29 a15.19 ± 1.46 b
Ca: Calcium; P: Phosphorus; K: Potassium; Fe: Iron; Mg: Magnesium. Different superscript letters (a–c) in each column indicate significant differences among means by Duncan’s test (p < 0.05).
Table 9. Quality indicators for setting expiration date of the steamed fish paste cake prototype.
Storage ConditionQuality Indicator
TemperatureDayOA
(Score)
VBN
(mg/100 g)
TBARS
(MDA mg/kg)
TBC
(Log CFU/g)
E. coli
(CFU/g)
25 °C08.8 ± 0.48 ab8.78 ± 0.70 a0.57 ± 0.02 cdefNDNegative
158.7 ± 0.67 ab8.85 ± 0.70 abc0.61 ± 0.01 fNDNegative
308.7 ± 0.67 ab9.10 ± 0.35 abc0.60 ± 0.01 efNDNegative
458.4 ± 0.52 ab9.57 ± 0.73 abcd0.59 ± 0.01 efNDNegative
608.2 ± 0.52 ab9.45 ± 0.70 abcd0.59 ± 0.03 efNDNegative
758.3 ± 0.53 ab10.03 ± 0.40 bcd0.59 ± 0.02 cdefNDNegative
908.3 ± 0.42 ab10.50 ± 0.35 cd0.55 ± 0.01 bcdNDNegative
1057.8 ± 0.82 ab10.62 ± 0.88 bcde0.58 ± 0.01 cdefNDNegative
1307.8 ± 0.74 ab10.03 ± 0.81 abcd0.55 ± 0.01 bcdNDNegative
1457.5 ± 0.67 ab11.08 ± 0.53 cde0.52 ± 0.02 abNDNegative
1607.3 ± 0.48 a12.02 ± 0.20 e0.52 ± 0.01 abNDNegative
35 °C08.8 ± 0.48 ab8.78 ± 0.70 a0.57 ± 0.02 cdefNDNegative
158.5 ± 0.71 abc8.98 ± 0.40 ab0.51 ± 0.02 abNDNegative
308.7 ± 0.67 abc9.45 ± 0.70 ab0.54 ± 0.02 abcNDNegative
458.6 ± 0.52 abc9.68 ± 0.40 ab0.57 ± 0.01 bcNDNegative
608.3 ± 0.52 abc10.62 ± 0.40 c0.52 ± 0.04 abcNDNegative
758.3 ± 0.53 abc10.85 ± 0.35 c0.57 ± 0.03 bcNDNegative
908.6 ± 0.48 bc10.62 ± 0.40 c0.51 ± 0.05 abcNDNegative
1057.8 ± 0.82 abc10.85 ± 0.61 c0.53 ± 0.01 abcNDNegative
1308.7 ± 0.74 abc11.08 ± 0.20 c0.51 ± 0.01 aNDNegative
1457.4 ± 0.74 abc10.85 ± 0.61 c0.50 ± 0.01 aNDNegative
1607.1 ± 0.42 abc12.25 ± 0.35 d0.50 ± 0.01 aNDNegative
45 °C08.8 ± 0.48 ab8.78 ± 0.70 a0.57 ± 0.02 cdefNDNegative
158.7 ± 0.67 bc9.45 ± 0.35 abc0.58 ± 0.03 eNDNegative
308.6 ± 0.70 abc9.92 ± 0.40 abcd0.51 ± 0.01 cdNDNegative
458.3 ± 0.42 abc9.80 ± 0.61 abcd0.54 ± 0.01 dNDNegative
608.1 ± 0.48 abc10.73 ± 0.88 abcdef0.52 ± 0.01 cdNDNegative
758.1 ± 0.52 abc10.97 ± 0.40 bcdef0.54 ± 0.01 dNDNegative
908.2 ± 0.32 abc11.20 ± 0.70 bcdef0.49 ± 0.03 abcdNDNegative
1057.8 ± 0.67 abc11.32 ± 1.13 bcdef0.46 ± 0.02 abNDNegative
1308.8 ± 0.74 bc11.78 ± 0.73 def0.45 ± 0.02 abNDNegative
1457.1 ± 0.88 abc11.32 ± 1.01 bcdef0.45 ± 0.02 abNDNegative
1606.8 ± 0.42 ab12.48 ± 0.53 f0.45 ± 0.01 aNDNegative
Values are means ± S.E. OA: Overall acceptance; VBN: Volatile basic nitrogen; TBARS: Thiobarbituric acid reactive substances; TBC: Total bacterial count; E. Coli: Escherichia coli; CFU/g: Colony forming units per gram. Different superscript letters (a–f) in each column at each temperature indicate significant differences among means by Duncan’s test (p < 0.05).
Disclaimer/Publisher’s Note: The statements, opinions and data contained in all publications are solely those of the individual author(s) and contributor(s) and not of MDPI and/or the editor(s). MDPI and/or the editor(s) disclaim responsibility for any injury to people or property resulting from any ideas, methods, instructions or products referred to in the content.

