Article

Optimizing the Mixing Ratios of Source-Separated Organic Waste and Thickened Waste Activated Sludge in Anaerobic Co-Digestion: A New Approach

1
Civil Engineering Department, Toronto Metropolitan University, Toronto, ON M5B 2K3, Canada
2
Chemical Engineering Department, Toronto Metropolitan University, Toronto, ON M5B 2K3, Canada
*
Author to whom correspondence should be addressed.
Processes 2024, 12(4), 794; https://doi.org/10.3390/pr12040794
Submission received: 2 March 2024 / Revised: 8 April 2024 / Accepted: 11 April 2024 / Published: 15 April 2024
(This article belongs to the Special Issue Anaerobic Digestion Process: Design, Optimization and Application)

Abstract

:
Anaerobic co-digestion (AnCoD) presents several advantages over conventional mono-digestion. Various factors can impact the efficiency of the co-digestion process, including the mixing ratio of the feedstocks. This study primarily investigates the effects of different mixing ratios on methane production during the co-digestion of source-separated municipal organic waste (SSO) with thickened waste activated sludge (TWAS). While the C/N or COD/N ratio has generally been used for optimizing the mixing ratios of co-digested feedstocks, a new approach is introduced in this study to evaluate the effects of the lipid, protein, and carbohydrate (L:P:C) ratios on the efficiency of AnCoD with respect to methane production, kinetics, and synergism at mixing ratios of TWAS:SSO of 10:90, 30:70, 50:50, 70:30, and 10:90. AnCoD improved methane production and kinetics relative to TWAS at all mixing ratios, the highest of which was at the 10:90 ratio, corresponding to a methane yield, maximum methane production rate, and an L:P:C ratio of 353 mL CH4/g COD, 25 mL CH4/g COD/d, and 8:1:18, respectively. Improvements in methane yields and kinetics due to synergy were evident at all mixing ratios, with improvements in methane yields ranging from 11 to 23% and improvements in kinetics ranging from 18 to 58%. Improvements in methane yields and kinetics were insensitive to the feedstock composition beyond the 50:50 mixing ratio.

1. Introduction

Almost 1.3 million tons of food waste (FW) end up being discarded into landfills contributing to the production of 3.3 million tons of carbon dioxide equivalents per year, and in spite of the rising interest in FW prevention and recovery, negligible amounts of waste are recovered [1,2]. The scarcity of specialized facilities for processing municipal solid waste (MSW) and source-separated organics (SSOs) underscores the multifaceted challenges arising from the heterogeneous nature and compositional variability inherent in these materials. The rapid degradation of carbohydrates and long-chain fatty acids (LCFAs) into volatile fatty acids (VFAs), coupled with inadequate uptake by methanogenic archaea, precipitates a progressive decline in pH levels, thereby impeding methanogenic activity over time [3]. Furthermore, the accumulation of both light and heavy metals, coupled with an insufficiency of essential trace elements, complicates the management of these waste streams [3]. On the other hand, wastewater treatment plants (WWTPs) produce a significant amount of sludge, the treatment and disposal of which accounts for over 50% of the total operational cost. The handling and disposal of sludge is a major challenge in wastewater management, especially with the highest expenses involved in sludge treatment processes overall [4]. The management and disposal of sludge poses formidable challenges in wastewater management, particularly considering the exorbitant expenses associated with sludge treatment processes overall. Anaerobic digestion (AD) of organic wastes offers a viable avenue for reducing volatile solids, harnessing biogas production, and facilitating waste stabilization. However, the widespread application of AD is often hindered by prolonged retention times and inadequate reduction in volatile solids (VSs), with the limitations primarily attributed to the hydrolysis stage [5].
Biofuel production from biomasses has gained more attention during recent years. Both biogas and syngas (SNG), can be produced as gaseous biofuels. However, production of SNG is narrowly practiced, as it is not a cost-competitive alternative [6]. AD, adopted for the treatment of wet residual biomasses, is one of the most favorable technologies for biofuel production. Among the numerous biological processes known in the energy sector, AD of organic waste has shown to be an energy-efficient technology while creating a smaller environmental footprint [7,8]. The generated methane from AD can be utilized as an alternative to fossil fuels, especially now that research has shown that 20 to 300 kWh of net energy per ton of waste can be obtained from biogas by AD [9].
AD technologies have proven to adaptable to a broad range of different feedstocks with high biological pollution loads, including organic fractions of municipal solid waste (OFMSW), agricultural and animal wastes, sewage sludge (SS), and rural and slaughterhouse effluents [10,11,12]. Capturing CO2 and energy recovery from biogas contribute to the reduction in greenhouse gas emissions considerably. Additionally, anaerobically digested sludge (ADS), the semi-solid residue of AD, contains demineralized nitrogen and phosphorus, which could be utilized as organic fertilizer [13]. Even though AD is a very well-established technology and a commercial reality for a variety of organic wastes, mono-digestion is associated with several drawbacks, such as nutrient imbalances, swift acidification, poor buffering capacity, high ammonia nitrogen release from the ammonification of proteins, and long-chain fatty acid inhibition, leading to severe instabilities and process disruptions [14,15,16].
AnCoD, through which the simultaneous digestion of two or more feedstocks takes place, has proven to be a viable option to alleviate the disadvantages of mono-digestion while improving the economic feasibility of existing AD plants by increasing methane yields [3,15,17,18]. Selection of the co-substrate and mixture ratio in order to improve synergism, dilute inhibitory compounds, and optimize methane production and ADS quality are important criteria in AnCoD [3,19]. Municipal solid waste (MSW) comprises a range of organic and inorganic materials. Source-separated organic waste (SSO) refers to the combination of the organic fractions of MSW from residences and the industrial, commercial, and institutional (ICI) sectors. With almost 33% of edible food being wasted yearly, municipalities are facing further challenges regarding the management and disposal of MSW. Consequently, municipalities cannot achieve diversion targets above 50% without establishing residential organics collection programs, and also, considering that SS digesters operate at low organic loading rates with almost 30% of their capacity unused, AnCoD becomes a lucrative option towards waste minimization while producing biogas as a renewable source of energy that can be utilized for heat and power generation [20].
Liu et al. [21] investigated the AnCoD of waste activated sludge (WAS) and MSW at a mixing ratio of 25:75 (v/v) in a 1.6 m3 mesophilic pilot anaerobic digester in steady-state conditions. Improvements in methane yields were reported at organic loading rates (OLRs) of 1.2, 2.4, and 3.6 kg VS/m3∙d; however, accumulation of volatile fatty acids (VFAs) was reported at organic loading rates (OLRs) > 4.8 kg VS/m3∙d despite the low C/N ratio of the feedstock (i.e., 6.07 to 6.27). Kim et al. [22] investigated the AnCoD of SS and FW at mixing ratios of 90:10, 80:20, and 60:40 in mesophilic anaerobic digesters operated at an HRT of 20 days. An increase in the methane yield from 0.16 to 0.29 L CH4/g COD (+81%) at a 60:40 ratio with AnCoD was observed; however, they concluded that these improvements could not be attributed to the C/N ratio. bkoor Alrawashdeh et al. [23] investigated the AnCoD of WAS and primary sludge (PS) with MSW at mixing ratios 70:30 and 50:50 (w/w) in mesophilic batch tests. They reported a 12% and a 44% decrease in the methane yields with the addition of MSW to WAS and a 34% and a 36% decrease in the methane yields with the addition of MSW to PS at 70:30 and 50:50 mixing ratios, respectively, despite the C/N ratio being maintained within the optimal range. Gu et al. [24] investigated the AnCoD of SS and FW at mixing ratios of 75:25, 50:50, and 25:75 (w/w) in mesophilic batch tests. They observed an increase in the methane yield from 336.7 to 368.7 mL CH4/g COD, a slight increase of 8.7% over the theoretical yield, at the 25:75 mixing ratio, which suggested that co-digestion did not enhance biodegradability but only methane production rates.
Previous research has been deficient in providing comprehensive analyses, particularly in terms of the detailed characterization, anaerobic biodegradability, and kinetics of individual feedstocks prior to co-digestion. This deficiency leads to a significant gap in understanding the comparative effects of co-digestion versus mono-digestion or control scenarios. Furthermore, the potential synergistic effects of co-digestion have been largely overlooked in the existing literature, and when reported, they are often limited to methane yields without delving into kinetics. In the design and optimization of anaerobic co-digestion systems, various variables play crucial roles, including the mixing ratios of feedstocks, the optimal C/N ratio, and the proportions of macromolecular constituents such as lipids, proteins, and carbohydrates. However, the available literature presents contradictory results regarding optimal mixing ratios and C/N ratios as performance indicators. This article addresses these gaps through the investigation of different mixing ratios of TWAS:SSO, taking into consideration the COD/N ratios and macromolecular distribution of lipids, proteins, and carbohydrates (L:P:C). Additionally, this article addresses not only methane yields but also the kinetic performance of co-digestion. Moreover, this study seeks to explore the potential synergism between TWAS and SSO in terms of enhancing methane yields and kinetics, an aspect that has scarcely been addressed in the existing literature.

2. Methodology

2.1. Materials

TWAS and the ADS used as the inoculum were collected from Ashbridges Bay Treatment Plant (Toronto, ON, Canada). SSO was collected from Disco Road Organics Processing Facility (Toronto, ON, Canada). The feedstock characteristics and the inoculum are reported in Table 1. Samples were kept in a cold room at a temperature of 5 ± 1 °C to preserve their characteristics.

2.2. Experimental Setup

The factorial design of this study is summarized in Table 2. Biochemical methane potential (BMP) tests were carried out in 250 mL serum flasks sealed with rubber septa on a screw cap and incubated in a MaxQ 4000 shaking incubator (Thermo Fisher Scientific, Pleasanton, CA, USA) at 150 rpm and 37 ± 1 °C. The volumes of both the substrate and the inoculum were calculated based on a food-to-microorganism ratio of 2 g COD/g VSSs, as recommended for most applications [25,26,27]. All BMPs were carried out in triplicate at 37 ± 1 °C by incubating the bottles in a water bath set at the designated temperature. The headspace of the bottles was flushed with nitrogen gas for 3 min at 10 psi (69 kPa) and sealed to ensure that the bottles were completely anaerobic. Blanks solely containing the inoculum in addition to controls containing the individual feedstocks were used to compare experimental and theoretical methane yields in addition to evaluating synergistic effects between the feedstocks. BMPs were stopped when methane production curves plateaued (i.e., methane production for 3 consecutive days was less than 2% of the cumulative volume. Additionally, anaerobic systems operate at a pH range between 6.8–7.8 to maintain optimal methanogenic activity [28]; hence, the pH was adjusted to 7.3 by 1 M HCl or NaOH solutions.

2.3. Analytical Methods

The analysis of solid contents, including total solids (TSs), VSs, total suspended solids (TSSs) and volatile suspended solids (VSSs) of the inoculum and feedstocks were carried out using Standard Methods [29]. To assess total and soluble chemical oxygen demand, nitrogen, ammonia, and VFAs, Hach Methods (Hach, Los Angeles, CA, USA) were employed. To isolate the soluble content, samples underwent centrifugation at 9000× g rpm for 45 min, followed by filtration using sterile 0.45 μm membrane filter papers (VWR International, Mississauga, ON, Canada). Gas volume measurements were performed manually using a 100 mL Gastight Luer-Lock glass syringe daily at the commencement of the digestion period. As gas production rates decelerated, gas measurements were taken every couple of days. The quality of biogas was analyzed utilizing a Thermo Fisher Scientific Trace 1310 gas chromatograph (GC) equipped with a thermal conductivity detector. The oven, detector, and filament temperatures were set to 80, 100, and 250 °C, respectively. A TG-Bond Msieve 5A model column (TG Scientific Ltd., Hertfordshire, UK) with dimensions of 30 m in length and 0.53 mm in diameter was employed for analysis.
The Coomassie Bradford assay using the Pierce Coomassie (Bradford, UK) Protein Assay Kit was used to measure proteins (Thermo Fisher Scientific, Mississauga, ON, Canada) with a bovine serum albumin (BSA) standard. Carbohydrates were measured by the phenol sulphuric acid method as described in [30]. A bovine serum albumin (BSA) and a glucose standard were used in the measurement of proteins and carbohydrates, respectively. Results of both proteins and carbohydrates were obtained by reading absorbance at 595 nm and 490 nm, respectively, using a Hach DR3900 spectrophotometer (Hach, Toronto, ON, Canada). All samples were analyzed in duplicate with blanks and standards to ensure the accuracy of the results. Lipid concentrations were measured gravimetrically after extraction using hexane [31].

2.4. Calculations

The Modified Gompertz model presented in Equation (1) was used to model the anaerobic degradation kinetics of the different feedstocks:
M = P exp {−exp [(Rm × e/P) (λt) + 1]}
where M is the cumulative methane produced (mL CH4), P is the maximum methane potential (mL CH4), Rm is the maximum methane production rate (mL CH4/d), λ is the lag phase (d), and e is Euler’s number.
Equation (2) was used to calculate the biodegradability of the substrates:
Bo = Yex/Yth
where Bo is the biodegradability of the substrate (%), Yex is the experimental methane yield (mL CH4/g COD), and Yth is the theoretical methane yield at 37 °C (0.397 mL CH4/g COD).
Theoretical methane yields used as a reference to assess the synergistic effects of co-digestion were calculated using Equation (3):
Yth = MTWAS × YTWAS + MSSO × YSSO
where Yth is the calculated theoretical methane yield (mL CH4/g COD), MTWAS is the mass of added TWAS (g COD), YTWAS is the experimental yield of the TWAS (mL CH4/g COD), MSSO is the mass of added SSO (g COD), and YSSO is the experimental yield of the SSO (mL CH4/g COD).

3. Results and Discussion

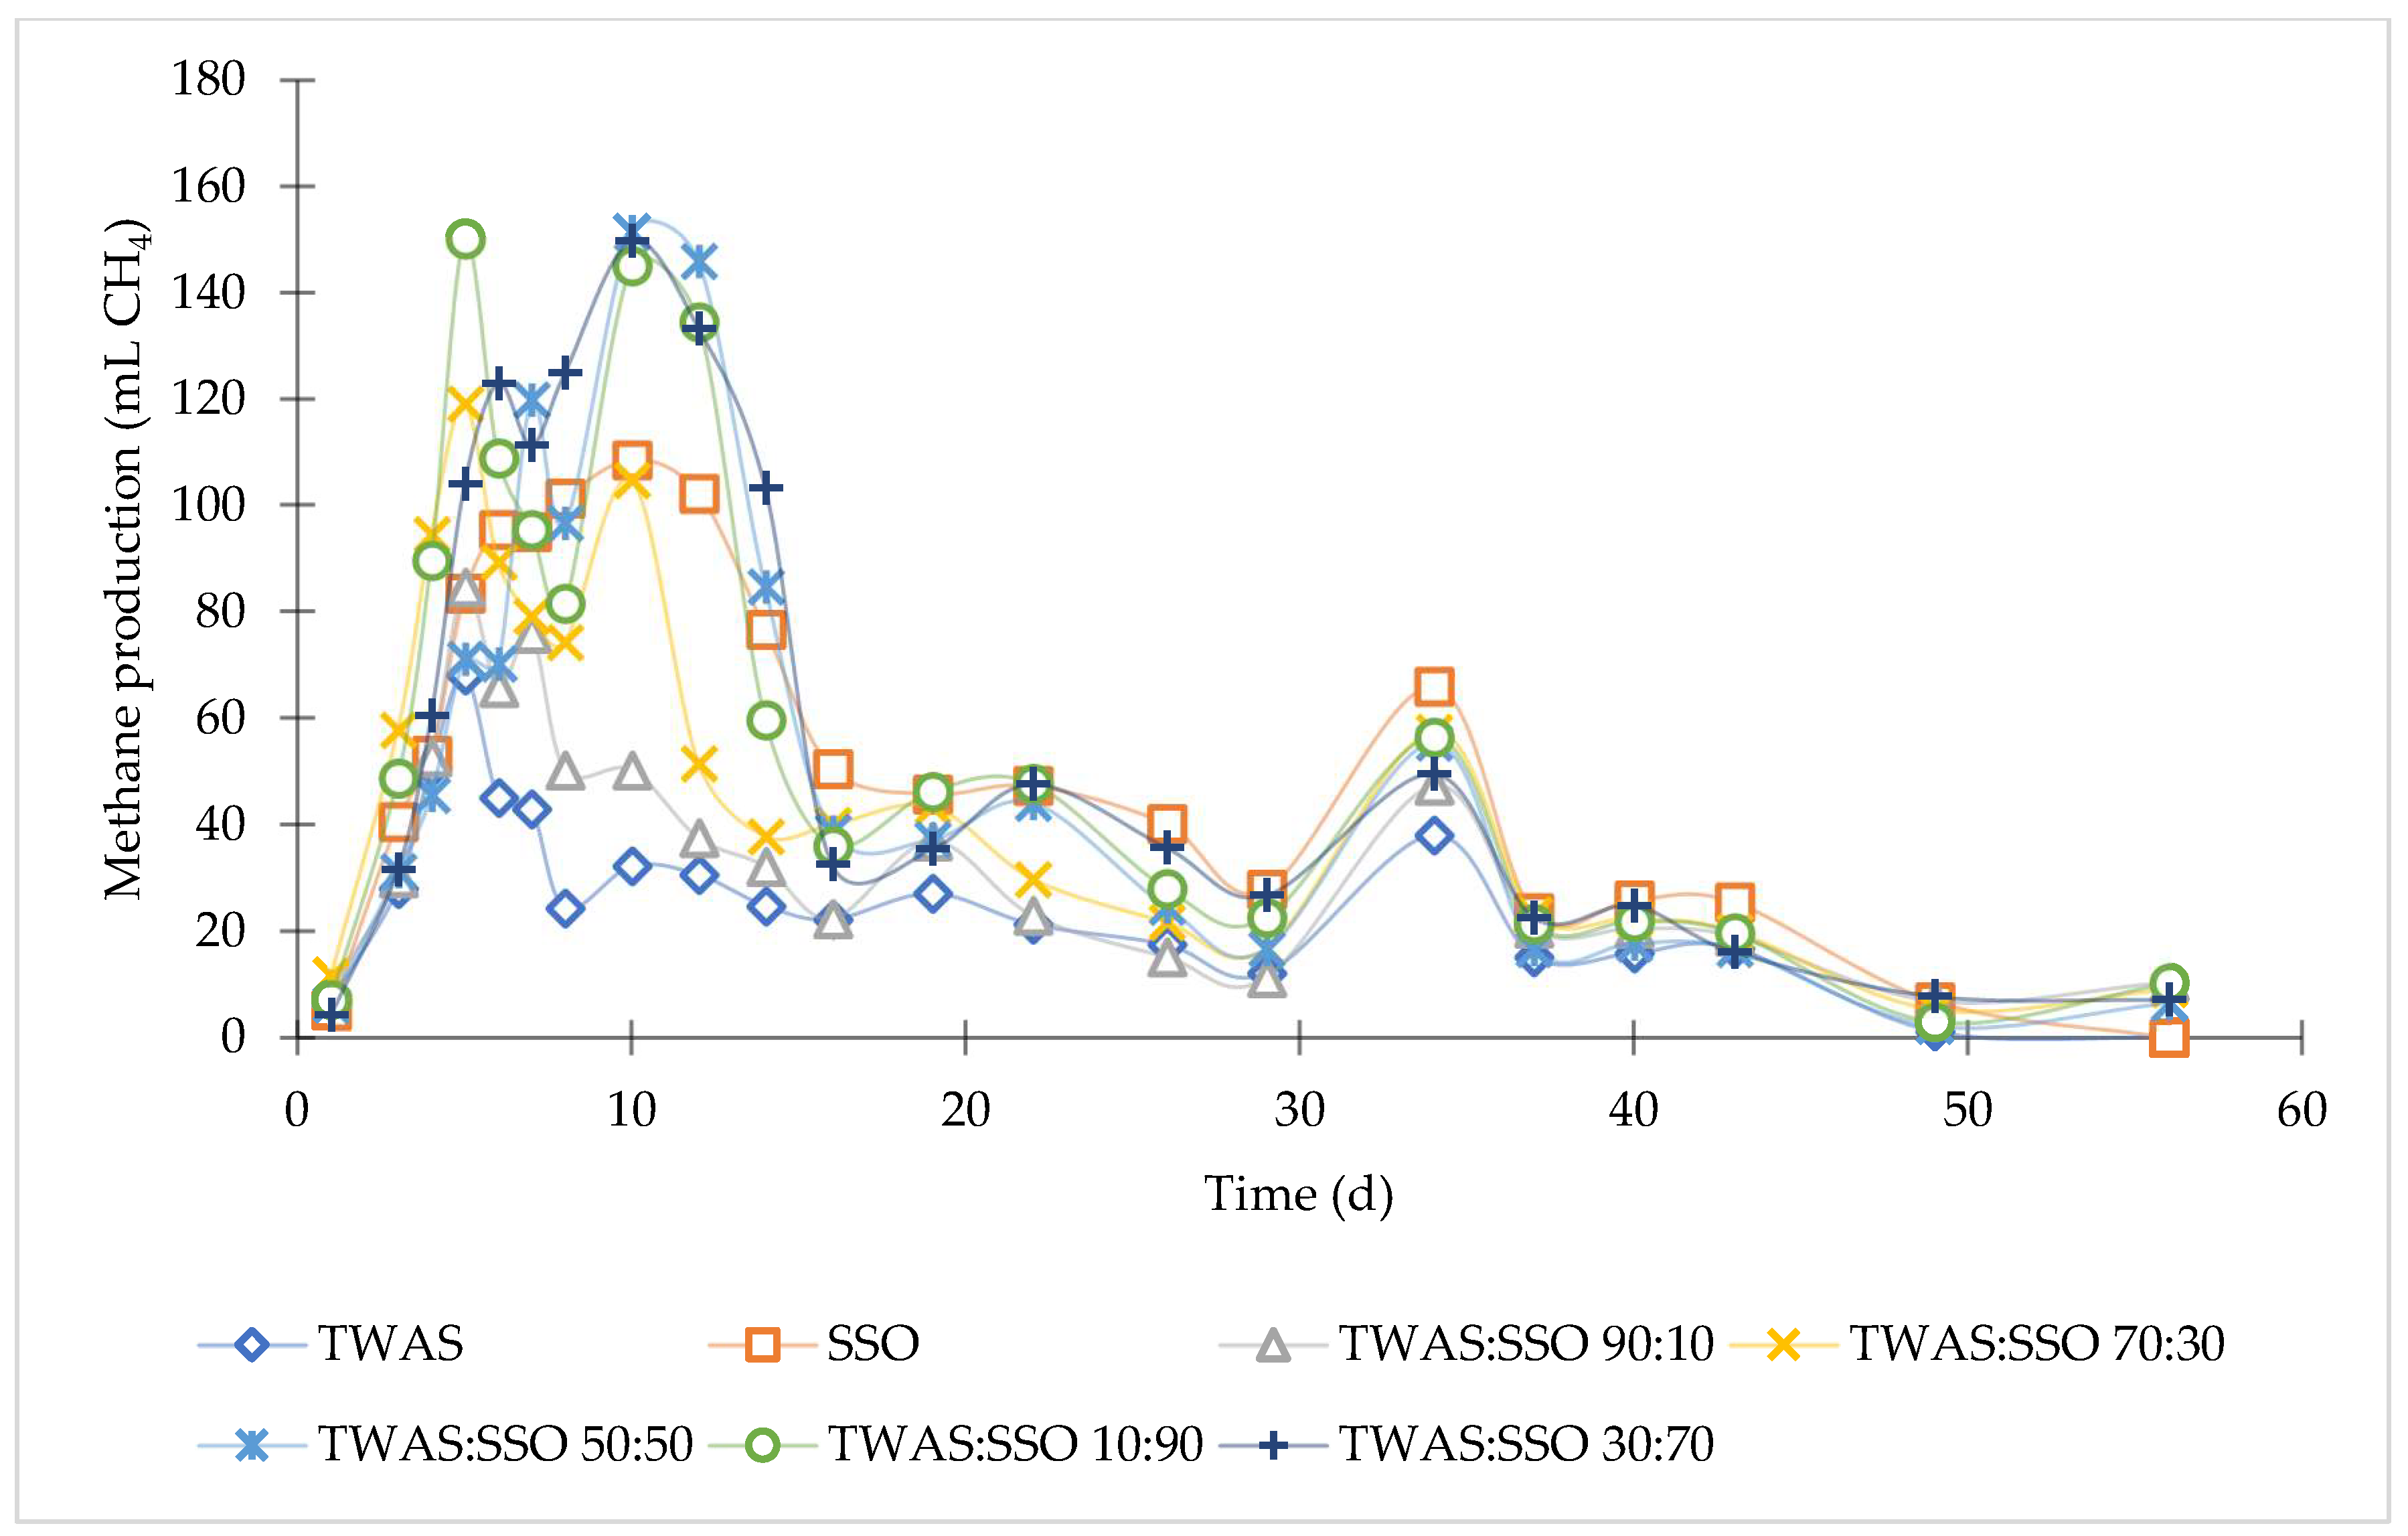
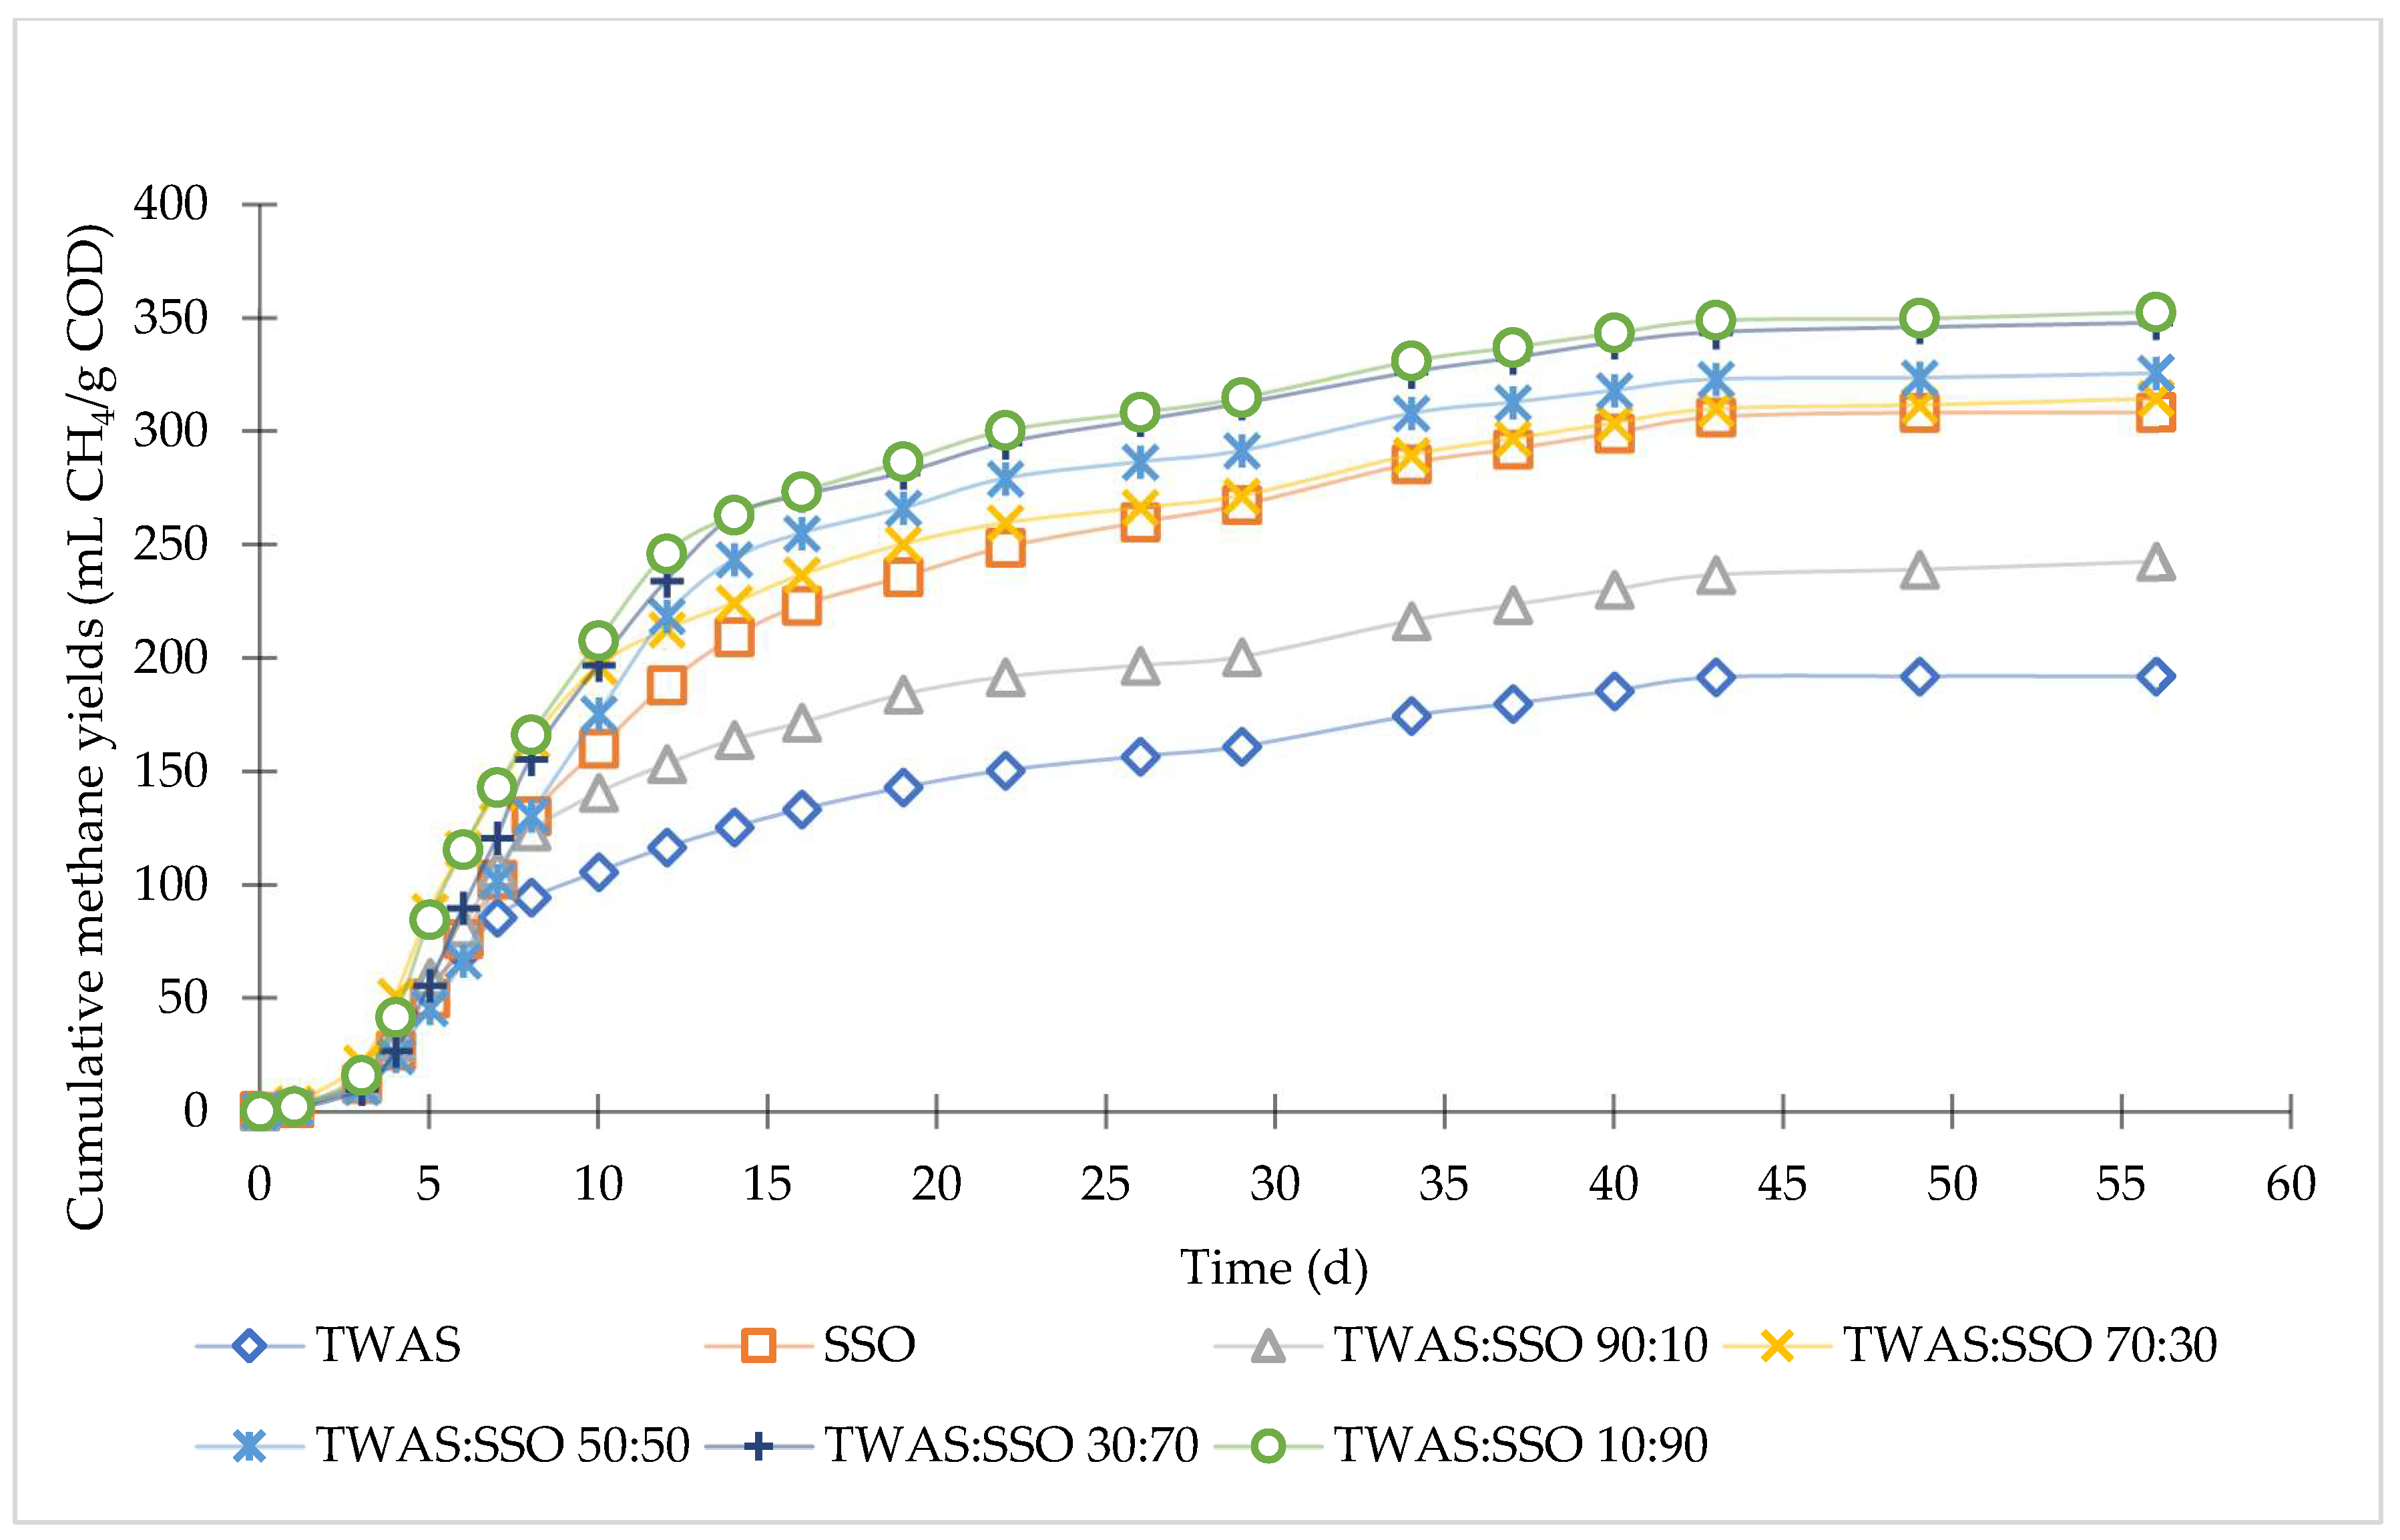
3.1. Anaerobic Degradation and Methane Production

Methane yields are reported at 37 °C. Differences in the cumulative methane production curves across all BMP replicates were statistically insignificant (p > 0.05), emphasizing the reproducibility of the data.
Figure 1 depicts the cumulative methane yields of the mono- and co-digested feedstocks. The methane yields of the TWAS and SSO were 192 and 308 mL CH4/g COD, corresponding to biodegradabilities of 48% and 76%, respectively. Co-digestion consistently enhanced methane yields across all mixing ratios compared to TWAS alone. The lowest improvement was observed at the 90:10 ratio, showing a 27% increase. This increase in the methane yield was directly proportional to the fraction of SSO in the mixtures, peaking at the 10:90 ratio. At this ratio, the highest methane yield of 358 mL CH4/g COD was achieved due to the high biodegradability of the SSO, which accounted for 97% of the added COD. Similarly, the methane yields at the 50:50 and 70:30 ratios were 315 and 326 mL CH4/g COD, respectively, representing increases of 64% and 70% compared to the TWAS alone. The methane yields at the 50:50 and 70:30 ratios were 315 and 326 mL CH4/g COD, respectively, showing increases of 64% and 70% relative to TWAS alone, agreeing with the findings of Kim et al. [22] and Wang et al. [32], who reported 68% and 65% increases in the methane yields of co-digested SS and FW at 60:40 and 50:50 ratios, respectively.
Figure 2 provides a detailed insight into the daily methane production profiles observed throughout the batch tests conducted in this study. Notably, the majority of methane production occurred within the initial 14 days of operation. A significant peak in methane production was evident during the first 10 days, which was attributed to the rapid utilization of the available soluble substrate present in the feedstocks. However, methane production exhibited a decline by day 14, as the readily available substrate was depleted. On day 34, another peak in methane production was recorded. This phenomenon can be attributed to the hydrolysis of the slowly biodegradable fraction of the feedstocks, leading to the generation of volatile fatty acids that were subsequently made available for methanogenic consumption. However, by day 49, methane production had dwindled to almost negligible levels, signifying the depletion of methane potential from the added substrates. Furthermore, the digesters exhibited varying degrees of methane production efficiency over different time intervals. Specifically, within the first 7 days of operation, the digesters generated approximately 31–45% of their ultimate biogas production. By the end of the first 14 days, this figure increased to 65–76%, indicating a substantial improvement in methane production efficiency. Finally, within the initial 30 days of operation, the digesters reached 83–90% of their ultimate biogas productions. Ismail et al. [33] reported a plateau in methane production curves after 15 days; however, the feedstocks used in the aforementioned study were thermally pretreated; hence, a larger soluble COD fraction was available for microbial consumption.

3.2. Kinetic Analysis

The kinetic analysis of the methane production curves is presented in Table 3. The modeled data showed an excellent fit, with R2 values ranging from 0.985 to 0.996.
No lag phase was observed with the digestion of TWAS; however, a lag phase of 1.95 d was observed with the digestion of SSO. Considering that the inoculum and the TWAS were obtained from the same plant, the inoculum was well-adapted to its consumption compared to SSO. The lag phase increased as the SSO fraction increased, peaking to 3.11 d at the 50:50 ratio, while dropping to 1.85 d at the 10:90 ratio. This could be attributed to the increase in the readily biodegradable sCOD fraction of the SSO, considering that 40% of the COD of SSO is soluble. This drop in the lag phase, explained by the increase in sCOD, is further corroborated with the increase in the Rm at the 50:50, 30:30, and 10:90 ratios. The Rm remained insensitive to the increase in the SSO fraction at the 50:50 ratio and beyond, remaining almost equal (i.e., 25–26 mL CH4/g COD/d) and corresponding to an improvement of 160% relative to TWAS alone.

3.3. COD/N and L:P:C Ratios
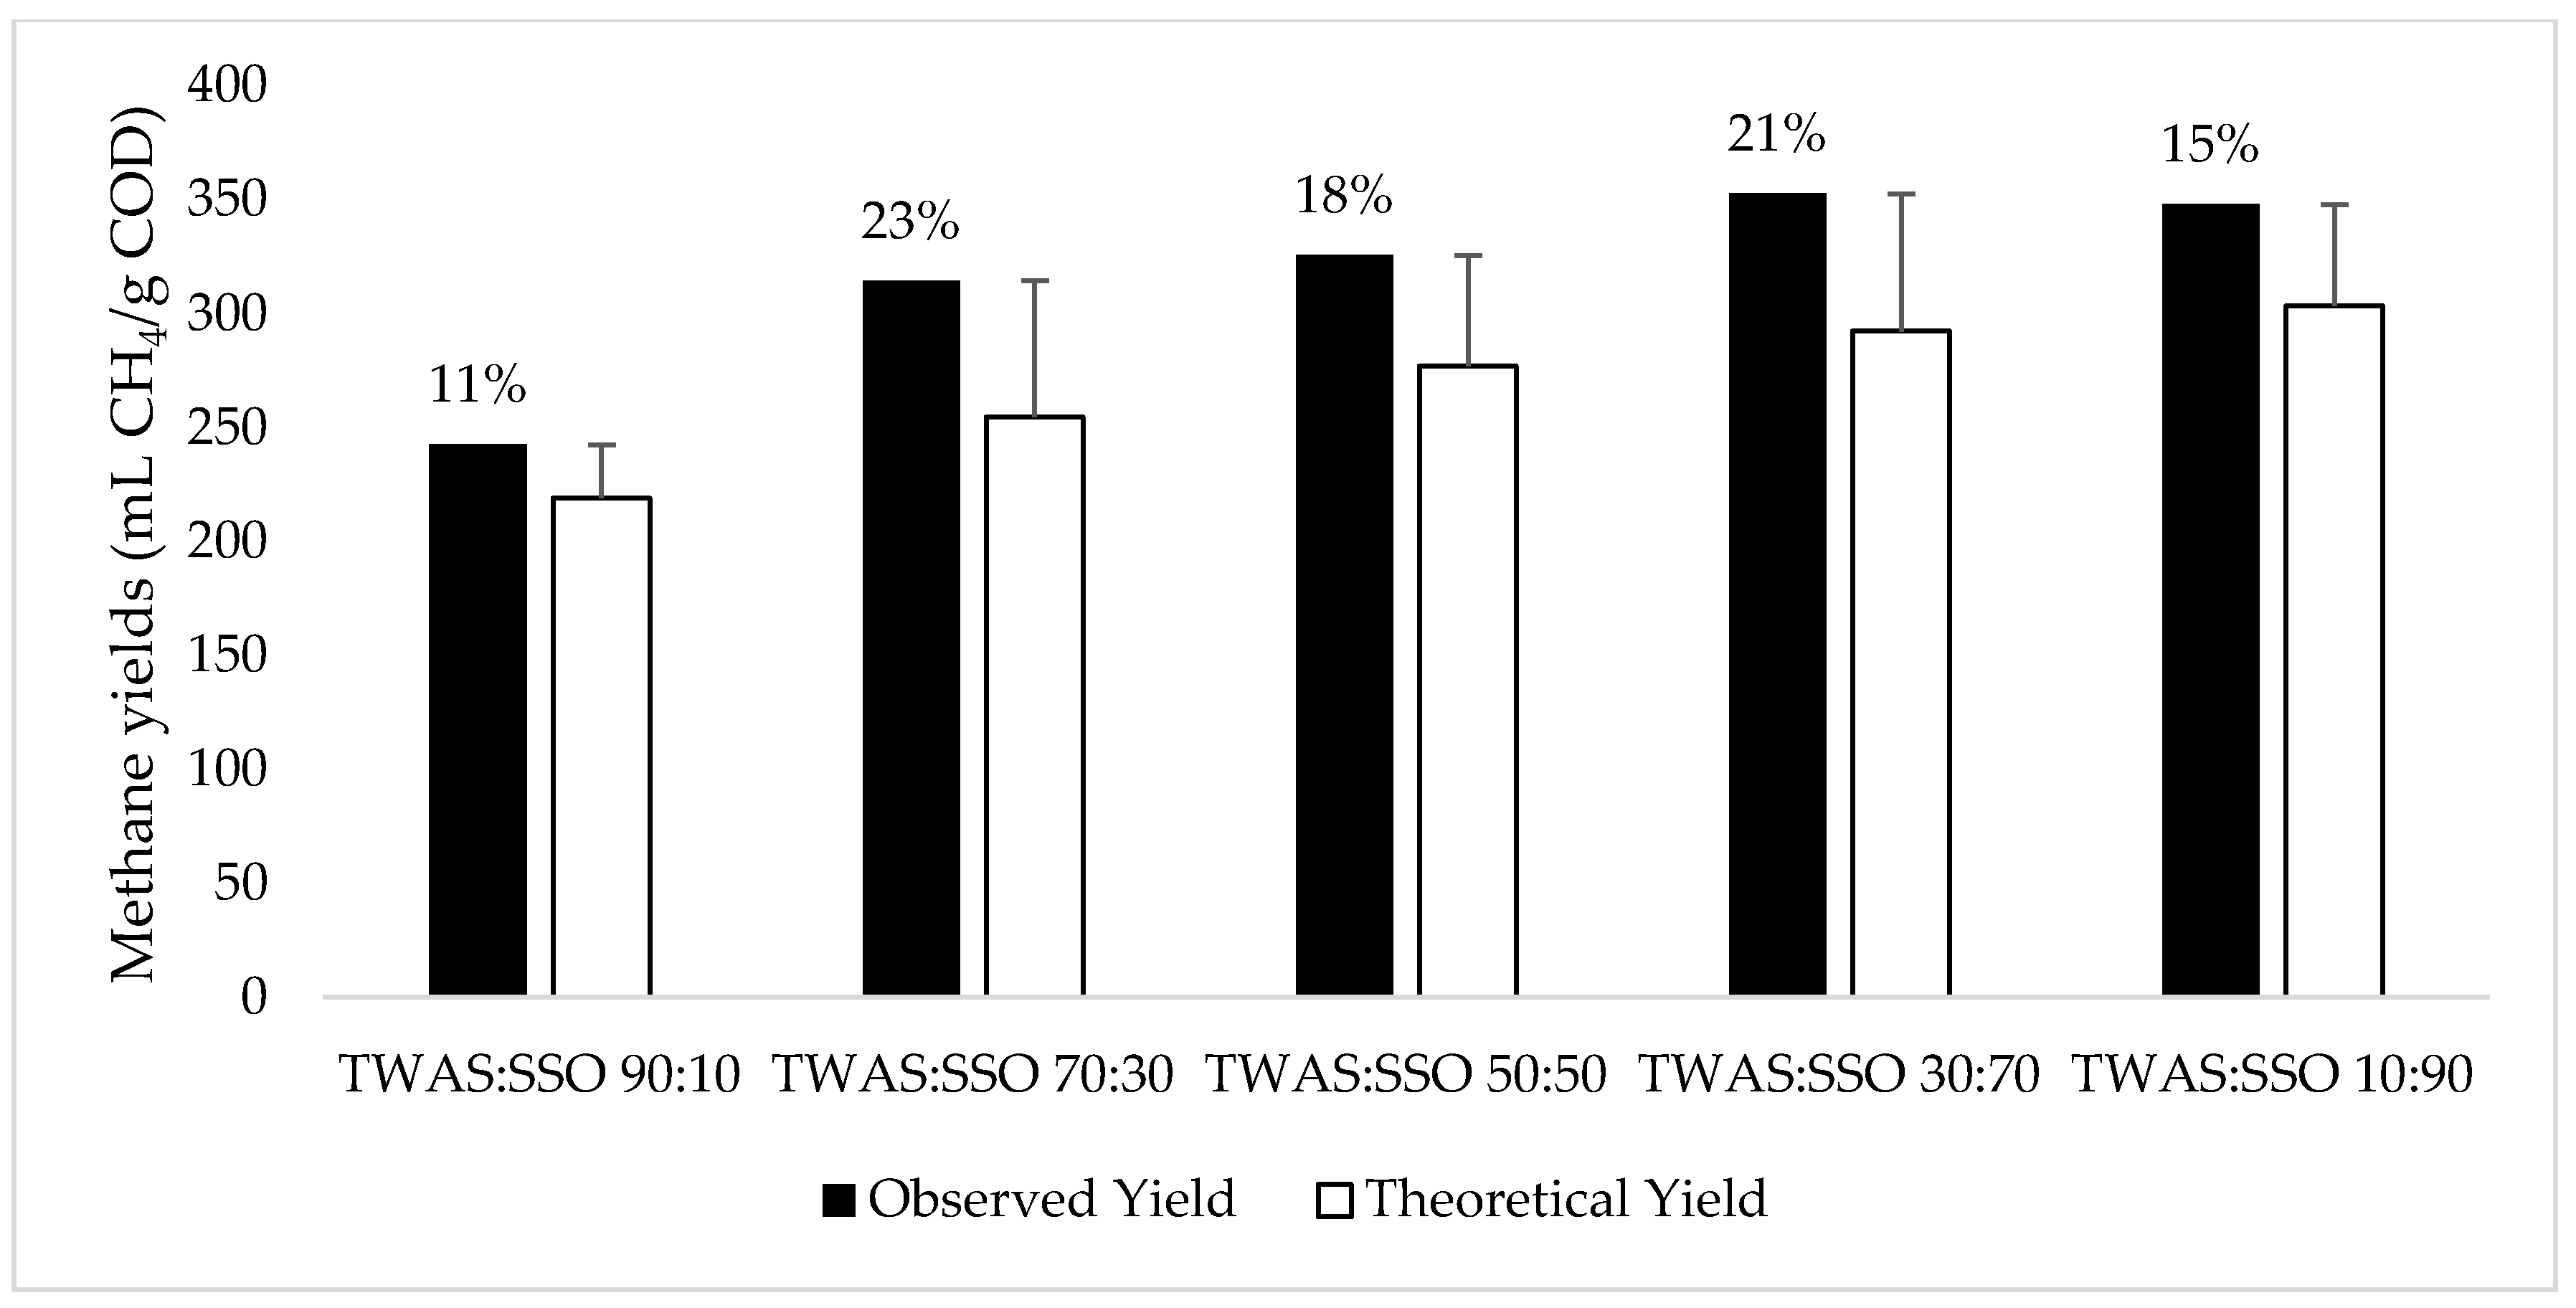
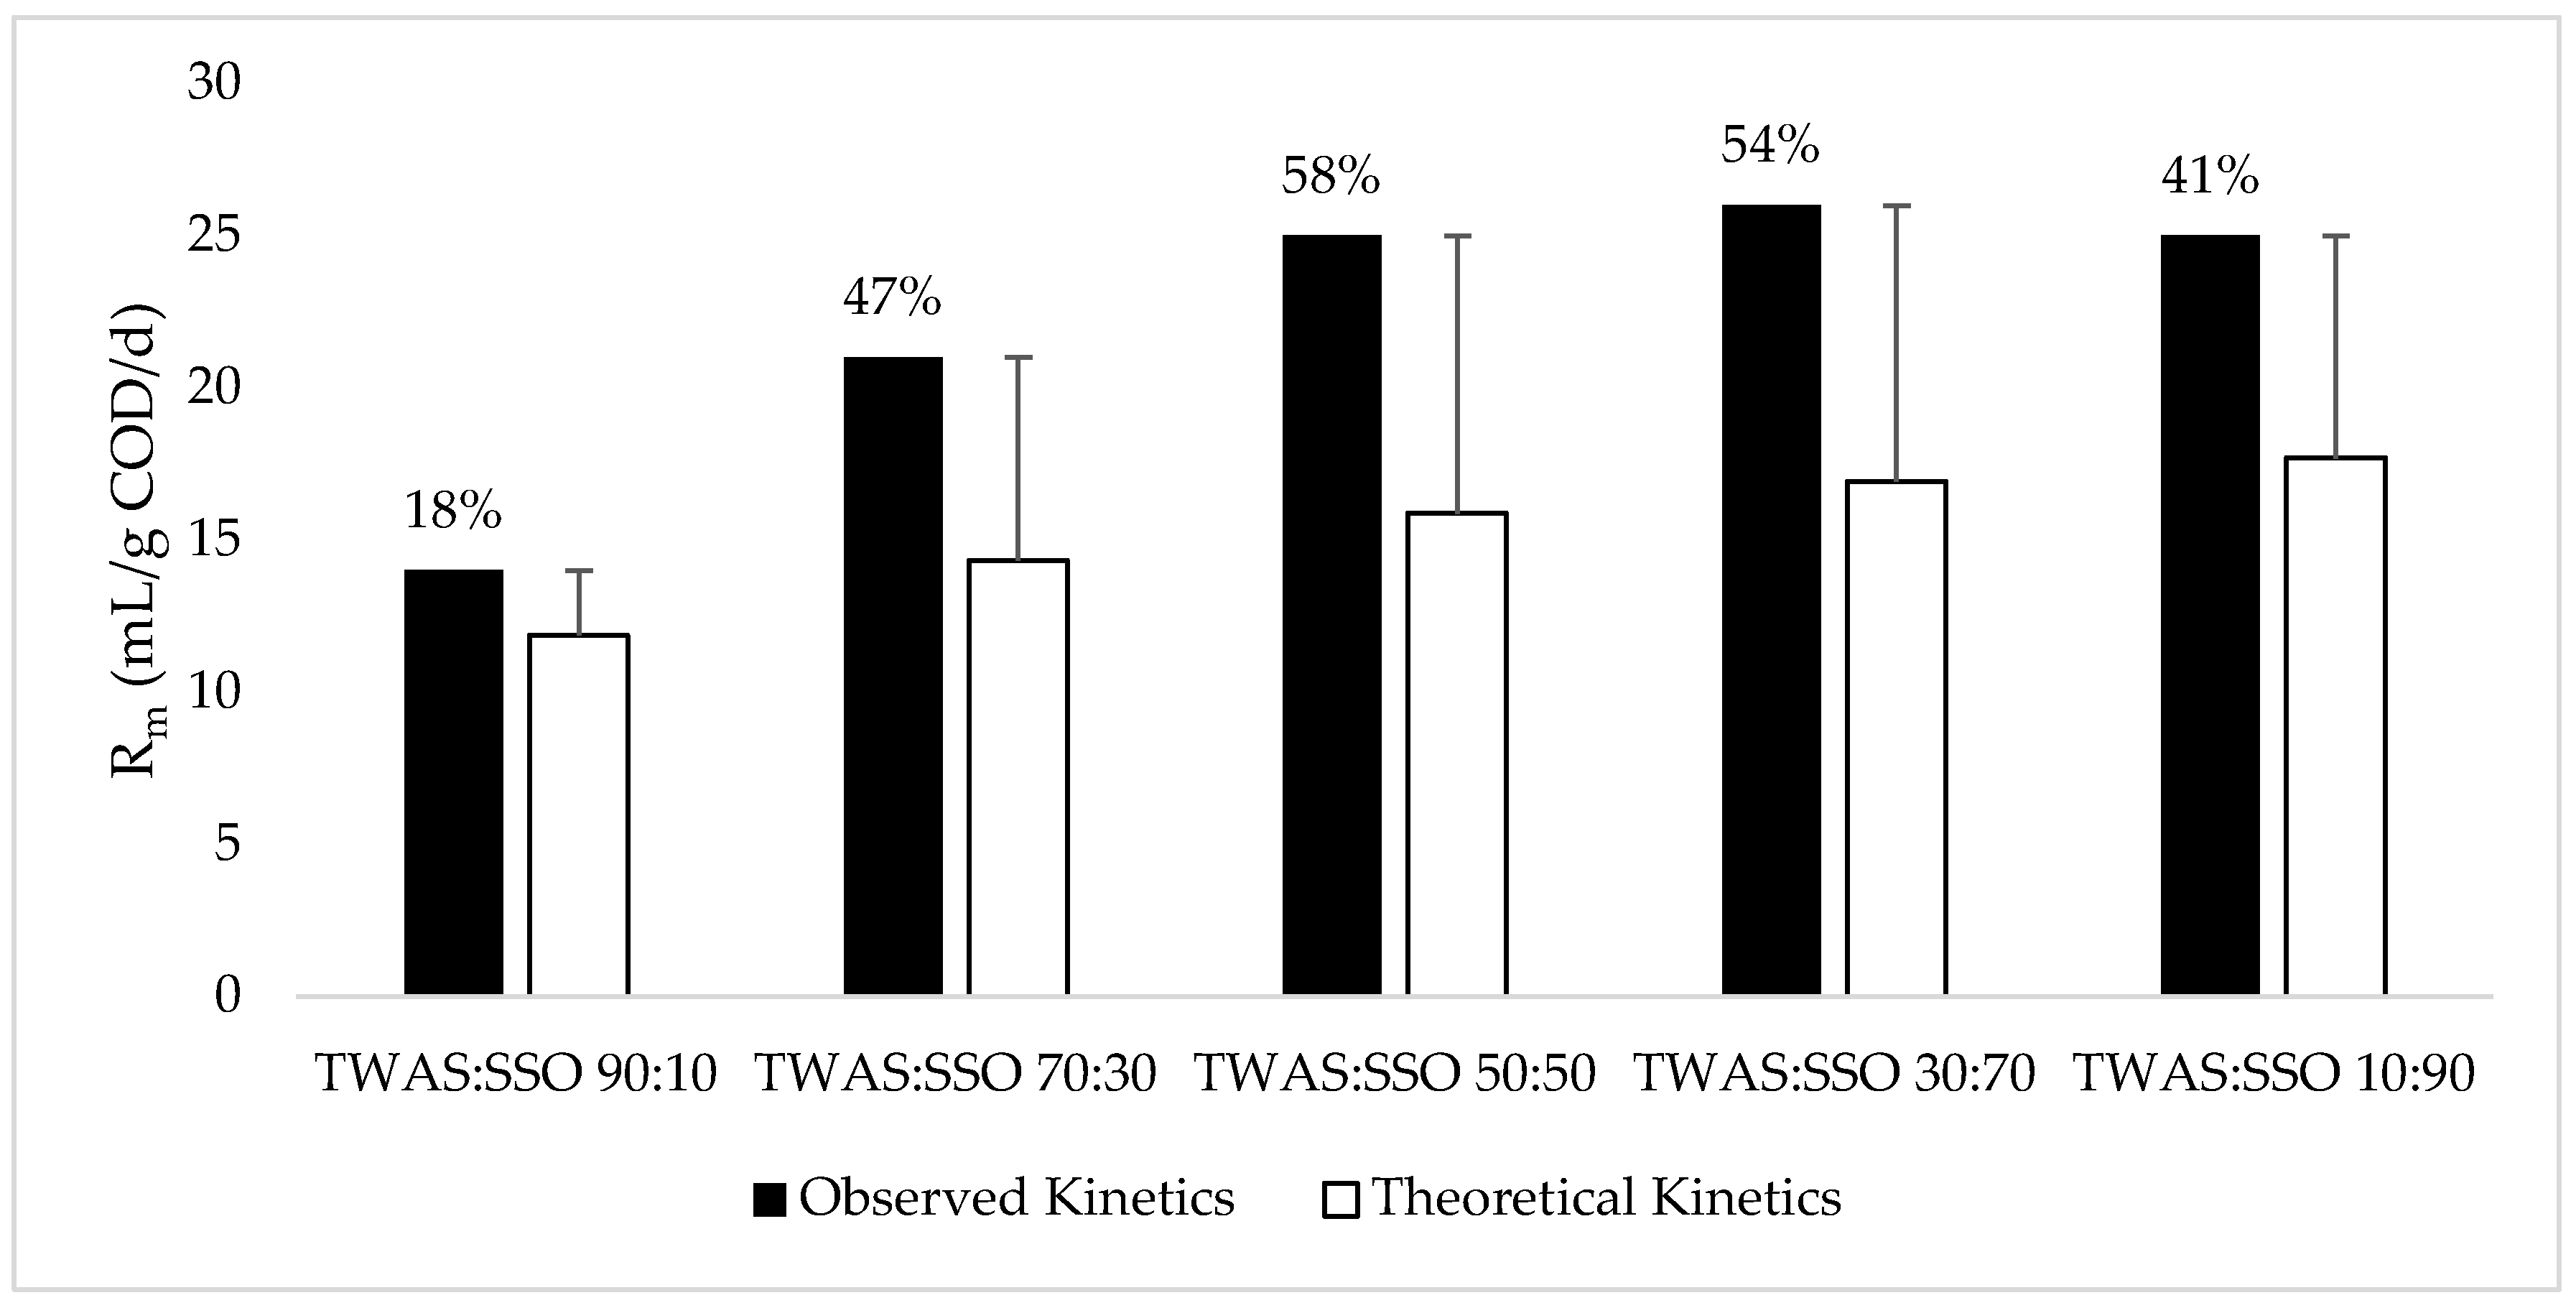
The COD/N ratios, L:P:C ratios, and ultimate methane yields of the feedstocks are presented in Table 4. TWAS, which is primarily constituted of microorganisms, exhibited the highest protein content among all the feedstocks. This high protein content can be attributed to the semi-rigid structure of the cell envelope, which contains glycan strands crosslinked with peptide chains. Consequently, the protein in TWAS demonstrates resistance to biodegradation, resulting in lower methane yields [34]. Despite the low COD/N ratio of the TWAS, nitrogen comprises almost 12% of the microbial cells in activated sludge systems; hence, the low COD/N ratio is not a proper measure of the low biodegradability of the TWAS [28]. In contrast, source-separated organics exhibited the highest lipid and carbohydrate content, having macromolecules that are more readily consumed by microbes compared to proteins. This content ranges from 67% to 100%, thereby explaining the relatively high biodegradability observed compared to TWAS [31]. The degradation of lipids during AD is the biggest contributing factor to the production of hydrogen gas. A total of 28% of the methane produced during AD is owed to hydrogenotrophic methanogens utilizing hydrogen as an electron donor and carbon dioxide as an electron acceptor. Additionally, the half-velocity constant of hydrogen utilization is as low as 0.0001 mg COD/L; hence, near-complete utilization is inevitable [35].
The increase in the lipid and carbohydrate content of the mixtures associated with an increase in SSO fraction was directly proportional to the increase in the methane yield, peaking to 333 mL CH4/g COD at the highest SSO fraction. The COD/N ratios of the mixtures ranged from 16 to 26, corresponding to C/N ratios of 5.6–9.1 based on the conversion ratio of 0.35 adopted from Koch et al. [36], which is far off the optimal range of 20–30 for AD [37]. The results of this coincide with the findings of Kim et al. [22], who demonstrated that the COD/N ratio alone was not a major performance indicator for five anaerobic digesters fed SS and FW at different mixing ratios in steady-state conditions. However, low COD/N ratios may result in the depletion of carbon and the accumulation of nitrogen in the form of ammonia, which in return causes methanogenic inhibition [38].

3.4. Synergism

Methane produced from AD develops through a syntropic metabolism between methanogenic archaea and hydrolytic bacteria [39]. Synergetic improvements in methane production and kinetics may be observed when multiple feedstocks are co-digested [40]. Figure 3 and Figure 4 depict the synergetic improvements in methane yields and kinetics at different mixing ratios. No specific trend was observed with the synergetic improvements in methane yields with the different mixing ratios. The observed methane yields increased by 11% to 23% relative to the theoretical yields, with the lowest being at the 90:10 mixing ratio. At the 30:70 ratio, a 21% increase in the methane yield was observed relative to the theoretical yield, coinciding with the findings of Wang et al. [32], who reported a 27% increase in the methane yield at the same mixing ratio from the co-digestion of SS and FW.
Similarly, synergetic improvements in the kinetics were observed, ranging from 18% to 58%, peaking at the 50:50 ratio. The 90:10 ratio showed the least improvement in kinetics, increasing to 47% at the 70:30 ratio and peaking at the 50:50 ratio. The improvements in kinetics were not sensitive to the change in the TWAS: SSO ratio from 50:50 to the 30:70 ratio, remaining almost equal. The improvements in kinetics decreased to 41% with an increase in the SSO fraction of more than 70%. The improvements in both methane yields and kinetics can be attributed not only to the diversity of the microbial community but also to the additions of alkalinity, trace elements, nutrients, and the dilution of toxins [33].

4. Conclusions

Co-digestion of SSO with TWAS improved methane yields relative to the mono-digestion of TWAS solely at all mixing ratios, with the highest methane yield of 385 mL CH4/g COD corresponding to a mixing ratio of 10:90. The methane yields at the 30:70 and 10:90 ratios were almost equal, showing that improvements beyond the 30:70 ratio are not significant. Improvements in kinetics were more significant with co-digestion, reaching a 160% improvement relative to the mono-digestion of TWAS alone due to the introduction of a higher soluble biodegradable COD fraction. Co-digestion improved methane yields by 11% to 23% and kinetics by 18% to 58% beyond the expected/calculated theoretical values due to synergy.
The results of this study demonstrate that the COD/N ratio is not a proper measure of digester performance; however, macromolecular constituents (i.e., lipids, proteins, and carbohydrates) provide better insights into performance predictions. The improvements in methane yields and kinetics were insensitive to increasing the SSO fraction of more than 50%; however, no upsets in performance were observed; hence, the optimal ratio should be decided based on feedstock availability.

Author Contributions

Conceptualization, A.R., A.E.S. and E.E.; formal analysis, A.R., A.E.S. and A.I.; investigation, A.R. and A.E.S.; methodology, A.R., A.E.S. and E.E.; resources, E.E., S.A. and Y.D.; validation, A.R., A.I. and E.E.; visualization, A.R. and A.I.; writing—original draft, A.R. and A.I.; writing—review and editing, A.I. and E.E. All authors have read and agreed to the published version of the manuscript.

Funding

The authors would like to thank the Natural Sciences and Engineering Research Council (NSERC) for their financial support.

Data Availability Statement

Data are contained within the article.

Conflicts of Interest

The authors declare no conflict of interest.

Abbreviations

ADAnaerobic digestion
AnCoDAnaerobic co-digestion
CCarbon
FWFood waste
GCGas chromatograph
HRTHydraulic retention time
LCFAsLong-chain fatty acids
MSWMunicipal solid waste
NHx-NAmmonia nitrogen
NNitrogen
OFMSWOrganic fraction of municipal solid waste
OLROrganic loading rate
pHPotential of hydrogen
PSPrimary sludge
sCODSoluble chemical oxygen demand
sNSoluble nitrogen
SNGSynthetic natural gas
SSSewage sludge
SSOSource-separated organics
TCarbsTotal carbohydrates
TCODTotal chemical oxygen demand
TLipidsTotal lipids
TNTotal nitrogen
TProteinsTotal proteins
TWASThickened waste activated sludge
TSsTotal solids
TSSsTotal suspended solids
VFAsVolatile fatty acids
VSsVolatile solids
VSSsVolatile suspended solids
WASWaste activated sludge
WWTPWastewater treatment plant

References

  1. Mehariya, S.; Patel, A.K.; PObulisamy, K.; Punniyakotti, E.; Wong, J.W.C. Co-digestion of food waste and sewage sludge for methane production: Current status and perspective. Bioresour. Technol. 2018, 265, 519–531. [Google Scholar] [CrossRef]
  2. Thyberg, K.L.; Tonjes, D.J. Drivers of food waste and their implications for sustainable policy development. Resour. Conserv. Recycl. 2016, 106, 110–123. [Google Scholar] [CrossRef]
  3. Mata-Alvarez, J.; Dosta, J.; Romero-Güiza, M.S.; Fonoll, X.; Peces, M.; Astals, S. A critical review on anaerobic co-digestion achievements between 2010 and 2013. Renew. Sustain. Energy Rev. 2014, 36, 412–427. [Google Scholar] [CrossRef]
  4. Boguniewicz-Zablocka, J.; Klosok-Bazan, I.; Capodaglio, A.G. Sustainable management of biological solids in small treatment plants: Overview of strategies and reuse options for a solar drying facility in Poland. Environ. Sci. Pollut. Res. 2021, 28, 24680–24693. [Google Scholar] [CrossRef] [PubMed]
  5. Tiehm, A.; Nickel, K.; Zellhorn, M.; Neis, U. Ultrasonic waste activated sludge disintegration for improving anaerobic stabilization. Water Res. 2001, 35, 2003–2009. [Google Scholar] [CrossRef]
  6. Guo, M.; Song, W.; Buhain, J. Bioenergy and biofuels: History, status, and perspective. Renew. Sustain. Energy Rev. 2015, 42, 712–725. [Google Scholar] [CrossRef]
  7. Razavi, A.S.; Koupaie, E.H.; Azizi, A.; Hafez, H.; Elbeshbishy, E. Bioenergy production data from anaerobic digestion of thermally hydrolyzed organic fraction of municipal solid waste. Data Brief. 2019, 22, 1018–1026. [Google Scholar] [CrossRef]
  8. Elbeshbishy, E.; Dhar, B.R.; Nakhla, G.; Lee, H.S. A critical review on inhibition of dark biohydrogen fermentation. Renew. Sustain. Energy Rev. 2017, 79, 656–668. [Google Scholar] [CrossRef]
  9. Karlis, P.; Presicce, F.; Giner-Santonja, G.; Brinkmann, T.; Roudier, S. Best Available Techniques (BAT) Reference Document for the Slaughterhouses, Animal By-products and/or Edible Co-products Industries. 2024. Available online: https://publications.jrc.ec.europa.eu/repository/handle/JRC135916 (accessed on 22 February 2024).
  10. Gelegenis, J.; Georgakakis, D.; Angelidaki, I.; Christopoulou, N.; Goumenaki, M. Optimization of biogas production from olive-oil mill wastewater, by codigesting with diluted poultry-manure. Appl. Energy 2007, 84, 646–663. [Google Scholar] [CrossRef]
  11. Igoni, A.H.; Ayotamuno, M.J.; Eze, C.L.; Ogaji, S.O.T.; Probert, S.D. Designs of anaerobic digesters for producing biogas from municipal solid-waste. Appl. Energy 2008, 85, 430–438. [Google Scholar] [CrossRef]
  12. Karagiannidis, A.; Perkoulidis, G. A multi-criteria ranking of different technologies for the anaerobic digestion for energy recovery of the organic fraction of municipal solid wastes. Bioresour. Technol. 2009, 100, 2355–2360. [Google Scholar] [CrossRef]
  13. Ward, A.J.; Hobbs, P.J.; Holliman, P.J.; Jones, D.L. Optimisation of the anaerobic digestion of agricultural resources. Bioresour. Technol. 2008, 99, 7928–7940. [Google Scholar] [CrossRef] [PubMed]
  14. Bayr, S.; Ojanperä, M.; Kaparaju, P.; Rintala, J. Long-term thermophilic mono-digestion of rendering wastes and co-digestion with potato pulp. Waste Manag. 2014, 34, 1853–1859. [Google Scholar] [CrossRef] [PubMed]
  15. Mata-Alvarez, J.; Dosta, J.; Macé, S.; Astals, S. Codigestion of solid wastes: A review of its uses and perspectives including modeling. Crit. Rev. Biotechnol. 2011, 31, 99–111. [Google Scholar] [CrossRef]
  16. Silvestre, G.; Illa, J.; Fernández, B.; Bonmatí, A. Thermophilic anaerobic co-digestion of sewage sludge with grease waste: Effect of long chain fatty acids in the methane yield and its dewatering properties. Appl. Energy 2014, 117, 87–94. [Google Scholar] [CrossRef]
  17. Shah, F.A.; Mahmood, Q.; Rashid, N.; Pervez, A.; Raja, I.A.; Shah, M.M. Co-digestion, pretreatment and digester design for enhanced methanogenesis. Renew. Sustain. Energy Rev. 2015, 42, 627–642. [Google Scholar] [CrossRef]
  18. Mata-Alvarez, J.; Macé, S.; Llabrés, P. Anaerobic digestion of organic solid wastes. An overview of research achievements and perspectives. Bioresour. Technol. 2000, 76, 3–16. [Google Scholar] [CrossRef]
  19. Divya, D.; Gopinath, L.R.; Merlin, P. Christy A review on current aspects and diverse prospects for enhancing biogas production in sustainable means. Renew. Sustain. Energy Rev. 2015, 42, 690–699. [Google Scholar] [CrossRef]
  20. Secondi, L.; Principato, L.; Laureti, T. Household food waste behaviour in EU-27 countries: A multilevel analysis. Food Policy 2015, 56, 25–40. [Google Scholar] [CrossRef]
  21. Liu, X.; Wang, W.; Shi, Y.; Zheng, L.; Gao, X.; Qiao, W.; Zhou, Y. Pilot-scale anaerobic co-digestion of municipal biomass waste and waste activated sludge in China: Effect of organic loading rate. Waste Manag. 2012, 32, 2056–2060. [Google Scholar] [CrossRef]
  22. Kim, M.; Chowdhury, M.M.I.; Nakhla, G.; Keleman, M. Synergism of co-digestion of food wastes with municipal wastewater treatment biosolids. Waste Manag. 2017, 61, 473–483. [Google Scholar] [CrossRef] [PubMed]
  23. Al bkoor Alrawashdeh, K.; Pugliese, A.; Slopiecka, K.; Pistolesi, V.; Massoli, S.; Bartocci, P.; Bidini, G.; Fantozzi, F. Codigestion of untreated and treated sewage sludge with the organic fraction of municipal solid wastes. Fermentation 2017, 3, 35. [Google Scholar] [CrossRef]
  24. Gu, J.; Liu, R.; Cheng, Y.; Stanisavljevic, N.; Li, L.; Djatkov, D.; Peng, X.; Wang, X. Anaerobic co-digestion of food waste and sewage sludge under mesophilic and thermophilic conditions: Focusing on synergistic effects on methane production. Bioresour. Technol. 2020, 301, 122765. [Google Scholar] [CrossRef] [PubMed]
  25. Angelidaki, I.; Angelidaki, I.; Alves, M.; Bolzonella, D.; Borzacconi, L.; Campos, J.L.; Guwy, A.J.; Kalyuzhnyi, S.; Jenicek, P.; van Lier, J.B. Defining the biomethane potential (BMP) of solid organic wastes and energy crops: A proposed protocol for batch assays. Water Sci. Technol. 2009, 59, 927–934. [Google Scholar] [CrossRef] [PubMed]
  26. Moody, L.; Burns, R.; Wu-Haan, W.; Spajić, R. Use of biochemical methane potential (BMP) assays for predicting and enhancing anaerobic digester performance. In Proceedings of the 4th International and 44th Croatian Symposium of Agriculture, Opatija, Croatia, 16–20 February 2009. [Google Scholar]
  27. Owen, W.F.; Stuckey, D.C.; Healy, J.B.; Young, L.Y.; McCarty, P.L. Bioassay for monitoring biochemical methane potential and anaerobic toxicity. Water Res. 1979, 13, 485–492. [Google Scholar] [CrossRef]
  28. Metcalf & Eddy. Wastewater Engineering: Treatment and Resource Recovery, 5th ed.; McGraw-Hill Professional: New York, NY, USA, 2014. [Google Scholar]
  29. Baird, R.B. Standard Methods for the Examination of Water and Wastewater, 23rd ed.; Water Environment Federation, American Public Health Association: Washington, DC, USA, 2017. [Google Scholar]
  30. DuBois, M.; Gilles, K.A.; Hamilton, J.K.; Rebers, P.A.; Smith, F. Smith Colorimetric Method for Determination of Sugars and Related Substances. Anal. Chem. 1956, 28, 350–356. [Google Scholar] [CrossRef]
  31. Bougrier, C.; Delgenès, J.P.; Carrère, H. Impacts of thermal pre-treatments on the semi-continuous anaerobic digestion of waste activated sludge. Biochem. Eng. J. 2007, 34, 20–27. [Google Scholar] [CrossRef]
  32. Wang, N.; Zheng, T.; Ma, Y. New insights into the co-locating concept on synergistic co-digestion of sewage sludge and food waste towards energy self-sufficient in future WWTPs. Bioresour. Technol. Rep. 2020, 10, 100351. [Google Scholar] [CrossRef]
  33. Ismail, A.; Kakar, F.L.; Elbeshbishy, E.; Nakhla, G. Combined thermal hydrolysis pretreatment and anaerobic co-digestion of waste activated sludge and food waste. Renew. Energy 2022, 195, 528–539. [Google Scholar] [CrossRef]
  34. Weemaes, M.P.J.; Verstraete, W.H. Evaluation of current wet sludge disintegration techniques. J. Chem. Technol. Biotechnol. 1998, 73, 83–92. [Google Scholar] [CrossRef]
  35. Rittmann, B.E.; McCarty, P.L. Environmental Biotechnology: Principles and Applications, 1st ed.; McGraw-Hill Education: New York, NY, USA, 2001; Available online: https://www.accessengineeringlibrary.com/content/book/9781260440591 (accessed on 22 February 2024).
  36. Koch, K.; Helmreich, B.; Drewes, J.E. Co-digestion of food waste in municipal wastewater treatment plants: Effect of different mixtures on methane yield and hydrolysis rate constant. Appl. Energy 2015, 137, 250–255. [Google Scholar] [CrossRef]
  37. Jadhav, D.A.; Dutta, S.; Sherpa, K.C.; Jayaswal, K.; Saravanabhupathy, S.; Mohanty, K.T.; Banerjee, R.; Kumar, J.; Rajak, R.C. Chapter 7—Co-digestion processes of waste: Status and perspective. In Bio-Based Materials and Waste for Energy Generation and Resource Management; Hussain, C.M., Kushwaha, A., Bharagava, R.N., Goswami, L., Eds.; Elsevier: Amsterdam, The Netherlands, 2023; pp. 207–241. [Google Scholar] [CrossRef]
  38. Wang, X.; Lu, X.; Li, F.; Yang, G. Effects of Temperature and Carbon-Nitrogen (C/N) Ratio on the Performance of Anaerobic Co-Digestion of Dairy Manure, Chicken Manure and Rice Straw: Focusing on Ammonia Inhibition. PLoS ONE 2014, 9, e97265. [Google Scholar] [CrossRef] [PubMed]
  39. Viotti, P.; Di Genova, P.; Falcioli, F. Numerical analysis of the anaerobic co-digestion of the organic fraction from municipal solid waste and wastewater: Prediction of the possible performances at Olmeto plant in Perugia (Italy). Waste Manag. Res. 2004, 22, 115–128. [Google Scholar] [CrossRef] [PubMed]
  40. Zamanzadeh, M.; Hagen, L.H.; Svensson, K.; Linjordet, R.; Horn, S.J. Biogas production from food waste via co-digestion and digestion- effects on performance and microbial ecology. Sci. Rep. 2017, 7, 17664. [Google Scholar] [CrossRef]
Figure 1. Cumulative methane yields of the investigated conditions.
Processes 12 00794 g001
Figure 2. Methane production rates of the investigated conditions.
Processes 12 00794 g002
Figure 3. Synergetic improvements in methane yields.
Processes 12 00794 g003
Figure 4. Synergetic improvements in kinetics.
Processes 12 00794 g004
Table 1. Characteristics of the feedstocks and inoculum.
Parameter SSO *TWASInoculum
TSs62,300 ± 0.0238,800 ± 0.1221,500 ± 0.03
VSs43,500 ± 0.0231,200 ± 0.0113,100 ± 0.02
TSSs53,800 ± 0.1231,500 ± 0.117,000 ± 0.02
VSSs38,500 ± 0.125,600 ± 0.110,900 ± 0.02
TCOD110,000 ± 0.140,000 ± 0.116,400 ± 0.03
sCOD44,400360 ± 0.1362 ± 0.05
TN4170 ± 0.182900 ± 0.142030 ± 0.1
sN1790 ± 0.02420 ± 0.15696 ± 0.16
NHx-N1740255 ± 0.121500 ± 0.03
TCarbs40,400 ± 0.11290 ± 0.1961 ± 0.1
TProteins2020 ± 0.11460 ± 0.2585 ± 0.1
TLipids18,600 ± 0.12551 ± 0.11920 ± 0.1
Alkalinity (CaCO3)7700 ± 0.071950 ± 0.13940 ± 0.12
pH5.66.37.2
* Sample average ± standard deviation. All units are in mg/L except pH.
Table 2. Factorial design of the experiment.
ConditionTWAS
0%10%30%50%70%90%100%
SSO0% R8
10% R7
30% R6
50% R5
70% R4
90% R3
100%R1
Table 3. Kinetic analysis of the mono- and co-digested feedstocks.
FeedstockP (mL CH4/g COD)Rm (mL CH4/g COD/d)λ (d)R2
TWAS181100.000.985
SSO292181.950.993
TWAS: SSO 90:10222140.800.985
TWAS: SSO 70:30293210.970.989
TWAS: SSO 50:50310253.110.996
TWAS: SSO 30:70329262.730.994
TWAS: SSO 10:90333251.850.993
Table 4. COD/N ratios, L:P:C ratios, and ultimate methane yields of the mono- and co-digested feedstocks.
FeedstockCOD/NL:P:CP (mL CH4/g COD)
TWAS141:3:2181
SSO289:1:20292
TWAS: SSO 90:10162:1:4222
TWAS: SSO 70:30194:1:8293
TWAS: SSO 50:50216:1:12310
TWAS: SSO 30:70267:1:15329
TWAS: SSO 10:90248:1:18333
Disclaimer/Publisher’s Note: The statements, opinions and data contained in all publications are solely those of the individual author(s) and contributor(s) and not of MDPI and/or the editor(s). MDPI and/or the editor(s) disclaim responsibility for any injury to people or property resulting from any ideas, methods, instructions or products referred to in the content.

