Article

Automatic Detection of Banana Maturity—Application of Image Recognition in Agricultural Production

1
College of Mechanical Engineering, Wuhan Polytechnic University, Wuhan 430048, China
2
Hubei Cereals and Oils Machinery Engineering Center, Wuhan 430048, China
3
School of Mechanical and Manufacturing Engineering, University of South Wales, Sydney 4385, Australia
*
Author to whom correspondence should be addressed.
Processes 2024, 12(4), 799; https://doi.org/10.3390/pr12040799
Submission received: 25 January 2024 / Revised: 1 April 2024 / Accepted: 9 April 2024 / Published: 16 April 2024

Abstract

:
With the development of machine vision technology, deep learning and image recognition technology has become a research focus for agricultural product non-destructive inspection. During the ripening process, banana appearance and nutrients clearly change, causing damage and unjustified economic loss. A high-efficiency banana ripeness recognition model was proposed based on a convolutional neural network and transfer learning. Banana photos at different ripening stages were collected as a dataset, and data augmentation was applied. Then, weights and parameters of four models trained on the original ImageNet dataset were loaded and fine-tuned to fit our banana dataset. To investigate the learning rate’s effect on model performance, fixed and updating learning rate strategies are analyzed. In addition, four CNN models, ResNet 34, ResNet 101, VGG 16, and VGG 19, are trained based on transfer learning. Results show that a slower learning rate causes the model to converge slowly, and the training loss function oscillates drastically. With different learning rate updating strategies, MultiStepLR performs the best and achieves a better accuracy of 98.8%. Among the four models, ResNet 101 performs the best with the highest accuracy of 99.2%. This research provides a direct effective model and reference for intelligent fruit classification.

1. Introduction

Bananas are one of the most important crops all over the world [1]. They are widely sold around the world and are considered as one of the most important traded fruits [2,3]. Bananas are rich in minerals and vitamins and have a high carbohydrate and low fat content [4,5]. As shown in Figure 1, the general process of bananas production from harvest to sale in the market is picking, cleaning, packing, transportation, storage, and, finally, mature bananas placed on the shelf for sale [6]. At different ripening stages after banana harvest, fruits contain different physiochemical and nutritional characteristics [7]. In addition, in the process of banana ripening, the peel gradually changes from immature green to mature yellow due to the degradation of chlorophyll pigment. Overripe bananas appear with black spots or even rot [8,9]. Consumers usually choose bananas with superior appearance, and the black spots and partial rot on overripe bananas cannot be accepted by markets. On the other hand, since bananas are a climacteric fruit, unripe bananas need to be ripened before sale to achieve good flavor and texture and uniform skin color [10]. Unripe bananas are not chosen by consumers for long-term storage on shelves due to their poor appearance quality. Therefore, the appearances of overripe and underripe bananas seriously affect their economic value, causing losses to supermarket. Before selling, the banana ripeness should be considered; therefore, banana ripeness classification is crucial, as it is related to bananas’ appearance quality and economic value.
According to international standards, three aspects should be considered in fruit quality testing: maturity, geometry, and defects. Maturity can generally be determined based on the fruit color level [11]. Traditional maturity assessment mainly depends on the expert manual evaluation of fruits appearance [12]. It is time-consuming and labor-intensive, which also leads to judgement errors due to external factors [13]. Based on these facts, many scholars have proposed intelligent recognition and classification methods according to image information. For example, traditional machine learning methods use images’ color or texture features for image recognition. Although traditional machine learning has achieved great success and has been applied in certain specific fields, the demand for extensive labeled images has become a major limiting factor [14]. With the rapid development of image recognition algorithms, the deep learning method combined with transfer learning methods has shown significant advantages. This method utilizes multi-layer networks to process data for feature extraction and transfers pretrained weights and parameters. Currently, the application of CNN and the transfer learning image recognition method has become increasingly widespread. Traditional CNN models attempt to learn each task from the beginning. But in some cases, people can better solve new problems with the learned knowledge or skills beforehand. For example, people can more accurately and quickly recognize motorcycles if they can already recognize bicycles well. In order to solve existing problems more quickly, it is necessary to use the transfer of knowledge that is used to solve similar problems; this is called transfer learning [15]. It has been applied in many fields, including face recognition, signal processing, and robot technology [16,17,18]. In the agricultural field, researchers have studied disease identification and fruit ripeness detection. Jiang used the pretraining model VGG 16 on ImageNet for transfer learning and alternating learning, obtaining 97.22% recognition accuracy for rice leaf diseases and 98.75% for wheat leaf diseases [19]. AlexNet and VGG 16 models were applied to jujube maturity classification based on transfer learning, achieving the best accuracy of 99.17% with better performance [20]. To obtain apple deformation features, five main pretrained CNN models were used, classifying the physiological disorders [21]. When using CNN models and transfer learning, the model performance should match the dataset. The learning-to-augment strategy for an orange fruit dataset was analyzed with the models GoogleNet, ResNet18, ResNet50, ShuffleNet, MobileNetv2, and DenseNet201. ResNet50 reached a better accuracy at 99.5% [22]. In the task of fruit maturity recognition, the ResNet and VGG models show high efficiency and better performance when combined with transfer learning. Several pretrained models were applied to classify three tomatoes classes. VGG 19 performed the best, achieving 97.37% accuracy for the condition [23]. In addition, during the model training process, the performance of different CNN models was analyzed and various parameters and optimizers were usually compared to obtain the optimal recognition condition. Optimizers with different learning rates need to be analyzed for their impact on model accuracy [24,25].
Classification model accuracy has been analyzed under ideal conditions for recognition. A few studies have focused on banana ripeness in real conditions and classification models’ working performance. Bananas with more appearance features during recognition and classification can achieve higher accuracy [26]. Image processing methods need to be able to identify the banana ripeness stage by the color and size properties [27]. Novel artificial neural networks for real working conditions should be proposed, using Tamura statistical texture, color, and brown spots to classify banana ripeness stages [28]. Compared with machine learning methods, the proposed method achieved a good accuracy of 97.75%. In previous studies, researchers classified banana ripeness by traditional machine learning to extract features. The accuracy of classification and recognition has improved considerably with optimization and method refinement; however, drawbacks exist under traditional image recognition technology. Vast image pre-processing is needed, including image segmentation and edge detection. In addition, method implementation is based on abundant images with real labels, the generation of which is a time-consuming and laborious task. The CNN method combined with transfer learning has better performance than traditional machine learning in fruit maturity recognition fields [29,30].
Accurate fruit ripeness classification is important in the real working production line and selling stage. Both traditional identification and the CNN method have defects in classification tasks, and the transfer learning method can better solve these problems. Efficient results have been shown in related image recognition and online fields. The classification of bananas ripeness stage using this approach needs in-depth upgrading. In this paper, the research method based on combined CNN and transfer learning was applied for banana ripeness recognition, to achieve automatic, accurate, and efficient working performance. The main contents of the paper are as follows:
(1)
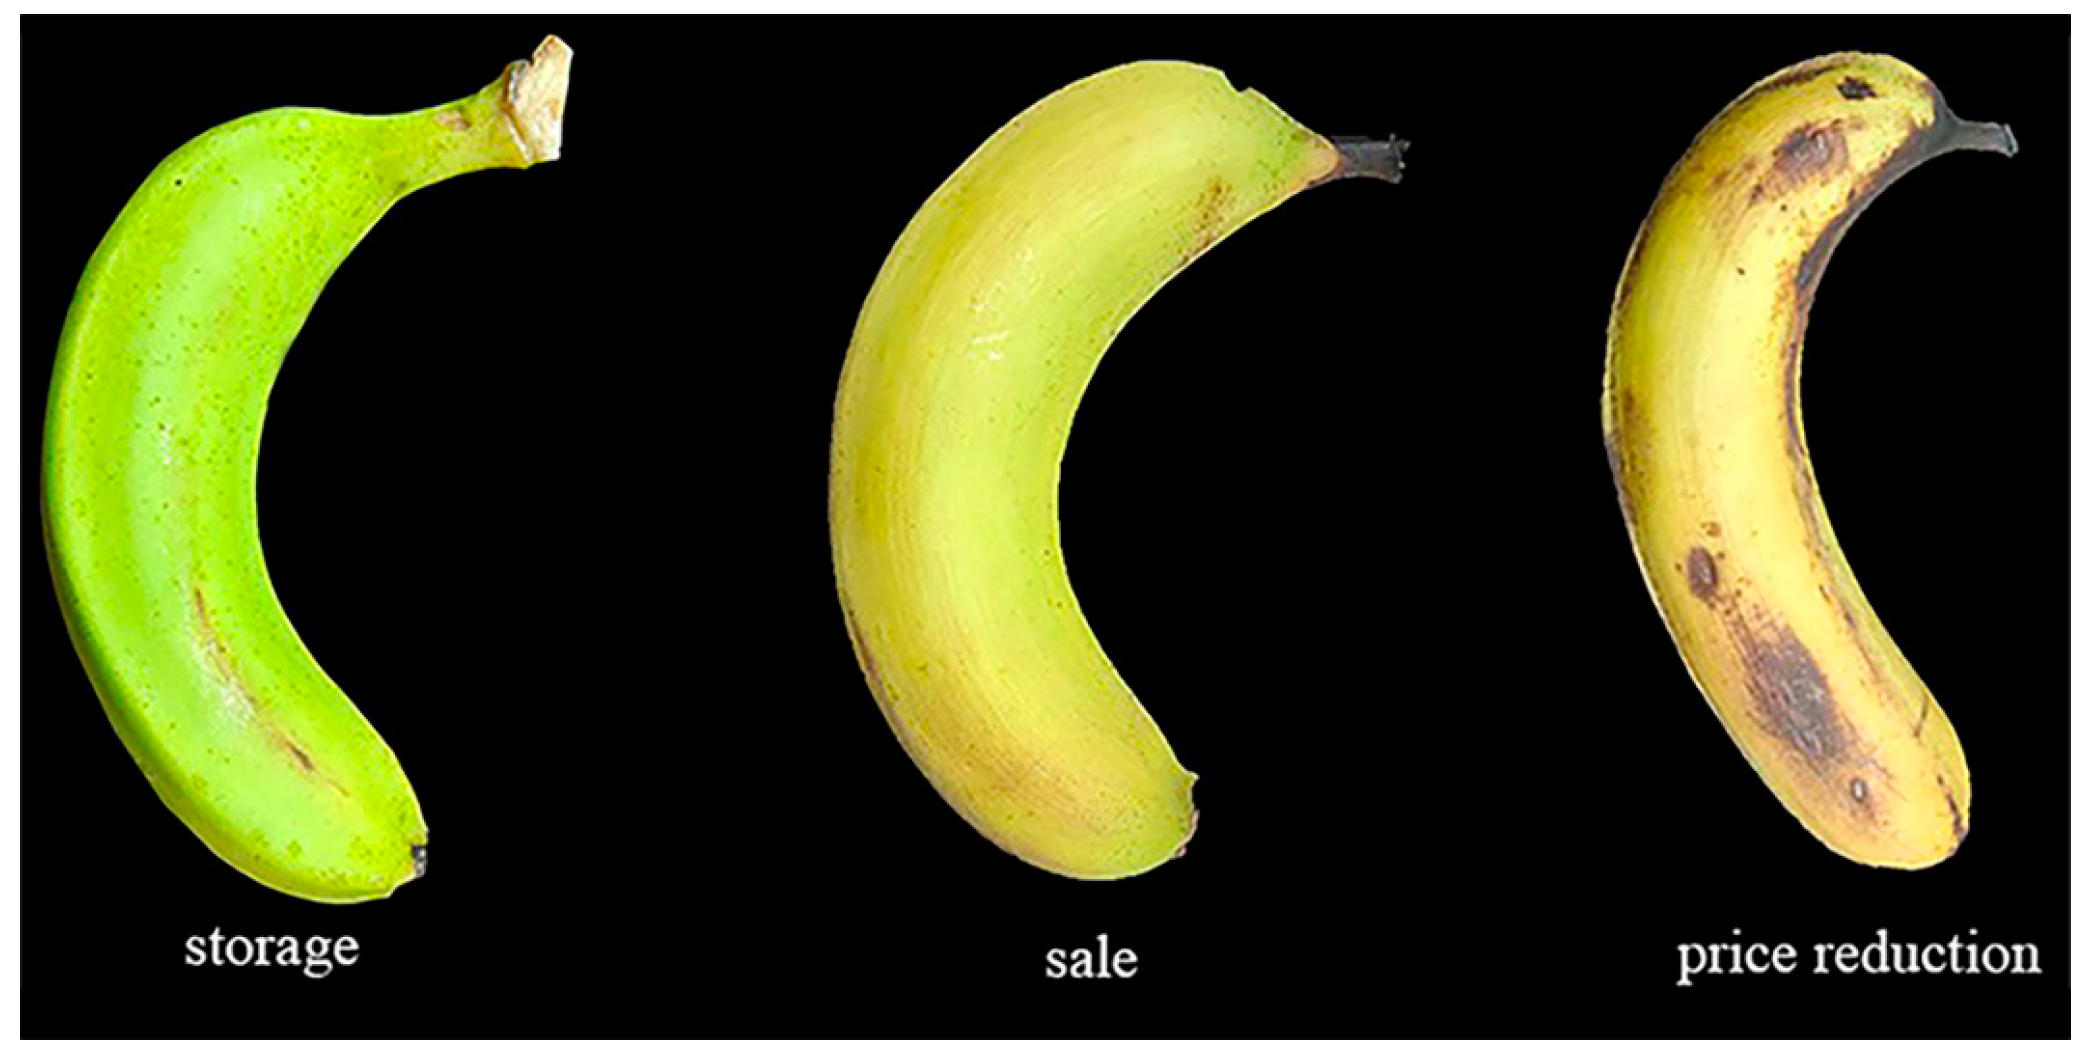
A banana dataset was established; three categories were obtained that combined general ripeness standards with real market sales.
(2)
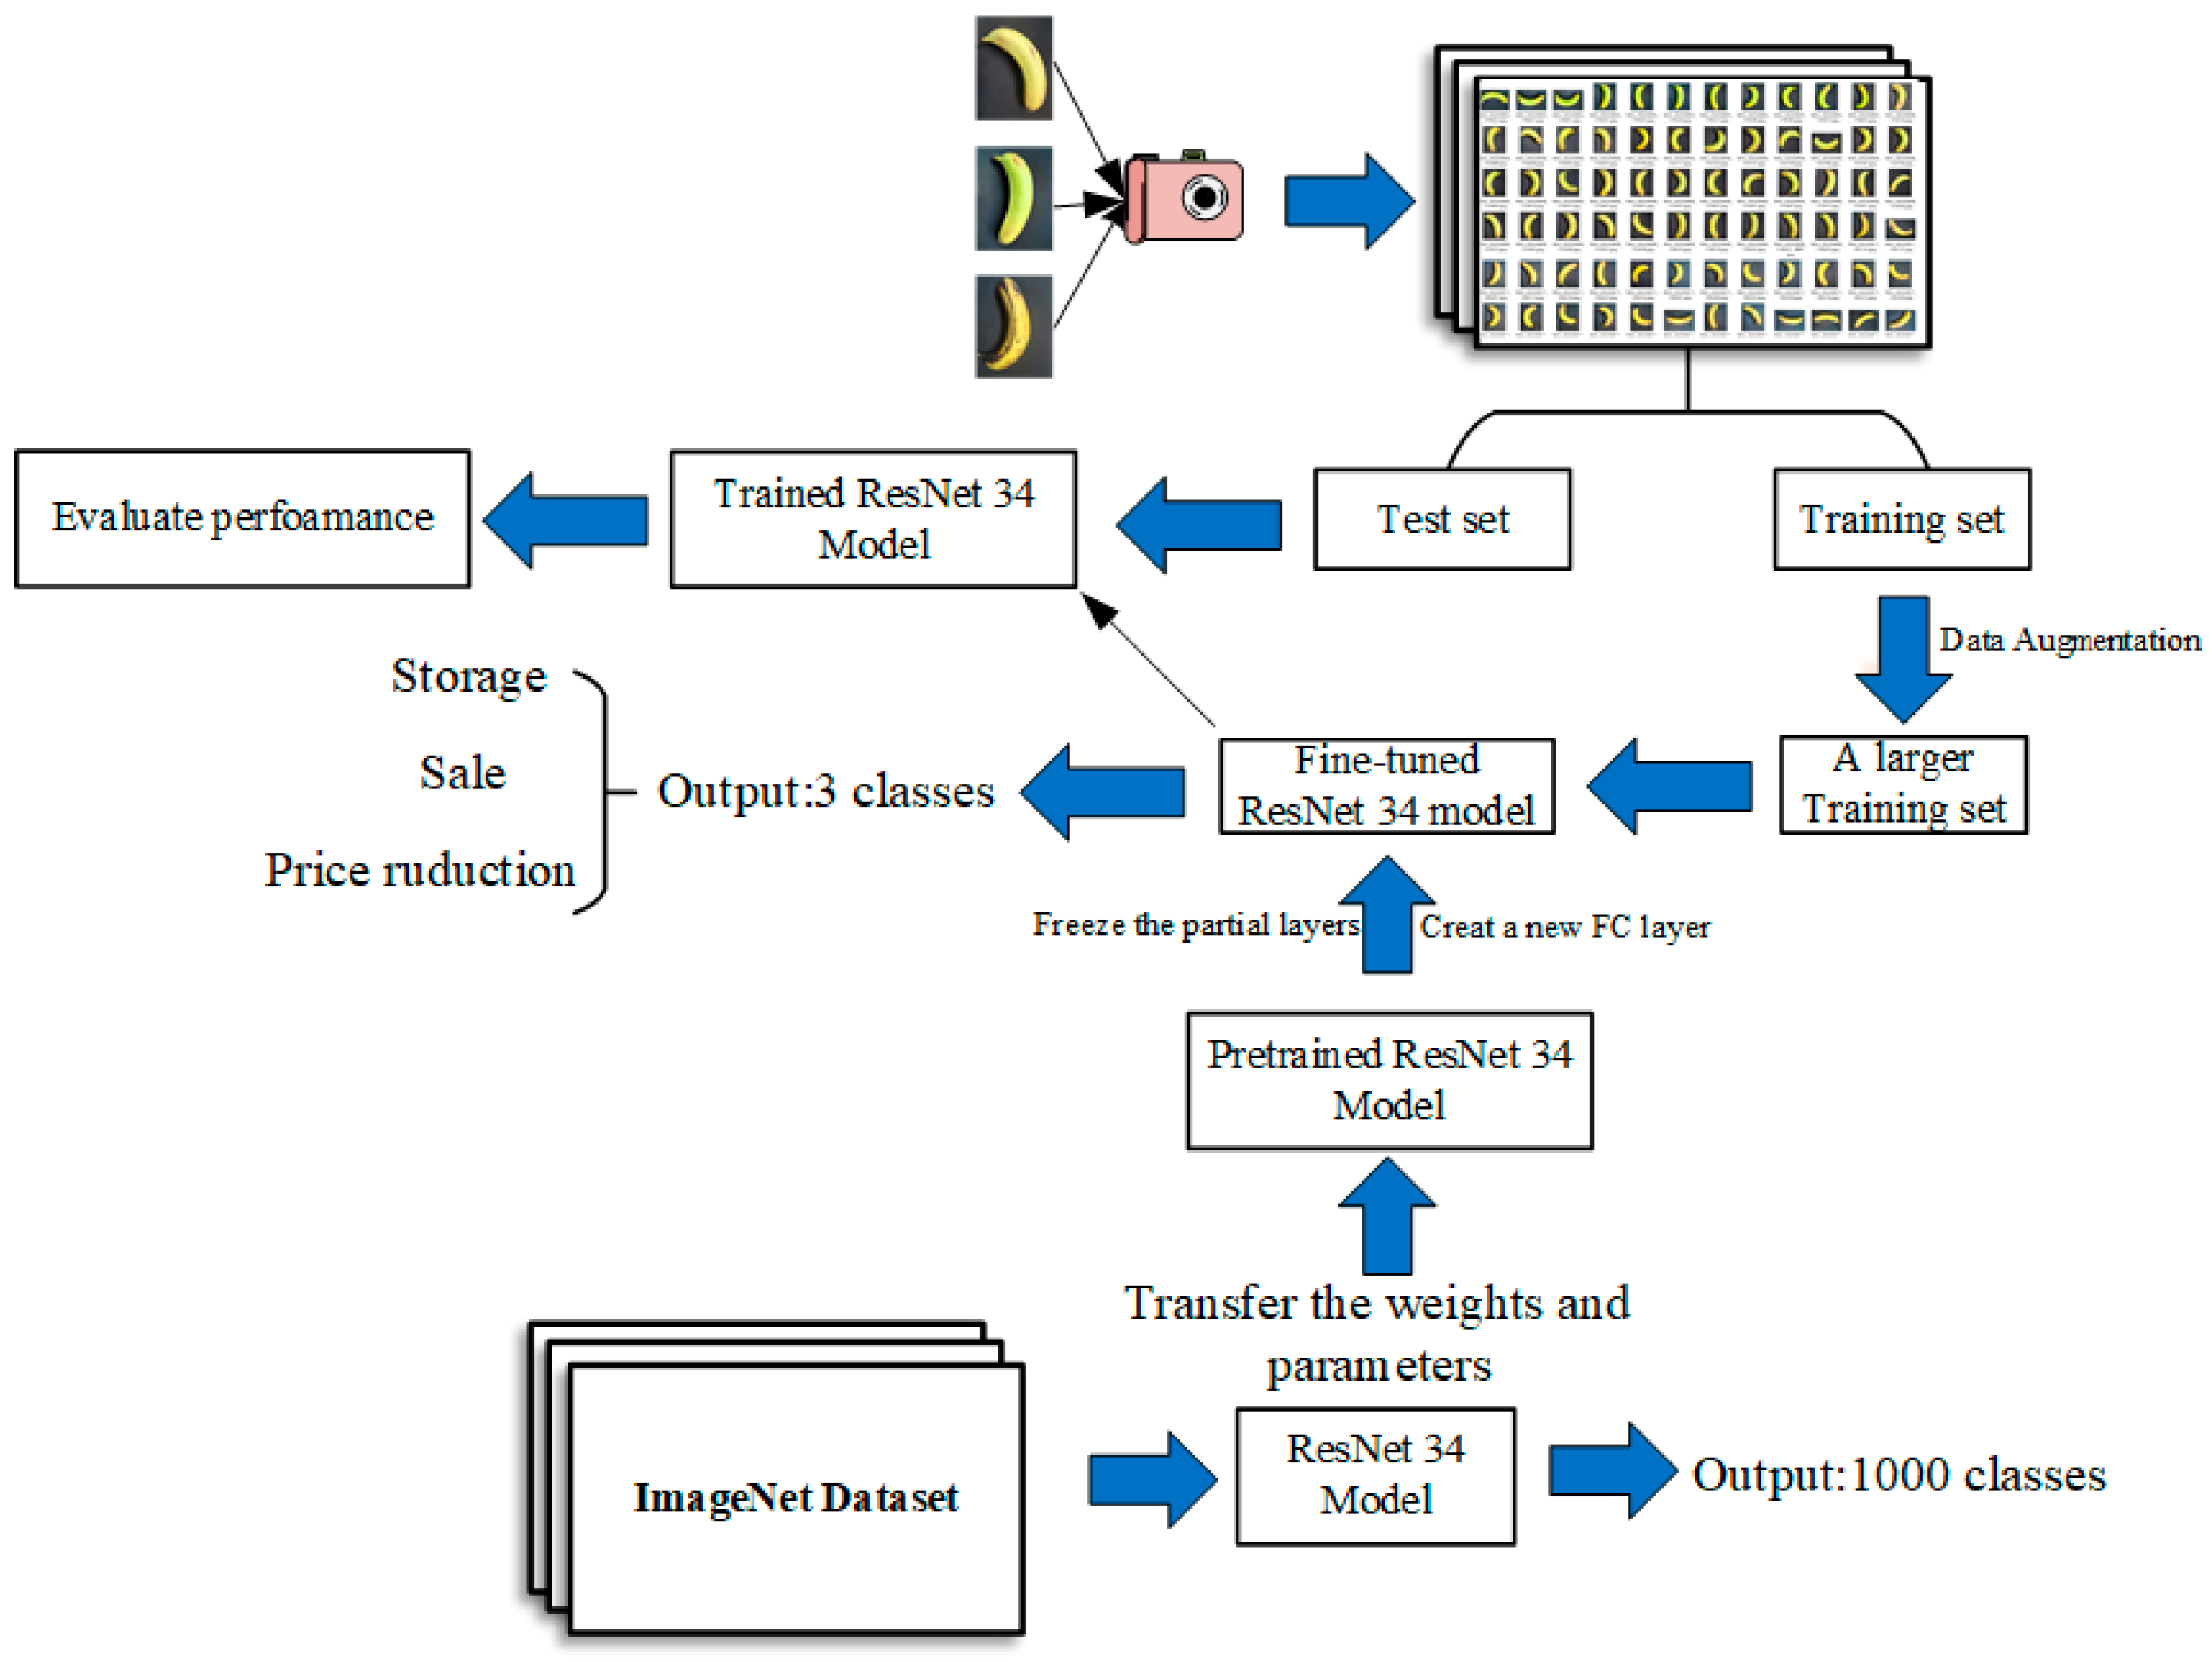
A combined classification model for banana ripeness stages was proposed based on the CNN and transfer learning method.
(3)
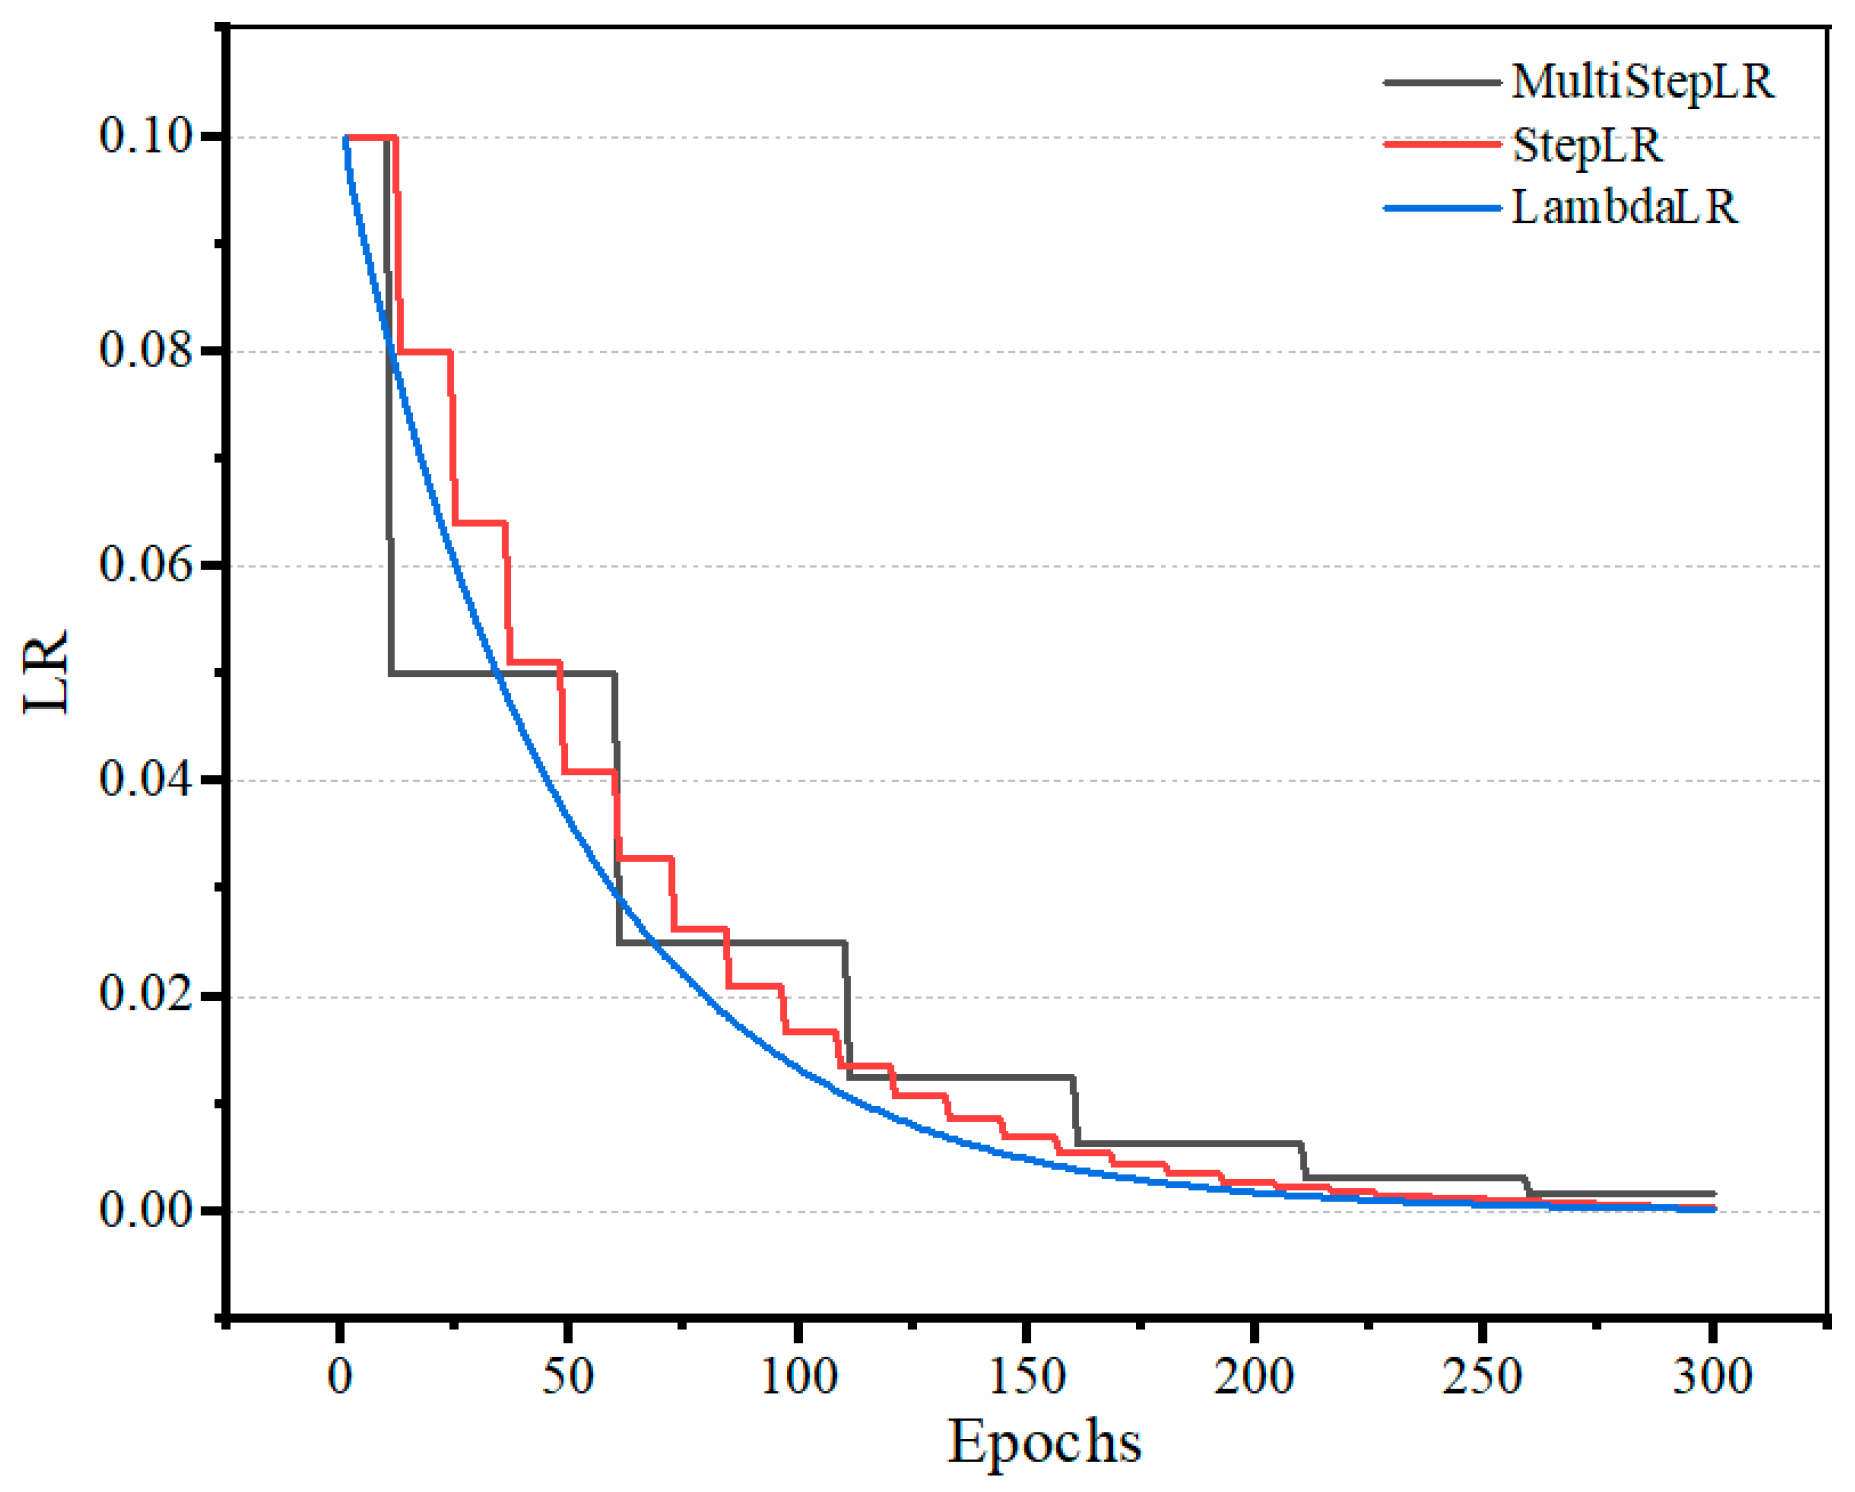
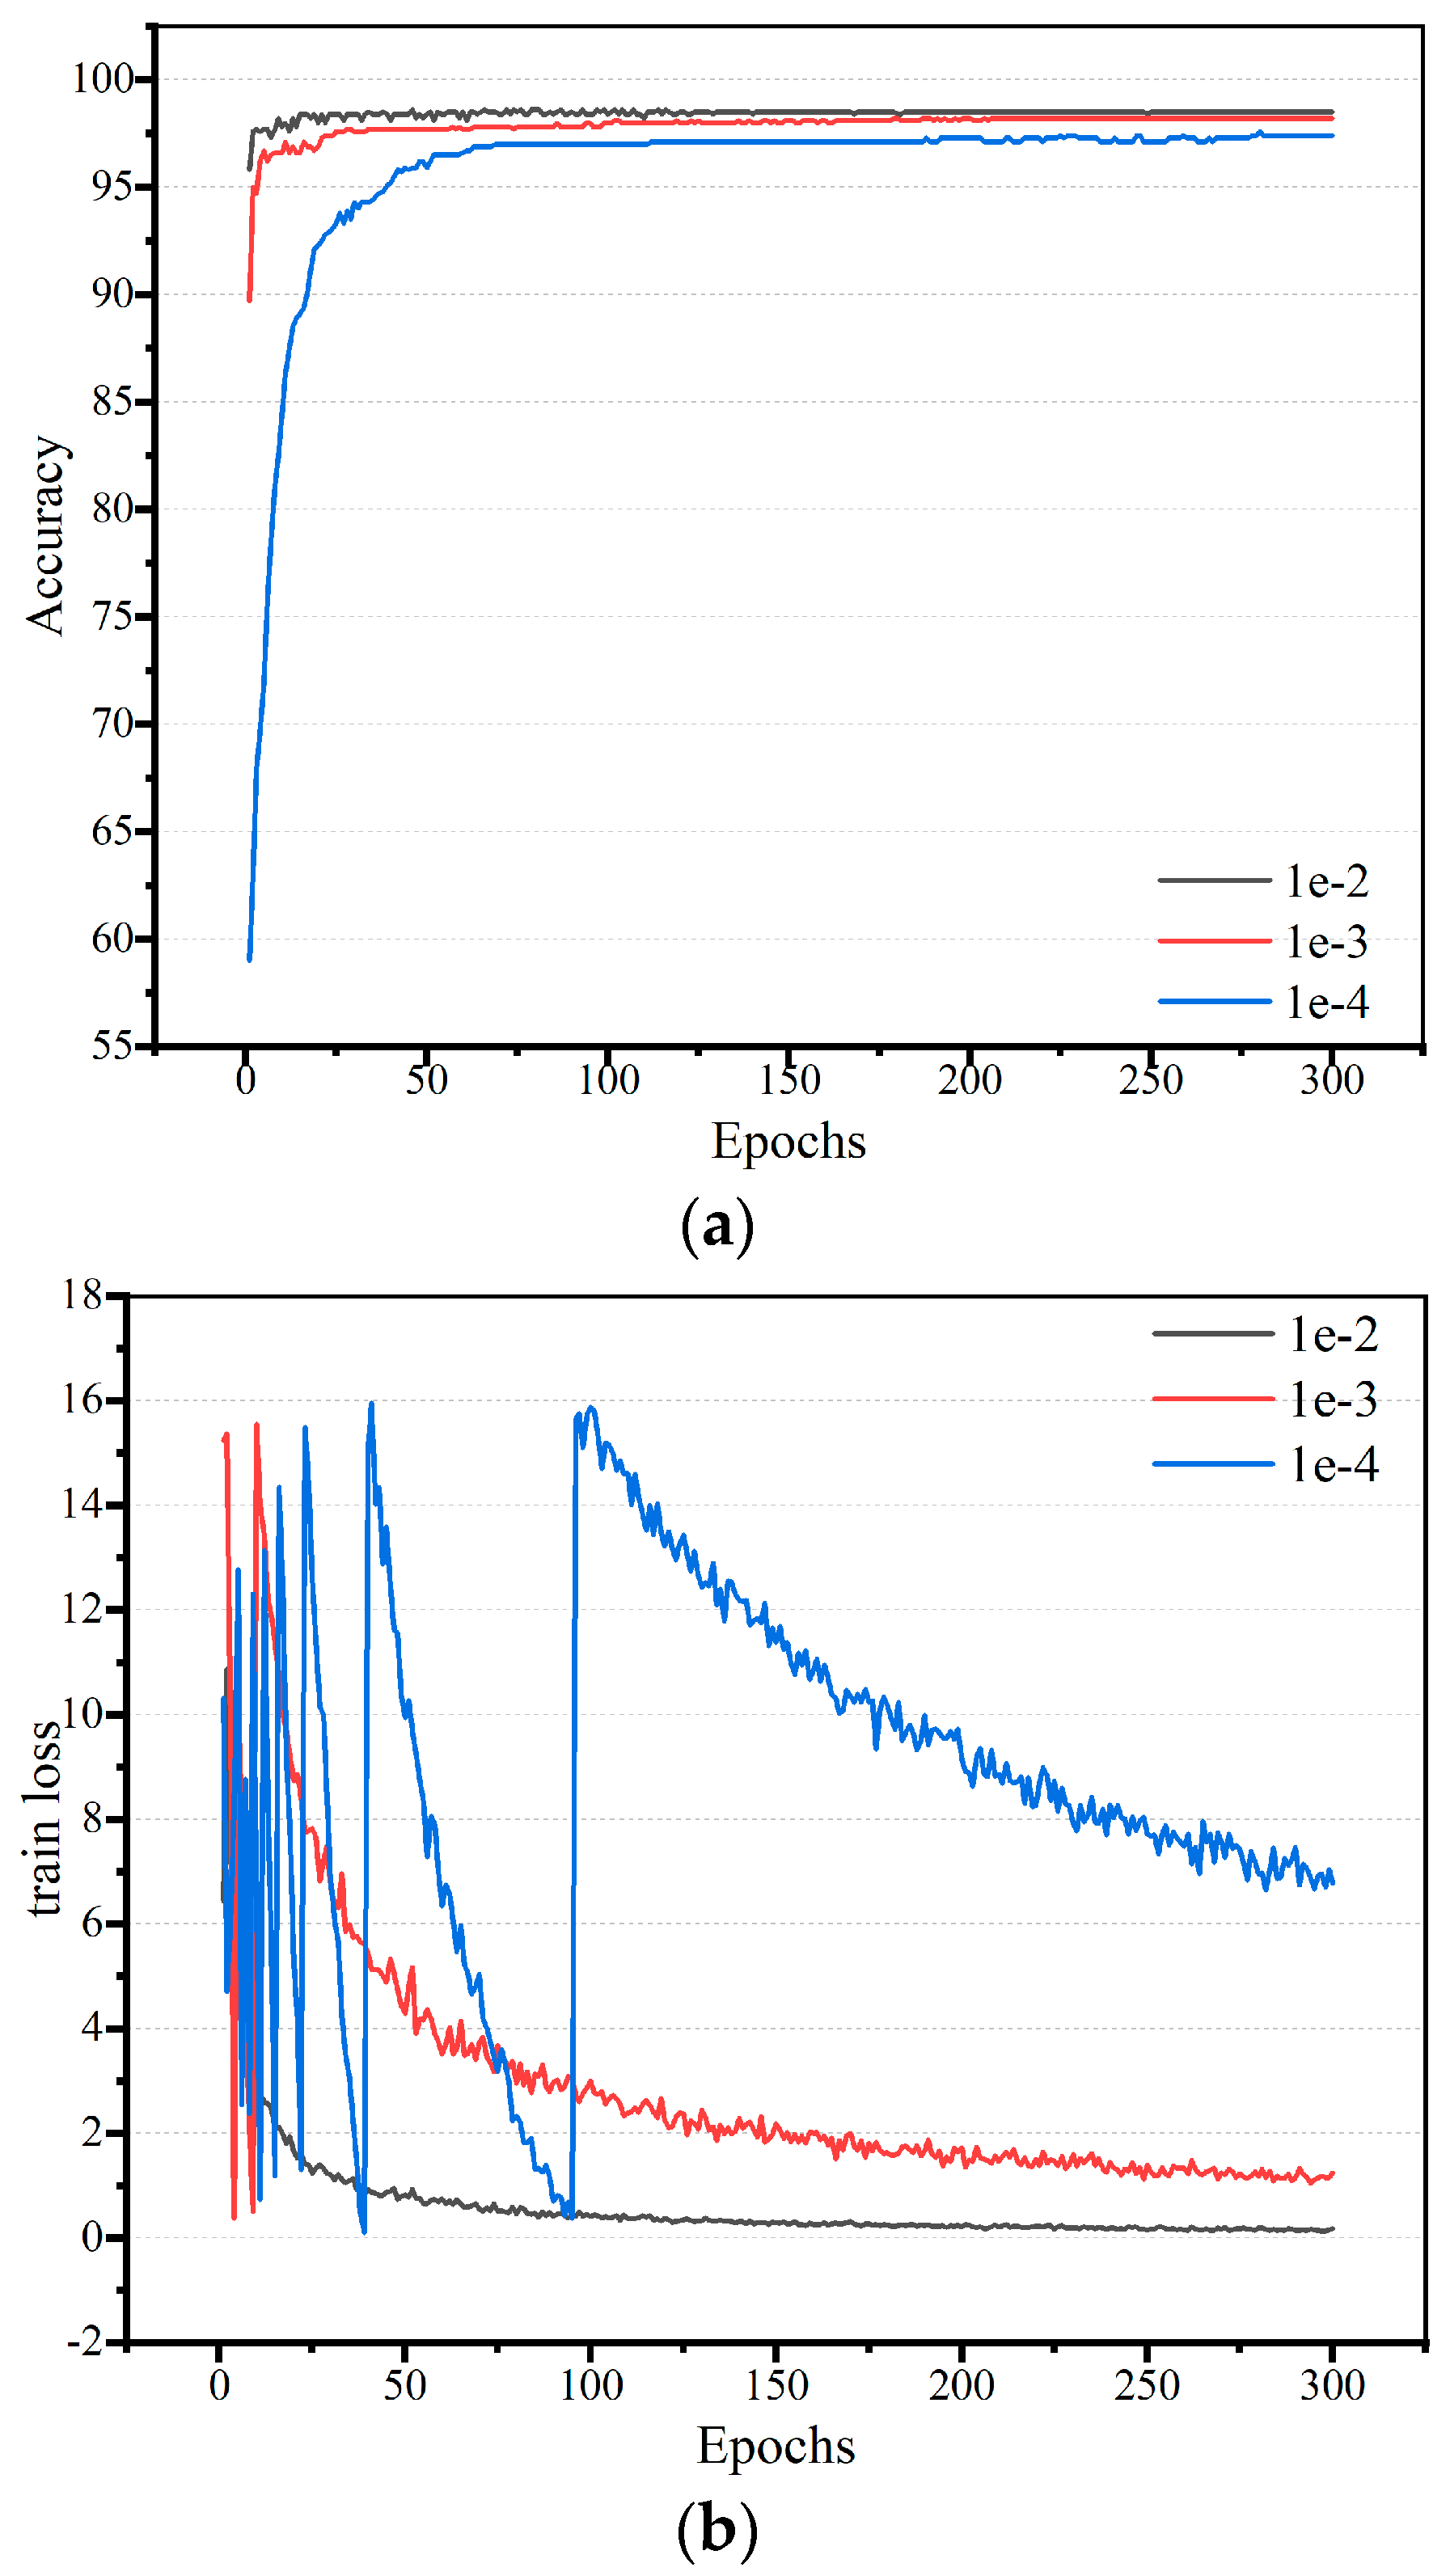
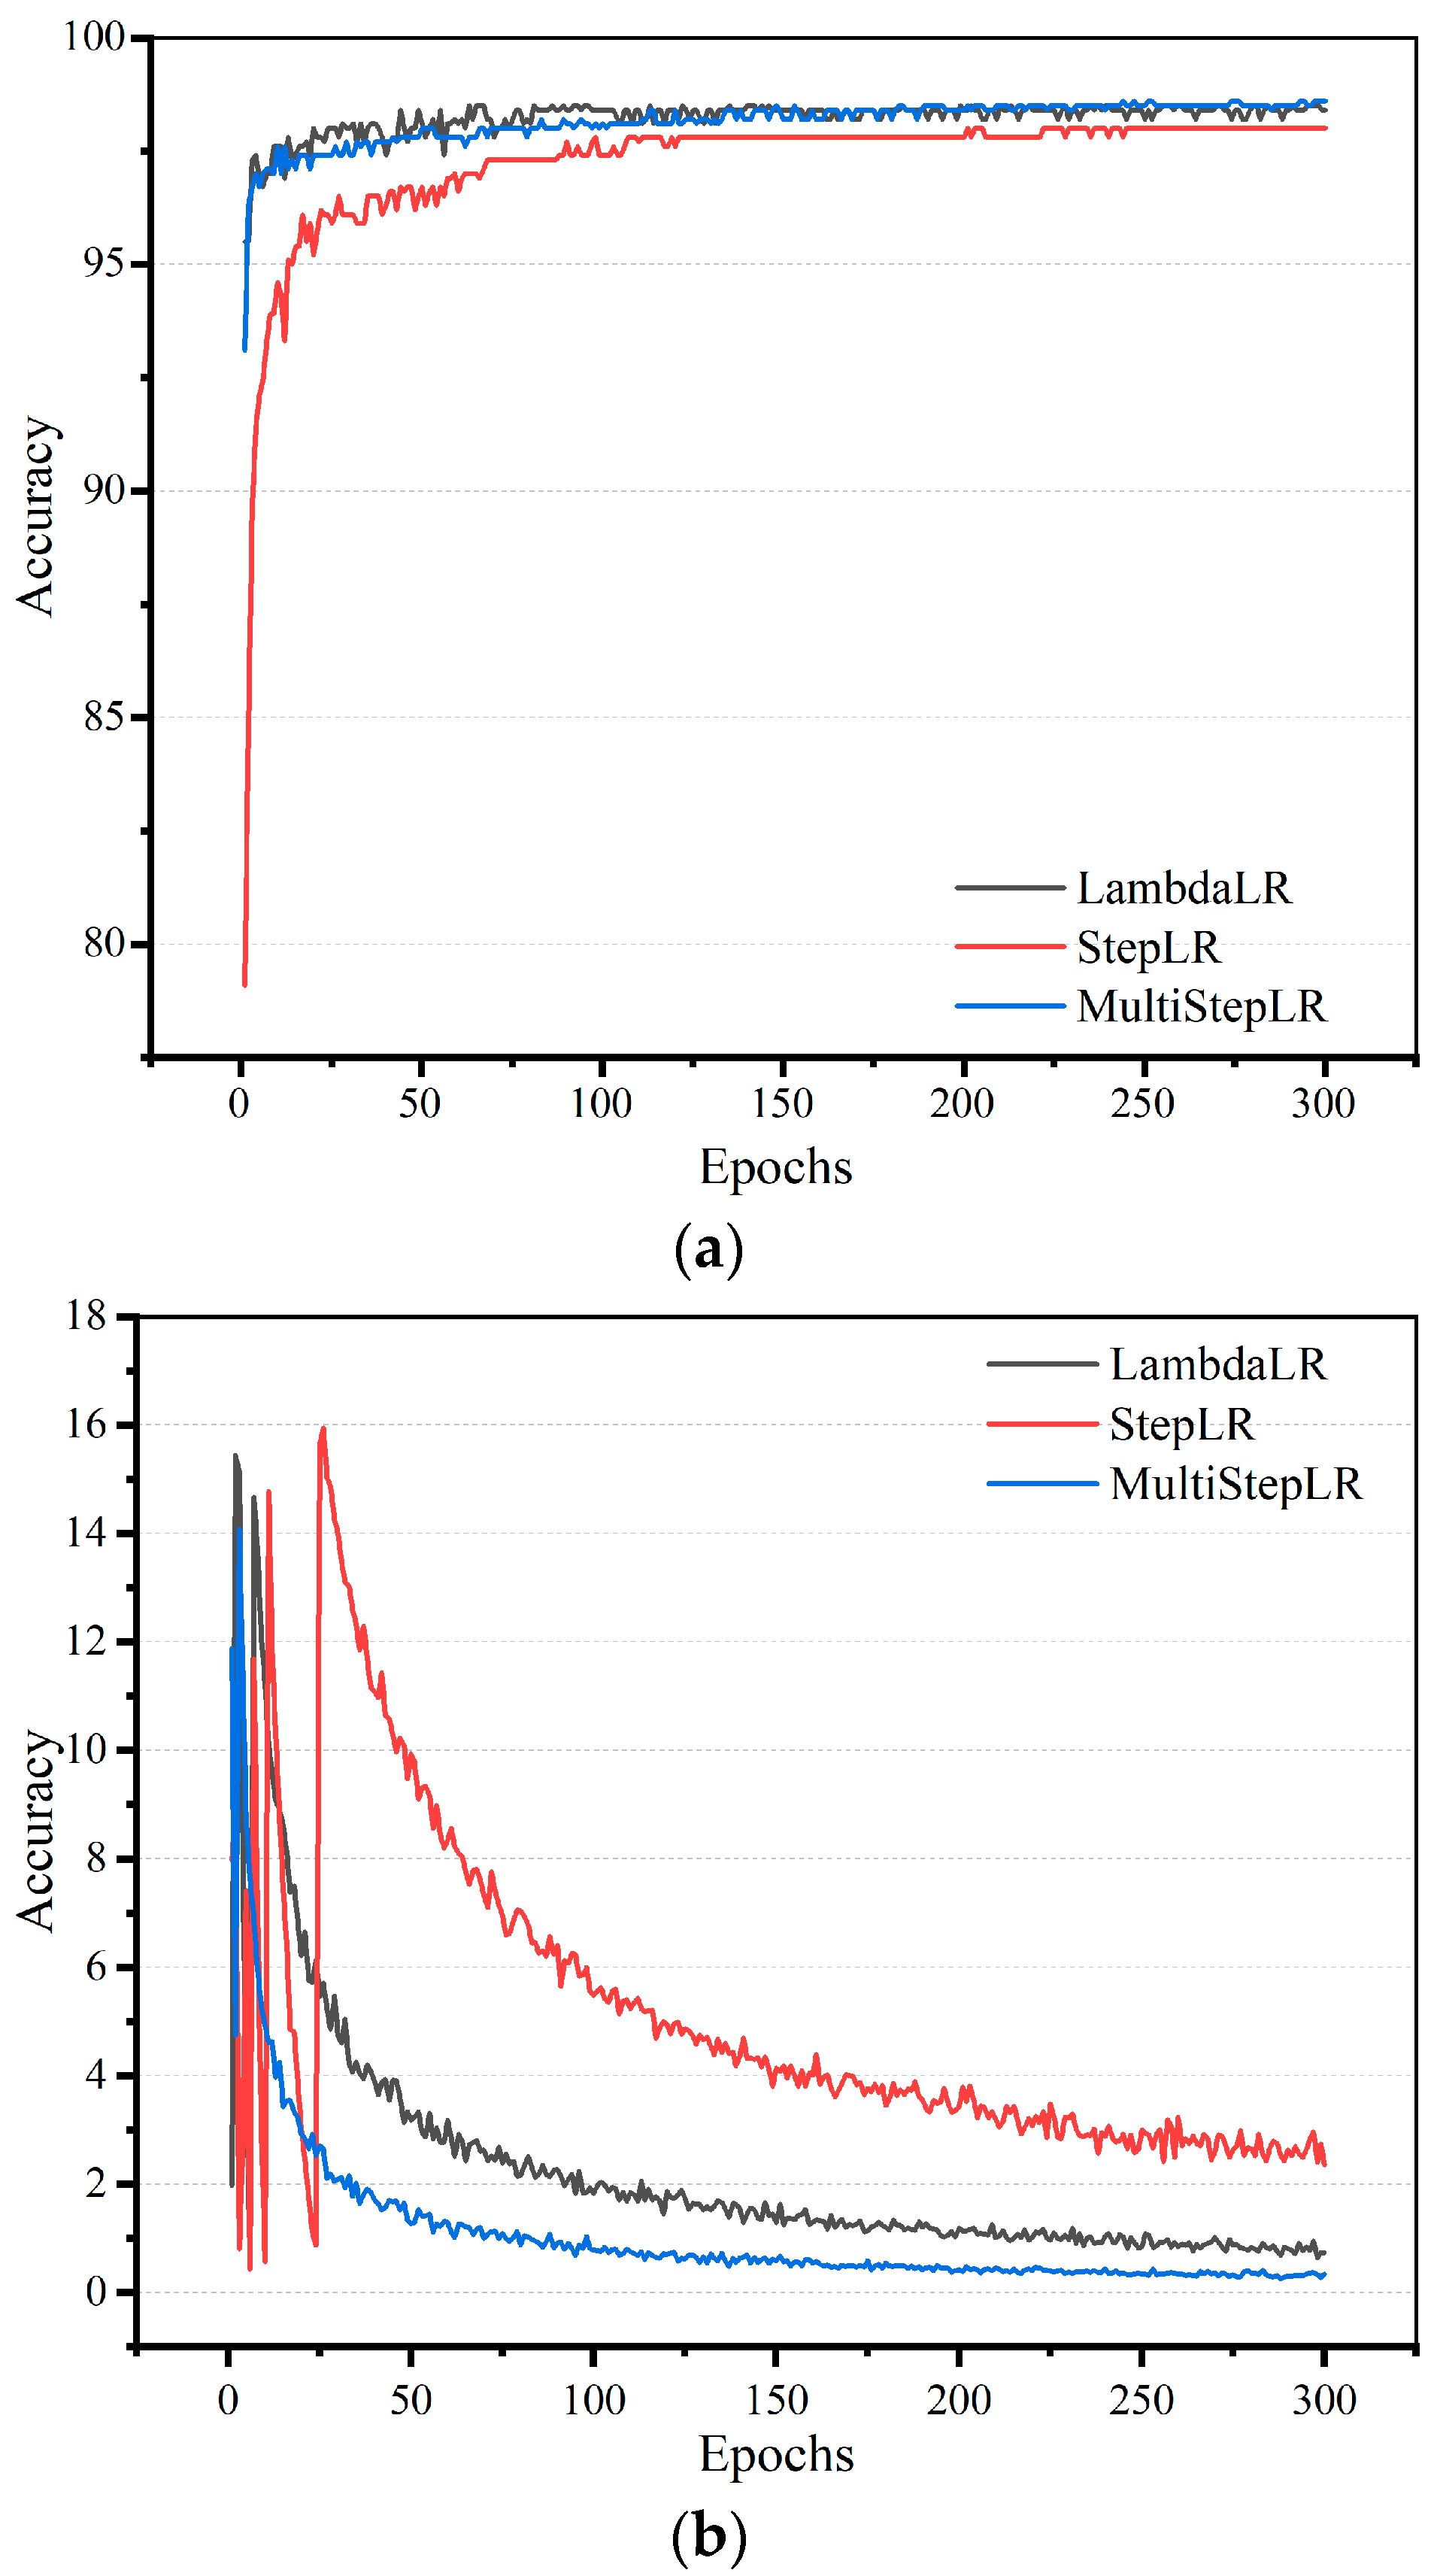
The influence of fixed learning rates and learning rate updating strategies on model optimization were studied in depth.
(4)
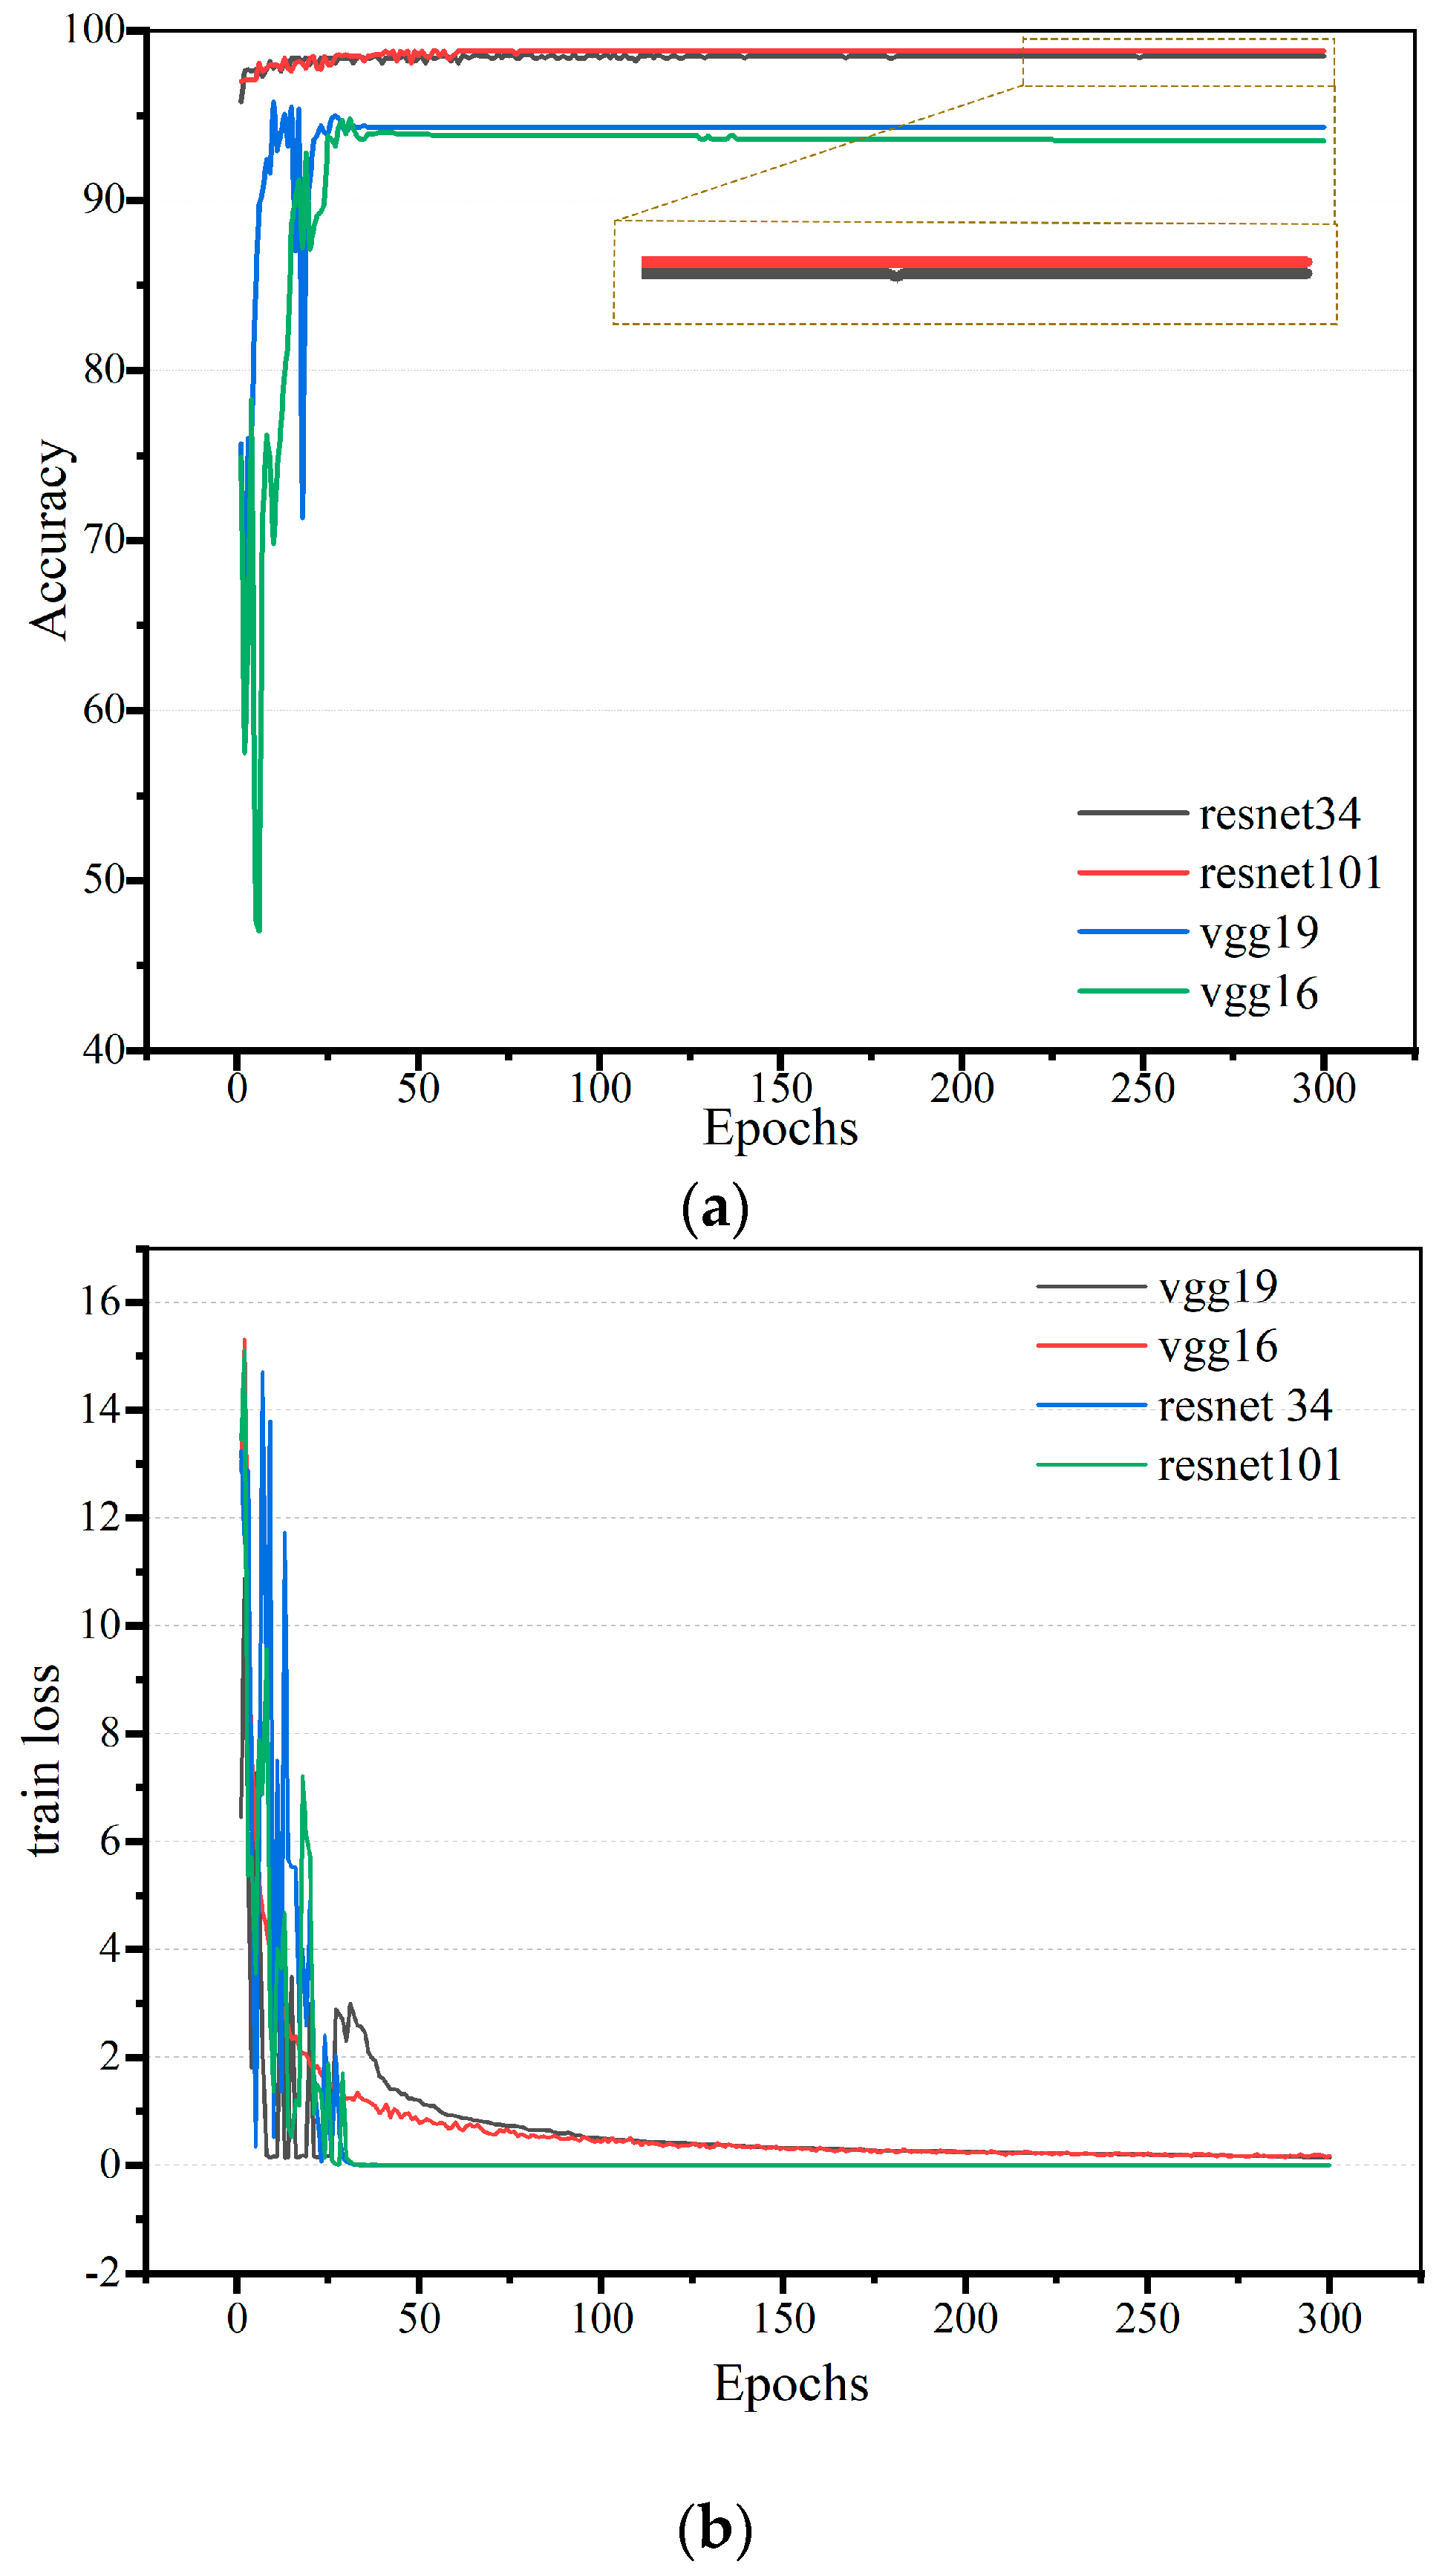
The performances of four fine-tuned CNN models were researched to identify the model that is most suitable for banana datasets, including ResNet 34, ResNet 101, VGG 16, and VGG 19.

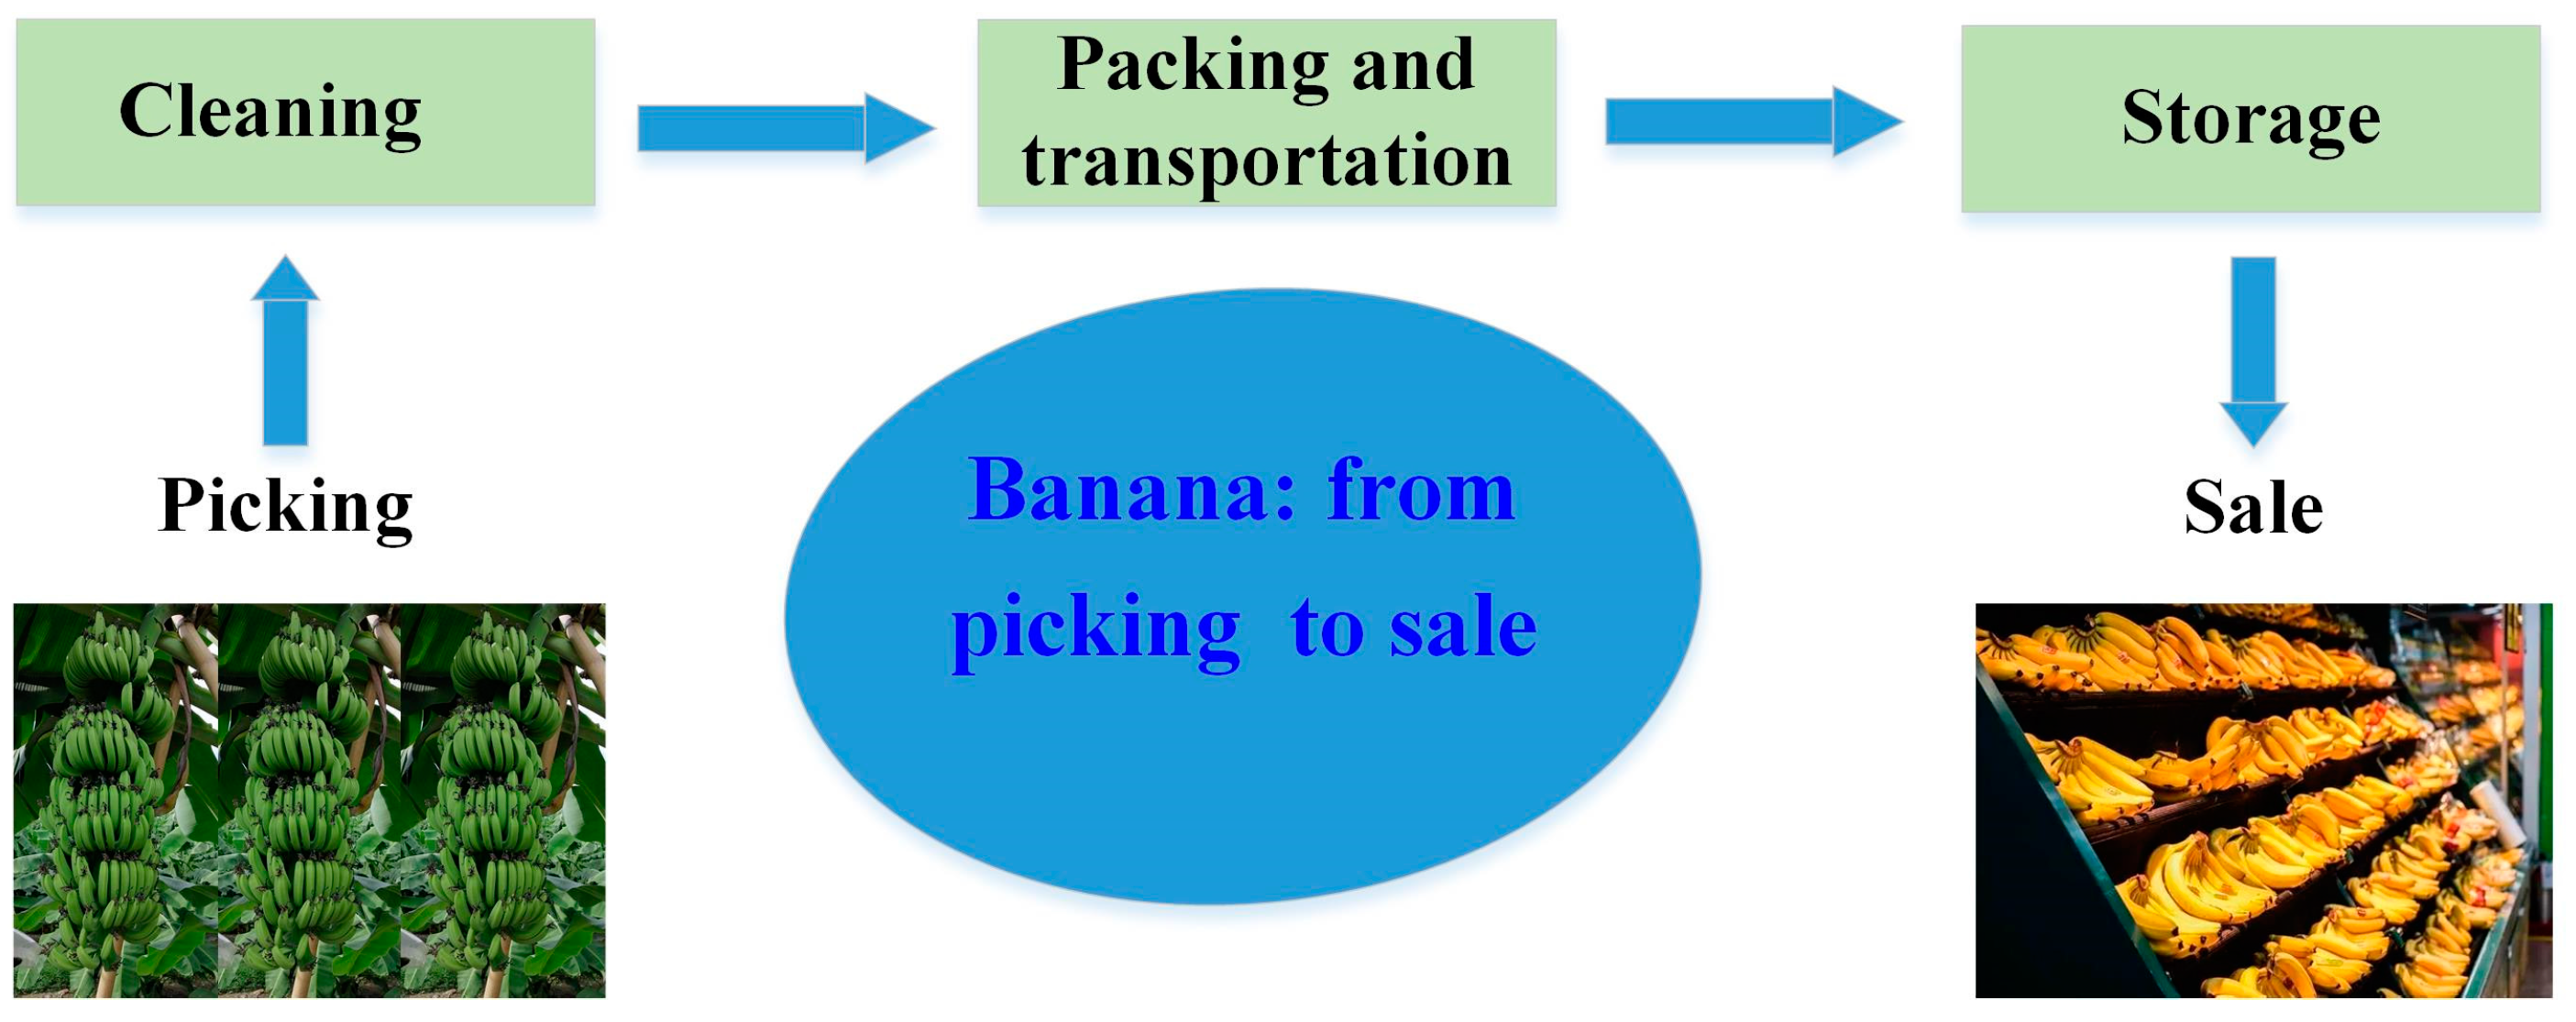
2. Materials and Methods

2.1. Dataset Acquisition

The banana variety used in this experiment is alpine banana from Guangdong Province. As the storage time increases, bananas gradually become mature, and the peel color changes. Freshly picked bananas without any bruises or defects were stored in a laboratory environment, at 26 ± 3 °C and 50 ± 5% relative humidity. Under natural light, the banana images were captured using a camera with black cards as the background. Banana image collection work started from the first day of storage until the bananas showed a large number of black spots and rotted. The entire image collection process lasted for 15 days, with 40 high-quality images selected from the 100 collected per day, totaling 600 photos, saved in a JPG file format. According to the classification standards, the 600 samples were divided into 1~7 grades on the basis of ripeness. Based on the general market sales laws, the grade classification can be simplified to 3 grades. Grades 1~4 were classified as the storage stage, grades 5~6 were classified as the sales stage, and grade 7 was classified as the price reduction stage [26]. Examples of three different banana ripeness images are shown in Figure 2.

2.2. Hardware and Software Tools

The experimental hardware environment contains 16 GB RAM, an NVIDIA GeForce RTX3090Ti (Taiwan, China) graphics card, and an (Taiwan, China).
The research software is the Windows 10 operating system. Before creating Anaconda, the Python 3.8 programming language was installed and CUDA11.6 was selected as the programming platform. Anaconda is convenient for managing the Python environment of different projects and solving the problem of environment conflicts in Python packages of different projects. After the Anaconda environment was created, the Anaconda Prompt command line was used to activate the environment. After that, the necessary packages were installed. After completing the environment installation, training tasks were implemented in the system.

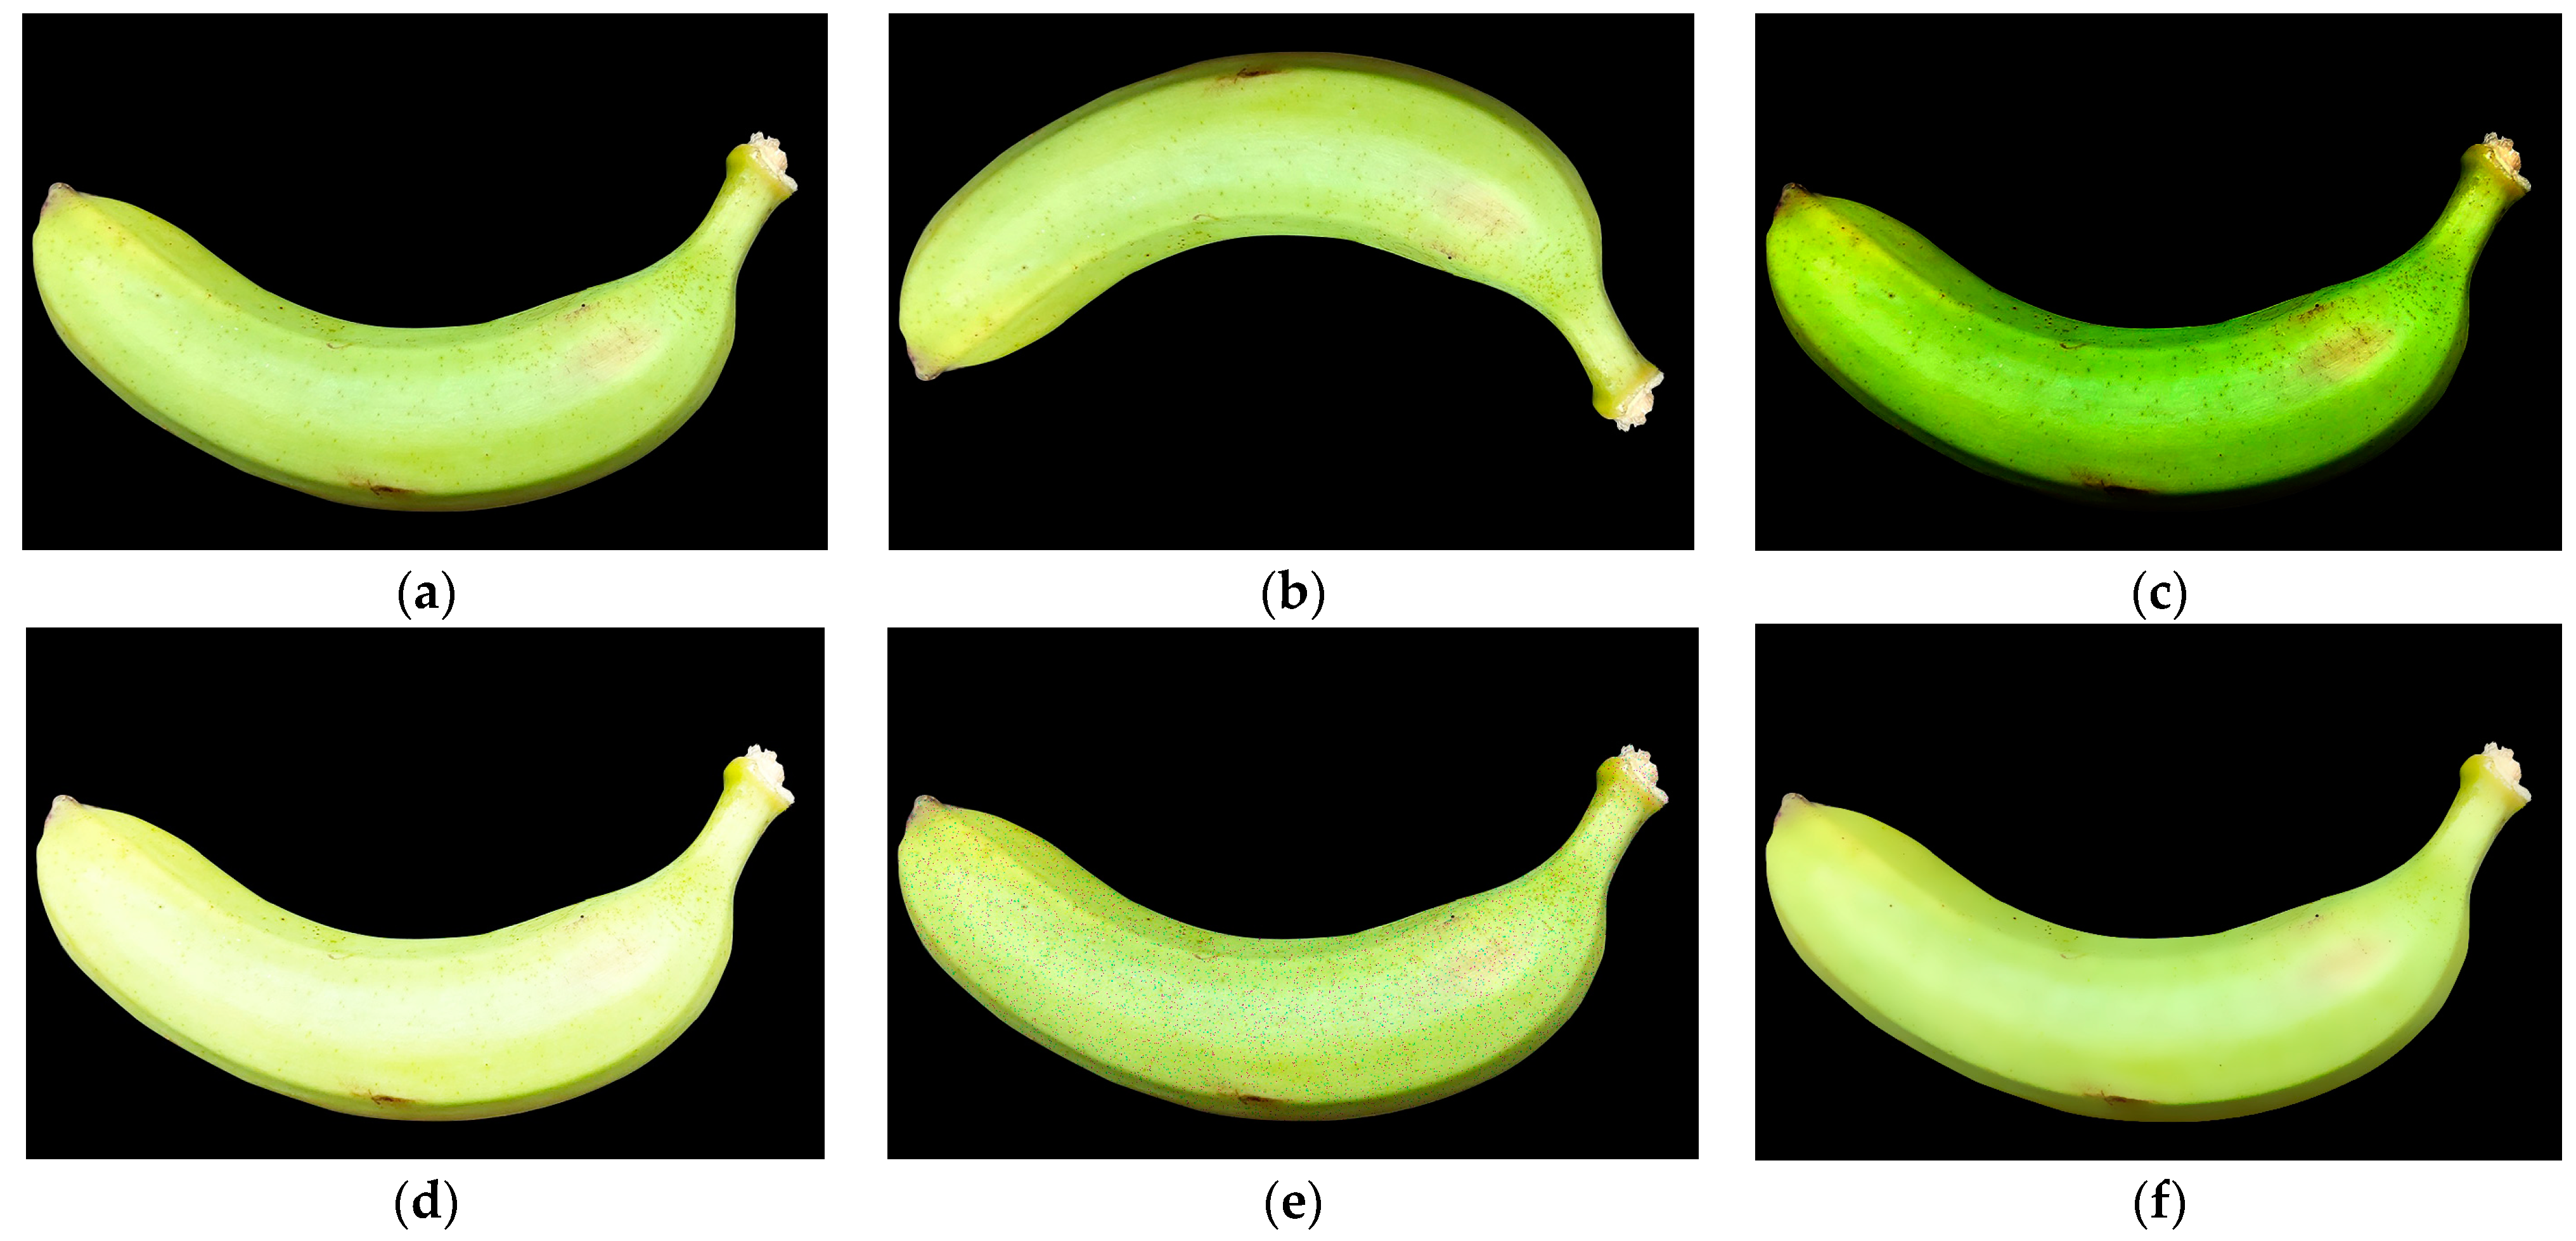
2.3. Data Augmentation

A total of 480 banana photos were used as the training set, and the remaining 120 photos were used as the test set. Data augmentation is a method for increasing image numbers in a training dataset through various techniques. In a previous study, three types of data augmentation, named image rotation, gamma correction, and noise rejection, were applied to the dataset. It indicates that a dataset with augmentation can reach a higher accuracy [31]. A larger dataset improves the learning algorithm performance and prevents overfitting [32,33]. In order to make up for the shortcoming of insufficient dataset samples and to improve the model generalization ability, the data augmentation method was used. Common data augmentation methods include geometric transformations, operation intensification, noise injection, and filtering. Geometric transformation is the process of scaling, rotating (Figure 3b), and performing other operations on an image. Operation intensification is used to change the image’s pixel values, modifying the brightness (Figure 3c,d) of the image. Noise injection is also a popular data augmentation method aimed at improving the model’s generalizability in unstable and fuzzy environments, such as by randomly adding pretzel or noise (Figure 3e). Under filtering augmentation, images can be sharpened or blurred (Figure 3f), making it easier to extract important information. Using the data augmentation technique, the size of the augmented dataset was 2520 photos, as summarized in Table 1. Data augmentation effects are shown in Figure 3.

2.4. Classification with CNN and Transfer Learning

With the rapid development of computer technology, deep learning has attracted significant attention in machine learning, due to the ability to process various complex data. In several deep learning methods, CNN becomes one of the most important algorithms, possessing unique advantages in the image recognition field [34,35]. Compared with traditional machine learning, target features can be extracted automatically by CNN [36]. For a new CNN model, millions of labeled images are acquired in training to achieve a high prediction performance, and it is usually challenging to obtain a large dataset. In order to overcome CNN’s shortcomings, more researchers pay attention to the development of transfer learning. Transfer learning is a method that aims to find a model that is suitable for a new given dataset, with the weights and parameters from a trained model in a large dataset. The model is used again to solve other similar problems after modifying the parameters of the original dataset model. During the process of collecting different banana ripeness photos, thousands of images are difficult to obtain and process for a standard dataset. Deep CNNs using transfer learning have been shown to be effective in related fields [37]. In the training process, four CNN models (ResNet 34, ResNet 101, VGG 16, and VGG 19) that were pretrained on the ImageNet dataset [38] were analyzed, as they have been used in many fruits’ ripeness classification.
Figure 4 shows the principle of using the ResNet 34 model with the transfer learning method. First, the ResNet 34 model is loaded with pretrained weights and parameters. The classifier of the original ResNet 34 model in ImageNet classifications is a 1000 class task. Then, a new layer is created to replace the original fully connected layer (FC) according to the grades of our banana ripeness dataset, and the output is three classes. Due to insufficient training data, not all transfer parameters are involved in fine tuning, and the parameters of the coevolution layer are frozen. The fine-tuned ResNet 34 model was used to train the target dataset, which can greatly reduce training time and computing resources. The method was applied to the four models, and their training performance will be compared.

2.5. Experiment Parameters Setting

The hyperparameters are crucial in the optimization process of the model and directly affect the overall model working performance. In this study, the training sample batch size was set to 16, the optimization algorithm was SGD, and cross-entropy was chosen as the loss function. To explore the influence of different learning rates (LR) on model optimization, the learning rates are set to different initial fixed values (LR = 1 × 10⁻², LR = 1 × 10⁻³, LR = 1 × 10⁻⁴) and different learning rate updating strategies. The number of iterations (Epoch) was set to 300, obtaining the model convergence at each learning rate, and the different learning updating strategies are shown in Figure 5.
LambdaLR: The stride is set to 1, and the gamma is set to 0.98, meaning that learning rate changes every epoch by 0.98 times the previous one.
StepLR: The stride is set to 12, and the gamma is set to 0.8.
MultiStepLR: During the training cycle, when the training epoch reaches the set value (10, 60, 110, 160, 210, 260), each group’s learning rate is 0.5 times the previous group’s learning rate.

3. Results

3.1. Training Results

In the experiment, the effects of different fixed learning rates and learning rate updating strategies on fine-tuned model were investigated using the training process. In order to ensure that the experiment results were comparable, all learning rate effects were tested under the ResNet 34 model, and other hyperparameters were the same, including batch size, optimization algorithm, and cross-entropy. Figure 6 illustrates the average accuracy comparison and loss value curve of training at different fixed learning rates, LR = 1 × 10⁻², 1 × 10⁻³, 1 × 10⁻⁴. In Figure 6a, at the training beginning epochs, the average accuracy value increases from 95.8% to 98.2% with an increase to 20 epochs (LR 1 × 10⁻²), 89.7% to 98.0% within 20 epochs (LR 1 × 10⁻³), and 59% to 97.3% within 70 epochs (LR 1 × 10⁻⁴). In Figure 6b, the learning rate shows a different effect on convergence performance; it starts to converge at epoch 8 under LR = 1 × 10⁻², at epoch 20 under LR = 1 × 10⁻³, and at epoch 100 under LR= 1 × 10⁻⁴. Convergence to a relatively stable value of 0.02 occurs when reaching 100 epochs under LR = 1 × 10⁻²; however, it does not converge to a value at epoch 300 under LR = 1 × 10⁻³ and LR = 1 × 10⁻⁴. A faster convergence rate was obtained under LR = 1 × 10⁻², with the highest accuracy of 98.2% and the lowest training loss value of 0.02. When the learning rate is lower than a small value, the model converges slowly with a lower accuracy. In the loss curve figure, the model with a low value does not converge at the end of training process, and strong fluctuations appear [39].
A fixed learning rate is commonly used under traditional SGD optimizers. The algorithm takes a long time to converge under a slow learning rate which may also cause the model training to fall into a local minimum value, preventing the model parameters from updating and reducing the model training accuracy. A faster learning rate will speed up the training progress, but it tends to miss the optimal solution of model during the training process, resulting in a sharp learning curve fluctuation [40,41]. In order to obtain the best learning rate optimization effect during training, learning rate updating strategies are used for the pretrained ResNet 34 model. Figure 7 shows the comparison of average training accuracy and loss value curve under learning rate updating strategies. As shown in Figure 7a, the training average accuracy increases from 78.2% to 97.5% (StepLR), from 92.9% to 98.8% (MultiStepLR), and from 96.0% to 98.5% (LambdaLR). In Figure 7b, the loss value of three learning rate updating strategies fluctuates strongly during the beginning training epochs. It starts to converge under the MultiStepLR approach at epoch 10, the LambdaLR approach at epoch 20, and the StepLR approach at epoch 29. It can be seen that MultiStepLR has excellent performance in both average training accuracy and loss value curve. It has a faster convergence rate and higher accuracy compared to the other two strategies. Furthermore, the highest accuracy reaches 98.8%, which is higher than all performance values under the fixed learning rate.
In order to obtain the best model for the banana ripeness dataset, four well-known models were trained based on transfer learning, including ResNet 34, ResNet 101, VGG 16, and VGG 19. Meanwhile, the hyperparameters were set to the same values, making the experimental data more comparable. The MultiStepLR updating strategy with the best performance model was selected. Figure 8 shows the comparison of average training accuracy and loss value curve with four different models. In Figure 8a, ResNet 34 and ResNet 101 achieve a high accuracy at the beginning of training and increase from 97.5% to 98.8% and from 98% to 99.2%, respectively. VGG 16 and VGG 19 increase from 46.2% to 94.8% and from 67.5% to 95.0%, and a sharp fluctuation appears. In Figure 8b, ResNet models converge within 30 epochs, and VGG models converge within 100 epochs. The results show that the four models can converge within 300 training cycles, and the model convergence speed, average accuracy, and loss value are different. The two ResNet models’ average accuracies are higher than the VGG models with quicker convergence speeds, lower loss values, and stability from the beginning of training. The accuracy of ResNet 101 is higher than that of ResNet 34 due to the deeper convolutional layers [42].

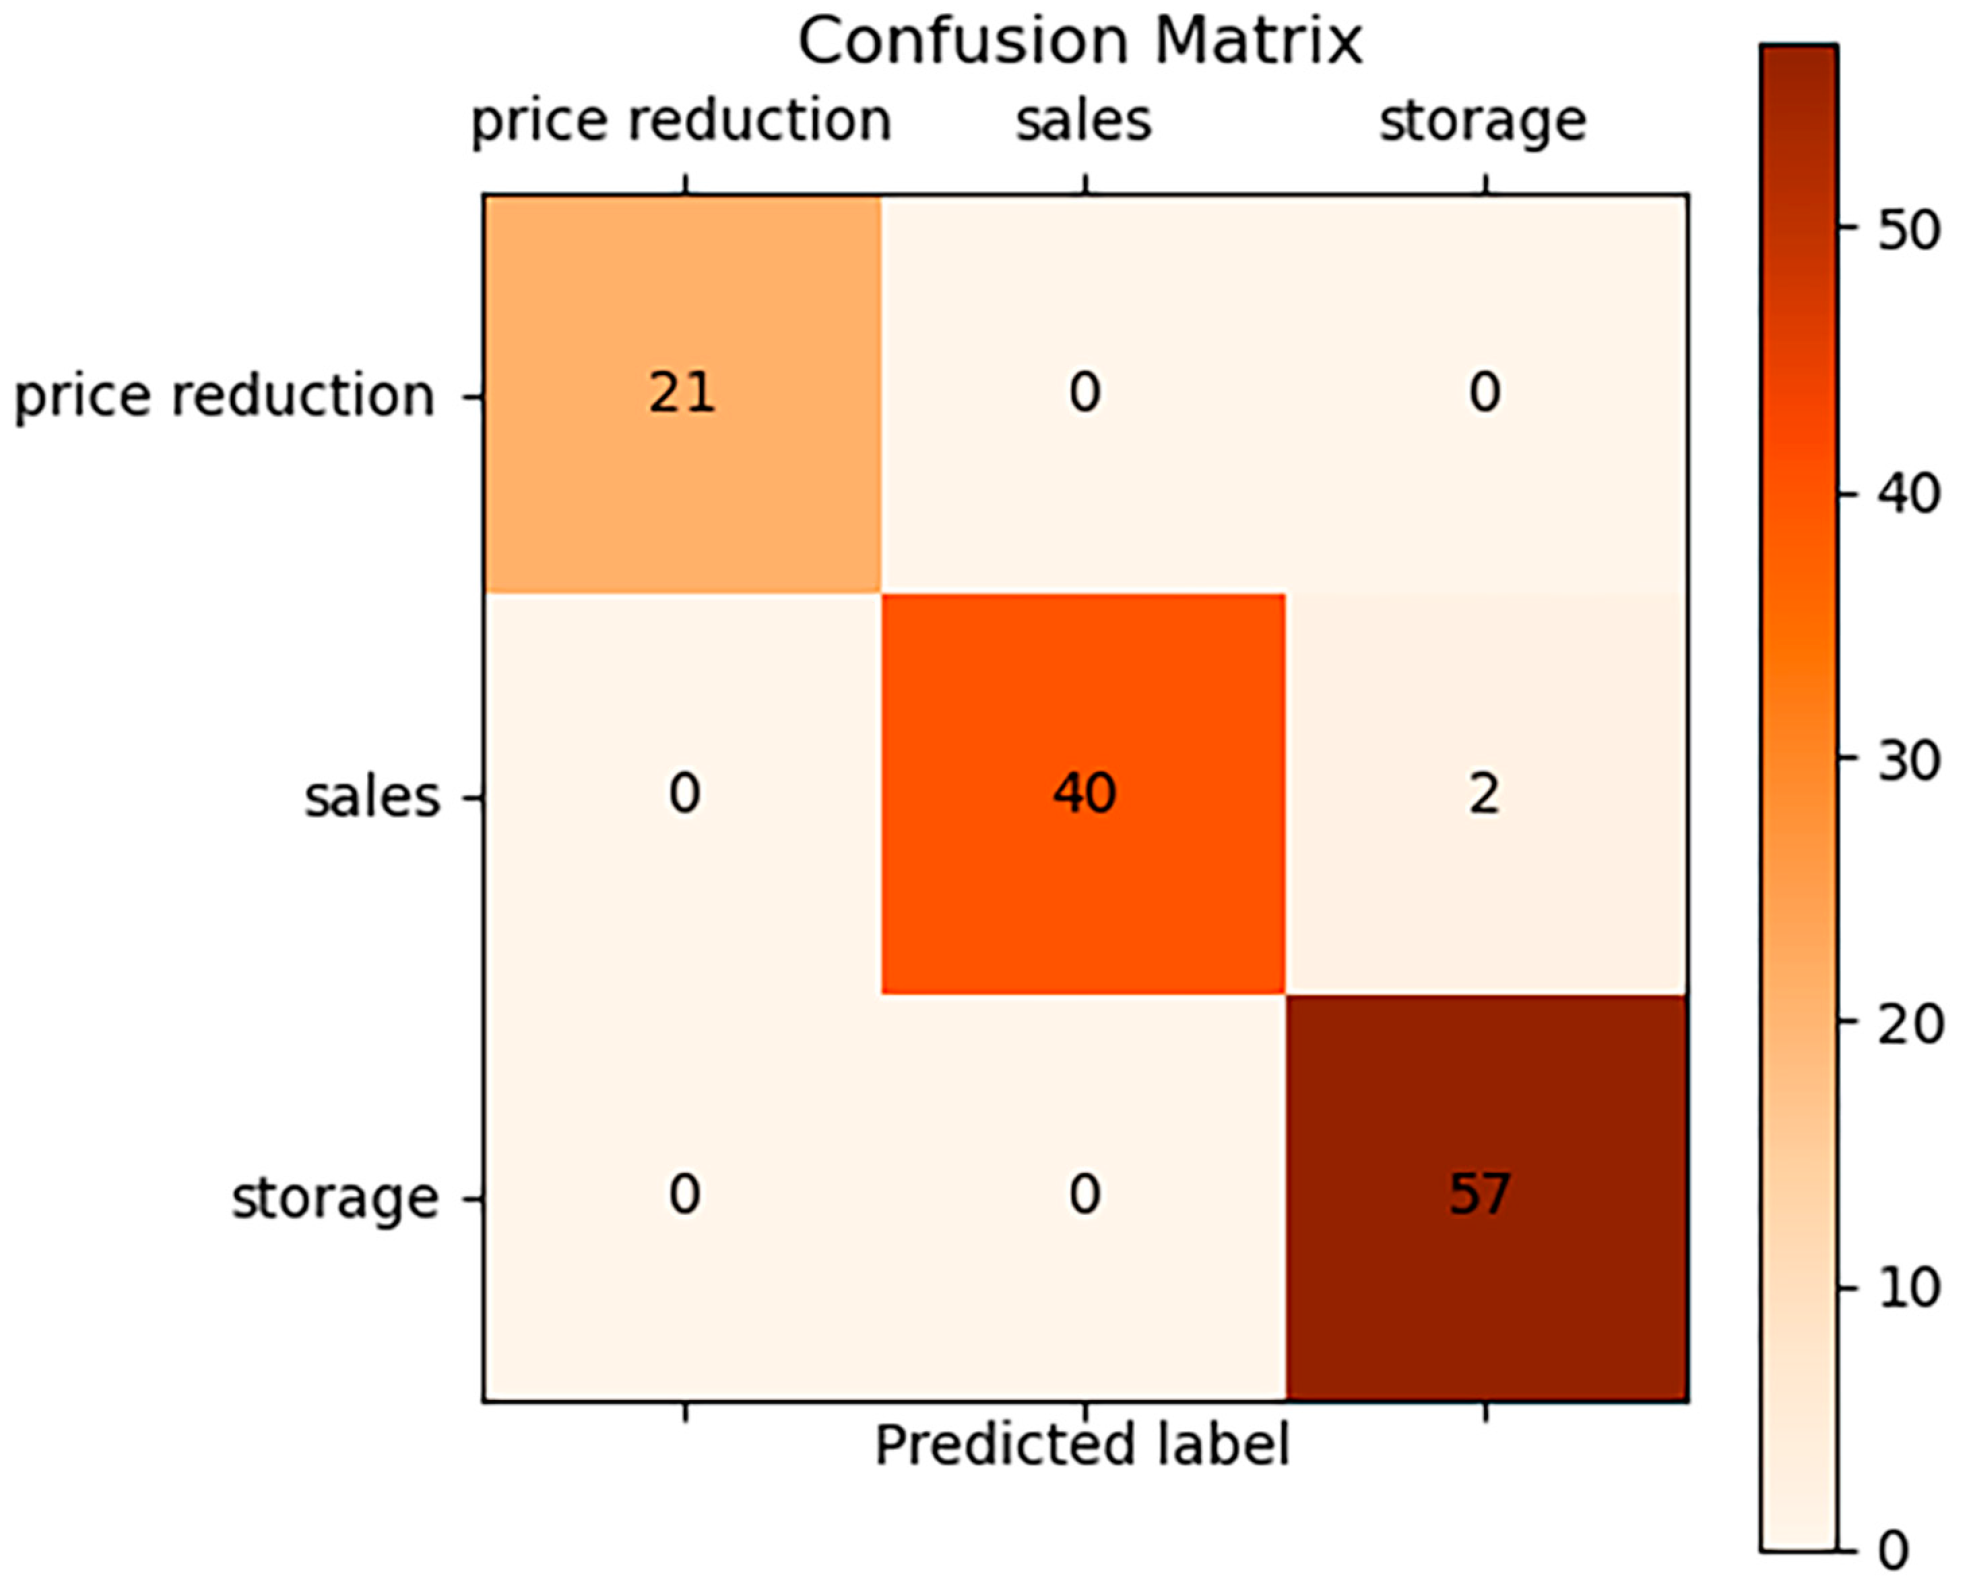
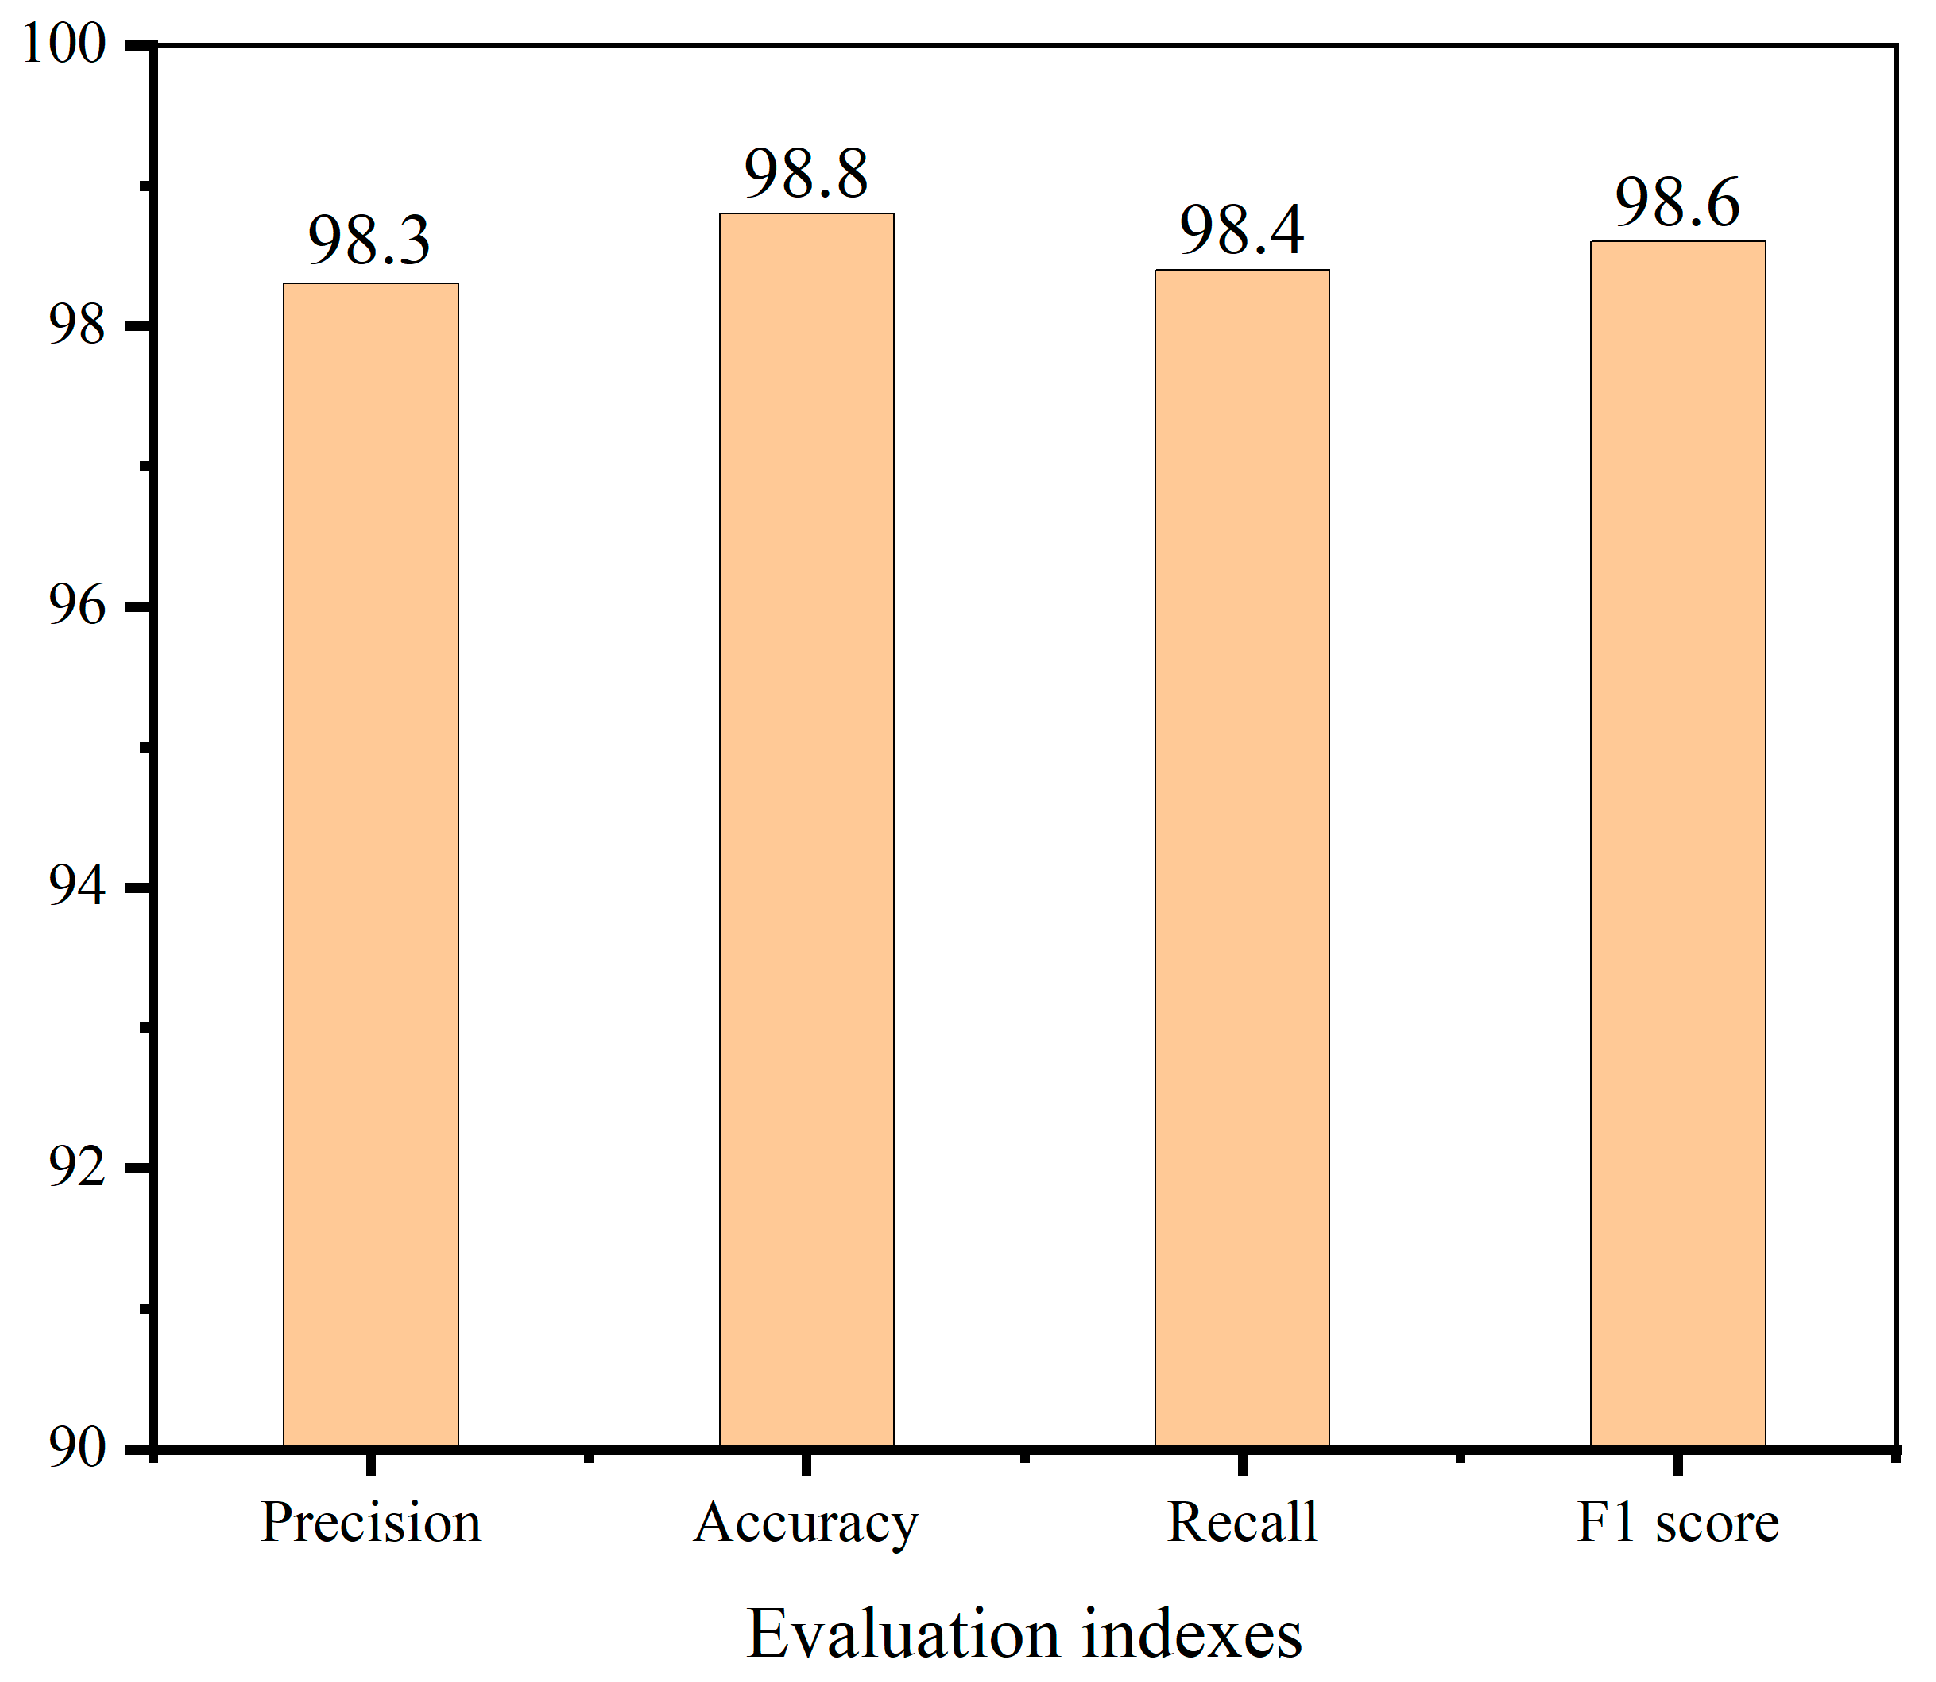
3.2. Model Evaluation

Several CNN models were fine tuned via transfer learning, and the performance results in the training set were compared in Section 3. The results show that the ResNet 101 model had the best performance in training, and the best learning rate for fine-tuned model optimization was the MultiStepLR method. During the whole training process, the weights and parameters of each epoch were automatically recorded, and the best one was used to test 120 sample images in the test set. In this section, the fine-tuned ResNet 101 model is evaluated using different metrics with the MultiStepLR learning rate updating strategy to determine the best weights and parameters.
In detection algorithms, model evaluation metrics are the key to reflecting the model’s prediction results. They objectively evaluate the accuracy and completeness of training models, providing feedback for algorithm optimization and improvement. The most widely used model evaluation metrics are the confusion matrix, accuracy, precision, recall, and F1 score. The confusion matrix, known as the likelihood table or error matrix, is essentially a statistical matrix of classification, and it is one of the important metrics for evaluating a model’s performance. It evaluates the validity of model identification and provides a visual distribution of each correct and incorrect sample [43]. It shows which category is easy to be confused when predicting a photo’s label. Based on the model testing results, the classification confusion matrix was plotted, as shown in Figure 9. The rows represent the actual categories of price reduction, sales, and storage, while the columns represent the predicted values of these three labels. The diagonal of the matrix represents cases where the predicted category is consistent with the true category, that is, the number of correctly predicted categories. The non-diagonal area represents the number of prediction errors. The confusion matrix shows that the fine-tuned ResNet 101 model incorrectly predicted only two samples of the sale period as the storage period in the test set. This may be due to the fact that some of the photo samples are extremely similar in these two categories, leading to the wrong prediction.
Based on the combination of true label and detected label by the model, samples can be classified into four categories, including true positive (TP), true negative (TN), false positive (FP), and false negative (FN). The ResNet 101 model prediction results were evaluated by Equations (1)–(4) using the statistical detection of correct and incorrect predictions. Accuracy represents the proportion of correctly classified banana image samples compared to the total number of samples. Precision means the data predicted as positive are correctly predicted, and the false positive rate is relatively small. It is used to evaluate the classifier accuracy based on successful detection. Recall represents the proportion of correct predictions from all the positive data, and it is used to evaluate the classifier performance on all tested data. F1 score is the harmonic mean of accuracy and recall, representing the stability of the classification model.
As shown in Figure 10, the fine-tuned ResNet 101 performs well with average accuracy and other evaluation metrics reaching more than 98%.
Accuracy = T P + T N T P + T N + F P + F N  
Precision = T P T P + F P  
Recall = T P T P + F N  
F 1   score = 2 × P r e c i s i o n × R e c a l l P r e c i s o n + R e c a l l

4. Discussion

In this work, four pretrained CNN models, including ResNet 34, ResNet 101, VGG 16 and VGG 19, employing transfer learning methods were applied to the banana dataset, and the work realized the classification of different banana ripeness levels. Based on the experimental results, learning rates including the size of the initial learning rate and different learning rate updating strategy directly affect the convergence state of the model. In Figure 6, the smaller initial learning rate usually has a slower convergence speed both in accuracy and training loss. As seen in Figure 7, the ResNet 34 model with MultiStepLR has better performance than the other learning rates, and it achieved the highest accuracy of 98.8%. When the learning rate is set as a low value, the model performs poorly both in accuracy and loss curves. In Figure 8, among four pretrained models, the results from the same types of models show little difference, and the ResNet model produces a more successful classification compared with the VGG model. The weights of the best training performance were used in the test set, and then the trained model was evaluated by four indexes, precision, accuracy, recall, and F1 score. Based on Figure 9 and Figure 10, the trained model only misclassified two sales-stage bananas as storage-stage bananas and achieved more than 98% in the other evaluation metrics.
From the experimental test results, it has been shown that pretrained model and transfer learning methods can be employed successfully in banana ripeness recognition. The proposed method is also compared with existing studies in the field of banana ripeness recognition, which is significant in banana ripeness classification. As shown in Table 2, related work has not been widely concerned with this topic, and previous studies focused on traditional feature extraction and artificial neural networks (ANN). These studies have achieved banana ripeness multi classifications with a small amount data; however, several drawbacks still existed. Referring to Mazen and Nashat [28], the banana dataset is used for image preprocessing before training and testing first, converting RGB banana images to HSV and morphological filtering. Then, banana images are segmented from complex backgrounds. In addition, it is necessary to extract the texture and color features of bananas and calculate the ripeness coefficient. This method represents the main work of most ANNs in classification tasks, and it is time consuming and cumbersome [23,44,45]. Traditional machine learning, such as SVM [46], requires large amounts of preprocessing and the manual extraction of the features of a banana peel. Zhang et al. [47] used a CNN architecture to classify bananas into seven maturity levels, using the 17,312 banana images, achieving an accuracy of 95.6%. This study only used a single CNN model, and the dataset is quite large. Ramadhan et al. [48] trained the VGG 16 model using two optimizers, SGD and Adam, and achieved an accuracy of 94.12% on the training set, while the accuracy on the test set was only 71.95%. Zhu and Spachos [49] applied the YOLOV3 model to identify banana maturity based on the number of surface black spots but only considered two maturity levels, semi-ripened and well-ripened, achieving a recognition accuracy of 90.16%. Chuquimarca et al. [50] constructed a virtual banana dataset and a small number of real datasets, using a simplified CNN model to identify banana maturity, achieving a recognition accuracy of 91.7%. Overall, previous studies using CNN models required a large dataset or could only achieve lower recognition accuracy. The proposed approach achieved a high accuracy of 99.2% with a small dataset of three different ripeness stages. This classification method is based on the bananas’ sales law in the market, which is different from the previous direct classification according to the peel color. This grading method provides a reference for the automatic grading of bananas in sales, allowing grocers to control waste and reduce the economic loss caused by overripening.

5. Conclusions

In this paper, CNN combined with the transfer learning method was applied to banana ripeness identification. This method solves the drawbacks in traditional machine learning and CNN models in banana ripeness recognition. Experimental results show that the learning rate has a huge impact on the model optimization using a fine-tuned model, and the models with different learning rates show great differences in the training process. Among four models, training results show that the adaptability of different models to the same banana dataset is different. A banana dataset was established, and this dataset was augmented using different methods, to compensate for the insufficient data. Comparing different learning rates, the results show that the learning rate updating strategy is more stable with less fluctuation in the loss value compared to the fixed learning rate. MultiStepLR optimized the model the best during training and achieved 98.7% accuracy. The comparison of different model training results shows that the ResNet model is more suitable for the banana dataset in this experiment, and it achieves higher accuracy and lower loss in the training curve. Finally, the weights and parameters of the ResNet 101 model with the highest accuracy in the training were saved and tested against 120 samples in the test set. Then, the model was evaluated by some evaluation metrics, and it had excellent performance. This study shows that the method based on CNN and transfer learning can identify different banana ripeness levels efficiently, which enriches the existing identification methods. Based on the results on the banana maturity recognition model developed in this study, the model can be deployed to the automated sorting system of the industry line. The model is beneficial to improve the efficiency and accuracy of banana pre-sale grading, reduce quality and economic losses, and provide consumers with high-quality banana products.

Author Contributions

L.Y.: conceptualization, resources, supervision, project administration, and funding acquisition. B.C.: conceptualization, methodology, software, formal analysis, investigation, and writing—original draft. J.W.: software and validation. X.X.: software and validation. Y.L.: software and validation. Q.P.: methodology. Y.Z.: formal analysis and writing—review and editing. All authors have read and agreed to the published version of the manuscript.

Funding

This study is mainly funded by the Science and technology research project of Hubei Grain Bureau (2023HBLSKJ005), the Youth Project of the Natural Science Foundation of Hubei Province (No. 2022CFB944), the Science and Technology Research Project of the Hubei Provincial Education Department (No. Q20211609), the Hubei Provincial grain bureau project (2023HBLSKJ004), and the Key R&D plan of Hubei Province (No. 2022BBA0047). Part of this research is supported by Jiangsu Key Laboratory of Advanced Food Manufacturing Equipment & Technology (FM-202103) and the Science Foundation of Wuhan Polytechnic University (No. 2019RZ08, 2020J06).

Data Availability Statement

The datasets generated and analyzed during the present study are available from the corresponding author upon reasonable request.

Acknowledgments

We extend our thanks for the support of the Hubei Cereals and Oils Machinery Engineering Technology Research Center at Wuhan Polytechnic University.

Conflicts of Interest

The authors declare no conflicts of interest.

References

  1. Ashokkumar, K.; Elayabalan, S.; Shobana, V.G.; Sivakumar, P.; Pandiyan, M. Nutritional value of cultivars of Banana (Musa spp.) and its future prospects. J. Pharmacogn. Phytochem. 2018, 7, 2972–2977. [Google Scholar] [CrossRef]
  2. Bebber, D.P. The long road to a sustainable banana trade. Plants People Planet 2023, 5, 662–671. [Google Scholar] [CrossRef]
  3. Ni, J.; Gao, J.; Deng, L.; Han, Z. Monitoring the change process of banana freshness by GoogLeNet. IEEE Access 2020, 8, 228369–228376. [Google Scholar] [CrossRef]
  4. Singh, B.; Singh, J.P.; Kaur, A.; Singh, N. Bioactive compounds in banana and their associated health benefits—A review. Food Chem. 2016, 206, 1–11. [Google Scholar] [CrossRef] [PubMed]
  5. Takougnadi, E.; Boroze, T.E.T.; Azouma, O.Y. Effects of drying conditions on energy consumption and the nutritional and organoleptic quality of dried bananas. J. Food Eng. 2020, 268, 109747–109757. [Google Scholar] [CrossRef]
  6. Guo, J.; Duan, J.; Yang, Z.; Karkee, M. De-Handing Technologies for Banana Postharvest Operations—Updates and Challenges. Agriculture 2022, 12, 1821. [Google Scholar] [CrossRef]
  7. Campuzano, A.; Rosell, C.M.; Cornejo, F. Physicochemical and nutritional characteristics of banana flour during ripening. Food Chem. 2018, 256, 11–17. [Google Scholar] [CrossRef] [PubMed]
  8. Sanaeifar, A.; Bakhshipour, A.; De La Guardia, M. Prediction of banana quality indices from color features using support vector regression. Talanta 2016, 148, 54–61. [Google Scholar] [CrossRef] [PubMed]
  9. Santoyo-Mora, M.; Sancen-Plaza, A.; Espinosa-Calderon, A.; Barranco-Gutierrez, A.I.; Prado-Olivarez, J. Nondestructive quantification of the ripening process in banana (Musa AAB Simmonds) using multispectral imaging. J. Sens. 2019, 44, 6901–6910. [Google Scholar] [CrossRef]
  10. Watharkar, R.B.; Chakraborty, S.; Srivastav, P.P.; Srivastava, B. Physicochemical and mechanical properties during storage-cum maturity stages of raw harvested wild banana (Musa balbisiana, BB). J. Food Meas. Charact. 2021, 15, 3336–3349. [Google Scholar] [CrossRef]
  11. Hernández-Sánchez, N.; Moreda, G.P.; Herre-ro-Langreo, A.; Melado-Herreros, Á. Assessment of internal and external quality of fruits and vegetables. In Imaging Technologies and Data Processing for Food Engineers; Springer: Berlin/Heidelberg, Germany, 2016; pp. 269–309. [Google Scholar]
  12. Bhargava, A.; Bansal, A. Fruits and vegetables quality evaluation using computer vision: A review. J. King Saud Univ. Comput. Inf. Sci. 2021, 33, 243–257. [Google Scholar] [CrossRef]
  13. Wang, Z.; Ling, Y.; Wang, X.; Meng, D.; Nie, L.; An, G.; Wang, X. An improved Faster R-CNN model for multi-object tomato maturity detection in complex scenarios. Ecol. Inform. 2022, 72, 101886–101895. [Google Scholar] [CrossRef]
  14. Zhuang, F.; Qi, Z.; Duan, K.; Xi, D.; Zhu, Y.; Zhu, H.; He, Q. A comprehensive survey on transfer learning. Proc. IEEE 2020, 109, 43–76. [Google Scholar] [CrossRef]
  15. Lu, J.; Behbood, V.; Hao, P.; Zuo, H.; Xue, S.; Zhang, G. Transfer learning using computational intelligence: A survey. Knowl. Based Syst. 2015, 80, 14–23. [Google Scholar] [CrossRef]
  16. Mishra, N.K.; Dutta, M.; Singh, S.K. Multiscale parallel deep CNN (mpdCNN) architecture for the real low-resolution face recognition for surveillance. Image Vis. Comput. 2021, 115, 104290–104305. [Google Scholar] [CrossRef]
  17. Nanni, L.; Maguolo, G.; Paci, M. Data augmentation approaches for improving animal audio classification. Ecol. Inform. 2020, 57, 101084–101094. [Google Scholar] [CrossRef]
  18. Ulloa, C.C.; Krus, A.; Barrientos, A.; del Cerro, J.; Valero, C. Robotic fertilization in strip cropping using a CNN vegetables detection-characterization method. Comput. Electron. Agric. 2022, 193, 106684–106695. [Google Scholar] [CrossRef]
  19. Jiang, Z.; Dong, Z.; Jiang, W.; Yang, Y. Recognition of rice leaf diseases and wheat leaf diseases based on multi-task deep transfer learning. Comput. Electron. Agric. 2021, 186, 106184–106195. [Google Scholar] [CrossRef]
  20. Mahmood, A.; Singh, S.K.; Tiwari, A.K. Pre-trained deep learning-based classification of jujube fruits according to their maturity level. Neural Comput. Appl. 2022, 34, 13925–13935. [Google Scholar] [CrossRef]
  21. Buyukarikan, B.; Ulker, E. Classification of physiological disorders in apples fruit using a hybrid model based on convolutional neural network and machine learning methods. Neural Comput. Appl. 2022, 34, 16973–16988. [Google Scholar] [CrossRef]
  22. Begum, N.; Hazarika, M.K. Maturity detection of tomatoes using transfer learning. Meas. Food 2022, 7, 100038. [Google Scholar] [CrossRef]
  23. Momeny, M.; Jahanbakhshi, A.; Neshat, A.A.; Hadipour-Rokni, R.; Zhang, Y.D.; Ampatzidis, Y. Detection of citrus black spot disease and ripeness level in orange fruit using learning-to-augment incorporated deep networks. Ecol. Inform. 2022, 71, 101829–101839. [Google Scholar] [CrossRef]
  24. Verma, P.; Tripathi, V.; Pant, B. Comparison of different optimizers implemented on the deep learning architectures for COVID-19 classification. Mater. Today Proc. 2021, 46, 11098–11102. [Google Scholar] [CrossRef]
  25. Hsieh, K.W.; Huang, B.Y.; Hsiao, K.Z.; Tuan, Y.H.; Shih, F.P.; Hsieh, L.C.; Yang, I.C. Fruit maturity and location identification of beef tomato using R-CNN and binocular imaging technology. J. Food Meas. Charact. 2021, 15, 5170–5180. [Google Scholar] [CrossRef]
  26. Mendoza, F.; Aguilera, J.M. Application of image analysis for classification of ripening bananas. J. Food Sci. 2004, 69, 471–477. [Google Scholar] [CrossRef]
  27. Surya Prabha, D.; Satheesh Kumar, J. Assessment of banana fruit maturity by image processing technique. J. Food Sci. Technol. 2015, 52, 1316–1327. [Google Scholar] [CrossRef] [PubMed]
  28. Mazen, F.M.; Nashat, A.A. Ripeness classification of bananas using an artificial neural network. Arab. J. Sci. Eng. 2019, 44, 6901–6910. [Google Scholar] [CrossRef]
  29. Pardede, J.; Sitohang, B.; Akbar, S.; Khodra, M.L. Implementation of transfer learning using VGG16 on fruit ripeness detection. Int. J. Intell. Syst. Appl. 2021, 13, 52–61. [Google Scholar] [CrossRef]
  30. Gulzar, Y. Fruit image classification model based on MobileNetV2 with deep transfer learning technique. Sustainability 2023, 15, 1906. [Google Scholar] [CrossRef]
  31. Alomar, K.; Aysel, H.I.; Cai, X. Data augmentation in classification and segmentation: A survey and new strategies. J. Imaging 2023, 9, 46. [Google Scholar] [CrossRef]
  32. Paymode, A.S.; Malode, V.B. Transfer learning for multi-crop leaf disease image classification using convolutional neural network VGG. Artif. Intell. Agric. 2022, 6, 23–33. [Google Scholar] [CrossRef]
  33. Akbarimajd, A.; Hoertel, N.; Hussain, M.A.; Neshat, A.A.; Marhamati, M.; Bakhtoor, M.; Momeny, M. Learning-to-augment incorporated noise-robust deep CNN for detection of COVID-19 in noisy X-ray images. J. Comput. Sci. 2022, 63, 101763–101777. [Google Scholar] [CrossRef] [PubMed]
  34. Chen, L.; Li, S.; Bai, Q.; Yang, J.; Jiang, S.; Miao, Y. Review of image classification algorithms based on convolutional neural networks. Remote Sens. 2021, 13, 4712. [Google Scholar] [CrossRef]
  35. Fang, Z.; Wang, Y.; Peng, L.; Hong, H. Integration of convolutional neural network and conventional machine learning classifiers for landslide susceptibility mapping. Comput. Geosci. 2020, 139, 104470–104482. [Google Scholar] [CrossRef]
  36. Wu, J.; Chen, X.Y.; Zhang, H.; Xiong, L.D.; Lei, H.; Deng, S.H. Hyperparameter optimization for machine learning models based on Bayesian optimization. J. Electron. Sci. Technol. 2019, 17, 26–40. [Google Scholar]
  37. Han, D.; Liu, Q.; Fan, W. A new image classification method using CNN transfer learning and web data augmentation. Expert Syst. Appl. 2018, 95, 43–56. [Google Scholar] [CrossRef]
  38. Russakovsky, O.; Deng, J.; Su, H.; Krause, J.; Satheesh, S.; Ma, S.; Fei, L. Imagenet large scale visual recognition challenge. Int. J. Comput. Vis. 2015, 115, 211–252. [Google Scholar] [CrossRef]
  39. Jiang, W.; Huang, K.; Geng, J.; Deng, X. Multi-scale metric learning for few-shot learning. IEEE Trans. Circuits Syst. Video Technol. 2020, 31, 1091–1102. [Google Scholar] [CrossRef]
  40. Dubey, S.R.; Chakraborty, S.; Roy, S.K.; Mukherjee, S.; Singh, S.K.; Chaudhuri, B.B. diffGrad: An optimization method for convolutional neural networks. IEEE Trans. Neural Netw. Learn. Syst. 2019, 31, 4500–4511. [Google Scholar] [CrossRef]
  41. Takase, T.; Oyama, S.; Kurihara, M. Effective neural network training with adaptive learning rate based on training loss. Neural Netw. 2018, 101, 68–78. [Google Scholar] [CrossRef]
  42. Vaishali, S.; Neetu, S. Enhanced copy-move forgery detection using deep convolutional neural network (DCNN) employing the ResNet-101 transfer learning model. Multimed. Tools Appl. 2023, 83, 10839–10863. [Google Scholar] [CrossRef]
  43. Ruuska, S.; Hämäläinen, W.; Kajava, S.; Mughal, M.; Matilainen, P.; Mononen, J. Evaluation of the confusion matrix method in the validation of an automated system for measuring feeding behaviour of cattle. Behav. Process. 2018, 148, 56–62. [Google Scholar] [CrossRef] [PubMed]
  44. Adebayo, S.E.; Hashim, N.; Abdan, K.; Hanafi, M.; Zude-Sasse, M. Prediction of banana quality attributes and ripeness classification using artificial neural network. In Proceedings of the III International Conference on Agricultural and Food Engineering, Kuala Lumpur, Malaysia, 23–25 August 2016. [Google Scholar]
  45. Larada, J.I.; Pojas, G.J.; Ferrer, L.V.V. Postharvest classification of banana (Musa acuminata) using tier-based machine learning. Postharvest Biol. Technol. 2018, 145, 93–100. [Google Scholar]
  46. Sabilla, I.A.; Wahyuni, C.S.; Fatichah, C.; Herumurti, D. Determining banana types and ripeness from image using machine learning methods. In Proceedings of the 2019 International Conference of Artificial Intelligence and Information Technology (ICAIIT), Yogyakarta, Indonesia, 13–15 March 2019. [Google Scholar]
  47. Zhang, Y.; Lian, J.; Fan, M.; Zheng, Y. Deep indicator for fine-grained classification of banana’s ripening stages. EURASIP J. Image Video Process. 2018, 2018, 46. [Google Scholar] [CrossRef]
  48. Ramadhan, Y.A.; Djamal, E.C.; Kasyidi, F.; Bon, A.T. Identification of cavendish banana maturity using convolutional neural networks. In Proceedings of the International Conference on Industrial Engineering and Operations Management, Dubai, United Arab Emirates, 10–12 March 2020; pp. 10–12. [Google Scholar]
  49. Zhu, L.; Spachos, P. Support vector machineand yolo for a mobile food grading system. Internet Things 2021, 13, 100359–100369. [Google Scholar] [CrossRef]
  50. Chuquimarca, L.E.; Vintimilla, B.X.; Velastin, S.A. Banana Ripeness Level Classification Using a Simple CNN Model Trained with Real and Synthetic Datasets. In Proceedings of the VISIGRAPP, Lisbon, Portugal, 19–21 February 2023; pp. 536–543. [Google Scholar]
Figure 1. General process from banana harvest to sale.
Processes 12 00799 g001
Figure 2. Different ripeness bananas’ images.
Processes 12 00799 g002
Figure 3. Different data augmentation effects: (a) original image, (b) rotation, (c) darkening, (d) brightening, (e) pretzel, and (f) blurring.
Processes 12 00799 g003
Figure 4. Schematic diagram of CNN and transfer learning method.
Processes 12 00799 g004
Figure 5. Learning rate updating strategies.
Processes 12 00799 g005
Figure 6. Accuracy and loss with different fixed initial learning rates: (a) accuracy value, (b) training loss.
Processes 12 00799 g006
Figure 7. Accuracy and loss with different learning rate updating strategies: (a) accuracy value, (b) training loss.
Processes 12 00799 g007
Figure 8. Accuracy and loss with different models: (a) accuracy value; (b) training loss.
Processes 12 00799 g008
Figure 9. Test result of confusion matrix.
Processes 12 00799 g009
Figure 10. Precision, accuracy, recall, and F1 score on test set.
Processes 12 00799 g010
Table 1. Banana dataset.
Banana RipenessTrain SetTest SetAugmentation Train Set
Storage16040800
Sale16040800
Price reduction16040800
Table 2. Comparison of proposed method with existing works.
ReferenceMethodsDataset SizeClassesAccuracy
[23]ANN300497.7%
[44]ANN270695.5%
[45]ANN1164494.2%
[46]SVM5193396.6%
[47]CNN17312795.6%
[48]CNN300494.12%
[49]YOLOV3150390.16%
[50]Simplified CNN3495491.7%
Proposed methodCNN and Transfer learning600399.2%
Disclaimer/Publisher’s Note: The statements, opinions and data contained in all publications are solely those of the individual author(s) and contributor(s) and not of MDPI and/or the editor(s). MDPI and/or the editor(s) disclaim responsibility for any injury to people or property resulting from any ideas, methods, instructions or products referred to in the content.

