Article

Diesel Adulteration Detection with a Machine Learning-Enhanced Laser Sensor Approach

College of Engineering and Technology, American University of the Middle East, Egaila 54200, Kuwait
*
Author to whom correspondence should be addressed.
Processes 2024, 12(4), 798; https://doi.org/10.3390/pr12040798
Submission received: 14 March 2024 / Revised: 8 April 2024 / Accepted: 9 April 2024 / Published: 16 April 2024
(This article belongs to the Special Issue Clean Combustion and Emission in Vehicle Power System, 2nd Edition)

Abstract

:
This paper introduces a novel and cost-effective method for detecting adulterated diesel, specifically targeting contamination with kerosene, by leveraging machine learning and the refractive index values of mixed diesel samples. It proposes a laser-based sensor, employing COMSOL simulations for synthetic data generation to facilitate machine learning training. This innovative approach not only streamlines the detection process by eliminating the need for expensive equipment and specialized personnel but also enables on-site testing without extensive sample preparation. The sensor’s design, utilizing light refraction and reflection principles, allows for the accurate measurement of diesel adulteration levels. Validation results showcase the machine learning models’ high precision in predicting adulteration percentages, as evidenced by an R-squared value of 0.999 and a mean absolute error of 0.074. This research signifies a leap in sensor technology, offering a practical solution for rapid diesel adulteration detection, especially in developing countries, by minimizing reliance on advanced laboratory analyses. The sensor’s design aligns with the requirements for low-cost IoT technology, presenting a versatile tool for various applications.

1. Introduction

Diesel adulteration is a widespread issue in many countries, driven by the price disparity between similar quantities of different products [1]. This practice poses a significant threat to national interests, with petroleum products like high-speed diesel and petrol being particularly vulnerable due to their high demand, cost, and occasional scarcity.
Among these, diesel, extensively used in heavy vehicles, is commonly tampered with using domestically available, subsidized kerosene, causing substantial damage to vehicle engines and reducing fuel efficiency [2]. The similar properties of kerosene and diesel facilitate this illicit practice for financial gain. Kerosene, with a calorific value of 45 KJ/g, is distributed at reduced rates by some governments for household and industrial use, yet unscrupulous individuals mix it with diesel, exploiting these overlapping properties [3].
Diesel, a complex blend of hydrocarbons (C9–C19) with a specific calorific value and distillation range and a composition that includes 15–30% aromatics and 70–85% saturated aliphatics, contrasts with kerosene’s hydrocarbon range (C6–C16) [4]. Despite efforts by government bodies to monitor diesel and petrol quality through random sample collection, existing laboratory analyses are flawed, allowing adulterated samples to pass. The literature lacks fully accurate and cost-effective methods for qualitative adulteration assessment in diesel. Recent advancements claim more precise quantification methods, though some physical parameter-based analyses remain impractical.
Specific gravity is a measure of the density of a substance compared to the density of water at a specified temperature. For diesel, this property is important because it affects the fuel’s energy content, combustion characteristics, and behavior in engines. The specific gravity of diesel samples ranges between 0.800 and 0.850. In comparison, kerosene’s specific gravity spans from 0.780 to 0.820, showing a considerable overlap [5]. Therefore, it becomes difficult to distinguish between pure diesel, pure kerosene, and their mixtures based solely on this property. This overlap presents a significant challenge for quality control, requiring more sophisticated analytical techniques to accurately detect and quantify the extent of adulteration.
The process of separating and identifying polycyclic aromatic compounds in diesel can be efficiently conducted using techniques such as two-dimensional microbore high-performance liquid chromatography [6], high-resolution mass spectrometry [7], and microfabricated gas chromatography [8], yet challenges persist due to the hydrocarbon overlap in diesel and kerosene, and conclusive detection remains complex.
Jabin et al. [9] introduced a novel approach for detecting diesel adulteration using a silver-coated surface plasmon resonance (SPR)-based biosensor. The sensor’s performance was analyzed using COMSOL Multiphysics V-5.1 and MATLAB-V16 software. Their experimental evaluation focused on key optical parameters of the SPR-PCF (photonic crystal fiber), including birefringence, coupling length, power fraction, etc. This advancement is considered significant in the field of photonics.
Another research work evaluated the efficacy of infrared (IR) spectroscopies [10] in conjunction with advanced statistical models like partial least squares (PLS) regression, support vector machine regression (SVR), and multivariate curve resolution with alternating least squares (MCR-ALS) for quantitatively and qualitatively identifying kerosene in commercial diesel. These models proved accurate in quantifying kerosene concentrations ranging from 2.5% to 40% by volume, with low errors (RMSEC < 2.59% and RMSEP < 5.56%) and a high correlation between actual and predicted values.
Nonetheless, additional methods have also been employed in this domain, including NMR spectroscopy [11,12,13], fiber optic technique [14,15,16], fluorescent paper strips [17], optical sensor [18,19], infrared spectrometer [20,21,22,23], ultrasonic technique [24], artificial intelligence (AI) prediction [25], computational technique [26], and many other chemical-based techniques [27,28,29].
Recent advancements have positioned machine learning models as a novel approach for examining diesel adulteration. Bhowmik et al. [25] explored how ethanol blended with adulterated diesel could improve exhaust emissions without compromising engine performance. Utilizing experimental findings, a gene expression programming (GEP) model, rooted in artificial intelligence (AI) and encompassing multiple parameters, was crafted to delineate the connection between various inputs (e.g., engine load and shares of kerosene and ethanol) and outputs (e.g., BTE, BSEC, NOx, UHC, and CO) for Diesosenol implementations. This model demonstrated remarkable accuracy, validated by a comparison with empirical data and statistical evaluations, displaying minimal mean square error values between 0.00002 and 0.00031.
Each of these techniques can provide valuable information about the presence of adulterants in diesel. However, the choice of method often depends on the specific requirements of the testing, including the need for accuracy, speed, cost-effectiveness, and the ability to perform analyses on-site. Some of these techniques, such as SPR or IR spectroscopy [9,10], have a high initial cost for equipment and may require calibration for different types of diesel. It also might be less effective in distinguishing between similar types of hydrocarbons or detecting low concentrations of adulterants. Others, such as gas and liquid chromatography [8,27], require skilled operators, time-consuming sample preparation, and are not suitable for on-site testing. The equipment is expensive as well and requires skilled operation. Furthermore, no technique can be suitable for all types of adulterants, particularly organic ones. Chemical sensor techniques may not detect unknown adulterants or those present in very low concentrations, and sensor degradation over time can affect reliability [30].
Machine learning and neural network-based techniques can analyze complex datasets using spectroscopic techniques (like NIR and FTIR) to improve the accuracy and prediction of adulteration levels. AI can handle large data volumes, making it suitable for detecting subtle patterns indicative of adulteration. Yet, this method requires extensive datasets for training and may be complex to set up, and the accuracy depends significantly on the quality and diversity of the training data [31].
Relative to the previously discussed methods and techniques that necessitate expensive equipment, consumables, laboratory apparatus, and operation by trained professionals, certain optical techniques may prove more economical in the long term. This cost-efficiency stems from their reduced need for consumables, advantages like lasting durability, low upkeep, the possibility for automated operation, and the capability to conduct tests without damaging the samples [18,19,20,21,22,23].
However, optical techniques also have disadvantages, such as limited sensitivity, especially when certain types of adulterants have similar refractive indices or densities to diesel, which makes the adulterants difficult to detect. They are also not effective for precise quantification of adulteration levels.
The use of optical sensors alongside digital and AI technologies serves as a prospective means of improving the efficiency of the performance and analysis of data; hence, this approach could significantly reduce costs and lead to the development of superior detection methods. Even though it is a yet-understudied method used for detecting diesel fraud, distressingly, few studies have investigated this issue [32,33,34,35,36].
This manuscript introduces a novel method combining light reflection principles with a machine learning ML framework to detect diesel adulteration with kerosene instantly. Traditional methods for detecting fuel adulteration, as aforementioned, often involve complex laboratory analyses, which are time-consuming and not feasible for real-time application. Recent advancements have explored optical techniques and ML algorithms for adulteration detection; however, these approaches have faced challenges, including the need for extensive real-time data for ML model optimization and limitations in sensitivity and specificity.
Our research stands at the forefront by employing COMSOL Multiphysics and ML to design a sensor that overcomes these challenges. Unlike previous studies that separate the application of optical studies and ML, our approach integrates them, enhancing the ability to detect adulteration with high precision even with limited data sources. This integration is crucial, considering the dynamic nature of diesel properties and the variety of adulterants used. The novelty of our study lies in the creation of synthetic data through simulations in COMSOL Multiphysics, enabling the training of an ML model without the extensive need for real-world contaminated samples (reference the importance of synthetic data in overcoming data scarcity in ML models).
Moreover, the proposed model introduces a cost-effective laser configuration, leveraging Snell’s law to analyze light interactions with adulterated diesel. This approach allows for the estimation of kerosene concentrations in diesel, a significant step forward in real-time adulteration detection.
In summary, this manuscript contributes a unique perspective to the field by merging optical principles with ML for detecting diesel adulteration. It offers a new, affordable, and portable solution for on-the-spot analysis, addressing a significant gap in current research. Future works will delve into the development phase and experimental validations, further solidifying this innovative approach’s applicability and effectiveness.
This paper is structured to outline the conceptual framework and methodology behind the proposed sensor in Section 2, laying the groundwork for the methodologies applied. Section 3 provides a detailed exposition of the machine learning approach, including the definition of the dataset and the models utilized within the machine learning framework. Section 4 then presents the results, along with a discussion evaluating the effectiveness and performance of the machine learning models deployed.

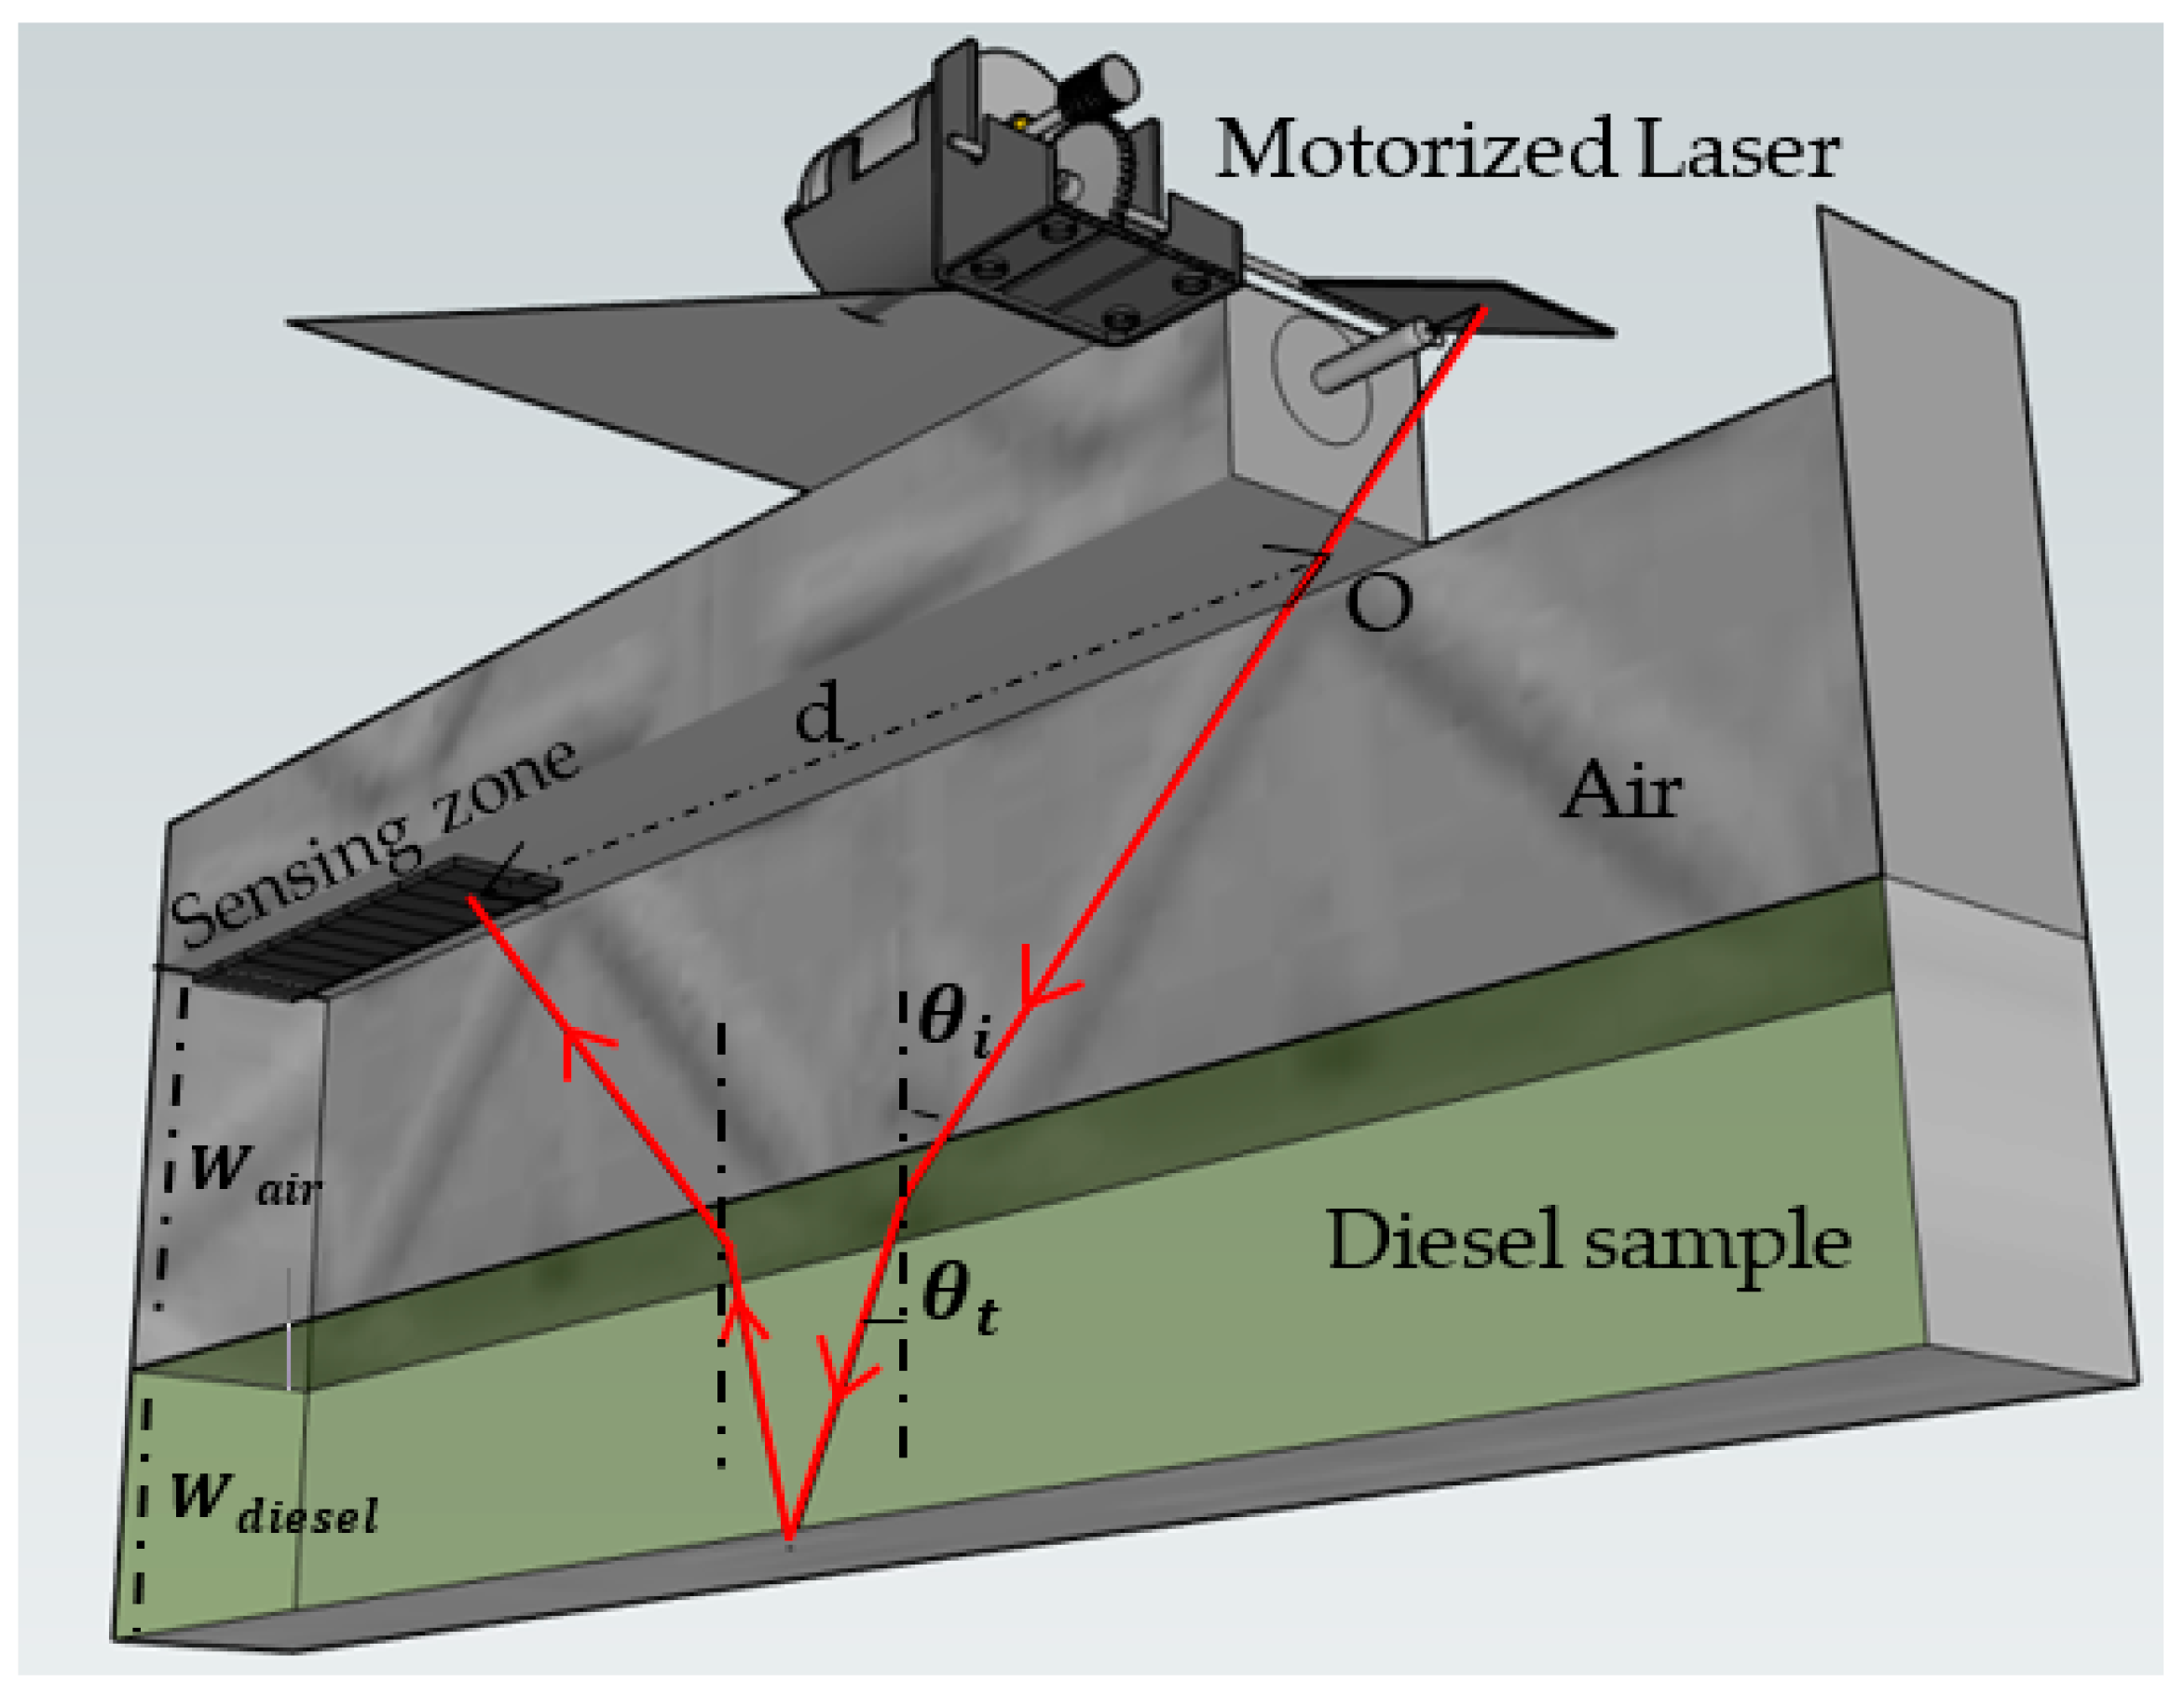
2. Optical-Based Sensor Mechanism

COMSOL Multiphysics® [37] is used to define the sensor’s operating principle and generate synthetic data for the input-output of the regressors in the machine learning tool. This simulation entails representing the layout of the sensor as a 2D rectangular configuration, akin to a container or tank in which the diesel sample is subjected to testing.
The fundamental principle underpinning the sensor’s functionality involves the refraction and reflection of laser light within the diesel sample. Once the laser light is emitted into the sample, it traverses until it reaches the base of the container, where it reflects off the surface and travels back through the sample before exiting toward a designated area known as the “sensing zone”, positioned along the laser’s trajectory. Within this zone, the distance d, defined as the light path from its point of entry to its intersection with the sensing zone, is calculated. This distance d depends on various factors, including the light’s wavelength, transmission angle, refractive index, and the temperature of the diesel sample.
This section outlines the key parameters and equations used in the COMSOL Multiphysics simulation to analyze the sensor’s design and operational principles. The sensor model is divided into three primary components: a cap that accommodates the laser source, a container for the diesel sample, and a sensing zone equipped with sensors located on the container’s upper surface. Defined within COMSOL, the sensor’s geometry is conceptualized as a 2D structure, distinguishing two distinct areas: air (with a refractive index n a i r = 1 ) and the diesel sample (with a refractive index n d ). Figure 1 displays a three-dimensional depiction of the sensor’s conceptual design.
Nonetheless, the sensor conceptualization and the data collected via COMSOL in this study pertain to a 2D analysis. The sensor possesses a rectangular geometry, measuring 30 cm in length and 15 cm in width (Figure 2). The laser is positioned at the incidence point O within the cap and emits light at an incidence angle θ i . This angle can be altered through a system combining a mirror and a servo motor, as illustrated in Figure 1. Upon transitioning from air into a diesel sample, the light beam refracts at an angle θ t relative to the normal. Snell’s law, which establishes the correlation between n a i r ,   n d ,   θ i ,   a n d   θ t , governs this behavior and is incorporated into the simulation, as described by Equation (1):
n a i r sin θ i = n w sin θ t
To reach the sensing zone located a distance d away from the initial point of incidence O, the transmitted light navigates through the diesel sample medium at a refraction angle θ t . The determination of d is subject to several influencing factors, including the incident light wavelength λ , the angle of incidence θ i , the refractive index n d of the diesel sample, and the depth ratio of air to diesel within the medium, denoted as W a i r / W d i e s e l .
In COMSOL, the modeling of electromagnetic wave propagation utilizes the “Geometrical Optics” time-dependent physics interface. In this study, diffraction effects at the edges and corners of the geometry are neglected by setting the wall boundary conditions to “disappear” options, ensuring perfect absorption. To accurately capture the refraction between air and diesel, the step size for the optical path length is set to 0.01 cm.
COMSOL calculates the ray’s time (source-to-target) to reach the sensor zone. On the other hand, the beam travels at the speed of light, and the duration is expressed in nanoseconds, or Angstroms. It is challenging to locate a time sensor that can precisely measure the nanoscale time difference that occurs between beams after they arrive at the detecting zone. Consequently, it is useless to examine the source-to-target time that COMSOL collected. Thus, the focus of this study is primarily on the distance d parameter, dependent on the λ ,   n d ,   T ,   θ i ,   a n d   W a i r / W d i e s e l parameters. Simulations are carried out to compute the distance d for a wavelength λ of 450 nm, an angle θ i ranging from 10° to 40° with a 1° step, a width W d i e s e l ranging from 1 cm to 5 cm with a 0.5 cm step, and a refractive index n d with a 1 × 10 4 step. The small increment in the n d computation is designed to guarantee precise identification of the sample’s refractive index, given the close similarity between the refractive indices of diesel and its adulterants.
Numerous studies have explored diesel adulteration by assessing the refractive index of various adulterated diesel samples. Bhausaheb et al. [38] tested ten fuel and kerosene samples, each obtained from different reputable sources. Then, different ratios were combined to create admixtures of kerosene in diesel, corresponding to adulteration volume percentages varying from 10% to 100%. Refractive index readings at room temperature from the refractometer for the 10 distinct diesel samples varied from 1.4600 to 1.4612, with an average of 1.4606, and from 1.4445 to 1.4471, with an average of 1.453, for the kerosene samples. For the admixture samples, results show a refractive index of 1.4587, 1.4571, 1.4556, 1.4550, 1.4523, 1.4507, 1.4491, 1.4477, 1.4461, and 1.4444, corresponding to 10% to 100% kerosene adulteration, respectively. It was observed that the refractive index decreases as the proportion of kerosene increases, displaying a linear relationship between the refractive index and the percentage of kerosene.
Kanyathare et al. [39] introduced a method for detecting adulterated diesel oil by comparing the refractive index of mixtures of suspected adulterated and authentic diesel oils using a refractometer. The process benefits from the availability of genuine diesel from regulatory authorities and employs the Lorentz–Lorenz formula to estimate the permittivity changes, aiding in the detection of counterfeit diesel. It suggests the potential for creating a calibration curve library for all diesel types in a country to facilitate screening. The values of the refractive indices obtained were also in the range of the ones obtained in reference [38].
Thus, based on the above, the refractive index is swept in the simulation study from 1.4444 to 1.4604 with 1 × 10 4 increments to cover the maximum range of adulterated diesel concentration.
As aforementioned, the output of the simulation study is the measurement of the parameter d for each change of the parameters θ i (from 10° to 40° with a 1° increment), W d i e s e l (from 1 cm to 5 cm with a 0.5 cm increment), and n d (from 1.4444 to 1.4604 with a 1 × 10 4 increment).
In the following section, we will outline the preparation of the dataset by establishing the input-output parameters for the machine learning model and subsequently assess its performance.

3. Machine Learning Regression Models for Diesel Purity Prediction

As referenced above, the simulation COMSOL Multiphysics software is used to analyze the effects of reflection/refraction, which are characterized by multiple variables, including W d i e s e l ,   θ i ,   n d ,   a n d   d . Changing these variables will impact the distance d . The effects of different values of each variable are modeled to get a more accurate result. The final outcome is the distance d produced for each variable. The simulation and training variables forming the dataset are:
  • Incident angle θ i from 10° to 40° with a 1° increment.
  • Diesel sample depth W d i e s e l from 1 cm to 5 cm with a 0.5 cm increment.
  • Refractive index of the diesel sample n d from 1.4444 to 1.4604 with a 1 × 10 4 increment to cover all possible adulterated diesel volume percentage.
The categorization of diesel adulteration volume percentage is determined by the refractive index, as indicated in Table 1.
The data obtained from these simulations were aggregated and reformatted to create a dataset that defines the adulterated diesel volume concentration as output based on the value of the predicted n d (Table 2). Table 2 presents a portion of the dataset obtained from COMSOL, featuring selected values of incident angles and refractive indices of adulterated diesel at various diesel depths.
The adjusted variables will together create the input dataset for the regression models, which will then be utilized to calculate the percentage of adulteration in diesel. In this section, we delve into the presentation of machine learning regression models to predict diesel concentration/purity based on the data influenced by the light reflection/refraction concept, given in Table 1. We will discuss the pivotal role of normalization, elucidate the process of data partitioning, describe the input–output relationships, introduce relevant equations, and underscore the significance of model evaluation.

3.1. Dataset Preparation and Partitioning

In our study, we began with a comprehensive dataset comprising 4986 input parameters, encompassing θ i in degrees, W d i e s e l in cm, n d and d in cm. To facilitate robust model training and evaluation, we adopted a principled approach to data partitioning. Unambiguously, we allocated 70% of the dataset, amounting to 3490 samples, for model training. The remaining 30%, consisting of 1496 samples, was reserved for rigorous testing of the trained models. Additionally, we generated five sets of data for post-modeling analysis and result presentation, ensuring comprehensive evaluation and validation.

3.2. Normalization for Enhanced Model Performance

Normalization serves as a critical preprocessing step to standardize the input data and ensure uniform scaling across features. Leveraging the “sklearn.preprocessing.normalize” function, we transformed θ i and d data to a consistent range, promoting convergence and stability in regression models. The normalization equation is presented in Equation (2):
x n o r m = x min x max x m i n ( x )
where x represents the input feature, min( x ) is the minimum value of x , and max( x ) is the maximum value of x .
Our input parameters, denoted as x = [ θ i ,   d 1 ,   d 2 , ,   d 7 ], encapsulate the incident angles θ i and distances d influenced by reflection/refraction and the diesel sample W d i e s e l , while the output variable y represents the refractive index n d predicted by the regression models.
Regression models are fundamental tools in machine learning for predicting continuous target variables based on input features. In our scenario of predicting diesel purity, regression models play a crucial role in deciphering the complex relationships between incident angles, distances affected by reflection/refraction, and refractive indices. In this study, we explore a collection of regression techniques, including linear regression equations, gradient boosting regressors, decision tree regressors, random forest regressors, extra trees regressors, and voting regressors. Each model encapsulates distinct methodologies to infer the intricate relationships between input features and refractive indices, culminating in accurate predictions of diesel purity. A brief description of each of the mentioned models is presented in the following paragraph.
Linear regression establishes a linear relationship between the input features and the target variable by fitting a straight line to the data points. This model learns the coefficients (slope) and the intercept (bias) that minimize the difference between the predicted and actual values. In our context, linear regression estimates the refractive index based on angles and distances, offering interpretability and simplicity in model representation.
Gradient boosting is an ensemble learning technique that sequentially builds a series of decision trees, each correcting the errors of its predecessor. In our scenario, GradientBoostingRegressor constructs a strong predictive model by iteratively minimizing the residuals between predicted and actual refractive indices. By combining weak learners into a robust ensemble, GradientBoostingRegressor adapts to complex data patterns and offers superior predictive performance.
Decision trees partition the feature space into hierarchical structures based on feature thresholds, enabling intuitive decision-making. DecisionTreeRegressor constructs a binary tree where each node represents a feature and each branch represents a decision based on that feature. In predicting diesel purity, DecisionTreeRegressor recursively splits the data to minimize the variance of refractive index predictions, offering transparency and interpretability in model insights.
Random forests leverage the power of ensemble learning by constructing multiple decision trees and aggregating their predictions. RandomForestRegressor introduces randomness in tree construction by bootstrapping samples and selecting random subsets of features, thereby reducing overfitting and improving generalization performance. In our context, RandomForestRegressor captures intricate relationships between angles, distances, and refractive indices, offering robust predictions for fuel purity.
ExtraTreesRegressor, a variant of random forests, introduces additional randomness during tree construction by selecting random thresholds for feature splitting. By incorporating feature randomness and bootstrap sampling, ExtraTreesRegressor explores the feature space more comprehensively, thereby enhancing predictive performance and mitigating overfitting concerns. In predicting diesel purity, ExtraTreesRegressor offers versatility and robustness in capturing subtle variations in angle-distance-refraction relationships.
VotingRegressor aggregates predictions from multiple base estimators, including linear regression, GradientBoostingRegressor, DecisionTreeRegressor, RandomForestRegressor, and ExtraTreesRegressor. By combining diverse regression models, VotingRegressor harnesses the collective wisdom of individual estimators to improve prediction accuracy and robustness. In our scenario, VotingRegressor provides a unified approach to diesel purity estimation, leveraging the strengths of different regression techniques to enhance predictive performance.
Scikit-learn, a popular machine learning library, offers default values for hyperparameters in its implementations of various models. For instance, in gradient boosting, the default learning rate (eta) is typically set to 0.1, while the number of trees ( n e s t i m a t o r s ) defaults to 100. Decision trees often have default values such as ‘None’ for maximum depth (allowing nodes to expand until all leaves are pure) and 2 for the minimum number of samples required to split an internal node (min_samples_split). Random forests usually default to 100 trees ( n e s t i m a t o r s ), and while the maximum depth defaults to ‘None’, for our modeling, it was set to 100. Additionally, ‘auto’ is the default value for maximum features, which chooses the square root of the number of features for classification and the number of features for regression. Linear regression in scikit-learn does not have hyperparameters to tune by default, but if regularization is applied, the default alpha for Lasso or Ridge regularization is set to 1.0. Similarly, for the extra trees regressor, the default number of trees ( n e s t i m a t o r s ) is 100, and while the maximum depth defaults to ‘None’, it is updated to 100 for this study. The maximum feature defaults to ‘auto’. These default values offer a starting point for model training and can be adjusted through hyperparameter tuning to optimize performance for specific datasets and tasks.
To measure the efficacy of our regression models, we employed a suite of evaluation metrics, including mean squared error (MSE), R-squared ( R 2 ), mean absolute error (MAE), and root mean squared error (RMSE). These metrics provide quantitative insights into model performance, enabling nuanced comparisons and informed decision-making. The equations for these metrics are provided in Equations (3)–(6):
M S E = 1 N Σ i = 1 N y i y i 2
R 2 = 1 Σ i = 1 N y i y i 2 Σ i = 1 N y i y i 2
M A E = 1 m k = 1 m y k ¥ k
R M S E = M S E
where ¥ k represents predicted values for interval k and y k represents the real output.
In the following section, we will showcase and assess the outcomes derived from the various models employed.

4. Results and Model Verification

Regression models can serve as powerful tools for predicting diesel purity based on incident angle and distance data. Table 3 displays the outcomes for R 2 , MSE, RMSE, and MAE calculated from the different models utilized. It reveals that the models are highly reliable, as evidenced by an R 2 value of 0.999 and an MAE of 0.074. This confirms the viability of the proposed models for mapping inputs to outputs.
To determine which model shows the best performance, we typically look at various performance metrics like R 2 , MSE, RMSE, and MAE.
In this case, the model with the highest R 2 value and the lowest values for MSE, RMSE, and MAE would generally be considered the best-performing model.
Based on the provided metrics from Table 2, the ExtraTreesRegressor model shows the highest R 2 value (0.9999722953) and the lowest MSE, RMSE, and MAE among all models. Additionally, the RandomForestRegressor also performs exceptionally well, with a high R-squared value (0.9998072755) and low values for MSE, RMSE, and MAE.
Both ExtraTreesRegressor and RandomForestRegressor are ensemble methods and have likely benefited from their ensemble nature and randomness in the model building process, which can help improve generalization and reduce overfitting. Therefore, based on the provided metrics, ExtraTreesRegressor and RandomForestRegressor appear to show the best performance among the models listed.
VotingRegressor was chosen for this study due to its ability to aggregate predictions from multiple base estimators, including linear regression, GradientBoostingRegressor, DecisionTreeRegressor, RandomForestRegressor, and ExtraTreesRegressor. By combining diverse regression models, VotingRegressor leverages the collective wisdom of individual estimators to improve prediction accuracy and robustness. Although it may not have the highest R 2 and MSE values individually when compared to some of the base estimators, its strength lies in its ability to mitigate the weaknesses of any single model by averaging their predictions, thus potentially enhancing predictive robustness. In our scenario of diesel purity estimation, where accuracy and robustness are crucial, VotingRegressor offers a unified approach that harnesses the strengths of different regression techniques, potentially leading to enhanced predictive performance and more reliable results.
Figure 3 displays the error metrics and accuracy of the VotingRegressor model, demonstrating a close match between simulated and forecasted test data for various percentages of adulterated diesel, with slight fluctuations observed at specific data points. Importantly, the data used for evaluation tests were distinct from those used in the model’s training phase.
A more comprehensive statistical analysis of the model is presented in Table 4, where the different models are tested for predicting adulterated diesel concentration. This table depicts the means of error prediction for modified diesel concentration values.
It is noteworthy to highlight that the benchmark dataset labeled in Table 4 has not been employed during either the training or testing phases. The models’ average percentage errors are 5.028 × 10 3 % , 6.878 × 10 3 % , 3.07 × 10 3 % , 8.65 × 10 3 % , 7 × 10 4 % , and 3.87 × 10 3 % for the gradient boosting regressor, decision tree regressor, random forest regressor, linear regression, extra trees regressor, and voting regressor models, respectively.
These findings reveal the models’ expanding potential, highlighted by their accuracy in predicting diesel adulteration percentages using data not previously encountered in training.
Detecting false diesel and measuring relevant concentrations still looks like an underdeveloped research area, and existing studies show a shortage of emissions data obtained through sensors based on machine learning [19,20] using an optical philosophy. The limited quantity of training data resulted in a decrease in the accuracy of the deep-learning neural network’s ability to correctly classify adulterated diesel, thereby affecting its performance. Our research creates a synthetic dataset that creates the possibility of more accurate forecasts with the help of actual data. As Figure 3 and Table 3 reveal, our model proves that the d variable shows a significant correlation with adulterated diesel concentration with additive use labeled, which means we are able to benefit from the generated data without anomalies.

5. Conclusions

This paper outlines an innovative method for detecting adulterated diesel fuel, particularly when mixed with kerosene, by employing refractive index values of both authentic and potentially adulterated diesel samples in conjunction with machine learning algorithms to accurately ascertain the level of adulteration.
  • In contrast to traditional detection methods that are expensive, require extensive sample preparation, require skilled technicians, and are not adaptable for field testing or versatile in detecting various diesel adulterants, our suggested approach leverages the principles of optics of light reflection and refraction to create synthetic data for machine learning analysis.
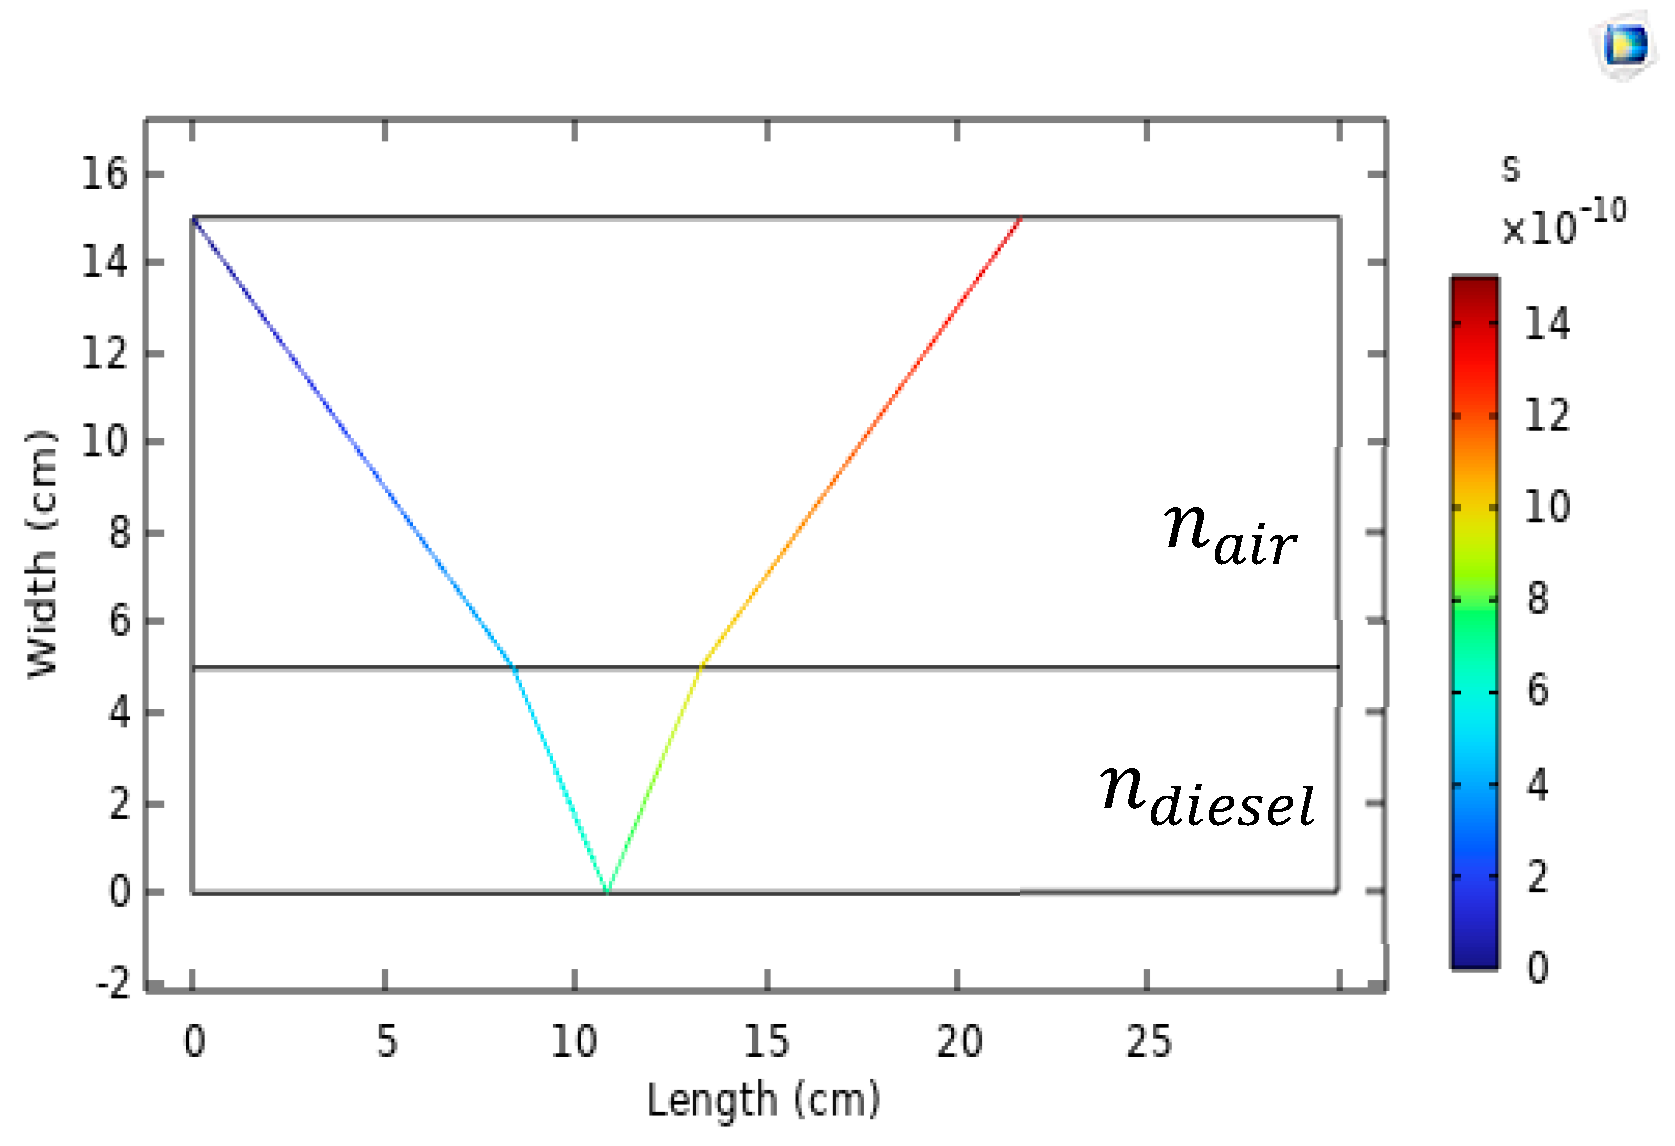
  • Our laser-based sensor, designed using COMSOL, is composed of a simple setup involving a diesel-filled container and an overhead laser. The laser light, after refracting through the diesel, is measured for its reflection back to a sensor aligned with the laser.
  • Various parameters are calculated, such as the distance from the laser to the point of light detection, angles of incidence, and diesel depth. These parameters are then utilized as synthetic data, streamlining the machine learning training phase, a typically laborious aspect of AI implementation, to predict adulteration levels across a spectrum from 0 to 100%.
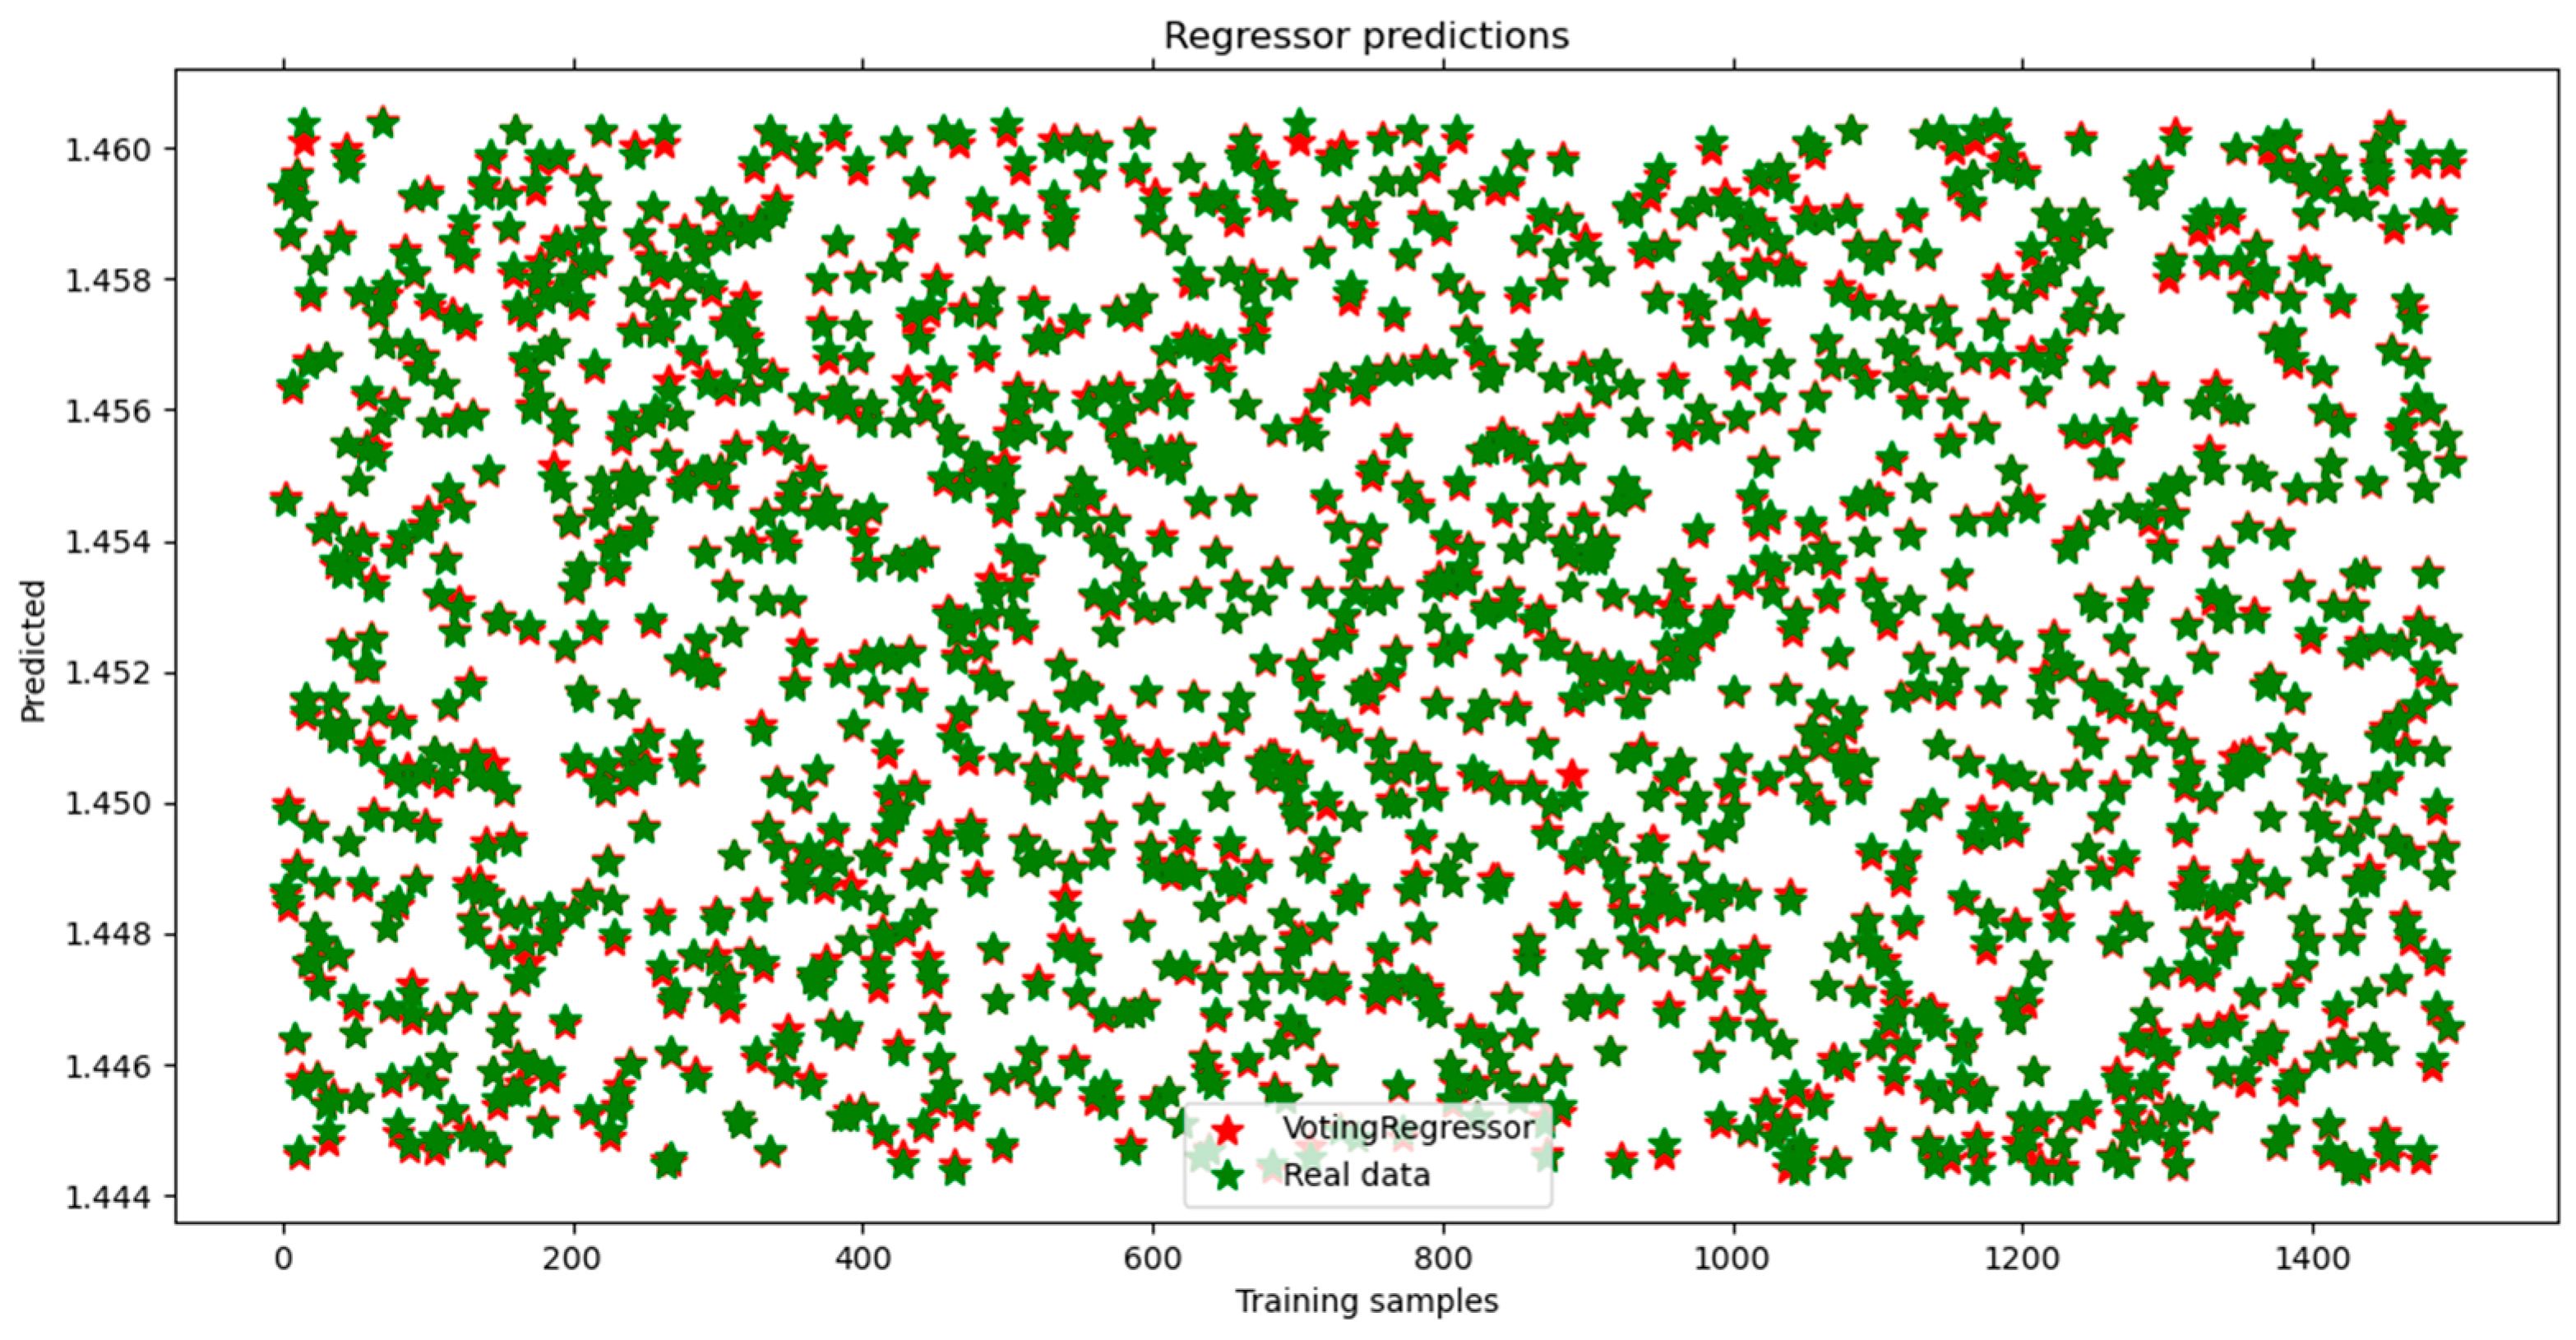
  • Different models have been tested to check the best performance looking at the hyperparameter metrics. The results validate our models’ high accuracy in predicting unseen data, as evidenced by an R-squared value of 0.999 and a mean absolute error of 0.074, confirming their potential for practical application.
  • This sensor’s cost-effective and versatile design promotes its utility across various applications, making it a promising solution for affordable, low-cost Internet of Things technologies.
The implications of this research are significant, offering advancements in sensor technology for the precise and accessible detection of diesel adulteration. This method is especially advantageous for use in developing countries, where it could significantly diminish the dependence on intricate lab analyses by allowing for initial adulteration screening on-site and thereby reserving detailed lab analyses for only the most challenging samples.

Author Contributions

Conceptualization, B.M. and S.V.; Investigation, B.M. and S.V.; Methodology, B.M. and S.V.; Software, B.M. and S.V.; Supervision, B.M. and S.V.; Validation, B.M. and S.V.; Visualization, B.M., S.V. and T.A.; Writing—original draft, B.M.; Writing—review and editing, B.M., S.V. and T.A. All authors have read and agreed to the published version of the manuscript.

Funding

This research received no external funding.

Data Availability Statement

Data are contained within the article.

Conflicts of Interest

The authors declare no conflicts of interest.

Abbreviations

SPRSurface plasmon resonance
PCF Photonic crystal fiber
IR Infrared
PLSPartial least squares
SVRSupport vector machine regression
MCR-ALSMultivariate curve resolution with alternating least squares
AIArtificial intelligence
MLMachine learning
GEPGene expression programming
BSECBrake specific energy consumption
NOxNitrogen oxides
BTEBrake thermal efficiency
UHCUnburned hydrocarbon
COCarbon monoxide
NIRNear-infrared
dLight path from its point of entry to its intersection with the sensing zone
n d Refractive index of diesel
n k Refractive index of kerosene
n a i r Refractive index of air
n w Refractive index of water
θ i Incident angle
θ t Transmitted angle
θ r Reflected angle
W a i r Depth of air
W d i e s e l Depth of diesel sample
λ Wavelength of light
R 2 R-squared
MSEMean squared error
MAEMean absolute error
RMSERoot mean squared error

References

  1. Vempatapu, B.P.; Kanaujia, P.K. Monitoring petroleum fuel adulteration: A review of analytical methods. TrAC—Trends Anal. Chem. 2017, 92, 1–11. [Google Scholar] [CrossRef]
  2. Mattheou, L.; Zannikos, F.; Schinas, P.; Karavalakis, G.; Karonis, D.; Stournas, S. Impact of using adulterated automotive diesel on the exhaust emissions of a stationary diesel engine. Glob. NEST J. 2018, 8, 291–296. [Google Scholar]
  3. Nurdin, H.; Hasanuddin, H.; Darmawi, D.; Prasetya, F. Analysis of Calorific Value of Tibarau Cane Briquette. Mater. Sci. Eng. Conf. Ser. 2018, 335, 012058. [Google Scholar] [CrossRef]
  4. International Council of Chemical Associations (US/ICCA) COCAM 3. 2012. Available online: https://hpvchemicals.oecd.org/UI/handler.axd?id=73b56220-3a8b-479b-b03c-99c7353bf4d6 (accessed on 7 April 2024).
  5. Yuan, W.; Hansen, A.C.; Zhang, Q. The specific gravity of biodiesel fuels and their blend with diesel fuel. Agric. Eng. Int. CIGR J. Sci. Res. Dev. 2004, 6. Available online: https://www.researchgate.net/publication/228589856_The_specific_gravity_of_biodiesel_fuels_and_their_blend_with_diesel_fuel (accessed on 7 April 2024).
  6. Obuchi, A.; Aoyama, H.; Ohi, A.; Ohuchi, H. Determination of polycyclic aromatic hydrocarbons in diesel exhaust particulate matter and diesel fuel oil. J. Chromatogr. A 1984, 312, 247–259. [Google Scholar] [CrossRef] [PubMed]
  7. Vempatapu, B.P.; Tripathi, D.; Kumar, J.; Kanaujia, P.K. Determination of Kerosene as an Adulterant in Diesel through Chromatography and High-Resolution Mass Spectrometry. SN Appl. Sci. 2019, 1, 637. [Google Scholar] [CrossRef]
  8. Chowdhury, M.; Gholizadeh, A.; Agah, M. Rapid Detection of Fuel Adulteration Using Microfabricated Gas Chromatography. Fuel 2021, 286, 119387. [Google Scholar] [CrossRef]
  9. Jabin, M.A.; Rana, M.J.; Al-Zahrani, F.A.; Paul, B.K.; Ahmed, K.; Bui, F.M. Novel Detection of Diesel Adulteration Using Silver-Coated Surface Plasmon Resonance Sensor. Plasmonics 2022, 17, 15–40. [Google Scholar] [CrossRef]
  10. Moura, H.O.; Câmara, A.B.; Santos, M.C.; Morais, C.L.; de Lima, L.A.; Lima, K.M.; de Carvalho, L.S. Advances in Chemometric Control of Commercial Diesel Adulteration by Kerosene Using IR Spectroscopy. Anal. Bioanal. Chem. 2019, 411, 2301–2315. [Google Scholar] [CrossRef] [PubMed]
  11. Cunha, D.A.; Neto, Á.C.; Colnago, L.A.; Castro, E.V.R.; Barbosa, L.L. Application of Time-Domain NMR as a Methodology to Quantify Adulteration of Diesel Fuel with Soybean Oil and Frying Oil. Fuel 2019, 252, 149. [Google Scholar] [CrossRef]
  12. de Aguiar, L.M.; Galvan, D.; Bona, E.; Colnago, L.A.; Killner, M.H.M. Data Fusion of Middle-Resolution NMR Spectroscopy and Low-Field Relaxometry Using the Common Dimensions Analysis (ComDim) to Monitor Diesel Fuel Adulteration. Talanta 2022, 236, 122838. [Google Scholar] [CrossRef] [PubMed]
  13. Cunha, D.A.; Montes, L.F.; Castro, E.V.R.; Barbosa, L.L. NMR in the Time Domain: A New Methodology to Detect Adulteration of Diesel Oil with Kerosene. Fuel 2016, 166, 78. [Google Scholar] [CrossRef]
  14. Verma, R.K.; Suwalka, P.; Yadav, J. Detection of Adulteration in Diesel and Petrol by Kerosene Using SPR Based Fiber Optic Technique. Opt. Fiber Technol. 2018, 43, 11. [Google Scholar] [CrossRef]
  15. Chauhan, M.; Khanikar, T.; Singh, V.K. PDMS Coated Fiber Optic Sensor for Efficient Detection of Fuel Adulteration. Appl. Phys. B 2022, 128, 109. [Google Scholar] [CrossRef]
  16. Roy, S. Fiber Optic Sensor for Determining Adulteration of Petrol and Diesel by Kerosene. Sens. Actuators B Chem. 1999, 55, 171. [Google Scholar] [CrossRef]
  17. Bell, J.; Gotor, R.; Rurack, K. Fluorescent Paper Strips for the Detection of Diesel Adulteration with Smartphone Read-Out. J. Vis. Exp. 2018, 141, 58019. [Google Scholar]
  18. Kanyathare, B.; Kuivalainen, K.; Räty, J.; Silfsten, P.; Bawuah, P.; Peiponen, K.E. A Prototype of an Optical Sensor for the Identification of Diesel Oil Adulterated by Kerosene. J. Eur. Opt. Soc. 2018, 14, 71. [Google Scholar] [CrossRef]
  19. Sadat, A. Determining the Adulteration of Diesel by an Optical Method. Int. J. Comput. Appl. 2014, 100, 17588. [Google Scholar] [CrossRef]
  20. Paiva, E.M.; Rohwedder, J.J.R.; Pasquini, C.; Pimentel, M.F.; Pereira, C.F. Quantification of Biodiesel and Adulteration with Vegetable Oils in Diesel/Biodiesel Blends Using Portable Near-Infrared Spectrometer. Fuel 2015, 160, 67. [Google Scholar] [CrossRef]
  21. Barra, I.; Mansouri, M.A.; Bousrabat, M.; Cherrah, Y.; Bouklouze, A.; Kharbach, M. Discrimination and Quantification of Moroccan Gasoline Adulteration with Diesel Using Fourier Transform Infrared Spectroscopy and Chemometric Tools. J. AOAC Int. 2019, 102, 966–970. [Google Scholar] [CrossRef] [PubMed]
  22. Pontes, M.J.C.; Pereira, C.F.; Pimentel, M.F.; Vasconcelos, F.V.C.; Silva, A.G.B. Screening Analysis to Detect Adulteration in Diesel/Biodiesel Blends Using Near Infrared Spectrometry and Multivariate Classification. Talanta 2011, 85, 2159–2165. [Google Scholar] [CrossRef]
  23. Kanyathare, B.; Asamoah, B.; Peiponen, K.E. Imaginary Optical Constants in Near-Infrared (NIR) Spectral Range for the Separation and Discrimination of Adulterated Diesel Oil Binary Mixtures. Opt. Rev. 2018, 26, 85–94. [Google Scholar] [CrossRef]
  24. Kumar, A.; Singh, V.R.; Parashar, D.C. Ultrasonic Detection of Adulteration in Diesel. Res. Ind. 1991, 36, 168–170. [Google Scholar]
  25. Bhowmik, S.; Paul, A.; Panua, R.; Ghosh, S.K.; Debroy, D. Artificial Intelligence Based Gene Expression Programming (GEP) Model Prediction of Diesel Engine Performances and Exhaust Emissions Under Diesosenol Fuel Strategies. Fuel 2019, 235, 317–325. [Google Scholar] [CrossRef]
  26. Babu, V.; Krishna, R.; Mani, N. Review on the Detection of Adulteration in Fuels through Computational Techniques. Mater. Today Proc. 2017, 4, 1723–1729. [Google Scholar] [CrossRef]
  27. De Matos, T.S.; Dos Santos, R.C.; De Souza, C.G.; De Carvalho, R.C.; De Andrade, D.F.; D’ávila, L.A. Determination of the Biodiesel Content on Biodiesel/Diesel Blends and Their Adulteration with Vegetable Oil by High-Performance Liquid Chromatography. Energy Fuels 2019, 33, 11310–11317. [Google Scholar] [CrossRef]
  28. Ejilah, I.R.; Olorunnishola, A.A.G.; Enyejo, L.A. A Comparative Analysis of the Combustion Behavior of Adulterated Kerosene Fuel Samples in a Pressurized Cooking Stove. Glob. J. Res. Eng. Mech. Mech. Eng. 2013, 13, 34–44. [Google Scholar]
  29. de Vasconcelos, F.V.C.; de Souza, P.F.B.; Pimentel, M.F.; Pontes, M.J.C.; Pereira, C.F. Using Near-Infrared Overtone Regions to Determine Biodiesel Content and Adulteration of Diesel/Biodiesel Blends with Vegetable Oils. Anal. Chim. Acta 2012, 716, 101–107. [Google Scholar] [CrossRef] [PubMed]
  30. Ogundare, F.; Adekola, F.; Oladosu, I. Compositions and photon mass attenuation coefficients of diesel, kerosene, palm and groundnut oils. Fuel 2019, 255, 115697. [Google Scholar] [CrossRef]
  31. Tran, N.; Chen, H.; Bhuyan, J.; Ding, J. Data Curation and Quality Evaluation for Machine Learning-Based Cyber Intrusion Detection. IEEE Access 2022, 10, 121900–121923. [Google Scholar] [CrossRef]
  32. Mourched, B.; Abdallah, M.; Hoxha, M.; Vrtagic, S. Machine-Learning-Based Sensor Design for Water Salinity Prediction: A Conceptual Approach. Sustainability 2023, 15, 11468. [Google Scholar] [CrossRef]
  33. Demircioğlu, U.; Sayil, A.; Bakır, H. Detecting Cutout Shape and Predicting Its Location in Sandwich Structures Using Free Vibration Analysis and Tuned Machine-Learning Algorithms. Arab. J. Sci. Eng. 2023, 49, 1611–1624. [Google Scholar] [CrossRef]
  34. Chugh, S.; Ghosh, S.; Gulistan, A.; Rahman, B.M.A. Machine Learning Regression Approach to the Nanophotonic Waveguide Analyses. J. Light. Technol. 2019, 37, 6080–6089. [Google Scholar] [CrossRef]
  35. Mourched, B.; Hoxha, M.; Abdelgalil, A.; Ferko, N.; Abdallah, M.; Potams, A.; Lushi, A.; Turan, H.I.; Vrtagic, S. Piezoelectric-Based Sensor Concept and Design with Machine Learning-Enabled Using COMSOL Multiphysics. Appl. Sci. 2022, 12, 9798. [Google Scholar] [CrossRef]
  36. Wang, Y.; Guo, J.; Yang, Z.; Dou, Y.; Chang, X.; Sun, R.; Zuo, G.; Yang, W.; Liang, C.; Hao, Y.; et al. Computer Prediction of Seawater Sensor Parameters in the Central Arctic Region Based on Hybrid Machine Learning Algorithms. IEEE Access 2020, 8, 213783–213798. [Google Scholar] [CrossRef]
  37. Ray Optics Module User’s Guide. COMSOL Multiphysics® v. 6.2. COMSOL AB, Stockholm, Sweden. 2023. Available online: https://doc.comsol.com/5.4/doc/com.comsol.help.roptics/RayOpticsModuleUsersGuide.pdf (accessed on 7 April 2024).
  38. Bhausaheb, M. Determination of Adulteration in Diesel by Refractive Index Measurements. Int. J. Appl. Chem. 2008, 4, 247–252. [Google Scholar]
  39. Kanyathare, B.; Peiponen, K.E. Hand-Held Refractometer-Based Measurement and Excess Permittivity Analysis Method for Detection of Diesel Oils Adulterated by Kerosene in Field Conditions. Sensors 2018, 18, 1551. [Google Scholar] [CrossRef] [PubMed]
Figure 1. Visual representation displaying the 3D design of the proposed sensor, highlighting the light path from the laser source towards the sensing zone.
Processes 12 00798 g001
Figure 2. Two-dimensional sensor design in COMSOL Multiphysics.
Processes 12 00798 g002
Figure 3. The accuracy of voting regressor model predictions across the 1496 dataset sample test.
Processes 12 00798 g003
Table 1. Refractive index range and corresponding diesel volume percentage adulteration.
n d RangeDiesel Volume Percentage Adulteration
1.4604 to 1.45880 (pure diesel)
1.4587 to 1.457210
1.4571 to 1.455720
1.4556 to 1.454130
1.4540 to 1.452440
1.4523 to 1.450850
1.4507 to 1.449260
1.4491 to 1.447870
1.4477 to 1.446280
1.4461 to 1.444590
≤1.4444100 (pure kerozene)
Table 2. Input–output data parameters from a subset of the entire dataset.
InputOutput
θi°W (cm)11.522.533.544.55ndAdulterated Diesel %
10d (cm)5.179355465.124128475.068901495.013674514.958447524.903220544.847993564.792766574.737539591.4444100
5.178541545.12290765.067273665.011639724.956005784.900371844.84473794.789103964.733470021.449260
5.177817085.12182095.065824735.009828564.953832384.897836214.841840044.785843874.729847691.453540
5.176663675.120090795.063517915.006945044.950372164.893799284.837226414.780653534.724080651.46040
157.866458627.780450047.694441467.608432887.52242437.436415727.350407147.264398567.178389991.445990
7.86578397.779437977.693092037.60674617.520400167.434054237.347708297.261362367.175016421.448570
7.864082537.776885917.156946097.076222596.995499096.914775596.83405216.75332866.67260511.455130
7.863365627.775810547.155614117.074557626.993501126.912444636.831388146.750331646.669275151.457910
2815.573598115.384755715.195913315.007070914.818228514.629386114.440543714.251701314.06285881.447580
15.571276915.381273915.191270915.001267914.811264914.621261914.431258914.241255914.05125291.451950
15.568867915.377660315.186452814.995245214.804037714.612830114.421622614.23041514.03920751.456520
15.568034115.376409715.184785314.993160814.801536414.60991214.418287614.226663114.03503871.458110
4024.487642624.144969423.802296223.45962323.116949822.774276622.431603522.088930321.74625711.445690
24.483467224.138706423.793945523.449184623.104423822.759662922.41490222.070141221.72538031.450560
24.481267324.135406523.789545723.443684923.097824122.751963422.406102622.060241821.7143811.453140
24.478742324.13161923.784495723.437372423.090249122.743125822.396002522.048879221.70175591.456120
Table 3. Errors in model regression.
R 2 MSERMSEMAE
GradientBoostingRegressor0.99957554230.00000000900.00009482490.0000780582
DecisionTreeRegressor0.99934935050.00000001380.00011740280.0001106952
RandomForestRegressor0.99980727550.00000000410.00006389600.0000462553
LinearRegression0.99764177820.00000005000.00022351020.0001711042
ExtraTreesRegressor0.99997229530.00000000060.00002422600.0000124726
VotingRegressor0.99977845770.00000000470.00006850670.0000536201
Table 4. Analysis of error rates and adulterated diesel percentage predictions for unseen data.
RealPredictedError %
GradientBoostingRegressor1.45881.458870.00476
1.44911.449120.0014
1.45671.456780.0052
1.44861.44850.0069
1.45381.45370.00688
DecisionTreeRegressor1.45881.45890.00685
1.44911.44920.0069
1.45671.45680.00686
1.44861.44850.0069
1.45381.45370.00688
RandomForestRegressor1.45881.458820.00171
1.44911.449090.00035
1.45671.456710.00103
1.44861.448530.00511
1.45381.45370.00715
LinearRegression1.45881.459260.03133
1.44911.449120.00116
1.45671.456470.01558
1.44861.448920.0221
1.45381.453780.00127
ExtraTreesRegressor1.45881.458810.00082
1.44911.44911.07 × 10−13
1.45671.45670.00027
1.44861.448620.00138
1.45381.453810.00103
VotingRegressor1.45881.458930.0091
1.44911.449130.00182
1.45671.456650.0033
1.44861.448610.00091
1.45381.453740.00423
Disclaimer/Publisher’s Note: The statements, opinions and data contained in all publications are solely those of the individual author(s) and contributor(s) and not of MDPI and/or the editor(s). MDPI and/or the editor(s) disclaim responsibility for any injury to people or property resulting from any ideas, methods, instructions or products referred to in the content.

