Article

Optimization of Anti-Skid and Noise Reduction Performance of Cement Concrete Pavement with Different Grooved and Dragged Textures

1
Highway School, Chang’an University, Xi’an 710054, China
2
Zhaotong Highway Investment Development Co., Ltd., Zhaotong 657099, China
3
National Center for Materials Service Safety, University of Science and Technology Beijing, Beijing 100083, China
4
Yunnan Research Institute of Highway Science and Technology, Panlong District, Kunming 650051, China
5
School of Environmental, Civil, Agricultural and Mechanical Engineering, University of Georgia, Athens, GA 30602, USA
*
Author to whom correspondence should be addressed.
Processes 2024, 12(4), 800; https://doi.org/10.3390/pr12040800
Submission received: 11 March 2024 / Revised: 9 April 2024 / Accepted: 12 April 2024 / Published: 16 April 2024

Abstract

:
Cement concrete pavements are crucial to urban infrastructure, significantly influencing road safety and environmental sustainability with their anti-skid and noise reduction properties. However, while texturing techniques like transverse grooving have been widely adopted to enhance skid resistance, they may inadvertently increase road noise. This study addressed the critical need to optimize pavement textures to balance improved skid resistance with noise reduction. Tests were conducted to assess the influence of surface texture on skid resistance and noise, exploring the relationship between texture attributes and their performance in these areas. The investigation examined the effects of texture representation methods, mean profile depth, and the high-speed sideway force coefficient (SFC) on noise intensity and pavement skid resistance. The findings revealed that transverse grooves significantly improved the SFC, enhancing skid resistance. In contrast, longitudinal burlap drag, through its micro- and macro-texture adjustments, effectively reduced vibration frequencies between the tire and pavement, thus mitigating noise. Utilizing the TOPSIS multi-objective optimization framework, an optimization model for pavement textures was developed to augment skid resistance and noise reduction at varying speeds. The results indicated that at 60 km/h, an optimal balance of groove width, depth, and spacing yielded superior skid resistance with a minimal noise increase. At 80 km/h, increased groove spacing and depth were shown to effectively decrease noise while maintaining efficient water evacuation. The optimal pavement texture design must consider the specific context, including traffic volume, vehicle types, and operating speeds. This study provides essential guidance for optimizing urban cement concrete pavement textures, aiming to diminish traffic noise and bolster road safety.

1. Introduction

As urbanization intensifies, the functionality and growth of cities increasingly hinge on road traffic efficiency. The surge in traffic volume, coupled with stringent environmental standards, has accentuated the need for diligent urban road functional health monitoring. This includes a thorough assessment and maintenance of road surface conditions, with a keen focus on safety and environmental attributes. Cement concrete pavement, a predominant choice for urban roads, plays a crucial role in this context, particularly due to its anti-skid and noise dampening properties [1,2,3,4]. Optimal skid resistance is vital for ensuring vehicular safety in adverse weather conditions like rain and snow [5,6]. Ensuring optimal skid resistance is paramount to vehicular safety, especially under adverse weather conditions such as rain or snow. Concurrently, the mitigation of road traffic noise, a significant source of urban pollution, is essential for enhancing the urban living experience [7,8].
Grooving techniques, esteemed for their cost-efficiency and simplicity, are prevalently employed to augment the performance of cement concrete pavements. Yet, the efficacy of these techniques in enhancing skid resistance and reducing tire/pavement noise is profoundly influenced by a multitude of factors including groove dimensions, spacing, and orientation, and vehicular attributes like tire patterns, weight, and velocity.
The relationship between pavement performance and its texture characteristics—both macro and micro—is well-established in the realm of skid resistance. Extensive studies leveraging traditional and advanced methodologies have scrutinized the influence of texture dimensions on skid resistance, utilizing tools ranging from the British Pendulum Tester (BPT) and Surface Friction Tester (SFT) to high-speed sideway force coefficient testing vehicles and high-resolution laser scanners. These investigations have elucidated that nuanced adjustments to texture parameters can markedly affect key metrics like the high-speed sideway force coefficient (SFC), mean profile depth (MPD), and British Pendulum Number (BPN). For instance, a texture depth of 2 mm and adequate surface area are pivotal for optimal pavement friction performance and longevity, with a texture wear rate beyond 40% significantly impairing braking skid resistance [9,10,11,12,13,14]. Innovative studies integrating optical scanning, image analyses, and advanced modeling techniques have further refined the precision in predicting skid resistance, offering novel insights into the intricate interplay between texture characteristics and skid resistance [1,15,16,17,18,19,20]. These advancements provide invaluable technical and theoretical underpinnings for the design of effective anti-skid pavements. Globally, research institutions have rigorously evaluated a spectrum of surface textures on experimental road sections, striving to pinpoint the ideal anti-skid texture configuration. In the USA, the focus is on optimizing transverse grooves with parameters like a groove width of 2.3–3.2 mm, depth of 3.2–4 mm, and spacing of 12–25 mm that significantly boost friction coefficients and safety [8,21,22,23]. Denmark employs grooving or embossing techniques coupled with seasonal treatments to elevate skid resistance [24]. Japan advocates for specific groove configurations on airport pavements to ensure safety, while in China, specific groove patterns are recommended to bolster lateral anti-skid performance [25,26,27]. These comprehensive studies offer substantial practical insights and technical recommendations for the crafting of anti-skid pavement designs.
In noise reduction performance, the On-Board Sound Intensity (OBSI) method is commonly used for noise level assessments. Cement pavement noise levels increase with macro-texture depth, but under specific conditions, a shallower texture depth (e.g., 0.8 mm) can effectively reduce noise. Additionally, increased pavement texture complexity and International Roughness Index (IRI) also raise noise levels [28,29,30]. New three-dimensional pavement texture metrics have proven superior in noise evaluation for unevenly textured surfaces. Moreover, texture-based noise models, such as the Statistical Energy Analysis (SEA) and Vibration Model (VM) algorithms, have enhanced our understanding of the relationship between texture level and noise frequency, with digital image processing revealing the critical role of micro-texture in noise reduction [31,32,33]. Material-wise, rubberized pavements show significant potential in reducing high-frequency noise. Comparisons indicate that small-particle exposed-aggregate concrete pavements outperform transverse grooved surfaces in noise reduction, demonstrating that precise texture spacing and depth adjustments can effectively lower noise in specific frequency bands [27,34,35,36,37,38]. Regarding transverse grooves’ impact on noise, the spacing between grooves has the most significant correlation with noise levels. Uniformly spaced transverse grooves create harsh tonal peaks, whereas non-uniformly spaced grooves can effectively eliminate these peaks, although the overall noise may be the same or increased. Combining angled and varied spacing grooves can effectively eliminate tonal peaks and reduce overall noise, but angled grooves introduce construction challenges [39,40,41,42,43,44].
There remains a relatively narrow focus within the research community on the collective impact of pavement texture on anti-skid efficiency and noise reduction. Recent researches have utilized clustering analyses to classify pavement characteristics, advocating for benchmarks such as a minimum high-speed sideway force coefficient (SFC) of 50 for tunnel pavements to safeguard against skidding, and a noise threshold of 105 dB to preserve a comfortable environment [45]. Investigations into assorted pavement designs have highlighted the benefits of wider groove spacing—extending up to 25 cm—not only for its efficacy in curtailing pumping noise but also in averting lateral vehicular slippage, thus endorsing it as a sound methodological choice for cement concrete pavements in tunnel sections of highways [46]. Although there has been a concerted effort to unravel the interplay between pavement textures and their skid-resistant and noise-dampening properties, research that meticulously examines the balance between enhancing skid resistance and suppressing noise is sparse. This observation points to an existing gap in research—an oversight in the comprehensive optimization of pavement texture design, which is pivotal for advancing the field.
Leveraging the existing research, this study conducted an in-depth analysis of how textures affect pavement anti-skid properties and noise reduction capabilities. Section 2 outlines the field experiments that examined both the grooving and burlap drag texture parameters, in addition to key pavement performance metrics such as mean profile depth, high-speed sideway force coefficient, and tire/pavement noise levels. In Section 3, the focus shifts to delineating texture characteristics, followed by an exploration of the relationship between grooved and burlap drag textures and the pavement’s skid resistance. 
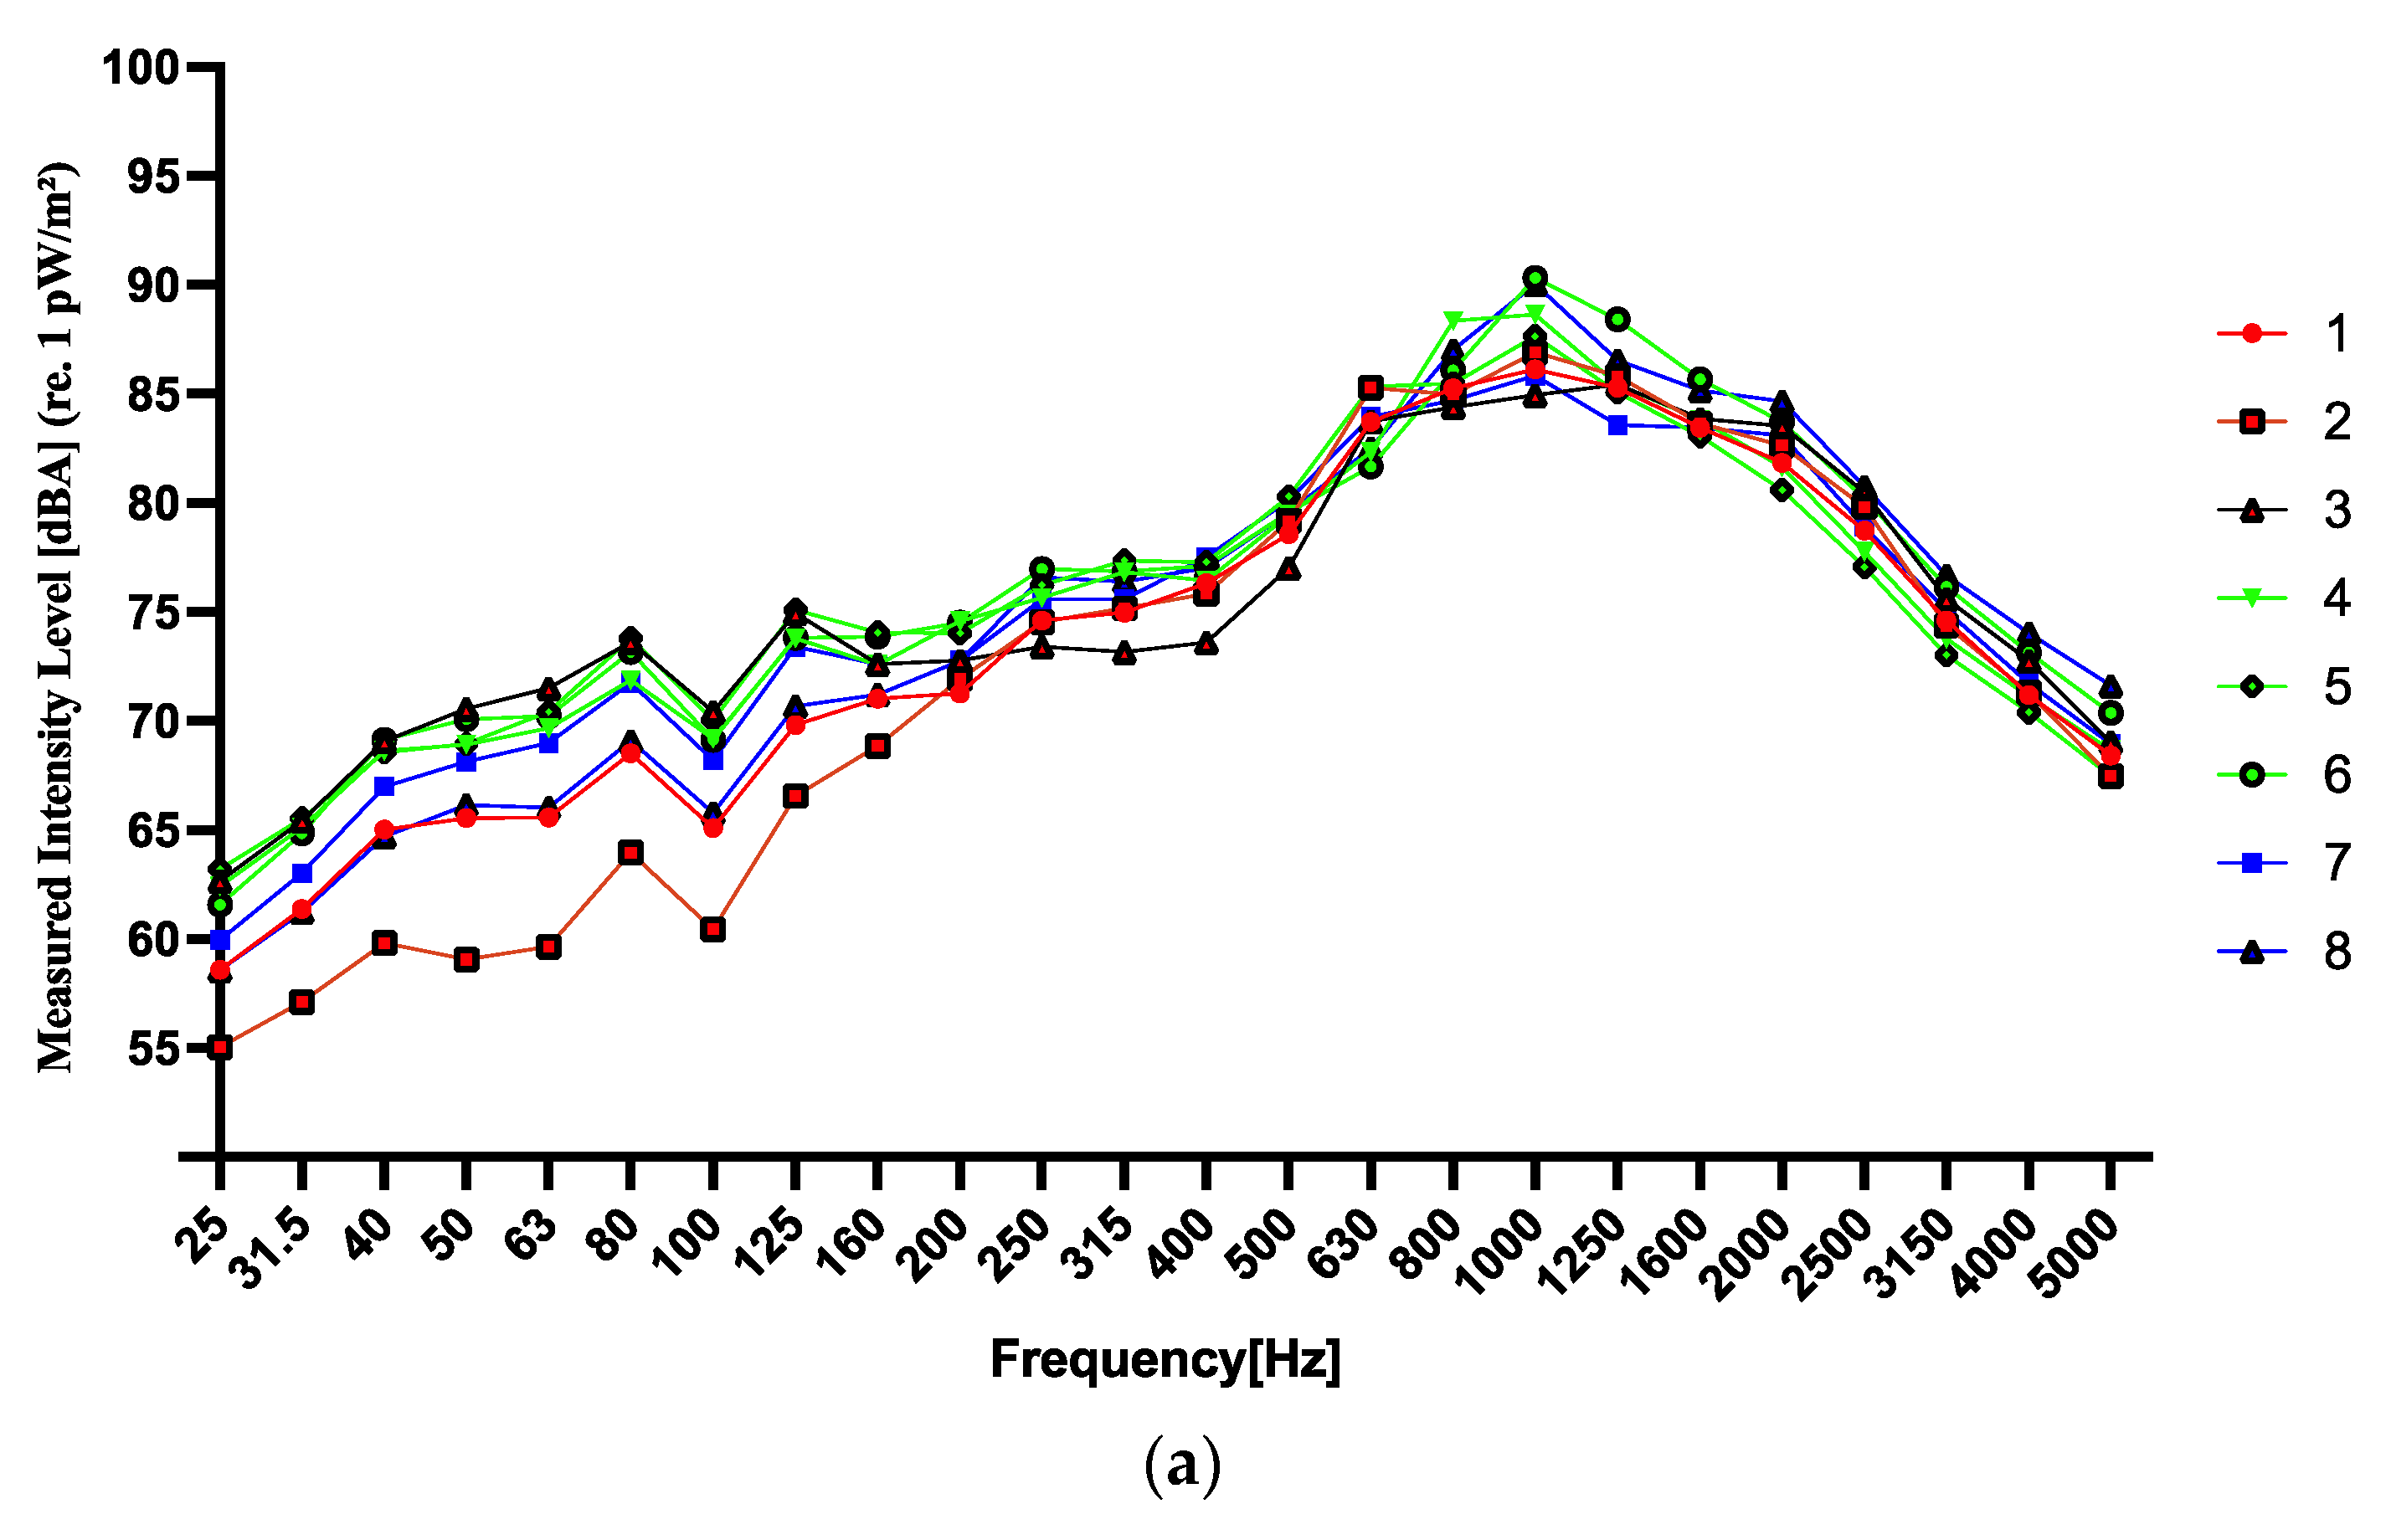
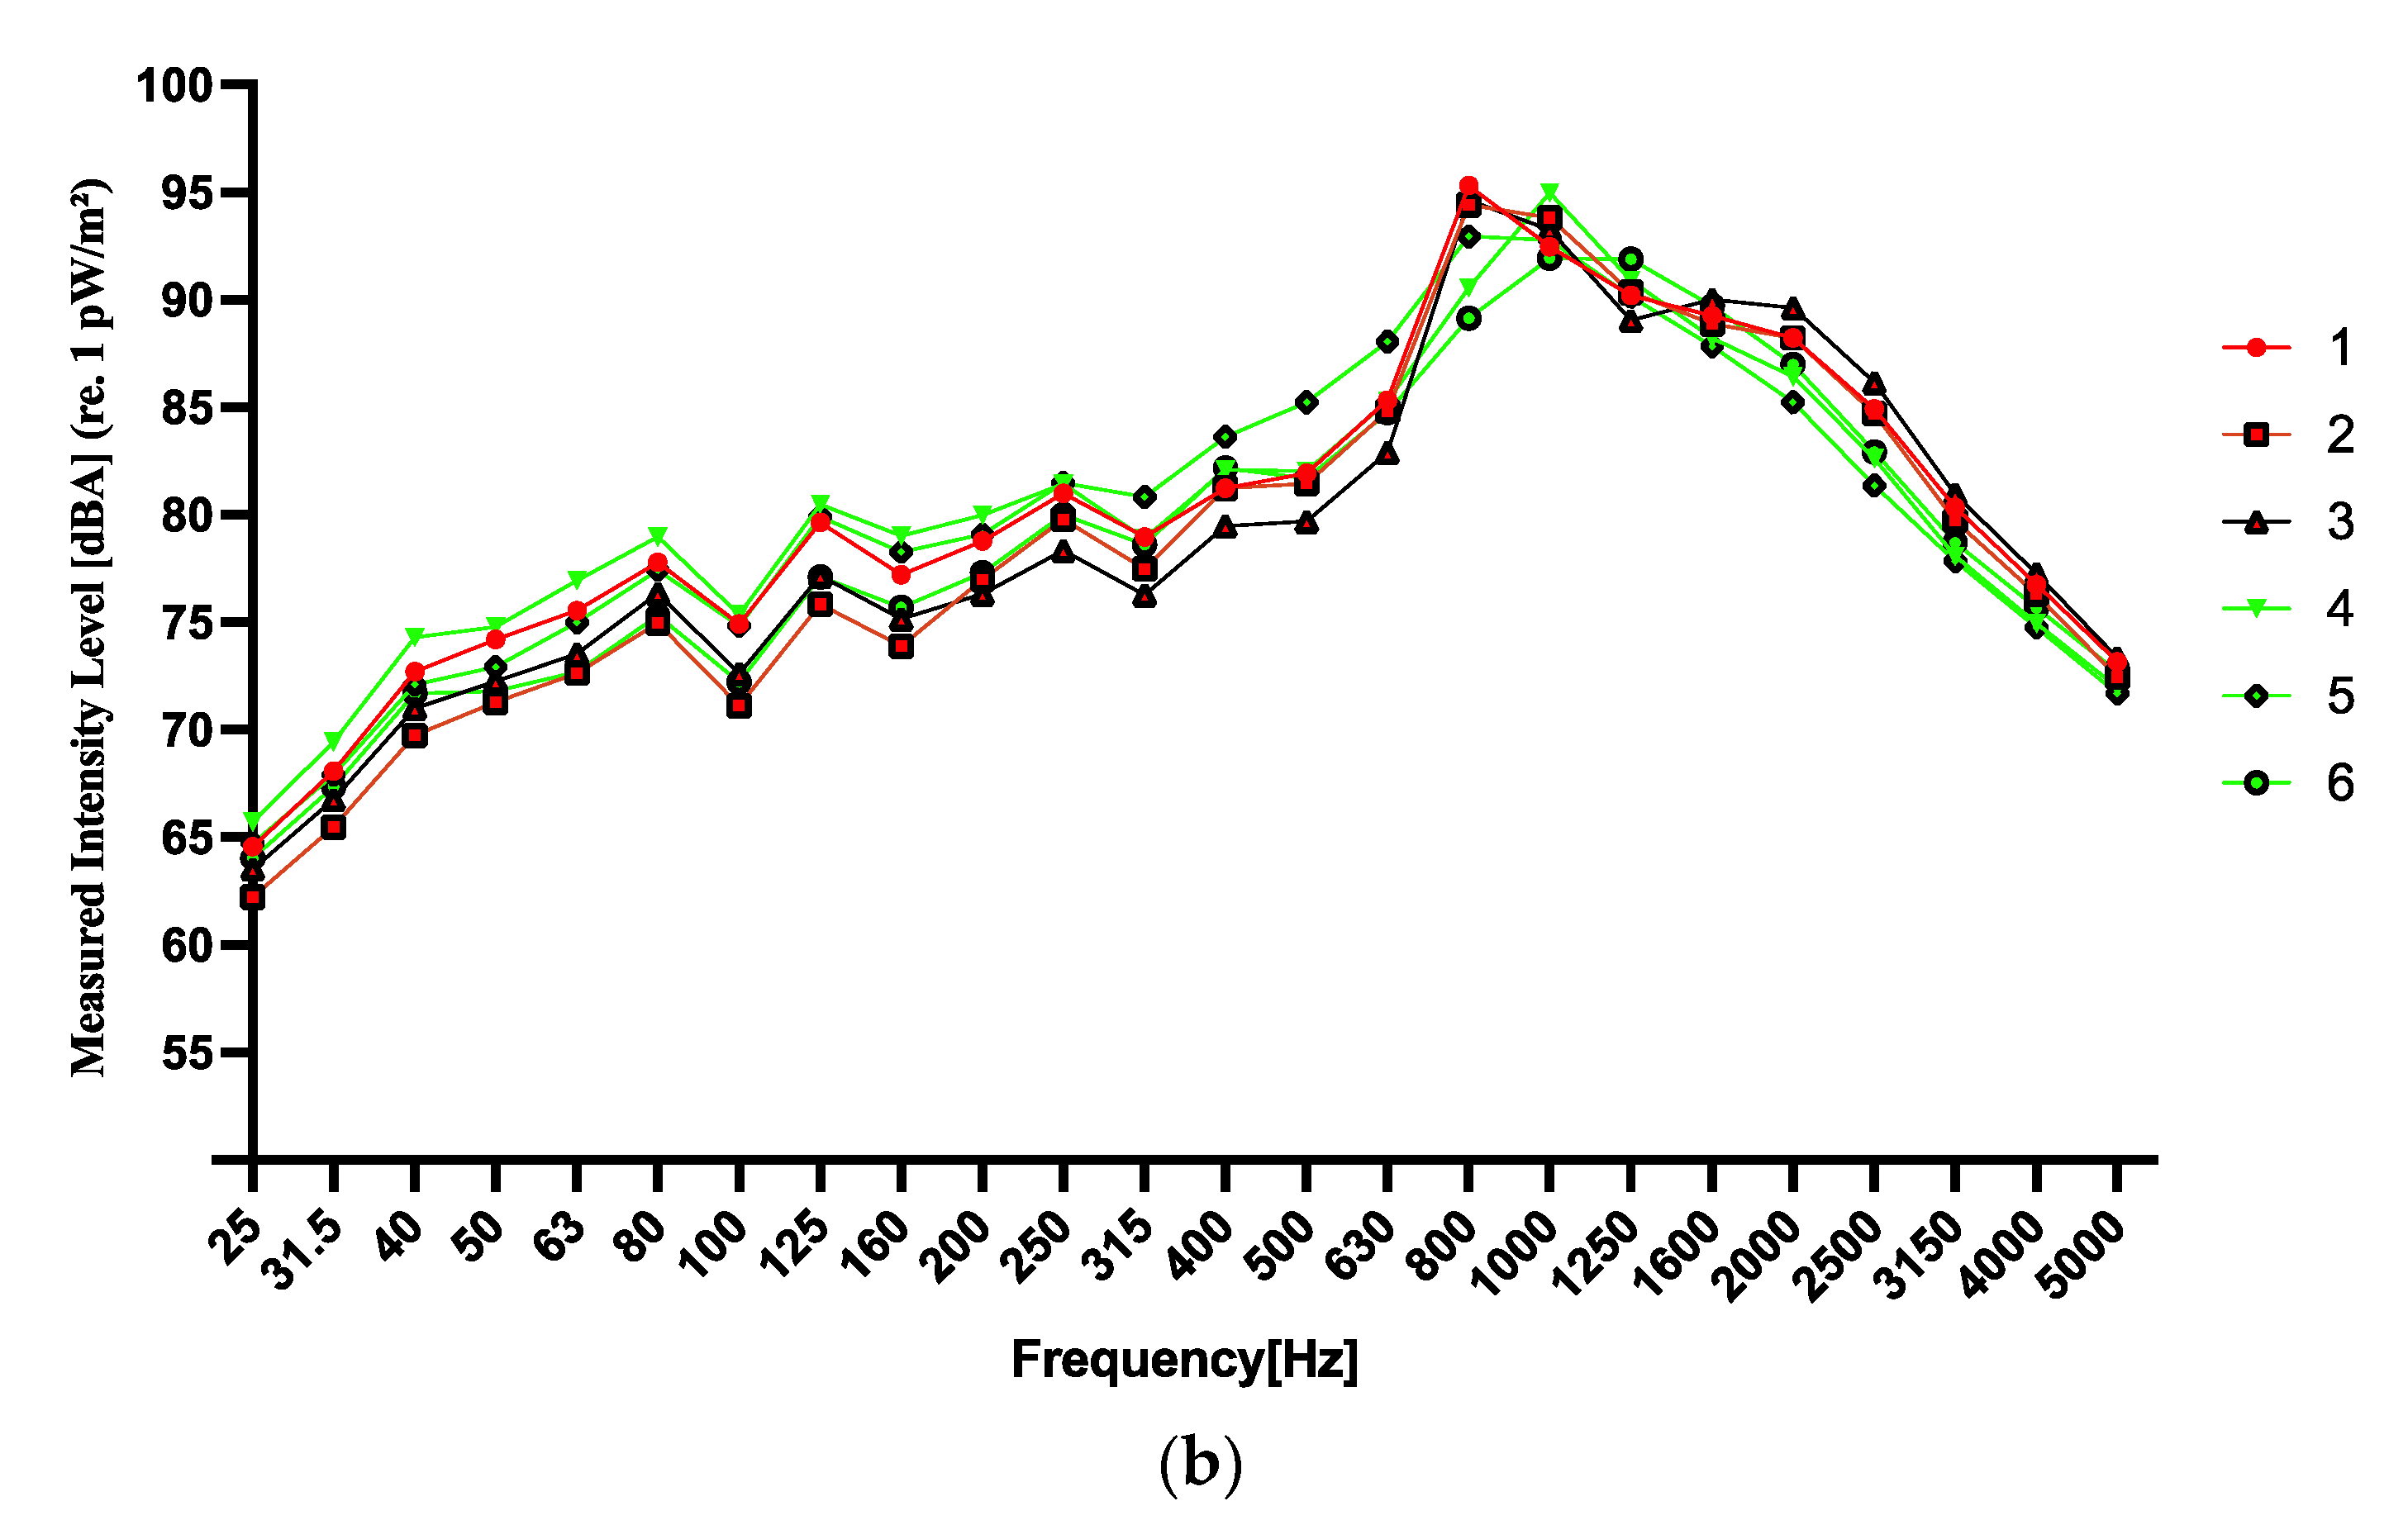
Section 4 ventures into the realm of tire–pavement noise characteristics, analyzing the impact of various texture characteristics on noise levels associated with pavements. Utilizing the TOPSIS multi-objective optimization approach in Section 5, the study assessed eight experimental scenarios on the test sections, balancing considerations of skid resistance and noise reduction, to identify optimal texture configurations for speeds of 60 km/h and 80 km/h. This research aimed to pinpoint the ideal pavement texture design that maximizes overall performance, thereby enhancing driving safety and minimizing noise pollution.

2. Tire/Pavement Noise and Skid Resistance Assessment

2.1. Experimental Setup

Field evaluations were conducted on a cement concrete pavement in Zhaotong City, Yunnan Province, spanning a 28.7 km stretch of open road. The surface texture was engineered using two distinct methods: transverse grooving and longitudinal burlap dragging. The grooving involved the use of an electric machine to cut into the concrete, creating grooves with predefined dimensions, thereby modifying the surface texture. The dragging technique employed a steel frame to pull double-layered coarse burlap over the fresh concrete, with the fabric’s friction against the soft surface generating a unique texture. The processes are depicted in Figure 1.
Research by the Federal Highway Administration in the United States indicates that the depth, width, spacing, and orientation of transverse grooves are crucial factors influencing tire/pavement noise. Among these, groove spacing exhibits the strongest correlation with noise intensity levels [39,40]. To corroborate these findings, the experiment included sections with three variations of transverse grooves at uniform spacings of 13/19/25 mm, two variations with non-uniform spacings averaging 17 mm and 28.8 mm, and several conditions for longitudinal burlap drag depths. Each design spanned a 200 m section. Figure 2 presents the test site surface conditions.

2.2. Test Methodology

2.2.1. Pavement Texture

To assess and characterize the surface texture of cement concrete pavements, this study employed the HC-CK103 crack measuring instrument from HICHANCE (Beijing, China), which can capture intricate texture images, as illustrated in Figure 3a. It uses an optical lens to magnify the crack, and combines built-in image processing technology to display the crack width on the instrument’s scale dial. This device boasts a precision of 0.01 mm and a measurement range from 0 to 10 mm, as shown in Figure 3b. For attributes exceeding the HC-CK103’s measurement capabilities, particularly concerning macro-texture such as groove spacing, a millimeter-scale ruler was utilized for the measurements.

2.2.2. Mean Profile Depth

An RTM-type vehicle-mounted intelligent road detection system, developed by Wuhan University, was utilized to evaluate the road’s evenness and mean profile depth, as depicted in Figure 4. Testing was conducted at a speed of 50 km/h, with each 100 m segment considered as a separate detection unit for mean profile depth calculations.

2.2.3. Tire/Pavement Noise

To ascertain tire/pavement noise on cement concrete surfaces, the experiment harnessed the OBSI noise testing system developed by the AVEC Corporation in the USA. This system comprises two arrays, each with two GRAS 26CA CCP Intensity Probes, strategically placed near the tire/pavement interface to precisely capture noise produced during movement, while isolating other noise sources. These probes can accurately gather noise data across a frequency spectrum of 2.5 Hz–200 kHz, featuring a noise level of 1.8 µV Gain and a gain of −0.30 dB. The system’s configuration is portrayed in Figure 5, with the captured noise signals being recorded at 26,500 Hz by the NI cDAQ-9171 and instantaneously relayed to the AVEC’s OBSI Software (https://www.avec-engineering.com/OBSI.html, accessed on 9 March 2024).
For this study, a Changan CS75 vehicle equipped with YOKOHAMA 225/65R17 tires was chosen, conforming to ASTM F 2493 specifications. Testing encompassed various pavement texture types, striving to maintain speeds as close to 60 km/h and 80 km/h as possible over a 200 m travel distance. The procedures and conditions were aligned with the AASHTO T 360-16 standard [47], ensuring data reliability through 2–3 repeated tests on most pavement surfaces at consistent speeds.

2.2.4. High-Speed Sideway Force Coefficient

The MCY-1-type pavement friction coefficient testing system was deployed to gauge the lateral friction coefficient of the road sections under study, as displayed in Figure 6. Throughout the testing, the test tire’s static vertical load was consistently held at 2000 ± 20 N, with the standard tire pressure maintained at 3.5 ± 0.2 kg/ c m 2 . The vehicle traversed the pavement at a steady 50 km/h, performing continuous measurements over the pavement where each 100 m segment was treated as an individual evaluation unit.

3. Pavement Texture Characteristics and Skid Resistance Analysis

3.1. Texture Characteristic Description

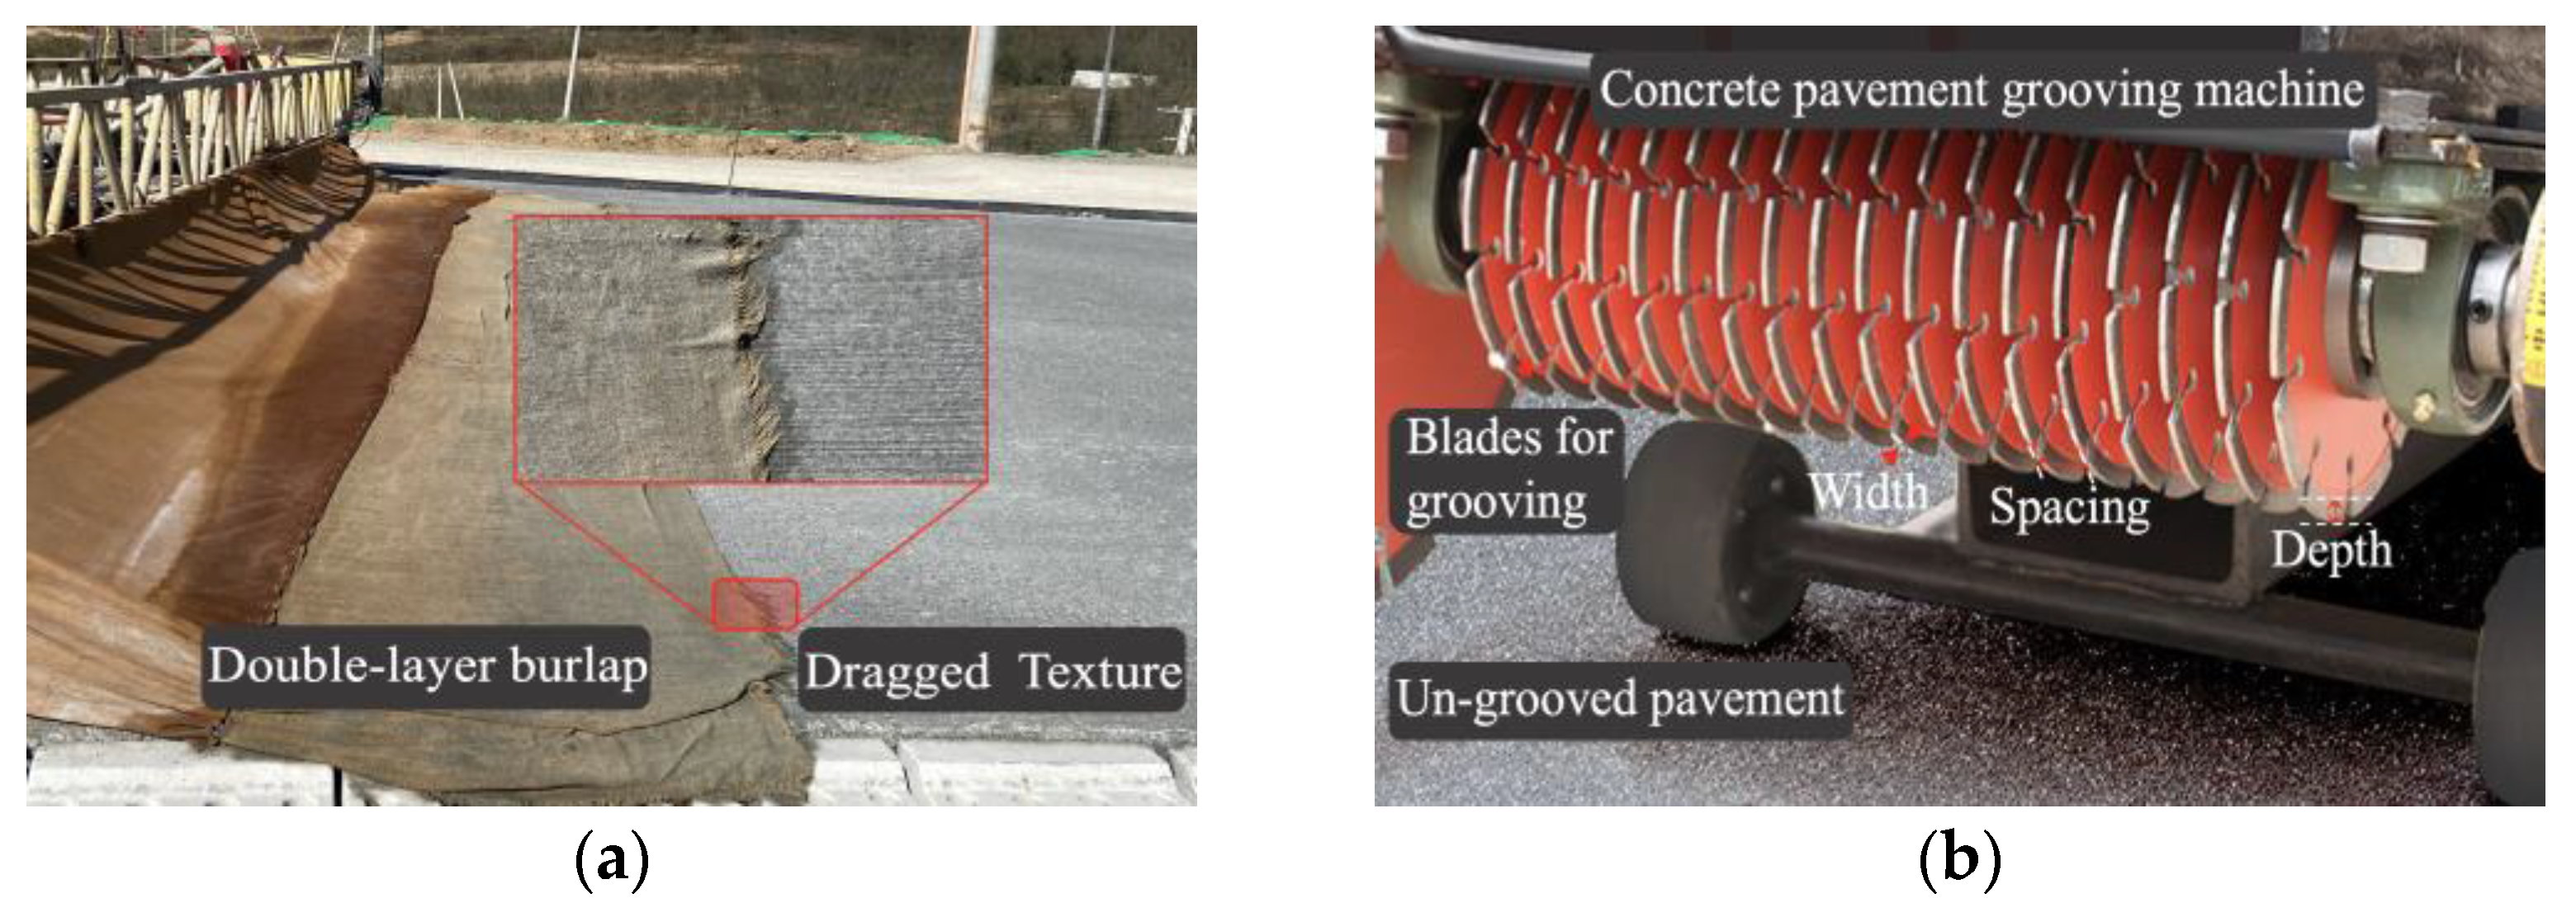
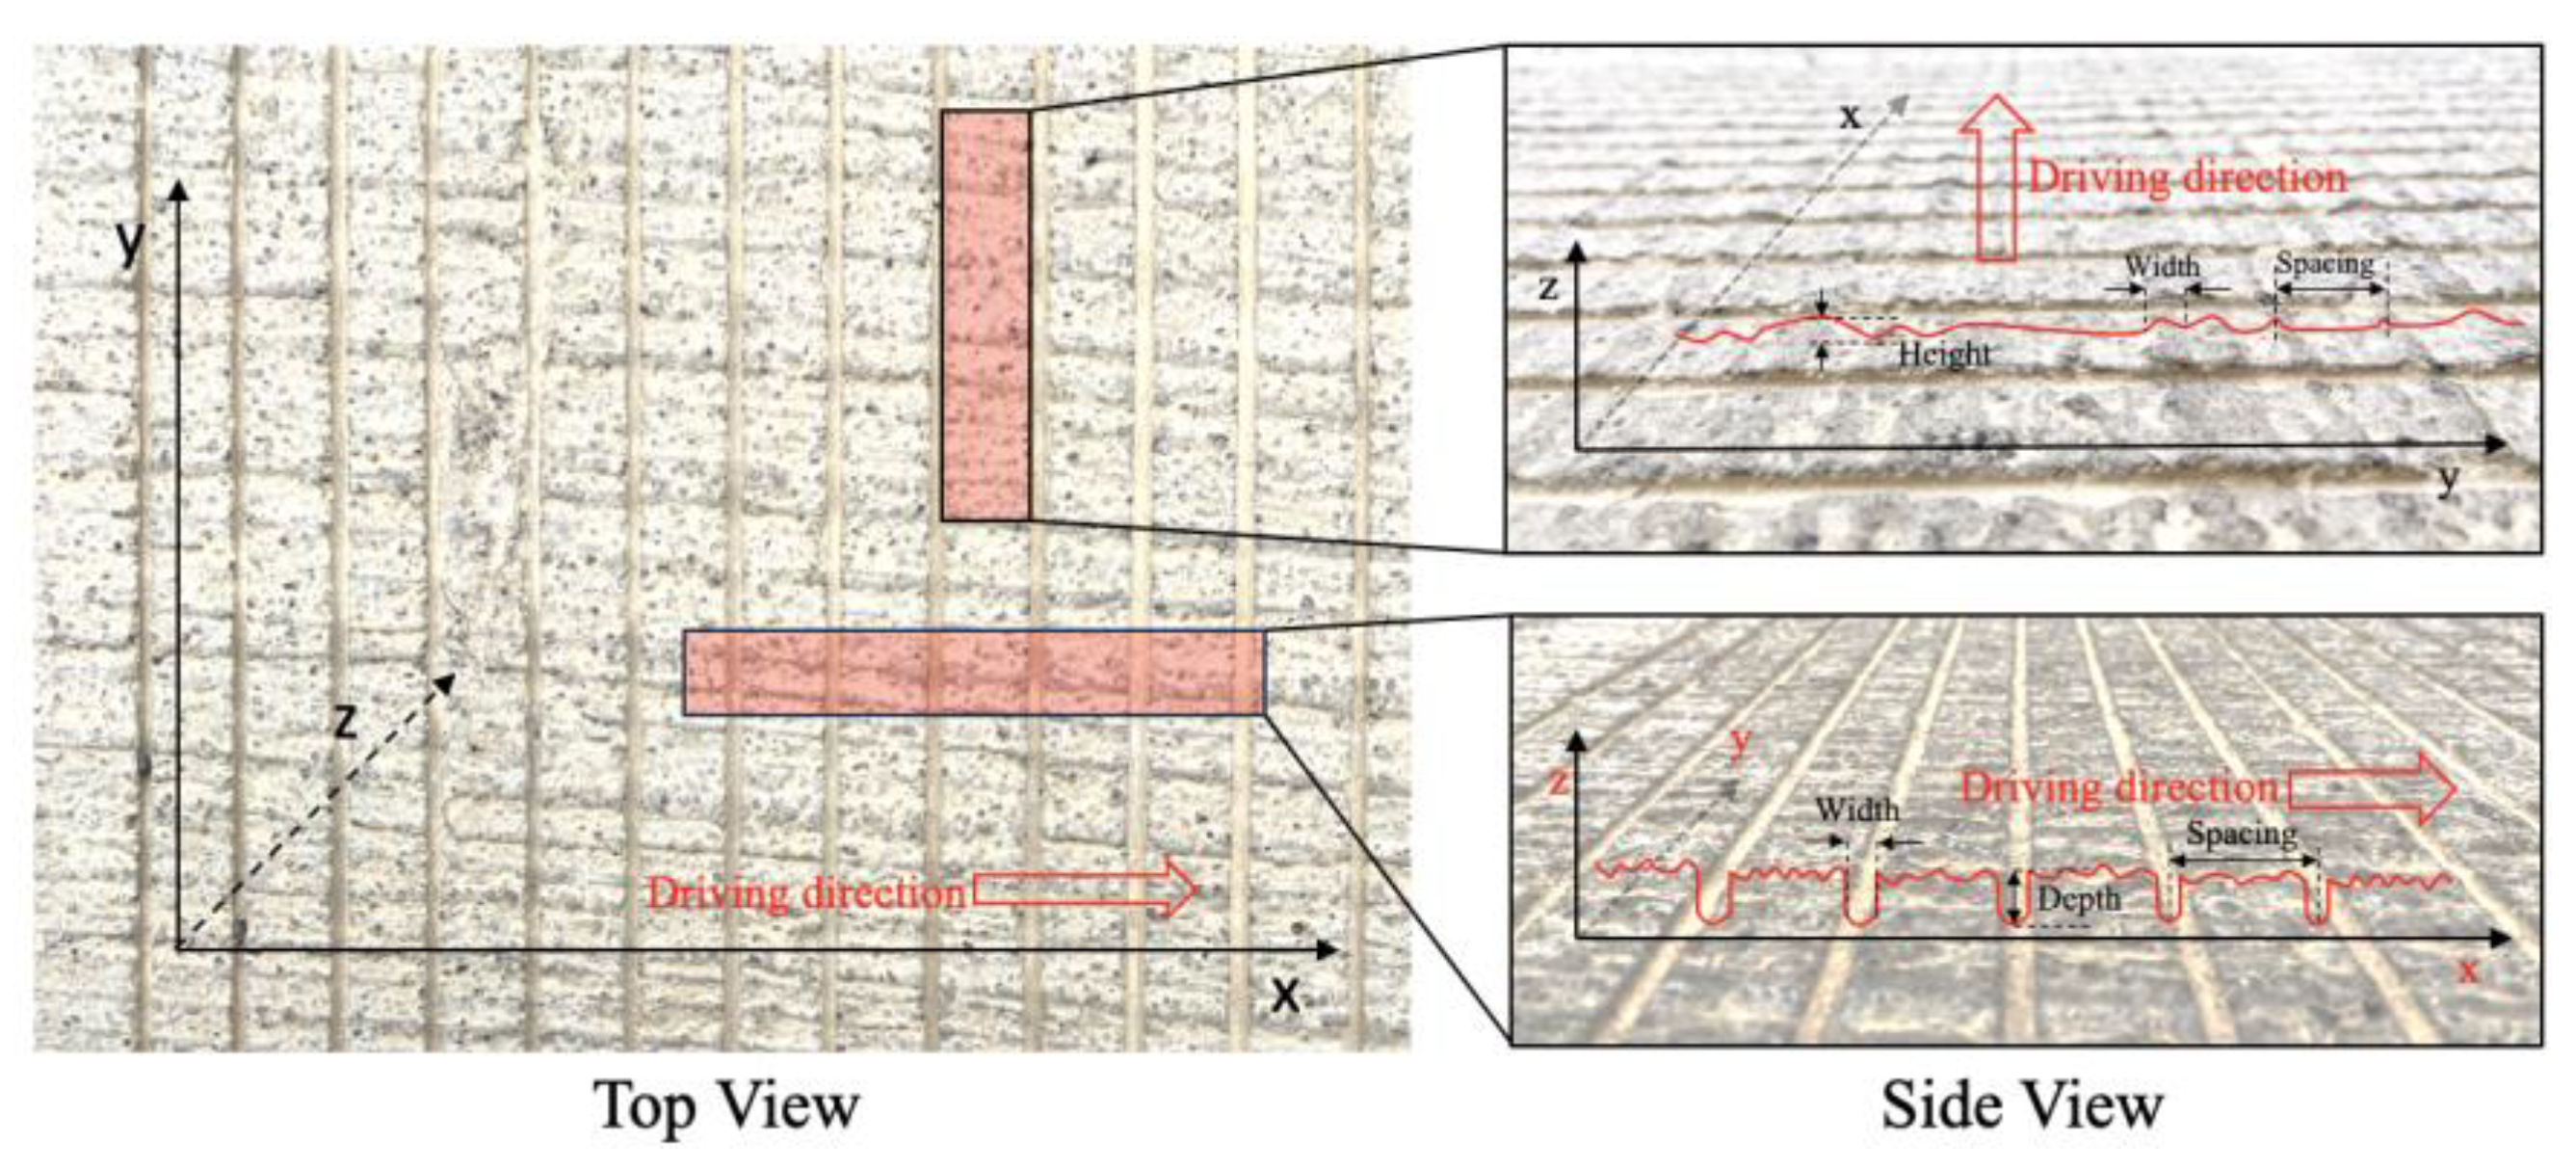
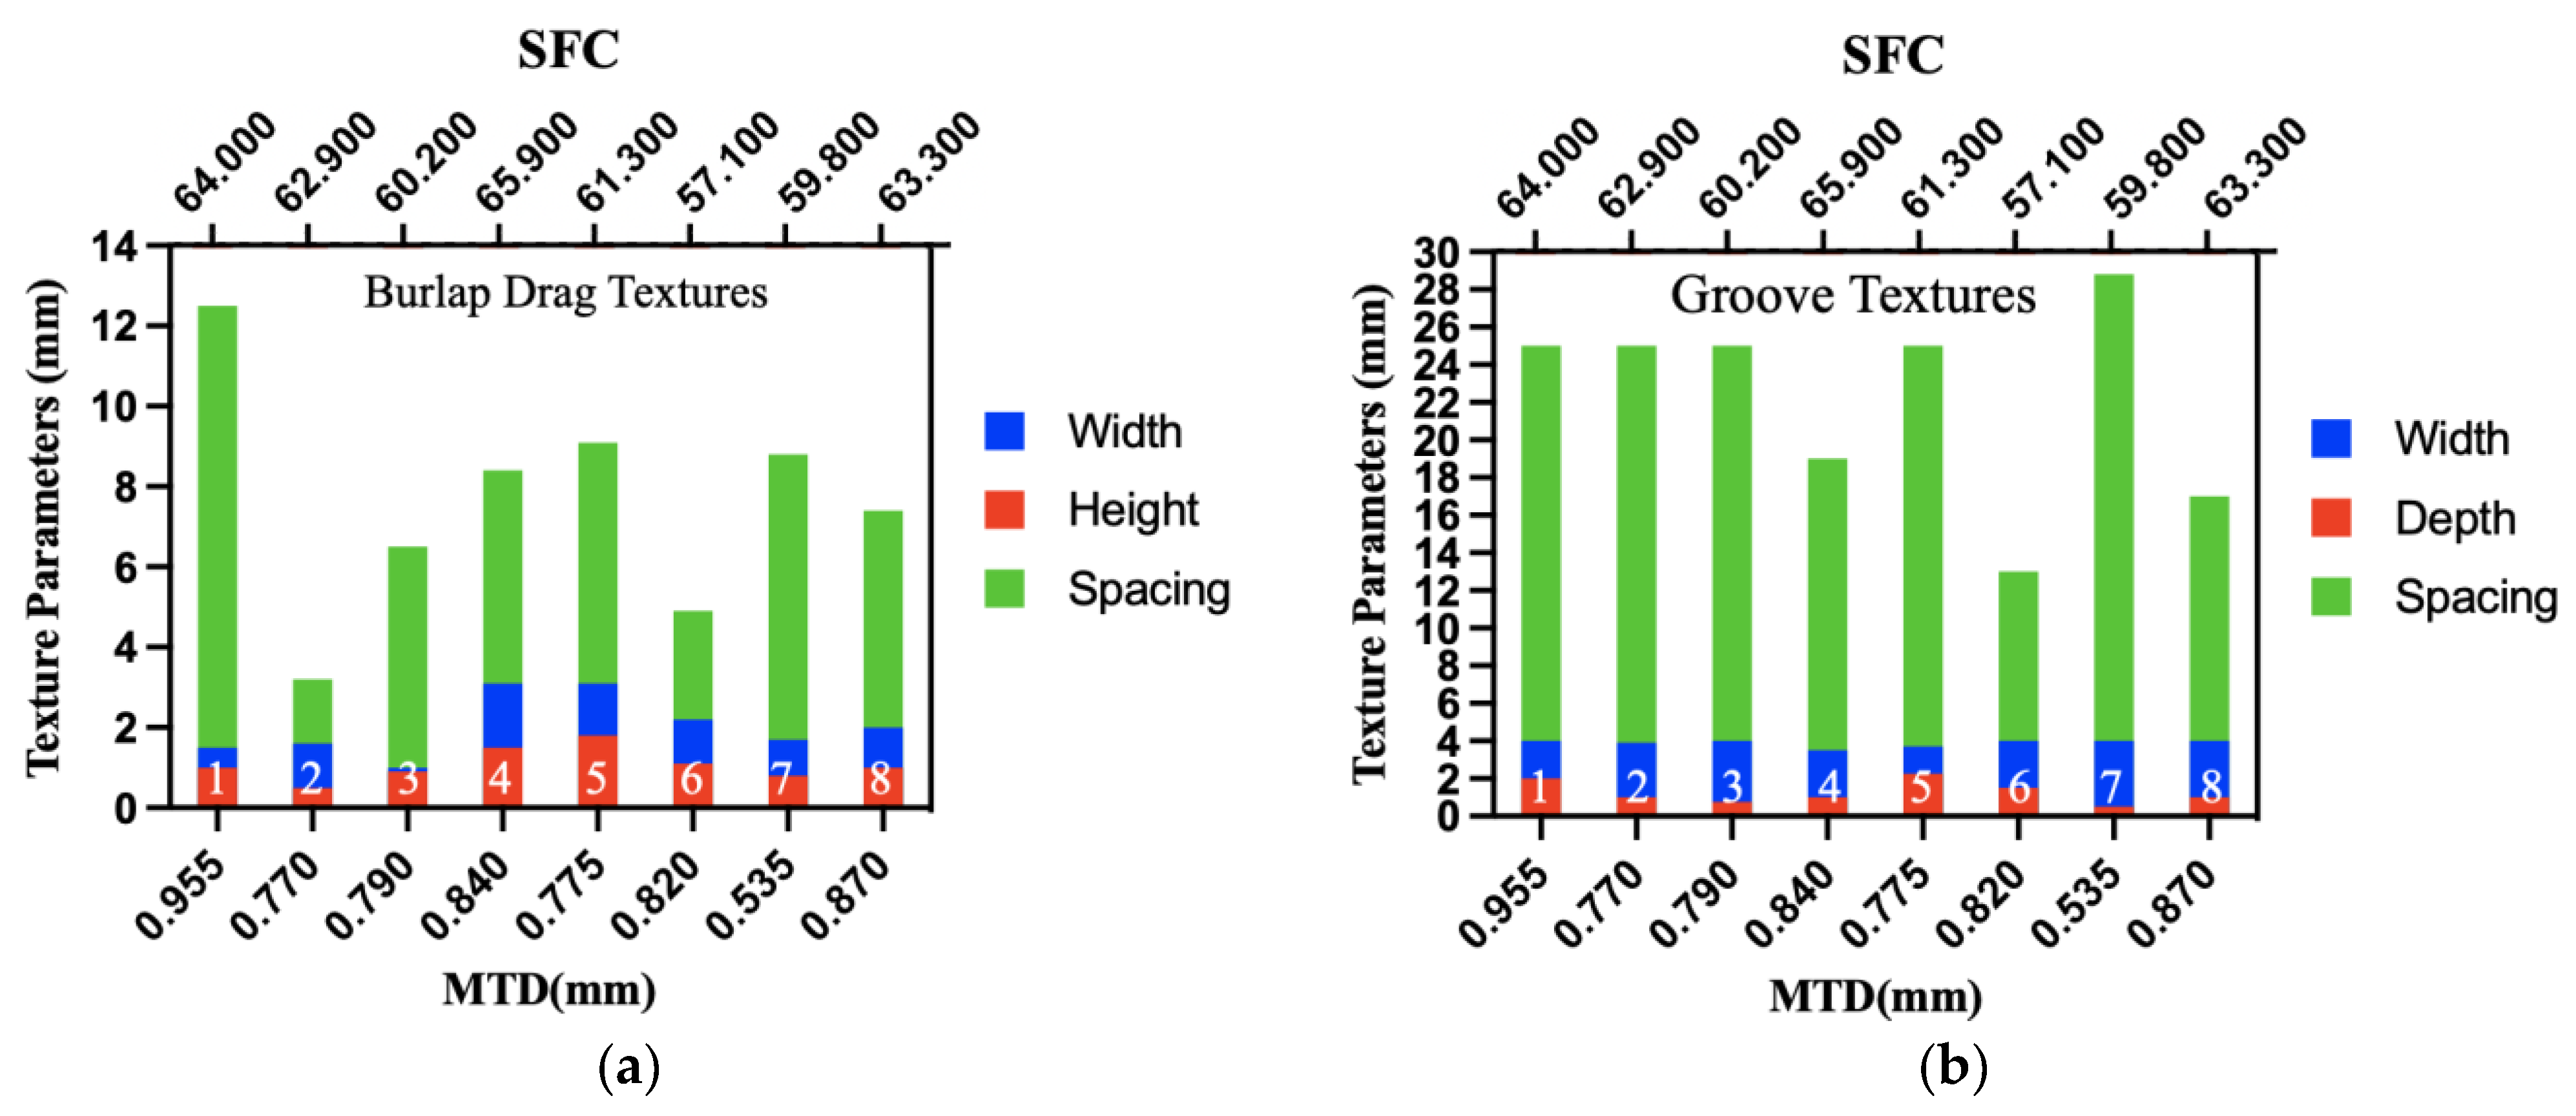
Different texture techniques generate distinct pavement surface profiles. Grooving results in undulations perpendicular to the travel direction, creating longitudinal texture contour curves. Conversely, burlap dragging yields textures parallel to the travel direction, resulting in transverse contour curves, as illustrated in Figure 7. The interweaving of textures from burlap dragging and grooving sketches a grid-like design on the pavement. To conduct a comprehensive evaluation, this study identified three critical parameters, groove width, groove depth/height, and groove spacing, which were measured for various grooved texture types.
Construction process variability leads to fluctuations in actual groove width, depth, and spacing. Groove textures, produced through mechanical cutting, exhibit minimal variations. Therefore, after multiple point measurements, mean values were computed to represent each condition’s texture characteristic values. Table 1 details the groove texture parameters for the evaluated pavement sites.
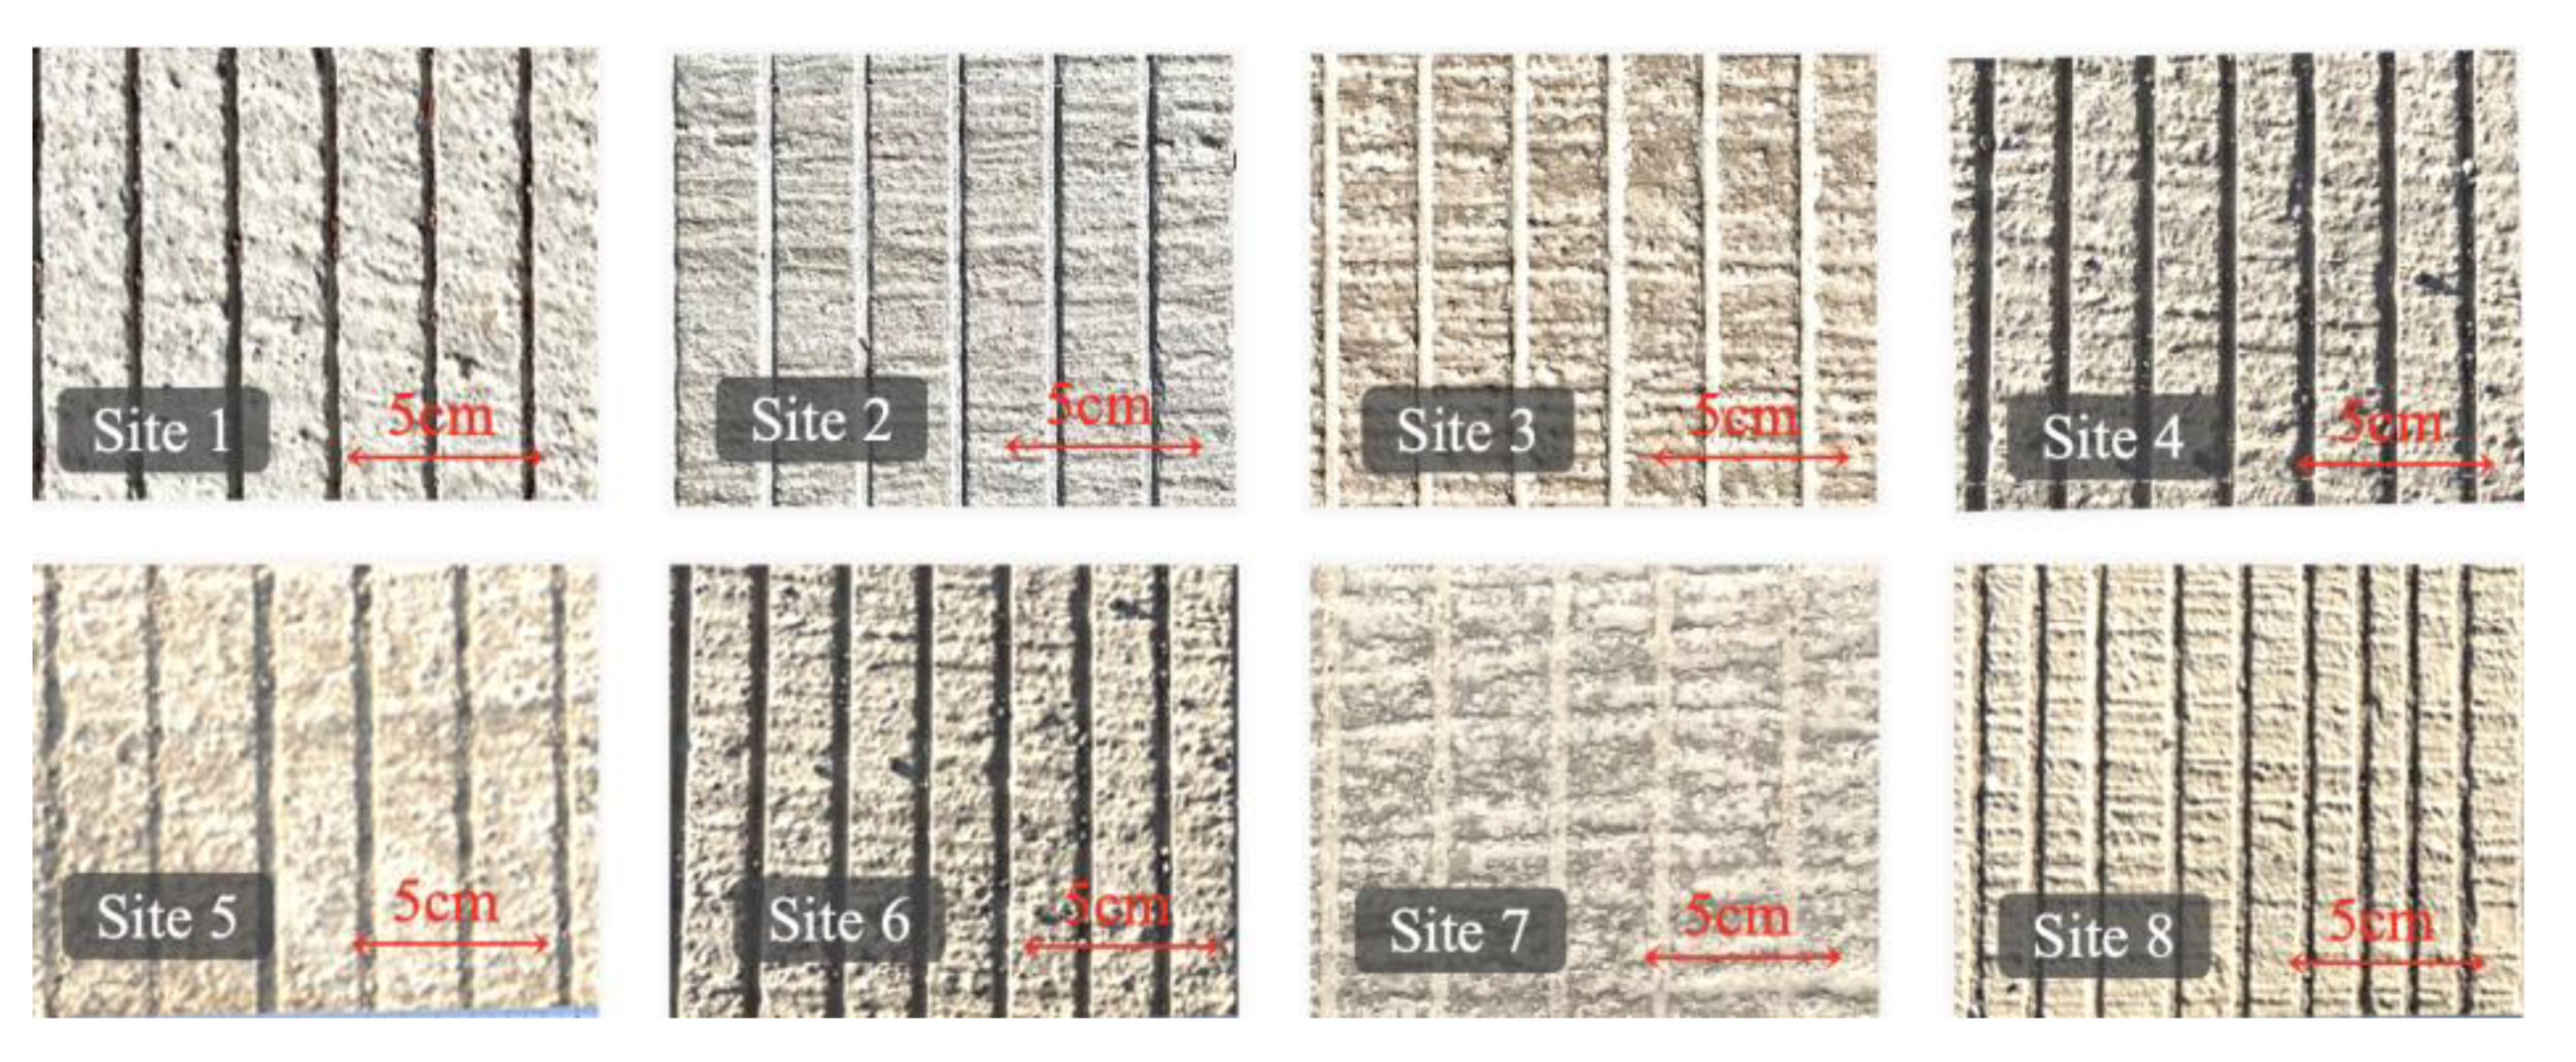
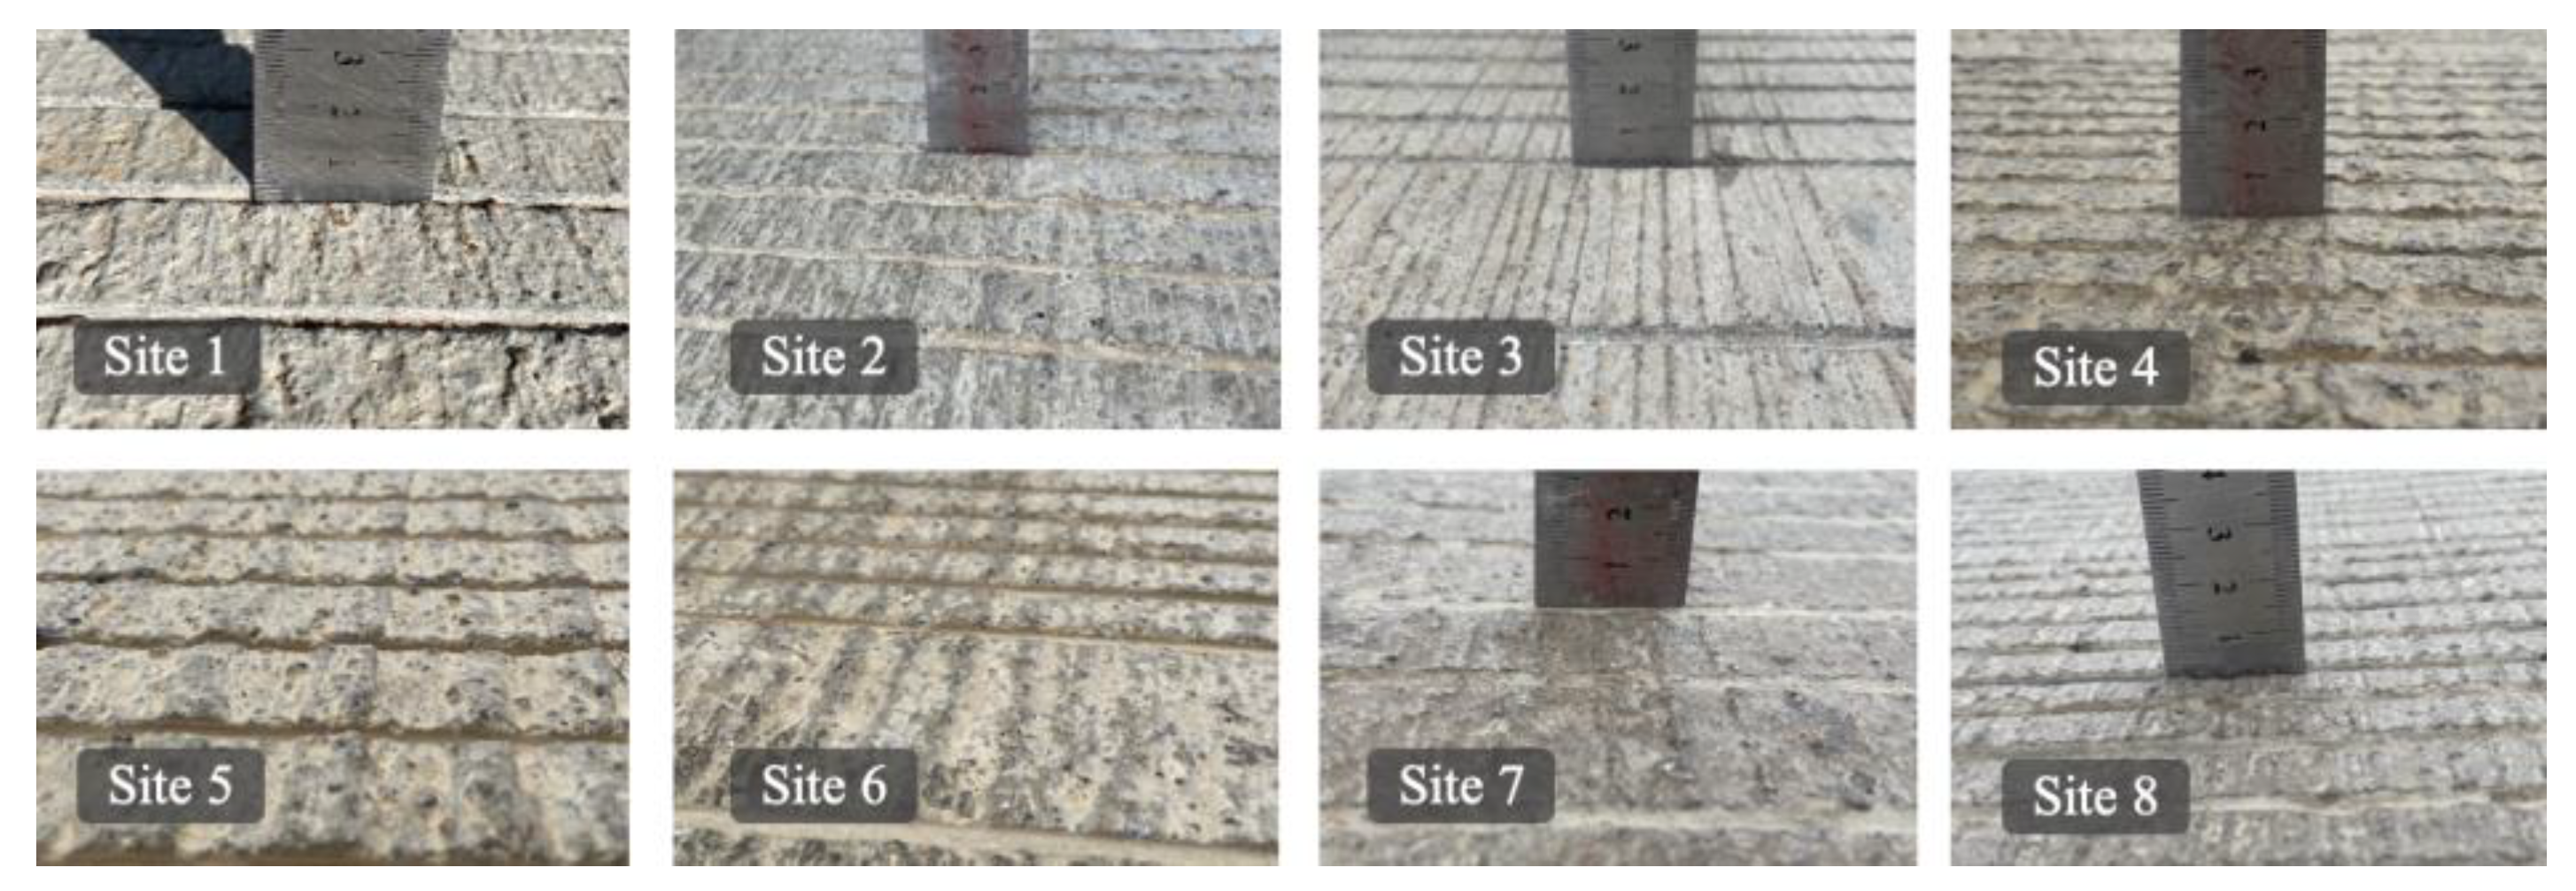
Due to the predominant formation of raised grooves in burlap dragging, this study utilized the groove height, width, and spacing as evaluation metrics, akin to the system used for grooved textures. Repeated measurements of the burlap drag texture in specific zones gathered extensive data to capture the variability of burlap drag textures under differing conditions. Figure 8 displays the burlap drag textures on eight pavement types, with Table 2 listing the burlap drag texture parameters at these sites.

3.2. Analysis of Mean Texture Depth

The Mean Texture Depth (MTD) serves as a critical measure of the pavement’s texture depth, illustrating the surface’s roughness and its substantial impact on the tire–pavement interactions and traction. Generally, a higher MTD signifies enhanced water drainage and improved skid resistance. The MTD values for different pavement texture sites are listed in Table 3.
The observed variation in MTD values across test sites 1 to 8 (ranging from 0.535 mm to 0.955 mm) underscores the influence of texture parameters on the pavement’s water drainage and grip. Notably, broader and deeper grooves contributed to superior water displacement, likely resulting in increased MTD values. For instance, site 1, characterized by a deeper groove (2 mm) and wider width (4.0 mm), aligns with the highest MTD value (0.955 mm), suggesting effective water drainage and potential for enhanced skid resistance. Conversely, site 7 exhibited a lower MTD value (0.535 mm) due to its shallower groove depth (0.5 mm), despite a comparable groove width (4.0 mm), indicating reduced drainage efficiency. Additionally, the texturing technique, including equal and unequal transverse spacing, plays a role in determining MTD values, with uneven spacing potentially affecting water flow and, consequently, MTD values.

3.3. Analysis of High-Speed Sideway Force Coefficient

A greater SFC value denotes superior skid resistance, providing more effective lateral grip, minimizing vehicle lateral movement, and thereby boosting driving stability and safety. The SFC values were continuously assessed at each test site, where each segment of 100 m was delineated as an individual unit. Two such units were established, and their respective SFC values were computed as an average. The SFC values for the various sites are presented in Table 4.
The findings suggest that, in grooved textures, an increased groove width or depth typically correlates with enhanced friction points and improved water removal capability, contributing to higher SFC values. Sites 1 and 5, with their wider and deeper grooves, exhibited higher SFC values, indicating strong lateral traction. Interestingly, site 4 showed the highest SFC despite site 6 having the densest texture, indicating that optimal groove spacing can enhance the contact area between the tires and pavement, thus boosting the SFC. Comparatively, sites with uniform texture spacing, like sites 4 and 8 or 3 and 7, demonstrated higher SFC values, presumably due to the consistent grip provided by even spacing, which helps stabilize the SFC values. Variable spacing may result in inconsistent lateral grip, potentially impacting SFC stability.
In the context of burlap drag textures, variations in texture parameters significantly affected the contact nuances between the pavement and tires. While wider grooves might reduce local contact areas, an optimal width can elevate friction edges, thus improving the SFC. Sites 4 and 5, with their broader grooves, are likely to offer enhanced edge friction, influencing their SFC values. Groove spacing impacts texture density and continuity; tighter spacing in burlap drag textures could provide more continuous friction edges, aiding in lateral grip. However, excessively close spacing might lead to friction saturation, failing to provide additional lateral traction.

3.4. Correlation Analysis

To quantify the strength of the association between the parameters of grooved and burlap drag textures and the skid resistance indicators of pavement, a correlation analysis was performed, relating these textures to MTD and SFC values. Table 5 displays the correlation coefficients, and Figure 9 illustrates the relationships between the various texture parameters and MTD and the SFC at 8 test sites.
The analysis indicated that groove textures significantly influenced MTD and the SFC, underscoring the importance of texture dimensions on pavement performance. The depth of the groove emerged as a critical factor affecting MTD, whereas the width predominantly influenced the SFC. The burlap drag textures exhibited a subtler impact, likely affecting the micro-texture characteristics rather than macro-texture attributes.
A strong positive correlation was observed between groove depth and MTD (0.5397), suggesting that deeper grooves result in greater texture depth, as depicted in Figure 9b. Conversely, the relationship between groove depth and the SFC was minimal (0.0504), indicating that depth alone does not directly impact surface friction. Groove width negatively correlated with MTD (−0.0912), likely because wider grooves reduce the per-unit-area texture, diminishing the texture depth. Moreover, wider grooves decreased the effective contact area between pavement and tire, resulting in a notable negative correlation with the SFC (−0.5453). Groove spacing influenced texture continuity and density, leading to a negative correlation with MTD (−0.4835). As the spacing increased, the SFC first rose and then declined, suggesting that optimal spacing can enhance tire–pavement contact but after becoming excessively large, it causes uneven contact areas.
In burlap drag textures, the positive correlations of groove width, height, and spacing with MTD (0.0717, 0.2161, 0.2128) were relatively weak, as illustrated in Table 5, reflecting the limited contribution of these smaller characteristic sizes to the overall texture depth. The positive correlations of groove width, height, and spacing with the SFC (0.2516, 0.1497, 0.3669) indicate that these parameters notably influence the SFC, possibly by affecting the texture density and distribution, thereby enhancing the micro-contact points between the tires and pavement.

4. Pavement Texture Characteristics and Noise Reduction Performance Analysis

4.1. Tire–Pavement Noise Characterization

Tire–pavement noise was recorded at 60 km/h and 80 km/h using the On-Board Sound Intensity (OBSI) noise testing system, which provided sound pressure amplitude–time curves for the tire–pavement interface. Time-domain signals were subjected to Fast Fourier Transform, as delineated in Equation (1) [48], to calculate the A-weighted sound level (overall level OA) for the test duration. The OA value was determined following the sound pressure level definition, yielding the aggregate sound pressure level for the time-domain signal, as expressed in Equation (2) [48], indicative of the peak noise intensity level for the roadway segment under study, as detailed in Table 6. For safety considerations, data at the higher speed of 80 km/h were not collected.
X k = n = 0 N 1 x n e i 2 π k n N       k = 0 , , N 1
L A e q = 10 l g 1 t 2 t 1 t 1 t 2 P A 2 t P 0 2 d t d B A
where P A ( t ) —instantaneous A-weighted sound pressure level of the noise model in pascals (Pa); P 0 —reference sound pressure in micropascals ( μ Pa), with a reference sound pressure of 20 μ Pa; and t 2 t 1 —interval of measurement time period T in seconds (s).
To dissect the influence of various frequency components on the overall noise, Fast Fourier Transform (FFT) and 1/3 octave band analysis were performed on the gathered time-domain signals. This analysis elucidated the distribution of tire–pavement noise across the frequency spectrum under different conditions, as shown by curves 1 to 8 in Figure 10a for 60 km/h and 1 to 6 in Figure 10b for 80 km/h.
The test findings revealed that at 60 km/h, sites 7 and 8 exhibited the highest tire–pavement noise levels, while sites 1 and 3 had the lowest levels. An analysis of their burlap drag and grooving parameters showed that sites 7 and 8 featured non-uniformly spaced grooves, whereas sites 1 and 3 had uniformly spaced burlap textures, which were more consistent overall, suggesting that such uniformity in texture can mitigate random vibrations induced by irregular textures, thus diminishing noise levels. At 80 km/h, the lowest noise levels were recorded at sites 4 and 5 (groove heights over 3 mm and widths over 1.5 mm), where the groove textures were notably narrower, which might have lessened air vibrations and compression during tire rolling. Moreover, the more pronounced groove heights and widths at these sites suggest that rougher textures can reduce noise generated by smoother surfaces, especially at increased speeds.
The 1/3 octave band analysis indicated an upward trend in noise levels with frequency, with all eight test conditions exhibiting tonal peaks around 1000 Hz. At higher speeds, the noise contribution from frequencies above 1000 Hz became more pronounced. Upon comparing texture profile levels with tire–pavement noise trends across the conditions, varying patterns were noted across different frequency ranges, implying that the interplay between pavement texture and tire–pavement noise may shift across different frequency bands, underscoring the need to assess the influence of texture parameters on noise across the spectral range.

4.2. Analysis of Pavement Texture’s Influence on Noise Intensity

4.2.1. Spacing

At a speed of 60 km/h, site 1 exhibited superior noise levels compared to sites 4 and 6. However, at 80 km/h, site 6 demonstrated the best noise performance. Figure 11 provides a noise spectrum analysis for the various evenly spaced grooves and burlap drag textures at both 60 km/h and 80 km/h, aiming to assess the effect of groove spacing on noise at differing velocities.
The data in Figure 12 indicate that noise intensities above 85 dBA are predominantly located between 630 Hz and 2000 Hz, with all three sites showcasing tonal peaks at 1000 Hz. At 60 km/h, site 1, featuring 25 mm evenly spaced grooves, displayed consistently lower noise levels across the frequency spectrum compared to sites 4 (19 mm spacing) and 6 (13 mm spacing). However, at 80 km/h, site 6 presented reduced noise levels within the 25 to 1000 Hz range, while site 1 had elevated levels within the 1000 to 5000 Hz range. This suggests that larger spacings can diminish air vibrations and compression as tires traverse texture gaps at lower speeds, thereby reducing air pumping noise. Consequently, the smallest spacing at site 6 (13 mm) may lead to increased air pumping noise, culminating in the highest noise level among the sites.
Upon acceleration from 60 km/h to 80 km/h, sites 1 and 4 showed amplified tonal peaks, with the peak frequency transitioning from 1000 Hz to 1250 Hz, indicating an uptick in high-frequency noise components. This frequency-specific noise could be attributed to the air pumping effect, where rapid air compression and release occurred as the tires engaged with the grooved textures. Smaller spacings could mitigate noise by intensifying the frequency of this air pumping phenomenon, whereas larger spacings may not disperse this effect as effectively. Therefore, site 1 with a 25 mm spacing exhibited a tonal peak at an 800 Hz center frequency, whereas site 4 with 19 mm spacings demonstrated a peak at 1000 Hz. Additionally, the increase in speed likely accentuated tire–pavement friction and vibration, influencing the noise levels. Site 6, with the narrowest spacing in burlap drag texture, could enhance tire–pavement interactions at elevated speeds, reducing the noise generated by friction and vibrations.

4.2.2. Depth/Height

At 60 km/h, test sites 1 and 3 demonstrated superior noise levels compared to site 2, but at 80 km/h, site 2 outperformed in terms of noise levels. To investigate the effect of groove depth on noise at different velocities, Figure 12 provides a noise spectrum analysis for various groove depths at 60 km/h and 80 km/h.
At 60 km/h within the 25 Hz to 250 Hz frequency band, site 2, with a 1 mm groove depth, showed consistently lower noise intensities across all frequencies compared to sites 1 (2 mm depth) and 3 (0.75 mm depth). Yet, within the 500 Hz to 1600 Hz range, site 2 recorded the highest noise intensity, indicating a higher overall noise level. This phenomenon suggests that a moderate groove depth at lower frequencies can disrupt the air pressure vibrations occurring during tire–pavement compression, which is not as effectively achieved by excessively deep or shallow grooves. At mid to high frequencies, the groove depth may amplify resonances at specific frequencies, particularly those aligning with tire vibration modes, thus increasing the noise. Site 2, exhibiting the smallest groove height and narrower texture spacing, s more intimate tire–pavement interactions, minimizing the voids created by texture. This enhanced contact contributed to the reduction of vibrations stemming from the tire compression of air within the pavement textures, an effect that was more noticeable at lower frequencies.
At 80 km/h, site 2 displayed lower noise levels in the 25–630 Hz range, whereas sites 1, 2, and 3 showed comparable noise levels in the 1000–5000 Hz range. This pattern suggests that at higher speeds, the influence of groove depth on high-frequency noise is mitigated. High-frequency noise appears to correlate more closely with tire vibration modes and aerodynamic noise rather than groove depth, diminishing the latter’s relative significance.

5. Optimization of Skid Resistance and Noise Reduction Texture Using TOPSIS

5.1. Method Overview

This study’s evaluation of the high-speed sideway force coefficient and tire–pavement noise levels provide insights into the performance of various pavement textures. To devise an optimal strategy that boosts pavement skid resistance while mitigating tire/road noise, a multi-objective optimization analysis was undertaken. Given the small sample size, the TOPSIS (Technique for Order Preference by Similarity to Ideal Solution) method was employed for a comprehensive assessment of each texture design [48]. This technique, which does not rely on the distribution pattern of the data, is appropriate for the limited empirical data available. The core principle involves determining the performance of each option across multiple criteria, and then identifying the optimal and least optimal solutions. The TOPSIS approach selects the most suitable option by calculating the distance of each alternative from the optimal and least optimal solutions, favoring the choice nearest to the optimal while the farthest is identified as the least optimal.
TOPSIS Calculation Steps: (1) Construct the decision matrix: Assuming there are m evaluation objects and n criteria, form decision matrix X :
X = x 11 x 12 x 1 n x 21 x 22 x 2 n x m 1 x m 2 x m n
where x i j represents the performance value of the i -th option under the j -th criterion.
(2) Normalize to eliminate the impact of different units and magnitudes, with the normalized r i j as shown in Equation (3):
r i j = x i j i = 1 m x i j 2
(3) Introduce weights w j for each criterion, forming the weighted normalized decision matrix:
v i j = w j × r i j
where w j is the weight of the j -th criterion.
(4) Determine the ideal best ( A * ) and worst ( A ) solutions:
A * = max v i j | j J + , mi n v i j | j J
A = mi n v i j | j J + , m ax v i j | j J
where J + is the set of beneficial criteria, and J is the set of non-beneficial criteria.
(5) Calculate the Euclidean distance of each option from A * and A :
D i * = j = 1 n ( v i j v j * ) 2
D i = j = 1 n ( v i j v j ) 2
(6) Compute the relative closeness to the ideal solution for each option, C i :
C i = D i D i * + D i
The closer C i is to 1, the closer the option is to the ideal solution.

5.2. Data Preprocessing

The dataset comprises texture parameters from 8 test sites and the corresponding performance metrics. The texture parameters were categorized into grooving and burlap drag, measured by width, depth, and spacing, as detailed in Table 1 and Table 2. The performance metrics included the pavement’s high-speed sideway force coefficient and noise levels at 60 km/h and 80 km/h, as listed in Table 4 and Table 6.
To mitigate the influence of diverse scales and magnitudes, all parameters and results were normalized using Z-score normalization, resulting in a dataset with a mean of 0 and a standard deviation of 1, as illustrated in Table 7.
Given the potential variation in pavement texture’s impact on noise at different speeds, the data for 60 km/h and 80 km/h were analyzed separately to gauge the speed’s influence on the optimization outcomes. The absence of noise data for test sites 7 and 8 at 80 km/h necessitated their exclusion from the dataset for this speed segment.

5.3. Determination of Weights

5.3.1. Top-Level Weight

To elucidate the causal relationship between performance objectives and texture design, top-level weights were assigned to pavement performance indicators (anti-skid and noise reduction capabilities). The parameters for burlap drag and grooving textures were established as secondary weights, with their internal distribution reflecting the influence of various texture parameters on performance metrics.
The objective of this study was to identify an optimal texture design that enhances pavement skid resistance while minimizing tire/pavement noise. Consequently, equal importance was attributed to skid resistance and noise reduction, assigning a weight of 0.5 to each at the top level.

5.3.2. Internal Weight Setting for Grooved and Burlap Drag Textures

The behavior of textures in noise reduction varies with speed, necessitating a distinct discussion on internal weight assignment at 60 km/h and 80 km/h.
At 60 km/h, the grooved textures’ width negatively correlated with the SFC and has a smaller impact on noise, warranting a 15% weight. Groove depth, which was positively correlated with the SFC and significant in reducing low-frequency noise, was allocated a 30% weight, emphasizing its crucial role. Groove spacing received a 55% weight due to its significant noise control contribution, highlighting its pivotal role in noise reduction. The burlap drag textures’ width was assigned a 20% weight for its minor noise control role at low speeds. Groove depth was given a 30% weight for its impact on texture roughness and indirect effects on the SFC and noise, while spacing, crucial for noise control, was given a 50% weight to underline its central function.
At 80 km/h, the weight for groove depth decreased to 20% as its noise impact diminishes at higher speeds. Groove width was assigned a 15% weight, and spacing, still a key noise and SFC influencer, especially for high-frequency noise, was given a 65% weight. For burlap drag textures, the groove depth’s weight was reduced to 25%, width was given a 20% weight, and spacing, maintaining its significance for noise and the SFC, was allocated a 55% weight. Table 8 presents the weight distribution across the different conditions and speeds.

5.4. Results

Utilizing normalized texture parameters and performance data, the relative closeness index was calculated for each test site, considering anti-skid and noise reduction. Table 9 displays these indices across the varying speeds.
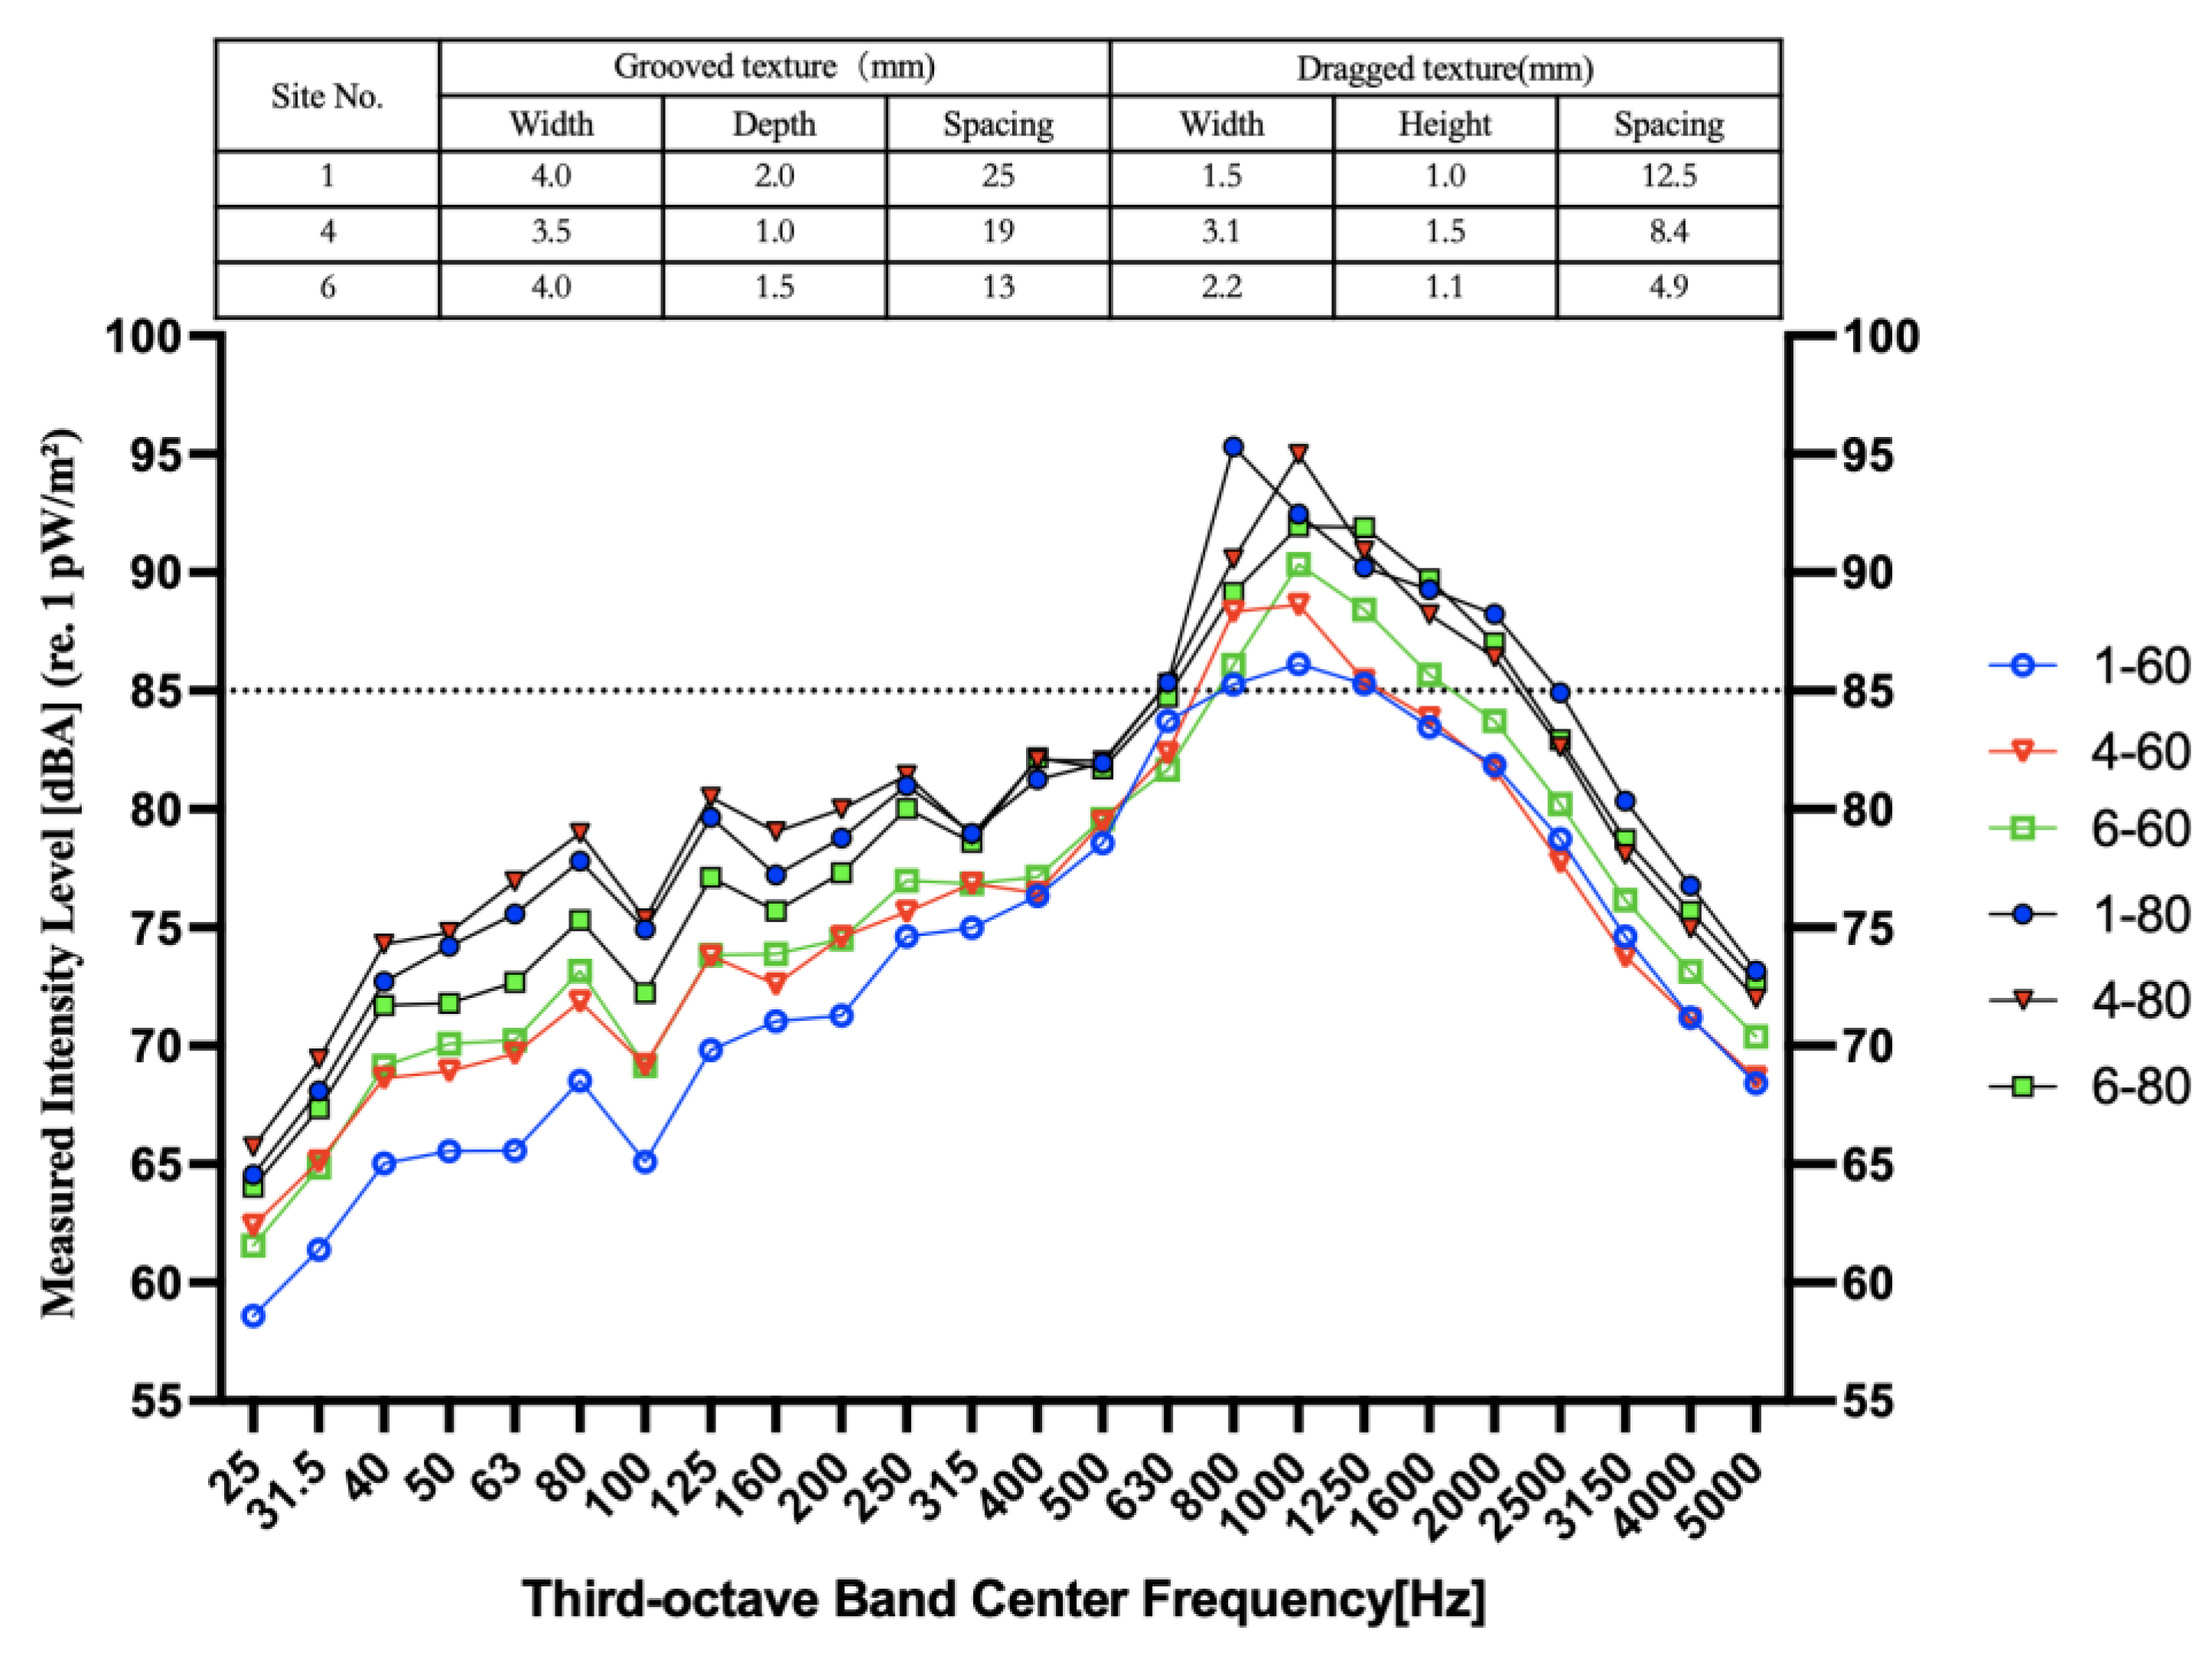
The results indicate that at 60 km/h, test sites 4 and 5 showed superior overall performance. Test site 4, with a groove width of 3.5 mm, depth of 1 mm, and spacing of 19 mm, offers a balanced configuration that may facilitate adequate water drainage while minimizing noise induced by excessively deep or narrow textures. For the burlap drag texture, test site 4’s larger groove width (3.1 mm) and relatively higher groove height (1.5 mm) may improve the contact pressure distribution, reducing high-frequency vibrations and noise.
At 80 km/h, the texture design of test site 1 align most closely with the ideal solution. Featuring a groove width of 4.0 mm, a depth of 2 mm, and a spacing of 25 mm, this configuration is likely to enhance water drainage and provide adequate friction at high speeds, while the greater spacing assists in mitigating noise generated by air vibration. The burlap drag texture at test site 1, characterized by a groove width of 1.5 mm, a height of 1.0 mm, and a spacing of 12.5 mm, is expected to maintain effective contact stability and contribute to noise reduction at elevated speeds.
In essence, improving pavement skid resistance typically necessitates an increase in surface roughness or texture depth, facilitating enhanced friction between the tires and pavement, thereby boosting vehicle stability and safety. Nevertheless, such modifications can result in heightened noise levels due to the increased surface vibrations and air compression fluctuations associated with rougher textures. Consequently, the design of pavement texture should be tailored to the specific conditions of road use and the requirements of the intended users. For example, in urban or heavy traffic areas, skid resistance may be a priority. Additionally, the design should take into account the diversity of vehicle types, traffic volumes, speed ranges, and load categories, as the needs for skid resistance and noise reduction can vary significantly between heavy-duty vehicles and light passenger cars. Along this vein, the objective of optimal pavement texture design is to strike an ideal balance between skid resistance and noise reduction, tailored to the particular application context.

6. Conclusions

This research provided a detailed evaluation of the texture characteristics of cement concrete pavements and their effects on pavement’s skid resistance and the levels of tire/pavement noise. Utilizing the TOPSIS multi-objective optimization method, various texture designs were appraised, culminating in a texture design scheme that optimally balances skid resistance and noise reduction. The key findings are as follows:
(1)
Grooved textures significantly enhance the high-speed sideway force coefficient (SFC), thereby markedly improving the pavement’s skid resistance. The groove’s width and depth are critical, particularly at lower speeds, where optimal dimensions support water displacement and deliver adequate traction without markedly heightening noise;
(2)
Dragged (burlap drag) textures directly influence noise levels, with their micro- and macro-textures diminishing vibration frequencies between the tires and pavement, thereby lowering noise. Within these textures, groove height and spacing are pivotal in managing noise levels and ensuring adequate skid resistance;
(3)
At 60 km/h, optimal skid resistance and noise reduction are achieved with a moderate groove width and depth alongside suitable spacing, exemplified by test site 4’s configuration of transverse grooves (3.5 mm width, 1 mm depth, 19 mm spacing) and longitudinal dragged texture (3.1 mm width, 1.5 mm height, 8.4 mm spacing). At 80 km/h, wider grooves, more considerable spacing, and deeper cuts enhance drainage while reducing noise, as seen in test site 1’s design featuring transverse grooves (4 mm width, 2 mm depth, 25 mm spacing) and longitudinal dragged texture (1.5 mm width, 1.0 mm height, 12.5 mm spacing);
(4)
Pavement texture design should be tailored to actual road use and user requirements. It is crucial to consider the diverse performance requirements of different vehicles, such as heavy versus light vehicles, and the distinct needs of urban versus intercity highways.
Future research should expand the TOPSIS method by including additional environmental and operational factors like tire types, weather conditions, and vehicle speed distribution to refine the model’s precision and dependability. Moreover, establishing ongoing pavement performance monitoring is recommended to evaluate the real-world efficacy of texture designs, providing valuable empirical data to guide future texture design decisions.

Author Contributions

All authors made significant contributions to the work presented in this manuscript. Conceptualization, B.Y. and L.W.; methodology, S.Y., X.Z. and Z.Y.; investigation, X.Z. and Z.Y.; resources, B.Y.; writing—original draft preparation, B.Y. and S.Y.; writing—review and editing, Z.Y. and L.W.; supervision, L.W.; project administration, B.Y.; funding acquisition, L.W. All authors have read and agreed to the published version of the manuscript.

Funding

This work was supported by the Technology Innovation and Demonstration Project of the Department of Transport of Yunnan Province (2021) No. 25. This work was also supported by the National Natural Science Foundation of China (No. 52208414) and Major Science and Technology Projects of Yunnan Province Science and Technology Department (No. 202302AD080007).

Data Availability Statement

The data presented in this study are available upon request from the corresponding author.

Conflicts of Interest

Author Biyu Yang was employed by the company Zhaotong Highway Investment Development Co., Ltd. The remaining authors declare that the research was conducted in the absence of any commercial or financial relationships that could be construed as a potential conflict of interest.

References

  1. Jiang, T.H.; Ren, W.Y.; Dong, Y.S.; Hou, Y.; Yuan, J.M. Precise representation of macro-texture of pavement and effect on anti-skidding performance. Munic. Eng. Technol. 2022, 40, 1–7, 24. [Google Scholar]
  2. Liu, J.; Li, J.; Li, X.Y.; Li, M.L. Determination of elastic component amounts of perforated elastic road surface and analysis of the noise reduction effect. J. Munic. Technol. 2023, 41, 7–11. [Google Scholar]
  3. Yang, E.H.; Cheng, Q.; Li, J.; Di, H.; Huang, B.; Qiu, Y. Surface Texture Reconstruction and Mean Texture Depth Prediction Model of Asphalt Pavement. China J. Highw. Transp. 2023, 36, 14–23. [Google Scholar]
  4. Zhang, Y.F. Measurement and Analysis of Skid-resistance and Noise Reduction Characteristics of the Cement Concrete Pavement. Munic. Eng. Technol. 2015, 33, 41–44. [Google Scholar]
  5. Fwa, T. Skid resistance determination for pavement management and wet-weather road safety. Int. J. Transp. Sci. Technol. 2017, 6, 217–227. [Google Scholar] [CrossRef]
  6. Wu, J.; Zhang, C.; Wang, Y.; Su, B.; Gond, B. Investigation on wet skid resistance of tread rubber. Exp. Tech. 2019, 43, 81–89. [Google Scholar] [CrossRef]
  7. Zhang, Y.C.; Zhou, X.X. Application of Recovery Technology for Anti-sliding Capability of Cement Concrete Pavement of Tunnel on Expressway. Highway 2021, 66, 297–299. [Google Scholar]
  8. Li, Y.X.; Dong, Y.S.; Yuan, J.M.; Jiang, T.H.; Ren, W.Y.; Yang, Y.Q. Research on Attenuation Law of Anti-skidding Performance of Asphalt Pavement. Munic. Eng. Technol. 2022, 40, 54–57+61. [Google Scholar]
  9. Zhou, W.; Tian, G.J.; Niu, Y.D.; Liu, Z.; Meng, F.; Liu, W. Design of Surface Friction Tester Measuring System and Experiment Analysis. J. Electron. Meas. Instrum. 2021, 35, 205–211. [Google Scholar]
  10. Wang, Y.X.; Miao, N.; Jing, G.Q.; Chen, N.; Liu, L. Modeling and error analysis of digital pendulum friction tester. Chin. J. Sci. Instrum. 2018, 39, 42–48. [Google Scholar]
  11. Liu, Y.; Tian, B.; Niu, K.M. Skid-resistance and Denoising Properties of Cement Concrete Pavement with Different Surface Texture. J. Highw. Transp. Res. Dev. 2012, 29, 28–33. [Google Scholar]
  12. Ran, M.P.; Yang, Y.M.; Huang, L.Y.; Zhou, X.-L. Analysis on Influence of Pavement Texture on Tire-road Rolling Resistance. J. Highw. Transp. Res. Dev. 2021, 38, 23–29. [Google Scholar]
  13. Ding, S.; Wang, K.C.P.; Yang, E.; Zhan, Y. Influence of effective texture depth on pavement friction based on 3D texture area. Constr. Build. Mater. 2021, 287, 123002. [Google Scholar] [CrossRef]
  14. Fan, Y.H.; Zhou, X.Y.; Yang, H.L.; Wang, L.-B. Analysis of Effects of Worn-out Surface Texture and Wet Surface on Asphalt Pavement Skid Resistance Through FEM-VDM Modeling. China J. Highw. Transp. 2023, 36, 318–332. [Google Scholar]
  15. Lu, X.L. Method of characterizing pavement texture wear attenuation based on entropy. China Sci. 2023, 18, 897–904. [Google Scholar]
  16. Dai, G.; Luo, Z.; Chen, M.; Zhan, Y.; Ai, C. Reconstruction and Intelligent Evaluation of Three-Dimensional Texture of Stone Matrix Asphalt-13 Pavement for Skid Resistance. Lubricants 2023, 11, 535. [Google Scholar] [CrossRef]
  17. Xu, G.; Lin, X.; Wang, S.; Zhan, Y.; Liu, J.; Huang, H. Incep-FrictionNet-Based Pavement Texture Friction Level Classification Prediction Method. Lubricants 2023, 12, 8. [Google Scholar] [CrossRef]
  18. Fang, T.; Guo, R.; Si, Y. Ensemble Mode and Singular Value Based Road Texture-Skid Study. Coatings 2021, 11, 947. [Google Scholar] [CrossRef]
  19. Yu, M.; Zhang, Q.; Shi, L.; Tang, O.D. Prediction Model of Skid Resistance of Asphalt Pavement Based on Dynamic Friction Behavior of Tire/Road. J. Chongqing Jiaotong Univ. (Nat. Sci.) 2023, 42, 40–46. [Google Scholar]
  20. Li, X.Y.; He, H.; Hu, J.B. Three-dimensional asphalt pavement texture study based on structured light measurement. J. China Foreign Highw. 2022, 42, 83–89. [Google Scholar]
  21. Smith, R.D. Longitudinal Grinding and Transverse Grooving to Improve Frictional and Profile Properties; Office of Materials Highway Division, Iowa Department of Transportation: Ames, IA, USA, 1983. [Google Scholar]
  22. Rasmussen, R.O.; Whirledge, R.P.; Turner, D.J.; Light, R.J.; Ferragut, T.R.; Wiegand, P. Identifying quieter concrete pavements using on-board sound intensity. In Proceedings of the Transportation Research Board 87th Annual Meeting, Washington, DC, USA, 13–17 January 2008. [Google Scholar]
  23. Ong, G.P.; Fwa, T.F. Effectiveness of transverse and longitudinal pavement grooving in wet-skidding control. Transp. Res. Rec. 2007, 2005, 172–182. [Google Scholar] [CrossRef]
  24. Kuemmel, D.A.; Sontag, R.C.; Crovetti, J.A.; Becker, Y.; Jaeckel, J.R.; Satanovsky, A. Noise and Texture on PCC Pavements-Results of a Multi-State Study; The National Academies of Sciences, Engineering, and Medicine: Washington, DC, USA, 2000. [Google Scholar]
  25. Ghafoori, N.; Diawara, H. Abrasion resistance of fine aggregate-replaced silica fume concrete. Mater. J. 1999, 96, 559–569. [Google Scholar]
  26. Ling, J.Q.; Han, S.; Guo, Z.T. Skid Resistance and Noise Reduction Texture Technique for Cement Concrete Pavement. Transp. Stand. 2009, 11, 62–66. [Google Scholar]
  27. Xu, J.; Yang, S.L.; Ye, Z.J.; Wang, L.B.; Wei, Y.; Yang, B.Y.; Meng, W.; Cui, T.; He, C.W. Analysis of Driving Noise Characteristics on Cement Concrete Pavement with Different Groove Textures. J. Munic. Technol. 2023, 41, 27–35. [Google Scholar]
  28. Chen, L.; Cong, L.; Dong, Y.; Yang, G.; Tang, B.; Wang, X.; Gong, H. Investigation of influential factors of tire/pavement noise: A multilevel Bayesian analysis of full-scale track testing data. Constr. Build. Mater. 2021, 270, 121484. [Google Scholar] [CrossRef]
  29. Gardziejczyk, W.; Gierasimiuk, P.; Motylewicz, M.; Wasilewska, M. Evaluation of noisiness of exposed aggregate cement concrete pavement. Road Mater. Pavement Des. 2021, 22, 2352–2368. [Google Scholar] [CrossRef]
  30. Kamil, B.A.; AlJameel, H.A.E. Impact of traffic characteristics and pavement surface condition on noise level for rigid pavement[C]//IOP conference series: Earth and environmental science. IOP Publ. 2022, 961, 012101. [Google Scholar]
  31. Dong, S.; Han, S.; Luo, Y.; Han, X.; Xu, O. Evaluation of tire-pavement noise based on three-dimensional pavement texture characteristics. Constr. Build. Mater. 2021, 306, 124935. [Google Scholar] [CrossRef]
  32. Del Pizzo, L.G.; Teti, L.; Moro, A.; Bianco, F.; Fredianelli, L.; Licitra, G. Influence of texture on tyre road noise spectra in rubberized pavements. Appl. Acoust. 2020, 159, 107080. [Google Scholar] [CrossRef]
  33. de León, G.; Del Pizzo, L.G.; Teti, L.; Moro, A.; Bianco, F.; Fredianelli, L.; Licitra, G. Evaluation of tyre/road noise and texture interaction on rubberised and conventional pavements using CPX and profiling measurements. Road Mater. Pavement Des. 2020, 21 (Supp. 1), S91–S102. [Google Scholar] [CrossRef]
  34. Chen, W.; Zheng, M.; Wang, H. Evaluating the tire/pavement noise and surface texture of low-noise micro-surface using 3D digital image technology. Front. Mater. 2021, 8, 683947. [Google Scholar] [CrossRef]
  35. Cai, Z.S.; He, Z.; Qiu, Z.X.; Hou, Z.; Liu, C.; Yan, L. Study on skid-resistance and noise reduction performance of different texture cement concrete pavement. Concrete 2018, 4, 5–7+12. [Google Scholar]
  36. Ginevra, D.P.L.; Bianco, F.; Moro, A.; Schiaffino, G.; Licitra, G. Relationship between tyre cavity noise and road surface characteristics on low-noise pavements. Transp. Res. Part D 2021, 98, 102971. [Google Scholar]
  37. Zheng, M.L.; Chen, W.; Wang, H.Y. Evaluation of texture and noise of low-noise micro-surface based on image processing technology. J. Traffic Transp. Eng. 2023, 23, 80–92. [Google Scholar]
  38. Lu, Z.F.; Li, B.; Zhang, Z.W.; Yang, X.L.; Ma, W.-Z. Statistical Analysis of Correlation between Surface Texture and Noise for Grooved Concrete Pavement. J. Highw. Transp. Res. Dev. 2015, 32, 14–19+26. [Google Scholar]
  39. Hall, J.W.; Smith, K.L.; Titus-Glover, L.; Wambold, J.C.; Yager, T.J.; Rado, Z. Guide for Pavement Friction; NCHRP Web Document; The National Academies Press: Washington, DC, USA, 2009. [Google Scholar]
  40. Hall, J.W.; Smith, K.L.; Littleton, P. Texturing of Concrete Pavements; NCHRP Report; The National Academies Press: Washington, DC, USA, 2009. [Google Scholar]
  41. Li, B.; Kang, H.W.; Zhang, Z.W. Comparison of skid resistance and noise between transverse and longitudinal grooving pavements in newly constructed concrete pavement. Adv. Mater. Res. 2012, 446, 2637–2640. [Google Scholar] [CrossRef]
  42. Cackler, E.T.; Harrington, D.S.; Ferragut, T. Evaluation of US and European Concrete Pavement Noise Reduction Methods; National Concrete Pavement Technology Center: Ames, IA, USA, 2006. [Google Scholar]
  43. National Academies of Sciences, Engineering, and Medicine; Transportation Research Board; National Cooperative Highway Research Program. Texturing of Concrete Pavements; National Academies Press: Washington, DC, USA, 2009. [Google Scholar]
  44. Behzadian, M.; Otaghsara, S.K.; Yazdani, M.; Ignatius, J. A state-of the-art survey of TOPSIS applications. Expert Syst. Appl. 2012, 39, 13051–13069. [Google Scholar] [CrossRef]
  45. Fang, J.; Tu, J.; Wu, K. Analysis of Skid Resistance and Noise Characteristics for Varieties of Concrete Pavement. Adv. Mater. Sci. Eng. 2020, 2020, 7427314. [Google Scholar] [CrossRef]
  46. Zhang, Z.; Luan, B.; Liu, X.; Zhang, M. Effects of surface texture on tire-pavement noise and skid resistance in long freeway tunnels: From field investigation to technical practice. Appl. Acoust. 2020, 160, 107120. [Google Scholar] [CrossRef]
  47. TP 76-2009; Standard Method of Test for Measurement of Tire. Pavement Noise Using the On-Board Sound Intensity (OBSI) Method. AASHTO—American Association of State Highway and Transportation Officials: Washington, DC, USA, 2009.
  48. Hwang, C.L.; Yoon, K. Multiple Attribute Decision Making: Methods and Applications a State-of-the-Art Survey; Springer Science & Business Media: Berlin/Heidelberg, Germany, 2012; Volume 186. [Google Scholar]
Figure 1. Pavement texture creation at test sites: (a) burlap drag and (b) grooved textures.
Processes 12 00800 g001
Figure 2. Test site surface conditions.
Processes 12 00800 g002
Figure 3. Texture measurement systems. (a) Texture captured by a high-definition camera microprobe; (b) measurement of the dragged texture.
Processes 12 00800 g003
Figure 4. RTM-type vehicle-mounted intelligent road detection system.
Processes 12 00800 g004
Figure 5. Noise testing system schematic.
Processes 12 00800 g005
Figure 6. MCY-1-type pavement friction coefficient testing system and system operating interface. (a) The vehicle-mounted MCY-1-type testing system; (b) testing system interface.
Processes 12 00800 g006
Figure 7. Description of texture characteristic parameters.
Processes 12 00800 g007
Figure 8. Burlap drag textures at various sites.
Processes 12 00800 g008
Figure 9. Relationship between groove and burlap drag textures and MTD and SFC at test sites 1 to 8. (a) Burlap drag with MTD and SFC; (b) groove textures with MTD and SFC.
Processes 12 00800 g009
Figure 10. The 1/3 octave frequency spectrum of tire–pavement noise at (a) 60 km/h; (b) 80 km/h.
Processes 12 00800 g010aProcesses 12 00800 g010b
Figure 11. Noise spectrum analysis for sites 1, 4, and 6.
Processes 12 00800 g011
Figure 12. Noise spectrum analysis for sites 1, 2, and 3.
Processes 12 00800 g012
Table 1. Grooved texture parameters at various sites.
Site No.MethodWidth (mm)Depth (mm)Spacing (mm)
1Transverse Grooves with Equal Spacing4.0225
23.9125
34.00.7525
43.5119
53.72.2525
64.01.513
7Transverse Grooves with Unequal Spacing4.00.528-30-22-31-27-32-28-30-27-33-24-34-29 (375/13 = 28.8)
84.0113-17-19-17-13-16-18-20-17-13-24-17-13-17-19-16-15-17-18-20-22-17-16 (390/23 = 17.0)
Table 2. Burlap dragged texture parameters at various sites.
Site No.MethodWidth (mm)Height (mm)Spacing (mm)
1Longitudinal burlap drag1.51.012.5
21.60.53.2
31.00.96.5
43.11.58.4
53.11.89.1
62.21.14.9
71.70.88.8
82.01.07.4
Table 3. Mean texture depth at 8 test sites.
Site No.12345678
MTD (mm)0.9550.770.790.840.7750.820.5350.87
Table 4. High-speed sideway force coefficient at 8 test sites.
Site No.12345678
SFC6462.960.265.961.357.159.863.3
Table 5. Correlation coefficients between groove, burlap drag textures, and pavement MTD and SFC.
Performance IndexBurlap Drag TextureGroove Texture
WidthDepthSpacingWidthHeightSpacing
MTD0.07170.21610.2128−0.09120.5397−0.4835
SFC0.25160.14970.3669−0.54530.05040.1210
Table 6. A-weighted sound levels (dBA) of tire–pavement noise at 8 test sites.
Test Speed12345678
60 km/h91.092.191.192.591.792.492.793.3
80 km/h98.197.497.797.096.996.8--
Table 7. The normalized dataset.
Site No.Burlap Drag TextureGroove TextureNoiseSFC
WidthDepthSpacingWidthHeightSpacing60 km/h80 km/h
1−0.6984−0.18461.72870.59681.22470.5233−1.38431.53130.7875
2−0.5654−1.4156−1.55230.0063−0.40820.523300.16290.3915
3−1.3636−0.4308−0.38810.5968−0.81650.5233−1.25850.7494−0.5805
41.43021.04630.2822−2.0556−0.4082−0.60820.5034−0.61911.4715
51.43021.78480.5292−0.99461.6330.5233−0.5034−0.8145−0.1845
60.23280.0615−0.95260.59680.4082−1.73970.3775−1.01−1.6966
7−0.4324−0.6770.42340.5968−1.22471.23990.7551-−0.7245
8−0.0333−0.1846−0.07060.5968−0.4082−0.98531.5101-0.5355
Table 8. Weight distribution of pavement performance and texture parameters at different speeds.
SpeedBurlap Drag TextureGroove TextureAnti-SkidNoise Reduction
WidthDepthSpacingWidthHeightSpacing
60 km/h0.30.350.350.30.40.30.50.5
80 km/h0.20.250.550.150.20.650.50.5
Table 9. Relative closeness indices at different speeds.
Speed12345678
60 km/h0.56030.42970.35210.61300.60690.40240.48360.5846
80 km/h0.80230.46350.51570.57200.58810.2025--
Disclaimer/Publisher’s Note: The statements, opinions and data contained in all publications are solely those of the individual author(s) and contributor(s) and not of MDPI and/or the editor(s). MDPI and/or the editor(s) disclaim responsibility for any injury to people or property resulting from any ideas, methods, instructions or products referred to in the content.

