Abstract
Vacuum arc remelting is the main production method of titanium alloy ingots at present. In order to obtain good quality ingots, it is of great significance to study the formation of the solidification structure of ingots via vacuum arc remelting. In order to select and optimize the nucleation parameters for the solidification microstructure simulation of an ingot, a 3D CAFE model for microstructure evolution during vacuum arc remelting was established, taking into account heat transfer, flow, and solute diffusion. The Gaussian distribution continuous nucleation model and extended KGT model were used to describe the grain nucleation and dendrite tip growth rates, respectively. The multi-point mass source and moving boundary method were used to simulate the ingot growth. The results show that there are three typical crystal regions in the solidification structure of vacuum arc remelting titanium alloy ingots, namely the surface fine crystal region, columnar crystal region, and central equiaxed crystal region. The proportion of the columnar crystal region in the solidification structure of an ingot increases gradually with the increase in the undercooling of the maximum bulk nucleation. With an increase in the maximum bulk nucleation density, the equiaxed grain zone gradually increases, and the grain size gradually decreases. The proportion of the columnar crystal region in the solidification structure of an ingot increases gradually with an increase in the undercooling of the maximum bulk nucleation. The maximum volume nucleation variance has no obvious effect on the change in the solidification structure. When the maximum volume nucleation undercooling is 5.5 K, the maximum volume nucleation standard deviation is 4 K, and the maximum volume nucleation density is 5 × 10⁸. The solidification structure simulation results are in good agreement with the experimental results.
1. Introduction
Titanium and titanium alloys have a series of outstanding advantages, such as high specific strength, good corrosion resistance, and high-temperature resistance. They can be used for parts forming, welding, and machining in various ways. They are key supporting materials and important strategic metal national defense materials in engineering technology and high-technology fields. They are widely used in many fields, such as aerospace, marine engineering, energy, and the chemical industry [1]. The TC4 titanium alloy is a typical α + β two-phase titanium alloy, and its nominal composition is Ti-6Al-4V. It was first successfully developed by the United States in 1954 and has now developed into an international titanium alloy. It is the most comprehensive and in-depth titanium alloy studied by people. It has been widely used in aviation, aerospace, civil, and other industries and currently accounts for more than half of the production of titanium alloys [1,2,3,4]. With the in-depth study of the TC4 titanium alloy and the development of new application fields, it is not only required to have good composition consistency, good microstructure uniformity, and high purity but also to have high reliability, a long life, and high-quality stability.
The titanium ingot is the billet of titanium-rolled products and remelted titanium castings, and it is key to obtaining high-quality rolled products. Due to the high chemical activity of titanium, molten titanium reacts strongly with other elements, reacts quickly with oxygen, nitrogen, hydrogen, and carbon, and generates brittle impurities. Therefore, it must be melted and solidified under a strong vacuum or under the protection of inert gases such as argon. Vacuum consumable arc melting is the most traditional and commonly used process in the titanium industry. With the development of vacuum technology and computer applications, vacuum consumable arc melting has become a mature industrial production technology for titanium melting and casting [5,6,7]. It exhibits the advantages of low equipment investment and operating costs and simple operation technology. As shown in Figure 1, the basic feature of VAR is that the consumable electrode is continuously melted under vacuum conditions, and simultaneously, the ingot is continuously solidified and increased in the mold from the bottom to the top [6,7]. In addition to composition segregation, the ingot produced by vacuum arc remelting also has some defects, such as an uneven solidification structure and shrinkage holes, which are the main factors determining the quality of the ingot [8,9,10,11]. Therefore, in order to obtain ingots with good quality, it is of great significance to study the formation of the solidification structure of ingots by vacuum arc remelting. Because the physical and chemical phenomena and ingot morphology of the vacuum consumable smelting process are difficult to observe, and the cost of industrial testing of titanium alloy production is high, the numerical calculation method has gradually replaced the traditional trial and error method as the main method to study the solidification structure. Numerical calculation can not only directly observe the formation of the solidification structure but also help to understand the formation mechanism of the solidification structure [12,13,14,15,16,17].
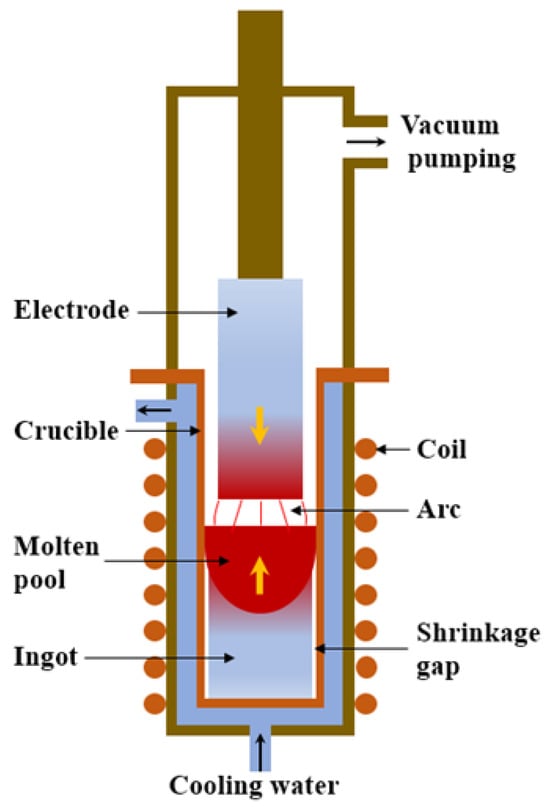
Figure 1.
Schematic diagram of VAR.
Domestic and foreign scholars have carried out a large number of numerical simulation studies on the solidification structure of vacuum consumable melting, including the realization of the vacuum arc remelting simulation process, the treatment of boundary conditions, the selection of a microstructure model, and so on [18,19,20,21,22,23,24]. Zhang Y et al. [25] established a three-dimensional axisymmetric finite element model for the solidification process of a TC4 alloy ingot in vacuum arc remelting, simulated the temperature field distribution using the moving boundary method, and calculated the solidification structure, shrinkage, and porosity formation of the TC4 ingot in the VAR process based on the cellular automaton and finite element coupling method (CAFE method); the simulation results are in good agreement with the experimental observations in the grain structure, columnar crystal growth direction, columnar to equiaxed crystal transition, shrinkage, and porosity. Bai L et al. [26] obtained the temperature field during the solidification process of 22CrMoH continuous casting billet using the moving boundary method. On this basis, the microstructure of the 22CrMoH gear steel continuous casting billet was simulated by the cellular automata-finite element (CAFE) method. The simulation results are basically consistent with the microstructure of the actual sample. The influence of alloy element content on the microstructure of the slab was discussed further. Using ProCAST finite element software, Huang Y et al. [27] simulated the temperature field, molten pool morphology, and microstructure of high-performance bearing steel during the vacuum consumable melting process, studied the microstructure evolution law of the ingot, and explored the influence of the temperature field and molten pool morphology on the microstructure growth. The simulation results were consistent with the experimental results, and the ingot microstructure morphology was a thin cylindrical crystal running through the center of the ingot and the vacuum consumable. There were small areas of equiaxed crystals at the bottom, edge, and solidified end of the ingot. Lan P et al. [28] established a 3D CAFE model to predict the solidification structure of a ferrite stainless steel multicomponent alloy on the basis of simultaneously considering heat transfer, flow, and solute diffusion. In the model, a Gaussian distribution was used to describe the relationship between the nucleation density and undercooling degree, and the KGT model was applied to describe the dendrite growth process. The changes in the temperature, solid phase ratio, and grain morphology of 430 stainless steel during solidification were revealed.
In this study, the ingot model was first established by using 3D drawing software, and then the solidification structure during the solidification process of vacuum arc remelting TC4 alloy ingot was simulated by using moving a multi-point mass source, moving boundary method, and CAFE model based on ProCAST2021.5 finite element software [29,30,31,32].
2. Solidification Structure Model
2.1. Mathematical Model
2.1.1. Heat Transfer Model
2.1.2. Flow Model
2.1.3. Solute Diffusion Model
In the liquid phase:
In the solid phase:
where: and are, respectively, the density of the solid and liquid phase; and are, respectively, the fraction of the solid and liquid phase; , and are, respectively, the mass fraction of the solid phase, liquid phase, and component at the interface; and are, respectively, the diffusion coefficients of the solid and liquid phase of component ; is the specific surface area of the interface; and is the diffusion distance.
2.1.4. Nucleation Model
According to the relationship between grain density and undercooling in the continuous nucleation model proposed by Rappaz and Gandin, the core formed by dendrite breakage and liquid phase surface oxidation is ignored, and the effect of liquid phase flow on nucleation is ignored:
where: is the grain density, is the degree of undercooling, is the maximum degree of undercooling, is the maximum nucleation density, and is the standard deviation of nucleation.
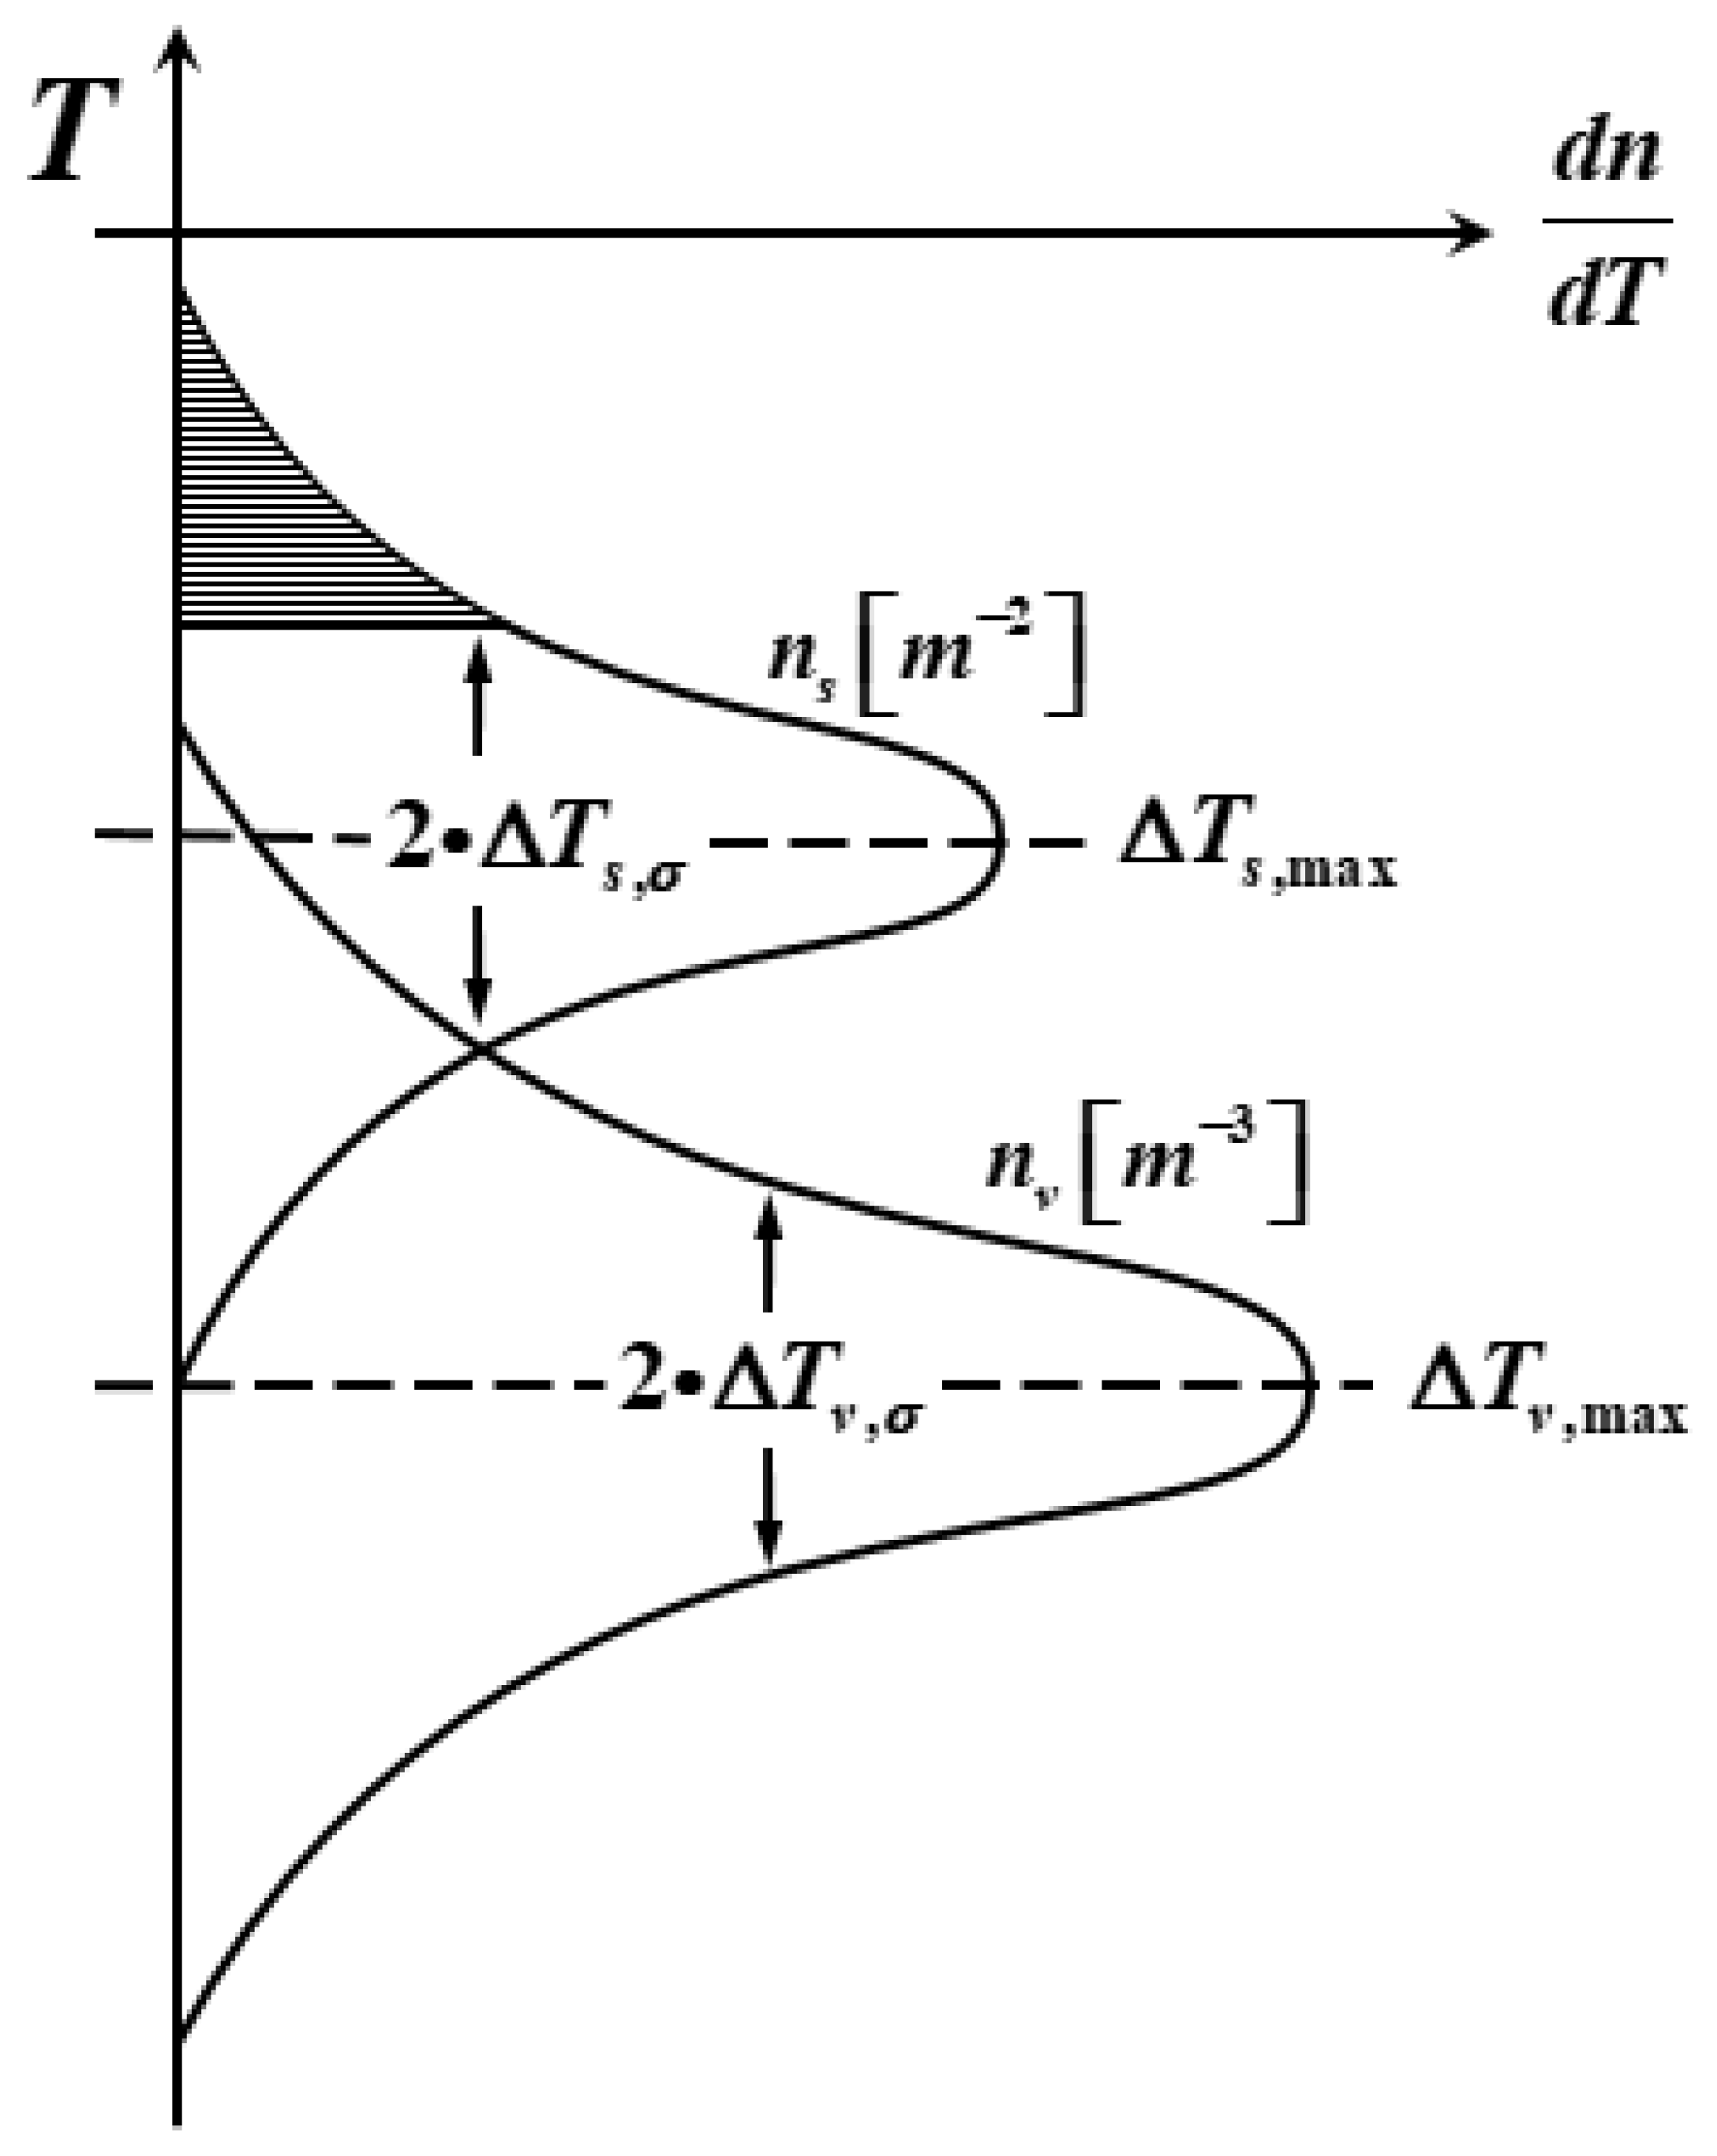
Figure 2 shows the grain nucleation density distribution curve on the ingot surface and inside. It can be seen from the figure that two sets of different nucleation parameters are used, denoted by subscript and subscript, respectively, due to the large difference between the ingot surface and the inside nucleation parameters. shows a normal distribution with the change in undercooling, and the grain density increases with the increase in undercooling, but the increase rate increases first and then decreases, and the increase rate in the grain density reaches the maximum at .

Figure 2.
Grain nucleation density distribution curves on the ingot surface and inside.
2.1.5. Grain Growth Model
In the actual solidification process of the alloy, crystal growth is affected by kinetics and composition undercooling. The total undercooling of the dendrite tip is as follows:
where: is the total undercooling degree, is the component undercooling degree, is the thermodynamic undercooling degree, is the solid-liquid interface curvature undercooling degree, and is the growth dynamic undercooling degree.
The , , and of most alloys are small and negligible, so the growth rate of columnar crystals and equiaxed crystals is described by the KGT model. In the simulation process, the KGT model is fitted to obtain the growth rate polynomial of the dendrite tip as follows:
where, and are growth kinetic coefficients. The growth kinetic coefficients and of the titanium alloy TC4 are 5.85 × 10⁻⁶ and 0, respectively.
2.2. Composition and Physical Properties of the TC4 Titanium Alloy
The main chemical composition of the TC4 titanium alloy used in the simulation is shown in Table 1.

Table 1.
Main chemical composition of the TC4 titanium alloy.
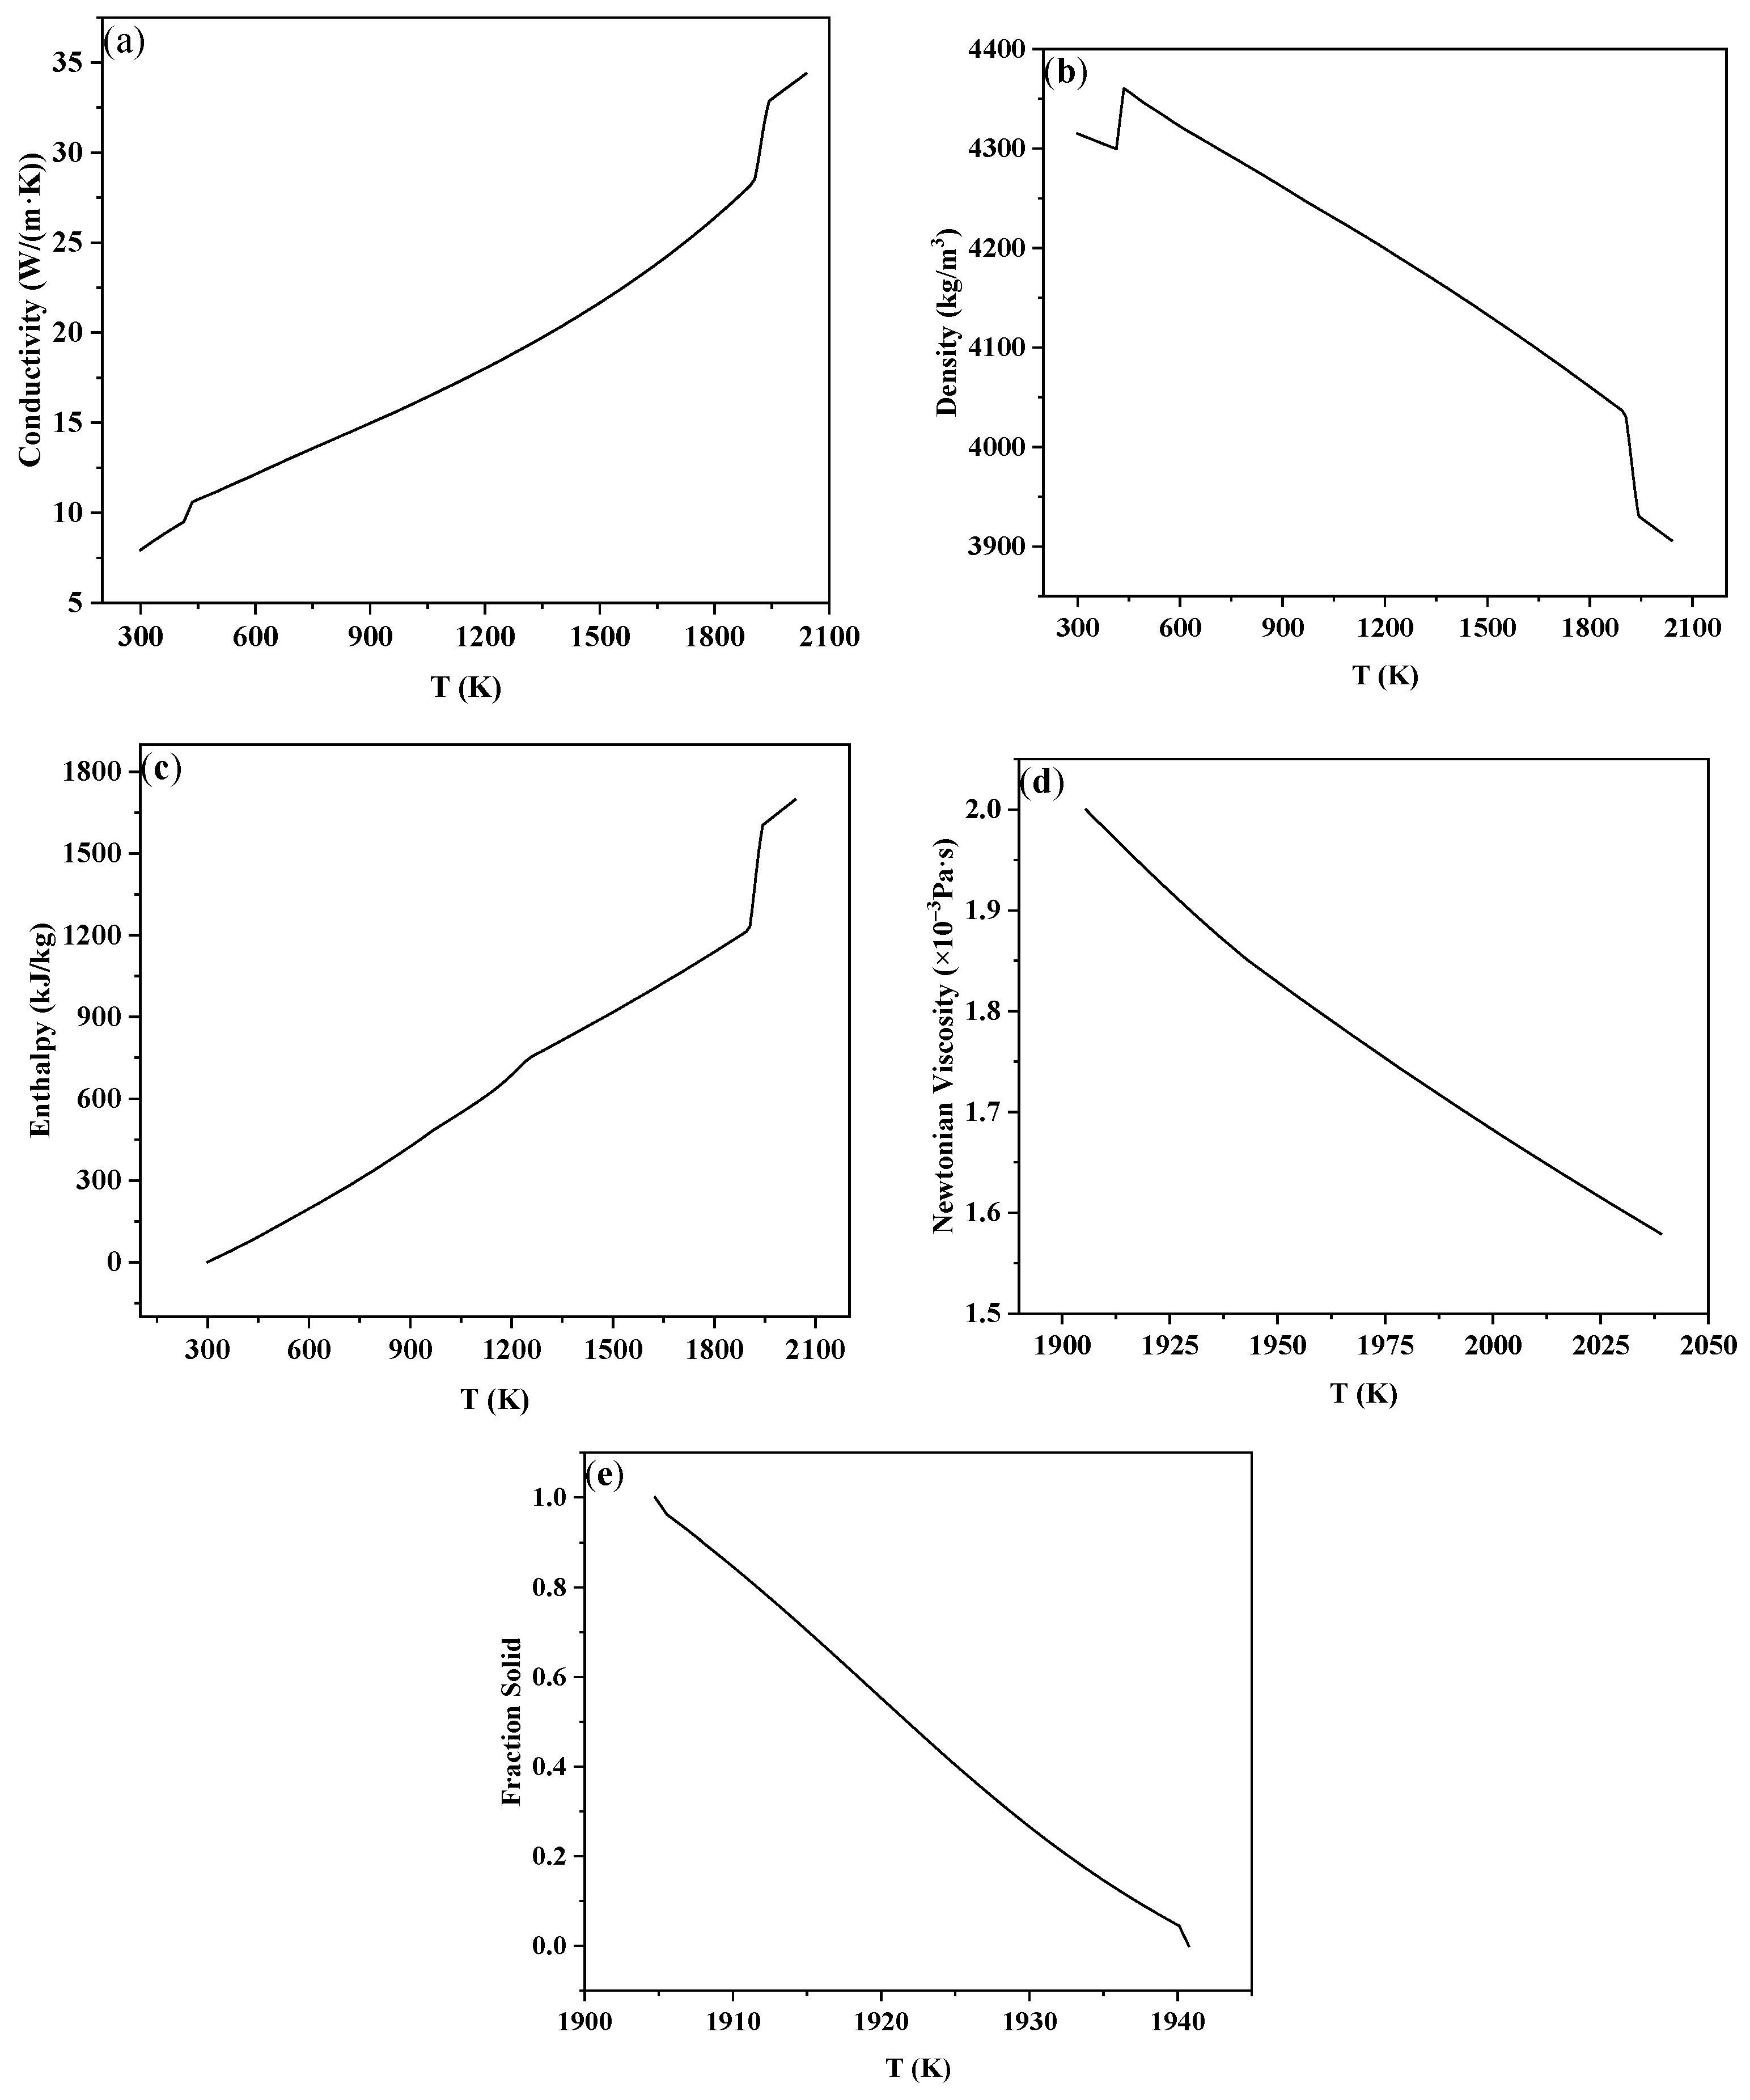
The physical parameters were calculated using the Scheil model in the Procast thermodynamic database. The relationship between the thermal conductivity, density, solidification enthalpy, viscosity, and solid fraction with temperature is shown in Figure 3. As can be seen from the picture, in the simulated temperature range, the thermal conductivity and solidification enthalpy increase with the increase in temperature, and the density, viscosity, and solid fraction decrease with the increase in temperature. At the same time, the liquidus and solidus temperatures of TC4 were calculated to be 1667 °C and 1631 °C, respectively.
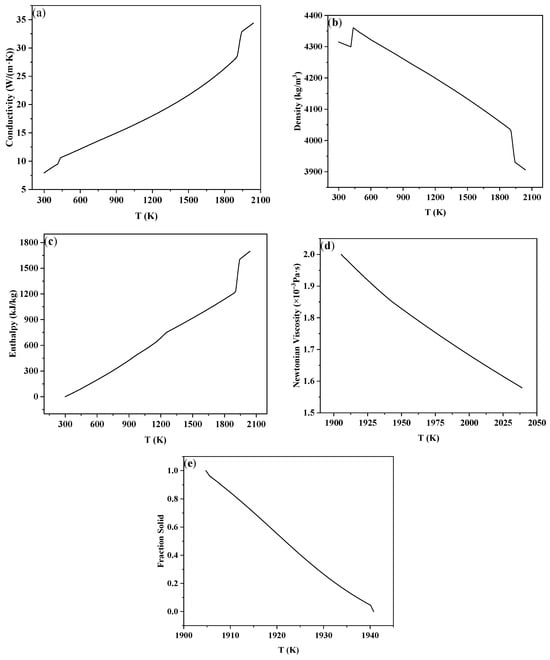
Figure 3.
Physical parameters of the titanium alloy TC4: (a) thermal conductivity, (b) density, (c) enthalpy, (d) viscosity, (e) solid fraction.
2.3. Model Parameters and Boundary Conditions
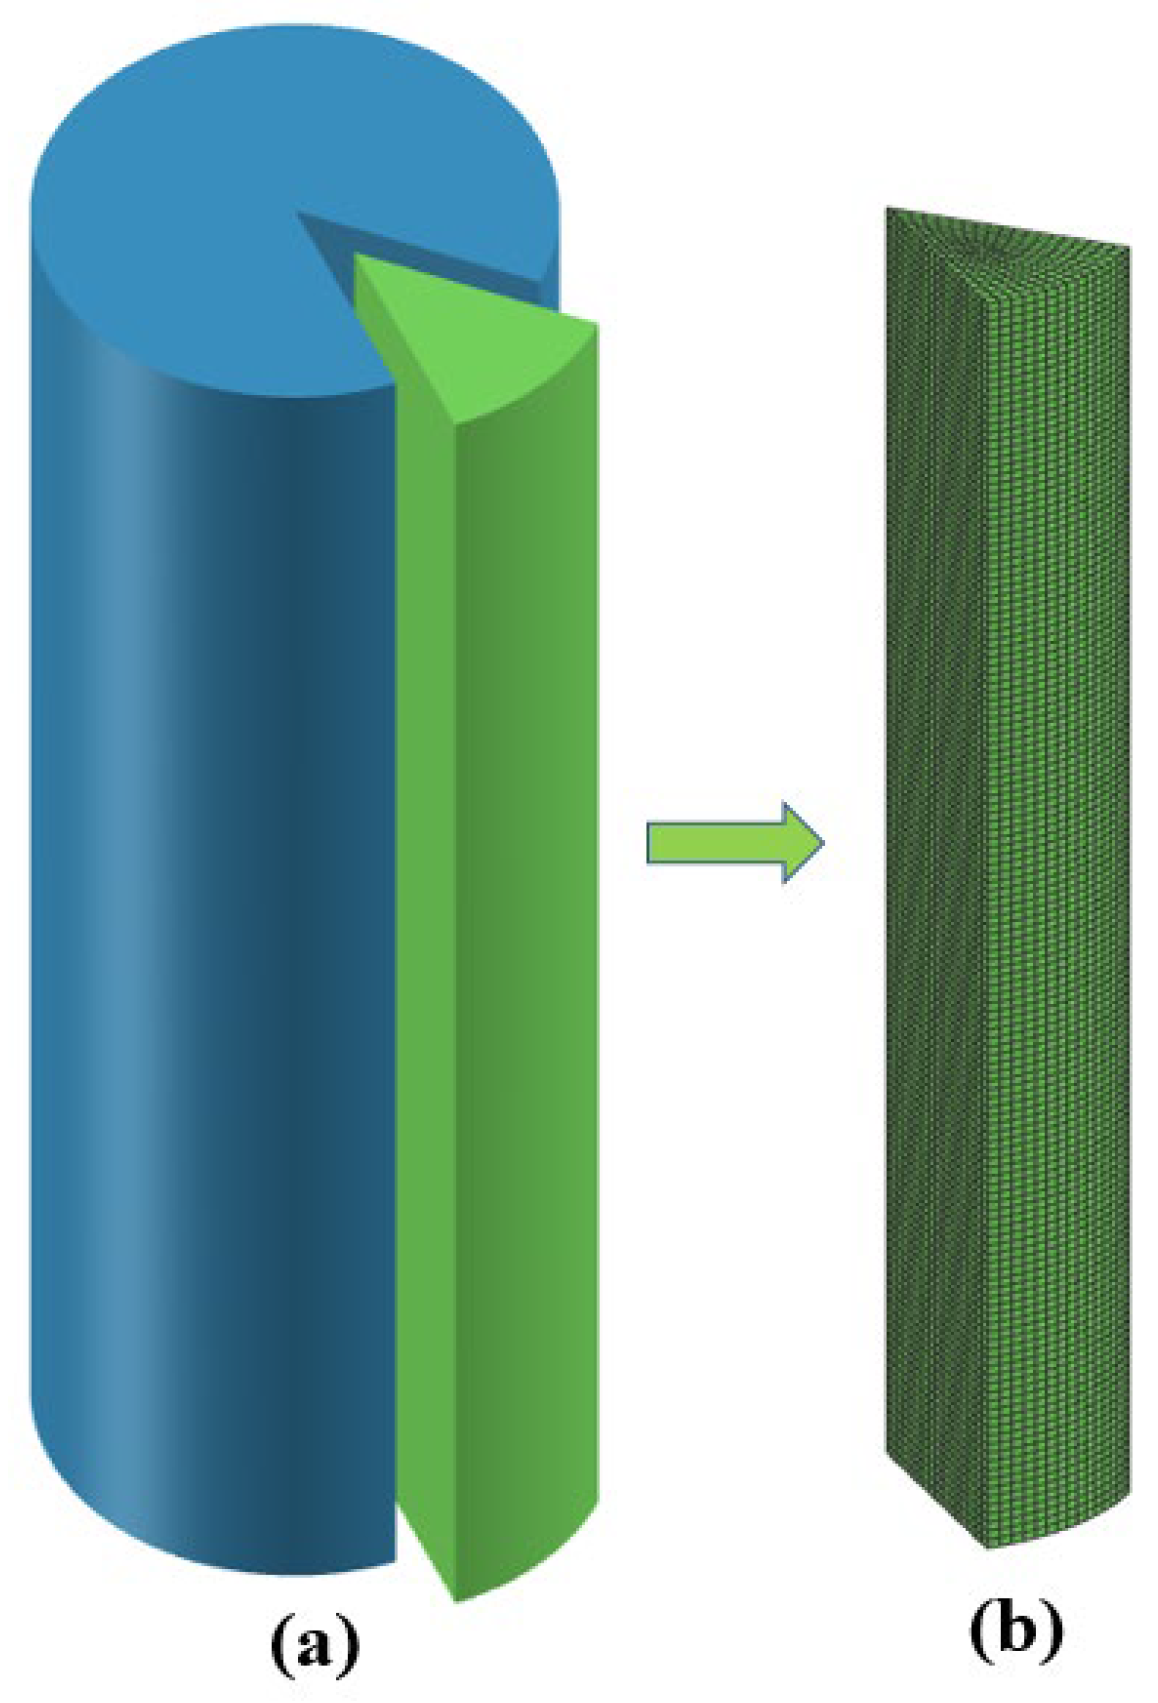
Because the thermal conductivity of the copper crucible is much higher than that of the titanium alloy ingot, the copper crucible is not the limiting part of the heat dissipation of the ingot, so it can be ignored and only the ingot is simulated. Considering the symmetry of the cylindrical ingot and the calculation speed, this model only establishes a three-dimensional finite element axisymmetric model of 1/12 of the cylindrical ingot. The geometric model and mesh division are shown in Figure 4. In the simulation process, the 3D drawing software was first used to establish the model, and then the model was imported into Procast2021.5 software for grid division and calculation. The grid is a hexahedral mesh and the calculated mesh size was 5mm.-

Figure 4.
Geometric model and grid division of the ingot: (a) geometric model, (b) grid division.
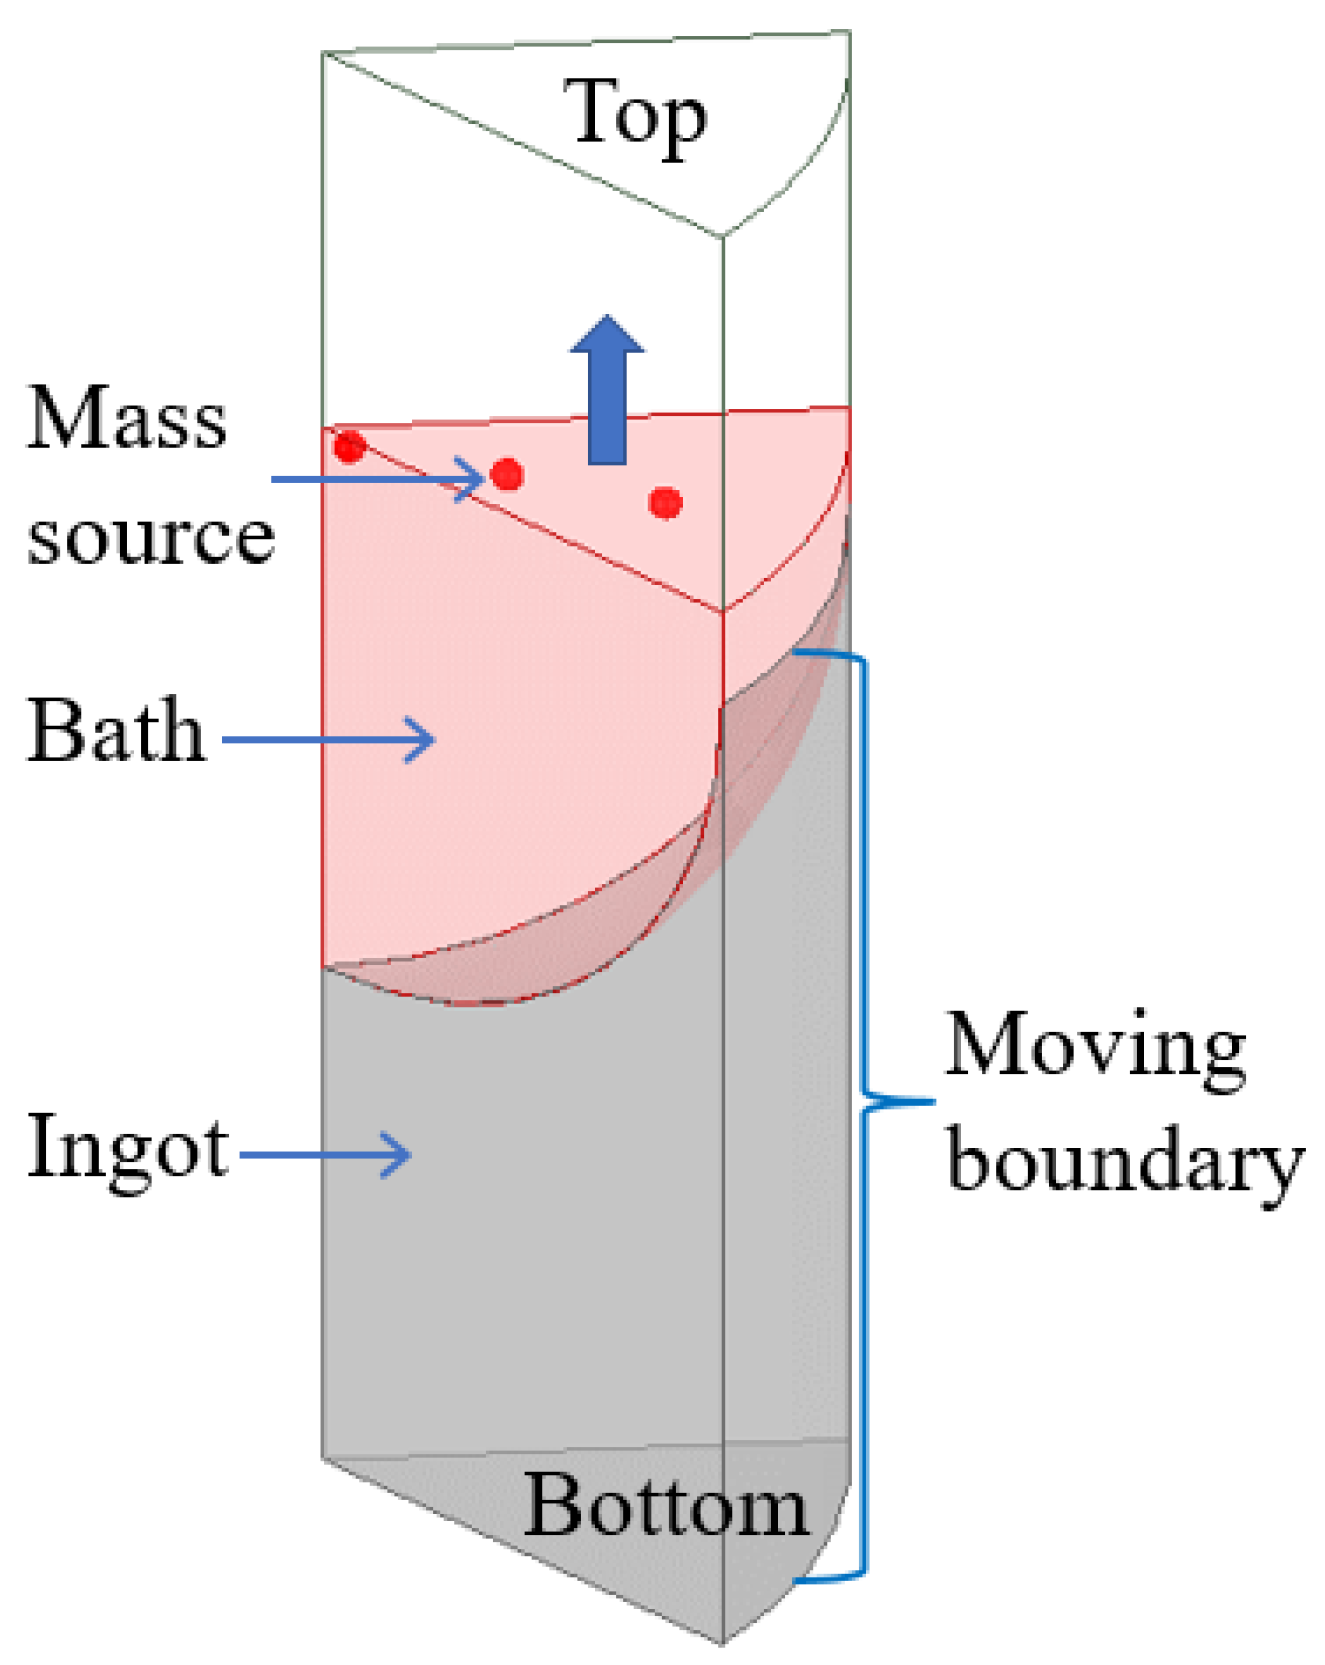
The boundary conditions in the calculation process are shown in Figure 5:
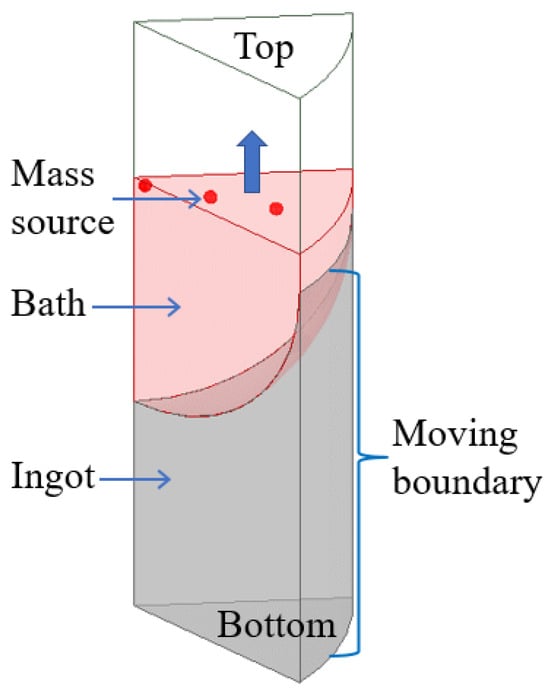
Figure 5.
Schematic diagram of the boundary conditions.
(1) In the process of vacuum arc remelting, the bottom surface of the consumable electrode will melt under the high temperature of the arc to form many metal droplets, which will continuously drop into the crucible to form a melting pool under the action of gravity. As the electrode continues to melt, the metal liquid level in the crucible continues to rise and solidify. According to the melting mode of the multi-point metal droplet melting in the melting process of the consumable electrode, the “multi-point mass source” is taken as the source of the mass source and heat source in the simulation process, where the sum of the mass source flow is the melting speed, and the temperature of the mass source is set according to the following empirical formula [28,29]:
where: is the liquidus temperature, K; is the melting current, kA; and is the ingot diameter, m.
(2) As the smelting goes on, the ingot gradually grows, and the side cooling part also becomes higher with the increase in the ingot. Therefore, the side wall boundary condition should move from the bottom to the top at the smelting speed, and the boundary movement is realized by the user’s function. The side wall and bottom of the ingot are the boundary of the convective heat transfer, and the formula [28,29] of convective heat transfer is:
It is assumed that the bottom of the ingot is in good contact with the crucible, and the upper part of the ingot side wall is in good contact with the crucible, . Due to the solidification shrinkage of the lower part of the ingot side wall, an air gap is generated between the ingot and the crucible, and the heat transfer mode changes from heat conduction to heat radiation. When the surface temperature of the side wall is lower than a critical temperature, the heat transfer coefficient is equivalently treated:
where, and are, respectively, the ingot surface temperature and ambient temperature, K; , , and are the heat transfer coefficient of the ingot bottom, the heat transfer coefficient of the ingot side wall, and the equivalent heat transfer coefficient of ingot side wall, respectively. W/(m2∙K); is the material emissivity and is the Stefan-Boltzman constant.
(3) After the electrode melting is completed, the ingot enters the capping stage. The top surface of the ingot is set as the wall boundary, the heat transfer condition is radiation heat transfer, and the other boundaries remain unchanged.
The detailed model and process parameters are shown in Table 2:
Table 2.
Model calculation parameter table.
3. Result Analysis and Discussion
3.1. Changes in the Temperature Field and Solid Fraction during the Melting Process
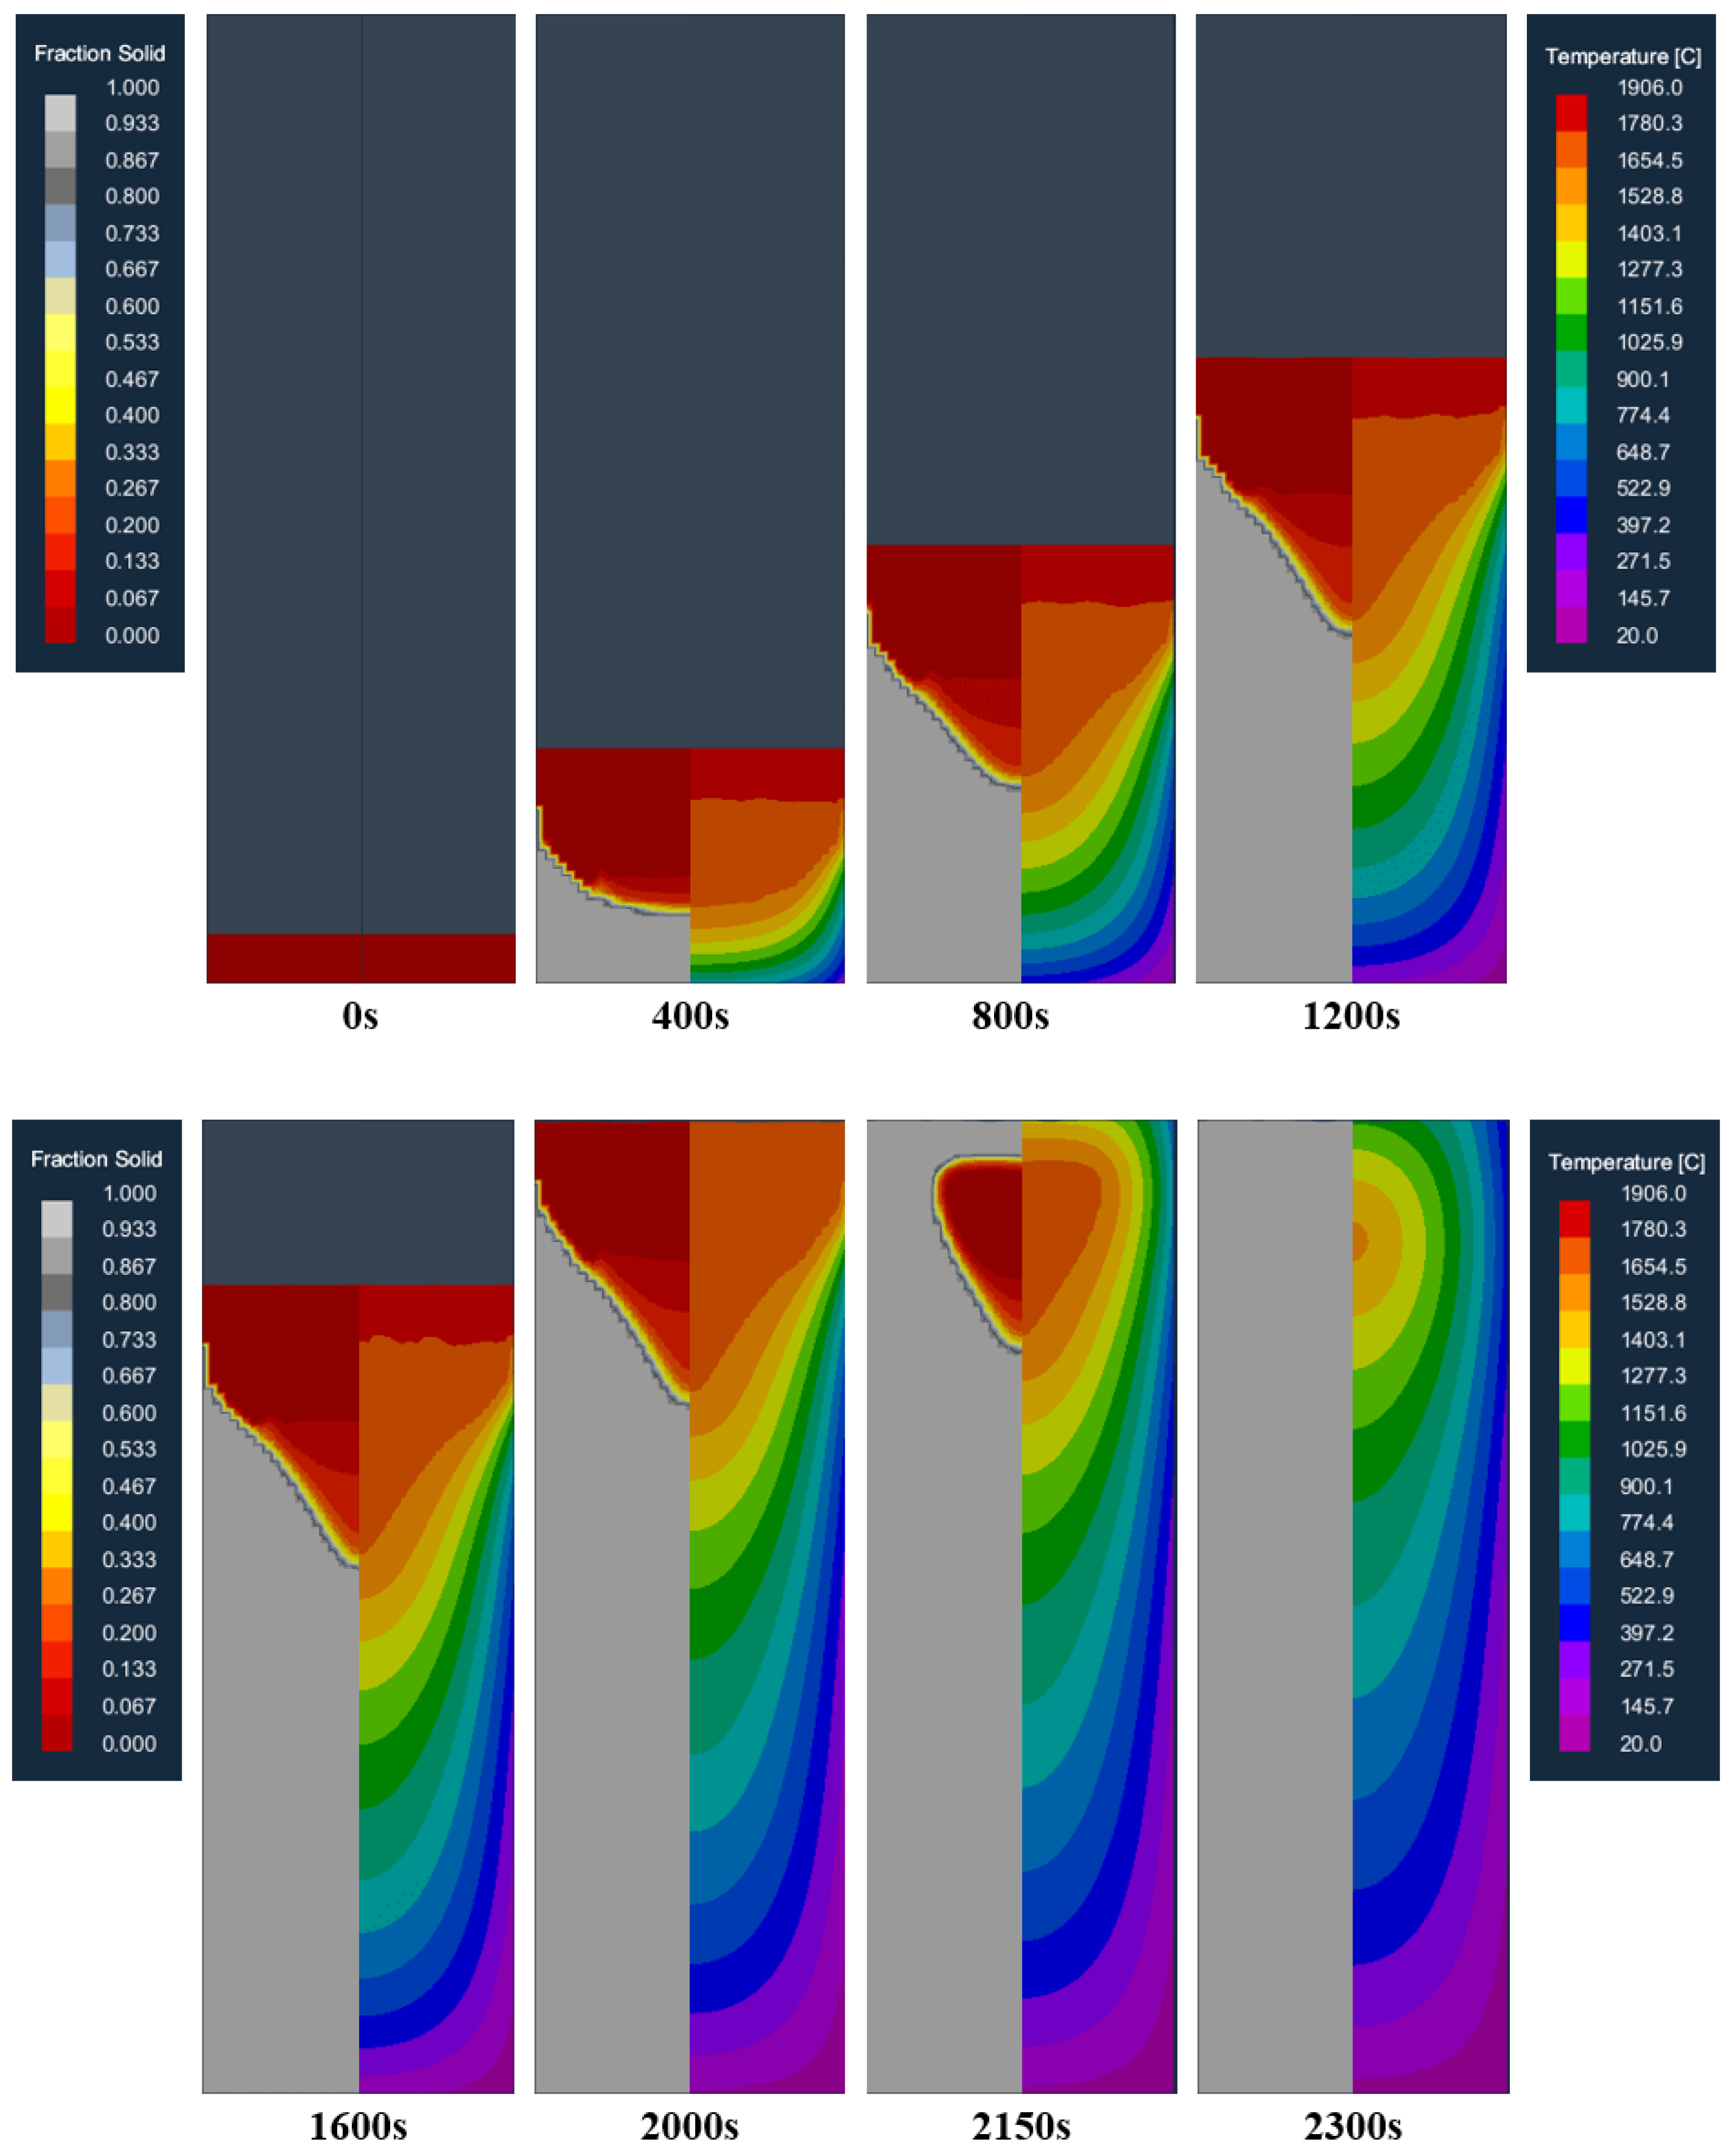
Figure 6 shows the distribution of the temperature field and the solid fraction at different moments in the longitudinal section of the model during the smelting process. As can be seen from the picture, at the beginning of melting, the molten pool can be effectively cooled at the bottom of the crucible so that the molten metal can rapidly solidify after entering the crucible, forming a flat and shallow molten pool (400 s). As the ingot increases gradually, the heat transfer to the bottom of the crucible is slowed down, and the heat released through the crucible is less than the heat released by the solidification of the liquid metal, and the accumulation of heat makes the molten pool gradually deepen. The shape of the molten pool gradually evolved from a flat shape to a funnel shape (800, 1200 s). With the increase in the depth of the molten pool, the contact area between the molten pool and the crucible wall increases, and the heat generation and dissipation in the crucible gradually reach a balance, forming a stable molten pool (1200, 1600 s), that is, reaching a stable melting stage. After that, the shape and depth of the molten pool do not change greatly until the electrode is melted (2000 s). After the electrode melting is completed, the ingot enters the capping stage. Affected by the radiation heat transfer on the top surface of the ingot, the top surface of the ingot begins to solidify, and the liquid core gradually shrinks until it is completely solidified (2150, 2300 s).
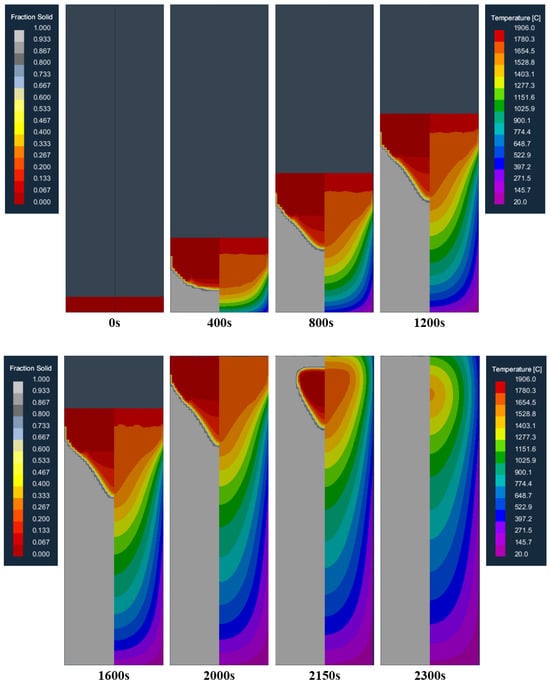
Figure 6.
Distribution of the temperature field and solid fraction at different moments in the longitudinal section of the model during the smelting process.
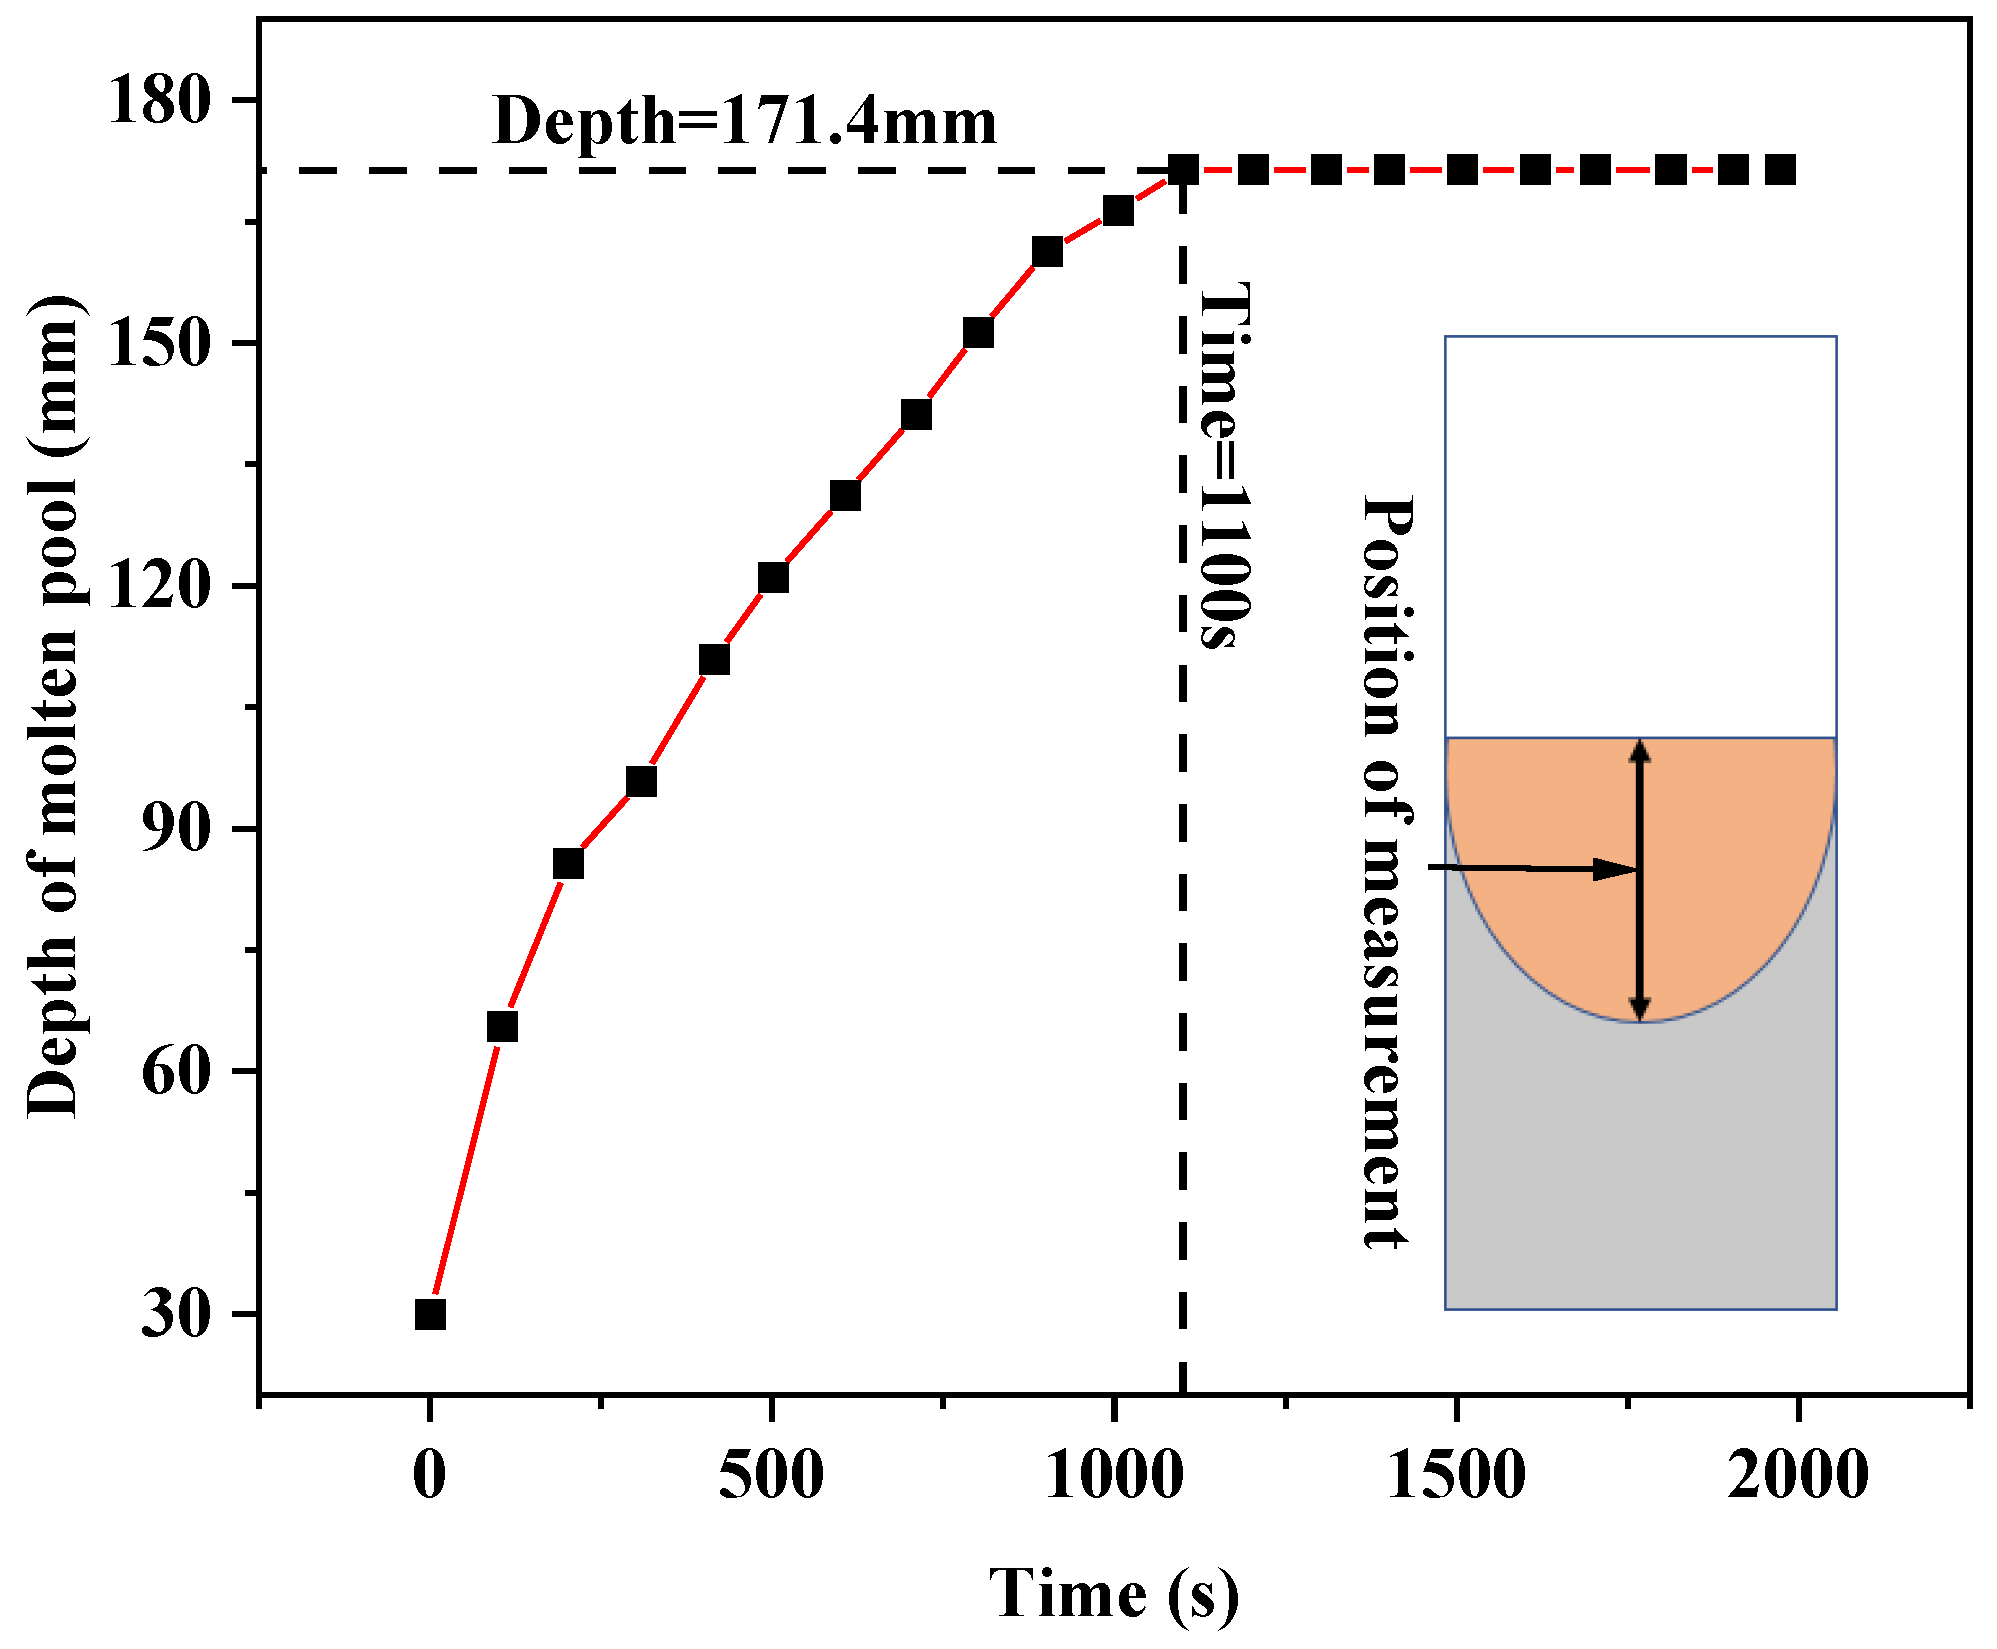
Figure 7 shows the variation of the molten pool depth over time by extracting the molten pool depth at different times in the melting process. It can be seen from the figure that after the beginning of smelting, the depth of the molten pool gradually increases, and it basically distributes linearly with time. At 1100 s, the depth of the molten pool reaches the maximum value of 171.4 mm, and then the depth of the molten pool remains unchanged. This is consistent with the results in Figure 6.
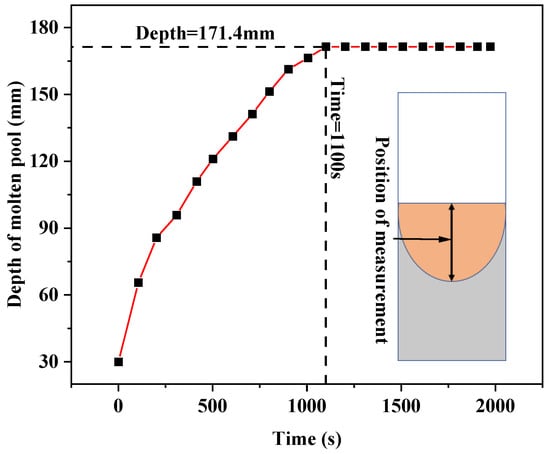
Figure 7.
Variation of molten pool depth with time in the melting process.
3.2. Changes in the Solidification Structure of the Ingot during Melting
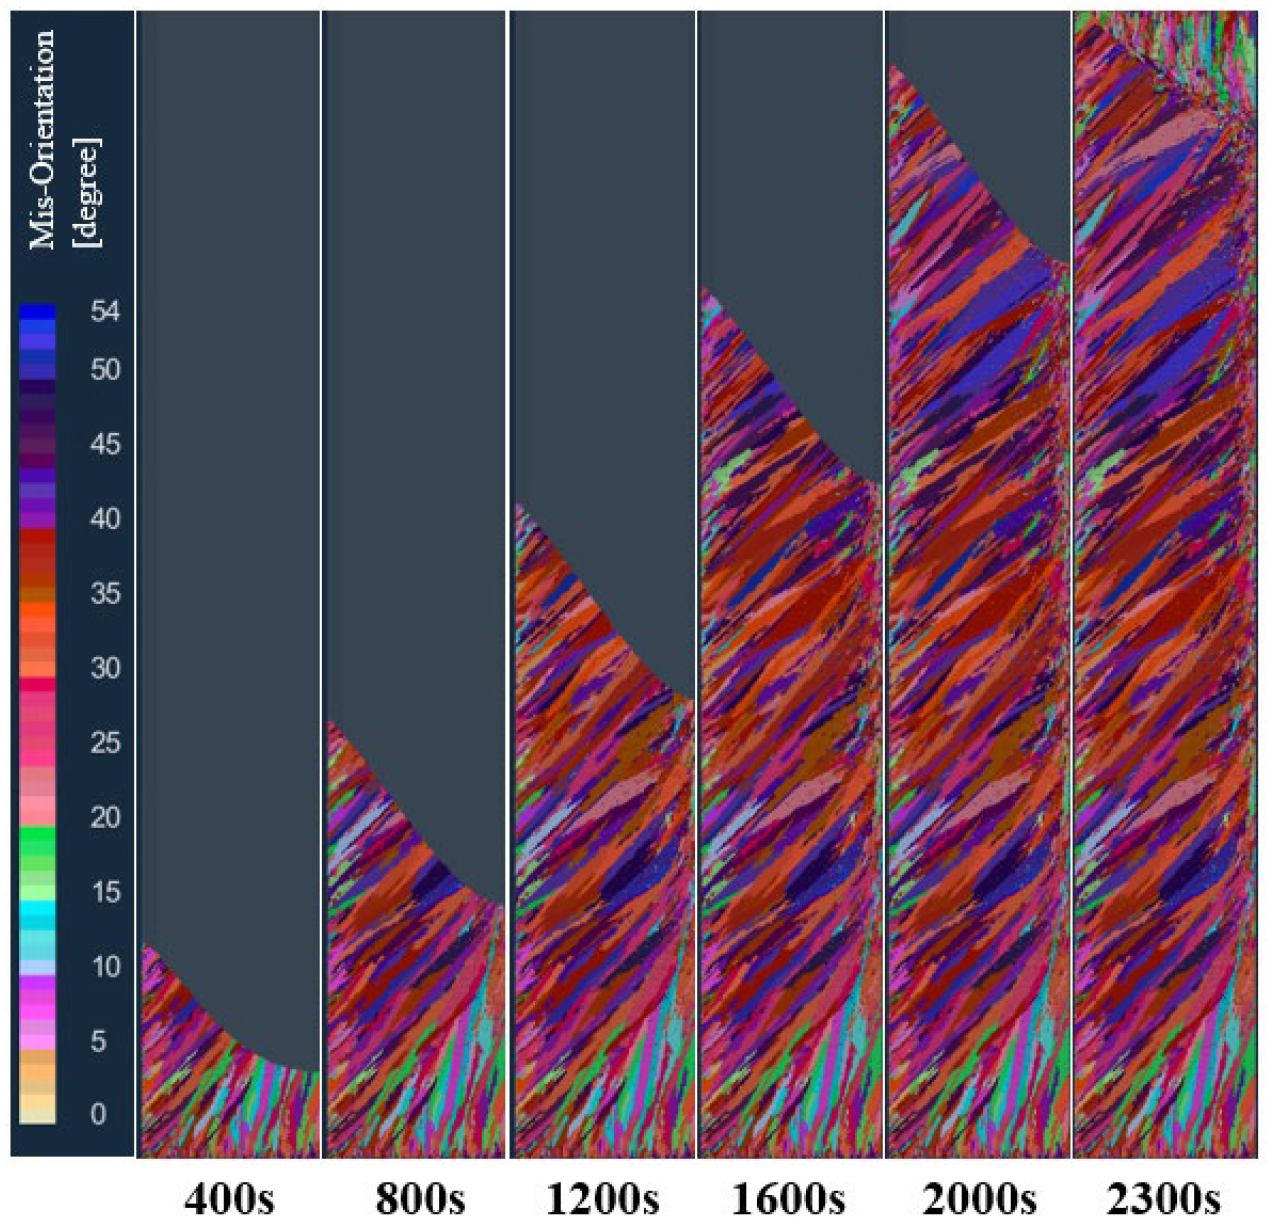
The solidification structure of the longitudinal section of the model at different times in the vacuum arc remelting process is shown in Figure 8. As can be seen from the figure, at the early stage of melting, when the high-temperature melt enters the water-cooled copper crucible, a layer of melt in contact with the crucible is strongly chilled. The bottom and wall of the crucible can be used as the heterogeneous nucleation base, so a large amount of nucleation near the crucible forms a thin layer of a fine grain zone on the surface of the ingot. As the melting proceeds, the latent heat of solidification continues to be released, which increases the melt temperature at the solidification front. At this time, the temperature gradient at the front of the solidification interface is large, and some fine grains grow in the form of dendrites. These preferentially grown dendrites form a columnar crystal zone with a certain preferred orientation. When the smelting enters the final stage, the melt temperature in the molten pool of the ingot continues to decrease, and there is enough heterogeneous nucleation substrate in the remaining melt at the center of the ingot, so the nucleation is almost simultaneous in the remaining melt, and the grains grow freely in the melt. The formed equiaxed crystal hinders the growth of columnar crystals, and the transformation of the columnar crystal to an equiaxed crystal occurs. Therefore, there are typically three crystal regions in the solidification structure of the vacuum arc remelting titanium alloy ingot: the surface fine crystal region, columnar crystal region, and central equiaxed crystal region.

Figure 8.
Changes in the solidification structure of the ingot at different times in the longitudinal section of the model during melting.
3.3. Effects of Different Bulk Nucleation Parameters on the Solidification Structure of Ingots
As can be seen from Figure 2, two different sets of nucleation parameters are used on the surface and inside of the ingot. In the case that the simulated boundary conditions and physical property parameters are determined, the nucleation parameters need to be determined according to experience. In order to obtain accurate nucleation parameters, the influence of different nucleation parameters on the solidification structure was studied. At the same time, in order to simplify the calculation, this paper only studied the bulk nucleation parameters, which have a great influence on the solidification structure of the ingot. The surface nucleation parameters are fixed as follows: the maximum surface nucleation undercooling = 5 K, surface nucleation standard deviation = 0.1 K, maximum surface nucleation density = 5 × 10⁷.
In order to study the influence of the three bulk nucleation parameters of the maximum bulk nucleation undercooling, , the standard deviation of the bulk nucleation, , and the maximum bulk nucleation density, , on the solidification structure, seven schemes were set in the simulation calculation for comparative analysis, as shown in Table 3. Among them, schemes a, b, and c are examples under different maximum bulk nucleation undercoolings, schemes d, b, and e are examples under different maximum bulk nucleation standard deviations, and schemes f, b, and g are examples under different maximum bulk nucleation densities.
Table 3.
Calculation schemes of different body nucleation parameters.
3.3.1. Effect of Maximum Bulk Nucleation Undercooling on the Solidification Structure of Ingots
In order to study the effect of maximum bulk nucleation undercooling on the solidification structure of an ingot, the maximum bulk nucleation undercooling was set to 3, 5.5, and 8 K, respectively, in schemes a, b, and c, while other nucleation parameters and process parameters remained unchanged. Figure 9 shows the comparison of solidification structures at different maximum bulk nucleation undercooling levels in the longitudinal section of the model after solidification. As can be seen from the figure, when the maximum bulk nucleation undercooling is 3 K, the solidification structure is divided into an obvious columnar crystal zone and a central equiaxed crystal zone. With the increase in the maximum bulk nucleation undercooling, the proportion of columnar crystals in the solidification structure gradually increases, and the proportion of central equiaxed crystals gradually decreases. When the maximum bulk nucleation undercooling is greater than 8 K, the solidification structure becomes a columnar crystal. This shows that the maximum body nucleation undercooling has a significant effect on the different crystal regions of the solidification structure of the ingot. The larger the maximum body nucleation undercooling, the greater the proportion of columnar crystal regions in the solidification structure of the ingot. This is because the growth rate of the grain is proportional to the square of the undercooling. If the nucleation undercooling increases, the amount of nucleation in the melt decreases at the same time, and the front end of the columnar crystal solidification lacks sufficient grain blocking, rapid growth is obtained, and the proportion of the obtained columnar crystal zone increases.
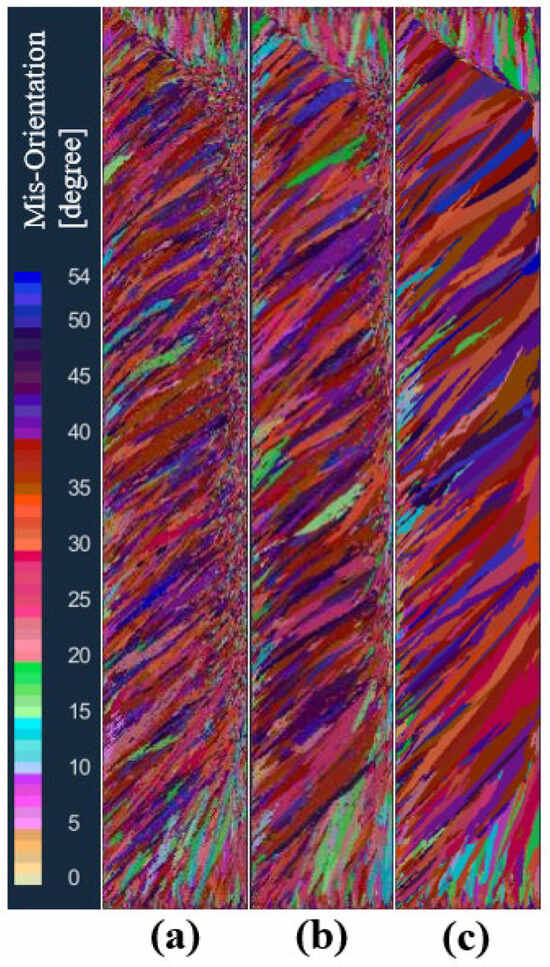
Figure 9.
Comparison of solidification structures at different maximum bulk nucleation undercoolings: (a) 3 K, (b) 5.5 K, (c) 8 K.
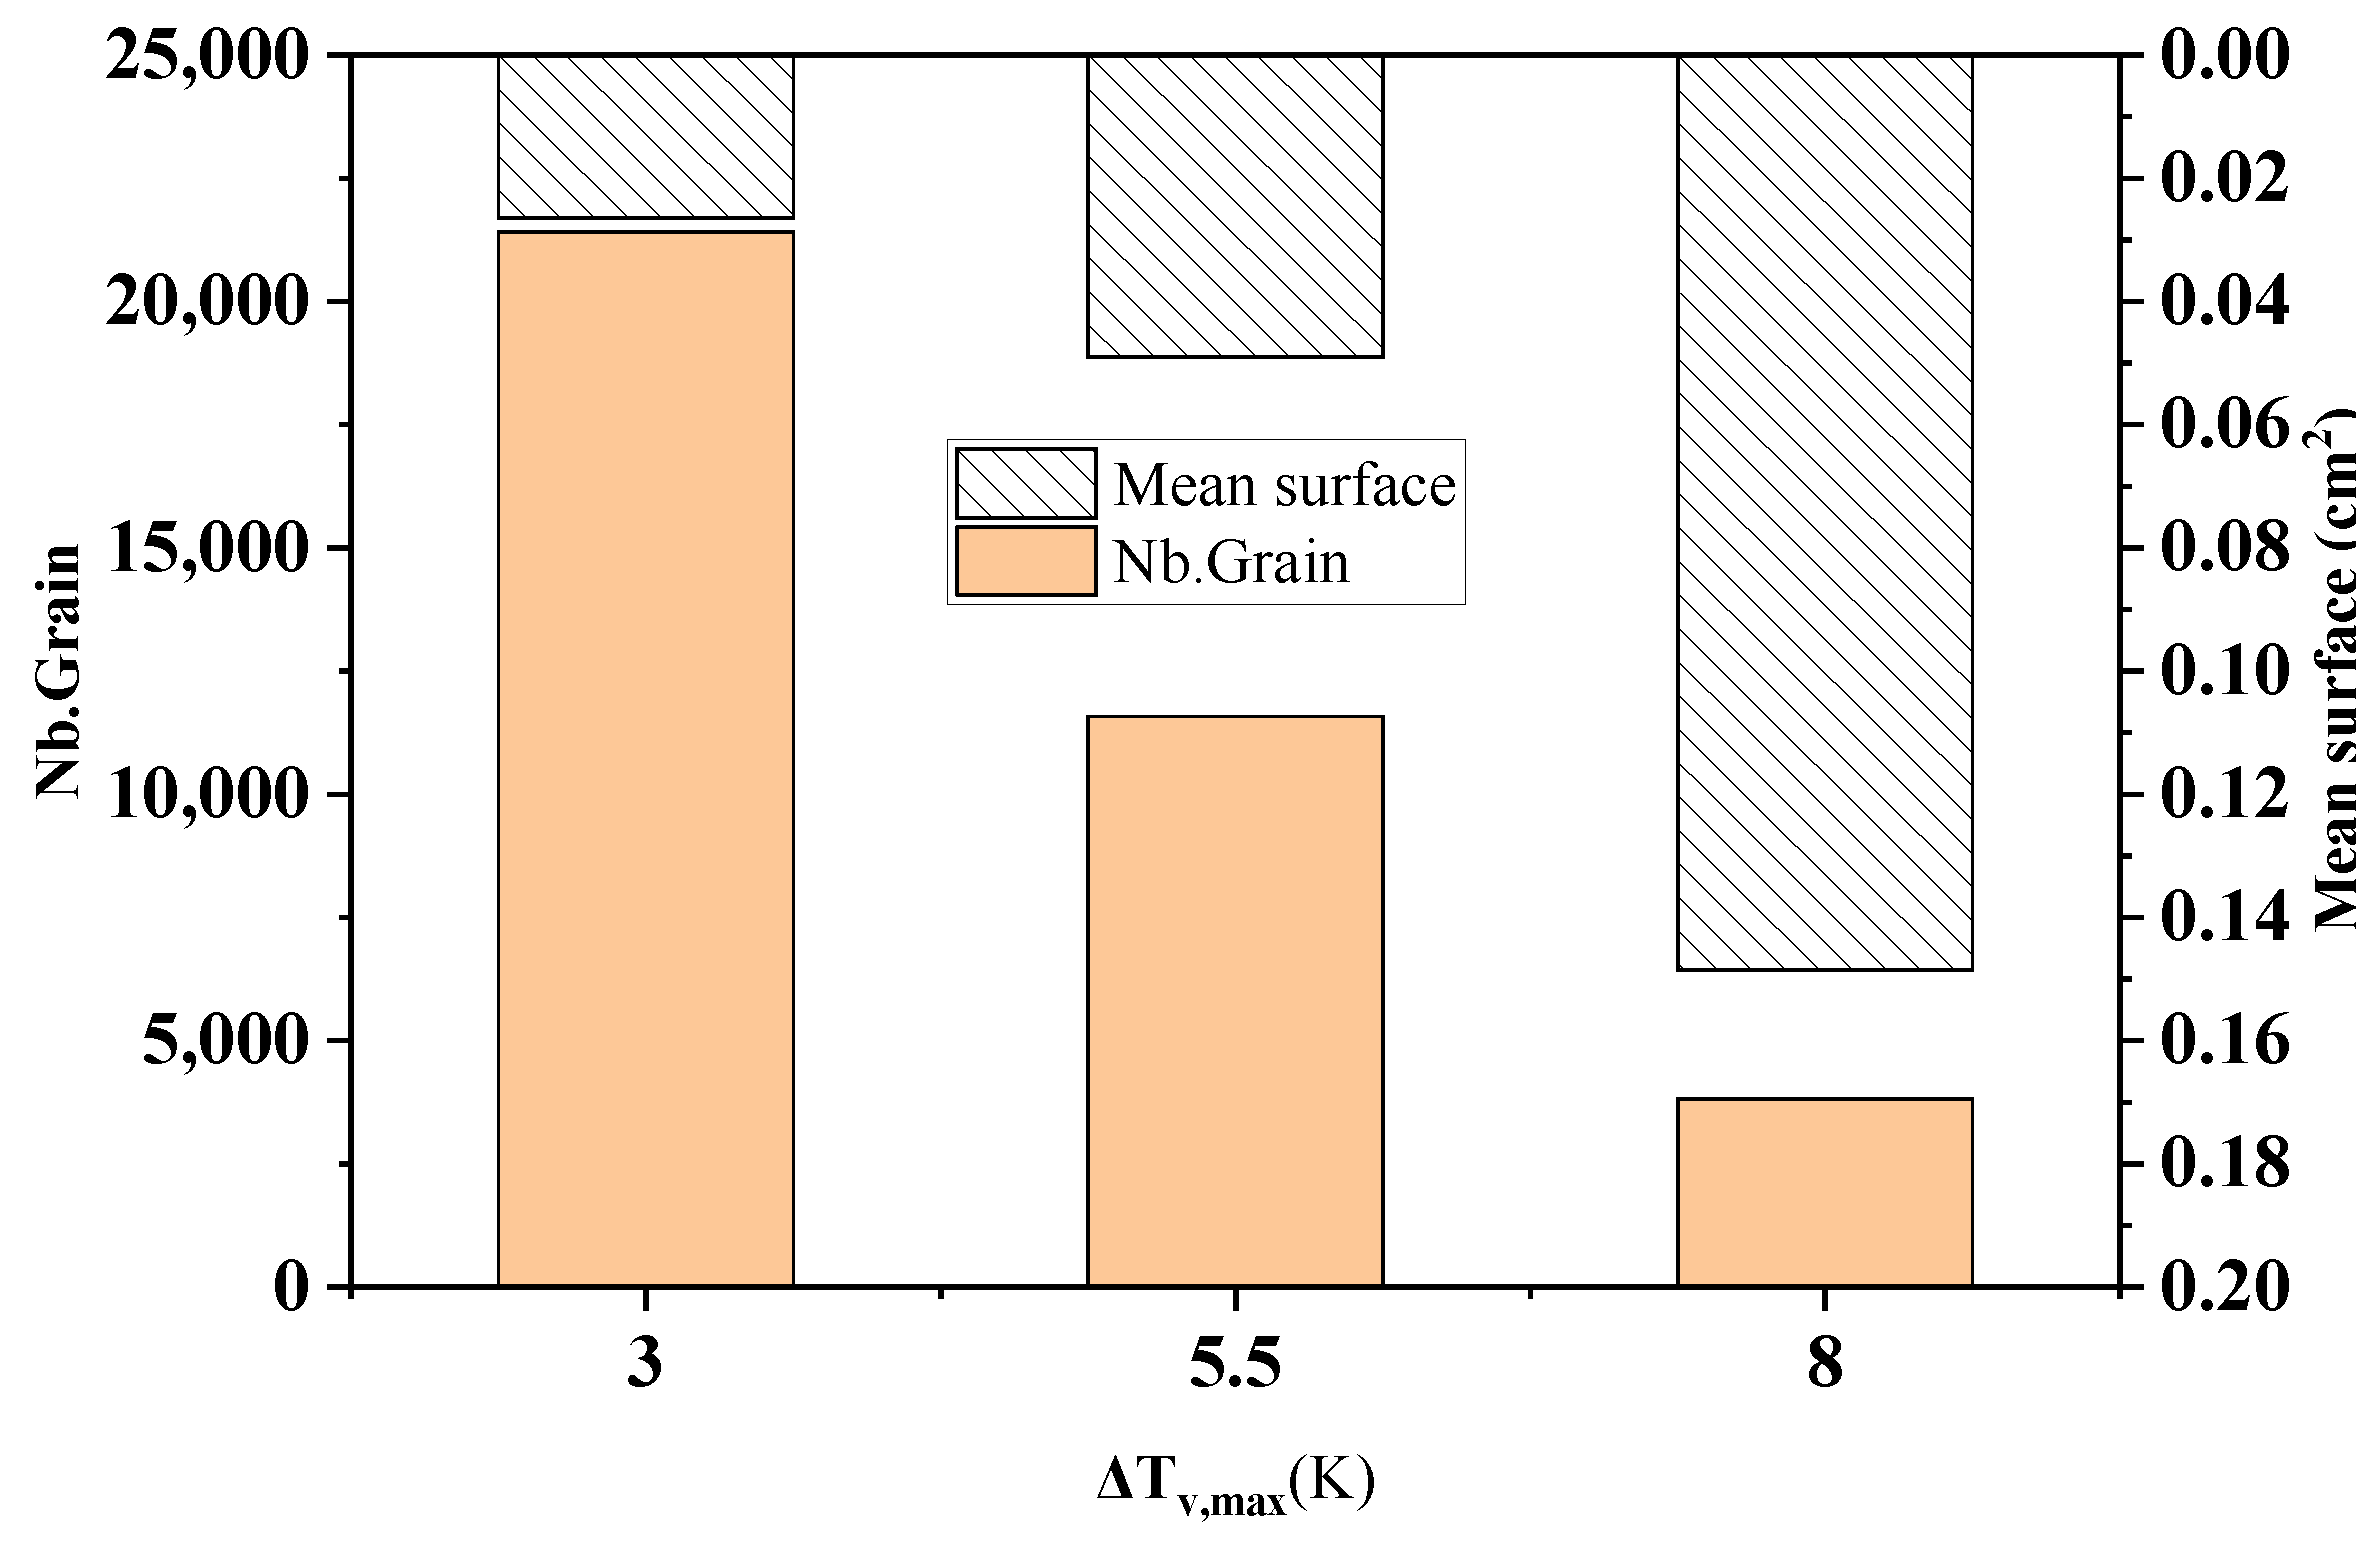
Figure 10 shows the comparison of the statistical results of the grain number and average grain area at different maximum bulk nucleation undercooling levels in the longitudinal section of the model at the end of solidification. As can be seen from the figure, when the maximum bulk nucleation undercooling increases from 3 K to 8 K, the solidification grain number decreases sharply from 21418 to 3818, with a decrease of 82.2%. The average grain area increases from 0.0265 cm2 to 0.149 cm2, with an increase of 82.2%. This echoes the simulation results in Figure 9.
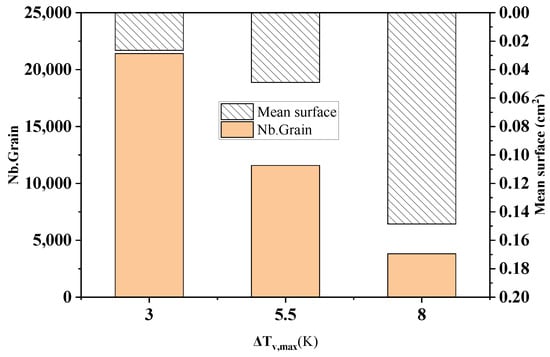
Figure 10.
Changes in the grain number and average grain area under different maximum bulk nucleation undercooling levels.
3.3.2. Effect of the Maximum Nucleation Density on the Solidification Structure of an Ingot
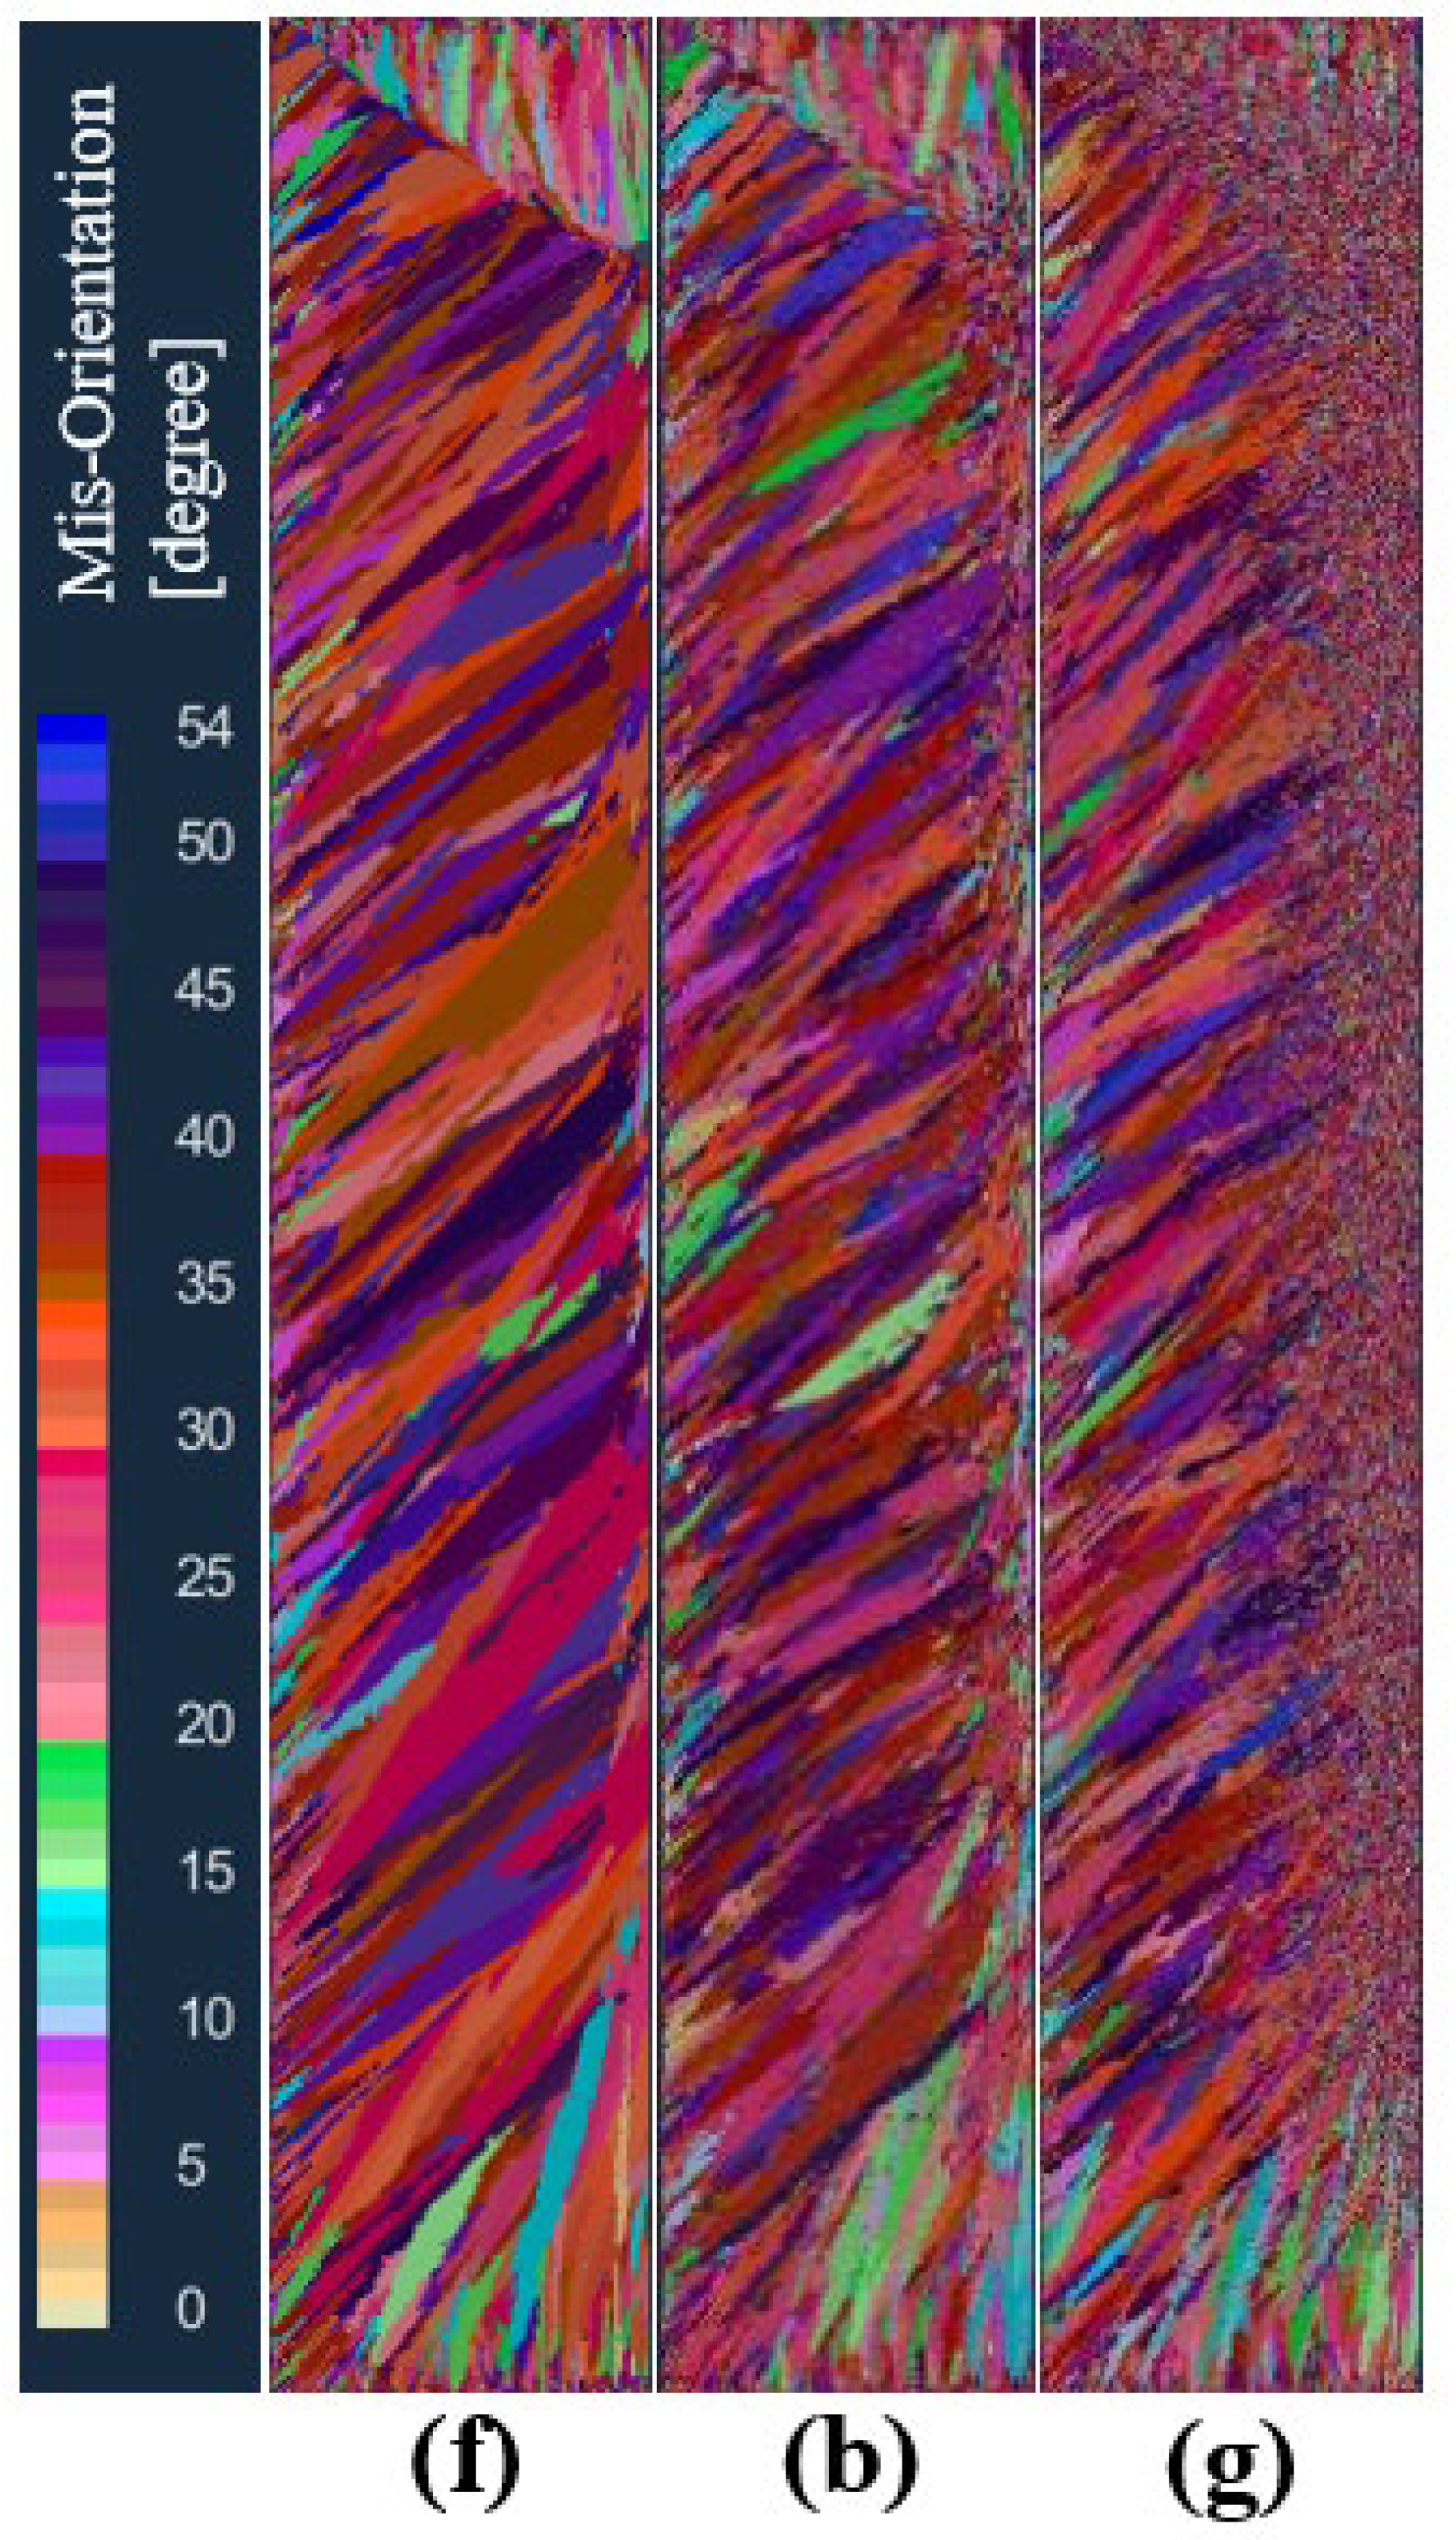
In order to study the effect of the maximum bulk nucleation density on the solidification structure of an ingot, the maximum bulk nucleation density was set to 5 × 10⁷, 5 × 10⁸, and 5 × 10⁹, respectively, in schemes f, b, and g under the condition that other nucleation parameters and process parameters remained unchanged. Figure 11 shows the comparison of solidified structures at different maximum bulk nucleation densities in the longitudinal section of the model after melting. As can be seen from the figure, when the maximum bulk nucleation density is 5 × 10⁷, the solidification structure only has a columnar crystal zone. When the maximum bulk nucleation density increases to 5 × 10⁸, the solidification structure produces an obvious central equiaxed crystal zone. When the maximum bulk nucleation density is further increased to 5 × 10⁹, the equiaxed grain zone in the center of the solidification structure becomes larger, the equiaxed grain zone becomes smaller, and the columnar grain zone becomes smaller. This shows that as the bulk nucleation density of the grains in the melt increases, the grain size becomes smaller in a certain cross-section, the equiaxed grain zone gradually increases, and the columnar grain zone is suppressed.

Figure 11.
Comparison of the solidification structures at different maximum bulk nucleation densities: (f) 5 × 10⁷, (b) 5 × 10⁸, (g) 5 × 10⁹.
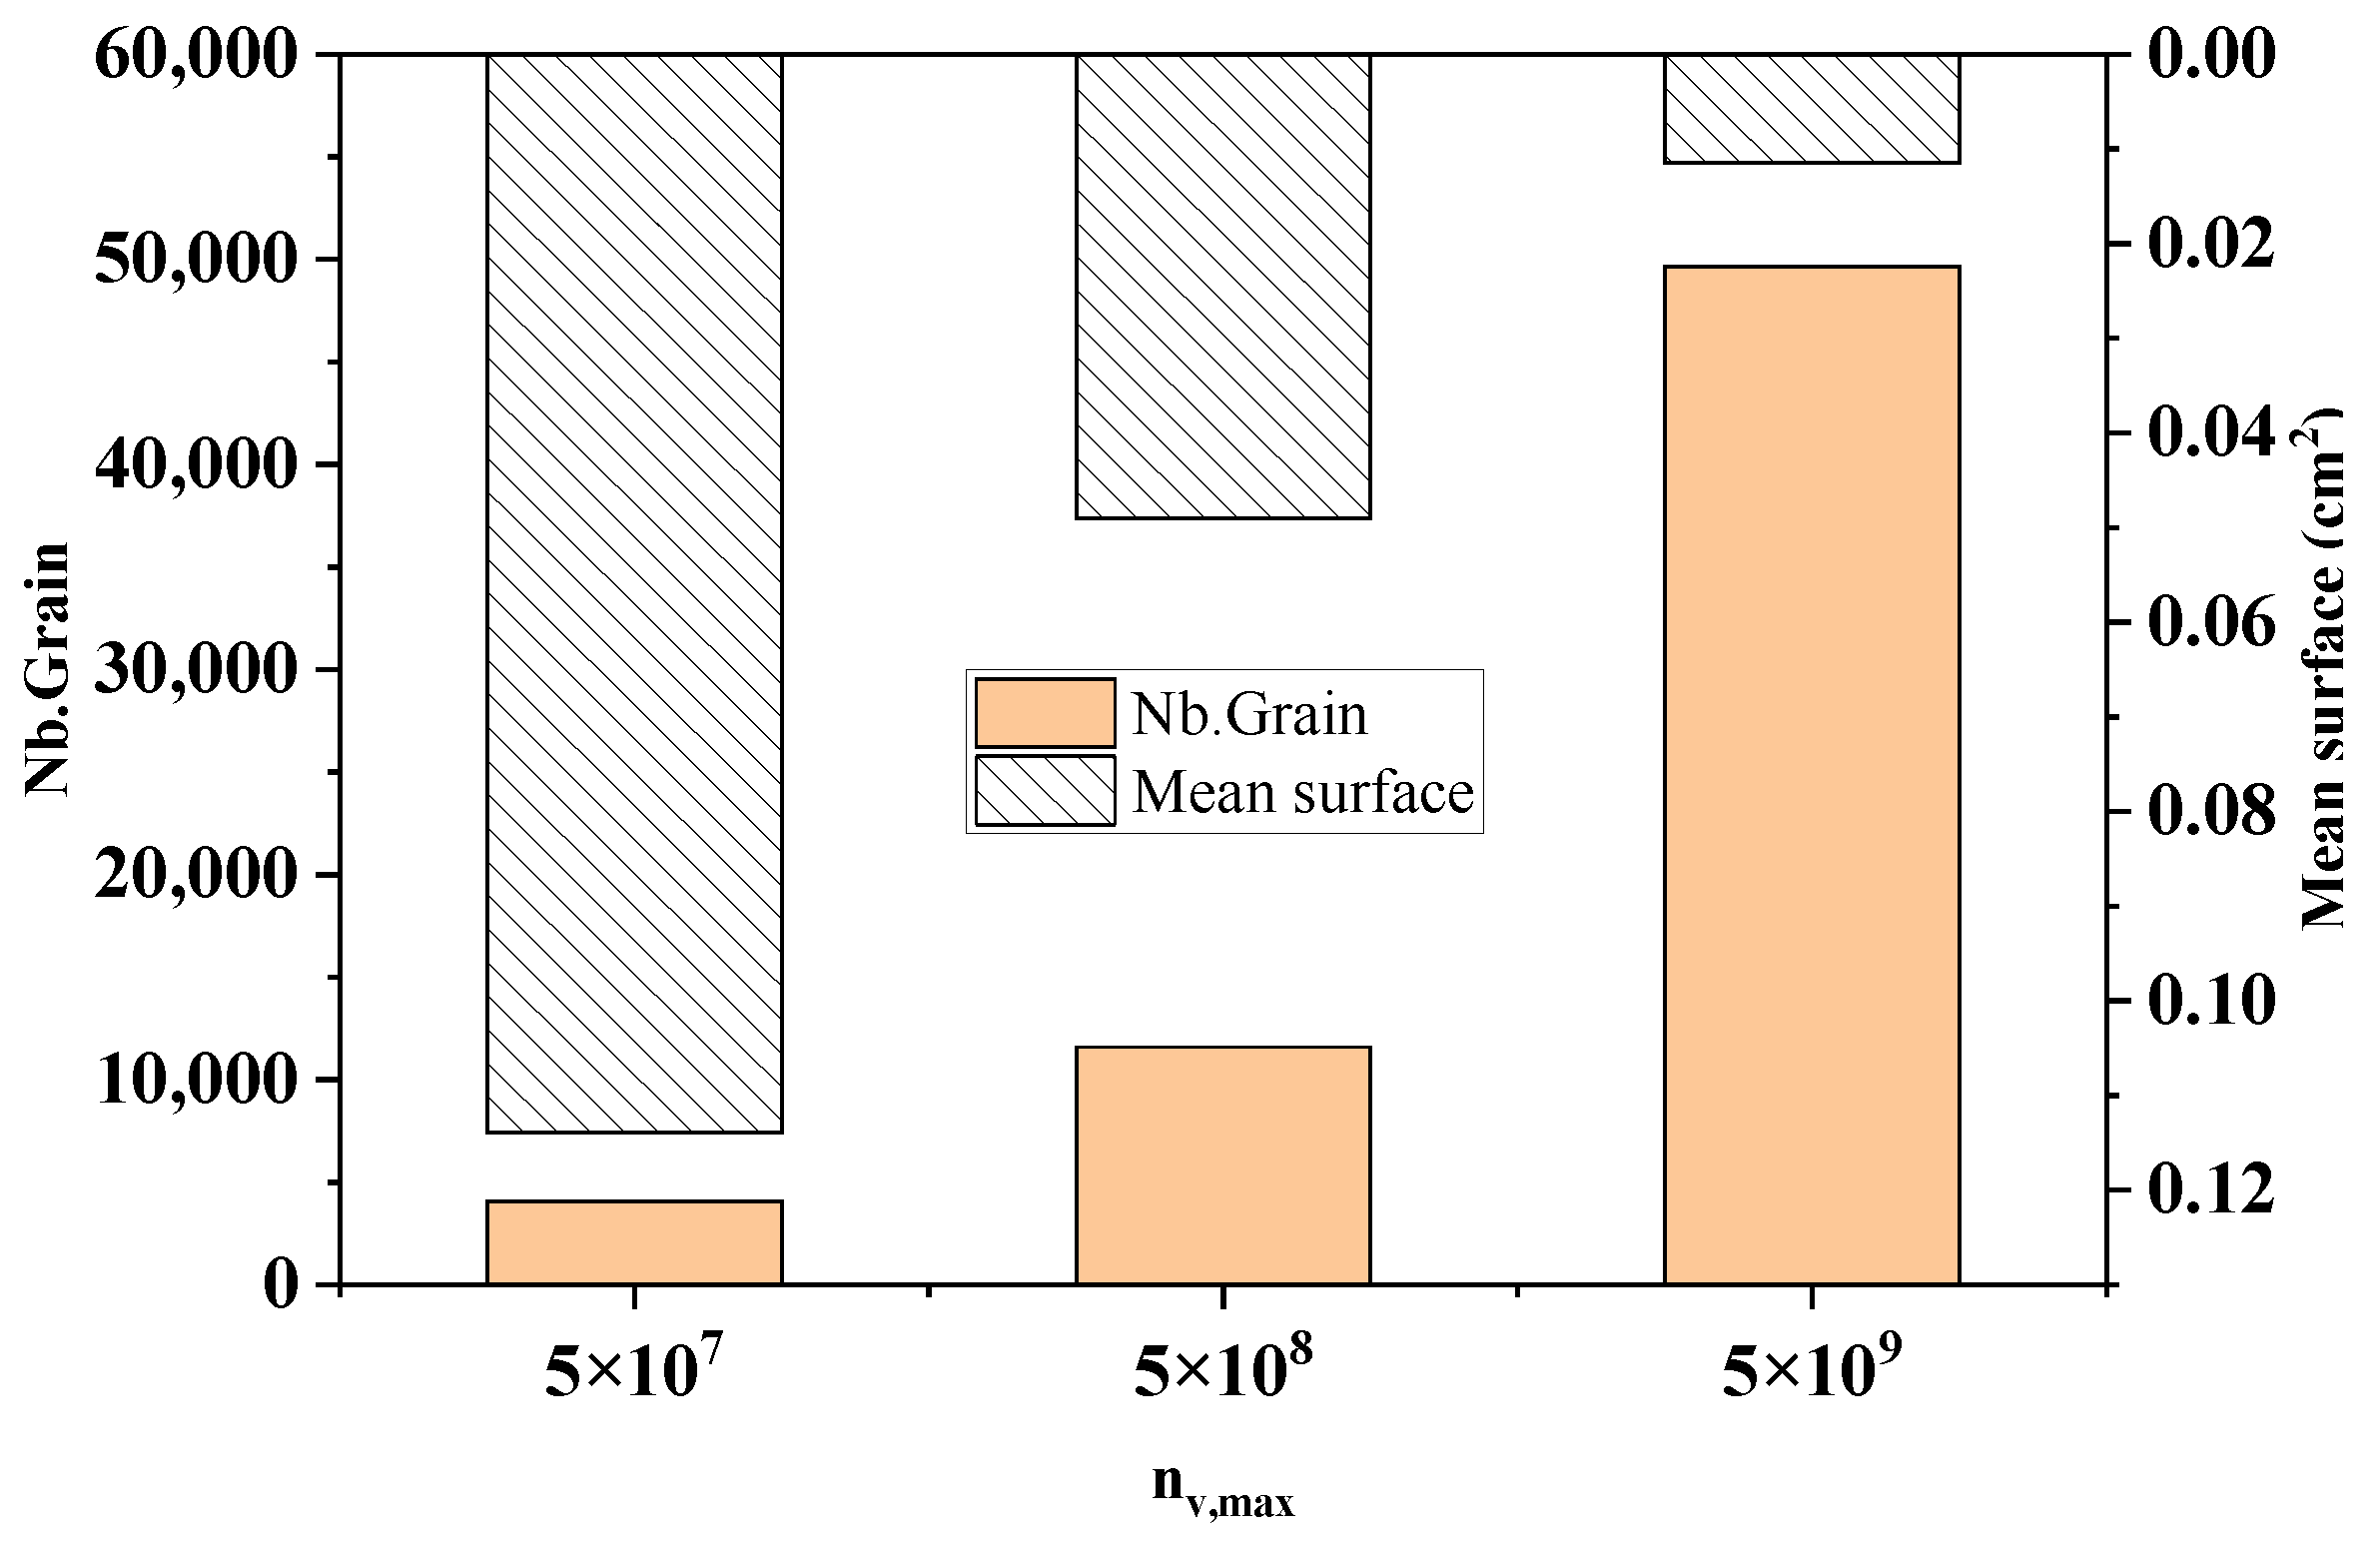
Figure 12 shows the comparison of the statistical results of the grain number and average grain area at different maximum bulk nucleation densities in the longitudinal section of the model at the end of solidification. As can be seen from the figure, when the maximum bulk nucleation density increased from 5 × 10⁷ to 5 × 10⁹, the number of crystallized grains increased sharply from 4076 to 49,637, with an increase of 91.8%. The average grain area reduced from 0.114 cm2 to 0.0114 cm2 by 90%. This echoes the simulation results in Figure 11.
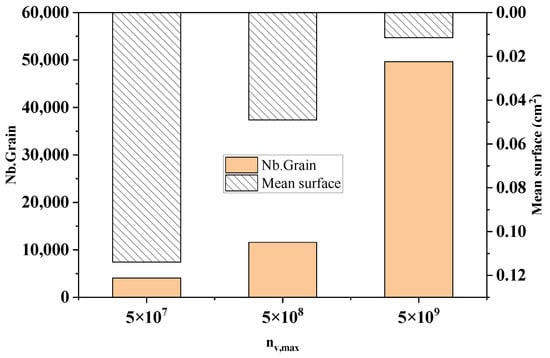
Figure 12.
The change in the grain number and average grain area with different maximum nucleation densities.
3.3.3. The Influence of the Maximum Bulk Nucleation Standard Deviation on the Solidification Structure
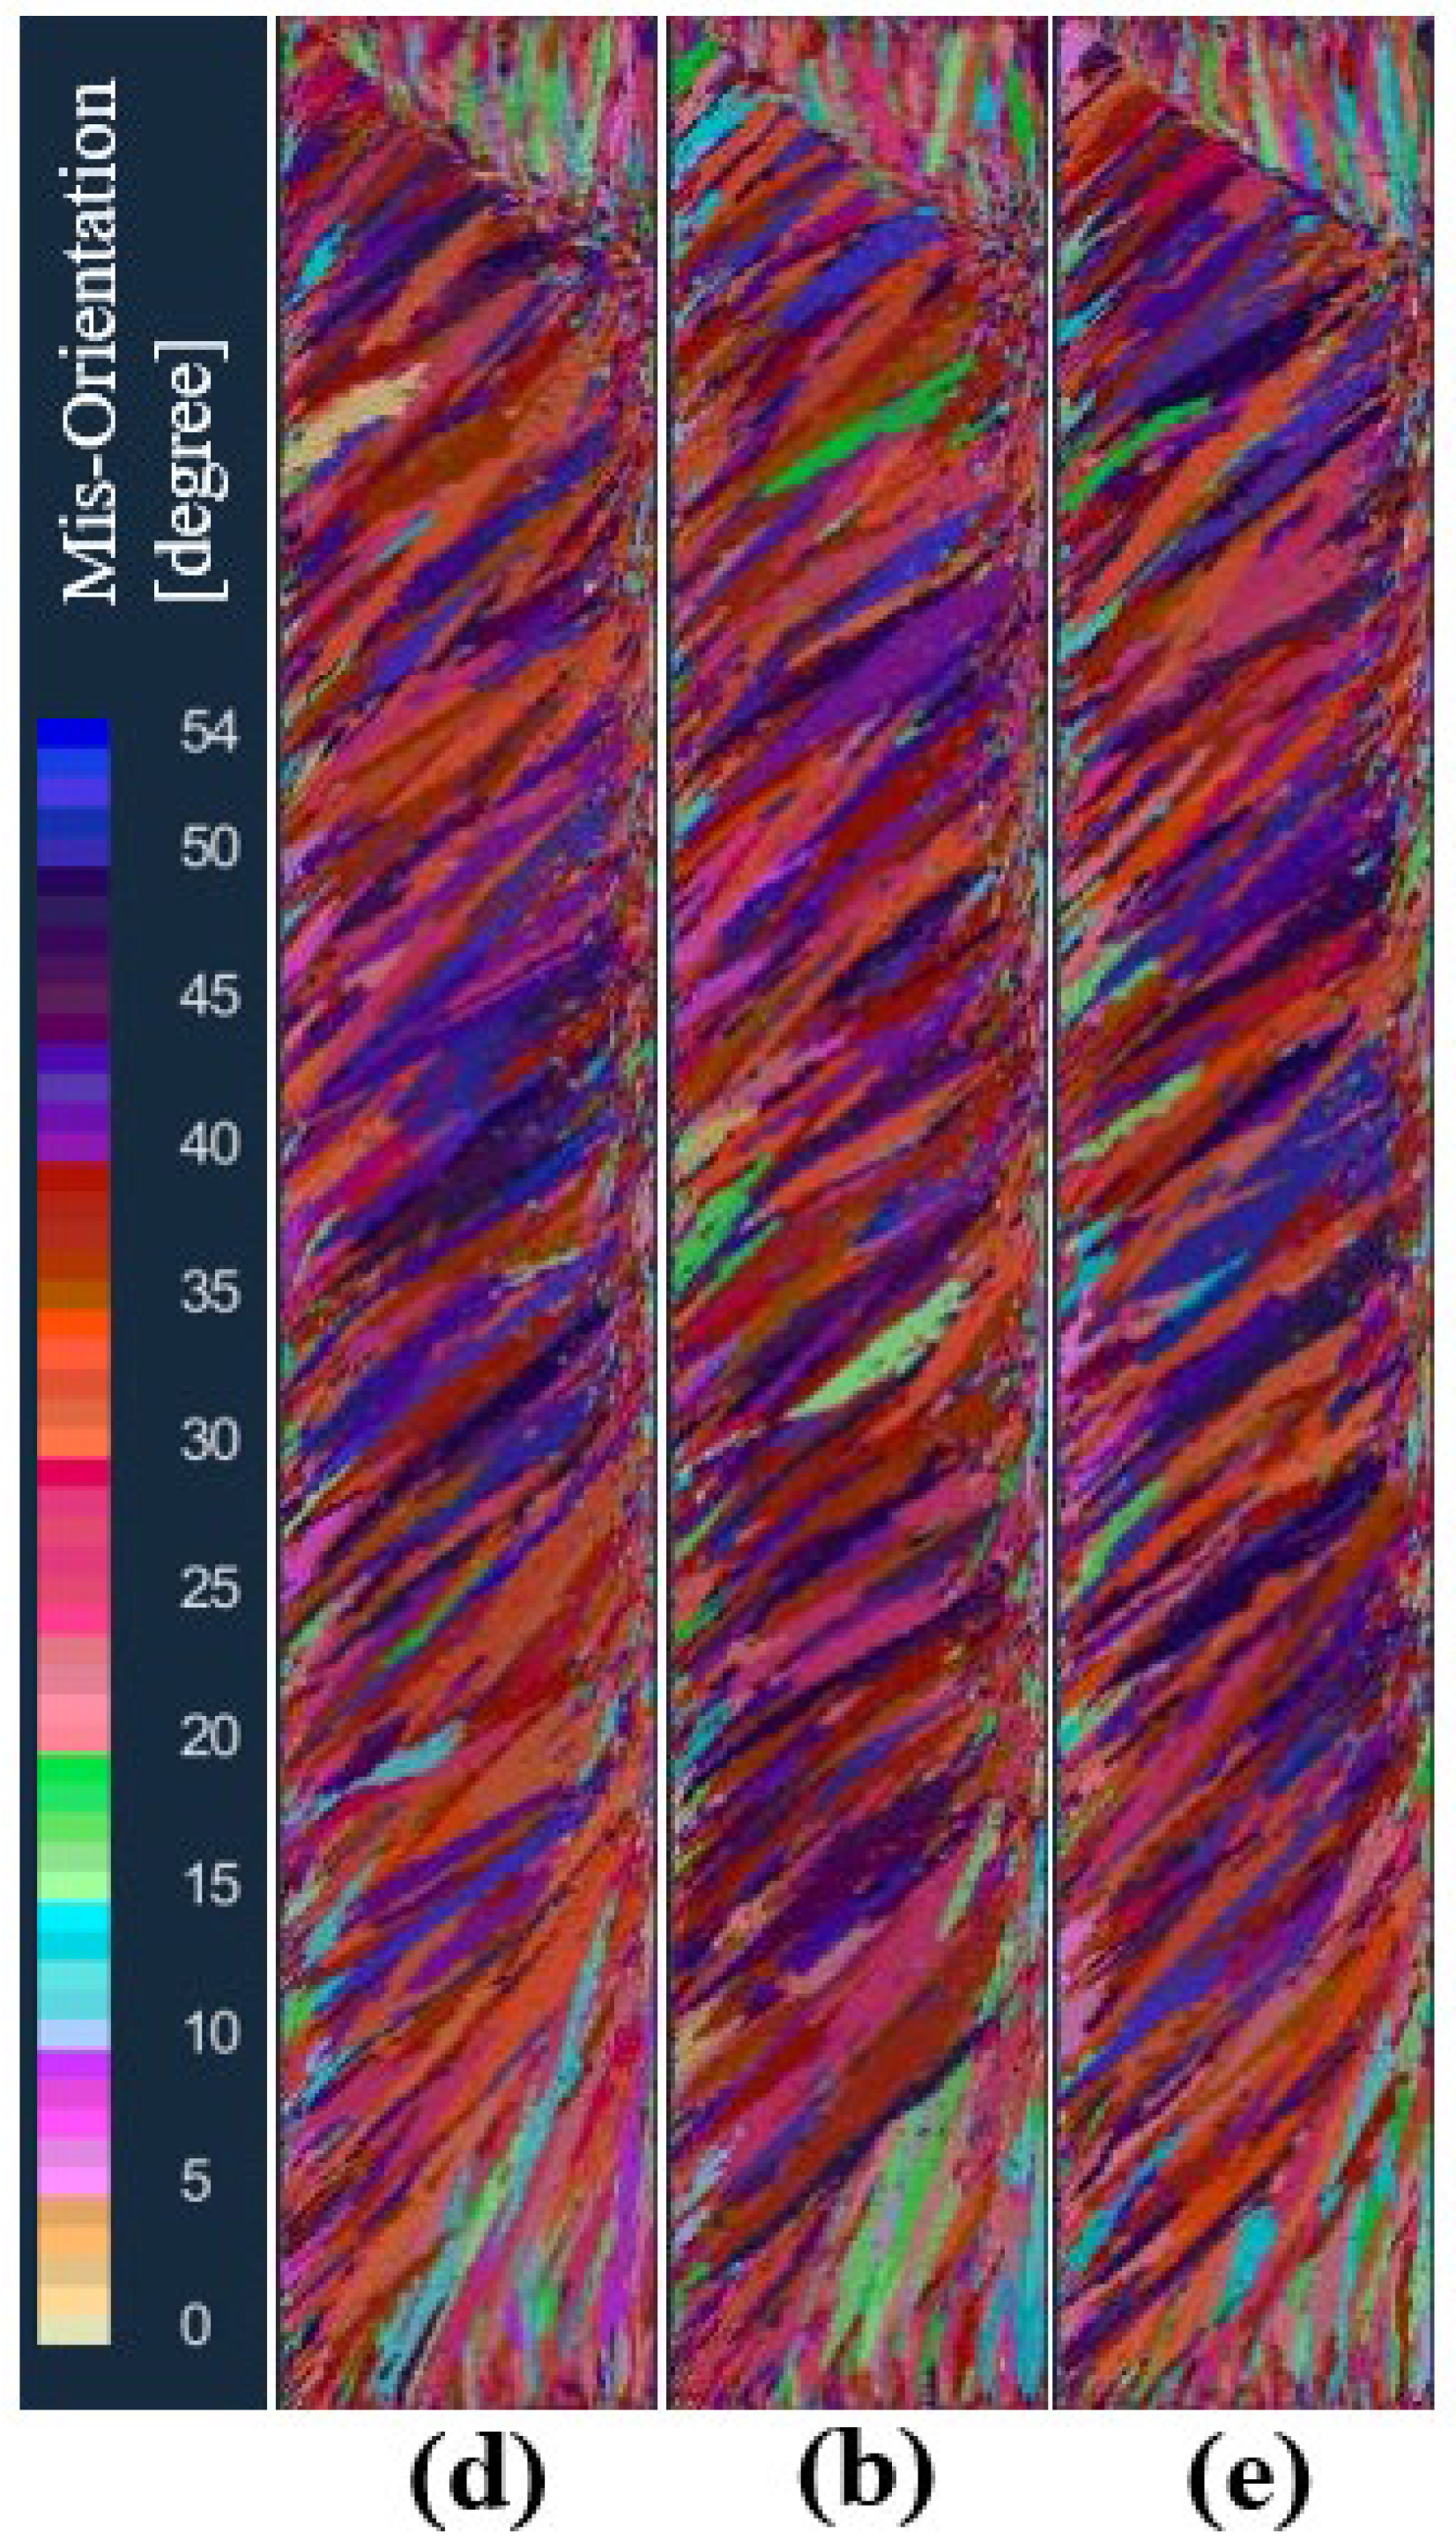
In order to study the influence of the standard deviation of the maximum body nucleation on the solidification structure of the ingot, under the condition that other nucleation parameters and process parameters remain unchanged, the schemes d, b, and e set the maximum body nucleation standard deviation to 2 K, 4 K, and 6 K, respectively, for the solidification structure calculation. Figure 13 is the solidification structure comparison of different maximum body nucleation standard deviations at the longitudinal section of the model after melting. It can be seen from the figure that the standard deviation of the maximum body nucleation increased from 2 K to 6 K, and the solidification structure did not change significantly.
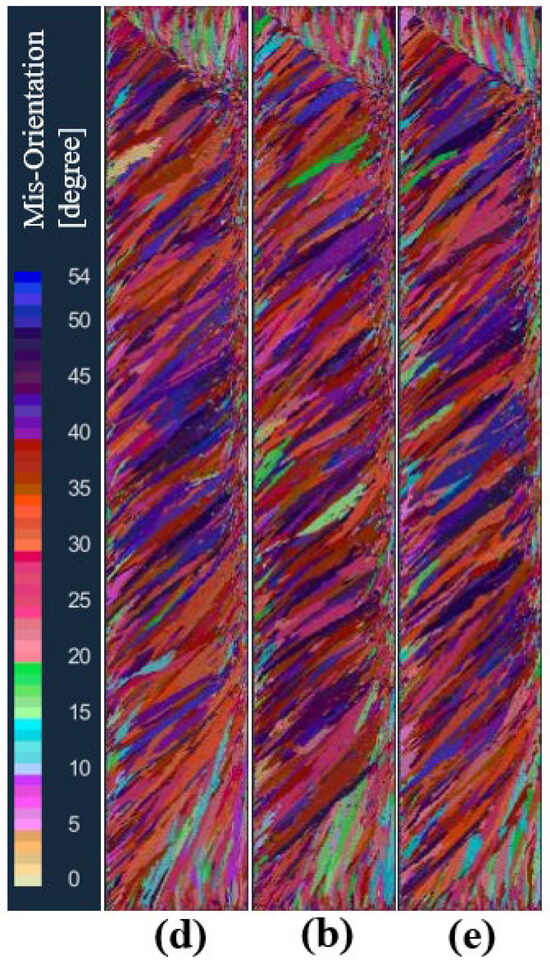
Figure 13.
Comparison of the solidification structures at different maximum bulk standard deviations of body nucleation: (d) 2 K, (b) 4 K, (e) 6 K.
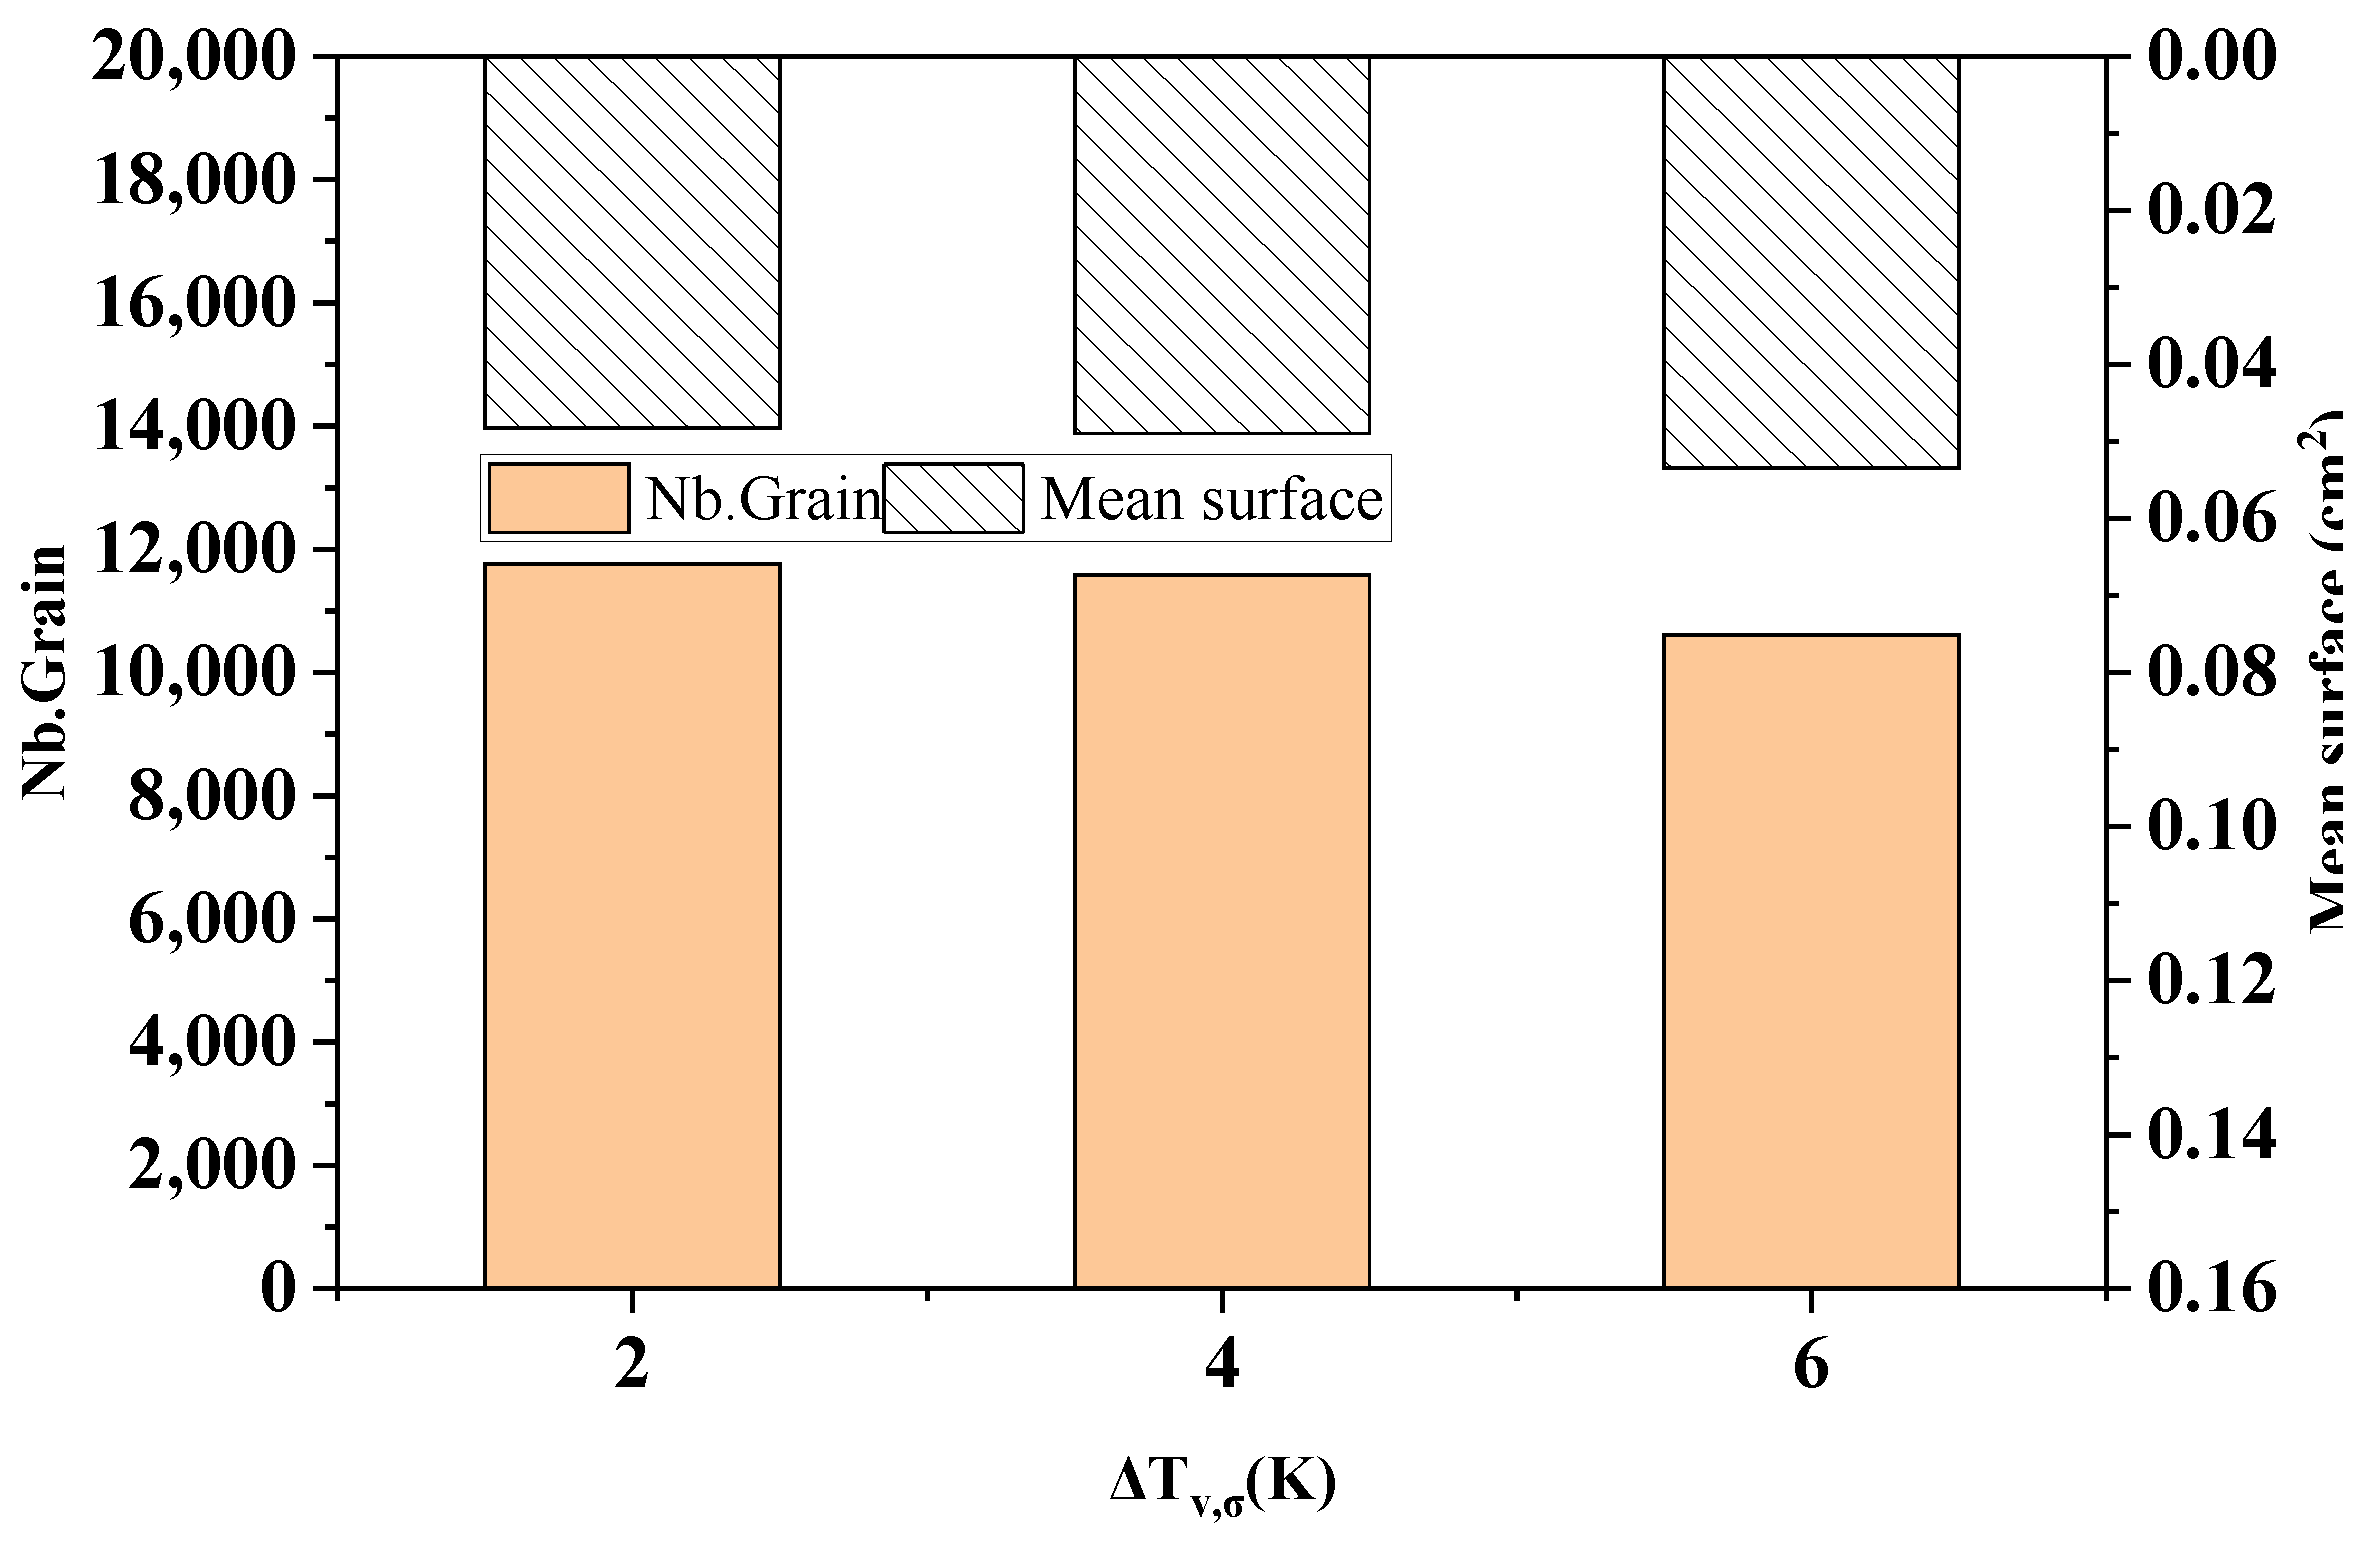
Figure 14 shows the comparison of the statistical results of the grain number and average grain area at different standard deviations of the maximum body nucleation in the longitudinal section of the model after solidification. As can be seen from the figure, when the maximum body nucleation standard deviations are 2 K, 4 K, and 6 K, the solidification microstructure grain numbers are 11,759, 11,583, and 10,612, which decrease slightly by 1.5% and 8.4%, respectively. The average grain areas are 0.0482 cm2, 0.0490 cm2, and 0.0535 cm2, respectively, and slightly increased by 1.5% and 9.1%, respectively.
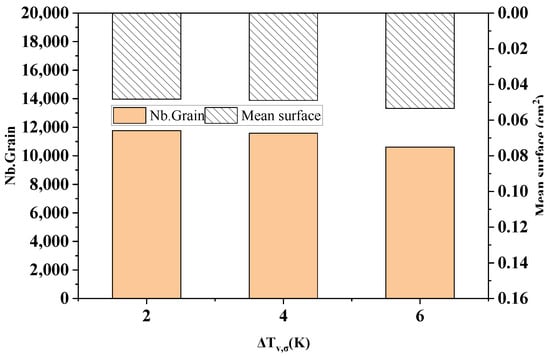
Figure 14.
The change in the grain number and average grain area with different standard deviations of maximum bulk nucleation.
3.4. Comparison between the Simulated and Experimental Results
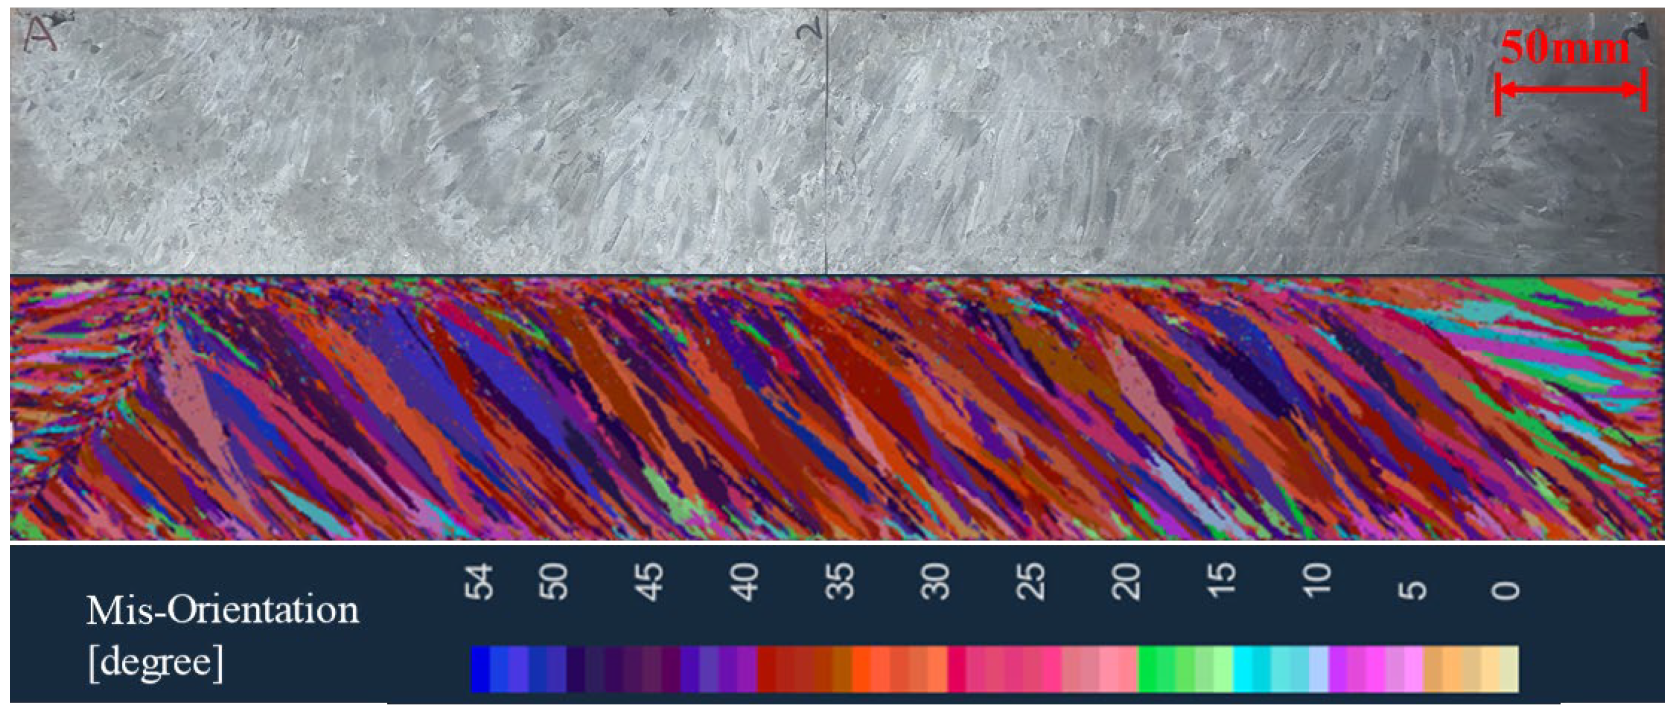
It is necessary to verify the simulation results with the experimental results in order to determine the core parameters of the solidification structure simulation of the ingot. The experimental furnace uses the same process parameters as the numerical simulation to melt the ingot, as shown in Table 2. The solidification structure of the ingot is obtained via the longitudinal section analysis after melting. Figure 15 shows the comparison of the experimental results and simulated results of the solidification structure of the ingot. The bulk nucleation parameters used in the simulation are: the maximum bulk nucleation undercooling = 5.5 K, bulk nucleation standard deviation = 4 K, and maximum bulk nucleation density = 5 × 10⁸. The simulation results of the solidification structure using this bulk nucleation parameter are in good agreement with the experimental results, which can accurately reflect the distribution position, proportion, and size of the equiaxed grains and columnar grains.
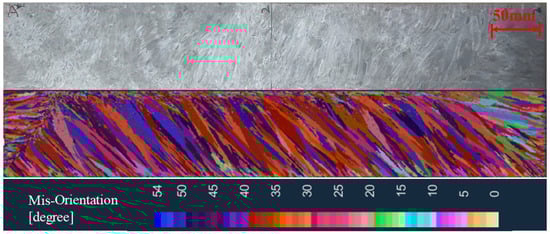
Figure 15.
Comparison of the simulated results and experimental results of the solidification structure.
4. Conclusions
- (1)
- After the start of smelting, the depth of the molten pool gradually increases, and the shape of the molten pool gradually evolves from a flat shape to a funnel shape until a stable molten pool is formed. The depth of the molten pool reaches a maximum of 171.4 mm, and then the depth of the molten pool remains unchanged.
- (2)
- The solidification structure of the vacuum arc remelting process at different times is obtained via a simulation. There are typically three crystal zones in the solidification structure of the ingot: the surface fine crystal zone, columnar crystal zone, and central equiaxed crystal zone.
- (3)
- The maximum body nucleation undercooling has a significant effect on the different crystal regions of the solidification structure of the ingot. The larger the maximum body nucleation undercooling, the larger the proportion of the columnar crystal region; when the maximum nucleation undercooling increases from 3 K to 8 K, the number of grains in the solidified structure decreases by 82.2%.
- (4)
- With the increase in the maximum bulk nucleation density, the equiaxed grain zone gradually increases, the grain size becomes smaller, and the columnar grain zone is suppressed. When the maximum bulk nucleation density increases from 5 × 10⁷ to 5 × 10⁹, the number of grains in the solidified structure increases by 91.8%. The maximum volume nucleation variance has no obvious effect on the change in the solidification structure.
- (5)
- When the maximum bulk nucleation undercooling is 5.5 K, the standard deviation of nucleation is 4 K, and the maximum bulk nucleation density is 5 × 10⁸. The solidification structure simulation results are in good agreement with the experimental results.
Author Contributions
Simulations and formal analysis: Z.J. and R.L., Review and editing: Z.J., experiments, and validation: N.G. and Y.W., Conceptualization, supervision, and project administration: Y.S. All authors have read and agreed to the published version of the manuscript.
Funding
This research received no external funding.
Data Availability Statement
Data are contained within the article.
Conflicts of Interest
Naitao Genga and Ying Wang are employed by the company Chengdu Advanced Metal Materials Industrial Technology Research Institute Co., Ltd. The remaining authors declare that the research was conducted in the absence of any commercial or financial relationships that could be construed as a potential conflict of interest.
References
- Guo, L.; He, W.; Zhou, P.; Liu, B. Research Status and Development Prospect of Titanium and Titanium Alloy Products in China. J. Hot Work. Technol. 2020, 49, 22–28. [Google Scholar]
- Dong, J.; Chen, J.; Wang, D.; Li, X. Study on Composition and Microstructure of TC4 Titanium Alloy. J. Heilongjiang Metall. 2014, 34, 6–9. [Google Scholar]
- Chen, W.; Wang, J.; Kong, Y. Analysis of Research Progress on Properties of Titanium Alloys TC4. Mod. Chem. Res. 2023, 51–53. [Google Scholar] [CrossRef]
- Yang, J.; Zhang, K.; Cao, J.; Liu, H.; Li, W. Research on Preparation of Oversized TC4 ELI Titanium Alloy Ingots by VAR. Titan. Ind. Prog. 2023, 40, 1–5. [Google Scholar]
- Yuan, W. Comparative Analysis on Melting Process of TC4 Titanium Alloy. J. Nonferrous Met. Process. 2018, 47, 23–27. [Google Scholar]
- Lei, W.; Zhao, Y.; Han, D.; Mao, X. Development of Melting Technology for Titanium and Titanium Alloys. J. Mater. Rep. 2016, 30, 101–106. [Google Scholar]
- Yang, H.; Yang, X.; Du, C.; Yuan, Z.; Wei, F.; Luo, B.; Wang, H. Recent development in researching the advanced melting processes for Titanium Alloy. World Nonferrous Met. 2019, 1–4+6. [Google Scholar]
- Li, M.; Yang, S.; Liu, W.; Jia, L.; Zhao, P.; Yan, Y. Research process on segregation and control of titanium alloy during vacuum arc remelting. China Metall. 2023, 33, 1–10+18. [Google Scholar]
- Wang, Y.; Zhang, L.; Zhang, J.; Zhou, Y.; Liu, T.; Ren, Y. Numerical simulation of macrosegregation in vacuum arc remelting process. J. Iron Steel Res. 2021, 33, 718–725. [Google Scholar]
- Luo, W.; Zhao, X.; Liu, P.; Wu, W.; He, Y.; Wang, K.; Hao, F. Computational Simulation of Factors Affecting Surface Quality of Titanium Alloy Ingot in VAR Process. J. Rare Met. Mater. Eng. 2020, 49, 927–932. [Google Scholar]
- Kondrashov, E.; Rusakov, K.; Leder, M. VAR ingot solidifification model and its verifification: Application to titanium Ti-10V-2Fe-3Al alloy. J. Eur. Phys. J. Spec. Top. 2020, 229, 485–494. [Google Scholar] [CrossRef]
- Pericleous, K.; Djambazov, G.; Ward, M.; Yuan, L.; Lee, P.D. A Multiscale 3D Model of the Vacuum Arc Remelting Process. Met. Mater. Trans. A 2013, 44, 5365–5376. [Google Scholar] [CrossRef]
- Kondrashov, E.N.; Leder, M.O.; Maksimov, A.Y. Maksimov. Simulation of the VT3-1 Alloy Ingot Solidification during VAR. J. Russ. Metall. (Met.) 2018, 12, 1114–1120. [Google Scholar] [CrossRef]
- Leder, M.O.; Gorina, A.V.; Kornilova, M.A.; Tarenkova, N.Y.; Kondrashov, E.N. Determination of the Thermophysical Properties of Titanium Alloys from Liquid Bath Profiles. J. Russ. Metall. (Met.) 2015, 12, 964–969. [Google Scholar] [CrossRef]
- Kondrashov, E.N.; Musatov, M.I.; Maksimov, A.Y.; Goncharov, A.E.; Konovalov, L.V. Calculation of the molten pool depth in vacuum arc remelting of alloy Vt3-1. J. Eng. Thermophys. 2007, 16, 19–25. [Google Scholar] [CrossRef]
- Boivineau, M.; Cagran, C.; Doytier, D.; Eyraud, V.; Nadal, M.H.; Wilthan, B.; Pottlacher, G. Thermophysical Properties of Solid and Liquid Ti-6Al-4V(TA6V) Alloy. J. Int. J. Thermophys. 2006, 27, 507–529. [Google Scholar] [CrossRef]
- Jia, L.; Cui, H.; Yang, S.; Lv, S.; Xie, X.; Qu, J. Effect of the cooling rates on the microstructure and segregation characteristics in directionally solidified GH4151 superalloy. Mater. Charact. 2024, 209, 113735. [Google Scholar] [CrossRef]
- Yan, Y.; Gu, Y.; Jia, L.; Zhao, P.; Li, M.; Yang, S. Microstructure evolution behavior in electroslag remelting ingot of GH3536 alloy. China Metall. 2024, 1–15. [Google Scholar] [CrossRef]
- Li, H.; Li, H.; Kou, H.; Zhong, H.; Chang, H.; Li, J. Prediction of solidification microstructure in γ-TiAl alloys ingots during Vacuum Arc Remelting. Spec. Cast. Nonferrous Alloys 2012, 32, 901–904. [Google Scholar]
- An, R.; Liu, F.; Chen, K.; Gao, J.; Kang, C.; Jiang, Z. CAFÉ simulation of electroslag remelting GH984G directional solidification structure. Iron Steel 2021, 56, 56–64+71. [Google Scholar]
- Cheng, A.; Ma, Y.; Gao, X.; Li, J.; Yang, S.; Bai, L. Numerical simulation on consumable-electrode vacuum melting process for 14Cr-13Co-5Mo-2Ni gear steel. Spec. Steel 2014, 35, 23–25. [Google Scholar]
- Zhao, P.; Zheng, L.; Yang, S.; Liu, W.; Li, J.; Yang, S.; Chen, Y. Microstructure characteristics and mechanical properties of a novel heavy density Ni–W–Co matrix alloy prepared by VIM/VAR. J. Mater. Res. Technol. 2021, 13, 2459–2468. [Google Scholar] [CrossRef]
- Atwood, R.C.; Lee, P.D.; Minisandram, R.S.; Jones, R.M.F. Multiscale modelling of microstructure formation during vacuum arc remelting of titanium 6-4. J. Mater. Sci. 2004, 39, 7193–7197. [Google Scholar] [CrossRef]
- Yuan, L.; Djambazov, G.; Lee, P.D.; Pericleous, K. Multiscale modeling of the vacuum arc remelting process for the prediction on microstructure formation. Int. J. Mod. Phys. B 2009, 23, 1584–1590. [Google Scholar] [CrossRef]
- Zhang, Y.; Kou, H.; Li, P.; Zhong, H.; Hu, R.; Li, J.; Zhou, L. Simulation on Solidification Structure and Shrinkage Porosity (Hole) in TC4 Ingot during Vacuum Arc Remelting Process. Spec. Cast. Nonferrous Alloys 2012, 32, 418–421. [Google Scholar]
- Bai, L.; Liu, H.; Zhang, Y.; Miao, X.; Ruan, X. Numerical simulation of the microstructure of 22CrMoH billets and the effects of alloying elements. Chin. J. Eng. 2011, 33, 1091–1098. [Google Scholar]
- Huang, Y.; Yang, M.; Li, J. Evolution and control of bearing-steel microstructures in Vacuum Consumable Melting. Chin. J. Vac. Sci. Technol. 2016, 36, 727–730. [Google Scholar]
- Lan, P.; Sun, H.; Li, Y.; Zhang, J. 3D CAFE model for simulating the solidification microstructure of 430 stainless steel. Chin. J. Eng. 2014, 36, 315–322. [Google Scholar]
- Zhao, X.; He, Y.; Luo, W.; Lai, Y.; Wang, K.; Liu, X. Numerical Simulation of the VAR Process of Ti-1023 Alloy Ingot with Melt Flow-VAR and Validation. Mater. China 2018, 37, 367–371. [Google Scholar]
- Güther, V.; Rothe, C.; Winter, S.; Clemens, H. Metallurgy, microstructure and properties of intermetallic TiAl ingots. BHM Berg-Und Hüttenmännische Monatshefte 2010, 7, 325–329. [Google Scholar] [CrossRef]
- Miao, F.; Xie, L.; Li, J.; Tian, R.; Wang, R.; Kang, Y.; Yan, Z. Simulation of Ingot Solidification Microstructure Evolution of Cu-3Ni-0.96Si-0.15Mg Alloy Based on CAFE. Hot Work. Technol. 2024, 135–140. [Google Scholar] [CrossRef]
- Lv, B.; Li, Z.; Yang, Z.; Liu, X.; Li, W.; Han, J. Effect of ESR Process on the Solidification Structure of GCr15 Bearing Steel. Mater. Rep. 2021, 35, 24134–24141. [Google Scholar]


Disclaimer/Publisher’s Note: The statements, opinions and data contained in all publications are solely those of the individual author(s) and contributor(s) and not of MDPI and/or the editor(s). MDPI and/or the editor(s) disclaim responsibility for any injury to people or property resulting from any ideas, methods, instructions or products referred to in the content. |
© 2024 by the authors. Licensee MDPI, Basel, Switzerland. This article is an open access article distributed under the terms and conditions of the Creative Commons Attribution (CC BY) license (https://creativecommons.org/licenses/by/4.0/).