Article

Synergistic Effects of Plastid Terminal Oxidases 1 and 2 in Astaxanthin Regulation under Stress Conditions

College of Life Sciences and Oceanography, Shenzhen University, Shenzhen 518000, China
*
Authors to whom correspondence should be addressed.
Processes 2024, 12(4), 804; https://doi.org/10.3390/pr12040804
Submission received: 19 February 2024 / Revised: 3 April 2024 / Accepted: 14 April 2024 / Published: 17 April 2024

Abstract

:
Plastid terminal oxidases (PTOXs) are essential for maintaining photosynthetic efficiency and cellular redox homeostasis. Astaxanthin, a carotenoid pigment with antioxidant properties, is synthesized and accumulates in response to oxidative stress induced by high-light intensity or nutrient limitation. It suggests that PTOX may impact astaxanthin biosynthesis under environmental stress conditions due to its involvement in ROS regulation. The ptox1 gene is thought to have a conserved role in safeguarding the photosynthetic apparatus from over-reduction and participating in energy dissipation. On the other hand, the ptox2 gene seems to be involved in the evolution of astaxanthin synthesis and adaptive responses to diverse environmental stressors. Efficient gene silencing strains were developed in Chlamydomonas reinhardtii CC849 for ptox1 and ptox2. The study found that the ptox2 gene correlates highly with resistance to intense light stress. Furthermore, the ptox2 gene showed increased activity under high salt stress conditions, indicating its importance in stress coping mechanisms. The quantification of astaxanthin in the gene-silenced strains revealed that ptox1 acts as a positive regulator, while ptox2 functions as a negative regulator of astaxanthin accumulation. Understanding the coordination between ptox1 and ptox2 could clarify the synergistic actions of these genes in maintaining photosynthetic performance and redox balance under fluctuating environmental conditions.

1. Introduction

The plastid terminal oxidase (PTOX) is a crucial enzyme located within the plastids of plant cells. It functions as a plastid quinone oxidase, pivotal in metabolic pathways that contribute to carotenoid synthesis, photorespiration, and chloroplast respiration [1]. The gene encoding PTOX is nuclear-encoded, and its protein product is crucial for maintaining the redox balance within the plastid. The Arabidopsis thaliana leaf white spot mutant was used to facilitate the initial characterization of PTOX [2]. PTOX regulates the balance between photosynthesis and cellular respiration by modulating electron transfer pathways [3]. Under optimal light conditions, photosynthesis is the primary energy source in plant cells, using linear electron flow (LEF) to generate ATP and NADPH. However, in situations like high light intensity or temperature stress, LEF can result in excess electrons leading to photo-oxidative damage, and this is where PTOX plays a crucial role. In stressful environments, it diverts excess electrons from linear electron flow (LEF) to cyclic electron flow (CEF), reducing the risk of photo-oxidative damage [4]. This balance allows plants to adapt to varying conditions, ensuring energy supply while safeguarding against damage. PTOX acts as a crucial regulator, enabling the efficient utilization of light energy and maintaining the overall stability of energy metabolism in plants [5].
Chlamydomonas reinhardtii is a unicellular green alga that has been extensively studied for its ability to grow rapidly and produce high amounts of biomass rich in proteins and other nutrients [6]. This makes it a promising candidate for applications in active substance production or protein production for various purposes. In terms of stressful conditions, challenges such as high light intensity, extreme temperatures, nutrient limitations, and oxidative stress can impact the growth, photosynthetic efficiency, and overall productivity of C. reinhardtii [7]. Studying the PTOX in C. reinhardtii holds significant importance due to the potential insights it can provide into the alga’s adaptive mechanisms and its ability to thrive under stressful conditions. In contrast to higher plants, which usually have only one form of ptox, the green alga C. reinhardtii has two isoforms, ptox1 and ptox2 [8]. PTOX1 is mainly responsible for regenerating plastoquinone (PQ), which is necessary for desaturation reactions during the biosynthesis of phytoene, an early step in the carotenoid biosynthetic pathway [4]. PTOX1 plays a crucial role in carotenoid production, including astaxanthin, which provides photoprotection and helps the alga cope with high light stress [9]. In contrast, PTOX2 exhibits a higher rate of plastoquinol oxidation during photosynthesis than PTOX1 [10]. Plastoquinol is the reduced form of PQ. Its oxidation by PTOX2 helps to maintain the flow of electrons in the photosynthetic electron transport chain, particularly under conditions where the demand for ATP and NADPH exceeds the consumption by the Calvin cycle. This activity of PTOX2 is important for preventing the over-reduction of the photosynthetic electron transport chain, which could lead to the production of harmful ROS [11]. The existence of two PTOX isoforms in C. reinhardtii enables a more nuanced regulation of PQ redox state and carotenoid biosynthesis, providing the alga with a flexible response to various environmental conditions. The differential expression and activity of PTOX1 and PTOX2 allow the alga to balance photosynthetic efficiency, redox homeostasis, and stress acclimation responses. However, no further research shows the interaction between these two PTOX genes.
In this study, the synergistic effects of plastid terminal oxidases 1 and 2 (PTOX1 and PTOX2) in the regulation of astaxanthin under stress conditions were investigated. The research sheds light on the intricate regulation of astaxanthin biosynthesis and photosynthetic efficiency in response to diverse environmental conditions.

2. Methods and Materials

2.1. Organism, Growth Medium, and Culture Conditions

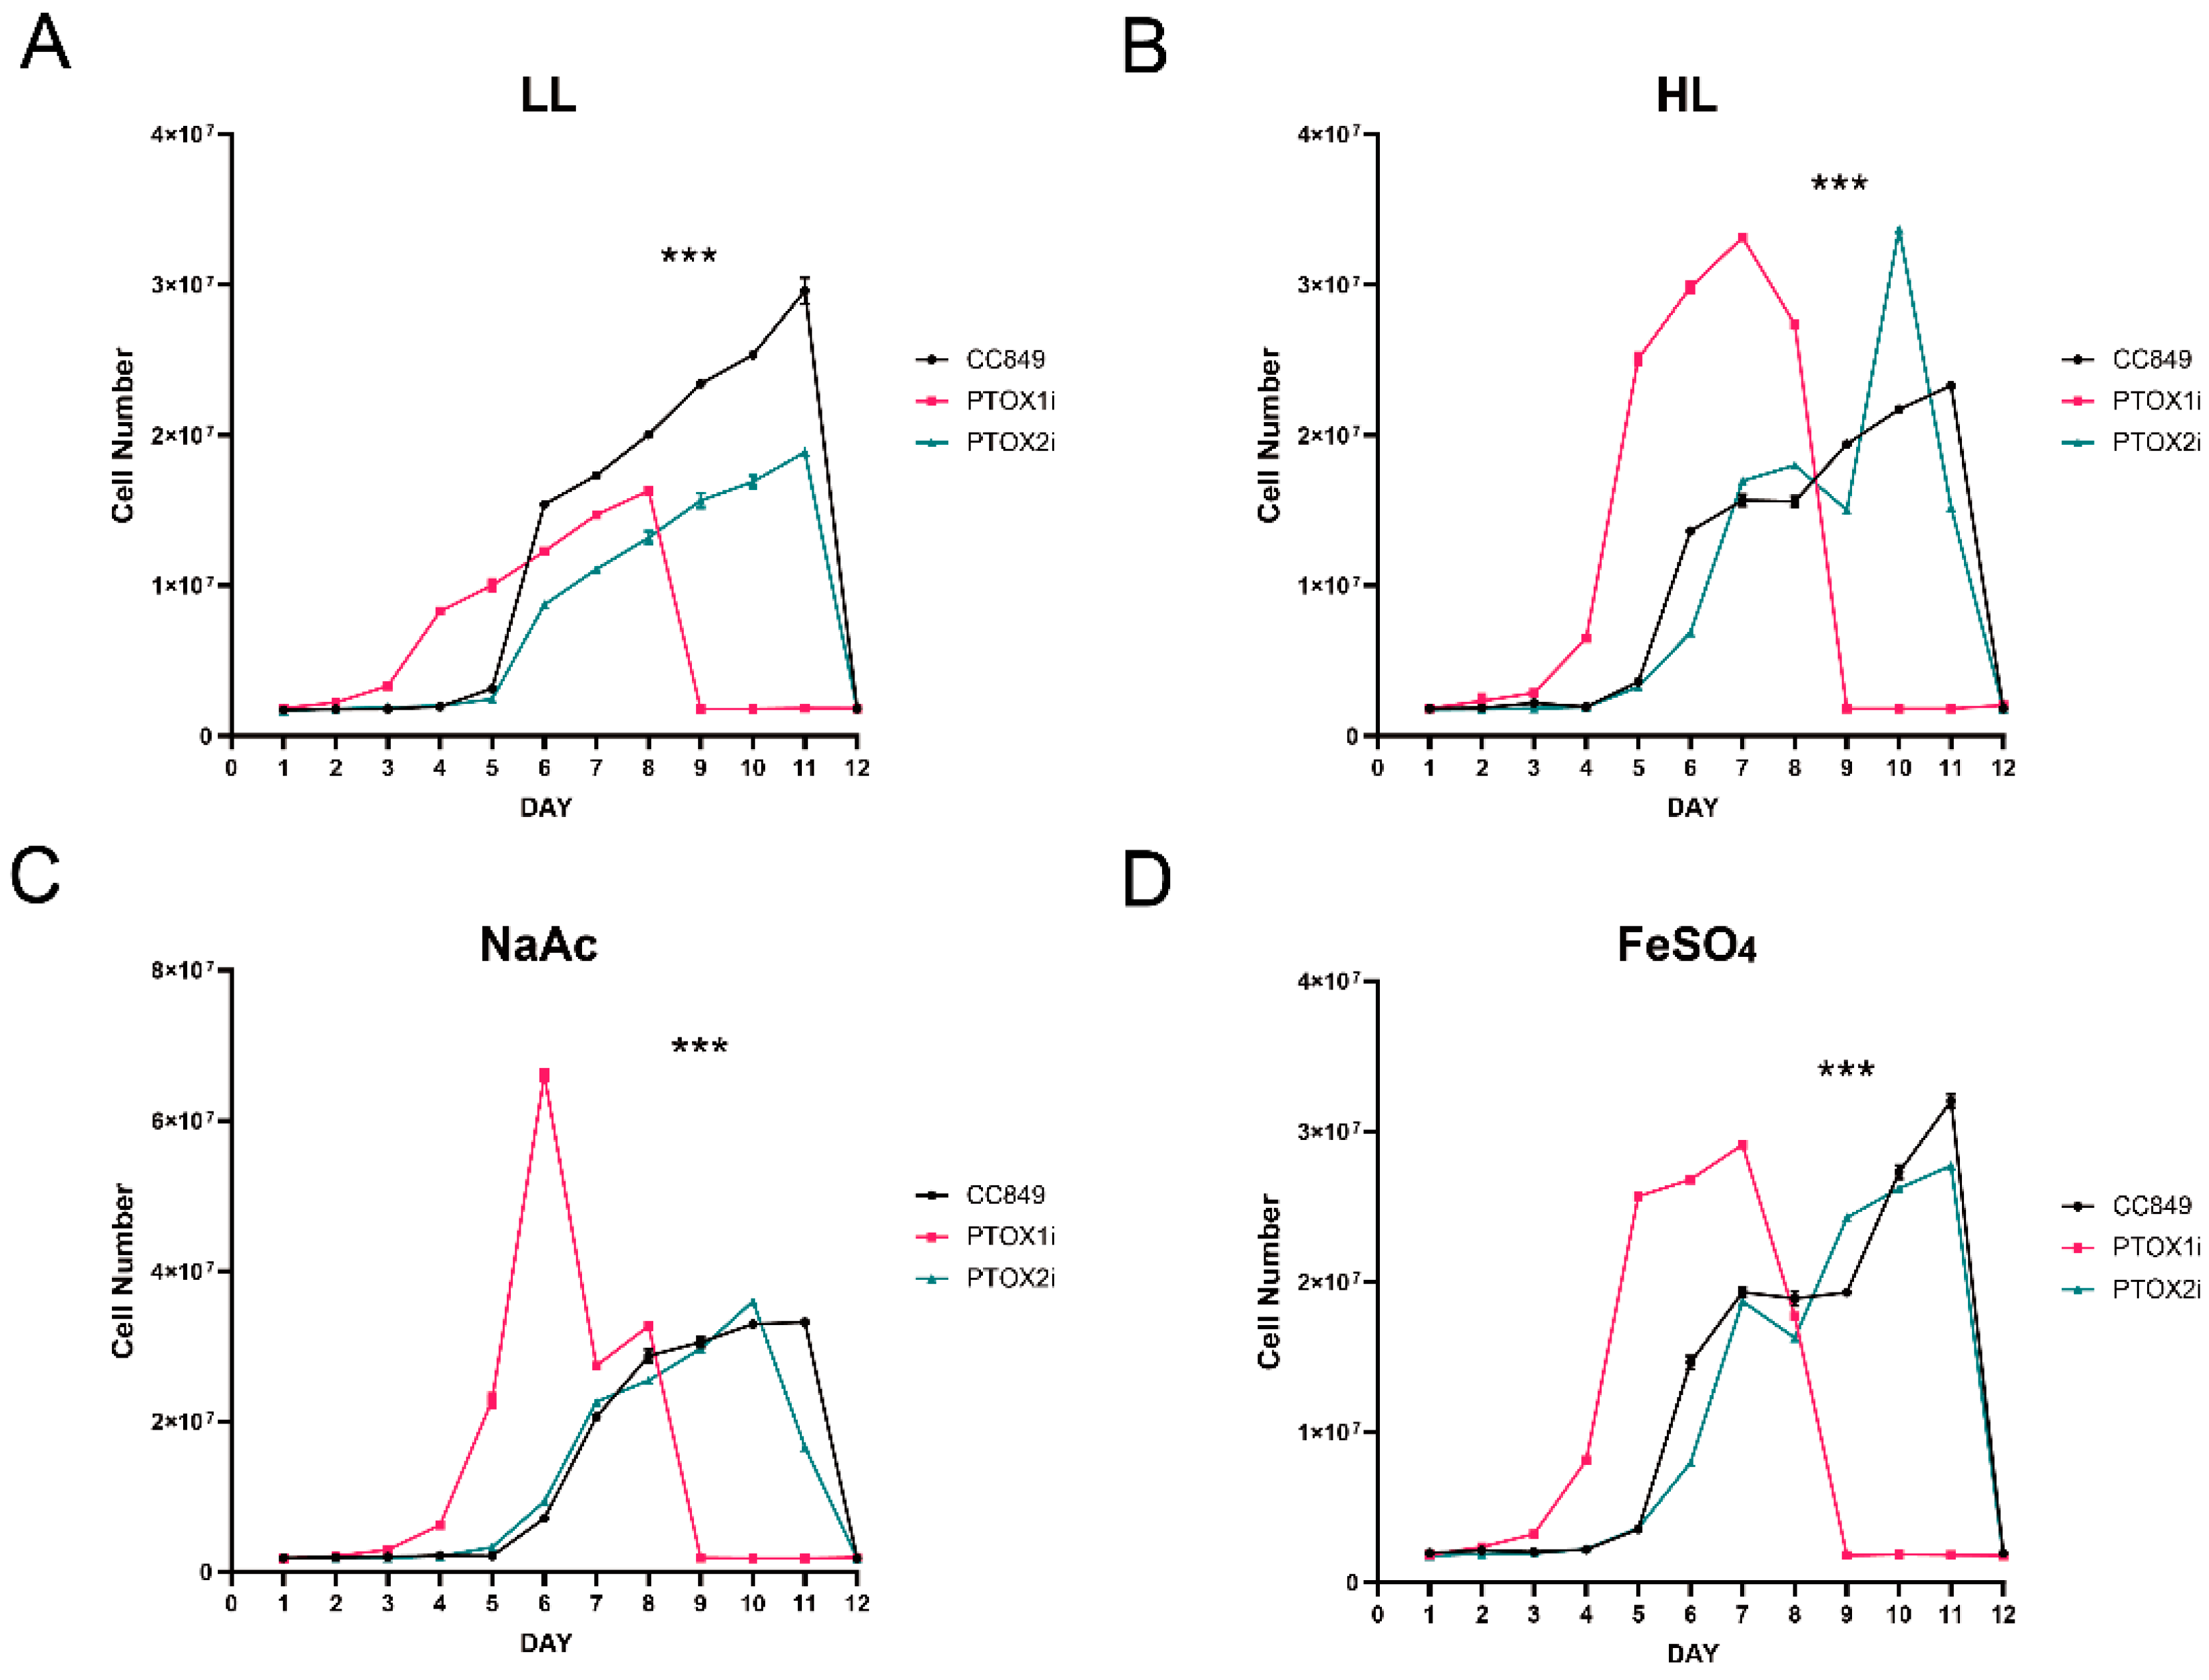
Chlamydomonas reinhardtii cell wall deficient mutant strain CC849 was obtained from the Chlamydomonas Genetic Centre (Duke University, Durham, NC, USA). Microalgal cells were grown using Tris-acetate phosphate (TAP) media with mineral nutrient supplements at 22 ± 1 °C and under continuous cool-white fluorescent lamps (≈20 μmol/m2s). For the analysis of cell growth, C. reinhardtii CC849 and transgenic algal strains are grown under different light conditions: normal light condition (approximately 20 μmol photons/m2s), high light condition (approximately 150 μmol photons/m2s), high light with 450 μM FeSO4 condition, high light with 45 mM NaAC condition, and high light with 450 μM FeSO4 + 45 mM NaAC condition (Macklin Biochemical Technology Co. Ltd., Shanghai, China).

2.2. RNAi Vector Construction and Transformation

For the targeted gene silencing of ptox1 (GenBank ID: 5718064) and ptox2 (GenBank ID: 5728910), complementary DNA fragments corresponding to the sense and antisense of the above genes, including their intronic sequences, were amplified using specific primer pairs (Sangon Biotech Co. Ltd., Shanghai, China). The glass bead method was used to transform the plasmid into the UVM4 strain, which is capable of highly efficient expression. In this method, C. reinhardtii CC849 cells were grown on solid media supplemented with 1.5 mM L-tryptophan, 5 μg/mL paromomycin, and 5 μM 5-fluoroindole (5-FI) (Macklin Biochemical Technology Co. Ltd., Shanghai, China). The coding sequences (CDSs) of ptox1 and 
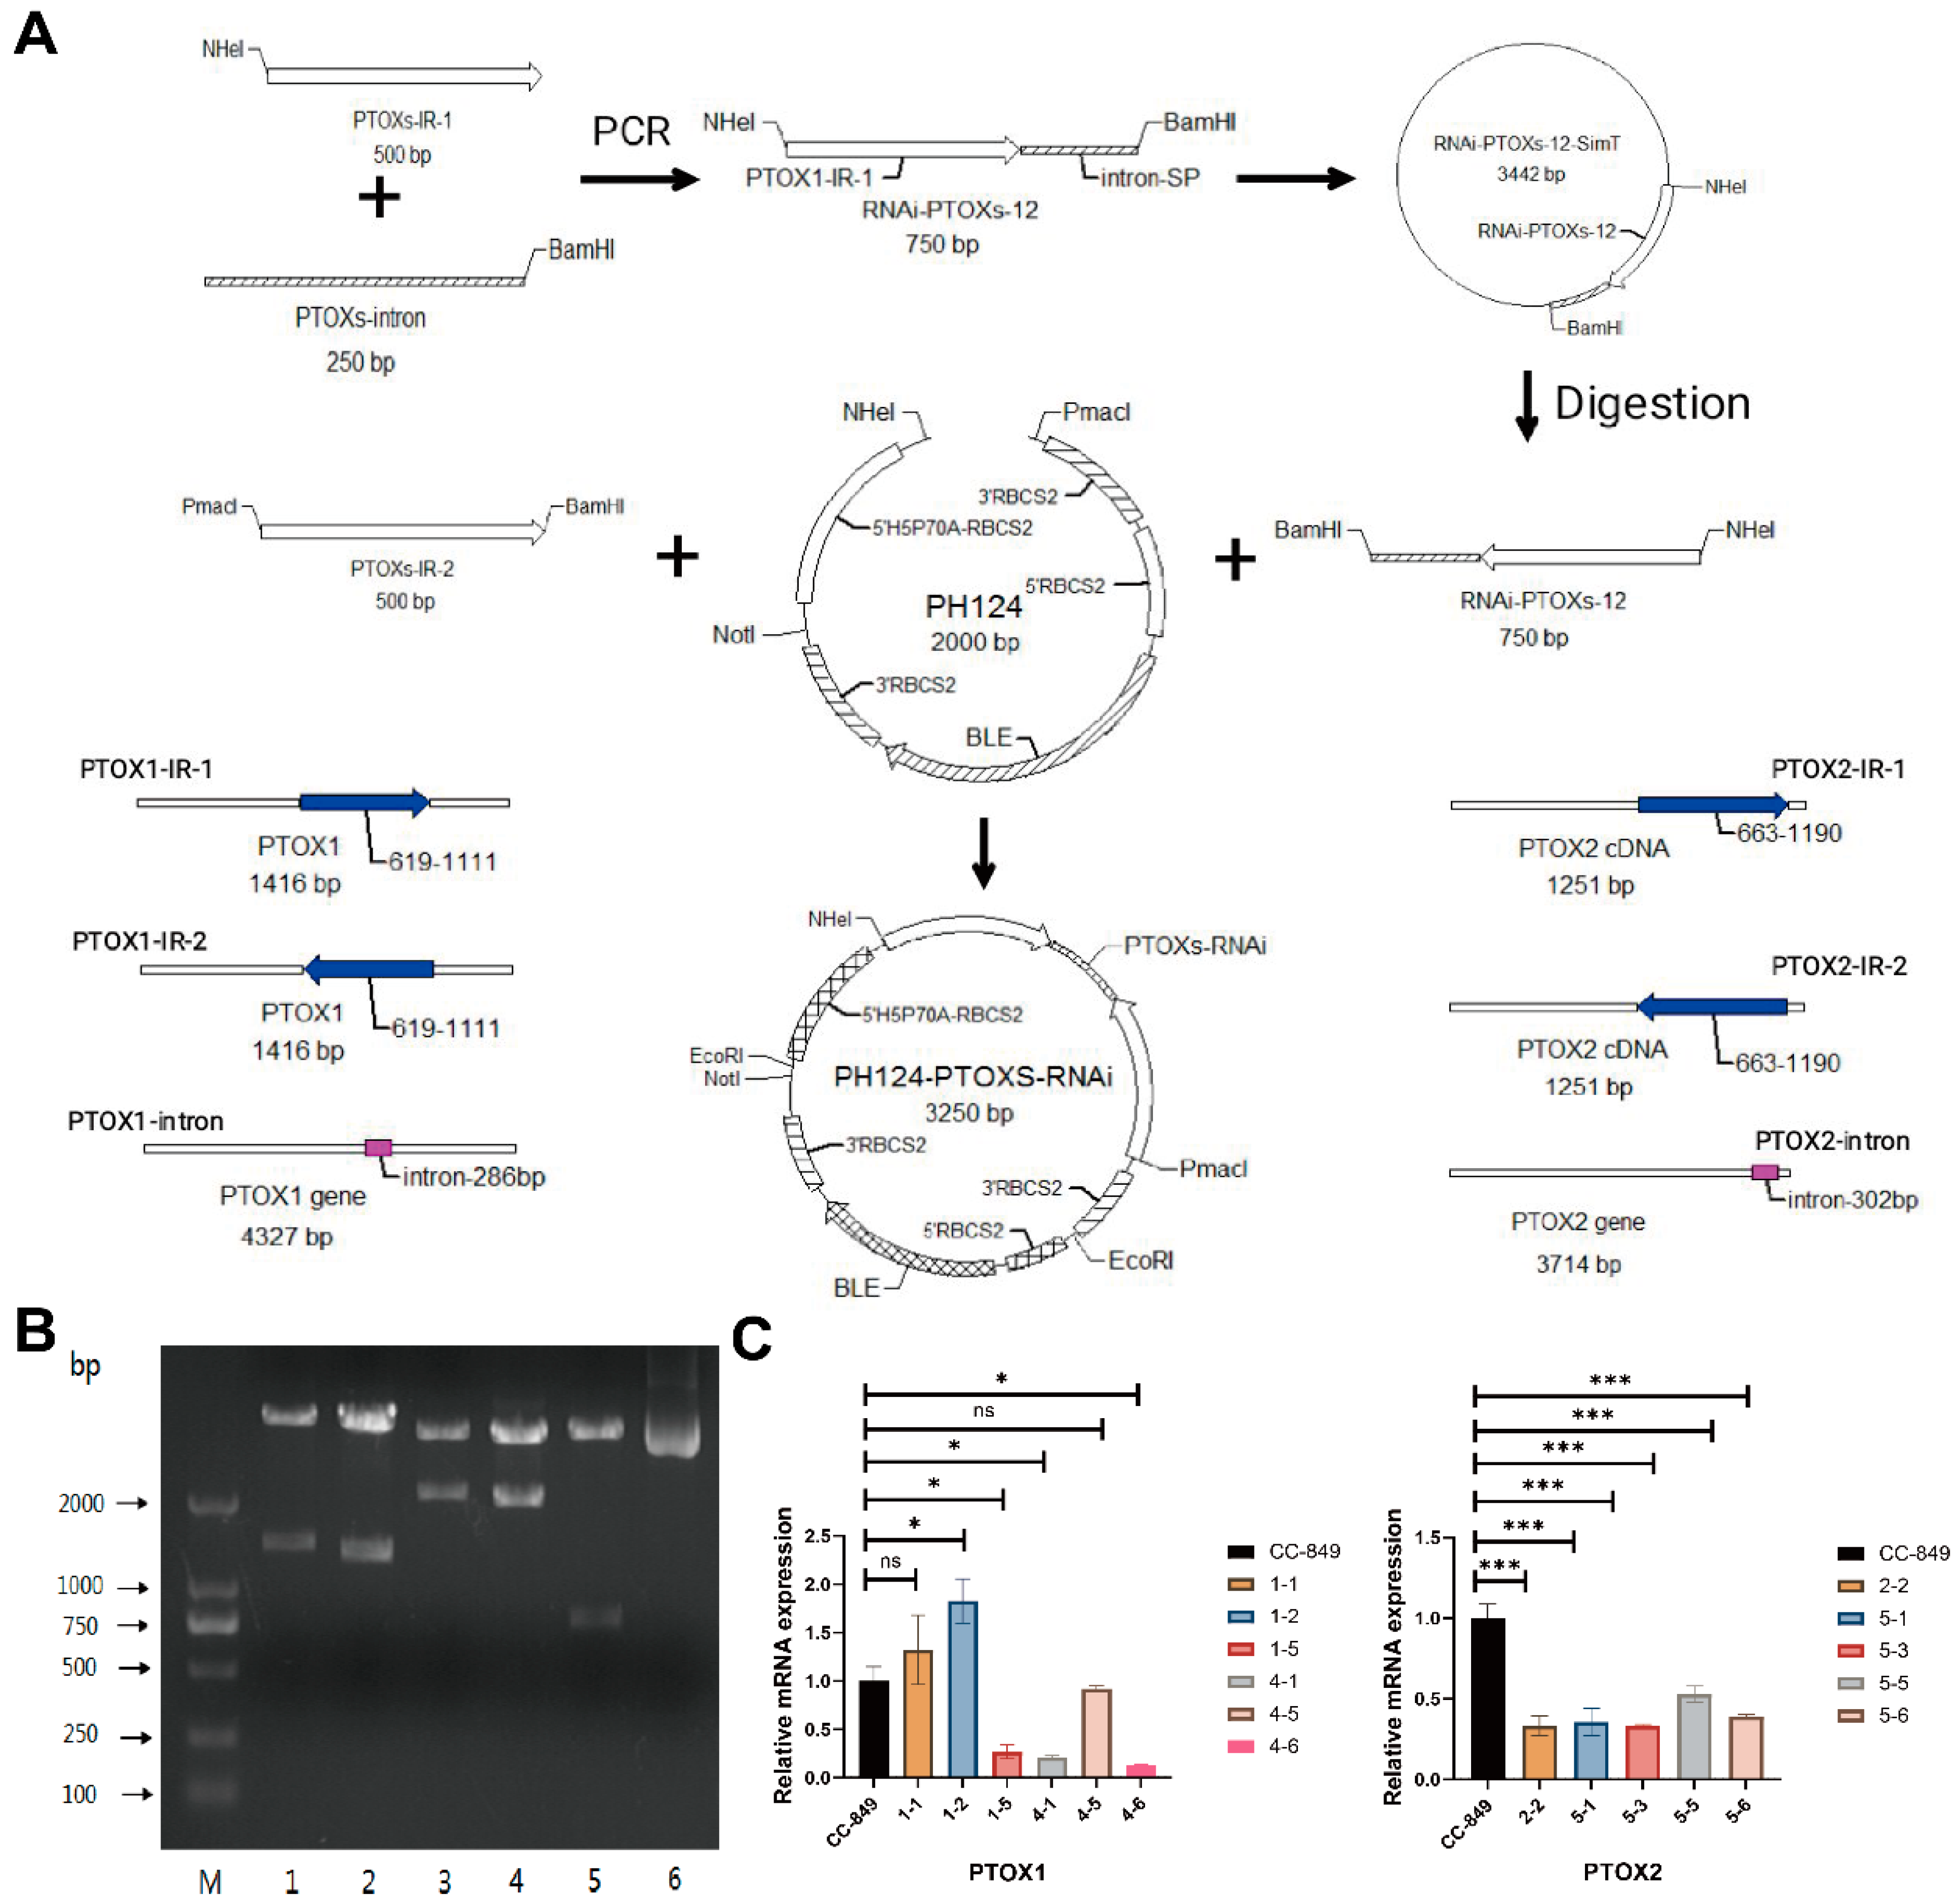
ptox2 were synthesized and fused to their respective introns. The resulting CDS–intron fusion products were then cloned into the pH124-PTOXs RNAi plasmid vector, as depicted in Figure 1A. To achieve the knockdown of ptox1 and ptox2 transcripts, the resulting plasmids were subjected to Not I restriction digestion and introduced into C. reinhardtii CC849 cells using the glass bead agitation method. Quantitative reverse transcription-PCR (qRT-PCR) was then used to identify the downregulation of ptox1 and ptox2 transcript levels via TaKaRa RNA PCR Kit (code number DRR019A) and SYBR PrimeScript TM RT-PCR Kit (Perfect Real Time, Takara Biotechnology Co. Ltd., Shiga, Japan) performed on an ABI Prism 7300 Sequence Detection System (Applied Biosystems, Waltham, MA, USA). β-actin was used as the internal reference gene. The lowest relative expression ptoxs were selectively amplified for use in downstream experimental procedures. All primers involved in this study were listed in Table S1. All experiments were performed in triplicate.

2.3. DNA and RNA Isolations

Genomic DNA was isolated from approximately 3 × 10⁷ cells of C. reinhardtii CC849, which were cultured to the log phase, using the Universal DNA Extraction Kit Ver.3.0 (Takara Biotechnology Co. Ltd., Shiga, Japan). RNA isolation from the same strain of C. reinhardtii CC849 was performed using the FAST200 Kit according to the manufacturer’s instructions (FeiJie Shanghai Biotech. Ltd., Shanghai, China). All experiments were performed in triplicate.

2.4. The Production of Astaxanthin

To analyze the astaxanthin content of C. reinhardtii CC849 and transgenic algal strains, High-Performance Liquid Chromatography (Waters Corp., Milford, MA, USA) was used. The cultures of C. reinhardtii CC849 and transgenic algal strains were grown under different light conditions: normal light condition (approximately 20 μmol photons/m2s), high light condition (approximately 150 μmol photons/m2s), high light with 450 μM FeSO4 condition, high light with 45 mM NaAC condition, and high light with 450 μM FeSO4 + 45 mM NaAC condition. Cells were harvested and the intracellular astaxanthin was extracted by dichloromethane–methanol (v/v = 25:75). The analytical column was a 4.6 × 250 mm HPLC column (Kromasil C18 5 μm, Kromasil Co., Bohus, Sweden). HPLC conditions were as follows: 90/10 methanol/Acetonitrile (v/v); flow rate: 1.0 mL/min; injection volume: 10 μL; and the chromatogram was recorded at 478 nm. All experiments were performed in triplicate.

2.5. Statistical Analysis

Experimental data were expressed as the mean ± standard deviation and analyzed using GraphPad Prism software (version 9.0, GraphPad Software Co. Ltd., Boston, MA. USA) Statistical analyses were conducted using independent sample t-tests for comparisons between two groups and one-way ANOVA for comparisons among three or more groups. A p-value of less than 0.05 was considered statistically significant and indicated as “*” in the bar graphs. The level of significance was further denoted as “*” for p < 0.05, “**” for p < 0.01, “***” for p < 0.001, and “ns” for non-significant results with p > 0.05.

3. Results

3.1. Construction of Chlamydomonas ptoxs-RNAi Mutant Strain

In this experiment, the ptoxs-RNAi silencing fragment was loaded onto the pH124 vector and transformed into Chlamydomonas, resulting in the silencing of the corresponding gene. The confirmation of successful RNAi vector construction was achieved through restriction digestion and DNA sequencing (Figure 1A,B). Subsequently, we screened over 20 positive transformants from each ptox vector based on their gene expression under high-light conditions using qRT-PCR. The RNAi backbone pH124 is a vector that is induced by high light, therefore we evaluated the expression levels of various genes under both normal and high light (HL) conditions. The strains with the lowest ptox mRNA levels under high light, 4-6 (approximately 10% of the control level) and 5-3 (approximately 29%), were selected for further investigation and designated as PTOX1-RNAi (PTOX1i) and PTOX2-RNAi (PTOX2i), respectively (Figure 1C).

3.2. The Growth Curves of PTOX Knockdown Cells under Stress

The study aimed to investigate the potential correlation between the knockdown of the ptox gene and cell growth. The PTOX1i strain, which has the silenced ptox1 gene, exhibited different growth curves compared to the wild-type and the PTOX2i strain, where the ptox2 gene is silenced. The PTOX1i strain exhibited an earlier decline phase at day 9 compared to other strains under diverse culture conditions (Figure S1). These results suggest a stronger correlation between the ptox1 gene and the stress resistance mechanism in C. reinhardtii than with the ptox2 gene (see Figure 2). The ptox1 gene may have a critical role in the stress response of C. reinhardtii, affecting the cell’s ability to resist adverse environmental conditions and potentially influencing its survival and growth dynamics.

3.3. ptox1 and ptox2 Differential Expression under Stress Conditions

Under normal culture conditions without high light stress, the strain did not exhibit any obvious effects attributed to the use of the pH124 vector for transgene expression. This vector contains a light-inducible promoter that requires high light conditions to activate gene silencing. Therefore, under normal conditions, the expected silencing of the ptox1 and ptox2 genes would not be observed. Moreover, there was no significant difference in the mRNA levels of the ptox1 and ptox2 genes among the three different species of C. reinhardtii (CC849, PTOX1i, and PTOX2i). However, during the logarithmic growth phase, there was an increasing trend in the expression of the ptox1 gene compared to the ptox2 gene (refer to Figure 3A,B). The expression levels of the ptox1 gene were notably reduced upon the introduction of acetate ions into the culture medium (Figure 3C,D). Similarly, the addition of ferrous ions to the culture medium resulted in a 50% increase in the maximum expression level of the ptox2 gene (Figure 3E,F).
As expected, the expression of both the ptox1 and ptox2 genes was significantly repressed under high-light conditions. A compensatory effect was observed in the expression of the ptox2 gene, which was significantly higher than that in the wild type within the PTOX1i strain (Figure 3G). Correspondingly, silencing the ptox2 gene led to a significant increase in the expression of the ptox1 gene. The expression of the ptox2 gene significantly increased in the wild-type C. reinhardtii under high light stress. This emphasizes the gene’s importance in the cellular response to high light conditions (Figure 3H). The findings highlight the role of both ptox1 and ptox2 genes as resistance factors against high light stress in C. reinhardtii. They seem to act synergistically to counteract the potential photo-oxidative damage caused by high light intensities. Furthermore, the administration of acetic acid can alleviate the effects of high light stress on algal cells (see Figure 3I,J). The expression of the ptox1 and ptox2 genes in the PTOX1i and PTOX2i strain did not significantly decrease under conditions of strong light induction and ferrous sulphate induction, indicating that the silencing was disrupted by ferrous sulphate (see Figure 3K,L).

3.4. Astaxanthin Production under Stress Conditions

Under standard cultivation conditions, none of the three strains, including CC849, PTOX1i, and PTOX2i, produced astaxanthin, even after a 120 h growth period (Figure 4A). The accumulation of astaxanthin was effectively activated in all three strains when exposed to high light conditions. However, the PTOX2i strain exhibited an increase in astaxanthin accumulation after 48 h, while the PTOX1i strain consistently exhibited lower levels of astaxanthin content (see Figure 4B). The induction with NaAc combined with high light conditions resulted in a relatively low astaxanthin content in the PTOX1i strain, which can be attributed to the inhibitory effect of the ptox1 gene. In contrast, the PTOX2i strain maintained a relatively high level of astaxanthin, as shown in Figure 4C. This pattern was also observed with FeSO4 induction (Figure 4D). These findings suggest that the ptox1 gene plays a more critical role in astaxanthin biosynthesis compared to the ptox2 gene. It is hypothesized that the ptox1 gene may functionally compensate for the absence of the ptox2 gene during the synthesis process. The ptox2 gene could potentially act as a negative regulatory element in this pathway.

4. Discussions

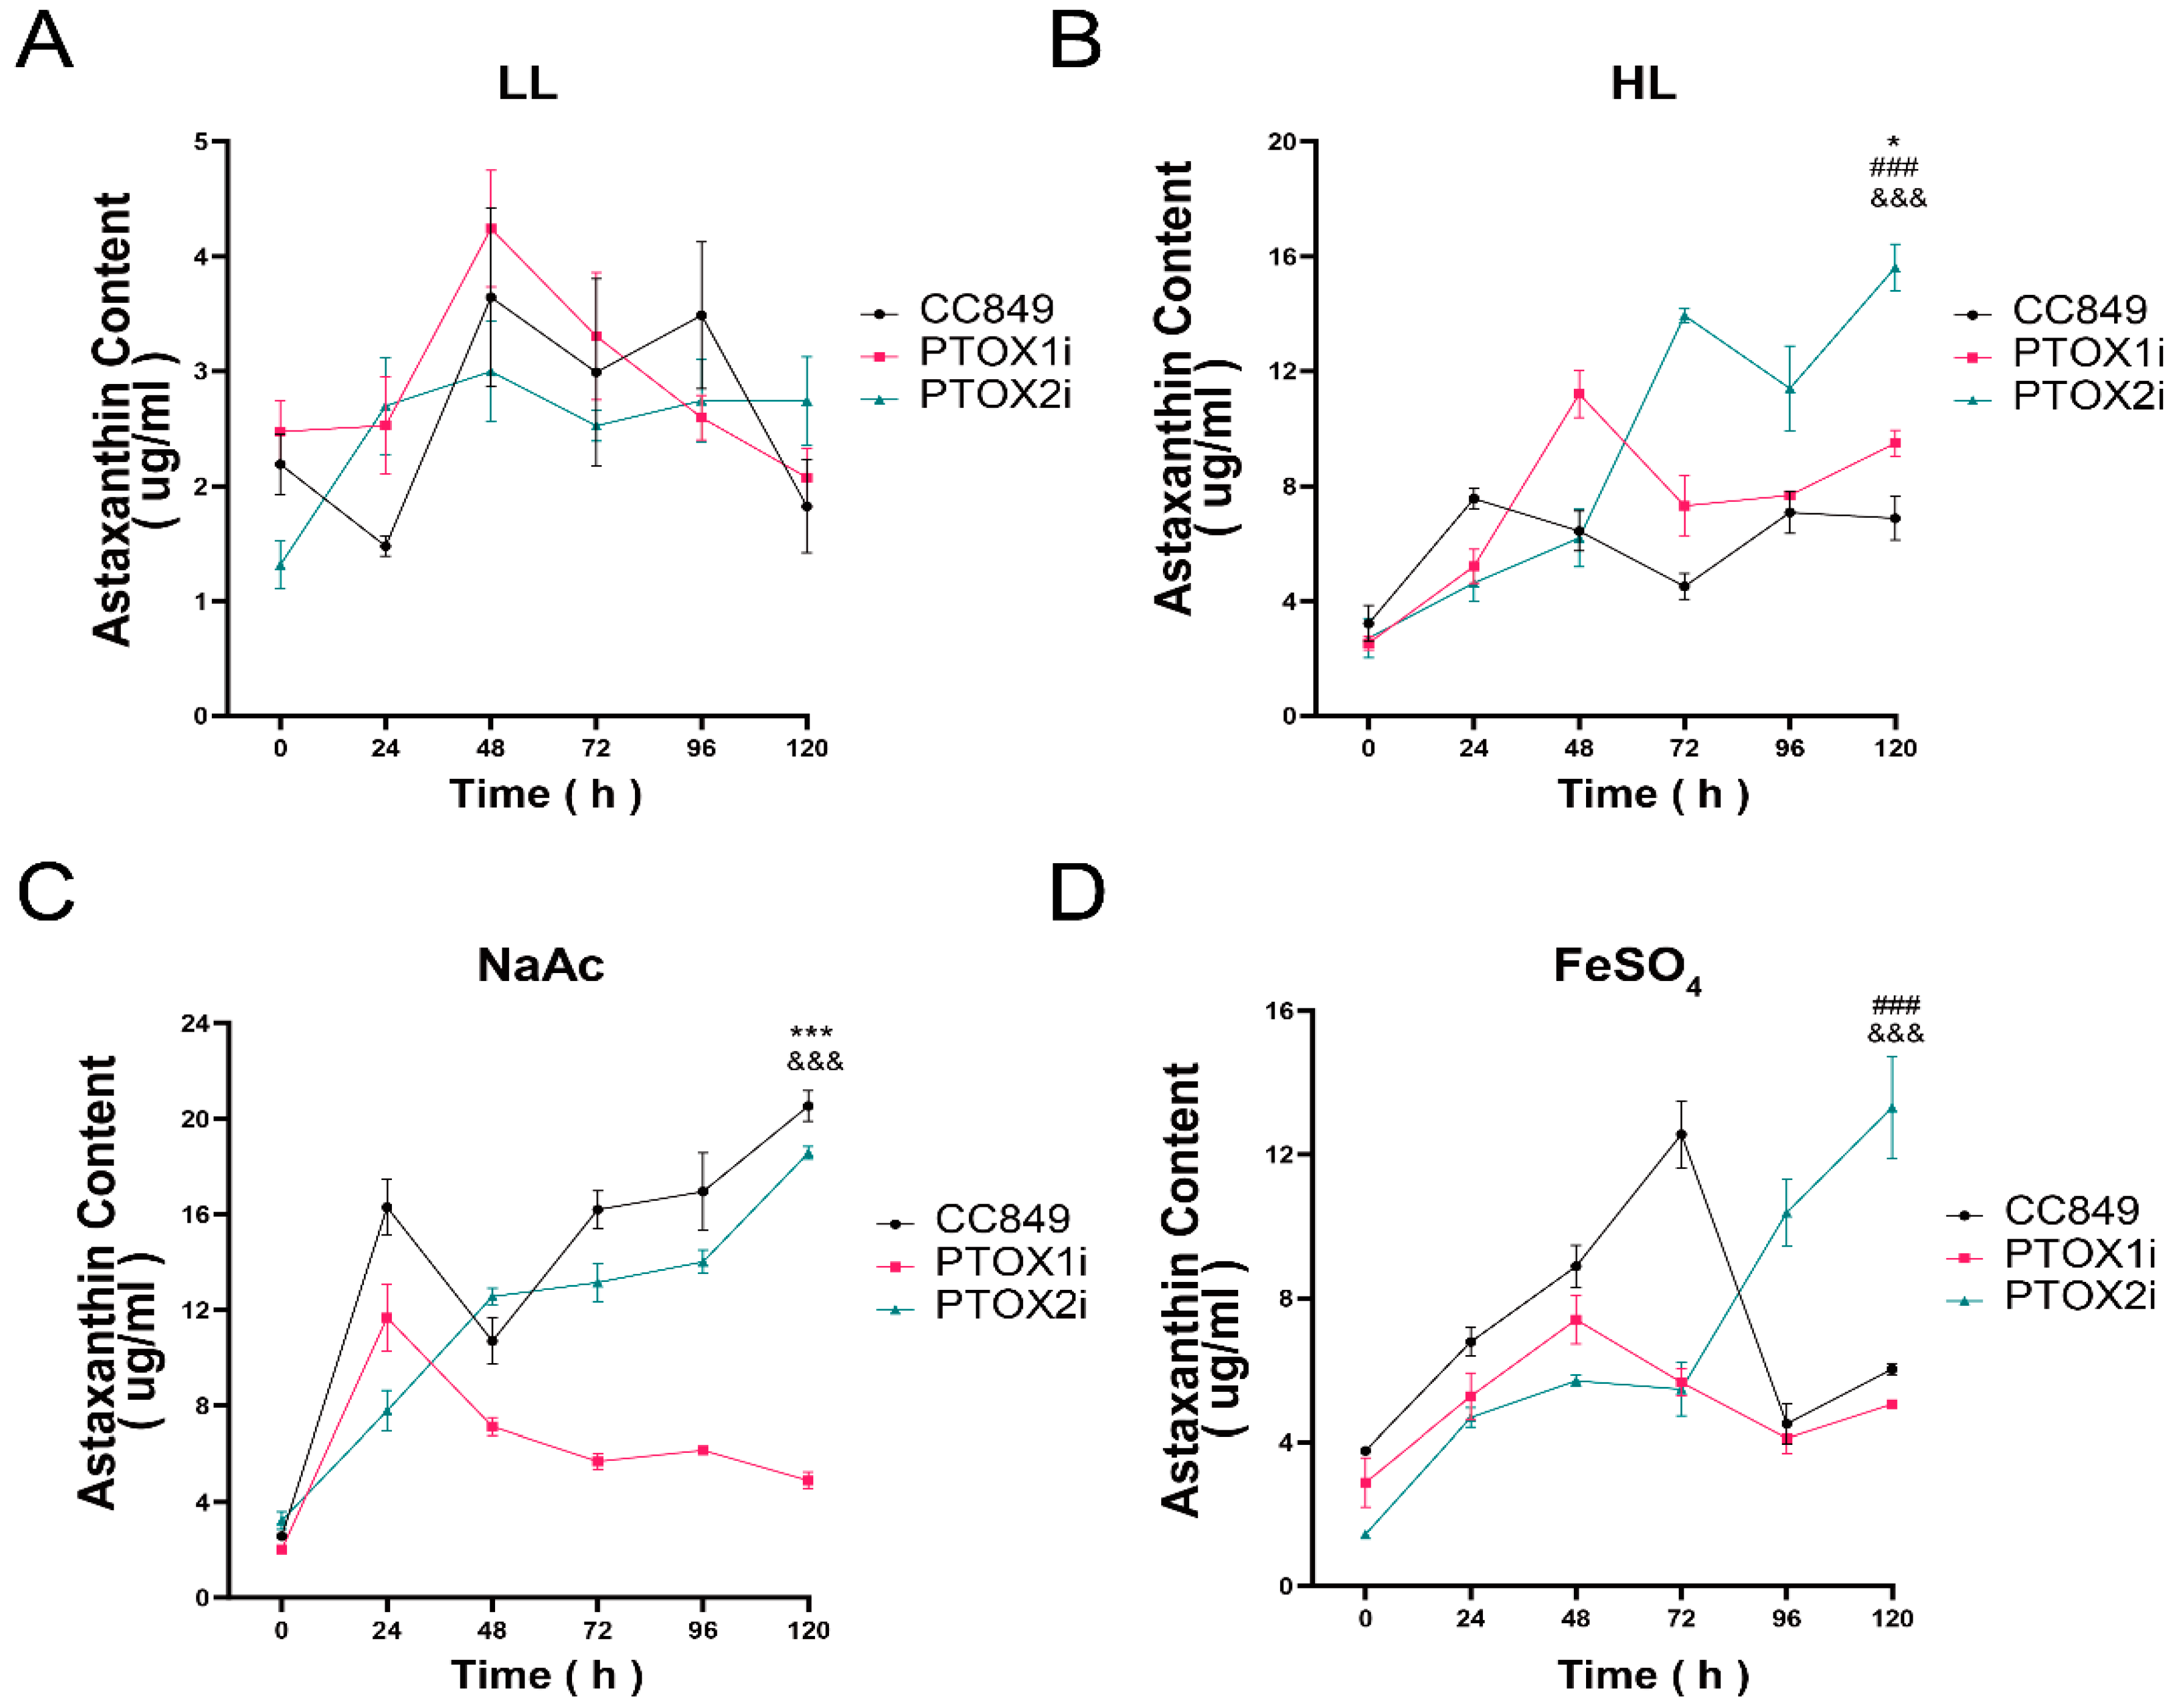
The study shows a significant correlation between the mRNA levels of ptox2 and the alga’s response to high light stress, indicating that ptox2 plays a crucial role in photoprotection under these conditions. Conversely, the behavior of ptox2 under high salt stress suggests an increased level of activity, indicating a role in osmotic stress management. The article demonstrates the relationship between environmental cues and gene expression regulation in C. reinhardtii through the responses of ptox2 to various stressors. Additionally, it clarifies the distinct functions of ptox1 and ptox2 in the alga’s stress response mechanisms, providing new insights into the regulatory processes that control carotenoid biosynthesis and photosynthetic efficiency. The discovery that ptox1 acts as a positive regulator of astaxanthin accumulation, while ptox2 functions as a counter-regulatory gene, enhances our understanding of how this model organism adapts to changing environmental conditions. These findings provide insight into the molecular mechanisms underlying stress responses and metabolic regulation in photosynthetic organisms, contributing to the broader field of plant biology.
The C-terminal region of PTOX exhibits a high degree of sequence homology with the mitochondrial alternative oxidase (AOX) [12]. While PTOX localizes in the plastid, AOX localizes in the mitochondrion [13]. Both PTOX and AOX share a significant feature, a hydrophobic domain, which is crucial for their subcellular localization within their respective organelles [14]. AOX plays a role in bypassing cytochrome c oxidase in the mitochondrion under certain conditions. PTOX in the plastid helps to maintain cellular energy homeostasis and minimize the production of ROS [15]. Additionally, it manages the redox status of the photosynthetic electron transport chain. In situations such as high light intensity or limited CO₂ availability, it can accept electrons from the PQ pool, preventing over-reduction and potentially harmful ROS production. The shared hydrophobic motif between PTOX and AOX highlights their relatedness and emphasizes their critical roles in modulating electron flow within their respective organelles [16]. This contributes to the overall cellular redox balance and stress response mechanisms.
Knocking out ptox in plants and microalgae results in severe phenotypes, such as developmental and growth defects, as well as increased photosensitivity. This indicates that ptox plays a crucial role in maintaining normal growth and protecting against light-induced damage. However, downregulating ptox to approximately 3% of the wild-type levels did not affect plant growth under standard laboratory conditions in Arabidopsis [17]. Plants exhibit plasticity in response to reduced ptox expression, potentially due to compensatory mechanisms or alternative pathways for managing photosynthetic electron flux. Studies on ptox overexpression have revealed its function. For example, the overexpression of ptox1 in Chlamydomonas reinhardtii leads to mutants that are more sensitive to high light stress than wild-type plants [18,19]. Similarly, the overexpression of Arabidopsis ptox in tobacco has been observed to increase susceptibility to oxidative stress [20,21]. These findings suggest that while ptox can enhance the ability to handle excess light energy, overexpression can also have detrimental effects, possibly due to an imbalance in the redox state of the photosynthetic electron transport chain. In the case of the salt-tolerant brassica species Eutrema salsugineum, the overexpression of ptox leads to faster induction and higher tolerance upon exposure to salt stress [22]. This suggests that ptox may play a role in mitigating the effects of salt stress, possibly by dissipating excess reducing equivalents generated during stress conditions. Moreover, the expression of OsPTOX in the cyanobacterium Synechocystis does not affect growth under standard conditions with light intensities ranging from 50 to 150 μmol photons/m2s. This implies that under non-stressful conditions, the modulation of ptox expression may not significantly impact the growth of this organism [23]. These findings emphasize the significance of finely regulating ptox expression to maintain photosynthetic efficiency and protect against environmental stresses. The diverse responses observed in various organisms and under different conditions highlight the importance of a nuanced comprehension of ptox’s functions in photosynthetic organisms and its potential for enhancing stress tolerance in crops.
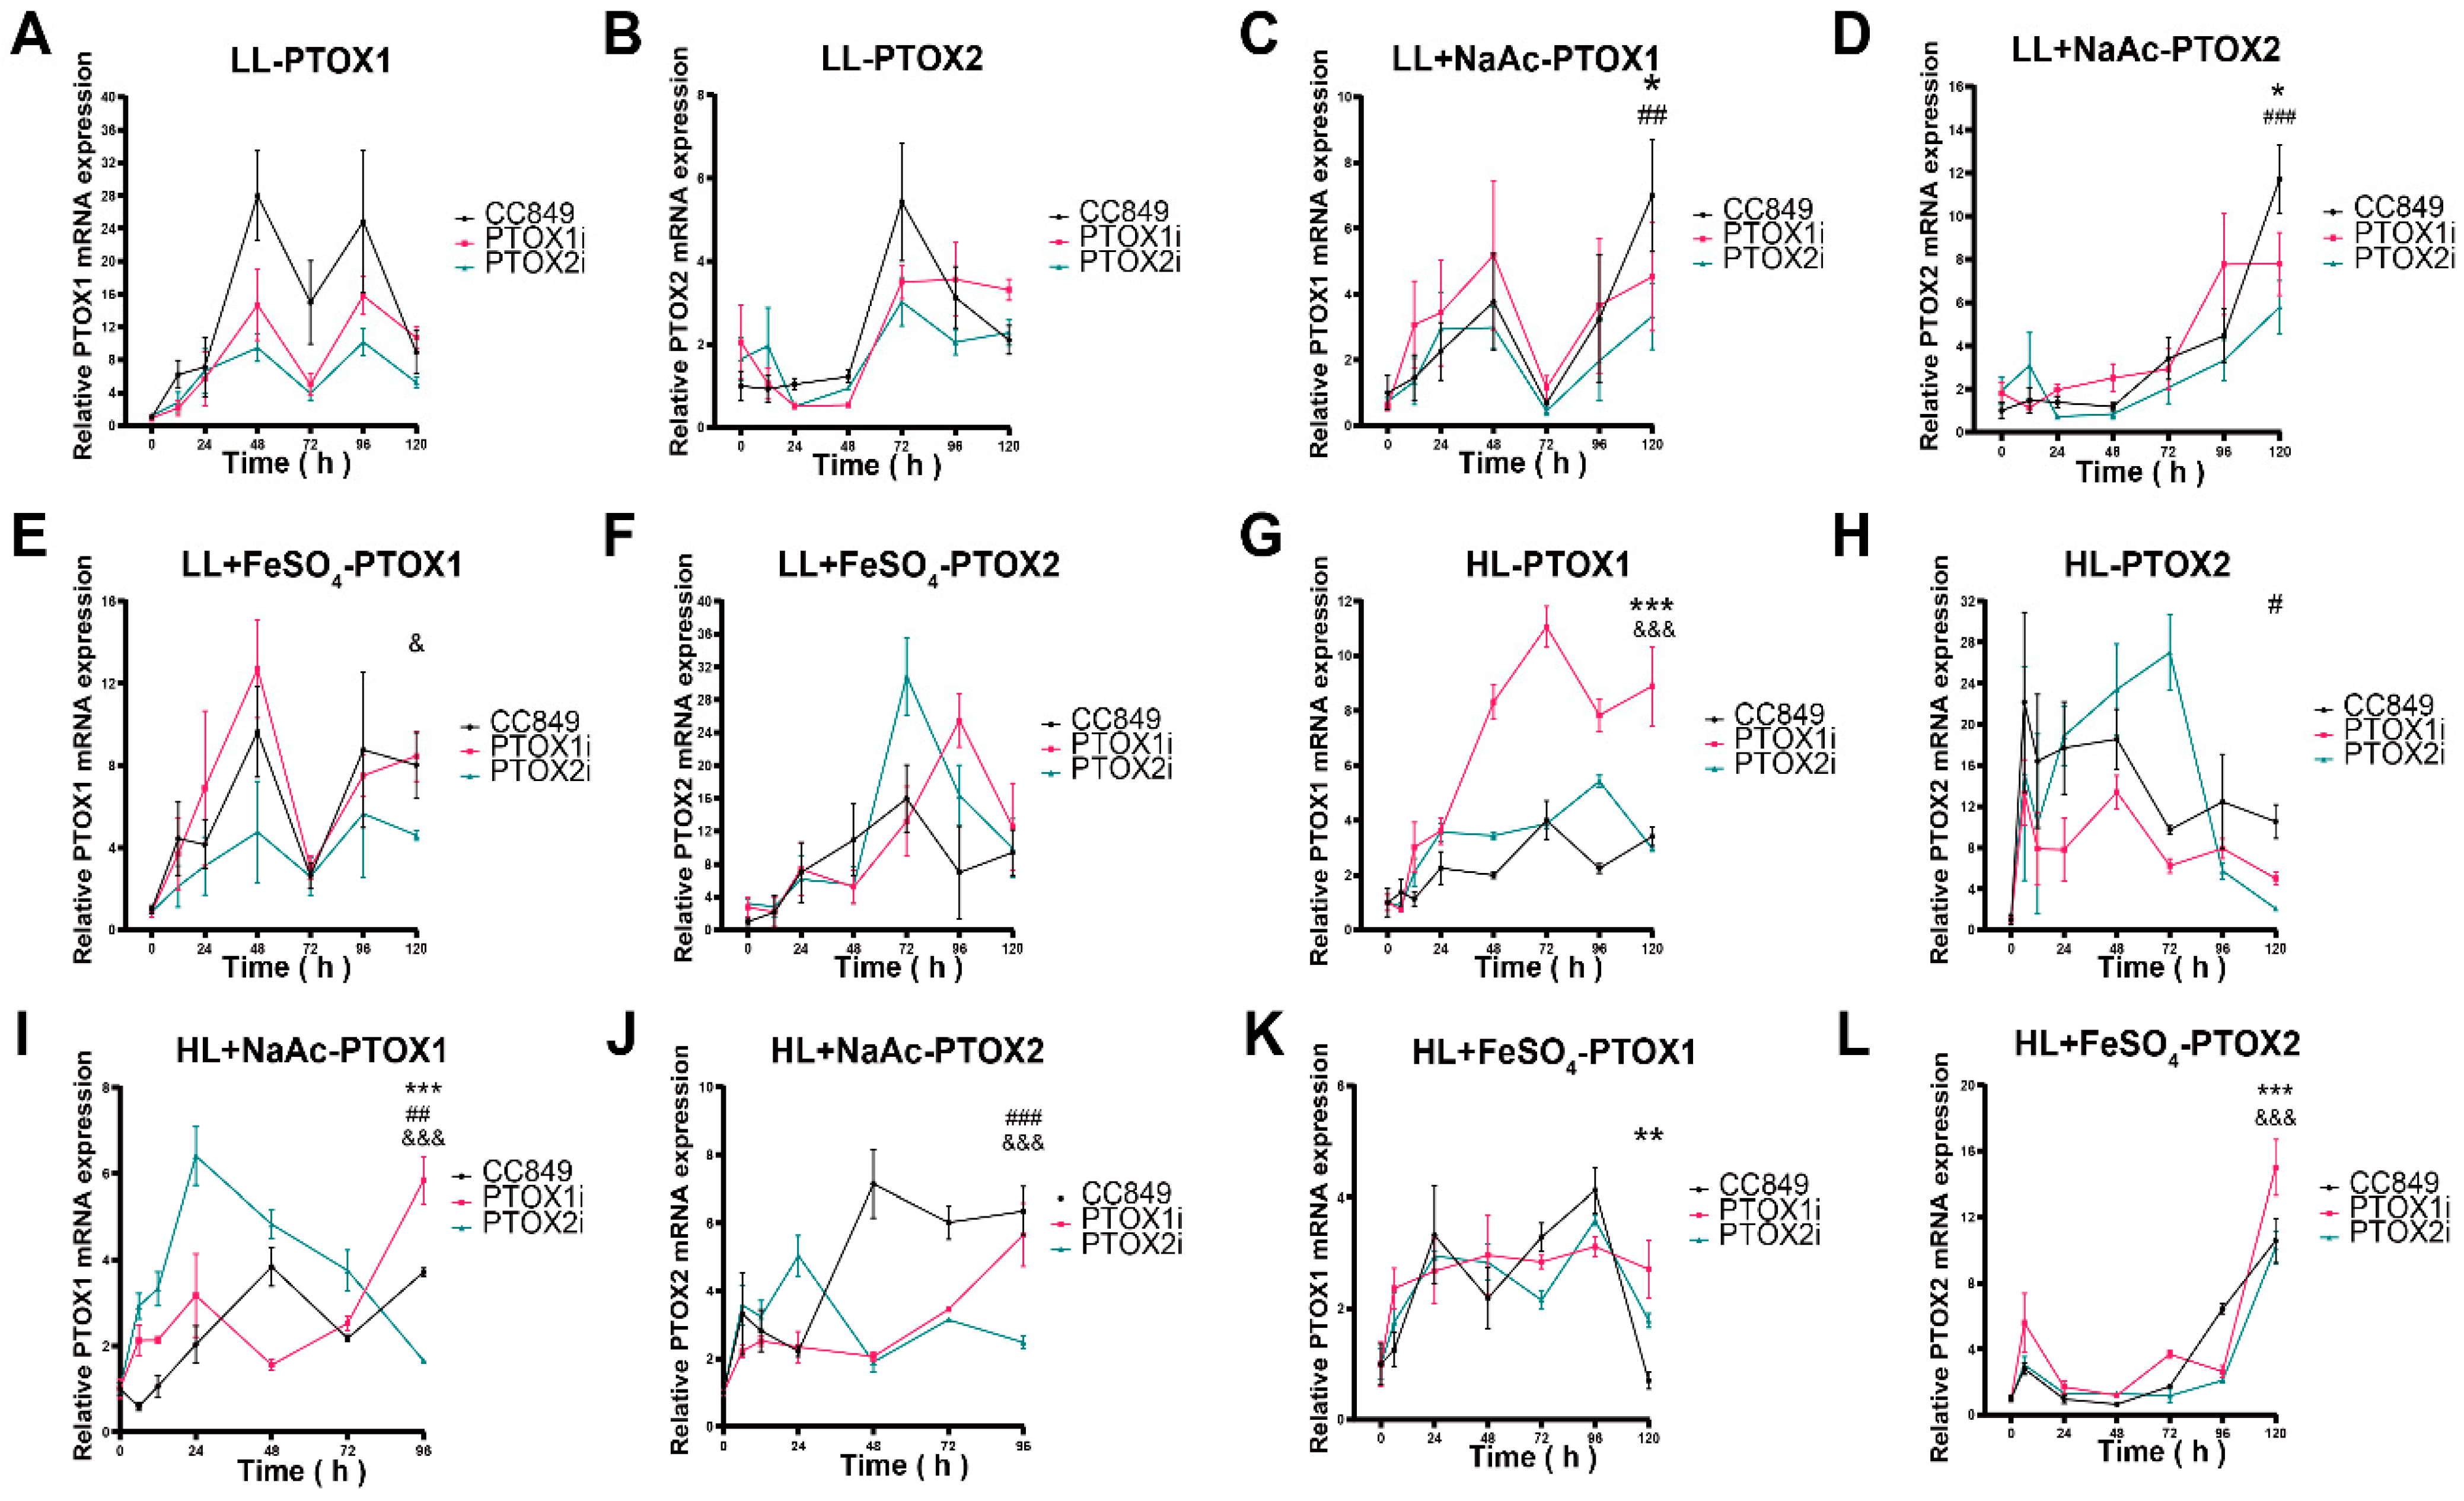
Under high light stress, the activation of the light promoter in the pH124 vector inhibited both the ptox1 and ptox2 genes. The increase in the expression of one gene when the other is inhibited suggests a compensatory mechanism between the two, indicating that PTOX1 and PTOX2 may have overlapping functions and can substitute for each other to some extent. The observations suggest that the PTOX genes play a more significant role in response to high light stress than NaAc-induced stress. This is because the ptox1 and ptox2 genes were not significantly inhibited in their respective silenced strains compared to the high-light intensity group. The lack of a significant complementary effect between PTOX1 and PTOX2 under NaAc treatment suggests that these two genes may have similar functions in response to this particular stressor. Inhibiting either gene does not result in a compensatory upregulation of the other gene. Additionally, the experimental group exhibited a reduced silencing effect when exposed to the combined stress of FeSO4 and high light intensity. The statement suggests that the inclusion of FeSO4 as a stressor exacerbates the condition of the cells, necessitating an upregulation of both PTOX genes to cope with the excess reducing equivalents produced during photosynthesis.
The responses of PTOX genes to different stress conditions highlight the intricate regulatory mechanisms involved in maintaining photosynthetic efficiency and cellular homeostasis. These findings underscore the significance of PTOX in mitigating the detrimental effects of environmental stressors, particularly under high light intensity. Exploring the potential of PTOX in responding to diverse stressors opens up promising avenues for future research and possible applications. Future research directions could delve into further elucidating the specific stress-response pathways and signaling networks involving PTOX genes. Investigating the molecular mechanisms underlying the upregulation or downregulation of PTOX expression under different stress conditions would provide valuable insights into their adaptive roles and regulatory mechanisms. Additionally, exploring the genetic diversity and functional variations of PTOX genes in different plant species could enhance our understanding of their evolutionary significance and potential applications. Comparative genomics and population studies may uncover novel PTOX variants with enhanced stress tolerance or superior photosynthetic performance, paving the way for targeted breeding strategies to incorporate these traits into crop plants. Moreover, the potential of PTOX in stress tolerance enhancement could be harnessed through genetic engineering approaches. Modulating PTOX expression levels or engineering PTOX variants with optimized activity under specific stress conditions could confer improved stress tolerance in photosynthetic organisms. These efforts could involve the use of gene editing technologies, such as CRISPR-Cas9, to precisely modify PTOX genes and assess the resulting phenotypic effects.

5. Conclusions

In summary, our study provides valuable insights into the synergistic role of ptox1 and ptox2 genes in regulating growth, stress response, and astaxanthin production in Chlamydomonas reinhardtii. The results demonstrate that the ptox1 gene plays a crucial role in stress response and cellular growth dynamics, while the ptox2 gene is essential for resistance to high light stress and regulation of astaxanthin accumulation. Notably, the interplay between ptox1 and ptox2 genes appears to be of utmost importance in orchestrating the overall stress adaptation and metabolic regulation in C. reinhardtii.

Supplementary Materials

The following supporting information can be downloaded at: https://www.mdpi.com/article/10.3390/pr12040804/s1, Figure S1: Temporal growth dynamics of wild-type (CC849) and ptox mutants (PTOX1i and PTOX2i) under different conditions. Table S1: Primers involved in this study.

Author Contributions

Conceptualization, J.C., J.W. (Jiangxin Wang), and M.X.; data curation, J.C. and J.L.; formal analysis, J.C. and M.X.; methodology, J.C., J.W. (Jiangxin Wang), H.L., M.X., Y.Z. and J.L.; project administration, G.H.; resources, M.X.; software, M.X.; supervision, J.W. (Jinxia Wu) and G.H.; validation, J.W. (Jiangxin Wang), H.L., M.X. and Y.Z.; visualization, J.W. (Jinxia Wu); writing—original draft, J.C.; writing—review and editing, J.W. (Jinxia Wu) and G.H. All authors have read and agreed to the published version of the manuscript.

Funding

This research was funded by the Science, Technology and Innovation Commission of Shenzhen Municipality (KCXFZ20211020164013021), the Development and Reform Commission of Shenzhen Municipality (XMHT20220104019), the Guangdong Key R&D Project (2022B1111070005), Innovation Driven Development Special Fund Project of Guangxi (Guike AA18242047), the Project of DEGP (2023ZDZX4047), Department of Education of Guangdong Province (2022ZDZX4039), and Guangdong Province College Student Innovation and Entrepreneurship Training Program Project (S202310590071).

Data Availability Statement

The data presented in this study are included in the article and Supplementary Materials, further inquiries can be directed to the corresponding author.

Acknowledgments

We thank the central research facilities of the College of Life Sciences and Oceanography Shenzhen University for the assistance with astaxanthin content analysis.

Conflicts of Interest

The authors declare that they have no known competing financial interests or personal relationships that could have appeared to influence the work reported in this paper. No conflicts, informed consent, or human or animal rights apply to this study.

References

  1. Thiers, K.L.L.; da Silva, J.H.M.; Sartori, G.R.; dos Santos, C.P.; Saraiva, K.D.D.C.; Roque, A.L.M.; Arnholdt-Schmitt, B.; Costa, J.H. Polymorphisms in plastoquinol oxidase (PTOX) from Arabidopsis accessions indicate SNP-induced structural variants associated with altitude and rainfall. J. Bioenerg. Biomembr. 2019, 51, 151–164. [Google Scholar] [CrossRef] [PubMed]
  2. Wetzel, C.M.; Jiang, C.; Meehan, L.J.; Voytas, D.F.; Rodermel, S.R. Nuclear-organelle interactions: The immutans variegation mutant of Arabidopsis is plastid autonomous and impaired in carotenoid biosynthesis. Plant J. 1994, 6, 161–175. [Google Scholar] [CrossRef] [PubMed]
  3. Stepien, P.; Johnson, G.N. Contrasting responses of photosynthesis to salt stress in the glycophyte Arabidopsis and the halophyte thellungiella: Role of the plastid terminal oxidase as an alternative electron sink. Plant Physiol. 2009, 149, 1154–1165. [Google Scholar] [CrossRef] [PubMed]
  4. Nawrocki, W.J.; Buchert, F.; Joliot, P.; Rappaport, F.; Bailleul, B.; Wollman, F.-A. Chlororespiration Controls Growth Under Intermittent Light. Plant Physiol. 2019, 179, 630–639. [Google Scholar] [CrossRef] [PubMed]
  5. Overlander-Chen, M.; Carlson, C.H.; Fiedler, J.D.; Yang, S. Plastid terminal oxidase is required for chloroplast biogenesis in barley. Plant J. 2024, 117, 1179–1190. [Google Scholar] [CrossRef] [PubMed]
  6. Wang, Y.; Hu, Y.; Mo, J.; Wong, T.Y.; Liu, J.; Alessandro, P.; Tang, B.Z.; Wang, W.-X.; Yan, N. Bioprospecting of Chlamydomonas reinhardtii for boosting Biofuel-Related product production based on novel Aggregation-Induced emission active extracellular polymeric substances nanoprobes. Bioresour. Technol. 2024, 399, 130636. [Google Scholar] [CrossRef] [PubMed]
  7. Zheng, S.; Sun, S.; Zou, S.; Song, J.; Hua, L.; Chen, H.; Wang, Q. Effects of culture temperature and light regimes on biomass and lipid accumulation of Chlamydomonas reinhardtii under carbon-rich and nitrogen-limited conditions. Bioresour. Technol. 2024, 399, 130613. [Google Scholar] [CrossRef] [PubMed]
  8. Zhou, Q.; Wang, C.; Yamamoto, H.; Shikanai, T. PTOX-dependent safety valve does not oxidize P700 during photosynthetic induction in the Arabidopsis pgr5 mutant. Plant Physiol. 2022, 188, 1264–1276. [Google Scholar] [CrossRef] [PubMed]
  9. Ahmad, N.; Khan, M.O.; Islam, E.; Wei, Z.-Y.; McAusland, L.; Lawson, T.; Johnson, G.N.; Nixon, P.J. Contrasting Responses to Stress Displayed by Tobacco Overexpressing an Algal Plastid Terminal Oxidase in the Chloroplast. Front. Plant Sci. 2020, 11, 501. [Google Scholar] [CrossRef]
  10. Krieger-Liszkay, A.; Feilke, K. The Dual Role of the Plastid Terminal Oxidase PTOX: Between a Protective and a Pro-oxidant Function. Front. Plant Sci. 2015, 6, 1147. [Google Scholar] [CrossRef]
  11. Houille-Vernes, L.; Rappaport, F.; Wollman, F.-A.; Alric, J.; Johnson, X. Plastid terminal oxidase 2 (PTOX2) is the major oxidase involved in chlororespiration in Chlamydomonas. Proc. Natl. Acad. Sci. USA 2011, 108, 20820–20825. [Google Scholar] [CrossRef] [PubMed]
  12. Stenmark, P.; Nordlund, P. A prokaryotic alternative oxidase present in the bacterium Novosphingobium aromaticivorans. FEBS Lett. 2003, 552, 189–192. [Google Scholar] [CrossRef] [PubMed]
  13. Wang, D.; Fu, A. The Plastid Terminal Oxidase is a Key Factor Balancing the Redox State of Thylakoid Membrane. Enzymes 2016, 40, 143–171. [Google Scholar] [PubMed]
  14. Wang, D.; Wang, C.; Li, C.; Song, H.; Qin, J.; Chang, H.; Fu, W.; Wang, Y.; Wang, F.; Li, B.; et al. Functional Relationship of Arabidopsis AOXs and PTOX Revealed via Transgenic Analysis. Front. Plant Sci. 2021, 12, 692847. [Google Scholar] [CrossRef] [PubMed]
  15. McDonald, A.E.; Amirsadeghi, S.; Vanlerberghe, G.C. Prokaryotic orthologues of mitochondrial alternative oxidase and plastid terminal oxidase. Plant Mol. Biol. 2003, 53, 865–876. [Google Scholar] [CrossRef] [PubMed]
  16. McDonald, A.E.; Vanlerberghe, G.C. Origins, evolutionary history, and taxonomic distribution of alternative oxidase and plastoquinol terminal oxidase. Comp. Biochem. Physiol. Part D Genom. Proteom. 2006, 1, 357–364. [Google Scholar] [CrossRef] [PubMed]
  17. Fu, A.; Aluru, M.; Rodermel, S.R. Conserved active site sequences in Arabidopsis plastid terminal oxidase (PTOX): In vitro and in planta mutagenesis studies. J. Biol. Chem. 2009, 284, 22625–22632. [Google Scholar] [CrossRef]
  18. Ahmad, N.; Michoux, F.; Nixon, P.J. Investigating the production of foreign membrane proteins in tobacco chloroplasts: Expression of an algal plastid terminal oxidase. PLoS ONE 2012, 7, e41722. [Google Scholar] [CrossRef]
  19. Feilke, K.; Streb, P.; Cornic, G.; Perreau, F.; Kruk, J.; Krieger-Liszkay, A. Effect of Chlamydomonas plastid terminal oxidase 1 expressed in tobacco on photosynthetic electron transfer. Plant J. 2016, 85, 219–228. [Google Scholar] [CrossRef]
  20. Joët, T.; Genty, B.; Josse, E.-M.; Kuntz, M.; Cournac, L.; Peltier, G. Involvement of a plastid terminal oxidase in plastoquinone oxidation as evidenced by expression of the Arabidopsis thaliana enzyme in tobacco. J. Biol. Chem. 2002, 277, 31623–31630. [Google Scholar] [CrossRef]
  21. Heyno, E.; Gross, C.M.; Laureau, C.; Culcasi, M.; Pietri, S.; Krieger-Liszkay, A. Plastid alternative oxidase (PTOX) promotes oxidative stress when overexpressed in tobacco. J. Biol. Chem. 2009, 284, 31174–31180. [Google Scholar] [CrossRef] [PubMed]
  22. Feilke, K.; Ajlani, G.; Krieger-Liszkay, A. Overexpression of plastid terminal oxidase in Synechocystis sp. PCC 6803 alters cellular redox state. Philos. Trans. R. Soc. Lond. B Biol. Sci. 2017, 372, 20160379. [Google Scholar]
  23. Stepien, P.; Johnson, G.N. Plastid terminal oxidase requires translocation to the grana stacks to act as a sink for electron transport. Proc. Natl. Acad. Sci. USA 2018, 115, 9634–9639. [Google Scholar] [CrossRef] [PubMed]
Figure 1. Construction of Chlamydomonas ptoxs-RNAi mutant strain. (A) Construction process of the pH124-ptoxs-RNAi plasmid. (B) Identification of vector pH124-ptoxs-RNAi by restriction analysis. 1, pH124-ptox2-RNAi/Pmac I + Nhe I; 2, pH124-ptox1-RNAi/PmaC I + Nhe I; 3, pH124-ptox2-RNAi/EcoR I; 4, pH124-ptox1-RNAi/EcoR I; 5, pH124/EcoR Ⅰ; 6, pH124 vector without digestion. (C) Selection of high-efficiency silence transgene Chlamydomonas reinhardtii R1 and R2. The results represent three independent experiments (n = 3). Data represent means ± SD. * p < 0.05, *** p < 0.001, or “ns” for not significant.
Processes 12 00804 g001
Figure 2. The growth curves of PTOX knockdown cells under stress. Growth curves of wild-type (CC849) and ptox mutants (PTOX1i and PTOX2i) under different conditions. (A) The growth curves of wild-type (CC849) and ptox mutants (PTOX1i and PTOX2i) under normal conditions. (B) The growth curves of wild-type (CC849) and ptox mutants (PTOX1i and PTOX2i) under high light culture conditions. (C) The growth curves of wild-type (CC-849) and ptox mutants (PTOX1i and PTOX2i) under high light culture plus 45 mM NaAC treatment condition. (D) The growth curves of wild-type (CC849) and ptox mutants (PTOX1i and PTOX2i) under high light culture plus 4450 μM FeSO4 treatment condition. The results represent three independent experiments (n = 3). Data represent means ± SD. *** (CC849 versus PTOX1i, CC849 versus PTOX2i) p < 0.001. LL, normal conditions; HL, high light culture condition; NaAc, 45 mM NaAC condition; FeSO4, 450 μM FeSO4 condition.
Processes 12 00804 g002
Figure 3. ptox1 and ptox2 differential expression under stress conditions. Relative mRNA expression levels of ptox1, 2 genes of wild-type (CC849), and ptox mutants (PTOX1i and PTOX2i) under different conditions. (A) The expression of ptox1 under normal conditions. (B) The expression of ptox2 under normal conditions. (C) The expression of ptox1 under 45 mM NaAC treatment. (D) The expression of ptox2 under 45 mM NaAC treatment. (E) The expression of ptox1 under 450 μM FeSO4 treatment. (F) The expression of ptox2 under 450 μM FeSO4 treatment. (G) The expression of ptox1 under high light culture conditions. (H) The expression of ptox2 under high light culture conditions. (I) The expression of ptox1 under high light culture plus 45 mM NaAC treatment. (J) The expression of ptox2 under high light culture plus 45 mM NaAC treatment. (K) The expression of ptox1 under high light culture plus 450 μM FeSO4 treatment. (L) The expression of ptox2 under high light culture plus 450 μM FeSO4 treatment. * (CC849 versus PTOX1i) p < 0.05, ** (CC849 versus PTOX1i) p < 0.01, *** (CC849 versus PTOX1i) p < 0.001, # (CC849 versus PTOX2i) p < 0.05, ## (CC849 versus PTOX2i) p < 0.01, ### (CC849 versus PTOX2i) p < 0.001, & (PTOX1i versus PTOX2i) p < 0.05, &&& (PTOX1i versus PTOX2i) p < 0.001. The results represent three independent experiments (n = 3). Data represent means ± SD.
Processes 12 00804 g003
Figure 4. Astaxanthin production under stress conditions. Astaxanthin accumulation (μg/mL) of wild-type (CC849) and ptox mutants (PTOX1i and PTOX2i) under different conditions. (A) The astaxanthin production of wild-type (CC849) and ptox mutants (PTOX1i and PTOX2i) under normal conditions. (B) The astaxanthin production of wild-type (CC849) and ptox mutants (PTOX1i and PTOX2i) under high light culture conditions. (C) The astaxanthin production of wild-type (CC849) and ptox mutants (PTOX1i and PTOX2i) under high light culture plus 45 mM NaAc treatment condition. (D) The astaxanthin production of wild-type (CC849) and ptox mutants (PTOX1i and PTOX2i) under high light culture plus 4450 μM FeSO4 treatment condition. * (CC849 versus PTOX1i) p < 0.05, *** (CC849 versus PTOX1i) p < 0.001, ### (CC849 versus PTOX2i) p < 0.001, &&& (PTOX1i versus PTOX2i) p < 0.001. The results represent three independent experiments (n = 3). Data represent means ± SD. LL, normal conditions; HL, high light culture condition; NaAc, 45 mM NaAC condition; FeSO4, 450 μM FeSO4 condition.
Processes 12 00804 g004
Disclaimer/Publisher’s Note: The statements, opinions and data contained in all publications are solely those of the individual author(s) and contributor(s) and not of MDPI and/or the editor(s). MDPI and/or the editor(s) disclaim responsibility for any injury to people or property resulting from any ideas, methods, instructions or products referred to in the content.

