Abstract
The formation of solid deposits in the process of supercritical water gasification (SCWG) is one of the main problems hindering the commercial application of the process. Seven experiments were conducted with the grass Reed Canary Grass with different preheating temperatures, but all ended early due to the formation of solid deposits (maximum operation of 3.8 h). The position of solid deposits in the lab plant changed with the variation in the temperature profile. Since the formation of solid deposits consisting of salts, coke, and corrosion products is a severe issue that needs to be resolved in order to enable long-time operation, inner temperature measurements were conducted to determine the temperature range that corresponds with the zone of solid formation. The temperature range was found to be 400 to 440 °C. Wherever this temperature was first reached solid deposits occurred in the system that led to blockage of the flow. Additional to the influence of the temperature, the influence of the flow direction (up-flow or down-flow) on the operation of the continuous SCWG plant was examined. If salts are not separated from the system sufficiently, up-flow reactors should be avoided because they amplify the accumulation of solid deposits leading to a shortened operation time. The heating concept coupled with the salt separation needs to be redesigned in order to separate the salts before entering the gasification reactors. Outside of the determined temperature zone no deposition was visible. Thus, even though the gasification efficiency was low it could be shown that the operation was limited to the deposits forming in the heating section and not by incomplete gasification in the reactor where T > 600 °C.
1. Introduction
Supercritical Water Gasification (SCWG) utilizes water as a reaction medium to convert biomass into gaseous products efficiently. It operates at temperatures and pressures above the critical point of water, ensuring excellent mixing with the organic feedstock and facilitating rapid and uniform reactions [1,2]. An advantageous feature of SCWG is the absence of the energy-intensive drying step required in traditional biomass gasification [3]. This enables the utilization of wet biomass materials like microalgae, lignocellulosic biomass, sewage sludge, and animal manure [4,5,6,7].
The composition of the resulting gas and the efficiency of gasification in SCWG heavily depend on process parameters, such as temperature, pressure, and biomass concentration in the feed [8,9,10]. The primary constituents of the gas mixture are H2, CH4, and CO2, with lower amounts of C2 and C3 compounds and CO [4,11]. SCWG thus provides an option of producing hydrogen from biomass, which is in high demand as a clean fuel in the shift from fossil fuels to renewable energy sources. Additionally, SCWG yields compressed gas directly, eliminating the need for additional compression in subsequent synthesis or gas storage processes [12,13].
Common obstacles in the process of SCWG hindering a commercial application include the ability to pump biomass slurry, corrosion, and the formation of coke [14,15]. The pumpability of the slurry is restricted by the biomass content in the feed. The maximum pumpable content depends on the specific type of biomass [16]. This is contrary to the fact that gas production and the efficiency of the process increase with higher biomass content [17,18]. Pre-treatment aimed at reducing particle size can be beneficial.
Corrosion arises from the extreme process conditions and the gases and minerals formed within the process [18]. Especially, precipitating salts enhance corrosion at T > 500 °C [15,19,20]. Salts are generally poorly soluble in supercritical water and thus precipitate [21,22,23,24]. This enhances corrosion rates but can also lead to the blockage of the flow [4,25]. It is thus important to separate salts from the reaction system after they precipitate.
SCWG exhibits lower coke formation compared to conventional gasification methods [1,26]. The dilution of biomass in supercritical water reduces the interaction rate among biomass molecules, thus inhibiting the formation of tar and coke [15]. However, coke formation, even in low quantities, still plays a significant role, leading to decreased gasification efficiency and potential flow blockages [27]. Coke predominantly originates from the polymerization of aromatic intermediates, such as furfurals [28,29]. Coke formation may occur in heated pipelines due to temperature ranges that promote their development. Kruse et al. found high concentrations of these aromatic intermediates at subcritical temperatures [30]. Utilizing high heating rates can help minimize coke formation [30,31,32].
The present work deals with one of the main obstacles described above, the salt precipitation. The salt precipitation when gasifying biomass in a continuous SCWG lab-plant was investigated. As stated above, precipitating salts can cause corrosion and plugging of the reactors. Thus, salts need to be removed after reaching the supercritical state of water. Past work indicates that this is no trivial task and can lead to short operation times when insufficient [4,25]. The behavior of salt–water mixtures under supercritical conditions of water has been studied in the past by other authors [19,21,33,34]. However, it is important to study the precipitation also for biomasses which contain salts in various forms, in order to design the salt separation properly. Thus, a thorough investigation of the salt precipitation temperature was carried out.
2. Materials and Methods
2.1. Preparation of Educts
The grass Reed Canary Grass (RCG) (lat. Phalaris arundinacea) was used as biomass source for the gasification experiments. Prior experiments had shown that there are no major differences in the gasification of different plants [35], and thus, for the investigation of the present work, only one grass was chosen. The plant was processed in the form of a dry powder with a grain size smaller than 0.25 mm. The elemental analysis of the biomass is displayed in Table 1.

Table 1.
Elemental analysis of RCG (in wt.%).
The feed slurry was created by adding distilled water to the biomass powder in such a ratio that a dry matter content of 8 wt.%. was achieved. Xanthan, supplied by Carl Roth GmbH (Karlsruhe, Germany), was added as a thickening agent (0.5 wt.% based on slurry mass) to prevent phase separation, and KHCO3 (5000 mg K+/kg feed slurry), supplied by VWR International GmbH (Darmstadt, Germany), was added as a homogeneous catalyst. The homogeneous catalyst was chosen as it is known to enhance gasification efficiencies [36]; however, other homogenous catalysts such as K2CO3, KOH, or NaOH would have also been possible [37]. Even though, the homogenous catalysts are known to enhance gasification efficiencies, they might also contribute to plugging if the salt removal in the process is insufficient. A variation in catalyst concentration was not performed in the present study.
2.2. Apparatus
The SCWG experiments were performed in the Laboratory Plant for Energetic Utilization of Agricultural Materials (German acronym: LENA) at the Karlsruhe Institute of Technology. LENA is a high-pressure plant that operates at temperatures of up to 700 °C and pressures of up to 30 MPa. In the past, the laboratory plant has been redesigned several times. In the present paper, the following two configurations are assessed and compared.
2.2.1. Configuration 1
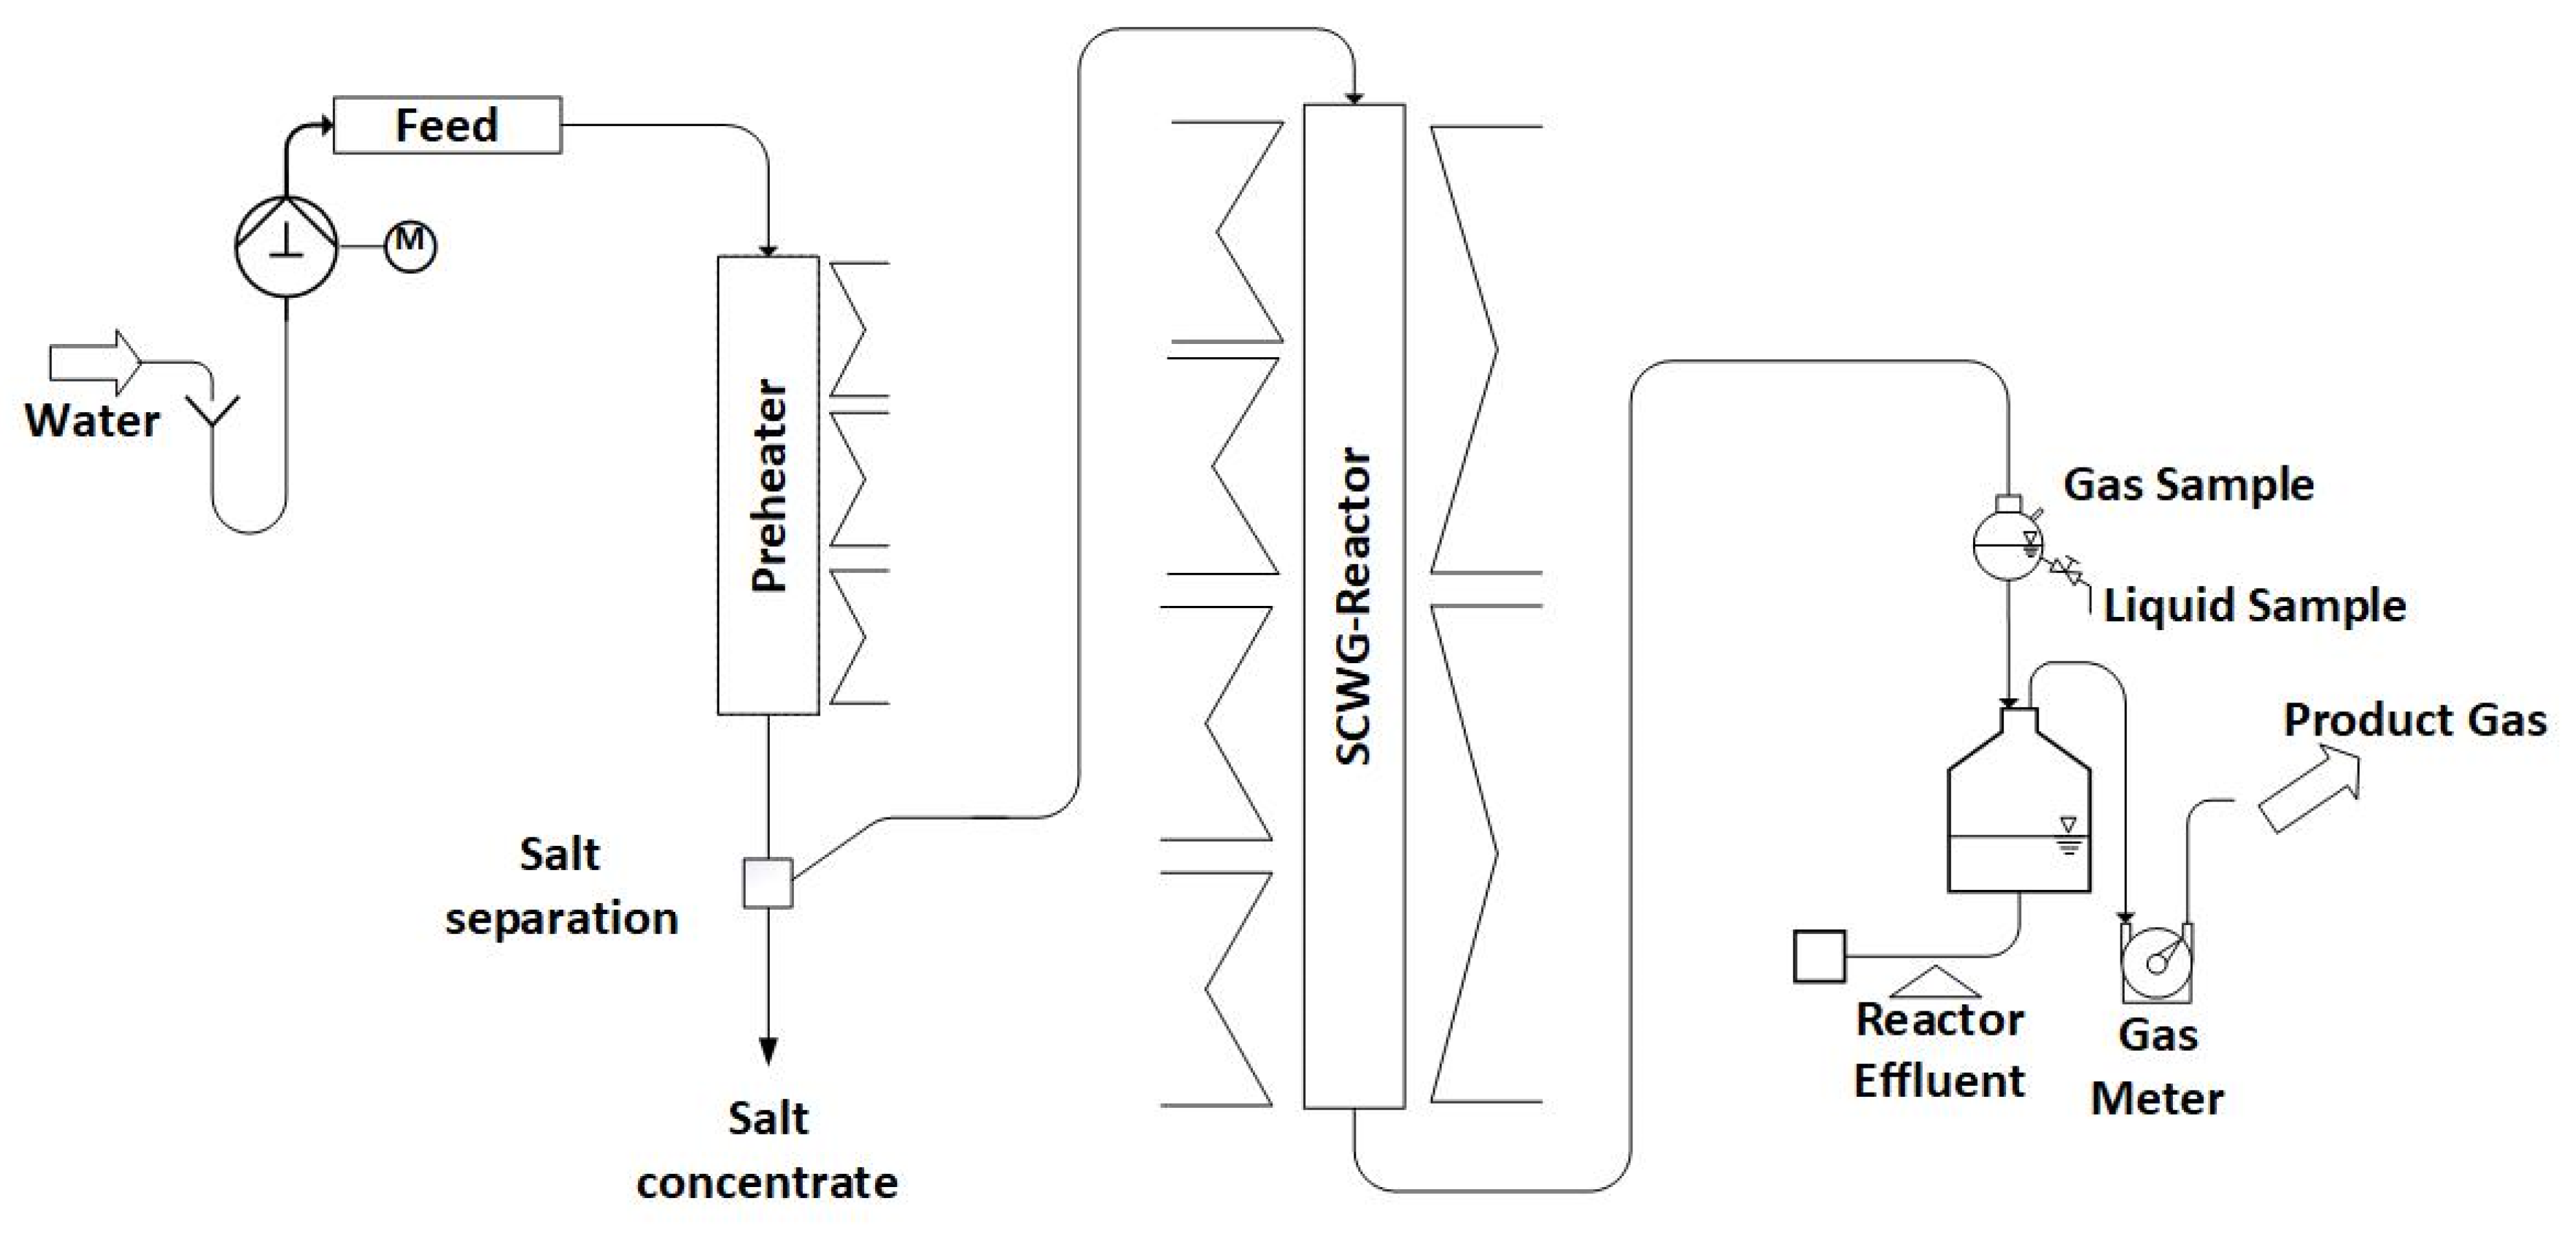
The description of Configuration 1 is adapted from [25]. In Configuration 1, the LENA lab plant consists of a preheater (750 mm long) and a gasification reactor (1800 mm long) (see Figure 1). Both are made out of the nickel-based alloy Inconel 625 with an inner diameter of 8.0 mm, but the preheater is equipped with a SS316 line to reduce its inner diameter to 3.2 mm. Both are externally heated by electric heaters. Thermocouples on the outside of the reactor wall monitor the temperatures. A more detailed description can be found in the authors’ previous paper [25].
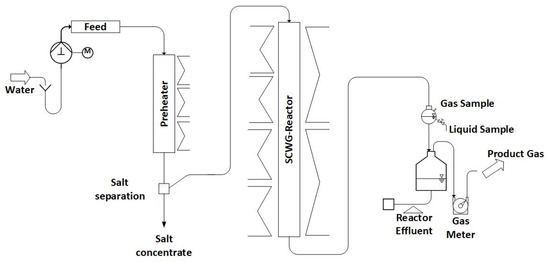
Figure 1.
Schematic diagram of LENA plant in Configuration 1.
Within the preheater, the supercritical state of water is reached. Due to the changes in properties of water, salts are poorly soluble in the supercritical region and thus precipitate. This process is intended to happen at the salt separation, which is realized in the form of a T-fitting at which the flow is redirected sideways. The salts are supposed to drop down vertically into the salt concentrate due to gravity, while the organics are intended to follow the water stream to the SCWG reactor (a schematic drawing can be seen in [4]). The accumulating salt concentrate is ejected into a collection bin by a needle valve that opens for 20 ms in intervals of 120 s. In the SCWG reactor, the organics are gasified. The products are quantified using scales (Soehnle Industrial Solutions GmbH, Backnang, Germany) and gas meters (Ritter Apparatebau GmbH & Co. KG, Bochum, Germany). Throughout the experiment, liquid and gas samples are collected at regular intervals. The evaluation is conducted under steady-state operating conditions, ensuring constant gas composition and production.
To pressurize the system, water is pumped using a high-pressure pump (ProMinent GmbH, Heidelberg, Germany) and subsequently heated. The process control system is used for setting the temperatures required for this purpose. The system’s pressure is regulated by a TESCOM back-pressure regulator (Emerson Automation Solutions, Selmsdorf, Germany) in the cold part of the lab plant after the reactor.
2.2.2. Configuration 2
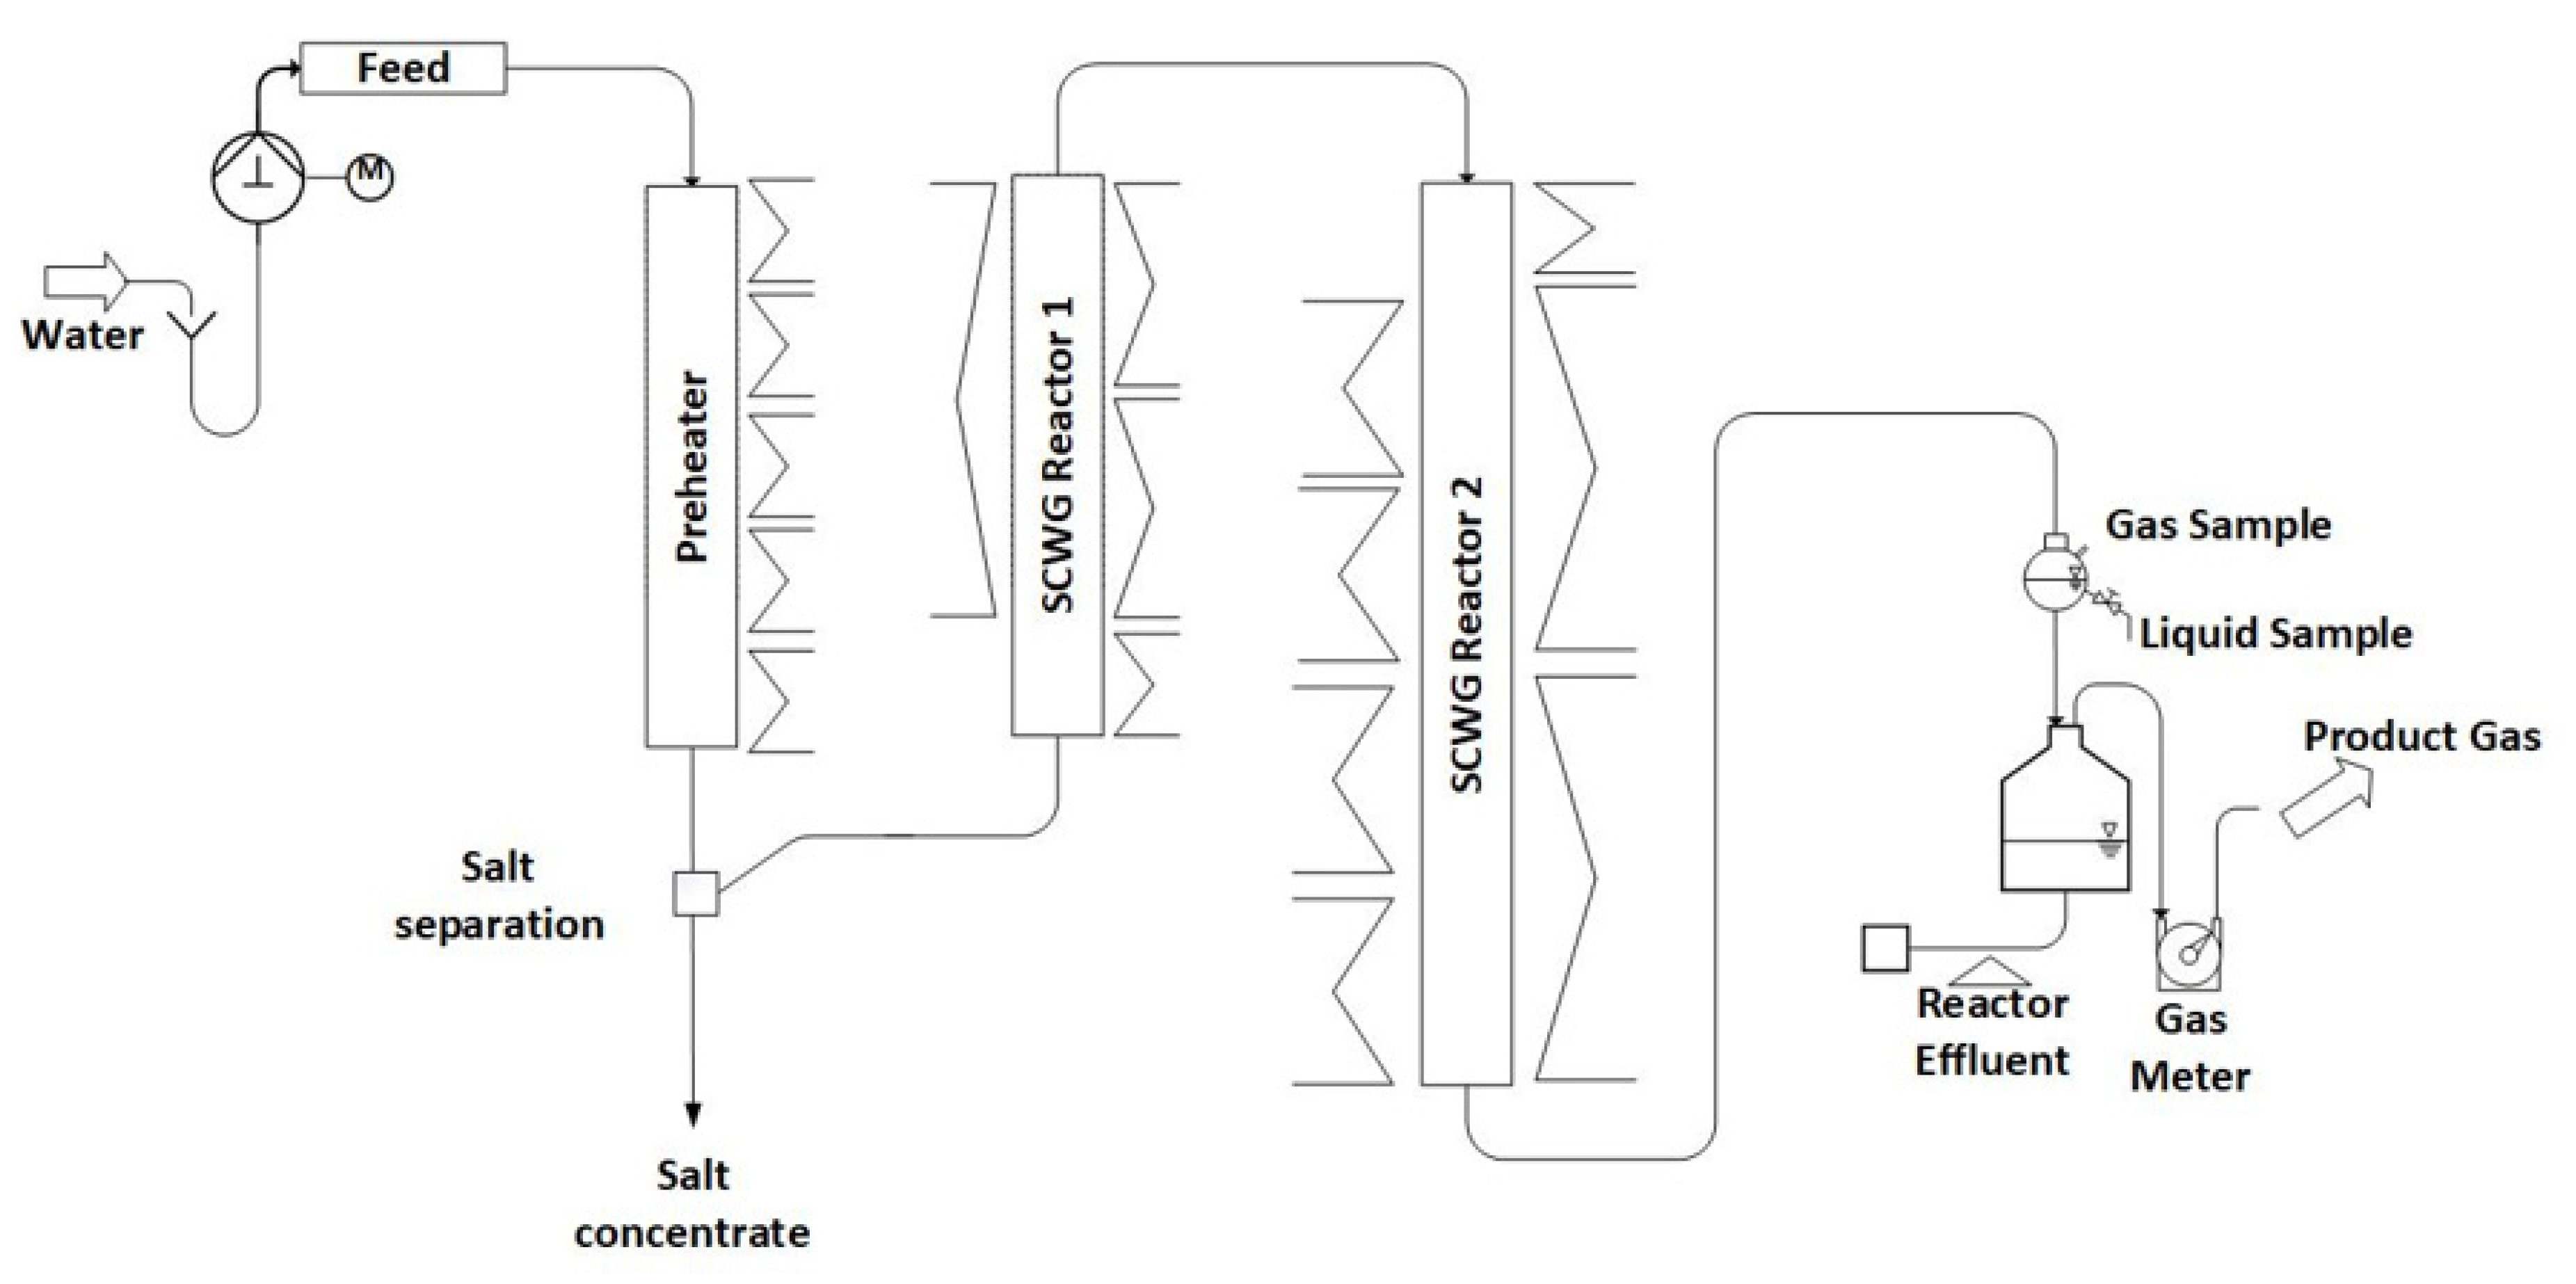
The periphery of the system (gas meters, feed system) is the same as in Configuration 1. Compared to Configuration 1, a prolonged preheater and a second reactor are installed, as depicted in Figure 2.
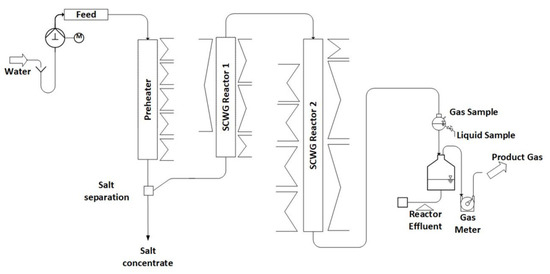
Figure 2.
Schematic diagram of LENA plant in Configuration 2.
The preheater, constructed from the nickel-based alloy Inconel 625, has an inner diameter of 8 mm and a length of 1200 mm. It is equipped with a liner to reduce the inner diameter. Two different liners are used, one made of SS316 with an inner diameter of 3.2 mm and one made of titanium with an inner diameter of 1.5 mm. To heat the preheater, five electric spiral heaters are positioned externally, each with two thermocouples attached to the outer wall of the pipe. In the preheater, the water is heated to its supercritical state.
The gasification reactors, also made of Inconel 625, have lengths of 1100 mm and 1800 mm, both with an inner diameter of 8 mm. Reactor 1 is heated externally using an electric spiral heater and three electric rod heaters, while Reactor 2 is heated using one electric spiral heater and six electric rod heaters. Thermocouples are mounted on the outer wall of both reactors to monitor temperature, with seven thermocouples for Reactor 1 and nine for Reactor 2.
2.3. SCWG Experiments
The SCWG experiments were conducted with a reaction temperature that was set to 650 °C and the pressure of the system was kept at 280 bar. These conditions were chosen out of experience. In general, the pressure does not influence the process significantly according to the literature [11,38]. The gasification efficiency increases with increasing temperature. D’Jesus showed that a temperature of at least 650 °C should be chosen for gasification efficiencies higher than 80% when gasifying 5 wt.% corn silage at different residence times [11]. The biomass content in the feed was 8 wt.% and the flow rate was 700 g h−1. In Table 2, the conducted experiments of Configuration 1 are listed in which the biomass and the preheating temperature were varied (taken from [4,25]).
Table 2.
Conducted experiments in Configuration 1 (taken from [4,25]).
In Table 3, the seven conducted experiments in Configuration 2 are listed in which the preheating temperature and the inner material of the preheater (SS316 and titanium) were varied. With the variation of materials, a variation in the inner diameter was also realized. The experiments were conducted once. Also, the according inner temperature profiles were measured once.
Table 3.
Conducted experiments in Configuration 2 (used biomass: Reed Canary Grass).
2.4. Analysis
The products obtained from the process are analyzed using various methods. The liquid samples, which are collected in regular intervals, are analyzed regarding the total carbon (TC), total inorganic carbon (TIC), and total organic carbon (TOC) in a TOC analyzer (DIMATOC 2100, DIMATEC Analysentechnik GmbH, Essen, Germany). Additionally, the content of trace elements (such as Al, Ca, Cr, Cu, Fe, K, Mg, Mo, Na, Ni, P, S, Si, and Zn) is quantified via ICP-OES (Inductively Coupled Plasma–Optical Emission Spectrometry) with an Agilent 725 spectrometer (Agilent Technologies, Waldbronn, Germany).
The product gas is analyzed immediately after sampling (every 30 min) in a gas chromatograph 5890 series II plus (Hewlett-Packard GmbH, Waldbronn, Germany), equipped with a fused silica capillary column (Carboxen 1010 PLOT 30 m, SUPELCO, Bellefonte, PA, USA). The following gas components are determined: H2, CO, CH4, CO2, C2H4, C2H6, C3H8, and C3H6.
The biomass and the feed slurry are dried in an oven at 105 °C and then analyzed regarding their C, H, N, and S content in the element analyzer vario EL cube (by Elementar Analysensysteme GmbH, Langenselbold, Germany), and the trace elements are analyzed via ICP-OES.
Solids, if formed in the process, are analyzed qualitatively via SEM-EDX (Scanning Electron Microscope–Energy Dispersive X-ray Spectroscopy) in a GeminiSEM 500 (Carl Zeiss AG, Oberkochen, Germany).
2.5. Data Interpretation
To evaluate the experiments, the following key figures are calculated: the carbon efficiency, the TOC-conversion, and the residence time.
The carbon efficiency (CE) determines the amount of organic carbon that is transferred from the feed to the gas phase and is calculated according to Equation (1). It is an indicator for the quality of gasification.
—Concentration of component ‘i’ in the gas product (vol.%);
—Organic carbon concentration in the feed (wt.%);
—Number of carbon atoms of component ‘i’ in the gas product;
—Feed mass flow (g/h);
—Molar mass of carbon (g/mol);
—Pressure (Pa);
—Universal constant of gases (J/mol*K);
—Temperature (K);
—Gas flow under ambient conditions (L/h).
The TOC-conversion describes the amount of the TOC in the feed slurry that is converted into other forms like gases, inorganic components, or residue like coke and thus quantifies the TOC that is not present in the effluent. It is thus a measure for the quality of the waste water and is calculated according to Equation (2).
—Mass flow of reactor effluent (g/h);
—Mass flow of salt concentrate (g/h);
—TOC content of liquid ‘i’ (mg/g);
—TOC content of salt concentrate (mg/g).
For the description of the process, it is necessary to know the residence time (τ) in the gasification reactor. It is determined using Equation (3). For this calculation, the mass content of the reactor needs to be determined, and thus, the density for the present temperature conditions needs to be known. The reactor is thus split into sections of length l, defined by the positions of the thermocouples. The mean temperature in these sections is calculated and considered constant. The mixture’s density is assumed to be equal to the density of water. Thus, for the given mean temperature, the density can be taken from the IAPWS-IF97 data base.
—Inner diameter of the reactor (m);
—Length of section with constant temperature (m);
—Density of water at given temperatures (kg/m3).
3. Results and Discussion
3.1. Influence of Temperature on Solids Formation in SCWG
SCWG experiments conducted with Reed Canary Grass, Napier Grass, and grapevines in Configuration 1 showed that when processing lignocellulosic biomasses, solid deposits can occur in the reaction system that cause a blockage of the flow [4,25]. The solid deposits consist of carbon, precipitating salts, and corrosion products. In previous work, the authors concluded that the formation of solid deposits can most likely be avoided through sufficient salt separation. The salts were not separated completely (30 wt.% or less of the salt forming elements were removed [4,25]) as the salt separation temperature was only slightly supercritical (at max. 390 °C). The salts that were not removed at the salt separation were transported to the gasification reactor where they precipitated due to the further increase in temperature. An optimization could possibly be conducted in terms of geometry and in terms of salt separation temperature [4].
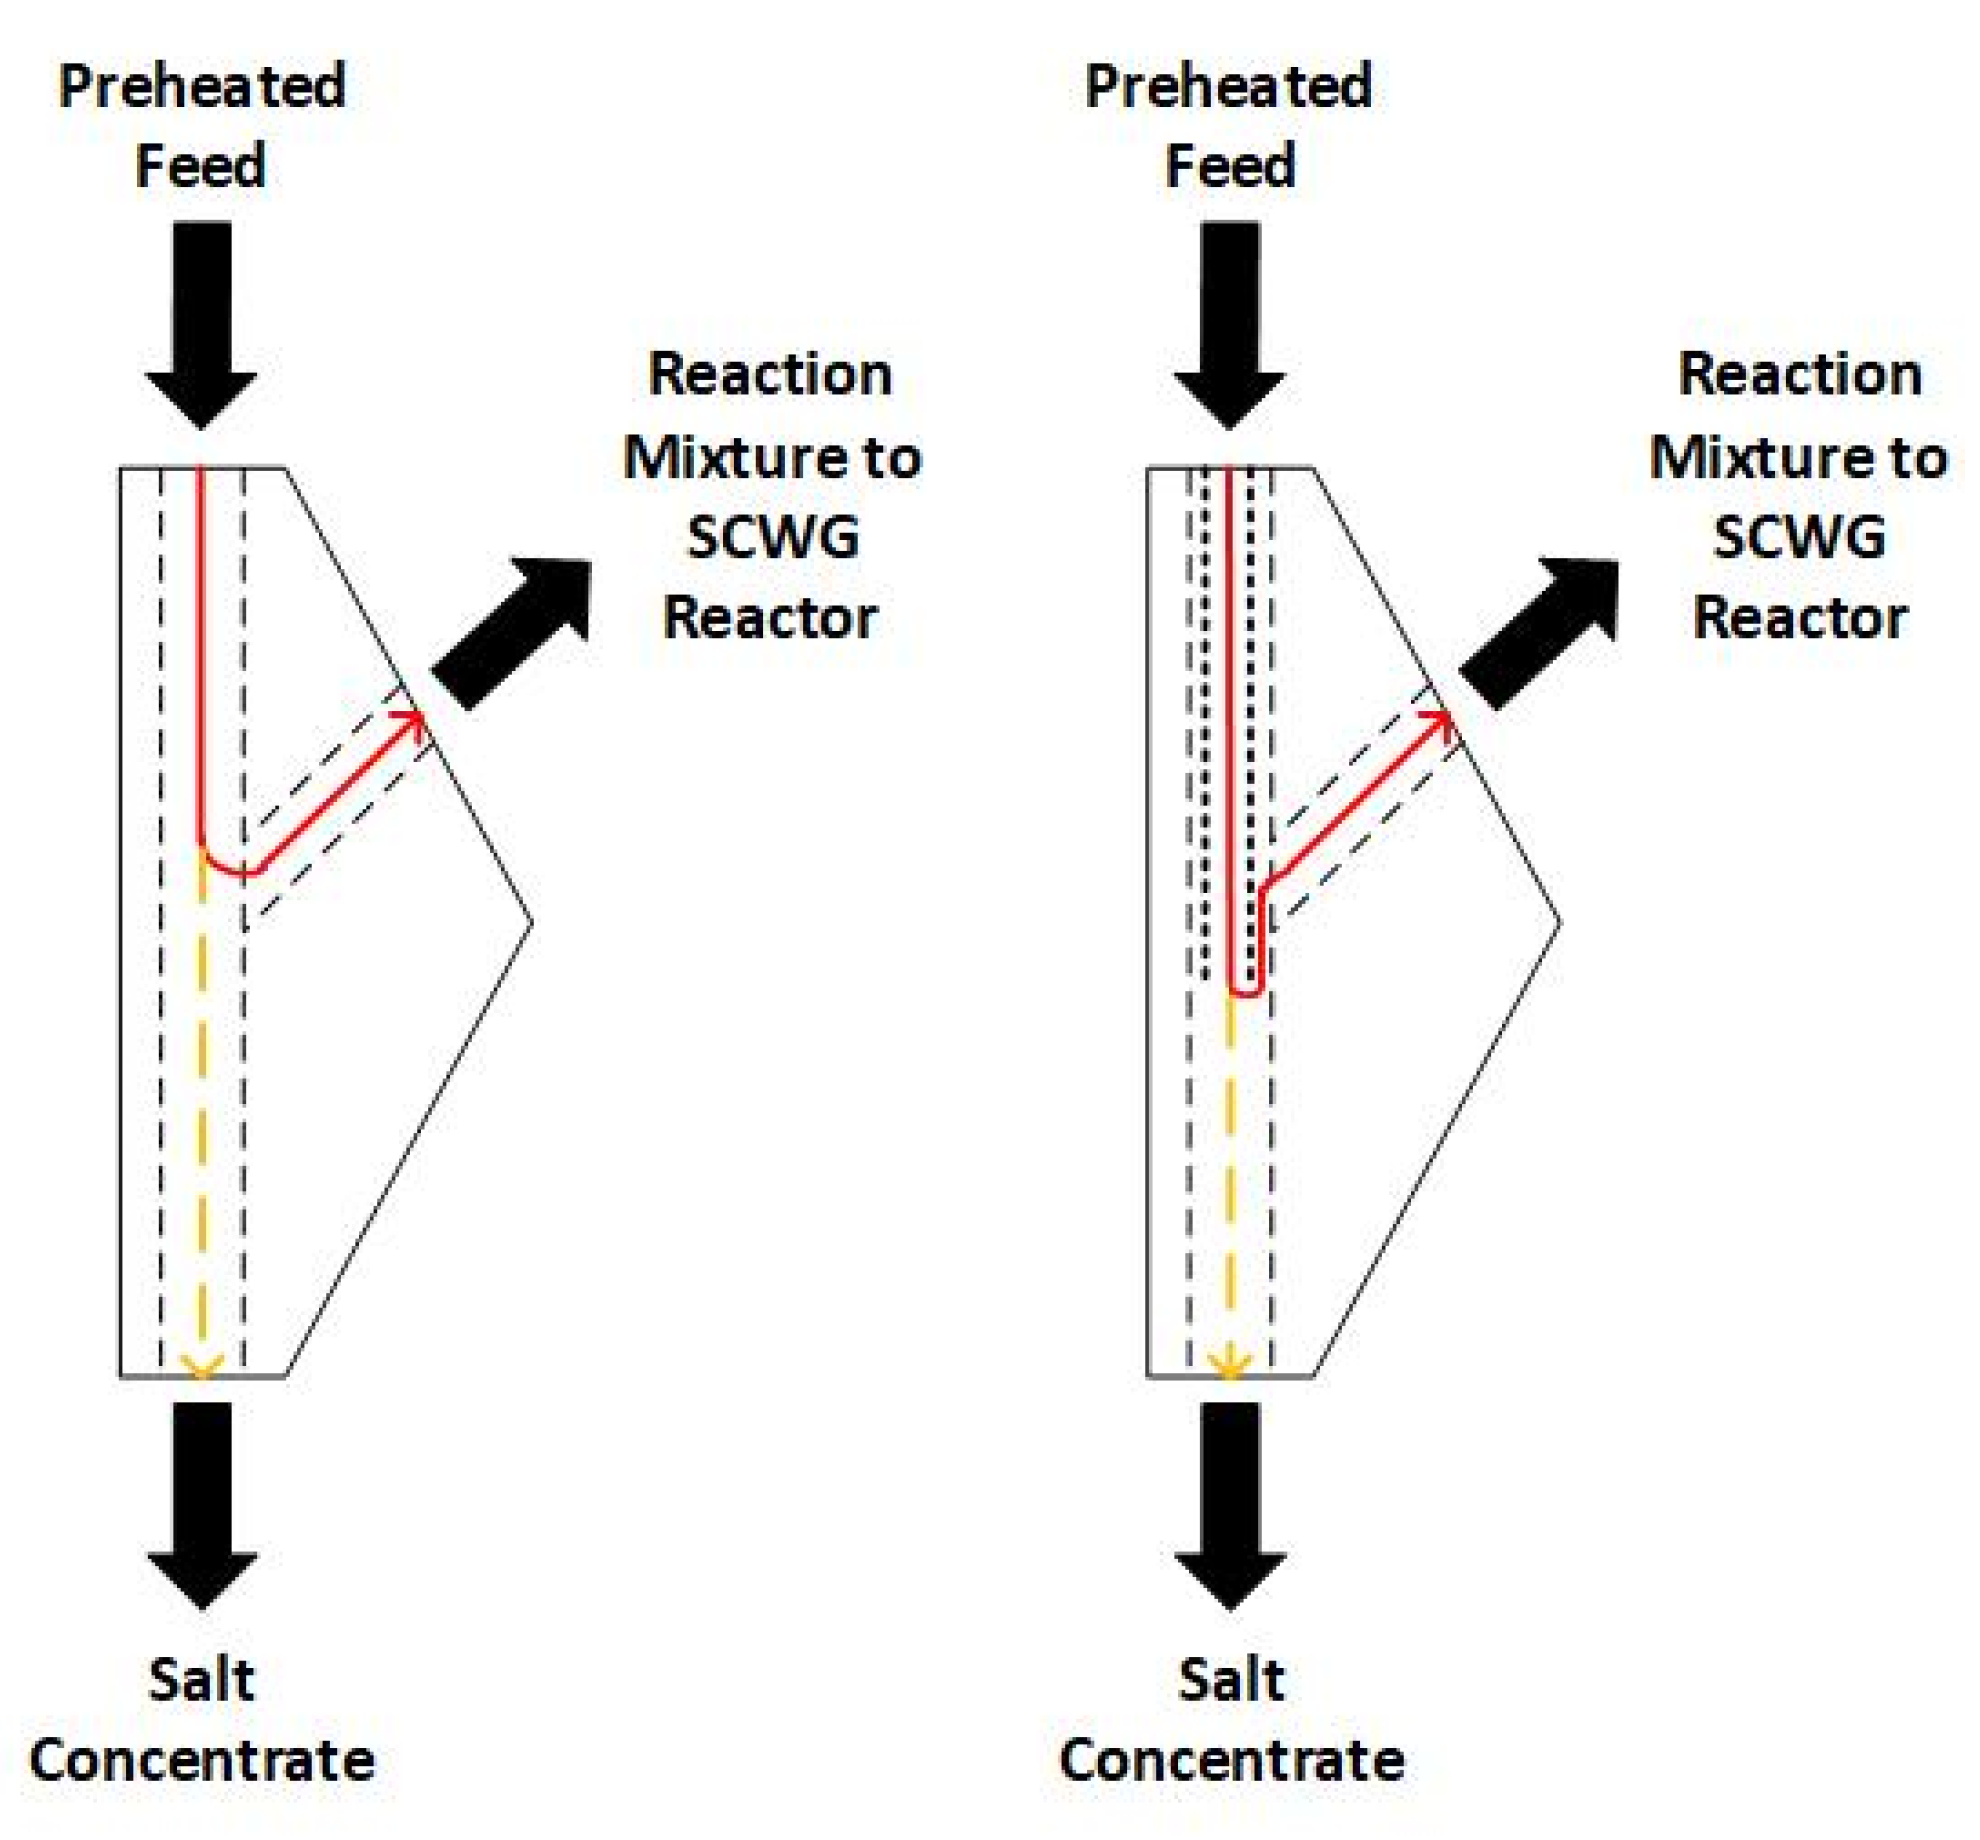
These measures were realized in Configuration 2. The optimization of the geometry was realized in the form of a sharper redirection of the flow in the salt separation T-fitting (see Figure 3) by extending the liner in the preheater past the outlet in the T-fitting that leads to the gasification reactors. The flow redirection is more extreme in Configuration 2, in theory resulting in more salts depositing in the salt concentrate due to gravity. At the same time, the preheater was prolonged from 750 mm [4,25] to 1200 mm in order to achieve higher temperatures at the T-fitting due to a longer heating range without exceeding 500 °C outer temperature, so that excessive local hot-spots at the reactor wall are avoided.

Figure 3.
Salt separation T-fitting. Red line: flow of reaction mixture. Yellow line: salts separating into salt concentrate. (left): Configuration 1, investigated in [4,25]. (right): Configuration 2.
Seven experiments were conducted with different preheating temperatures in Configuration 2. All conducted experiments, as listed in Table 3, ended early due to the formation of solid deposits. The maximum operation duration with the SS316 liner was 3.8 h. The deposits occurred in the preheater and in Reactor 1 depending on the temperature profile of the preheater. As a first countermeasure, a liner with a smaller inner diameter was installed to increase the flow rate in the preheater to improve the removal of possible precipitating solids. In order to avoid the possibility of the carbon formation on SS316 (through coke formation which can be catalyzed by nickel [39]), this new liner was made out of titanium (experiments 12 and 13). In these two experiments, solid formation occurred in less than 1.7 h and the location changed again with the preheating temperature profile. In previous work, the authors proposed that salts mainly precipitate in the reaction system at temperatures of about 450 °C [4,25]. For that reason, at a salt separation temperature of only 390 °C, the salts were not separated sufficiently [25]. In the present experiments, the proposed temperature that leads to solid formation seems to be reached in the preheater when setting the maximum preheating temperature at 500 °C or above when using the SS316 liner. The precipitating salts are not transported to the salt concentrate but rather deposited in the preheater. It is interesting to note that the location of the solid deposits in the preheater varies with the temperature profile. In experiment 7, the proposed temperature range seems to be reached far earlier than in the other experiments due to the long heating zone with an outer temperature of 500 °C and thus the solids were found at 65 to 75 cm from the top in the preheater (the middle of the preheater). In the other experiments with the SS316 liner, they occur further down towards the end of the preheater since less heating was conducted. When the preheating temperature was below 500 °C (experiment 11), the deposits occurred in Reactor 1. In this case, the temperature at the salt separation point was only 365 °C (measured on the outside of the T-fitting) and thus not sufficient to separate salts. The same accounts for the titanium liner where a higher outer temperature and a longer heated zone was necessary in order to reach the proposed temperature range due to the smaller diameter and thus higher flow speed.
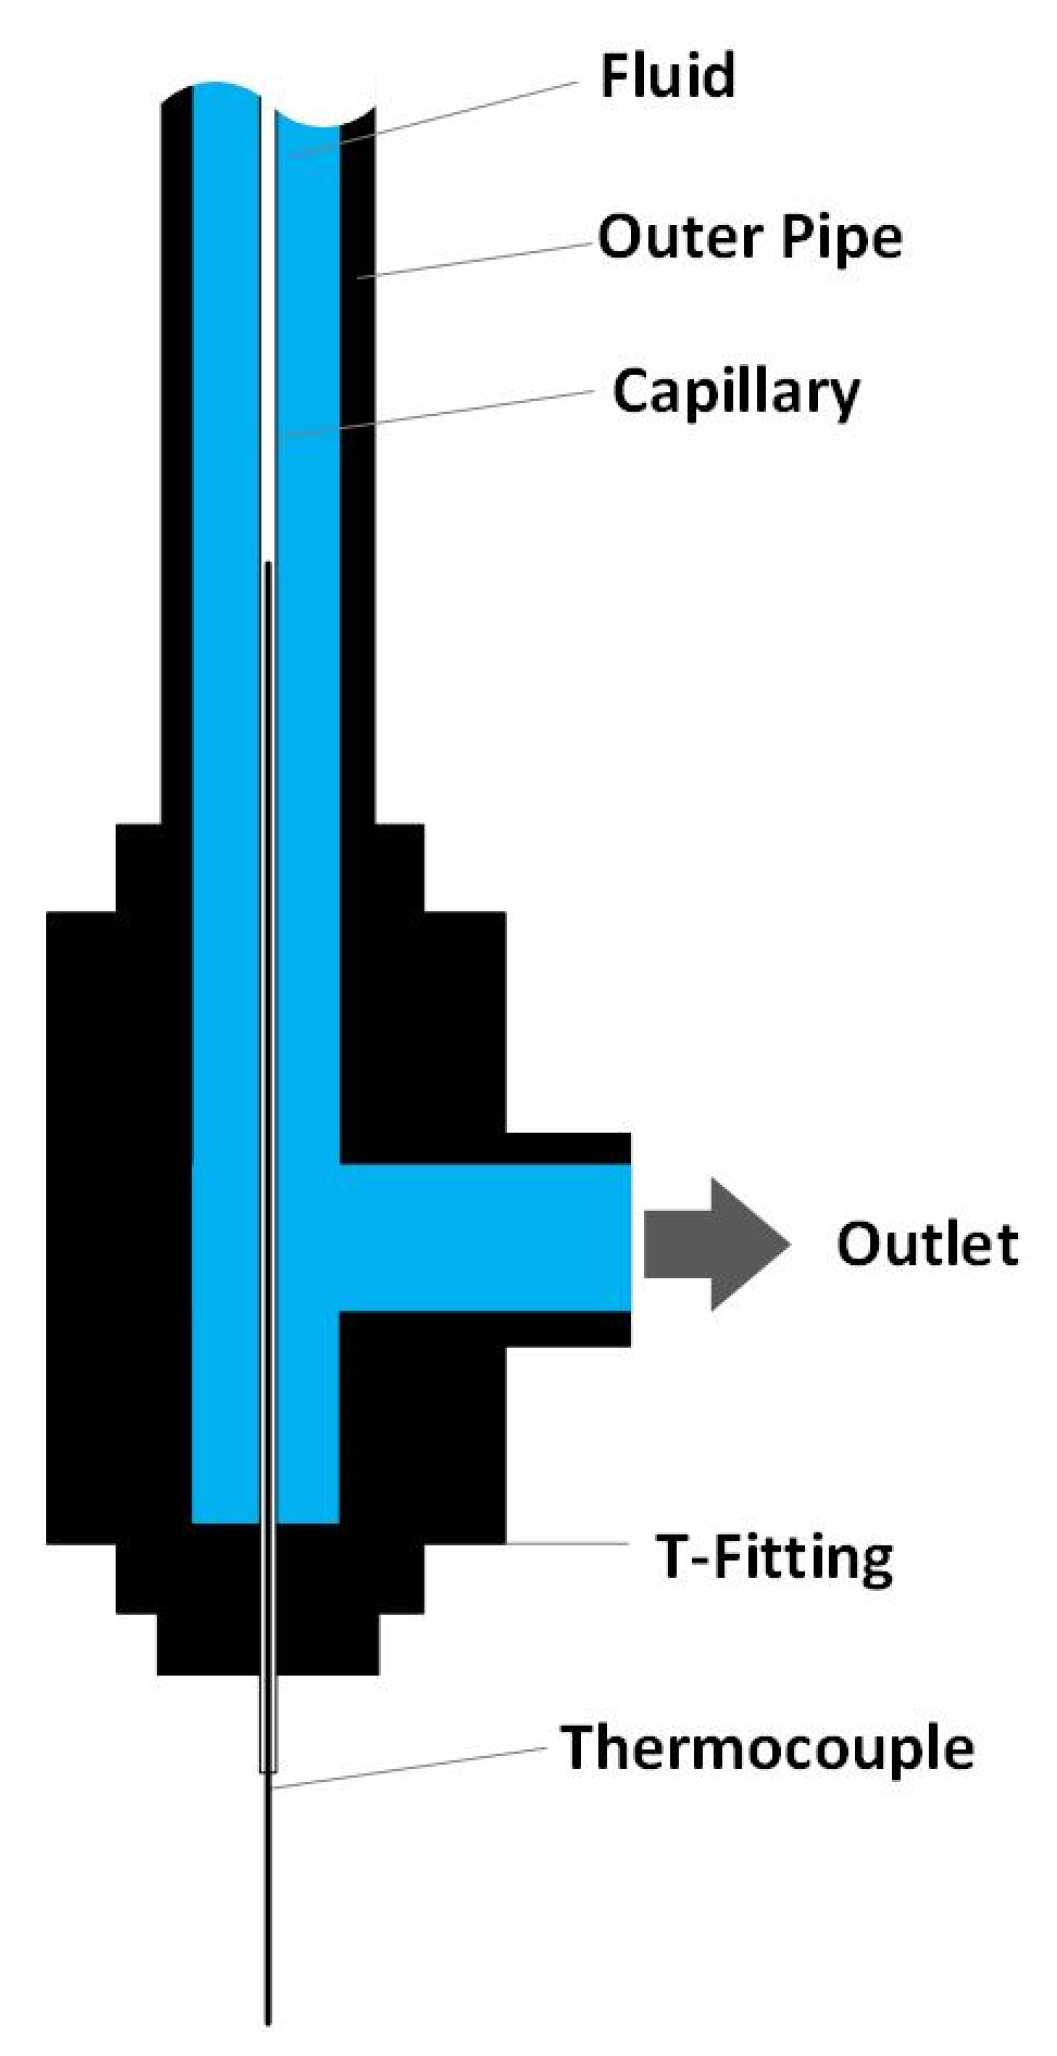
Since the formation of solids is the predominant issue hindering long-time operation in both configurations 1 and 2, the temperature zone of solid deposit formation is of great interest. Therefore, an inner temperature measurement was conducted. The inner temperature measurement was conducted by inserting a 1/16-inch capillary (material: SS316) into the preheater and Reactor 1 (over the whole length of the preheater/reactor) as shown in Figure 4. The inside of the capillary is open to the environment while the outside is in contact with the reaction medium. A thermocouple (0.5 mm diameter) can be inserted into the capillary and moved along the axis of the preheater/reactor to obtain a temperature profile over the whole length of the preheater/reactor. Due to the small diameter of the capillary, it is assumed that the temperature profile is not changed when inserting the capillary. Additionally, it can be assumed that the measured temperature profile is equal to the temperature profile during experiments since the capillary’s walls are so thin that temperature gradients due to heat transfer can be neglected. D’Jesus found that there is no difference in measuring the inner temperature profile with this method when water is flowing through the system compared to biomass slurry [11]. Thus, for simplicity and to avoid corrosion on the capillary, the temperature measurement is conducted with water. The inner measurement in the preheater could only be conducted with the SS316 liner and not the titanium liner since the inner diameter of the titanium liner (1.5 mm) is too small to insert a capillary.

Figure 4.
Set-up of the inner temperature measurement.
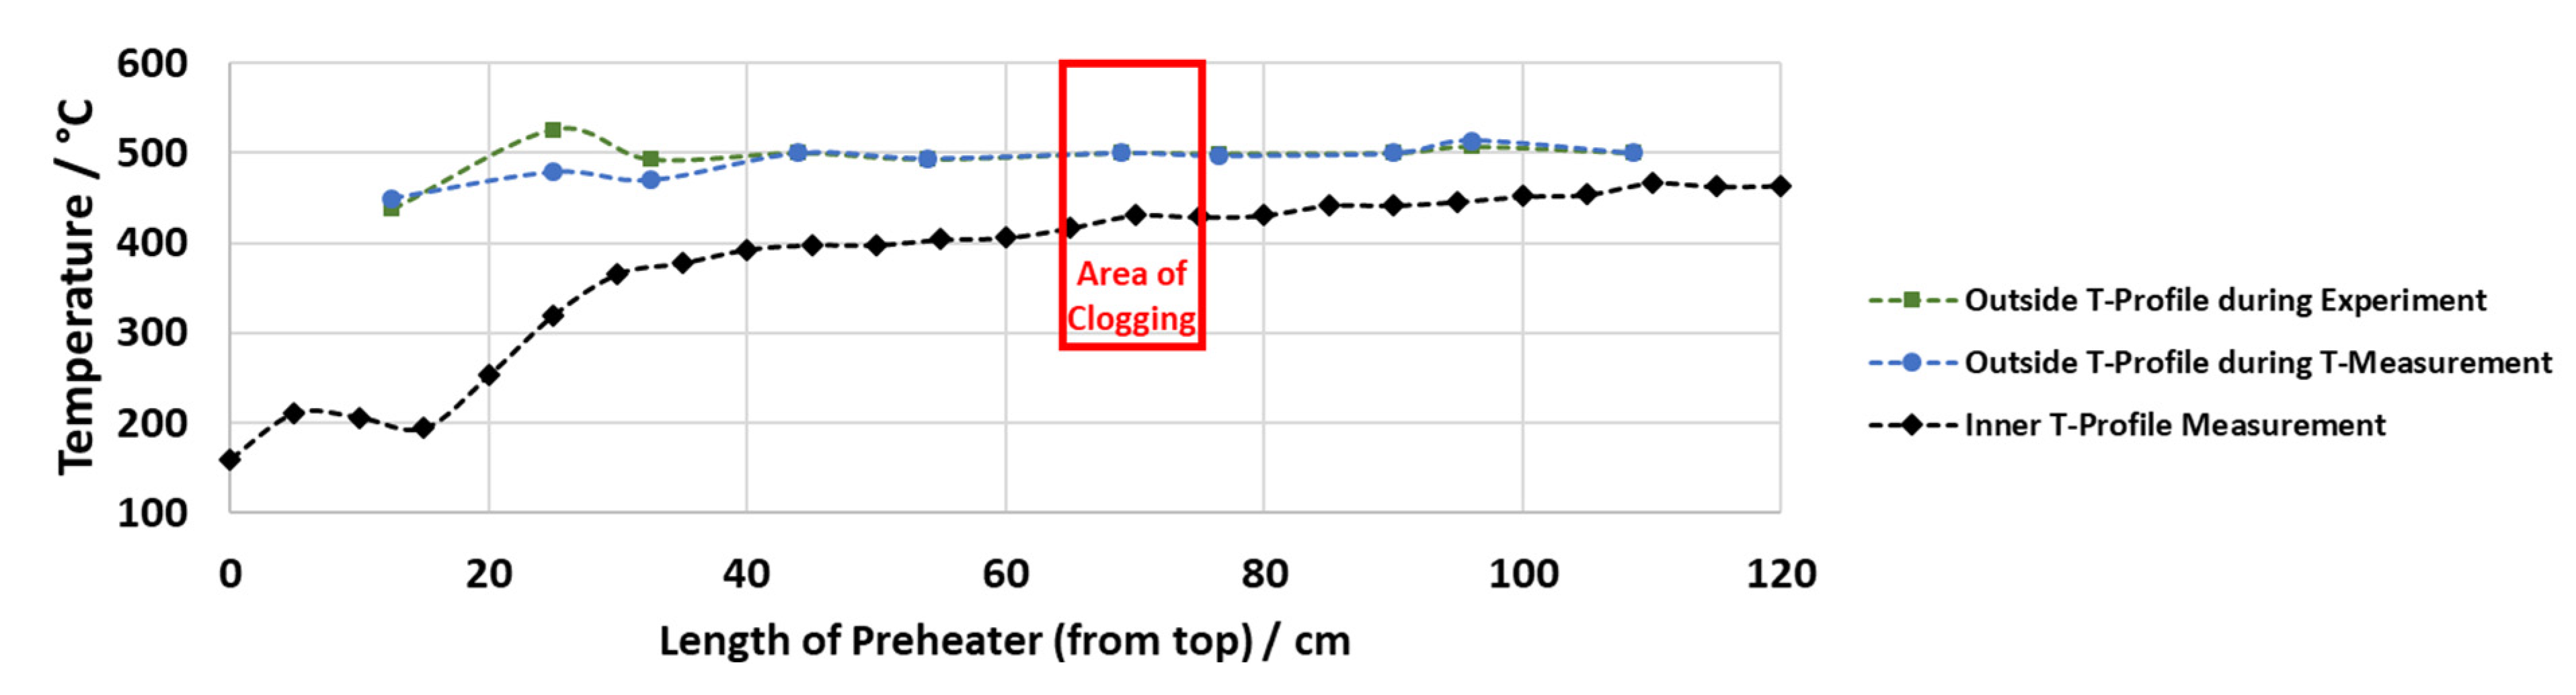
The temperature measurements of the preheater show that the outer pipe temperature profile is (almost) the same during the real experiment and during the temperature measurements with water. They display that the inner temperature is up to 100 °C colder than the set temperature on the outside of the preheater in parts where an outside temperature of 500 °C is reached (see Figure 5). Long zones of set outside temperatures of 500 °C are necessary to reach an inner temperature of more than 400 °C. When comparing the measured inner temperature profile and the locations of solid formation for experiments 7, 8 and 9, the temperature range of solid formation lies between 400 and 440 °C in all cases, while the outside temperature is set at 500 °C.
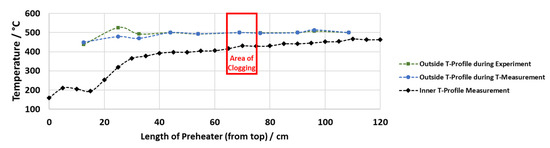
Figure 5.
Outside and inside temperature profile, representative for experiment 7.
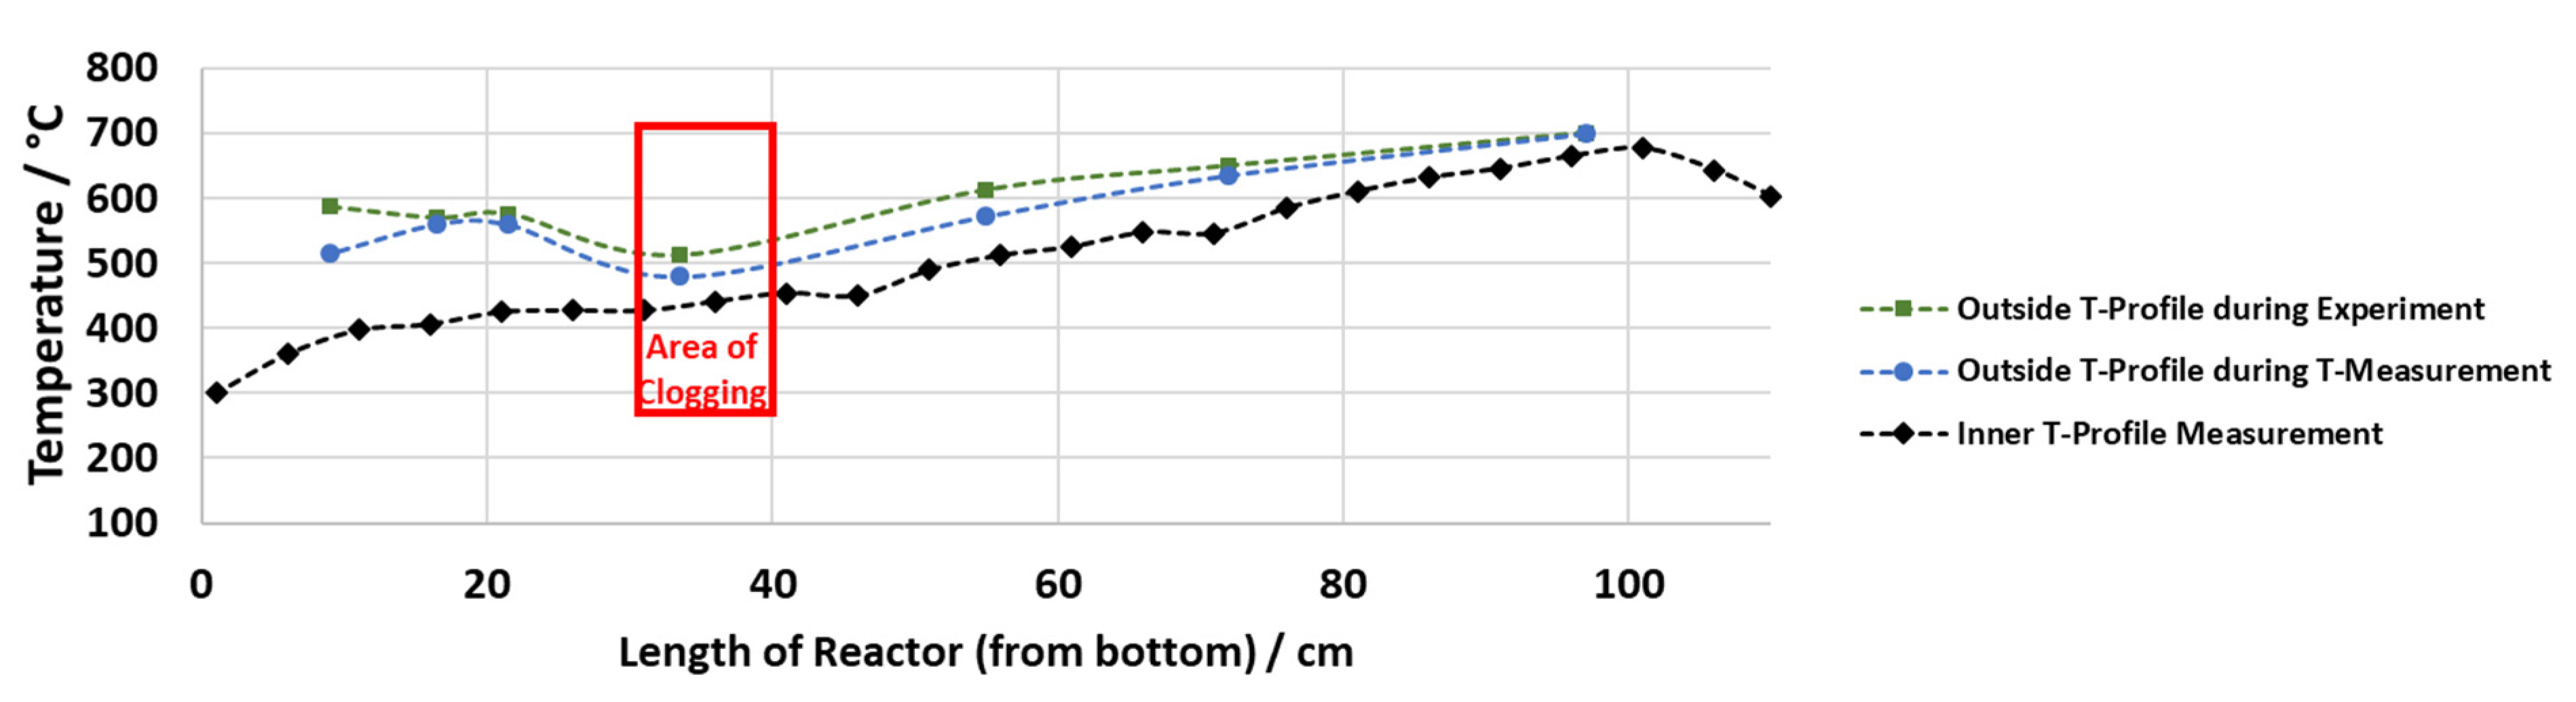
The inside measurements of Reactor 1 reinforce the knowledge gained from the measurements in the preheater (see Figure 6). When the maximum preheating temperature was set to 400 °C in the case of the SS316 liner and to 500 °C in case of the titanium liner, the crucial temperature range of 400 to 440 °C is not reached within the preheater. Subsequently, this temperature range is first reached in Reactor 1 (where the outside temperature is set to 600 °C) as shown by the inside measurement conducted under the set temperatures of experiment 11 and 12. In this case, the solids also formed in a place where 400 to 430 °C were reached.

Figure 6.
Outside and inside temperature profile, representative for experiment 11.
In the preheater and as well in Reactor 1, the solid deposits occurred in the same temperature range. In this temperature range, salts precipitate and coke seems to form. It is well known that salts precipitate at temperatures above 374 °C [19,22]. The ability to separate salts by precipitation depends on the kind of salt. In binary salt–water systems, salts are divided into type 1 and type 2 salts [21,33,34]. Type 1 salts dissolve in dense supercritical water and only precipitate when the temperature is further increased (e.g., KHCO3 [33]), while type 2 salts are poorly soluble in supercritical water (e.g., Na2SO4 [40]). Thus, in the crucial temperature range of 400 to 440 °C, type 2 salts precipitate but the solubility of type 1 salts also decreases significantly. Due to the addition of KHCO3 as a catalyst in large quantities, this salt is the predominant one present in the system. In a KHCO3–water mixture, Schubert found that a significant amount of potassium can be separated at a salt separation set point of 470 °C, which equals a fluid temperature of about 410 °C in their system [33]. This temperature fits in the interval determined in the present study. In the present case, the precipitation of salts is wanted in the preheater in order to separate them into the salt concentrate. The salts would need to be transported to the salt concentrate by the drag of the water flow, which they are not in the present experiments. Rather, they deposit on the reactor walls. This is also the case when the flow speed is increased through a smaller inner diameter, as shown in experiment 13 with the titanium liner. In the titanium liner, the Reynolds (Re) number (calculated based on properties of water taken from IAPWS-IF97 data base) is greater than 3000, and thus, the flow can be assumed to be turbulent, while in the SS316 liner, the flow is either laminar (Re < 2300) or in the transition between laminar and turbulent (2300 < Re < 3000) (see Table 4). The state of the flow thus does not seem to influence the transportation of the solids. A possible reason for this is that the reactor wall is the hottest point in the system as the reactors are heated from the outside, so there, the solubility of the salts is the lowest and they deposit there. A different heating concept could be implemented in order to avoid this if the present salt separation technique is kept.
Table 4.
Flow velocities and Re numbers for different temperatures in the preheater.
In addition to the salt precipitation, coke formation was observed in the present experiments and in the experiments conducted in the past by the authors [4,25]. A possible explanation for this can be found when looking at the hydrothermal liquefaction (HTL) of biomass. HTL usually is conducted at temperatures lower than 370 °C and elevated pressures of up to 250 bar [41]. The optimal temperature range of HTL for the maximum oil yield depends on the type of biomass, but in general, 275 to 350 °C seems to be optimal [42,43,44,45]. At lower temperatures, the biomass is not fully converted, whereas at higher temperatures, the formation of coke is increased due to repolymerization [46]. The optimal residence time also depends on the type of biomass, but in general, too long residence times increase the coke and gas yield due to repolymerization and cracking [46,47,48,49]. The residence time in the preheater is about 6 s with the titanium liner and about 29 to 37 s for the SS316 liner in the conducted experiments (depending on the temperature profile). Generally, HTL is conducted in multiple minutes rather than seconds [50,51,52,53], but in some cases, residence times as short as 1 or 1.4 min were sufficient to liquefy biomass [54,55]. The residence time in the present experiments under normal operation is too short to explain the coke formation. Assumedly, the coke formation thus might appear after salts precipitate, and thus, obstacles in the flow regime are formed at which biomass particles can get stuck. In this case, the residence time in the preheater is significantly prolonged for these particles. Additionally, once the system is blocked, no flow is possible anymore. Even without active heating, it takes several minutes to hours for the temperature to fall below the HTL temperature range due to the installed insulation leading to increased coke formation. Salt separation thus is the main issue that needs to be resolved.
As there is no sign of deposits outside this temperature window that could cause a blockage of the flow, a SCWG configuration should be developed that applies rapid heating of the biomass slurry to temperatures above the determined 400 to 440 °C, possibly without the pipe being the local hotspot. This might overcome the issue of salt depositions due to slow external heating, as it is the case in the present study.
3.2. Influence of Flow Direction on the Separation of Solids
In Configuration 1, only one gasification reactor was used (1800 mm long) (see Figure 1) [4,25]. For Configuration 2, additionally to the redesigned preheater/salt separation, a second reactor was installed to increase the residence time in the temperature range of T > 600 °C. The residence time increased from 17 [25] to 51 s. With this measure, the residence time was increased without changing further parameters. A reduction in the flow rate, for example, would also increase the residence time but also influence temperature profiles and the flow regime [25].
It is well known from the literature that an increase in residence time increases the gasification efficiency since the splitting of biomass towards gases can further proceed [56,57,58]. Compared to Configuration 1 [25], the gasification efficiency increased by roughly 7%, from 59 to 66% (experiment 3 and 9) (see Table 5). The literature shows that this increase in residence time is by far not sufficient to reach a full conversion of the biomass. D’Jesus et al. showed that residence times above 2 min are necessary in order to gasify 5 wt.% corn silage completely at T = 650 °C [8]. When comparing the present results with the results achieved by D’Jesus et al. [8], the gasification efficiency is in the same magnitude. Thus, in the present case, the residence time needs to increase further to achieve complete gasification, and the issues described in Section 3.1 need to be resolved.
Table 5.
CE and TOC conversion of conducted experiments with a flow rate of 700 g h−1.
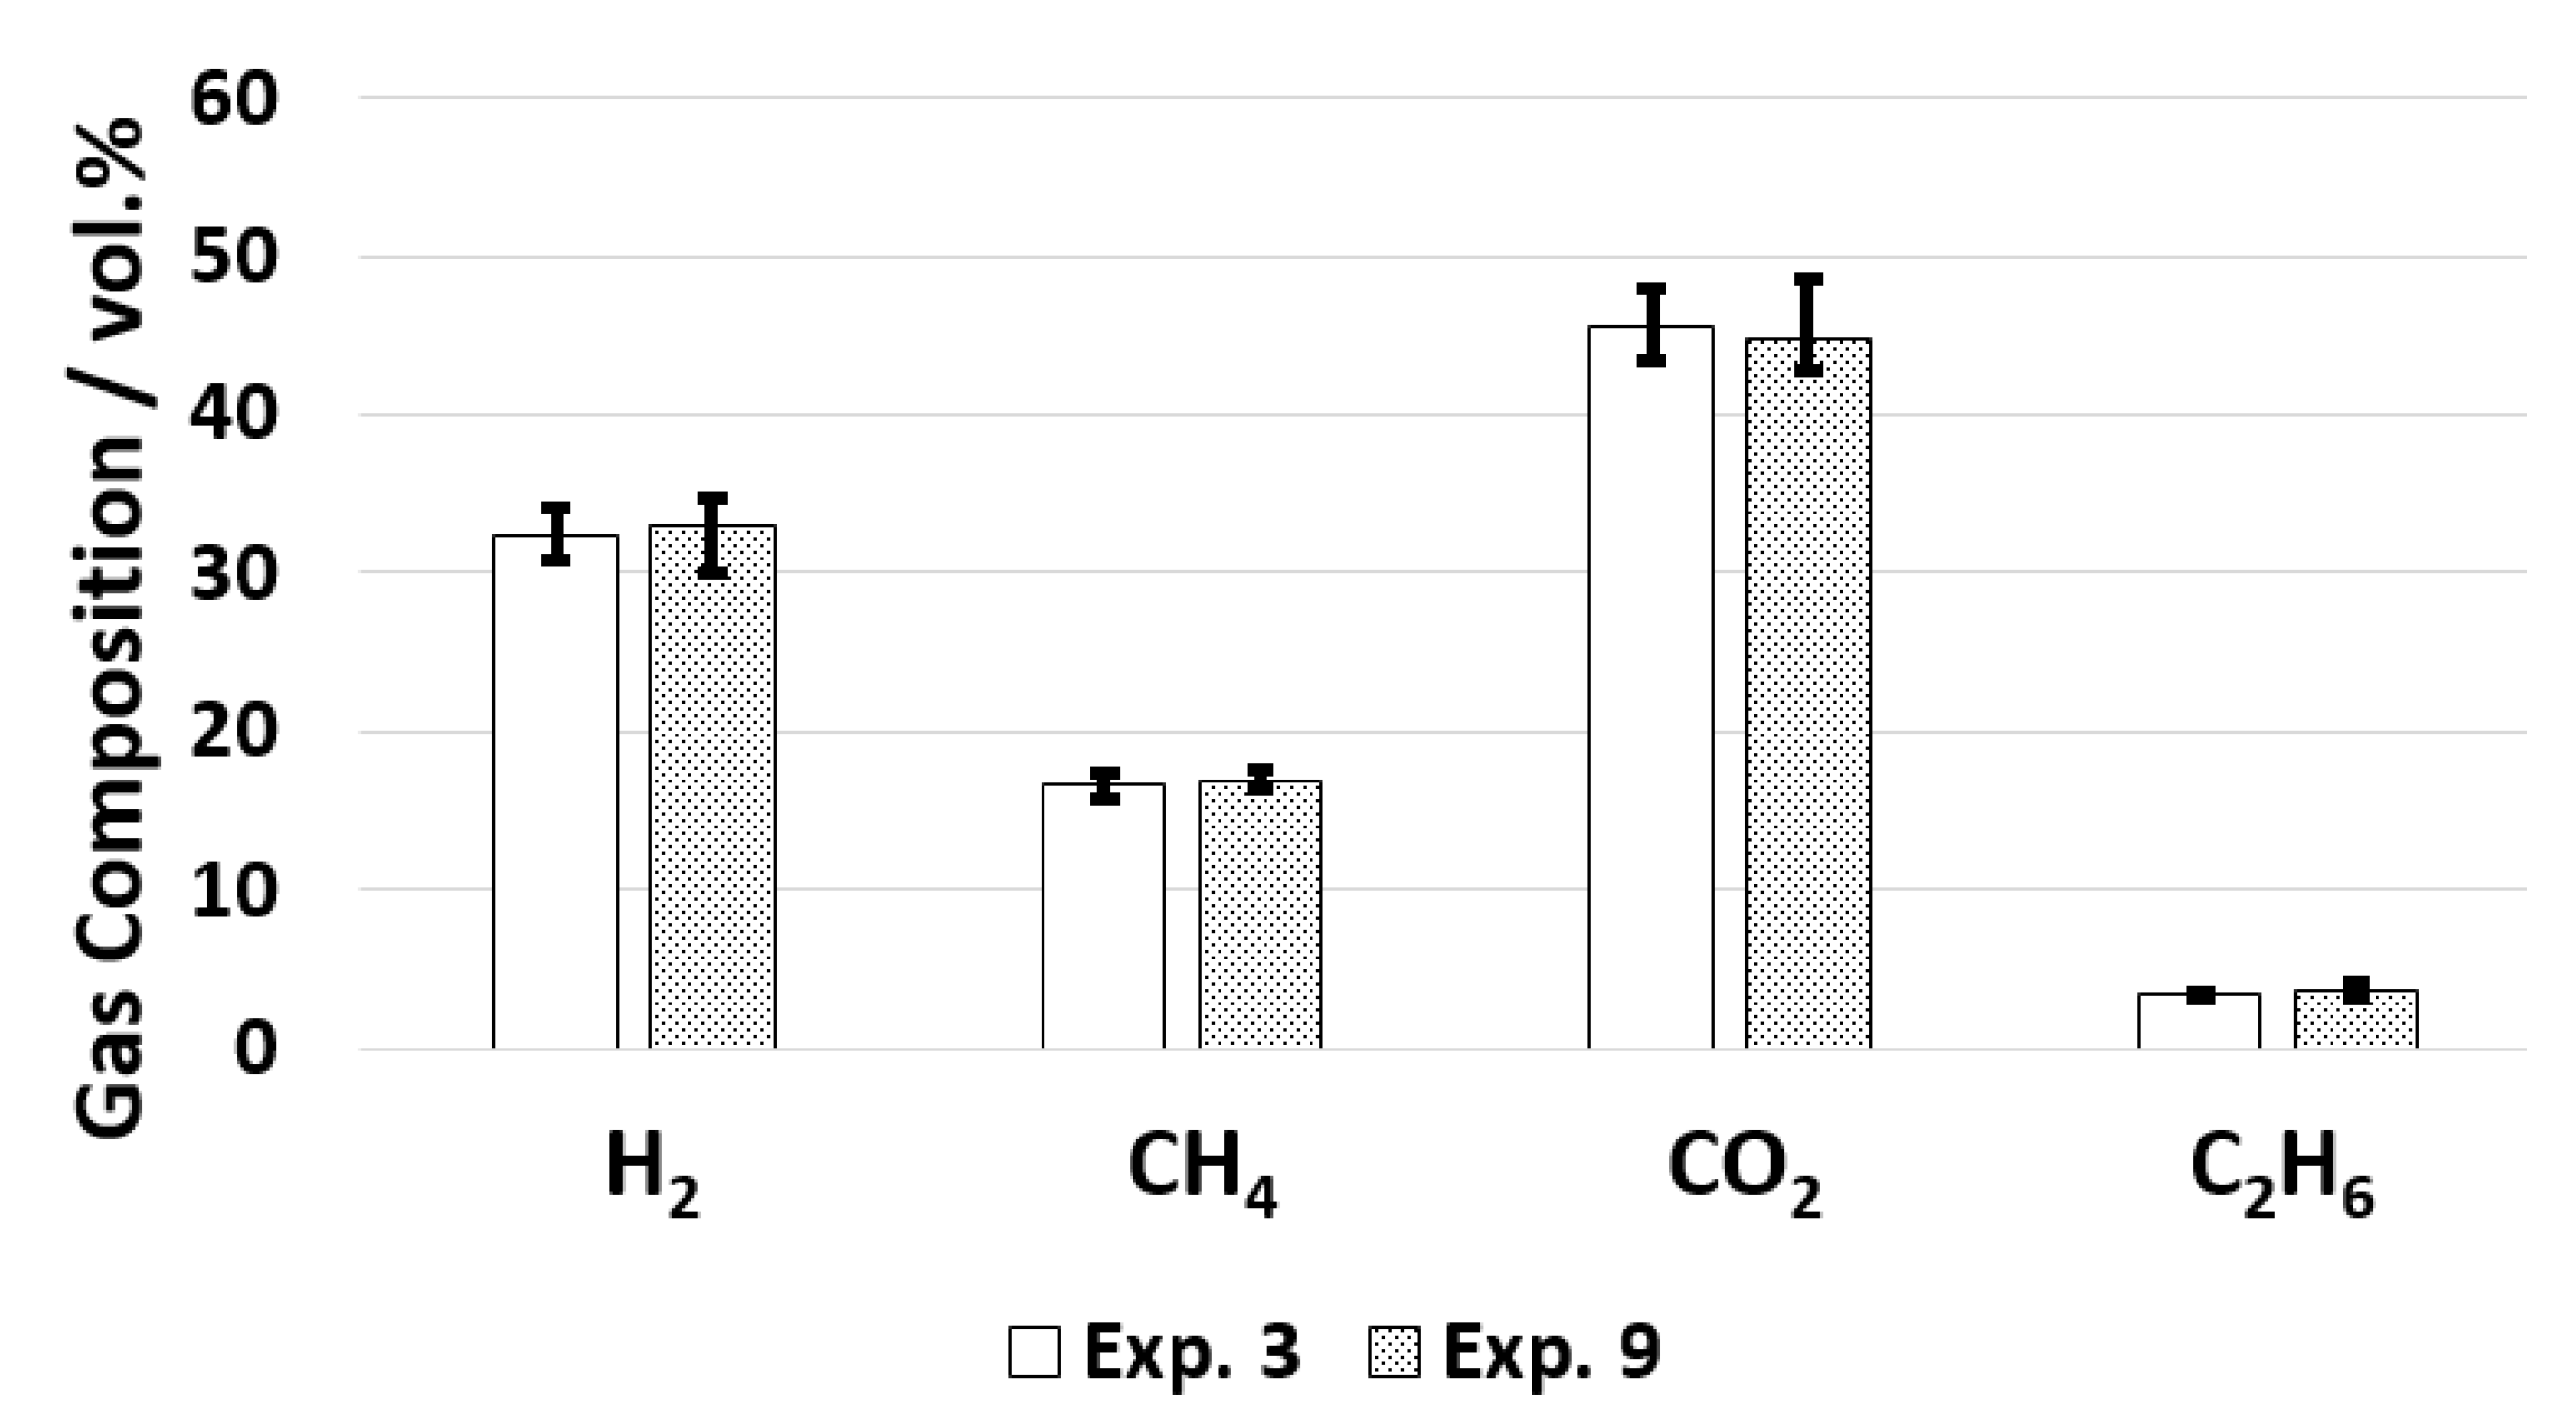
The increase in residence time did not influence the gas composition, as can be seen in Figure 7.

Figure 7.
Gas composition for old and new configuration.
The implementation of the new reactor (Reactor 1) resulted in new obstacles. When plugging in the gasification reactors occurred, it occurred after less than 2.5 h (experiments 11 and 12). In Configuration 1, operation of up to 6.5 h could be achieved before the plugging of the reactor [4,25]. The reason for this seems to be the flow direction in the reactors. In Configuration 1, the reactor is a downflow reactor, and the newly implemented reactor (Reactor 1) in Configuration 2 is an up-flow reactor. The flow direction is important for transporting deposits to the outlet of the system (reactor effluent) to avoid plugging. In the downflow reactor, the gravity and the flow direction result in a force in the same direction, while in the up-flow reactor, they act as opposite forces. Thus, in the up-flow reactor, the deposits (especially the precipitating salts) are not as easily transported with the flow and thus blocking occurs quicker.
An indicator for this is the potassium concentration in the reactor effluent during experiments with only Reactor 2 and with two reactors installed. During operation with only Reactor 2, 1090 to 2180 ppm K+ is detected in the effluent, and during operation with two reactors, on average, only 465 ppm K+ is detected (see Table 6). A reduced number of salts in the effluent is wanted if the salts instead are accumulated in the salt concentrate. But since salt separation was not improved with the newly implemented salt separation system (see Figure 8), the difference in potassium stays in the system as solid deposits which can be seen by the increase in potassium in the rinse water. During cooling of the plant, potassium is soluble again and is washed out of the system. To reach a certain amount of solid deposits, it thus takes less time which leads to quicker plugging. Reactor 1 also needs to be constructed as a downflow reactor to increase the operation time if the salt separation is not sufficient. In the case of complete salt removal before the gasification reactors, the flow direction in the reactors should not influence the process.
Table 6.
Potassium concentration in the reactor effluent.
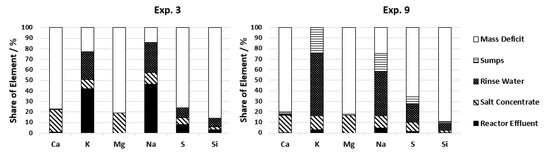
Figure 8.
Distribution of salt building elements for two configurations.
The described issues that result in the short duration of experiments are mainly due to chemical and physical effects (coking and salt precipitation) in the temperature range of 400 to 440 °C. Thus, resolving the heating problem and with that also the issue of salt separation should enable long-term operation. In the current lab plant with the chosen throughput, the residence time is very low (D’Jesus found that residence times well above 2 min are necessary to gasify 5 wt.% corn silage at T = 650 °C completely [8]), but still sufficient for some organics. This becomes clear when gasifying ethanol solutions (up to 72 wt.% ethanol), with no salts in it [59]. Long-time operation with CE = 100% was achieved by Dutzi et al. [59]. RCG obviously requires a higher residence time, as seen in the currently achieved CE.
4. Conclusions
The salt precipitation during the supercritical water gasification of biomass was investigated in a continuous SCWG lab plant. By inner temperature measurements in a complex setup, it was discovered that the temperature range in which salts mainly precipitate is 400 to 440 °C. In order to reach the reaction temperature of 650 °C, this temperature window needs to be passed. This could be used to separate the salts from the reaction mixture. However, since the salt separation installed, which is supposed to remove the precipitating salts by gravity, was not able to separate the salts in the current setup, blockage of the flow in the reactors occurred. Additionally, the influence of flow direction in the lab plant on the duration of operation was investigated. The tendency to block the flow by precipitation is strongly influenced by removing the salts by gravity and drag of the flow. It was thus found that the direction of flow is an important factor to consider during salt separation. The importance of the understanding of chemical and physical effects during the heating of biomass slurries in the process of supercritical water gasification was demonstrated. Future optimization of the heating concept coupled with the positioning of the salt separation device is necessary in order to enable long-time operation of SCWG with salt containing biomasses. If the present concept of salt separation proves to be insufficient in the future, other salt separation options like cyclones could be considered.
Author Contributions
Conceptualization, J.D. and N.B.; methodology, N.B.; validation, J.D., N.B. and J.S.; formal analysis, J.D.; investigation, J.D.; resources, N.B.; data curation, J.D.; writing—original draft preparation, J.D.; writing—review and editing, N.B. and J.S.; visualization, J.D.; supervision, J.S.; funding acquisition, N.B. All authors have read and agreed to the published version of the manuscript.
Funding
This research work was funded by the H2020 EU-Project CERESiS (Grant-Agreement-Nr.: 101006717).
Data Availability Statement
Data available on request.
Acknowledgments
The authors would like to thank E. Hauer for the contributions to the experimental work and K. Weiss, responsible for most of the mechanical work, for his contributions. Special thanks to the University of Strathclyde for providing the biomass. The authors would like to thank D. Katsourinis and A. Rentizelas for the coordination of the H2020-project CERESiS. We also acknowledge support from the KIT-Publication Fund of the Karlsruhe Institute of Technology.
Conflicts of Interest
The authors declare no conflicts of interest.
References
- Kruse, A.; Dinjus, E. Hot compressed water as reaction medium and reactant. Properties and synthesis reactions. J. Supercrit. Fluids 2007, 39, 362–380. [Google Scholar] [CrossRef]
- Kaltschmitt, M.; Hartmann, H.; Hofbauer, H. Energie aus Biomasse, 2nd ed.; Springer: Berlin/Heidelberg, Germany, 2009. [Google Scholar] [CrossRef]
- Wang, S.; Xu, D.; Guo, Y.; Tang, X.; Wang, Y.; Zhang, J.; Ma, H.; Qian, L.; Li, Y. Supercritical Water Processing Technologies for Environment, Energy and Nanomaterial Applications; Springer: Singapore, 2020. [Google Scholar] [CrossRef]
- Dutzi, J.; Boukis, N.; Sauer, J. Process Effluent Recycling in the Supercritical Water Gasification of Dry Biomass. Processes 2023, 11, 797. [Google Scholar] [CrossRef]
- Muangrat, R.; Onwudili, J.A.; Williams, P.T. Alkali-promoted hydrothermal gasification of biomass food processing waste: A parametric study. Int. J. Hydrogen Energy 2010, 35, 7405–7415. [Google Scholar] [CrossRef]
- Onwudili, J.A.; Lea-Langton, A.R.; Ross, A.B.; Williams, P.T. Catalytic hydrothermal gasification of algae for hydrogen production: Composition of reaction products and potential for nutrient recycling. Bioresour. Technol. 2013, 127, 72–80. [Google Scholar] [CrossRef]
- Gong, M.; Zhu, W.; Xu, Z.R.; Zhang, H.W.; Yang, H.P. Influence of sludge properties on the direct gasification of dewatered sewage sludge in supercritical water. Renew. Energy 2014, 66, 605–611. [Google Scholar] [CrossRef]
- D’Jesús, P.; Boukis, N.; Kraushaar-Czarnetzki, B.; Dinjus, E. Influence of process variables on gasification of corn silage in supercritical water. Ind. Eng. Chem. Res. 2006, 45, 1622–1630. [Google Scholar] [CrossRef]
- Chen, G.; Andries, J.; Luo, Z.; Spliethoff, H. Biomass pyrolysis/gasification for product gas production: The overall investigation of parametric effects. Energy Convers. Manag. 2003, 44, 1875–1884. [Google Scholar] [CrossRef]
- Nanda, S.; Reddy, S.N.; Hunter, H.N.; Dalai, A.K.; Kozinski, J.A. Supercritical water gasification of fructose as a model compound for waste fruits and vegetables. J. Supercrit. Fluids 2015, 104, 112–121. [Google Scholar] [CrossRef]
- D’Jesús, P. Die Vergasung von Realer Biomasse in Überkritischem Wasser. Ph.D. Thesis, Universität Karlsruhe, Karlsruhe, Germany, 2007. [Google Scholar]
- Gadhe, J.B.; Gupta, R.B. Hydrogen production by methanol reforming in supercritical water: Suppression of methane formation. Ind. Eng. Chem. Res. 2005, 44, 4577–4585. [Google Scholar] [CrossRef]
- Savage, P.E. A perspective on catalysis in sub- and supercritical water. J. Supercrit. Fluids 2009, 47, 407–414. [Google Scholar] [CrossRef]
- Boukis, N.; Stoll, I.K. Gasification of biomass in supercritical water, challenges for the process design—Lessons learned from the operation experience of the first dedicated pilot plant. Processes 2021, 9, 455. [Google Scholar] [CrossRef]
- Kruse, A. Supercritical water gasification. Biofuels Bioprod. Biorefining 2008, 2, 415–437. [Google Scholar] [CrossRef]
- Kruse, A. Hydrothermal biomass gasification. J. Supercrit. Fluids 2009, 47, 391–399. [Google Scholar] [CrossRef]
- Gutiérrez Ortiz, F.J. Biofuel production from supercritical water gasification of sustainable biomass. Energy Convers. Manag. X 2022, 14, 100164. [Google Scholar] [CrossRef]
- Yakaboylu, O.; Harinck, J.; Smit, K.G.; de Jong, W. Supercritical water gasification of biomass: A literature and technology overview. Energies 2015, 8, 859–894. [Google Scholar] [CrossRef]
- Hodes, M.; Marrone, P.A.; Hong, G.T.; Smith, K.A.; Tester, J.W. Salt precipitation and scale control in supercritical water oxidation—Part A: Fundamentals and research. J. Supercrit. Fluids 2004, 29, 265–288. [Google Scholar] [CrossRef]
- Boukis, N.; Hauer, E.; Habicht, W. Corrosion Behaviour of Ni-Base Alloys in Supercritical Water Containing Alkali Chlorides. In Proceedings of the EUROCORR 2013, Estoril, Portugal, 1–5 September 2013. [Google Scholar]
- Schubert, M.; Regler, J.W.; Vogel, F. Continuous salt precipitation and separation from supercritical water. Part 1: Type 1 salts. J. Supercrit. Fluids 2010, 52, 99–112. [Google Scholar] [CrossRef]
- Armellini, F.J. Phase Equilibria and Precipitation Phenomena of Sodium Chloride and Sodium. Ph.D. Thesis, Massachusetts Institute of Technology, Cambridge, MA, USA, 1993. [Google Scholar]
- Castello, D. Supercritical Water Gasification of Biomass. Ph.D. Thesis, University of Trento, Trento, Italy, 2013. [Google Scholar]
- Jin, H.; Chen, Y.; Ge, Z.; Liu, S.; Ren, C.; Guo, L. Hydrogen production by Zhundong coal gasification in supercritical water. Int. J. Hydrogen Energy 2015, 40, 16096–16103. [Google Scholar] [CrossRef]
- Dutzi, J.; Boukis, N.; Sauer, J. Supercritical water gasification of heavy metal contaminated plants with focus on separation of heavy metal contaminants. Biomass Bioenergy 2024, 182, 107059. [Google Scholar] [CrossRef]
- Chuntanapum, A.; Matsumura, Y. Char formation mechanism in supercritical water gasification process: A study of model compounds. Ind. Eng. Chem. Res. 2010, 49, 4055–4062. [Google Scholar] [CrossRef]
- Reddy, S.N.; Nanda, S.; Dalai, A.K.; Kozinski, J.A. Supercritical water gasification of biomass for hydrogen production. Int. J. Hydrogen Energy 2014, 39, 6912–6926. [Google Scholar] [CrossRef]
- Karayıldırım, T.; Sınağ, A.; Kruse, A. Char and Coke Formation as Unwanted Side Reaction of the Hydrothermal Biomass Gasification. Chem. Eng. Technol. 2008, 31, 1561–1568. [Google Scholar] [CrossRef]
- Yong, T.L.-K.; Matsumura, Y. Reaction Kinetics of the Lignin Conversion in Supercritical Water. Ind. Eng. Chem. Res. 2012, 51, 11975–11988. [Google Scholar] [CrossRef]
- Kruse, A.; Faquir, M. Hydrothermal Biomass Gasification—Effects of Salts, Backmixing and Their Interaction. Chem. Eng. Technol. 2007, 30, 749–754. [Google Scholar] [CrossRef]
- Matsumura, Y.; Harada, M.; Nagata, K.; Kikuchi, Y. Effect of heating rate of biomass feedstock on carbon gasification efficiency in supercritical water gasification. Chem. Eng. Commun. 2006, 193, 649–659. [Google Scholar] [CrossRef]
- Sınag, A.; Kruse, A.; Rathert, J. Influence of the Heating Rate and the Type of Catalyst on the Formation of Key Intermediates and on the Generation of Gases during Hydropyrolysis of Glucose in Supercritical Water in a Batch Reactor. Ind. Eng. Chem. Res. 2004, 43, 502–508. [Google Scholar] [CrossRef]
- Schubert, M. Catalytic Hydrothermal Gasification of Biomass Salt Recovery and Continuous Gasification of Glycerol Solutions. Ph.D. Thesis, ETH Zürich, Zürich, Switzerland, 2010. [Google Scholar] [CrossRef]
- Valyashko, V.M. Phase behavior in binary and ternary water-salt systems at high temperatures and pressures. Pure Appl. Chem. 1997, 69, 2271–2280. [Google Scholar] [CrossRef]
- Dutzi, J.; Stoll, I.K.; Boukis, N.; Sauer, J. Screening of ten different plants in the process of supercritical water gasification. Sustain. Chem. Environ. 2024, 5, 100062. [Google Scholar] [CrossRef]
- D’Jesús, P.; Artiel, C.; Boukis, N.; Kraushaar-Czarnetzki, B.; Dinjus, E. Influence of Educt Preparation on Gasification of Corn Silage in Supercritical Water. Ind. Eng. Chem. Res. 2005, 44, 9071–9077. [Google Scholar] [CrossRef]
- Nanda, S.; Dalai, A.K.; Kozinski, J.A. Supercritical water gasification of timothy grass as an energy crop in the presence of alkali carbonate and hydroxide catalysts. Biomass Bioenergy 2016, 95, 378–387. [Google Scholar] [CrossRef]
- Yan, Z.; Tan, X. Hydrogen generation from oily wastewater via supercritical water gasification (SCWG). J. Ind. Eng. Chem. 2015, 23, 44–49. [Google Scholar] [CrossRef]
- Rostrup-Nielsen, J.; Trimm, D.L. Mechanisms of Carbon Formation on Nickel-Containing Catalysts. J. Catal. 1977, 48, 155–165. [Google Scholar] [CrossRef]
- Weingärtner, H.; Franck, E.U. Überkritisches Wasser als Lösungsmittel. Angew. Chem. 2005, 117, 2730–2752. [Google Scholar] [CrossRef]
- Toor, S.S. Modelling and Optimization of Catliq® Liquid Biofuel Process. Ph.D. Thesis, Aalborg University, Aalborg, Denmark, 2010. [Google Scholar]
- Zhu, Z.; Rosendahl, L.; Toor, S.S.; Yu, D.; Chen, G. Hydrothermal liquefaction of barley straw to bio-crude oil: Effects of reaction temperature and aqueous phase recirculation. Appl. Energy 2015, 137, 183–192. [Google Scholar] [CrossRef]
- Minowa, T.; Zhen, F.; Ogi, T. Cellulose decomposition in hot-compressed water with alkali or nickel catalyst. J. Supercrit. Fluids 1998, 13, 253–259. [Google Scholar] [CrossRef]
- Arturi, K.R.; Strandgaard, M.; Nielsen, R.P.; Søgaard, E.G.; Maschietti, M. Hydrothermal liquefaction of lignin in near-critical water in a new batch reactor: Influence of phenol and temperature. J. Supercrit. Fluids 2017, 123, 28–39. [Google Scholar] [CrossRef]
- Nguyen, T.D.H.; Maschietti, M.; Åmand, L.-E.; Vamling, L.; Olausson, L.; Andersson, S.-I.; Theliander, H. The effect of temperature on the catalytic conversion of Kraft lignin using near-critical water. Bioresour. Technol. 2014, 170, 196–203. [Google Scholar] [CrossRef]
- Mathanker, A.; Das, S.; Pudasainee, D.; Khan, M.; Kumar, A.; Gupta, R. A Review of Hydrothermal Liquefaction of Biomass for Biofuels Production with a Special Focus on the Effect of Process Parameters, Co-Solvents, and Extraction Solvents. Energies 2021, 14, 4916. [Google Scholar] [CrossRef]
- Ogi, T.; Yokoyama, S.; Koguchi, K. Direct liquefaction of wood by catalyst. Part 1. Effects of pressure, temperature, holding time and wood/catalyst/water ratio on oil yield. J. Jpn. Pet. Inst. 1985, 28, 239–245. [Google Scholar] [CrossRef]
- Qu, Y.; Wei, X.; Zhong, C. Experimental study on the direct liquefaction of Cunninghamia lanceolata in water. Energy 2003, 28, 597–606. [Google Scholar] [CrossRef]
- Yang, L.; Nazari, L.; Yuan, Z.; Corscadden, K.; Xu, C.C. Hydrothermal liquefaction of spent coffee grounds in water medium for bio-oil production. Biomass Bioenergy 2016, 86, 191–198. [Google Scholar] [CrossRef]
- Akhtar, J.; Kuang, S.K.; Amin, N.S. Liquefaction of empty palm fruit bunch (EPFB) in alkaline hot compressed water. Renew. Energy 2010, 35, 1220–1227. [Google Scholar] [CrossRef]
- Alper, K.; Tekin, K.; Karagöz, S. Hydrothermal Liquefaction of Lignocellulosic Biomass Using Potassium Fluoride-Doped Alumina. Energy Fuels 2019, 33, 3248–3256. [Google Scholar] [CrossRef]
- Bach, Q.-V.; Sillero, M.V.; Tran, K.-Q.; Skjermo, J. Fast hydrothermal liquefaction of a Norwegian macro-alga: Screening tests. Algal Res. 2014, 6, 271–276. [Google Scholar] [CrossRef]
- Castello, D.; Pedersen, T.; Rosendahl, L. Continuous Hydrothermal Liquefaction of Biomass: A Critical Review. Energies 2018, 11, 3165. [Google Scholar] [CrossRef]
- Hammerschmidt, A.; Boukis, N.; Galla, U.; Dinjus, E.; Hitzmann, B. Conversion of yeast by hydrothermal treatment under reducing conditions. Fuel 2011, 90, 3424–3432. [Google Scholar] [CrossRef]
- Biller, P.; Sharma, B.K.; Kunwar, B.; Ross, A.B. Hydroprocessing of bio-crude from continuous hydrothermal liquefaction of microalgae. Fuel 2015, 159, 197–205. [Google Scholar] [CrossRef]
- Susanti, R.F.; Veriansyah, B.; Kim, J.D.; Kim, J.; Lee, Y.W. Continuous supercritical water gasification of isooctane: A promising reactor design. Int. J. Hydrogen Energy 2010, 35, 1957–1970. [Google Scholar] [CrossRef]
- Yakaboylu, O.; Albrecht, I.; Harinck, J.; Smit, K.G.; Tsalidis, G.-A.; Di Marcello, M.; Anastasakis, K.; de Jong, W. Supercritical water gasification of biomass in fluidized bed: First results and experiences obtained from TU Delft/Gensos semi-pilot scale setup. Biomass Bioenergy 2018, 111, 330–342. [Google Scholar] [CrossRef]
- Lu, Y.J.; Guo, L.J.; Ji, C.M.; Zhang, X.M.; Hao, X.H.; Yan, Q.H. Hydrogen production by biomass gasification in supercritical water: A parametric study. Int. J. Hydrogen Energy 2006, 31, 822–831. [Google Scholar] [CrossRef]
- Dutzi, J.; Vadarlis, A.A.; Boukis, N.; Sauer, J. Comparison of Experimental Results with Thermodynamic Equilibrium Simulations of Supercritical Water Gasification of Concentrated Ethanol Solutions with Focus on Water Splitting. Ind. Eng. Chem. Res. 2023, 62, 12501–12512. [Google Scholar] [CrossRef]

Disclaimer/Publisher’s Note: The statements, opinions and data contained in all publications are solely those of the individual author(s) and contributor(s) and not of MDPI and/or the editor(s). MDPI and/or the editor(s) disclaim responsibility for any injury to people or property resulting from any ideas, methods, instructions or products referred to in the content. |
© 2024 by the authors. Licensee MDPI, Basel, Switzerland. This article is an open access article distributed under the terms and conditions of the Creative Commons Attribution (CC BY) license (https://creativecommons.org/licenses/by/4.0/).