Article

Discovery of Natural Compound-Based Lead Molecule against Acetyltransferase Type 1 Bacterial Enzyme from Morganella morgani Using Machine Learning-Enabled Molecular Dynamics Simulation

1
College of Computer Science and Engineering, University of Ha’il, P.O. Box 2440, Hail 81411, Saudi Arabia
2
College of Computing and Informatics, Saudi Electronic University (SEU), Madinah 41538-53307, Saudi Arabia
*
Author to whom correspondence should be addressed.
Processes 2024, 12(6), 1047; https://doi.org/10.3390/pr12061047
Submission received: 23 April 2024 / Revised: 13 May 2024 / Accepted: 19 May 2024 / Published: 21 May 2024

Abstract

:
Drug-resistant Morganella morganii, a rod-shaped, Gram-negative, facultatively anaerobic bacillus belonging to the Enterobacteriaceae family, is a growing worldwide health concern due to its association with high morbidity and mortality rates. Recent advancements in machine learning, particularly Alphafold 2’s protein structure prediction using local physics and pattern recognition, have aided research efforts. This study focuses on the enzymatic activity of aminoglycoside N6′-acetyltransferase (aacA7), a critical transferase enzyme in bacteria that confers resistance to aminoglycosides. AacA7 modifies aminoglycoside molecules by catalyzing the acetylation of their 6′-amino group using acetyl-CoA, rendering antibiotics like kanamycin, neomycin, tobramycin, and amikacin inactive. We propose that Doripenem and OncoglabrinolC can interact with aacA7, potentially modifying its enzymatic activity. Molecular docking analysis of aacA7 with 22 drug targets revealed OncoglabrinolC as the most promising candidate, exhibiting a binding energy of −12.82 kcal/mol. These two top candidates, OncoglabrinolC and Doripenem, were then subjected to 100 ns of molecular dynamic simulations to assess their dynamic conformational features. Furthermore, the PredictSNP consensus classifier was used to predict the impact of mutations on aacA7 protein functionality. The study also investigated the interaction of wild-type and mutant aacA7 proteins with both Doripenem and OncoglabrinolC. These findings provide valuable insights into the binding behavior of OncoglabrinolC and Doripenem as potential lead molecules for repurposing against aacA7, potentially reducing the pathogenicity of Morganella morganii.

1. Introduction

Morganella morganii (Proteus morganii), a rod-shaped, Gram-negative, and elective anaerobic bacillus, falls in the community Proteeae of the Enterobacteriaceae family. It is divided into two sub-species, namely, morganii, and sibonii [1,2,3]. The morganii species is known to cause mainly post-operative wounds and urinary tract (UT) problems. M. morganii can cause severe infections of diverse tissue in patients of various age groups. Specific clinical M. morganii isolates show confrontation against several antibiotics by carrying numerous resistant genes (such as blaNDM-1, and qnrD1), in this manner imposing a seriously fatal challenge for clinical infection monitoring and control. In addition, the sharp drafting ability of the organism is one of its salient features. Collected data indicate that M. morganii causes infections associated with kidney disease. This deadly pathogen often results in the heavy loss of manpower in some cases [3]. This pathogenic organism cannot be ignored due to increased resistance and acute conditions. Additionally, virulence evolution makes M. morganii a significant non-negligent facultative pathogen. M. morganii causes various fatalistic infections, like sepsis, abscess, chorioamnionitis, purple urine bag syndrome, purpuric allantoic syndrome, and cellulitis [2,3].
Peritoneal infection following pleural empyema cannot be treated as a commonly occurring problem. Peritonitis and concomitant pleural empyema have been reported in immunocompromised patients based on different pathogenic methods and from diverse pathogenic microorganisms [4]. Amini and colleagues [4] reported a case of peritonitis and concomitant pleural empyema with an abnormal microbe in an immuno-competent host. In normal circumstances, M. morganii is considered habitually as intestinal commensal. It is normally found to be the culprit in pyogenic infections and urinary tract infections, but hardly causes CNS problems, specifically a brain abscess. There are fewer available reports of M. morganii as a problematic player in a brain abscess [1]. High chances of the presence of this microbe are crucial infection transfer of posed lead natural compound against was inhibitory all-in cases of brain abscess resulting in otogenic contamination. Patil and group [1] reported an uncommon case of M. morganii, bio-group-A in a brain abscess [1]. The identification of a novel genomic island (MMGI-1) and Tn6835 in an extravagant resilient M. morganii Strain [5], along with most isolates of morganii, were found to be susceptible to amikacin, ceftazidime, and imipenem. Many patients recuperated after getting an antibiotic cure. Almost 15% of patients lost their lives despite the therapy. Gentamicin (a highly frequent drug) was used in the management of infections caused by M. morganii [2], which is also developing resistance day by day. The drug resistance of M. morganii has increased in recent years, and the increased resistance and resulting virulence are mainly introduced via extra genetic and mobile elements. The infections caused by multidrug-resistant (MDR) or even the extensively drug-resistant (XDR) M. morganii often result in their failure during the clinical treatment [3,6,7,8,9]. A six-year study (2006–2011) at Changhua Christian Hospital in Taiwan examined samples from patients exhibiting symptoms of Gram-negative bacterial infections. Out of 82,861 samples, 1219 (1.47%) tested positive for M. morganii, making it the ninth most common cause of clinical infections at the hospital. In total, 17 M. morganii-associated infections have also been reported in other regions, including Japan, the United States, and Spain. However, these cases are often scattered and primarily occur in immunocompromised patients [3].
Aminoglycoside N(6′)-acetyltransferase type 1 (aacA7) protein (commonly found in M.morganii), is encoded by the aacA7 gene [10]. This gene is present in the transposons, integrons, chromosomes, and plasmids of various Gram-negative bacterial species, and is responsible for most amikacin-resistant strains [11]. Other names for this protein are aminoglycoside resistance protein and AAC(6′)-I. One of its subtypes, AAC (6′)-Ib, plays a significant role in combination with enzymatic inhibitors such as the aminoglycoside resistance enzyme [12].
Aminoglycoside N(6′)- acetyltransferase type 1 (aacA7) protein catalyzes the exchange of an acetyl bunch from acetyl-CoA to the 6′- amino gathering aminoglycoside particles, offering protection from anti-infection agents accommodating the active ring (purpurosamine) together with netilmicin and tobramycin, while also being less significant to gentamicin and amikacin [10]. The aacA7 protein is related to the N-acetyltransferase superfamily (GCN5-related) and provides confrontation to many aminoglycosides including amikacin (AMK), tobramycin, and kanamycin (KAN), which are composed of enzymes like histone acetyltransferases GCN5 and Hat1 [13,14].
The aacA7 protein catalyzes the transfer of the acetyl group from acetyl-CoA to the 6′-amino group of aminoglycoside, implying defiance to antibiotic drugs containing the purpurosamine ring. These include netilmicin and tobramycin and, to some extent, gentamicin and amikacin [1,2,3,4,5,10,15]. The protein initially acts by binding to the 30S ribosomal subunit composing the aminoacyl site of 16S ribosomal RNA, thus leading to the inhibition of translocation using the deceptive reading of the genetic code [16]. The initial requirements for peptide synthesis steps, such as mRNA binding and the binding of the 50S ribosomal subunit, are not disturbed. Still, the extension does not occur due to the interruption of the phenomenon to ensure translation accuracy. The established activity of antimicrobial is usually bactericidal to the susceptible Gram-negative bacilli [17]. It has also been observed that aminoglycosides at sub-inhibitory quantities could alter transcription rates. Lower concentrations of amikacin could disrupt the construction of the Z ring, leading to cell division inhibition [18,19].
Aminoglycosides (AGs) bactericidal antibiotics were initially isolated from Streptomyces and Micromonospora and show interest in opposition to Gram-negative and Gram-positive pathogenic microbes and mycobacteria. Many AGs have progressively been found and developed since the invention of the first-in-class AG, streptomycin. This development has kept them clinically applicable, regardless of the inherent nephrotoxicity. In the current scenario, amikacin, gentamicin, and tobramycin are the maximum advised aminoglycosides for systemic management inside the US against bacterial infections. Kanamycin A is likewise used systemically; however, it is most effective in dealing with the resistance of M. tuberculosis in sufferers who display no reaction to first-line anti-TB treatments [20,21].
Aminoglycosides and their mode of action are predicated mainly based on the bacterial ribosome in the foremost groove of the 16S rRNA subunit. The aminoglycoside binding causes genetic code misreading, generating misfolded proteins, and eventually leads to the death of the cell. Despite being some of the oldest antibacterial dealers till now, aminoglycosides have preserved huge effectiveness over a long time and continue to be typically used as antibiotics. On the other hand, bacterial resistance to aminoglycosides is spreading at a rapid scale. The earliest account of resistance may be dated again to 1946, when medical doctors at the Mayo Clinic found sufferers with tuberculosis wearing traces that had been one thousand instances extra immune to streptomycin [22].
For 3D structure prediction, many computer techniques for protein structure prediction have been applied. These techniques include threading, which uses comparable energy functions to assess a sequence’s matching with a fold that was produced experimentally. Template-based modeling, in which patterns of evolutionary variation are used to match a sequence to a sequence with a known structure, is now the most extensively utilized and generally dependable method. The techniques referred to as fold recognition, comparative modeling, and homology modeling are all included in template-based modeling [23].
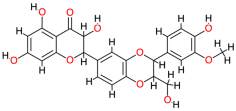
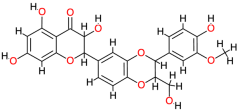
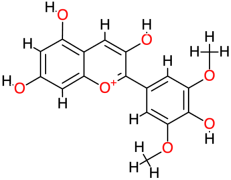
Neural networks have been used for structure prediction for a long time, but their effectiveness in improving structure prediction is relatively new. The protein structure prediction problem involves translating evolutionary couplings into protein distance matrix images and then incorporating the predicted distances into a heuristic system for 3D coordinate prediction. AlphaFold uses cutting-edge neural network topologies and training techniques to significantly increase the accuracy of structure prediction. The basic amino acid sequence is used by the AlphaFold network to directly predict the 3D coordinates of all heavy atoms for a particular protein [24]. The main objective of this study is to use recent machine learning/deep learning algorithms for structure prediction and minimization such as Alphafold2 to find certain potent molecules that break the acetylation reaction of the drug molecule itself, and show an inhibitory mechanism against the protein to slow down its pathogenic activity. Additionally, the study aimed to explore the repurposing of certain first-line antibacterials like Dorepenam, Silibinin, and Malvidin. Drug repurposing or drug repositioning is a way to carry forward the drug discovery procedure through the identification of a novel and potent clinical use for a pre-existing drug approved for a different ailment or indication [25].

2. Material and Method

2.1. Protein Sequence Retrieval

The FASTA sequence of aminoglycoside N(6′)-acetyltransferase type 1 of M. morganii (Uniprot ID: Q15BH7) obtained from UniProt KB [26,27,28] is given below:
  • MDSSPLVRPVETTDSASWLSMRCELWPDGTCQEHQSEIAEFLSGKVARPAAVLIAVAP DGEALGFAELSIRPYAEECYSGNVAFLEGWVVSARRQGVGVALVKAAEHWARGRGC TEFASDTQLNSASTSAHLAAGFTEVAQVRCFRKPL

2.2. Predictions for Stability and Pathogenicity

The (PredictSNP) [29] tool, also a consensus classifier, which is a combination of 9 PredictSNP, MAPP, PhD-SNP [30], PolyPhen-1, PolyPhen-2 [31], SIFT [32,33], SNAP [34], nsSNPAnalyser, and PANTHER [35] is used to get the indices for the change in the stability and pathogenicity of the aacA7 protein upon mutation. These are well-known tools for calculating the effects of mutation on the functioning of the protein.

2.3. Homology Modeling

The 152-amino-acid-long aacA7 protein was the target chosen sequence for the homology model. The sequence was downloaded from UniProt [28] and uploaded to various web servers, i.e., I-TASSER [36,37], Phyre2 [23], Alphafold2 [38], and Swiss Model [39], for a comparative homology modeling of the 3D structures of the desired protein.
The I-TASSER technique includes a neural network; however, threading, assembly, and refining are the steps used in the I-TASSER technique. The query sequence is initially run through the PDB library to find local pieces that are suitable for adoption in a subsequent structural reassembly. Three-dimensional (3D) protein structure comparative modeling is performed using the SWISS-MODEL system. The server handles all the aspects of template selection, alignment, and model construction automatically. Phyre2, which builds 3D models, predicts ligand binding sites, and analyses the impact of amino-acid variations for a user’s protein sequence using advanced homology detection techniques.
With the use of cutting-edge training techniques and innovative neural network topologies, AlphaFold significantly increases the accuracy of structure prediction. The basic amino acid sequence is used by the AlphaFold network to directly predict the 3D locations of all heavy atoms for a particular protein. There are two primary phases in the network. Initially, the inputs are processed by the network backbone via a unique neural network block known as the Evoformer, which is processed via many layers. Both attention-based and non-attention-based components may be found in various Evoformer blocks. This is followed by the structure module, which adds an explicit 3D structure to the network by rotating and translating each protein residue.
Energy minimization was performed on all the modeled structures using the Yasara server [40]. The protein models were validated via Ramachandran plots [41,42], the ProSA web server [43], ERRAT [44], and Verify3D [45], and in PROCHECK for the Gfactor calculations [46].

2.4. Ligand Retrieval

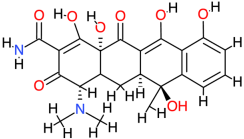
Different classes of antibiotic drugs have been on the market to treat many bacterial infections. Twenty-one random drugs were used, e.g., Silibinin, Doripenem, Azithromycin, telithromycin, tetracycline, doxycycline, and roxithromycin. All ligands were retrieved from the Pubchem database [47,48], minimized from the Yasara energy minimization server [40], and subjected to docking studies with wild-type and mutated forms of the aacA7 protein.

2.5. Ligand Toxicity Prediction

Ligand toxicity prediction was performed using the ProTox 3.0 web server (https://comptox.charite.de/protox3/, accessed on 24 February 2024). The prediction incorporated similarity, the propensities of the fragments, and frequent features, using a machine learning model based on 61 different models for the toxicity prediction. Several features included endpoints such as toxicity related to acute, organ, toxicology, molecular initiating, and metabolism. Also, Tox21 pathways including adverse outcomes and toxicity targets were considered. The percentage accuracy of the prediction was also calculated and reported in the results table. The reported LD50 values correspond to mice.

2.6. Molecular Docking of aacA7 with Known Drugs

Twenty-one random drug molecules were docked against the aacA7 protein, and the highest-scoring compounds with the least binding energy were found for further studies. The AutoDock 4.0 suite [49] was used to conduct the docking purpose. This software is perfectly suitable for the calculations of the ligands docking to the receptors. All intermediary steps like grid box creation were finalized using AutoDock Tools GUI (ADT) [49]. The prepared files were saved in the format given by AutoDock, known as PDBQT. The grid map was prepared using AutoGrid 4.0 using a grid box. The size of the grid was set to 126 × 126 × 126 XYZ points with a grid space of 0.375 Å, and the grid center was selected at X = −7.564, Y = −28.149, and Z = −32.156 dimensions.
A scoring grid calculation was performed from ligand geometry to shorten the time of computation. Top conformations were chosen using the Lamarckian Genetic Algorithm (LGA) [50]. A maximum of 20 conformers was set to be considered for every compound. The population size of 150 was set. The number of energy evaluations was set to 2,500,000, the number of generations to 27,000, the number of the top individual that automatically survived to 1, the mutation rate to 0.02, and the crossover rate to 0.8, all the maximum values that could be set. The rest of the parameters were selected as default with 10 runs. The protein was rigid while the ligands were kept flexible for docking analyses, as the entire complex of both the protein and ligand would be further flexible in the molecular dynamic simulations. The lowest binding energy poses were obtained and matched with the receptor for later analysis.

2.7. Molecular Dynamic Simulations

2.7.1. System Setup

To study the aacA7 protein–ligand complex, molecular dynamic (MD) simulations were performed. The CHARMM36 force field [51] was used, and the simulations were run for a total of 400 nanoseconds. Solvated systems using scripts in VMD [52] were prepared, and simulations were run using GROMACS 2020.4 [53,54,55]. The system consisted of the protein complex, water molecules, sodium and chloride ions, and 150 mM NaCl.
The system was first minimized for 3200 steps, followed by 1000 picoseconds of equilibration. The MD production run was then conducted for 100 nanoseconds each for a total of 400 nanoseconds. The NPT ensemble was used, with a pressure of 1 bar and a time step of 2 femtoseconds. The temperature was set to 300 Kelvin with a low damping coefficient, and pressure was controlled using the Nose–Hoover Langevin piston. Electrostatics were calculated using the particle mesh Ewald (PME) method, with a cutoff of 12 angstroms for short-range and Van der Waals electrostatics. Each simulation was replicated twice with an initialized random seed to obtain average scores.

2.7.2. Data Analyses

Data analysis was performed using Gromacs analysis scripts. The data were plotted using Gnuplot, a plotting software available at http://gnuplot.info (accessed on 24 February 2024). The hydrogen donor and acceptor were calculated with a cutoff of 3.6 angstroms, including the backbone and side chain. Other analyses, such as the radius of gyration (Rg), solvent accessible surface area (SASA), secondary structure content (DSSP), and hydrogen bond formation, were calculated using TCL bash scripts. RMSD, RMSF, SASA, total energy, hydrogen bonds, and Rg were plotted using Prism (https://www.graphpad.com/features, accessed on 24 February 2024), a data visualization software.

2.7.3. Analysis of Binding Free Energy (MMPBSA) from MD Simulations

The analysis module MMPBSA.py was used for the free energy calculation and interaction energy of the ligand. The mathematical equation used for this calculation was as follows:
∆Gbind.solv = ∆Gbind.vaccum + ∆Gsolv.complex − (∆Gsolv.ligand + ∆Gsolv.receptor)
The all-states solvation energy was calculated using Poisson Boltzman (OB) and Generalized Born (GB) [56,57]. This analysis disclosed the contribution of the electrostatics of the solvation state. The data were plotted using Prism.

2.7.4. Chemical Similarity Index

The chemical similarity index was performed using an online tool (ChemMine, https://chemminetools.ucr.edu/, accessed on 24 February 2024). The chemical structures in the SMILES format were uploaded and checked for the chemical similarity index using default settings.

3. Results and Discussion

3.1. Sequence Retrieval and Primary Sequence Analysis

The target sequence of the aminoglycoside N(6′)-acetyltransferase type 1 (Uniprot ID: Q15BH7) of M. morganii was acquired from the Uniprot database [28,58] and put through to the Expasy Protparam tool [59] for primary structural investigation.

3.2. Physico-Chemical Analysis of the Primary AAC6_MORMO Sequence

The primary protein structure analysis by Expasy’s ProtParam (Table 1) showed that AAC6_MORMO (Q15BH7) contains 152 residues with an estimated molecular weight of 16,376.45. The theoretical pI was predicted to be 5.18; hence, the protein was predicted to be acidic.

3.3. Phenotypic Analysis for Stability and Pathogenicity Prediction

A whole-protein-sequence SNP-based mutational analysis was performed using a consensus classifier (PredictSNP) [29]. Mutations showing deleterious effects in all seven programs of PredictSNP have been tabulated in Supplementary Table S1. Out of all these mutations, one random mutation E86K was chosen for the wild-type (WT) and mutated protein interaction studies with the lead compound selected after docking.

3.4. Tertiary Structure Prediction, Energy Minimization, Structure Analysis, and Visualization

Four web servers and Alphafold2 were utilized to get the best 3D structure of the aacA7 protein. The evaluation of the predicted 3D structure was accomplished using the template and the energy-minimized structure to discover the accuracy of the protein model. The stereo-chemical balance of the expected structure was calculated with PROCHECK [46]. The assessment of protein models with 3D sequence profiles was performed using Verify 3D [60,61]. ERRAT [44] was used to investigate the facts of non-bonded interactions among distinctive atom types. All the visualizations were carried out using the DeLano Scientific PyMol 3-D molecular viewer. All analyses resulted in the acceptance of the model generated by Alphafold2, which is based on machine learning and artificial intelligence as the best energetically stable homology model of the aacA7 protein. All the results of homology modeling are tabulated in Table 2.
Figure 1 demonstrates the 3D model of aacA7 using Alphafold2. The Ramachandran plot (Supplementary Figure S1) of the homology model generated utilizing PROCHECK shows that ~90% of the protein residues are spaced out under the central region, which delivers the model’s message as stereo-chemically stable. The homolog of the same protein from Salmonella enteritidis (UniProt-Q9R381) shows the structure in a dimer form, which has been resolved through X-ray crystallography. Supplementary Figures S15 and S16 also show the monomeric structure of aacA7 obtained from Alphafold2, along with the validation graph.

3.5. Molecular Docking of aacA7 with Drug Molecules

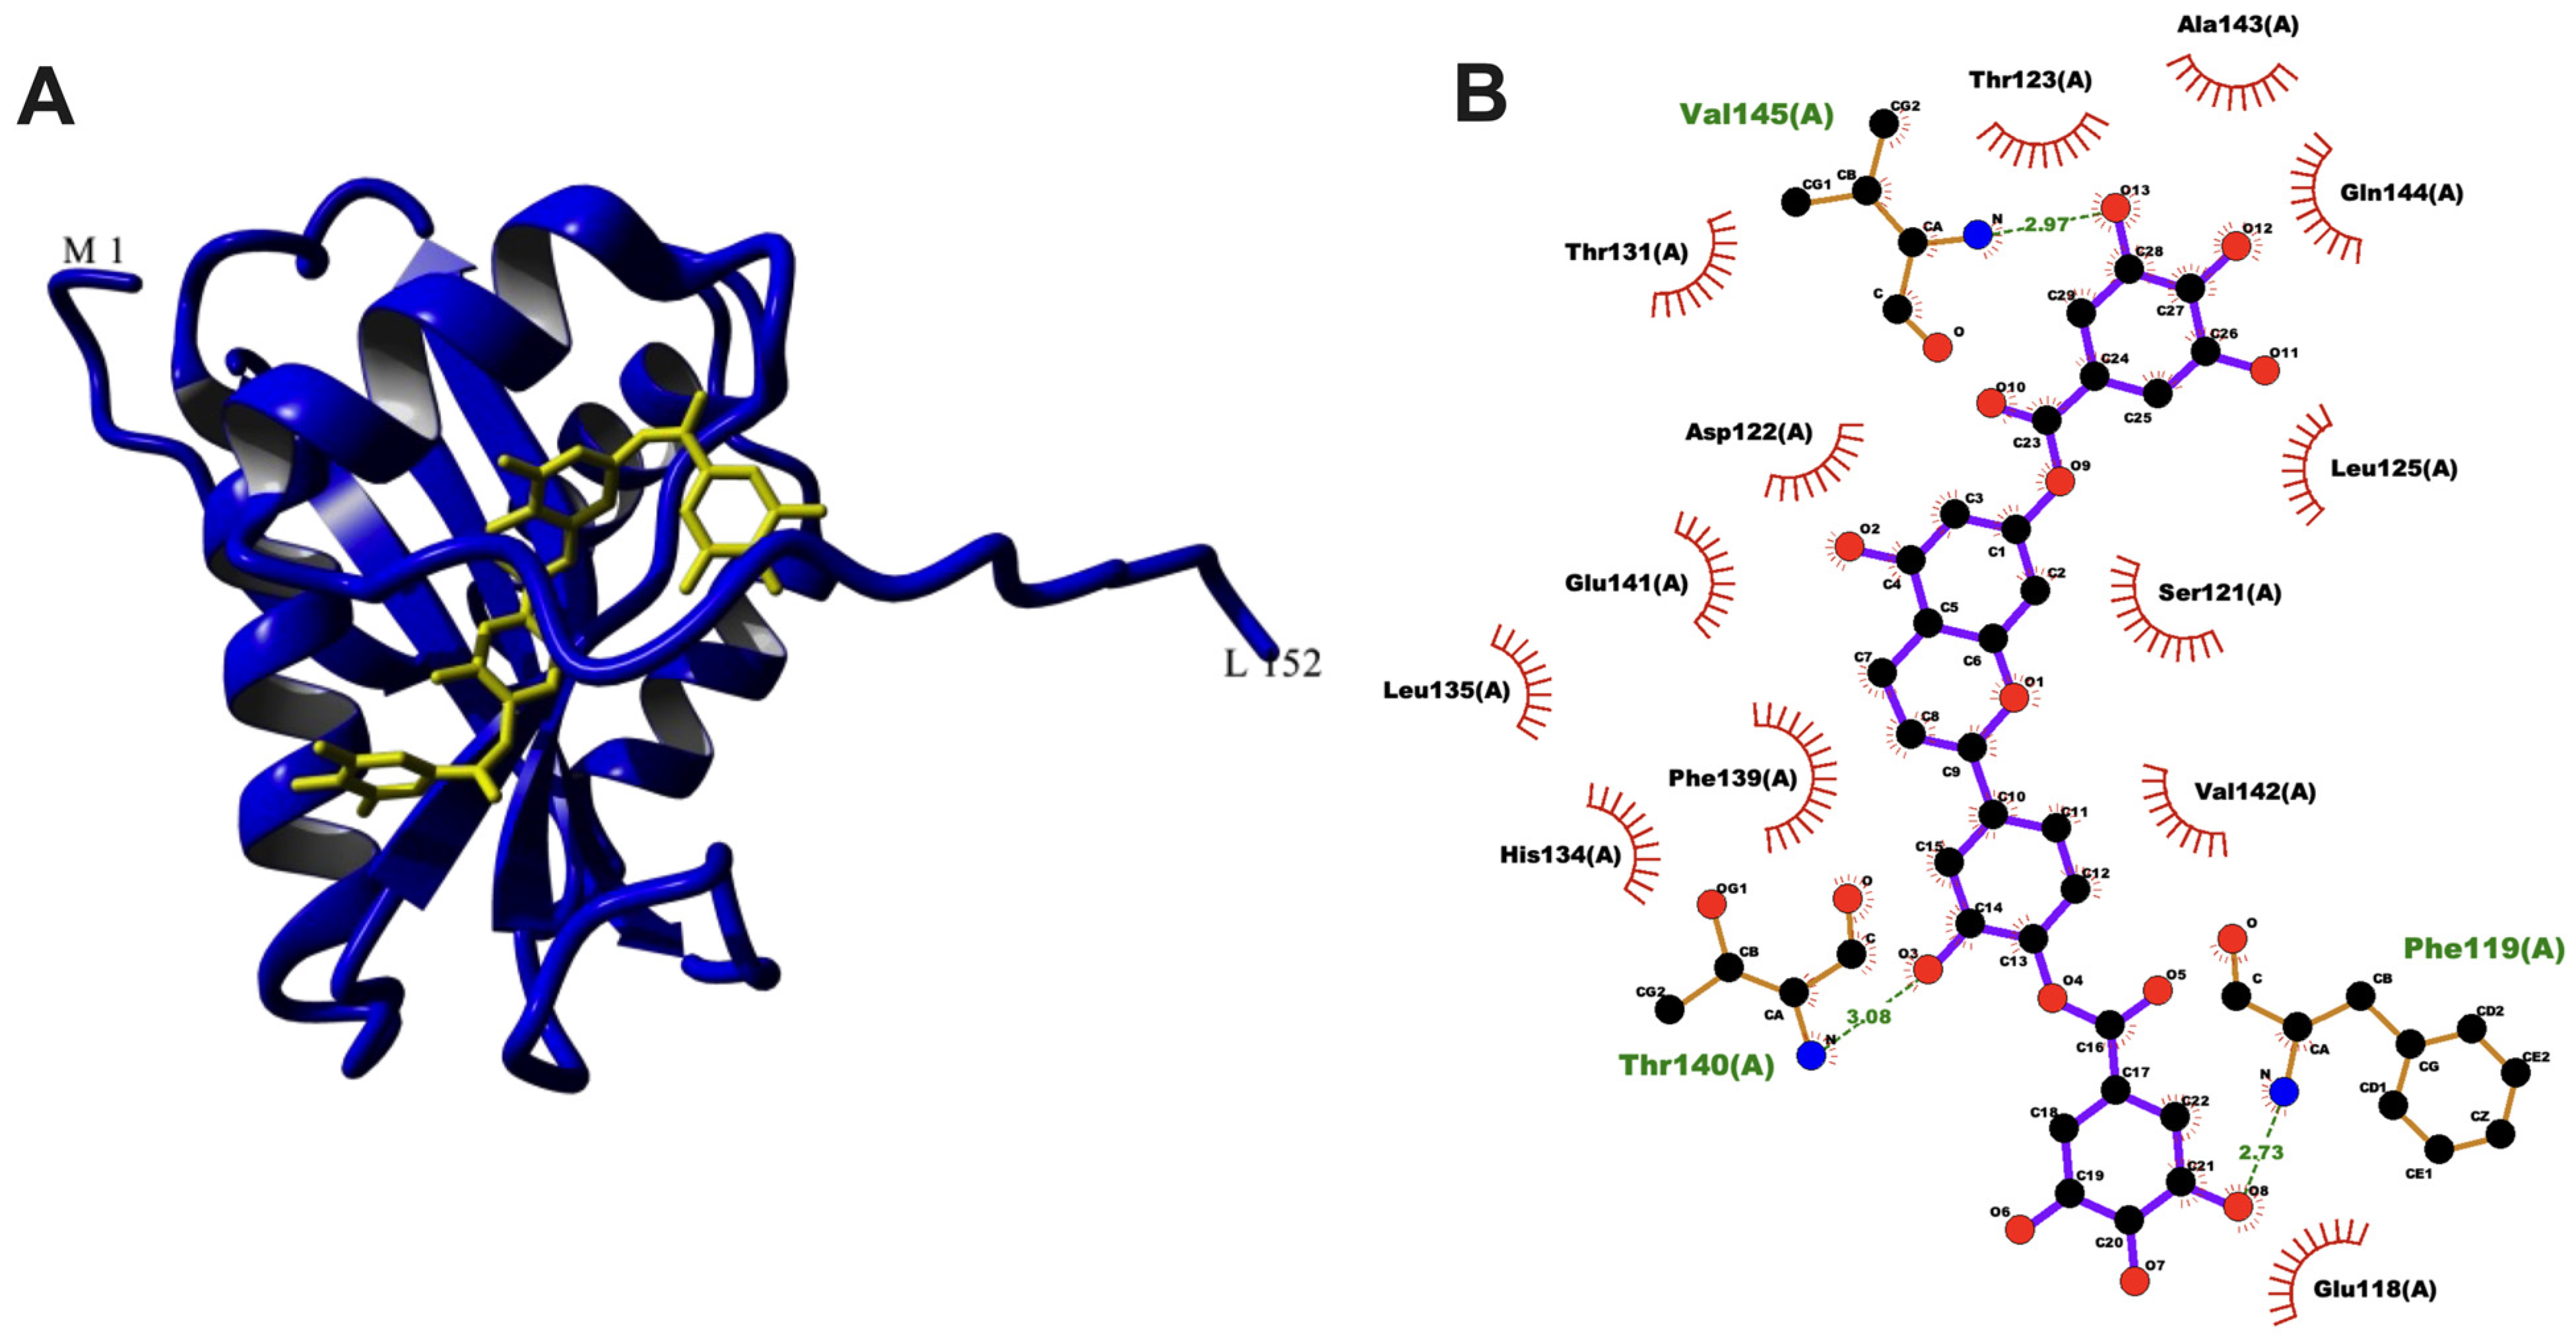
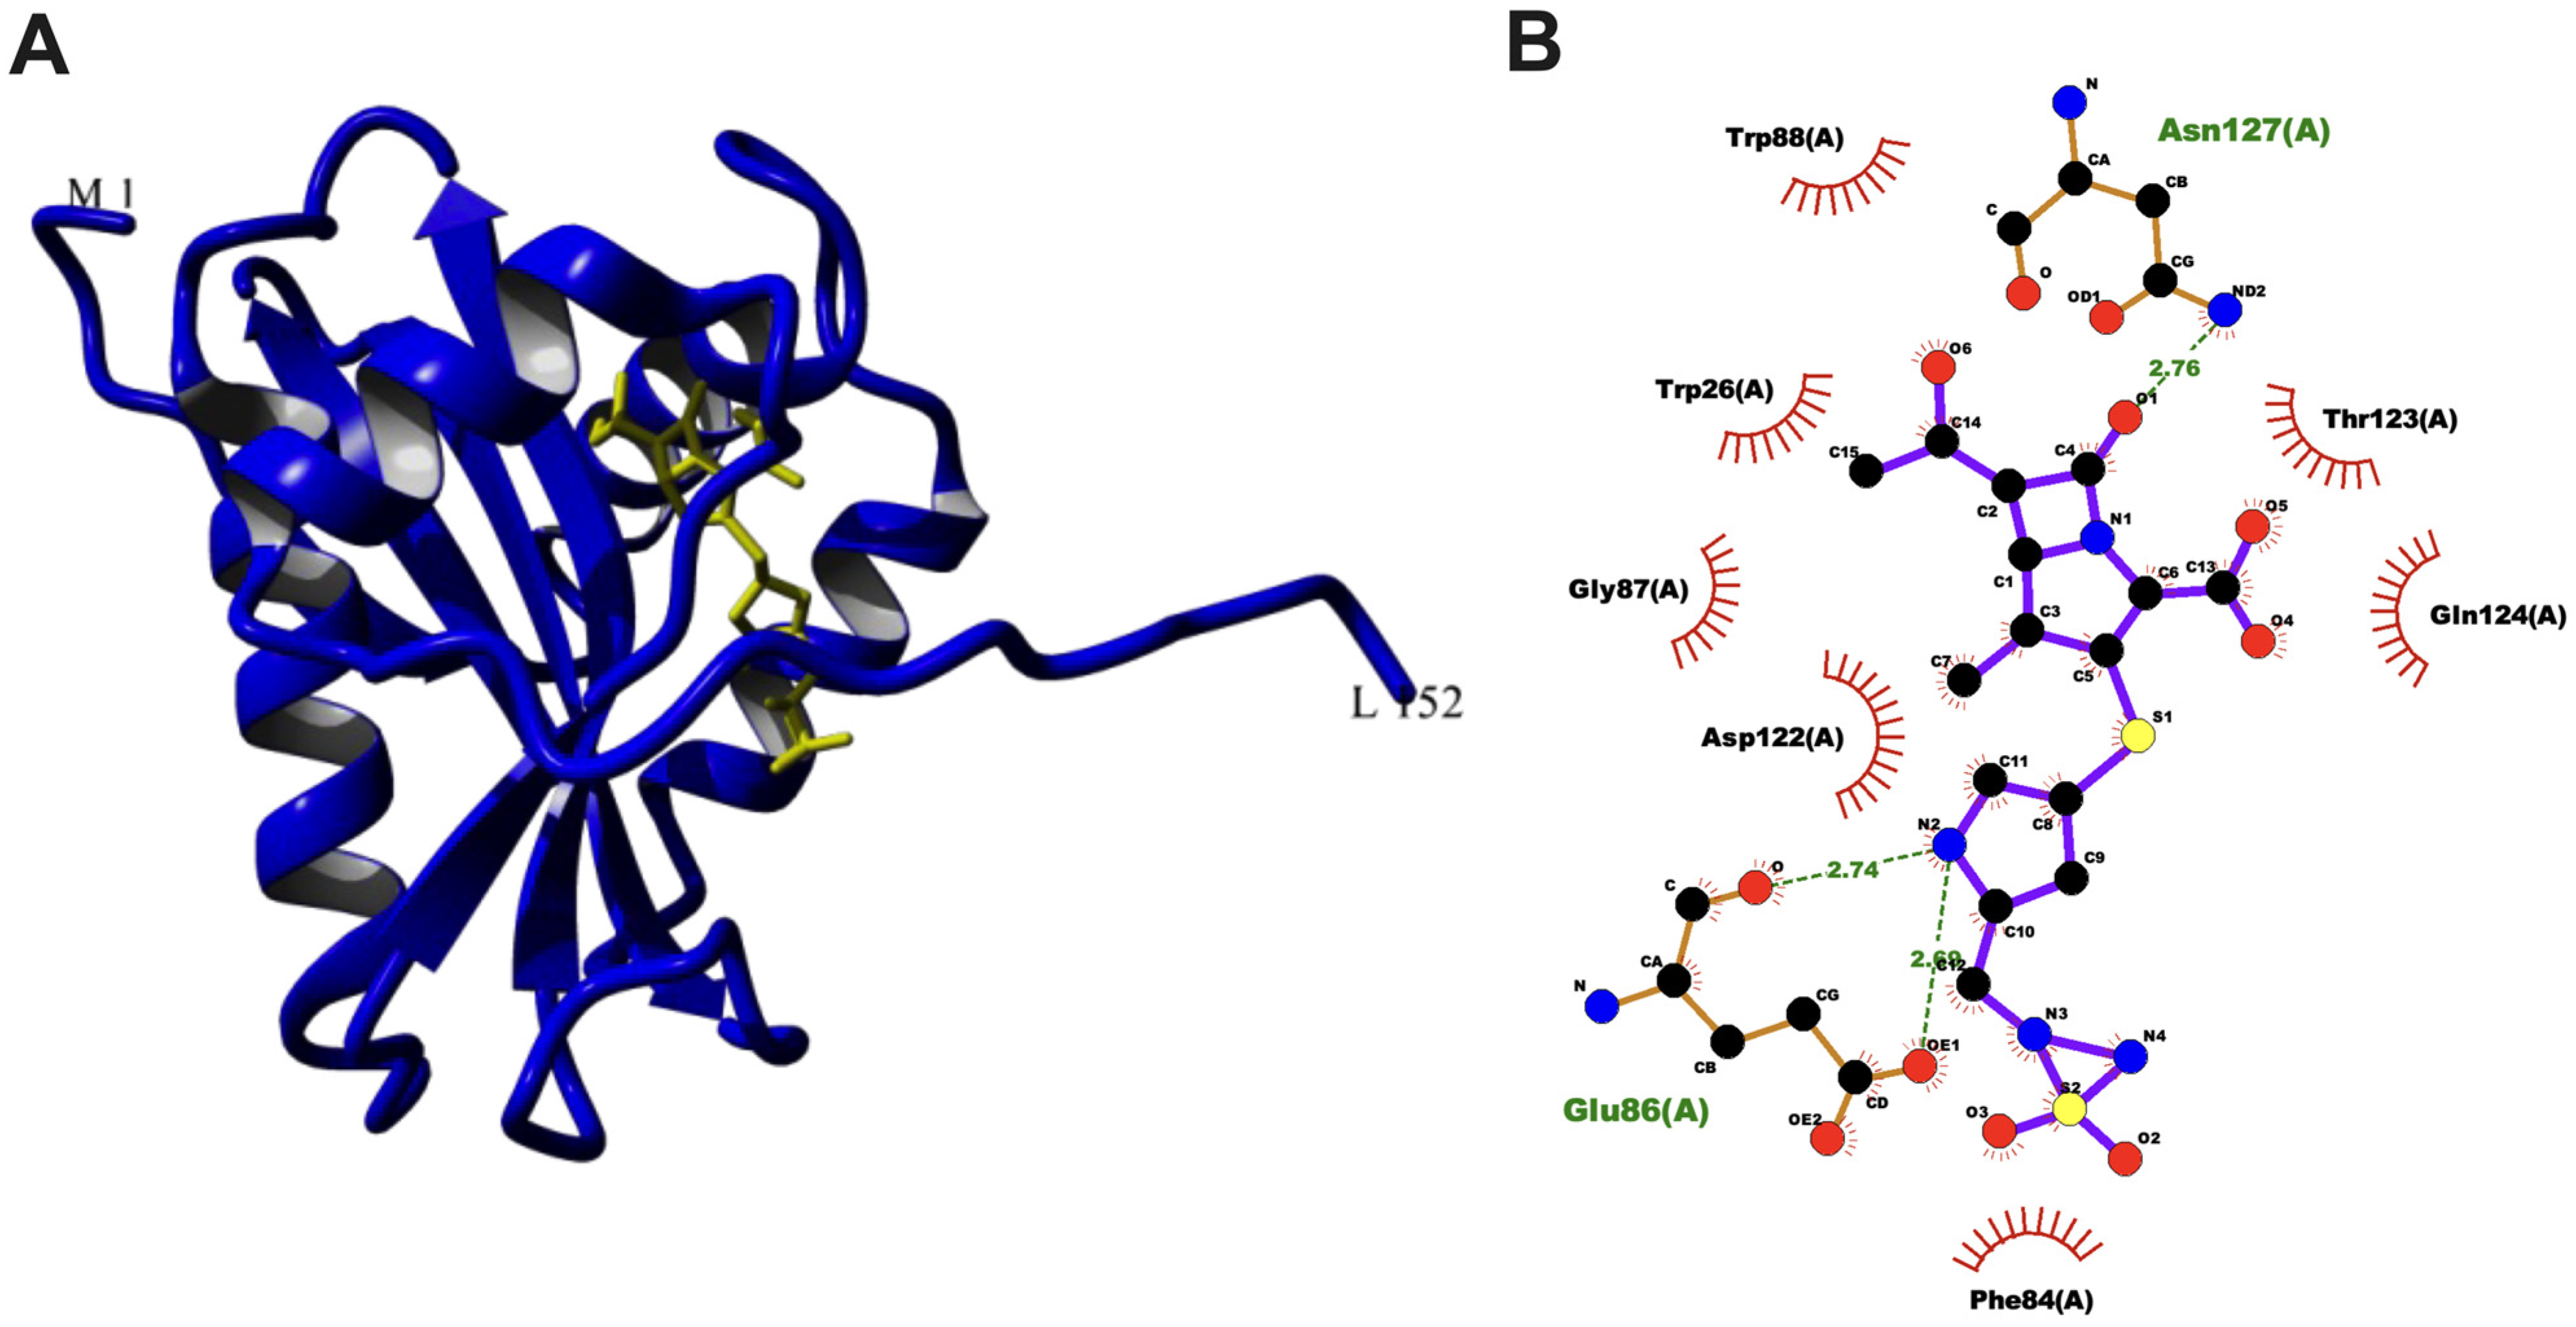
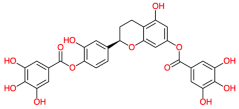
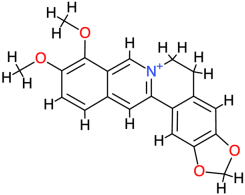
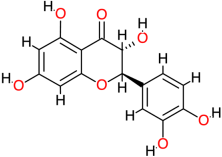
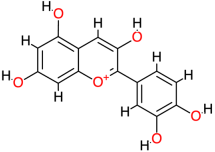
Molecular docking calculations were conducted to discover the potential inhibitory action of the available drugs in the market for general microbial infection. These drug molecules were tested with the homology model of the aacA7 protein created by the Phyre2 server. The protein was energy-minimized after modeling to bring it down to its native energy state before employing the docking protocol. Twenty-one different drugs, including azithromycin, doxycycline, tetracycline, silibinin, doripenem, roxithromycin, and telithromycin, were used for protein–ligand docking. The docking was performed using AutoDock 4.2 [62,63,64], a molecular docking software. Table 3 summarizes the information obtained from the in silico molecular docking experiment. Two best-bound drug candidates, Oncoglabrinol-C and Doripenem can be seen in Figure 2 and Figure 3, respectively, with the aacA7 protein. The protein–ligand interaction profile can also be observed as a leaflet at the right of the corresponding figures.
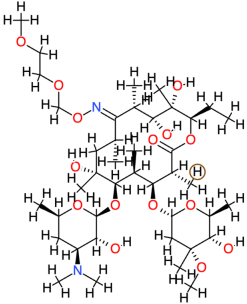
It can be easily observed that OncoglabrinolC and Doripenem are two drugs showing the best binding affinity (−12.82 and −10.28 kcal/mol, respectively) with the aacA7 protein. With 402.43 pM, OncoglabrinolC demonstrated an excellent value of enzyme inhibition, whereas Doripenem showed 29.23 nM of protein inhibition. The flavan derivative from O. glabratus, Oncoglabrinol C (5,3′-Dihydroxyflavan 7-4′-O-digallate), showed striking activation of PPARγ and PPARα in cell culture [65]. Table 4 demonstrates the toxicity study results of all the compounds used in our study. Toxicity studies signify that Doripenem belongs to class 5 of toxicity gradient and shows lesser toxic effects case by case.

3.6. Molecular Dynamics Simulation

Molecular dynamic (MD) simulations have been executed for the best two drug-binding molecules OncoglabrinolC and Doripenem with the aacA7 protein. To corroborate the binding stability of the protein–ligand complex, we performed an MD simulation of 100 ns each for wild and mutated complexes of aacA7–OncoglabrinolC and aacA7–Doripenem. The well-minimized equilibrated structure was used to perform docking studies; furthremore, all-atom MD simulations were performed to nullify any type of bias that could be felt during the experiment. All-atom 100 ns simulation is enough to get into the dynamic picture of a small protein–ligand complex. Potential energy analysis was performed during the 100 ns MD simulations for all the complexes. This plot shows that all the trajectories were stabilized and remained stable throughout the 100 ns simulation run, as observed in Figure 4A. The total energy of the whole system (Figure 4B) also suggested stable trajectories for all four protein–ligand complexes.
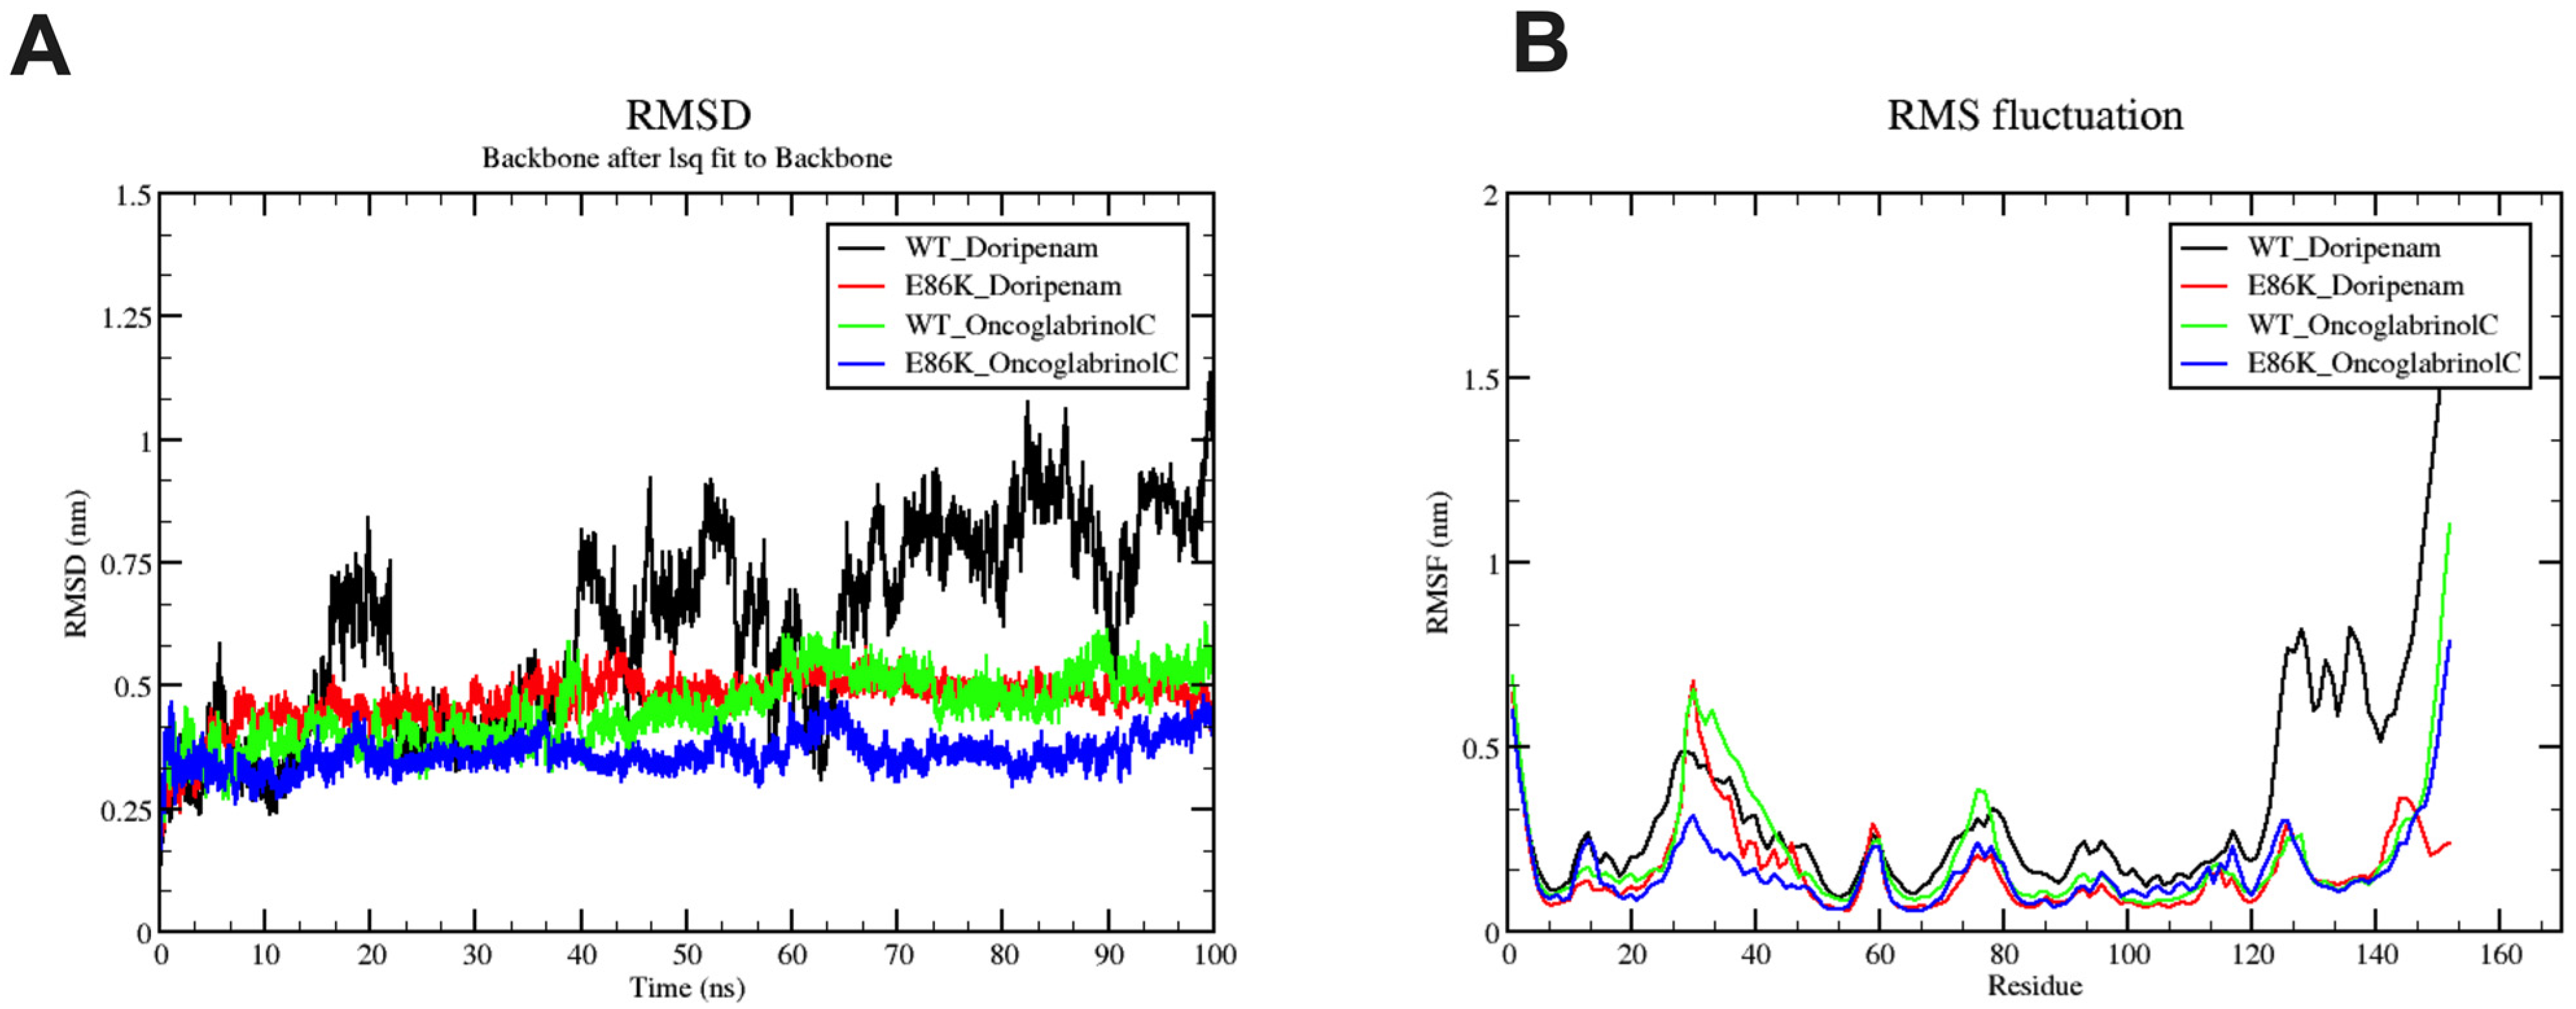
RMSD deviation in WT protein in association with Doripenem is relatively high, and the whole trajectory is unstable. The rest of the complexes show fewer RMSD deviations, and more stability can be observed. Overall trajectory analyses for all WT complexes in comparison to their respective mutated versions are quite unstable. This signifies that mutation plays a crucial role in the association of drug molecules to the enzyme of action. The compounds in the mutated version are more or less equilibrated with an atypical change of approx. 0.25 nm in the RMSD, except for a change of more than 1 nm in the case of the Doripenem WT complex (Figure 5A). The most deviation observed (approx. 0.75 nm) was the average RMSD change throughout the simulation, in total, 40 ns for the WT_Doripenem complex (shown in black) (Figure 5A). This sort of deviation could be the result of the attainment of the conformational change as the ligand molecule binds with the protein. On the other hand, the trajectory of the mutated aacA7 and Doripenem complex (displayed in red) presented the best-equilibrated contour through the simulation (Figure 5A).
Similarly, the trajectories’ RMSF plot shows almost the same per-residue fluctuation in all four complexes around 20–40 residue patches (Figure 5B). The WT Doripenem complex, as depicted in the RMSD plot, revealed most local residue-based variation around residue number 20 to 40 and after residue 120. The same profile was also observed in other complexes, except for the change in residues from 120 to further. These residue groups could be the plausible functional site for the ligand-binding incident. The large RMSD and RMSF values may suggest a huge energy exchange during the protein–ligand complex formation, which resulted in higher fluctuations. We are performing simulations only to understand this change in conformation, energy, and interactions. These values should be taken in a positive sense.
Figure 6A demonstrated the pattern for hydrogen bonding seen during 100 ns simulation in all four intra-protein complexes. The most numbered H-bonds were monitored in the case of the WT–Doripenem complex, and the least number of H-bonds were examined in the WT–OncoglabrinolC complex. Figure 6B displays the number of H-bonds formed between the protein and the surrounding solvent.
In addition to RMSD, RMSF, hydrogen bonding patterns, SASA, the radius of gyration (Rg), and MMPBSA graphs, other analyses were also performed. Specifically, the solvent-accessible surface area (SASA) of all the proteins and ligands was calculated to assess the effect of ligand binding on the surface residue profiling of the protein. Figure 7A shows the SASA plot obtained using the gmx sas command in Gromacs [53,66] for the 100 ns simulation. Overall, profiles are similar, apart from certain exceptions in the case of OncoglabrinolC wild and mutated states. The radius of gyration (Rg) plot for the four complexes in 100 ns simulation run-time suggests that the structure of the protein may change upon ligand binding in both wild and mutated states (Figure 7B).
The Rg value for WT–Doripenem is greater than 1.8 nm, which may indicate a change in the conformation of the ligand inside the binding pocket. This could be due to the protein being more receptive to the ligand, making more conformational space available for better ligand binding. On the other hand, the lower Rg values for the other complexes suggest that they are more structurally stable for ligand binding and interaction. The decrease in the gyration radius for the rest of the complexes indicates that the proteins become more compact upon ligand binding. The Rg is a measure of the compactness of a protein and is defined as the mass-weighted root mean square distance of a group of atoms from their center of mass. It is an important parameter that provides a close-up view of the overall dimensions of the protein [67,68,69]. Parameters that can be studied to track the changes using the radius of gyration are associatory and dissociation effects, the binding of coenzymes, temperature effects, and conformational changes by denaturation [70,71].
Similar results are also recorded for ligands in WT and mutated complexes. These results are provided in supplementary figures. Supplementary Figure S2 (left panel) demonstrated the RMSD graph for ligands only. OncoglabrinolC bound to E86K-mutated protein showed a high deviation, and Doripenem showed the least deviation. The RMSF graph (right panel) demonstrated the tremendous fluctuation rate in the conformation of ligands when bound to protein structures. Supplementary Figure S3 shows the SASA graph (left panel), with hardly any change in the ligand area. The Rg graph (right panel) also shows the negligent change in the radius of Doripenem. A change of 0.1 nm can be observed in the radius of OncoglabrinolC binding to WT and the mutated aacA7 protein. The number of observed H-bonds formed in between the protein and ligand during the 100 ns simulation run can be observed in Supplementary Figure S4. The highest digit of H-bonds (>10) is found in the E86K-mutated aacA7–OncoglabrinolC complex. The free energy of the solvation graph for protein (left panel) and ligands (right panel) is shown in Supplementary Figure S5. To understand the change and binding stability in the ligand-docked complexes, we studied the conformational change of aacA7–OncoglabrinolC (in wild and mutated forms) and aacA7–Doripenem (in wild and mutated forms) complexes at three different time intervals (0 ns, 50 ns, and 100 ns). Supplementary Figures S6–S8 show the overall binding residues of aacA7 in association with OncoglabrinolC and Doripenem in wild and mutated forms, respectively. The change in binding partner residues can be easily observed.
For a better understanding and relative comparison, we performed the whole procedure from modeling to simulation apo and holo states of the aacA7 dimer protein. The dimer was modeled with the help of Alphafold [72]. A comparative table for the average and standard error values for wild and mutated complexes for Oncoglabrinol-C and Doripenem in the monomeric state and apo and holo dimeric states of aacA7 bound to Oncoglabrinol-C is provided as Supplementary Table S3. Supplementary Figure S9 shows the dimeric state of the aacA7 protein docked with Oncoglabrinol-C. It is observable that the ligand binds at the interface of both chains as we get into the monomeric state. Superimposed dimeric conformations of aacA7 in the apo state at 0 ns (red) and 100 ns (green) time scale can be seen in Supplementary Figure S12. Additionally, Supplementary Figure S13 demonstrates the Superimposed dimeric conformations of aacA7 in the holo state (bound with Oncoglabrinol-C) at a 0 ns (red) and 100 ns (green) time scale. Supplementary Figure S14 shows the RMSD, RMSF, and H-bond graphs for the aacA7 protein in dimeric conformation in apo and holo states (bound to Oncoglabrinol-C). These graphs relate directly to the monomeric conformation of the protein and suggest that the process of binding to drug candidates is almost similar whether the protein is in a dimeric state or a monomeric state.
The initial study plan was to perform 50 ns simulations, but looking at the RMSD plots, we could infer that the 50 ns simulations would not be enough; hence, we increased the simulation time by two-fold to accommodate better stability for the protein–ligand complex. Usually, higher simulations are recommended for protein–protein interactions, as also confirmed by our additional simulations in triplicates (Supplementary Figure S14). In these simulations, we saw a stable RMSD with no absurd fluctuations when the protein was in a complex; therefore, we can infer that 100 ns simulation time is applicable for conclusive protein–ligand binding analysis.

3.7. Binding Free Energy (MMPBSA/MMGBSA) Analysis

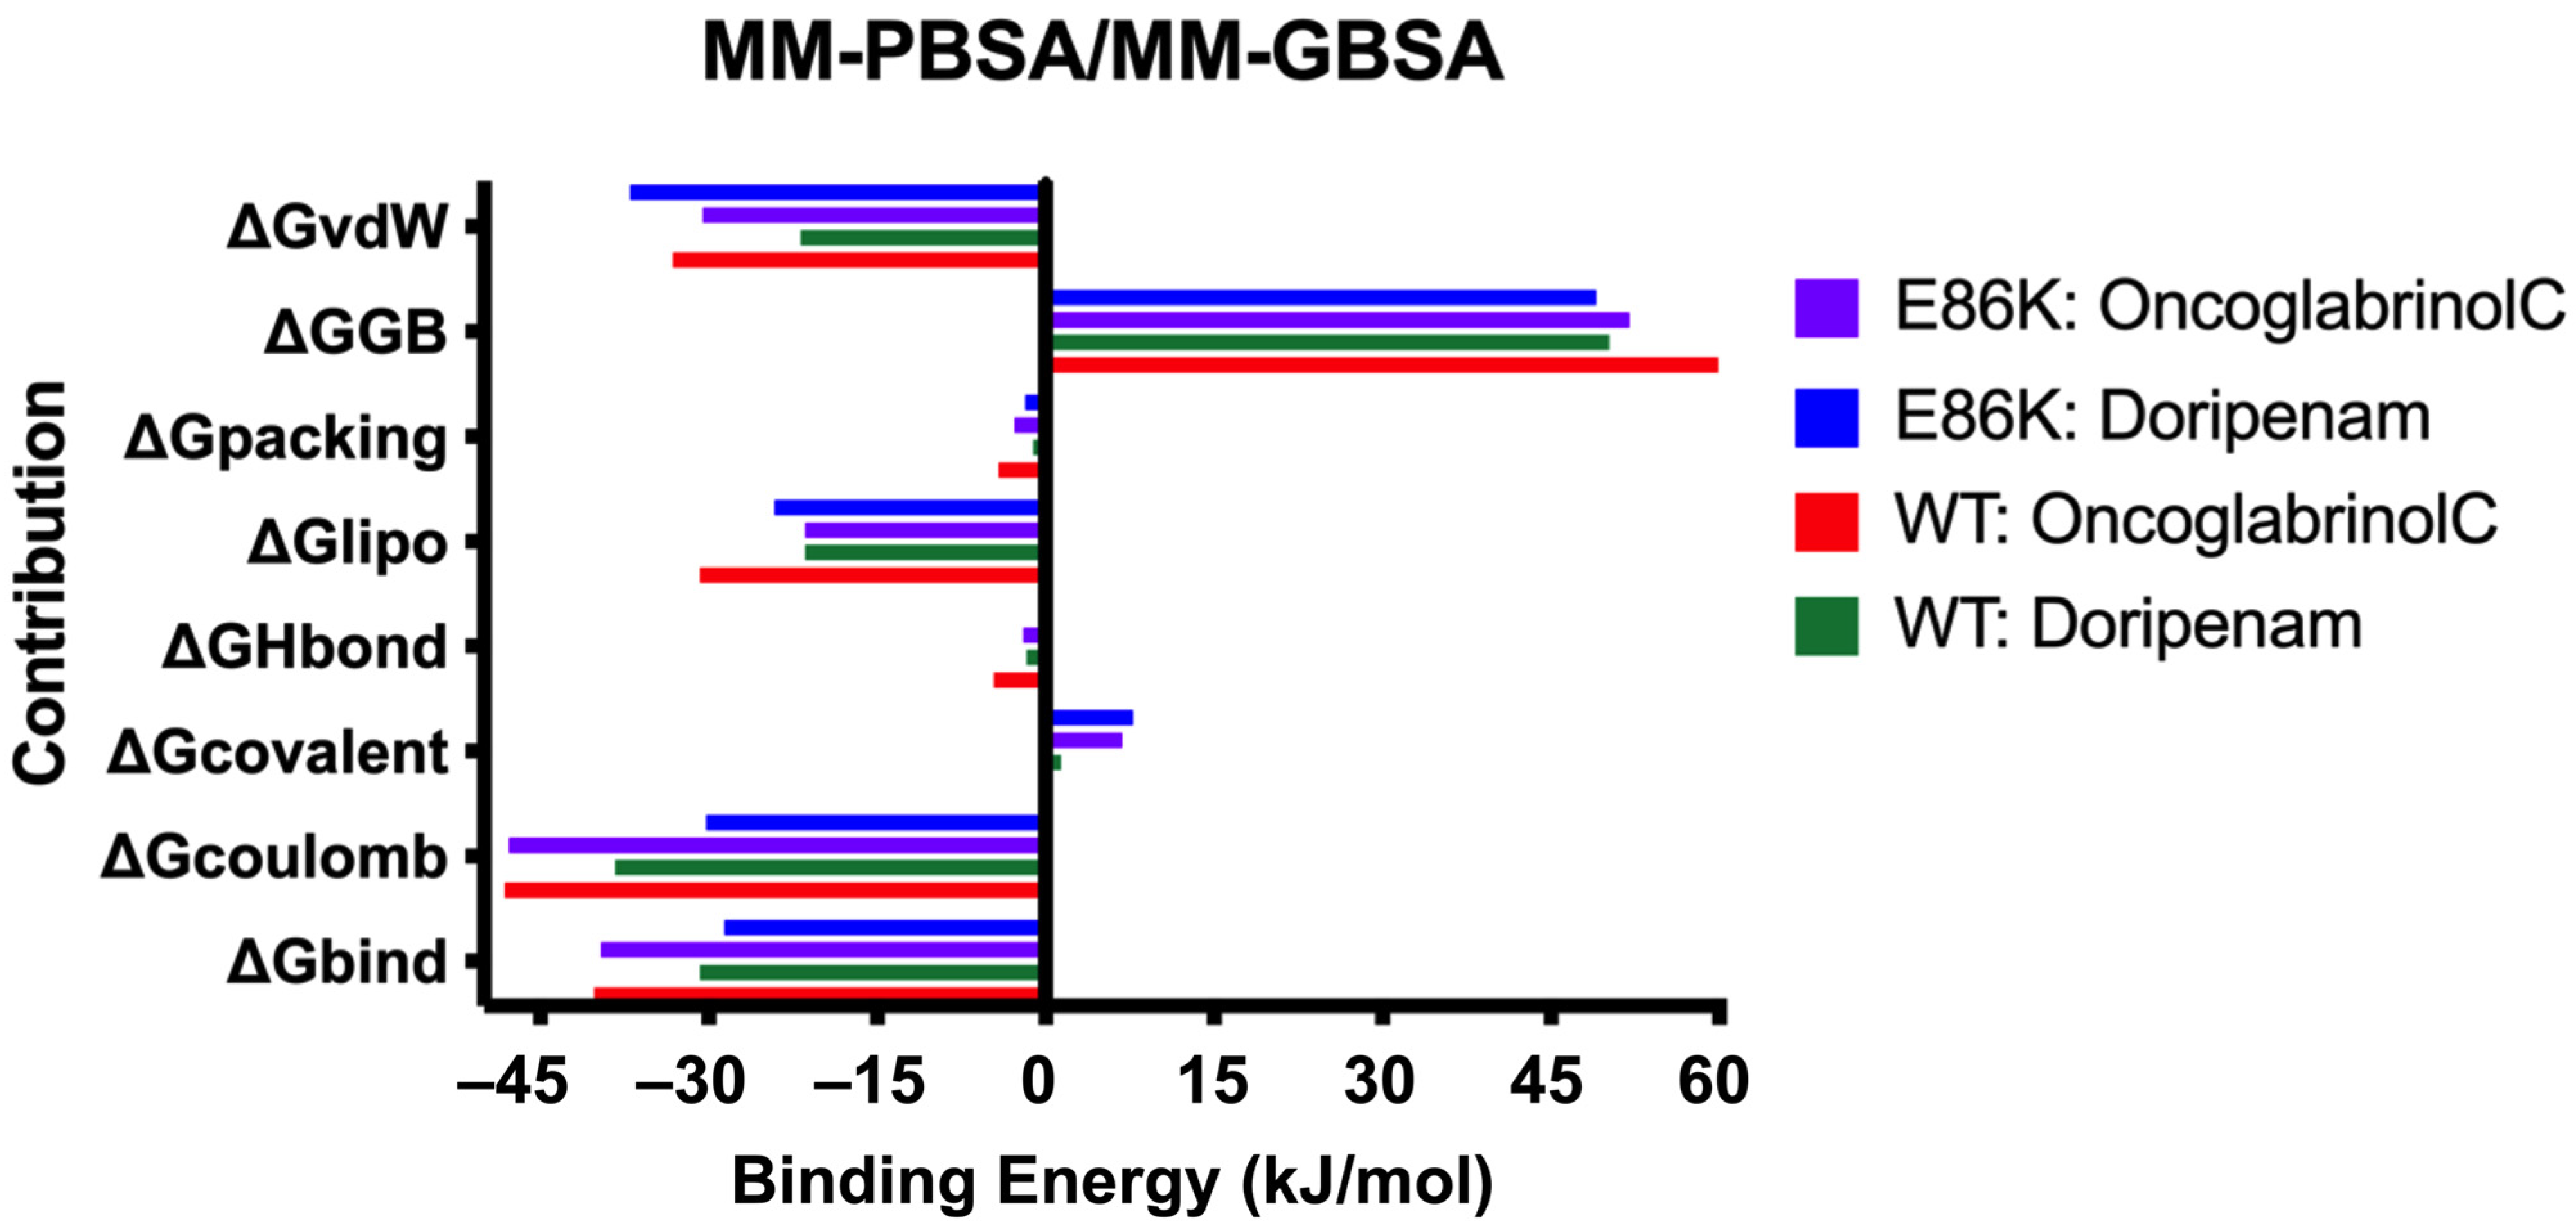
One-to-one energy components such as van der Walls forces, coulomb charges, and H-bonds are computed using MM-PBSA and MM-GBSA tools in Gromacs v2020.4 (Figure 8). The MMPBSA and GBSA tools have also been recently developed using machine learning algorithms for the better identification of local contacts. Also, Supplementary Table S2 represents these values and is incorporated in the text for understanding. The WT–OncoglabrinolC complex shows the maximum Gibbs free energy (−40.2 kJ/mol). When the glutamic acid is mutated to lysine (E86K), the Gibbs free energy does not change drastically, showing a similar affinity of OncoglabrinolC towards the protein. It suggests that after dynamic simulation, OncoglabrinolC is the most preferred molecule and a potential lead; it shows worthy interaction with aacA7 protein, demonstrating its potential as a lead candidate in the future.

3.8. PCA Analysis

Principal component analysis (PCA) was employed to investigate the time-dependent conformational dynamics of the protein–ligand complexes. This technique identifies the essential motions of the system by decomposing the atomic fluctuations into orthogonal principal components (PCs). Each PC represents a specific mode of motion, with the first few PCs capturing the greatest variance in the trajectory data. The eigenvalues associated with each PC quantify the contribution of that mode to the overall dynamics. Supplementary Figure S10 presents the eigenvalues, along with the corresponding free energies and covariance analysis. Analysis of these graphs reveals a greater spread in the eigenvalues for the wild-type complexes compared to the mutated complexes. This suggests a higher degree of conformational diversity in the wild-type protein–ligand interactions. Conversely, the mutations appear to introduce structural rigidity, leading to decreased fluctuations and potentially enhanced stability of the mutated complexes over time.

4. Conclusions

In this study, we investigated the potential repurposing of naturally occurring drug molecules against pan-resistant strains of Morganella morganii, a nosocomial pathogen exhibiting concerning virulence. M. morganii, belonging to the Enterobacteriaceae family, has emerged as a significant opportunistic pathogen, particularly associated with urinary tract infections. Given the extended timelines typically associated with de novo drug discovery, we employed a structure-based in silico approach for the rapid identification of potential drug candidates. AlphaFold2, a state-of-the-art protein structure prediction tool based on machine and deep learning, was utilized to generate a reliable 3D homology model of the aacA7 enzyme, a critical target for antibiotic therapy. Through in silico molecular docking simulations, we evaluated the binding affinities of two naturally occurring compounds, OncoglabrinolC and Doripenem, against both the wild-type and mutated forms of the aacA7 protein. The encouraging results from the docking studies, corroborated by essential dynamic simulations, suggest the potential of these molecules for further development as repurposed antibiotics. However, to definitively validate these findings and assess their efficacy against M. morganii strains, further wet lab experimentation is warranted. This in vitro and potentially in vivo testing will be crucial for establishing the therapeutic potential of the identified drug candidates.

Supplementary Materials

The following supporting information can be downloaded at: https://www.mdpi.com/article/10.3390/pr12061047/s1, Figure S1: The Ramachandran plot shows that more than 90% of protein residues are in the favored region as obtained from Procheck [46]; Figure S2: Left panel demonstrates the RMSD graph for ligands only. oncoglabrinolC bound to E86K mutated protein (in blue) shows high deviation and Doripenem molecule (in red) shows least deviation. RMSF graph demonstrated the huge fluctuation rate in conformation of ligands when bound to protein structures (right panel); Figure S3: SASA graph (left panel) shows hardly any change in ligand area. Rg graph (right panel) also shows the negligent change in radius of Doripenem. A change of 0.1 nm can be observed in radius of OncoglabrinolC binding to WT and mutated aacA7 protein; Figure S4: Number of observed H-bonds formed between protein and ligand during the 100 ns simulation run. Highest number of H-bonds (>10) is found in E86K mutated aacA7-OncoglabrinolC complex; Figure S5: Free energy of solvation graph for protein (left panel) and ligand (right panel); Figure S6: Binding interactions between Oncoglabrinol-C and wild type aacA7 protein at different time intervals of 100 ns MD simulation run; Figure S7: Binding interactions between Oncoglabrinol-C and mutated aacA7 protein at different time intervals of 100 ns MD simulation run; Figure S8: Binding interactions between Doripenem and wild type aacA7 protein at different time intervals of 100 ns MD simulation run; Figure S9: Binding interactions between Doripenem and mutated aacA7 protein at different time intervals of 100 ns MD simulation run; Figure S10: Dynamic behavior of protein-ligand complex in 2D space can be observed in this graph. PCA analysis with the components like covariance and eigenvector indices along with the energy factor is calculated and presented as 3 different graphs; Figure S11: Dimeric aacA7 protein docked with Oncoglabrinol-C. Two subunits are in magenta and green cartoon structure, Oncoglabrinol-C is in ball model; Figure S12: Superimposed dimeric conformations of aacA7 in the apo state at 0 ns (red) and 100 ns (green) time scale; Figure S13: Superimposed dimeric conformations of aacA7 in the holo state (bound with Oncoglabrinol-C) state at 0 ns (red) and 100 ns (green) time scale. Ligand position at 0 ns (blue) and 100 ns (yellow); Figure S14: The RMSD, RMSF, and H-bond graphs for aacA7 protein in dimeric conformation in apo and holo state (bound to Oncoglabrinol-C); Figure S15: Alphafold2 predicted artificial intelligence model for the AAC protein showing most residues falling in very high confidence region, with pLDDT > 90; Figure S16: Predicted Aligned Error (PAE) plot from Alphafold2 prediction showing the protein falls under very low expected position error, hence high confidence; Figure S17: Chemical similarity index for best protein ligands showing similar SMILES format for the Oncograbinol Molecular against Doripenem; Table S1: All the Mutations showing deleterious effect in all 7 programs of PredictSNP (Bendl et al., 2014) [29] have been tabulated; Table S2: MMPBSA/MMGBSA analysis performed using the script MMPBSA.py module showing different energy contributions during the 100 ns molecular dynamics simulation for each of the four complexes; Table S3: Comparative Table for Wild type and mutated complexes along-with Dimer results.

Author Contributions

Conceptualization, M.A.; methodology, M.A.; software, M.A.; validation, M.A.; formal analysis, M.A.; resources, O.M.; data curation, O.M.; writing—original draft, O.M.; project administration, O.M. All authors have read and agreed to the published version of the manuscript.

Funding

This paper is a part of the approved research project funded by Dr. Nasser Al-Rasheed Chair for kidney failure diseases research, the Scientific Research Chairs at the University of Ha’il, Saudi Arabia (Project No. SCR-22 008). The authors would like to express their gratitude to the Scientific Research Chairs of the University of Ha’il, Saudi Arabia, for funding this study.

Data Availability Statement

All data generated or analyzed during this study are included in this published article and Supplementary Materials.

Conflicts of Interest

The authors declare no conflicts of interest.

References

  1. Patil, A.B.; Nadagir, S.D.; Lakshminarayana, S.A.; Fasiha, M.S. Morganella morganii, subspecies morganii, biogroup A: An unusual causative pathogen of brain abscess. J. Neurosci. Rural Pract. 2012, 3, 370–372. [Google Scholar] [CrossRef] [PubMed]
  2. Zaric, R.Z.; Jankovic, S.; Zaric, M.; Milosavljevic, M.; Stojadinovic, M.; Pejcic, A. Antimicrobial treatment of Morganella morganii invasive infections: Systematic review. Indian J. Med. Microbiol. 2021, 39, 404–412. [Google Scholar] [CrossRef] [PubMed]
  3. Liu, H.; Zhu, J.; Hu, Q.; Rao, X. Morganella morganii, a non-negligent opportunistic pathogen. Int. J. Infect. Dis. 2016, 50, 10–17. [Google Scholar] [CrossRef]
  4. Amini, M.; Motie, M.R.; Amel Jamehdar, S.; Kasraei, M.R.; Sobhani, M. Concomitant empyema and peritonitis with Morganella morganii in an immunocompetent patient: A case report. Casp. J. Intern. Med. 2021, 12, 232–235. [Google Scholar]
  5. Xiang, R.; Li, M. Identification of Tn6835 and a Novel Genomic Island, MMGI-1, in a Pan-Resistant Morganella morganii Strain. Antimicrob. Agents Chemother. 2021, 65, e02524-20. [Google Scholar] [CrossRef]
  6. Toleman, M.A.; Walsh, T.R. Combinatorial events of insertion sequences and ICE in Gram-negative bacteria. FEMS Microbiol. Rev. 2011, 35, 912–935. [Google Scholar] [CrossRef]
  7. Harada, S.; Ishii, Y.; Saga, T.; Kouyama, Y.; Tateda, K.; Yamaguchi, K. Chromosomal integration and location on IncT plasmids of the blaCTX-M-2 gene in Proteus mirabilis clinical isolates. Antimicrob. Agents Chemother. 2012, 56, 1093–1096. [Google Scholar] [CrossRef] [PubMed]
  8. Rojas, L.; Vinuesa, T.; Tubau, F.; Truchero, C.; Benz, R.; Viñas, M. Integron presence in a multiresistant Morganella morganii isolate. Int. J. Antimicrob. Agents 2006, 27, 505–512. [Google Scholar] [CrossRef] [PubMed]
  9. Shi, D.-S.; Wang, W.-P.; Kuai, S.-G.; Shao, H.-F.; Huang, M. Identification of bla KPC-2 on different plasmids of three Morganella morganii isolates. Eur. J. Clin. Microbiol. Infect. Dis. 2012, 31, 797–803. [Google Scholar] [CrossRef]
  10. Tsakris, A.; Ikonomidis, A.; Spanakis, N.; Poulou, A.; Pournaras, S. Characterization of In3Mor, a new integron carrying VIM-1 metallo-beta-lactamase and sat1 gene, from Morganella morganii. J. Antimicrob. Chemother. 2007, 59, 739–741. [Google Scholar] [CrossRef]
  11. Ramirez, M.S.; Nikolaidis, N.; Tolmasky, M.E. Rise and dissemination of aminoglycoside resistance: The aac(6′)-Ib paradigm. Front. Microbiol. 2013, 4, 121. [Google Scholar] [CrossRef] [PubMed]
  12. Lin, D.L.; Tran, T.; Adams, C.; Alam, J.Y.; Herron, S.R.; Tolmasky, M.E. Inhibitors of the aminoglycoside 6′-N-acetyltransferase type Ib [AAC(6′)-Ib] identified by in silico molecular docking. Bioorg. Med. Chem. Lett. 2013, 23, 5694–5698. [Google Scholar] [CrossRef] [PubMed]
  13. Wybenga-Groot, L.E.; Draker, K.; Wright, G.D.; Berghuis, A.M. Crystal structure of an aminoglycoside 6’-N-acetyltransferase: Defining the GCN5-related N-acetyltransferase superfamily fold. Structure 1999, 7, 497–507. [Google Scholar] [CrossRef] [PubMed]
  14. Neuwald, A.F.; Landsman, D. GCN5-related histone N-acetyltransferases belong to a diverse superfamily that includes the yeast SPT10 protein. Trends Biochem. Sci. 1997, 22, 154–155. [Google Scholar] [CrossRef] [PubMed]
  15. Huang, W.-H.; Kao, C.-C.; Mao, Y.-C.; Lai, C.-S.; Lai, K.-L.; Lai, C.-H.; Tseng, C.-H.; Huang, Y.-T.; Liu, P.-Y. Shewanella algae and Morganella morganii Coinfection in Cobra-Bite Wounds: A Genomic Analysis. Life 2021, 11, 329. [Google Scholar] [CrossRef] [PubMed]
  16. Fourmy, D.; Recht, M.I.; Blanchard, S.C.; Puglisi, J.D. Structure of the A site of Escherichia coli 16S ribosomal RNA complexed with an aminoglycoside antibiotic. Science 1996, 274, 1367–1371. [Google Scholar] [CrossRef] [PubMed]
  17. Mingeot-Leclercq, M.P.; Glupczynski, Y.; Tulkens, P.M. Aminoglycosides: Activity and resistance. Antimicrob. Agents Chemother. 1999, 43, 727–737. [Google Scholar] [CrossRef] [PubMed]
  18. Goh, E.-B.; Yim, G.; Tsui, W.; McClure, J.; Surette, M.G.; Davies, J. Transcriptional modulation of bacterial gene expression by subinhibitory concentrations of antibiotics. Proc. Natl. Acad. Sci. USA 2002, 99, 17025–17030. [Google Scholar] [CrossRef]
  19. Possoz, C.; Newmark, J.; Sorto, N.; Sherratt, D.J.; Tolmasky, M.E. Sublethal concentrations of the aminoglycoside amikacin interfere with cell division without affecting chromosome dynamics. Antimicrob. Agents Chemother. 2007, 51, 252–256. [Google Scholar] [CrossRef]
  20. Li, Y.; Green, K.D.; Johnson, B.R.; Garneau-Tsodikova, S. Inhibition of aminoglycoside acetyltransferase resistance enzymes by metal salts. Antimicrob. Agents Chemother. 2015, 59, 4148–4156. [Google Scholar] [CrossRef]
  21. Krause, K.M.; Serio, A.W.; Kane, T.R.; Connolly, L.E. Aminoglycosides: An Overview. Cold Spring Harb. Perspect. Med. 2016, 6, a027029. [Google Scholar] [CrossRef] [PubMed]
  22. Vong, K.; Auclair, K. Understanding and overcoming aminoglycoside resistance caused by N-6′-acetyltransferase. MedChemComm 2012, 3, 397–407. [Google Scholar] [CrossRef]
  23. Kelley, L.A.; Mezulis, S.; Yates, C.M.; Wass, M.N.; Sternberg, M.J.E. The Phyre2 web portal for protein modeling, prediction and analysis. Nat. Protoc. 2015, 10, 845–858. [Google Scholar] [CrossRef]
  24. Jumper, J.; Evans, R.; Pritzel, A.; Green, T.; Figurnov, M.; Ronneberger, O.; Tunyasuvunakool, K.; Bates, R.; Žídek, A.; Potapenko, A.; et al. Highly accurate protein structure prediction with AlphaFold. Nature 2021, 596, 583–589. [Google Scholar] [CrossRef]
  25. Zheng, Y.G. (Ed.) Epigenetic Technological Applications; Elsevier: Cham, Switzerland, 2015. [Google Scholar] [CrossRef]
  26. UniProt Consortium. The universal protein resource (UniProt). Nucleic Acids Res. 2008, 36, D190–D195. [Google Scholar]
  27. UniProt Consortium. UniProt: A hub for protein information. Nucleic Acids Res. 2015, 43, D204–D212. [Google Scholar] [CrossRef]
  28. The UniProt Consortium. UniProt: The universal protein knowledgebase. Nucleic Acids Res. 2017, 45, D158–D169. [Google Scholar] [CrossRef]
  29. Bendl, J.; Stourac, J.; Salanda, O.; Pavelka, A.; Wieben, E.D.; Zendulka, J.; Brezovsky, J.; Damborsky, J. PredictSNP: Robust and accurate consensus classifier for prediction of disease-related mutations. PLoS Comput. Biol. 2014, 10, e1003440. [Google Scholar] [CrossRef] [PubMed]
  30. Capriotti, E.; Calabrese, R.; Casadio, R. Predicting the insurgence of human genetic diseases associated to single point protein mutations with support vector machines and evolutionary information. Bioinformatics 2006, 22, 2729–2734. [Google Scholar] [CrossRef] [PubMed]
  31. Adzhubei, I.A.; Schmidt, S.; Peshkin, L.; Ramensky, V.E.; Gerasimova, A.; Bork, P.; Kondrashov, A.S.; Sunyaev, S.R. A method and server for predicting damaging missense mutations. Nat. Methods 2010, 7, 248–249. [Google Scholar] [CrossRef]
  32. Pauline, C.N.; Henikoff, S. Predicting deleterious amino acid substitutions. Genome Res. 2001, 11, 863–874. [Google Scholar]
  33. Sim, N.-L.; Kumar, P.; Hu, J.; Henikoff, S.; Schneider, G.; Ng, P.C. SIFT web server: Predicting effects of amino acid substitutions on proteins. Nucleic Acids Res. 2012, 40, W452–W457. [Google Scholar] [CrossRef] [PubMed]
  34. Johnson, A.D.; Handsaker, R.E.; Pulit, S.L.; Nizzari, M.M.; O’Donnell, C.J.; De Bakker, P.I. SNAP: A web-based tool for identification and annotation of proxy SNPs using HapMap. Bioinformatics 2008, 24, 2938–2939. [Google Scholar] [CrossRef] [PubMed]
  35. Mi, H.; Muruganujan, A.; Thomas, P.D. PANTHER in 2013: Modeling the evolution of gene function, and other gene attributes, in the context of phylogenetic trees. Nucleic Acids Res. 2013, 41, D377–D386. [Google Scholar] [CrossRef] [PubMed]
  36. Roy, A.; Kucukural, A.; Zhang, Y. I-TASSER: A unified platform for automated protein structure and function prediction. Nat. Protoc. 2010, 5, 725–738. [Google Scholar] [CrossRef] [PubMed]
  37. Yang, J.; Zhang, Y. I-TASSER server: New development for protein structure and function predictions. Nucleic Acids Res. 2015, 43, W174–W181. [Google Scholar] [CrossRef] [PubMed]
  38. Nielsen, M.; Lundegaard, C.; Lund, O.; Petersen, T.N. CPHmodels-3.0—Remote homology modeling using structure-guided sequence profiles. Nucleic Acids Res. 2010, 38, W576–W581. [Google Scholar] [CrossRef] [PubMed]
  39. Waterhouse, A.; Bertoni, M.; Bienert, S.; Studer, G.; Tauriello, G.; Gumienny, R.; Heer, F.T.; de Beer, T.A.P.; Rempfer, C.; Bordoli, L.; et al. SWISS-MODEL: Homology modelling of protein structures and complexes. Nucleic Acids Res. 2018, 46, W296–W303. [Google Scholar] [CrossRef] [PubMed]
  40. Krieger, E.; Joo, K.; Lee, J.; Lee, J.; Raman, S.; Thompson, J.; Tyka, M.; Baker, D.; Karplus, K. Improving physical realism, stereochemistry, and side-chain accuracy in homology modeling: Four approaches that performed well in CASP8. Proteins 2009, 77 (Suppl. S9), 114–122. [Google Scholar] [CrossRef]
  41. Lovell, S.C.; Davis, I.W.; Arendall, W.B.; de Bakker, P.I.W.; Word, J.M.; Prisant, M.G.; Richardson, J.S.; Richardson, D.C. Structure validation by Calpha geometry: Phi, psi and Cbeta deviation. Proteins 2003, 50, 437–450. [Google Scholar] [CrossRef]
  42. Carugo, O.; Djinovic-Carugo, K. Half a century of Ramachandran plots. Acta Crystallogr. Sect. D Biol. Crystallogr. 2013, 69, 1333–1341. [Google Scholar] [CrossRef] [PubMed]
  43. Wiederstein, M.; Sippl, M.J. ProSA-web: Interactive web service for the recognition of errors in three-dimensional structures of proteins. Nucleic Acids Res. 2007, 35, W407–W410. [Google Scholar] [CrossRef] [PubMed]
  44. Colovos, C.; Yeates, T.O. Verification of protein structures: Patterns of nonbonded atomic interactions. Protein Sci. 1993, 2, 1511–1519. [Google Scholar] [CrossRef] [PubMed]
  45. Eisenberg, D.; Lüthy, R.; Bowie, J.U. VERIFY3D: Assessment of protein models with three-dimensional profiles. Meth. Enzymol. 1997, 277, 396–404. [Google Scholar]
  46. Laskowski, R.A.; MacArthur, M.W.; Moss, D.S.; Thornton, J.M. PROCHECK: A program to check the stereochemical quality of protein structures. J. Appl. Crystallogr. 1993, 26, 283–291. [Google Scholar] [CrossRef]
  47. Kim, S.; Thiessen, P.A.; Bolton, E.E.; Chen, J.; Fu, G.; Gindulyte, A.; Han, L.; He, J.; He, S.; Shoemaker, B.A.; et al. PubChem Substance and Compound databases. Nucleic Acids Res. 2016, 44, D1202–D1213. [Google Scholar] [CrossRef]
  48. Kim, S.; Chen, J.; Cheng, T.; Gindulyte, A.; He, J.; He, S.; Li, Q.; Shoemaker, B.A.; Thiessen, P.A.; Yu, B.; et al. PubChem in 2021: New data content and improved web interfaces. Nucleic Acids Res. 2021, 49, D1388–D1395. [Google Scholar] [CrossRef]
  49. Morris, G.M.; Huey, R.; Lindstrom, W.; Sanner, M.F.; Belew, R.K.; Goodsell, D.S.; Olson, A.J. AutoDock4 and AutoDockTools4: Automated docking with selective receptor flexibility. J. Comput. Chem. 2009, 30, 2785–2791. [Google Scholar] [CrossRef]
  50. Adaptation in Natural and Artificial Systems. Available online: https://mitpress.mit.edu/9780262581110/adaptation-in-natural-and-artificial-systems/ (accessed on 12 December 2023).
  51. Huang, J.; MacKerell, A.D. CHARMM36 all-atom additive protein force field: Validation based on comparison to NMR data. J. Comput. Chem. 2013, 34, 2135–2145. [Google Scholar] [CrossRef]
  52. Humphrey, W.; Dalke, A.; Schulten, K. VMD: Visual molecular dynamics. J. Mol. Graph. 1996, 14, 33–38. [Google Scholar] [CrossRef]
  53. Berendsen, H.J.C.; van der Spoel, D.; van Drunen, R. GROMACS: A message-passing parallel molecular dynamics implementation. Comput. Phys. Commun. 1995, 91, 43–56. [Google Scholar] [CrossRef]
  54. Kutzner, C.; Páll, S.; Fechner, M.; Esztermann, A.; de Groot, B.L.; Grubmüller, H. More bang for your buck: Improved use of GPU nodes for GROMACS 2018. J. Comput. Chem. 2019, 40, 2418–2431. [Google Scholar] [CrossRef] [PubMed]
  55. Abraham, M.J.; Murtola, T.; Schulz, R.; Páll, S.; Smith, J.C.; Hess, B.; Lindahl, E. GROMACS: High performance molecular simulations through multi-level parallelism from laptops to supercomputers. SoftwareX 2015, 1–2, 19–25. [Google Scholar] [CrossRef]
  56. Carrascal, N.; Green, D.F. Energetic decomposition with the generalized-born and Poisson-Boltzmann solvent models: Lessons from association of G-protein components. J. Phys. Chem. B 2010, 114, 5096–5116. [Google Scholar] [CrossRef] [PubMed]
  57. Lee, M.C.; Yang, R.; Duan, Y. Comparison between Generalized-Born and Poisson-Boltzmann methods in physics-based scoring functions for protein structure prediction. J. Mol. Model. 2005, 12, 101–110. [Google Scholar] [CrossRef] [PubMed]
  58. Boutet, E.; Lieberherr, D.; Tognolli, M.; Schneider, M.; Bansal, P.; Bridge, A.J.; Poux, S.; Bougueleret, L.; Xenarios, I. UniProtKB/Swiss-Prot, the Manually Annotated Section of the UniProt KnowledgeBase: How to Use the Entry View. Methods Mol. Biol. 2016, 1374, 23–54. [Google Scholar] [PubMed]
  59. Gasteiger, E.; Hoogland, C.; Gattiker, A.; Duvaud, S.E.; Wilkins, M.R.; Appel, R.D.; Bairoch, A. Protein Identification and Analysis Tools on the ExPASy Server. In The Proteomics Protocols Handbook; Walker, J.M., Ed.; Humana Press: Totowa, NJ, USA, 2005; pp. 571–607. [Google Scholar] [CrossRef]
  60. Lüthy, R.; Bowie, J.U.; Eisenberg, D. Assessment of protein models with three-dimensional profiles. Nature 1992, 356, 83–85. [Google Scholar] [CrossRef] [PubMed]
  61. Bowie, J.U.; Lüthy, R.; Eisenberg, D. A method to identify protein sequences that fold into a known three-dimensional structure. Science 1991, 253, 164–170. [Google Scholar] [CrossRef] [PubMed]
  62. Bikadi, Z.; Hazai, E. Application of the PM6 semi-empirical method to modeling proteins enhances docking accuracy of AutoDock. J. Cheminform. 2009, 1, 15. [Google Scholar] [CrossRef]
  63. Forli, S.; Huey, R.; Pique, M.E.; Sanner, M.F.; Goodsell, D.S.; Olson, A.J. Computational protein-ligand docking and virtual drug screening with the AutoDock suite. Nat. Protoc. 2016, 11, 905–919. [Google Scholar] [CrossRef]
  64. Rizvi, S.M.D.; Shakil, S.; Haneef, M. A simple click by click protocol to perform docking: AutoDock 4.2 made easy for non-bioinformaticians. EXCLI J. 2013, 12, 831–857. [Google Scholar] [PubMed]
  65. Parvez, M.K.; Al-Dosari, M.S.; Ahmed, S.; Rehman, M.T.; Al-Rehaily, A.J.; Alajmi, M.F. Oncoglabrinol C, a new flavan from Oncocalyx glabratus protects endothelial cells against oxidative stress and apoptosis, and modulates hepatic CYP3A4 activity. Saudi Pharm. J. 2020, 28, 648–656. [Google Scholar] [CrossRef] [PubMed]
  66. Van Der Spoel, D.; Lindahl, E.; Hess, B.; Groenhof, G.; Mark, A.E.; Berendsen, H.J. GROMACS: Fast, flexible, and free. J. Comput. Chem. 2005, 26, 1701–1718. [Google Scholar] [CrossRef] [PubMed]
  67. Baig, M.H.; Sudhakar, D.R.; Kalaiarasan, P.; Subbarao, N.; Wadhawa, G.; Lohani, M.; Khan, M.K.A.; Khan, A.U. Insight into the effect of inhibitor resistant S130G mutant on physico-chemical properties of SHV type beta-lactamase: A molecular dynamics study. PLoS ONE 2014, 9, e112456. [Google Scholar] [CrossRef] [PubMed]
  68. Bawn, M.; Magliozzo, R.S. Molecular dynamics investigation of the role of residues D137 and S315 to INH binding in katg. BioRxiv 2018. [Google Scholar] [CrossRef]
  69. Lobanov, M.Y.; Bogatyreva, N.S.; Galzitskaya, O.V. Radius of gyration as an indicator of protein structure compactness. Mol. Biol. 2008, 42, 623–628. [Google Scholar] [CrossRef]
  70. Alazmi, M.; Motwalli, O. In silico virtual screening, characterization, docking and molecular dynamics studies of crucial SARS-CoV-2 proteins. J. Biomol. Struct. Dyn. 2021, 39, 6761–6771. [Google Scholar] [CrossRef]
  71. Motwalli, O.; Alazmi, M. Analysis of natural compounds against the activity of SARS-CoV-2 NSP15 protein towards an effective treatment against COVID-19: A theoretical and computational biology approach. J. Mol. Model. 2021, 27, 160. [Google Scholar] [CrossRef]
  72. Alazmi, M. Molecular basis of the beta-lactamase protein using comparative modelling, drug screening and molecular dynamics studies to understand the resistance of β-lactam antibiotics. J. Mol. Model. 2020, 26, 200. [Google Scholar] [CrossRef]
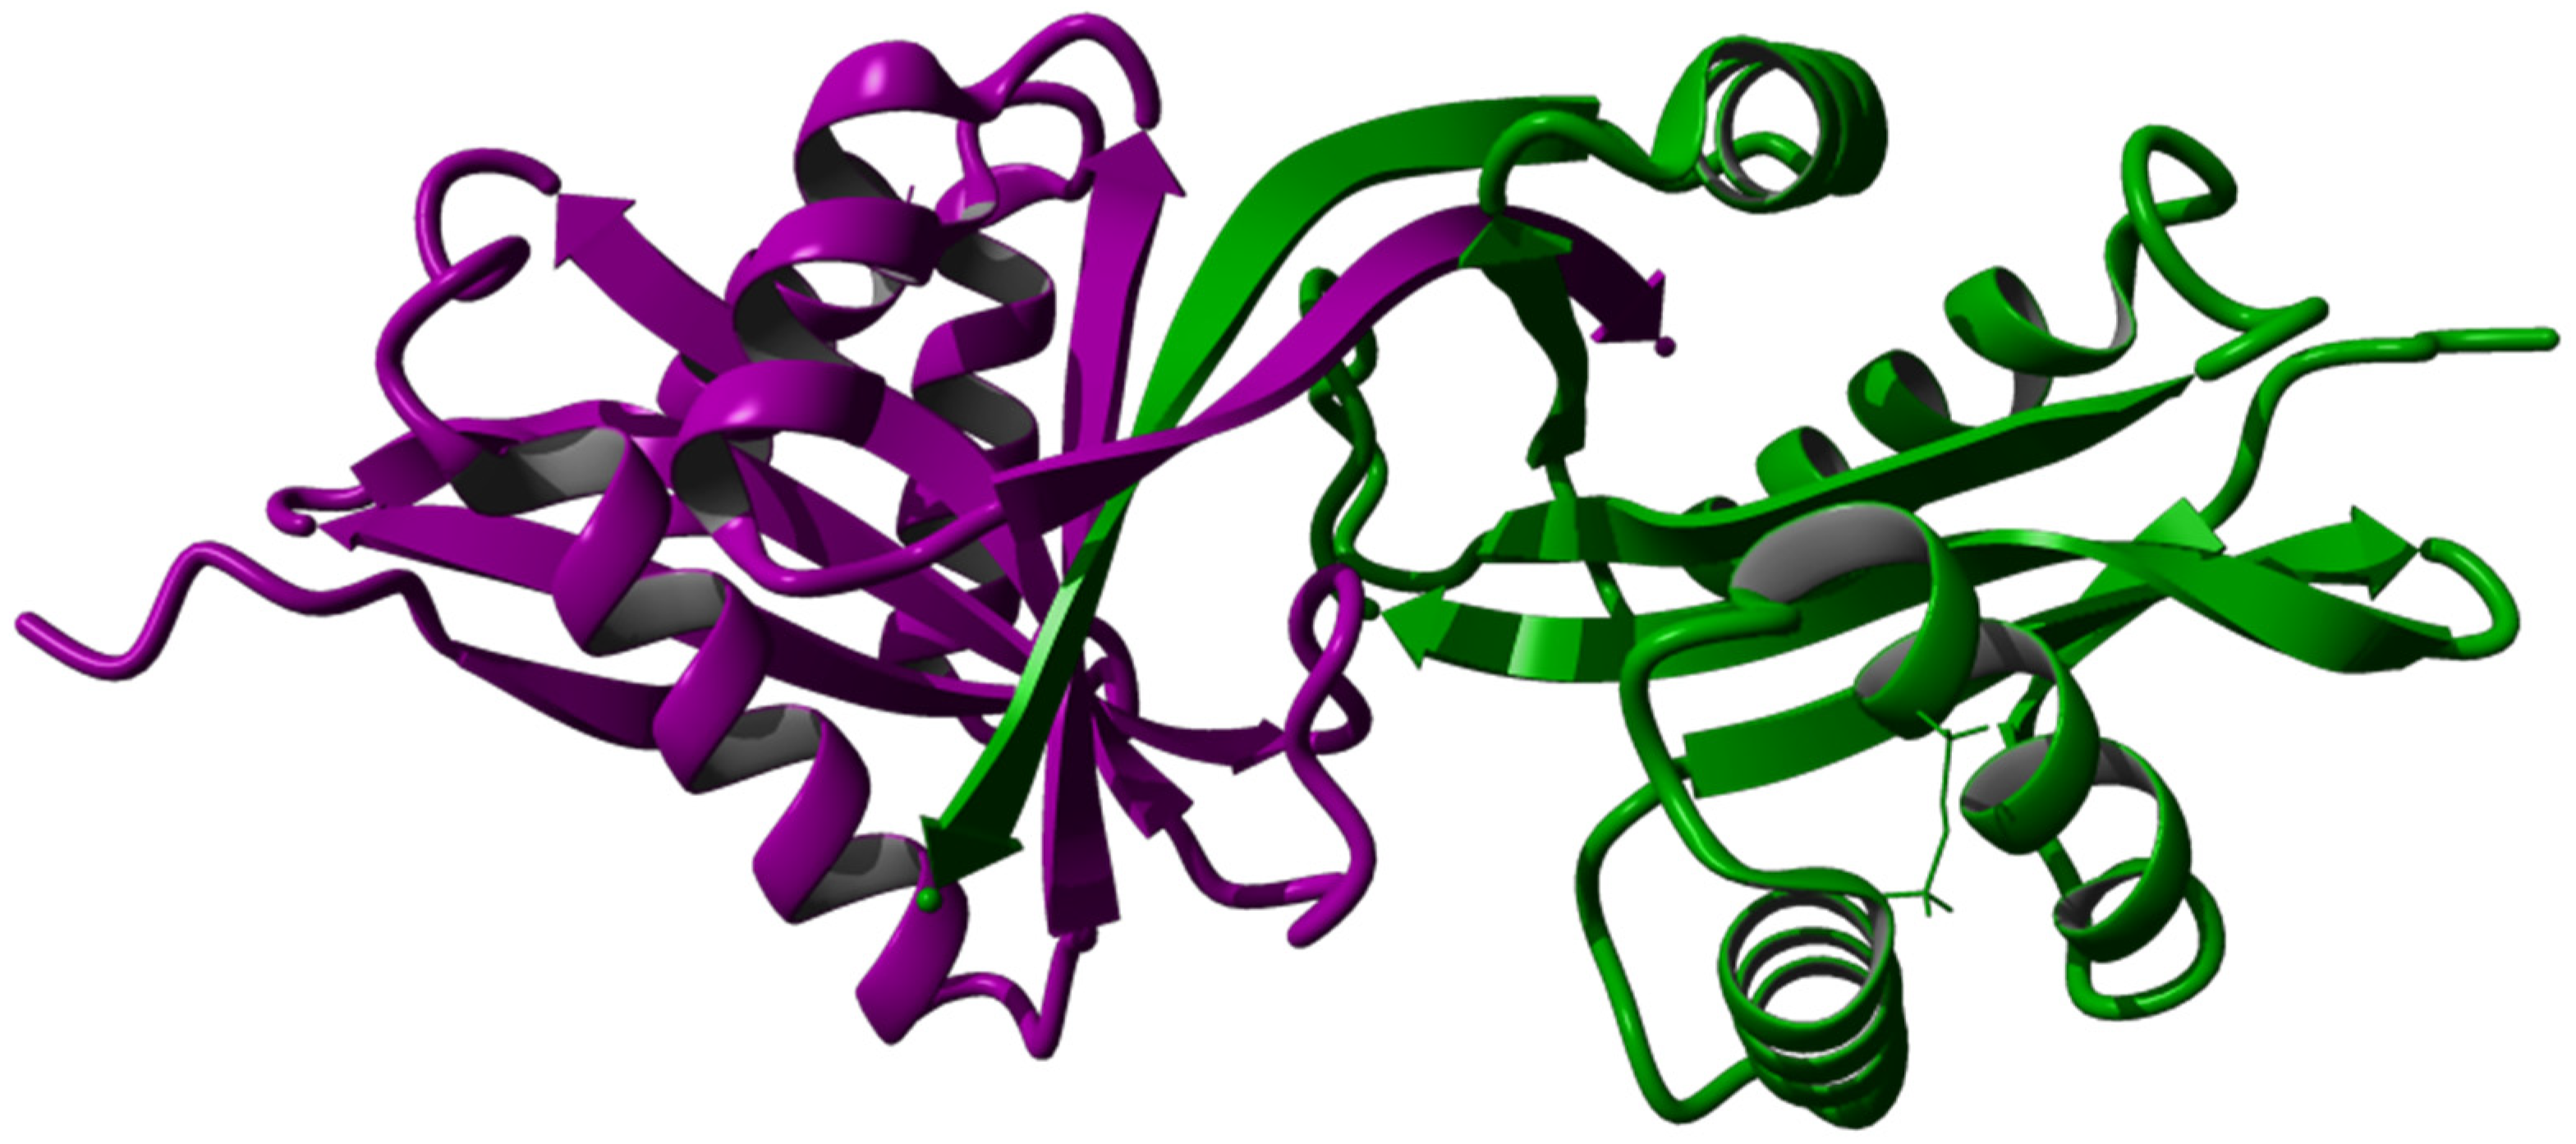
Figure 1. Modeled dimeric structure of AAC6_MORMO (aacA7) protein of M. morganii obtained from Alphafold2 deep learning structure prediction. Chain A is shown as a purple cartoon, while chain B is shown as a green cartoon.
Processes 12 01047 g001
Figure 2. Molecular docking of OncoglabrinolC with aacA7 protein. The aacA7 protein is represented by the blue cartoon and the ligand by the yellow stick (A). Two-dimensional ligand interaction profile on the (B).
Processes 12 01047 g002
Figure 3. Molecular docking of Doripenem with the aacA7 protein. The aacA7 protein is represented by the blue cartoon and the ligand by the yellow stick (A). Two-dimensional ligand interaction profile on the (B).
Processes 12 01047 g003
Figure 4. Potential energy (A) and free energy graph (B) obtained after 100 ns of the simulation run. An overall change in trajectory is negligible, showing the stable conformation throughout the run.
Processes 12 01047 g004
Figure 5. RMSD (A) and RMSF (B) graphs for WT and mutated complexes of OncoglabrinolC (green and blue) and Doripenem (black and red), respectively.
Processes 12 01047 g005
Figure 6. Hydrogen bonding pattern for intra-protein (A) and protein-water (B) interfaces.
Processes 12 01047 g006
Figure 7. SASA plot (A) and radius of gyration plot (B) for WT and mutated aacA7 protein in complex with OncoglabrinolC and Doripenem drug molecules.
Processes 12 01047 g007
Figure 8. Results of essential dynamics for wild and mutated complexes of aacA7 with OncoglabrinolC and Doripenem drug candidates.
Processes 12 01047 g008
Table 1. Various physicochemical properties of AAC6_MORMO (Q15BH7) from M. morganii were predicted using the Expasy Protparam tool [59].
ParametersPredicted Value
Molecular weight16,376.45
Theoretical pI5.1
Number of positive residues13
Number of negative residues18
Half-life mammalian reticulocytes (in vitro)30 h
Half-life yeast (in vivo)>20 h
Half-life E. coli (in vivo)>10 h
Extinction coefficient26,720
Instability index40.17
Aliphatic index77.76
GRAVY index0.059
Table 2. Structure validation of homology models as obtained from various web servers.
Modeling ServersProcheckVeryify %Errat %Template Used
Ramachandran Plot (% Residues)Bad ContactsG-FactorResidues
Favored Region (%)Additional Allowed
Regions (%)
Generously Allowed
Regions (%)
Disallowed Regions (%)
I-Tasser77.917.61.53.10-15275.6684.325hmn.1A
Phyre2 server
(intensive mode)
90.87.60.80.85-15278.2979.41C4e8o.1B
D1s3z.1A
Swiss modeling92.17.10.80.00-14685.6294.354E8O.1A
Alphafold292.05.62.40.01-15288.1988.191s3zb.1B
Table 3. Molecular docking results of aacA7 protein and 21 drug molecules of our choice. Binding energy, inhibition constant, and interacting residues are shown clearly.
LigandStructureMol. Wt. (g/mol)xLogPBinding Energy (kcal/mol)Binding Energy (Kj/mol)Inhibition
Constant (nM)
Polar ContactsNon-Polar
Contacts
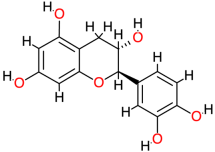
OncoglabrinolCProcesses 12 01047 i001556.311-−12.82−53.630.40Phe119, Val145, Thr140Ala120, Val142, His134, Phe139, Cys77, Leu125, Leu135, Ser121,
DoripenemProcesses 12 01047 i002420.50.84−10.28−43.0129.23Gln124, Asn127, Trp88, Arg71Asp122, Glu86, Trp6
SilymarinProcesses 12 01047 i003482.42.4−9.88−41.3357.7Thr140, Gly138, Glu108, Thr123Ala120, Ser121, Val142, Asp122, Cys77, Phe139
SilibininProcesses 12 01047 i004482.42.4−9.86−41.2559.31Thr140, Gly138, Glu108, Thr123Ala120, Ser121, Val142, Cys77, Phe139
MalvidinProcesses 12 01047 i005331.3-−7.78−32.551970Ala133, Arg96Ala94, Gly100, Ala137
TetracyclineProcesses 12 01047 i006444.4−2−8.87−37.11316.66Val145, Thr123, Glu76, Glu75Leu125
BerberineProcesses 12 01047 i007336.43.6−8.55−35.77540.44Thr140Val142, Phe119, Glu118, Ala120, Ser121, His134, Asp122, Thr123
TaxifolinProcesses 12 01047 i008304.31.5−7.3−30.544460Glu141, Ser121, Val145Leu125
CyanidinProcesses 12 01047 i009287.2-−7.78−32.551970Thr123, Thr140, Val145Leu125
CatechinProcesses 12 01047 i010290.30.4−7.84−32.801790Thr123, Thr140, Val145Leu125
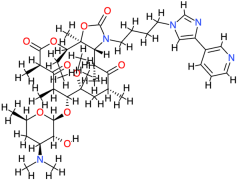
TelithromycinProcesses 12 01047 i011812.04.2−7.27−30.414710Glu86, Leu125Phe84, Cys147, Thr123, Asp122
RelacinProcesses 12 01047 i012653.6−2.4−8.74−36.56389.94Glu86, Gln124, Cys147Trp26, Asp122, Arg146
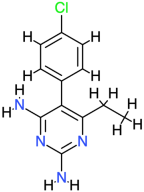
PyrimethamineProcesses 12 01047 i013248.72.7−7.47−31.253360Cys77, Glu118, Thr140Ala120, His134, Val142
DoxycyclineProcesses 12 01047 i014444.4−0.7−9.28−38.82157.63Glu75, Thr117, Glu118, Phe119, Thr140Cys77, Ala120, Gly138, Phe139, Val142
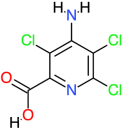
PicloramProcesses 12 01047 i015241.52.2−5.27−22.04136,840Ala94, Gln97, Val101, Gly98, Arg96Trp88, Arg95, Val90, Ala136, Ala133, Gly100, Val99
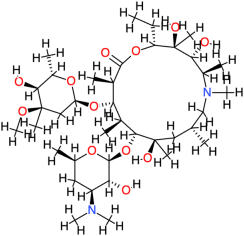
AzithromycinProcesses 12 01047 i016749.04−8.86−37.07319.06Cys147Asp122, Glu75, Phe84, Val145, Ser121, His134, Thr123, Leu125, Arg146
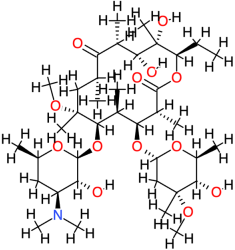
ErythromycinProcesses 12 01047 i017733.92.7−5.7−23.8466,170Asp122, Arg149Cys147, Glu76, Ala143, Val145
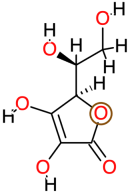
Ascorbic AcidProcesses 12 01047 i018176.1−1.6−4.83−20.20288,630Gln97, Val99, Gly100, Val101Val90, Arg95, Arg96
ClarithromycinProcesses 12 01047 i019748.03.2−6.34−26.5222,500Thr123, Ala143Glu86, Asp122, Gln124, Leu125, Cys147
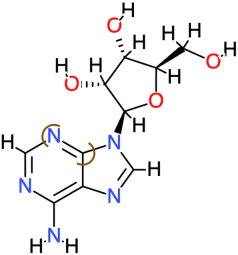
AdenosineProcesses 12 01047 i020267.2−1.1−4.97−20.79226,220Phe119, Val142, Ala143Ala120, Thr123
RoxithromycinProcesses 12 01047 i021837.03.1−4.77−19.95320,270Leu125, Cys147Asp122, Gln124, Arg146, Arg149
Table 4. Oral toxicity prediction results for input compound.
LigandTotal Polar Surface Area (TPSA)Predicted LD50Predicted Toxicity ClassPrediction Accuracy (%)Toxicity Model Prediction
OncoglabrinolC223.672170576.33Nephrotoxicity, Respiratory toxicity, Cardiotoxicity, Immunotoxicity, Nutritional Toxicity
Doripenem195.745000569.26Nephrotoxicity, Respiratory toxicity, Clinical Toxicity
Silymarin155.142000469.33Nephrotoxicity, Respiratory toxicity, Cardiotoxicity, Immunotoxicity, BBB-barrier, Nutritional Toxicity
Silibinin155.142000469.26Nephrotoxicity, Respiratory toxicity, Cardiotoxicity, Immunotoxicity, Nutritional Toxicity
Malvidin112.525000569.26Nephrotoxicity, Respiratory toxicity, Cardiotoxicity, Immunotoxicity, BBB-barrier, Nutritional Toxicity
Tetracycline181.624400468.07Hepatotoxicity, Respiratory toxicity, Immunotoxicity, Clinical toxicity, Nutritional Toxicity
Berberine40.8200367.38Neurotoxicity, Respiratory toxicity, Carcinogenicity, Immunotoxicity, Mutagenicity, Cytotoxicity, BBB-barrier, Ecotoxicity
Taxifolin127.4520004100Nephrotoxicity, Respiratory toxicity, Carcinogenicity, Mutagenicity, BBB-barrier, Nutritional Toxicity
Cyanidin114.295000569.26Nephrotoxicity, Respiratory toxicity, Carcinogenicity, BBB-barrier, Nutritional Toxicity
Catechin110.3810,0006100Nephrotoxicity, Respiratory toxicity, BBB-barrier, Clinical toxicity, Nutritional toxicity
Telithromycin171.85300354.26Hepatotoxicity, Neurotoxicity, Nephrotoxicity, Respiratory toxicity, Immunotoxicity, Clinical Toxicity, Nutritional toxicity
Relacin311.363000567.38Neurotoxicity, Nephrotoxicity, Respiratory toxicity, Clinical Toxicity
Pyrimethamine77.82923100Neurotoxicity, Respiratory toxicity, BBB-Barrier, Ecotoxicity, Clinical Toxicity
Doxycycline181.622240468.07Hepatotoxicity, Respiratory toxicity, Immunotoxicity, Clinical toxicity
Picloram76.216864100Hepatotoxicity, Neurotoxicity, Nephrotoxicity, Mutagenicity, BBB-Barrier, Clinical toxicity
Azithromycin180.0820004100Neurotoxicity, Nephrotoxicity, Respiratory toxicity, Immunotoxicity, Clinical toxicity
Erythromycin193.9120004100Hepatotoxicity, Neurotoxicity, Nephrotoxicity, Respiratory toxicity, Immunotoxicity, Clinical toxicity
Vitamin C107.2233675100BBB-barrier, Clinical toxicity, Nephrotoxicity
Clarithromycin182.9112304100Hepatotoxicity, Neurotoxicity, Nephrotoxicity, Respiratory toxicity, Immunotoxicity, Clinical toxicity
Adenosine139.5482100Neurotoxicity, Respiratory toxicity, Cytotoxicity, BBB-barrier
Roxithromycin216.893.0042100Hepatotoxicity, Blood–brain barrier
Disclaimer/Publisher’s Note: The statements, opinions and data contained in all publications are solely those of the individual author(s) and contributor(s) and not of MDPI and/or the editor(s). MDPI and/or the editor(s) disclaim responsibility for any injury to people or property resulting from any ideas, methods, instructions or products referred to in the content.