Article

Research of the Influence of Lateral Inflow Angles on the Cavitation Flow and Movement Characteristics of Underwater Moving Objects

National-Provincial Joint Engineering Laboratory for Fluid Transmission System Technology, Zhejiang Sci-Tech University, No. 2 Street, Hangzhou 310018, China
*
Author to whom correspondence should be addressed.
Processes 2024, 12(6), 1051; https://doi.org/10.3390/pr12061051
Submission received: 22 April 2024 / Revised: 16 May 2024 / Accepted: 19 May 2024 / Published: 21 May 2024
(This article belongs to the Section Advanced Digital and Other Processes)

Abstract

:
This study examined the multi-phase flow field for a single object and two parallel/series objects under different incoming angles of lateral flow. The volume of fluid model, the Sauer–Schnerr cavitation model, and the six degrees of freedom (DOF) method were adopted to consider simulations of multi-phase flow, phase change, and object movement, respectively. The results show that, for a single object, the degree of asymmetry in the cavity profile depends on the component (the z-component) of the lateral inflow velocity in the direction perpendicular to the initial velocity of the object. As this component increases, the asymmetry of the cavity increases. The cavity length is related to the relative axial speed between the object and the water. For parallel objects, the cavity asymmetry is determined by the superimposed influence of the z-component of the lateral incoming speed and the high-pressure zone induced by the nearby object. The object located downstream relative to the lateral flow has a stronger cavity asymmetry than that of the upstream object, and the trajectory of the downstream object is more easily deviated than that of the upstream object. For tandem objects, with the increase in the lateral incoming angle, the supercavity length increases after the rear object enters into the front cavity. With the increase in the z-component of the lateral flow velocity, the deviation speed increases.

1. Introduction

For an object moving rapidly in water, cavitation will occur when the pressure near the object’s surface is lower than the local saturated vapor pressure. When a cavity envelops the entire object, the phenomenon is known as supercavitation. The drag force acting on underwater moving objects can be reduced by 90% [1] using supercavitation technology. Therefore, it is important to explore the cavitation phenomenon and supercavitation technology to improve the performance of various objects in different applications. Supercavitating ships and missiles are examples of how this technology has been applied to enhance the capabilities of underwater transportation and weaponry. By furthering our understanding of cavitation and its control mechanisms, researchers can continuously innovate and develop advanced technologies for a wide range of applications.
The theoretical basis for the supercavitation computation that can be applied in the designing of high-speed torpedoes, high-velocity objects and so on, was laid by Logvinovich [2]. Based on the principle of independent expansion, Vasin [3] proposed an approach to solve the unsteady pressure inside cavities considering the effect of gravity. Aristoff and Bush [4], building upon the potential flow theory and the equilibrium theory of cavitation pressure, developed a theoretical method for solving cavity profiles. By comparison with experimental data, the accuracy of the theoretical solution was proved.
In the study of Savchenko et al. [5], three sets of supercavitation experimental devices were reported, in which a wide velocity scope for objects from 50 to 1300 m/s could be obtained. Hrubes [6] experimentally investigated the supercavitation flow of objects at 1100 m/s and observed significant impact loading with cavity collapse.
Burkin et al. [7] developed a procedure to simulate the flow field of supercavitating kinetic strikers moving underwater at speeds ranging from subsonic to supersonic. They carried out an experimental investigation, ensuring their stable movement.
Using a combination of the six degrees of freedom model for rigid body motion and overset grids, Nguyen et al. [8] numerically simulated the motion of three-dimensional objects entering water. They analyzed temperature changes and shockwaves in the supercavitation flow, concluding that with the increase in the velocity of supersonic objects, the increased pressure and temperature may soften and damage objects.
Recently, many studies considering the effect of surface characteristics have been carried out [9,10,11]. Jia et al. [12] examined the influence of surface wettability on the supercavitation process and found that, under the same conditions, the supercavitation size around a hydrophobic surface was significantly bigger than that around a hydrophilic surface. Moreover, the hydrophobic object was more stable in terms of ballistics in comparison to the hydrophilic one.
While the aforementioned studies focused on a single object, the evolution of supercavitation will be different when two objects are fired in parallel or successively [13,14,15]. Xu et al. [16] numerically determined the evolution of wake vortexes and the interaction between vortexes and objects under varying speeds and emission sequences. Their research identified two vortex patterns (counter-rotating vortex pairs and vortex rings) in wakes.
Ishchenko et al. [17] carried out experiments in which multi-strikers were simultaneously fired into water and demonstrated the possibility that the multi-strikers could reach the same target. Yun et al. [18] experimentally studied two spheres sequentially entering water and observed a “multi-section cavity” behind the rear sphere after deep sealing occurred. Using numerical simulations, Zhou et al. [19] simulated the entry and exit of two series objects into water and observed a disturbance in the cavity boundary when the rear object entered into the front cavity. Qi et al. [20] numerically investigated the supercavitating flow produced by two objects moving side by side in water and found that it is easier to form supercavitation around two parallel objects compared to a single one.
The studies described above were made in calm water without considering the effect of lateral flow. According to Yu et al. [21], numerical methods were employed to investigate the water-entry process of parallel objects, taking into account the effects of lateral flow. They found that if lateral flow speeds are relatively low, object heads come close to each other, while the object tails are close to each other under a relatively higher speed of lateral flow.
Adopting Open Field Operation and Manipulation (FOAM), Wang et al. [22] investigated the influences of lateral flows on the development of supercavities. They found that as the main flow speed increases, the influence of lateral flow is weakened. Here, it should be pointed out that the simulation did not account for the velocity decay of the object.
Previous studies have not considered the lateral flow effect, velocity decay and the deflection of objects together. Considering the influence of lateral flow speeds, Zhang et al. [23] investigated the supercavitation flow for objects moving underwater in parallel and in series. In this research, the velocity decay of objects was considered, but the effect of lateral inflow angles was not taken into consideration.
Up to now, most studies on supercavitation objects moving underwater have been carried out in calm water. Related research considering the effect of lateral flow is scarce. Studies considering the velocity decay and trajectory deflection of moving object are even fewer. In this paper, considering the velocity decay and trajectory deflections of objects, the influences of lateral incoming angles on supercavitation flows for a single object and two parallel or tandem objects are investigated. The effects of lateral inflow angles on the cavitation flow and the movement characteristics of moving objects are analyzed and discussed.
In this paper, the second section introduces the control equations and the numerical methods. The third section details the verification of mesh independence and the performance of the numerical models. Subsequently, in the fourth section, the simulation results are presented and analyzed. Conclusions are drawn in the last section.

2. Governing Equations and Numerical Methods

In the models in this paper, the object velocity is set to be high enough for cavitation to occur, that is, liquid water and water vapor exist simultaneously in the flow field. Thus, the flow field is a two-phase flow. In the study, the two-phase flow is modeled by the volume of fluid (VOF) model. In this multi-phase model, different phases are treated as a mixed phase of a single fluid medium. Equations (1) and (2) give the equations for the continuity and momentum, respectively.
ρ m t + ( ρ m u i ) x i = 0
( ρ m u i ) t + ( ρ m u i u j ) x j = p x i + x j [ ( μ m + μ t ) ( u i x j + u j x i 2 3 δ i j u k x k ) ] + F i
where ρm is the mixed-phase density and is calculated by Equation (3); p denotes the pressure; ui, uj and uk are the mixed-phase velocity components in the i-, j- and k-directions, respectively; t represents the time; xi is the coordinate in the x-direction; μm is the molecular dynamic viscosity of the mixture and is expressed by Equation (4); μt is the turbulent dynamic viscosity of the mixture and is obtained by the turbulence model used in this study; δij is the Kronecker symbol; and Fi refers to the body force component in the j-direction.
ρ m = α v ρ v + α l ρ l
μ m = α v μ v + α l μ l
where α, ρ and μ refer to the volume fraction, the density and the dynamic viscosity, respectively, and the subscripts v, l and m denote the water vapor, the liquid phase and the mixed phase, respectively.
The turbulent flow field was simulated by the Reynolds Number Group (RNG) κ-ε turbulence model [24]. The governing equations for the dissipation rate and the turbulent kinetic energy are given in Equations (5) and (6), respectively.
( ρ m κ ) t + ( ρ m κ u i ) x i = x j ( a κ μ e f f κ x j ) + G κ ρ m ε
( ρ m ε ) t + ( ρ m ε u i ) x i = x i ( a ε μ e f f ε x j ) + C 1 ε ε κ G κ C 2 ε ρ m ε 2 κ
In the above equations, κ and ε represent the turbulent kinetic energy and the dissipation rate, respectively; aκ and aε denote the Prandtl numbers of the negative effects of κ and ε, respectively; Gκ is the generation term of κ; C and C are the empirical constants of κ and ε, respectively; and μeff = μm + μt.
The water cavitation in this paper was simulated by the cavitation model proposed by Schnerr and Sauer [25]. The general form of its equation can be written as in Equation (7).
t ( α v ρ v ) + ( α v ρ v u v i ) x i = R e R c
where uvi denotes the velocity component of the water vapor in the i-direction and Re and Rc represent the rates of evaporation and condensation, respectively, and are given in Equations (8) and (9), respectively.
R e = ρ v ρ l ρ m α v ( 1 α v ) 3 r B 2 3 ( p v p ρ l ) , p v > p
R c = ρ v ρ l ρ m α v ( 1 α v ) 3 r B 2 3 ( p p v ρ l ) , p v < p
where rB denotes the gas core radius and pv is the saturated water vapor pressure.
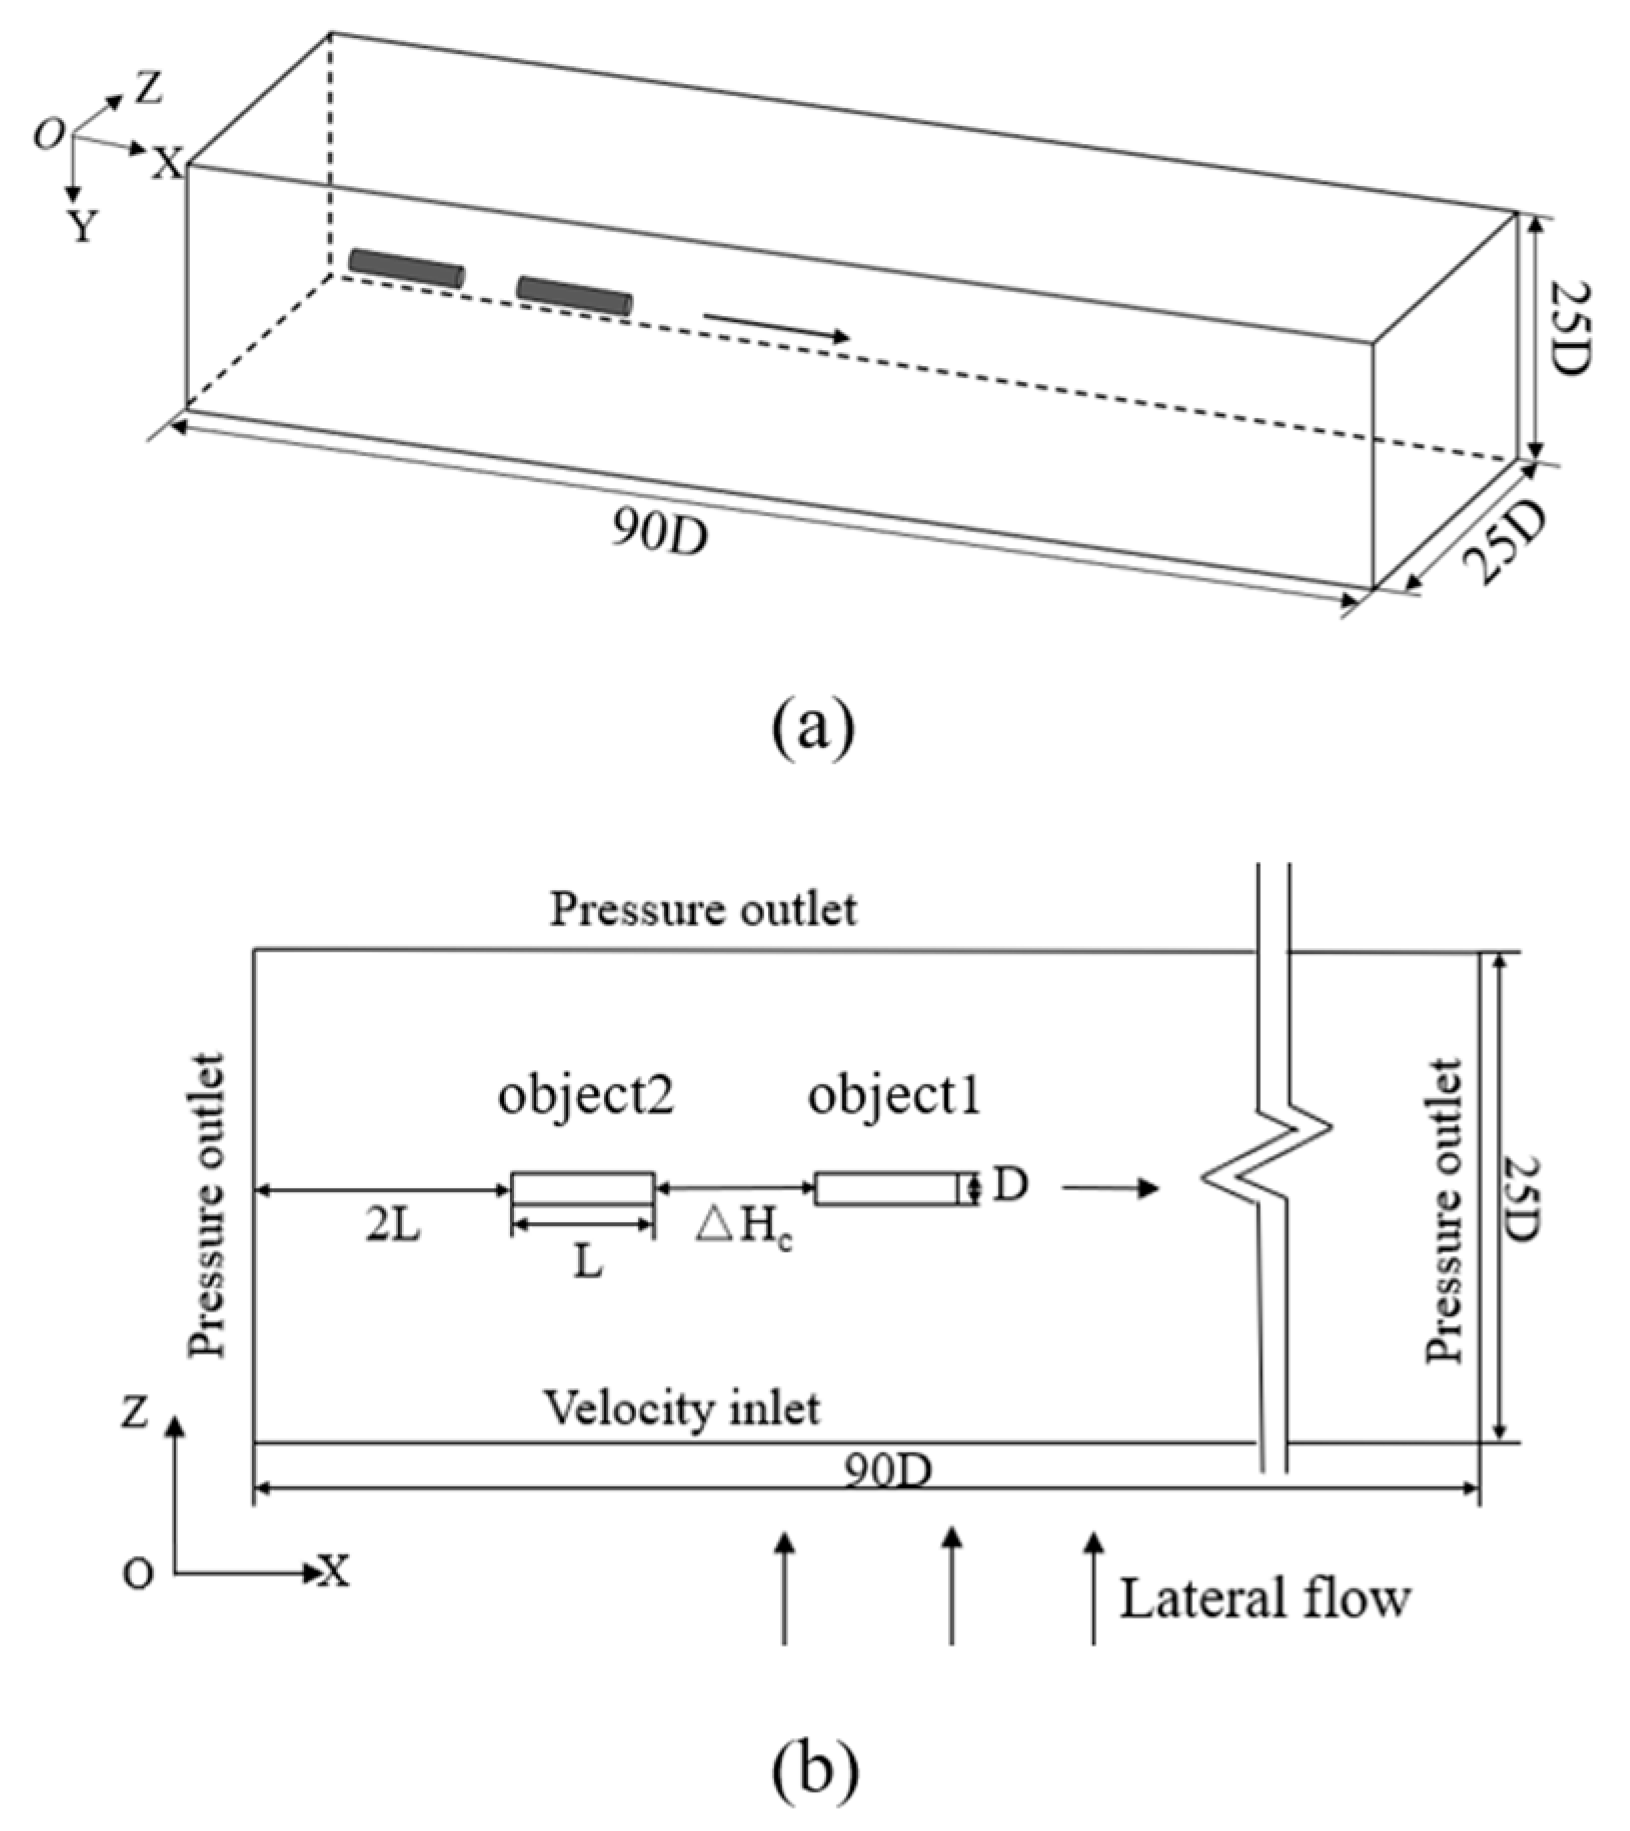
In this paper, a cylinder with a length of 36 mm, a diameter of 6 mm and a mass of 2.63 g was used as the physical object model. Figure 1 shows a diagrammatic sketch of the calculation area and the boundary conditions for a single object. The size of the calculation domain is 90D × 25D × 25D, which is a rectangular cuboid area. Initially, the object moves forward in the x-direction with a velocity of 70 m/s. The computational domain is taken to be sufficiently big for the boundary effects to be avoided. In addition, the calculation area can also satisfy the requirements for the object’s movement and deflection. The set of boundary conditions are given in Figure 1b. The boundary condition of the object’s wall was set as a no-slip wall. The lower part (in Figure 1b) or front side (in Figure 1a) was set as a velocity inlet, and the others were designated as pressure outlets.
The calculation domains and the boundary conditions for the parallel and series objects are the same as those for the single object, which are given in Figure 2 and Figure 3, respectively. The distances between the parallel and tandem objects are D and 6D, respectively. The initial velocities for the two parallel and series objects are the same: 80 m/s.
Structured grids were adopted in the whole computational domain. Near the object wall, the mesh was refined. The object movement in the computational domain was fulfilled by overlapping grids and six degrees of freedom (DOF) technology. The mesh in a 2D view is shown in Figure 4. The maximal distance between the first grid point and the object wall is about 3 × 10⁻⁵ m, and, correspondingly, the range of the y+ value is about 30 to 150.
When using the 6DOF rigid body motion equations to solve the motion of an object, the motion of the object is divided into translation along three centers of mass (x, y and z) and rotation around three axes (x, y and z). In an inertial reference frame, the control equation for the translational motion of the object is as follows:
d V d t = 1 m F
where V is the velocity vector of the object’s center-of-mass translation motion, m represents the mass of the object and F is the vector of the external forces acting on the object. The rotational control equation for the object in the coordinate system is as follows:
d ω d t = I 1 M ω × I ω
where ω is the angular velocity vector of the object, M stands for the vector of external moments acting on the object and I denotes the inertia tensor of the object.
The mesh in the whole calculation area is called the background mesh. The component meshes for the single object and the parallel objects are the zones around the single object (Figure 4a) and around the two parallel objects (Figure 4b), respectively. In Figure 4c, there are two component grids. In the overlapping parts between the component grid(s) and background grid, the data are exchanged by interpolating between grids. For the sake of data exchange accuracy, the background grid is refined in the overlapping region to match the size of the component grid.
The coupled algorithm was adopted for solving the pressure and velocity. For the space discretization of the pressure field, the scheme of the Poisson Pressure Equation with a SIMPLE Truncation Option (PRESTO!) [26] was selected. Modified High-Resolution Interface Capturing (HRIC) [27] was adopted to handle the interface of the phase volume rate. A first-order implicit scheme for time discretization was used. The time step in the numerical simulation was 1 × 10⁻⁶ s. For each time step, the maximum iteration count was set to 20. Additionally, convergence was considered to be achieved when the residual of the continuity equation was less than 1 × 10⁻³ and the residuals of the other terms were less than 1 × 10⁻⁶.

3. Verification of Mesh Independence and Numerical Models

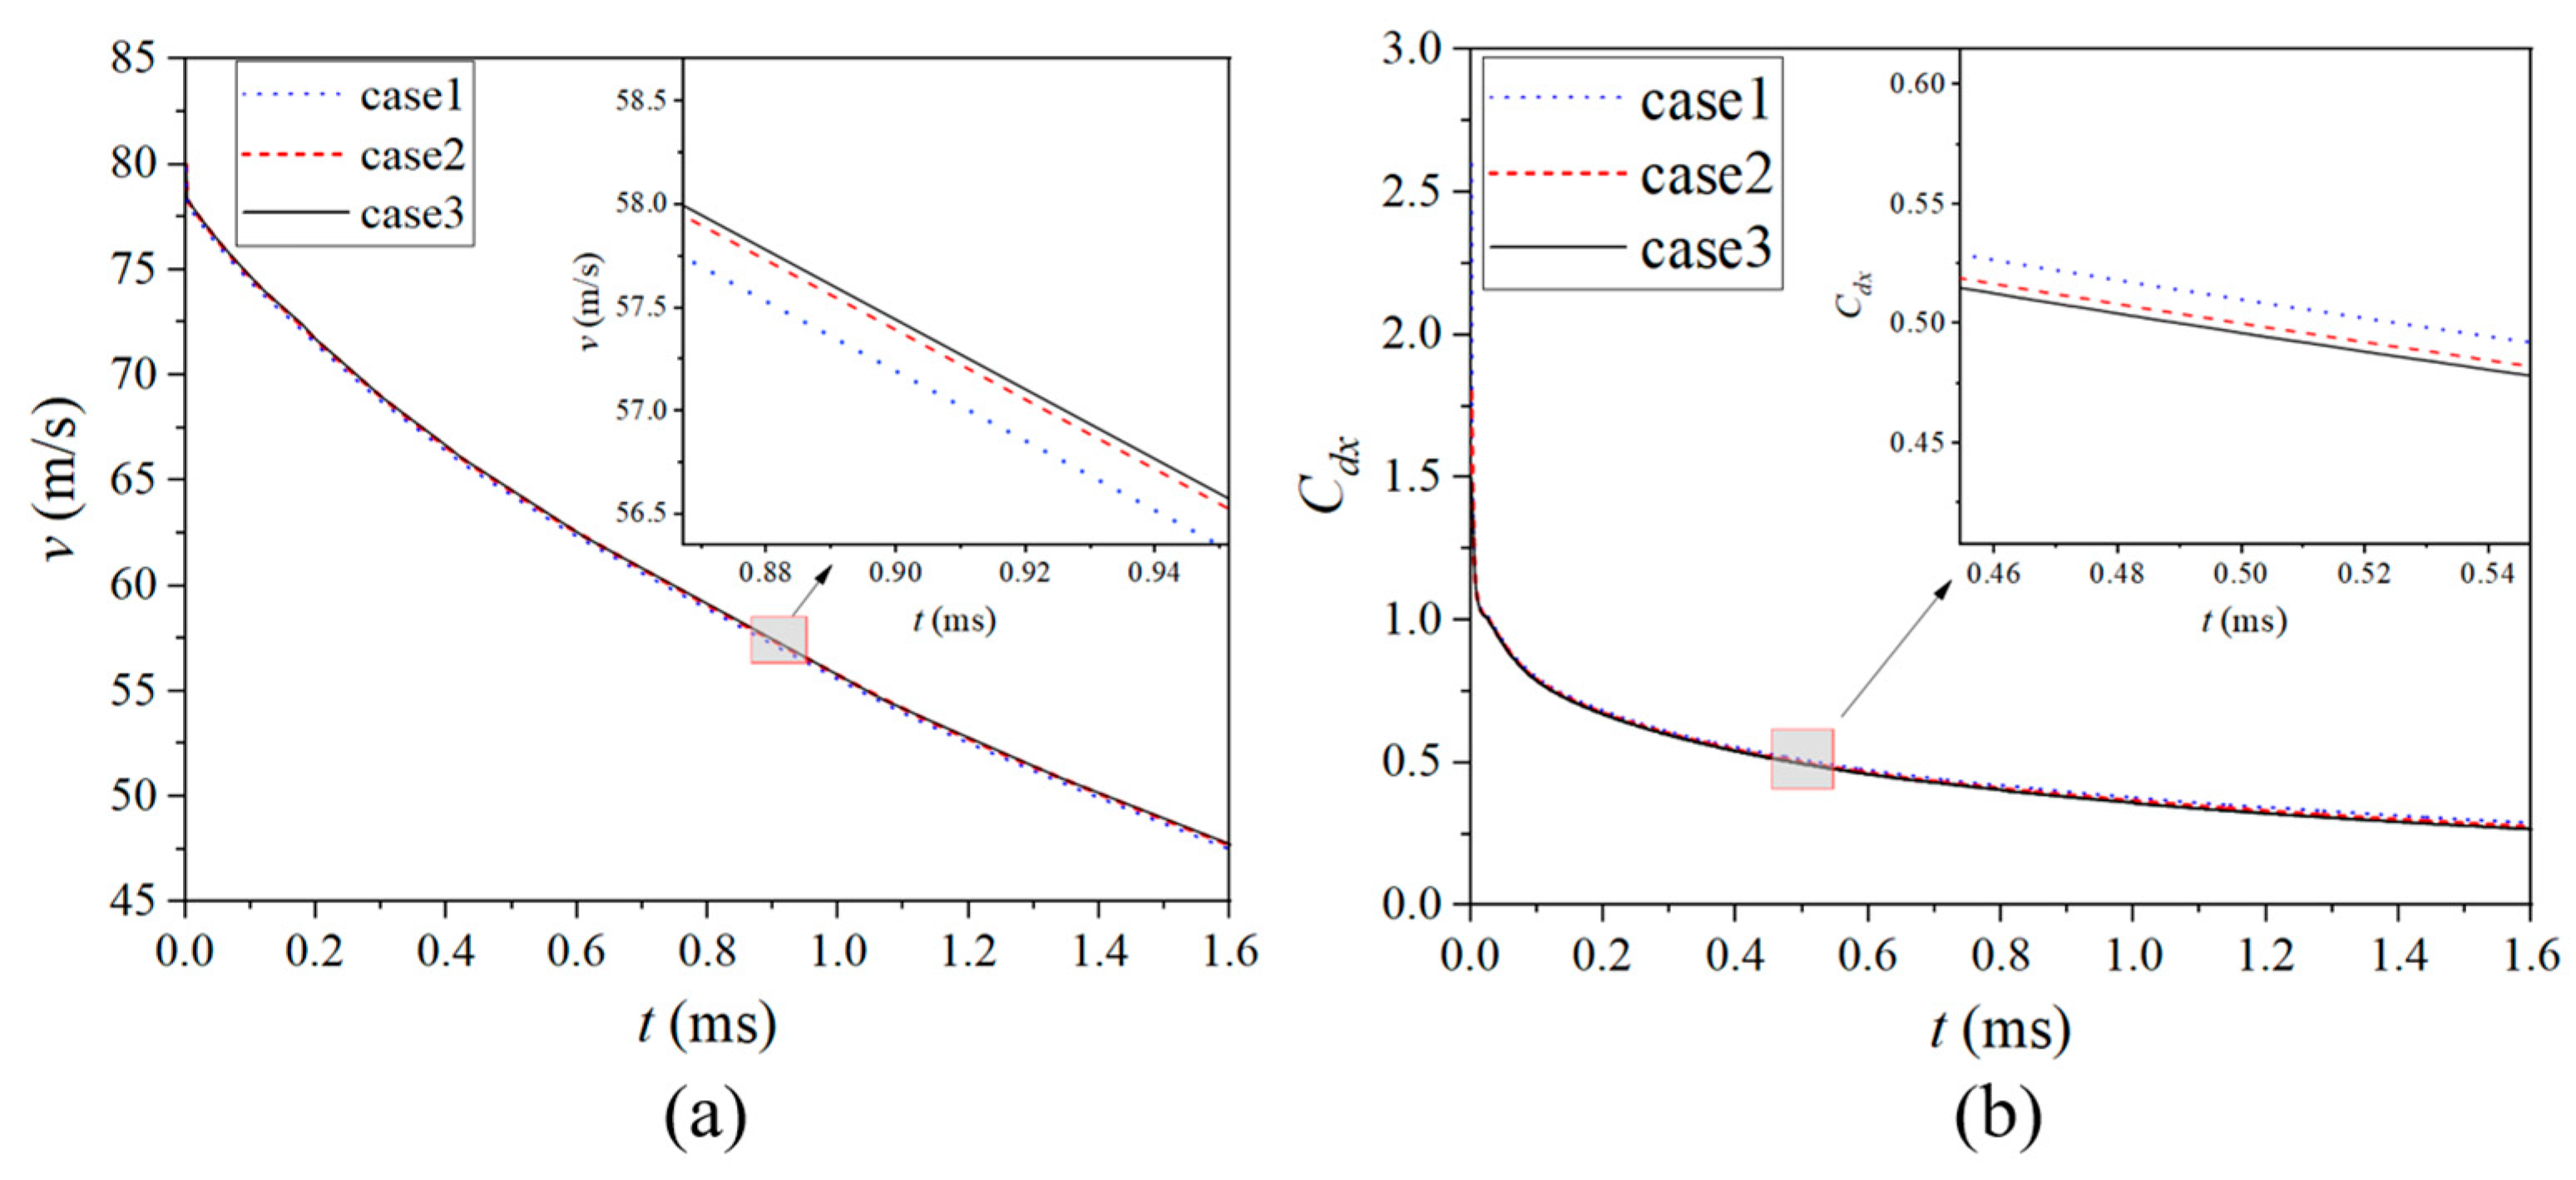
To verify the grid independence, three sets of meshes were used to simulate the underwater movement of a single object. The mesh numbers were 0.6 million, 1.4 million and 1.8 million, marked as cases 1–3, respectively. The speed change of the mass center of the object and the drag coefficient in the x-direction (the object’s motion was in the x-direction) with time were obtained and compared with each other for three different grid numbers. For the sake of simplicity, later, the velocity or displacement of the object was used as the velocity or displacement of the mass center of the object. The results are shown in Figure 5. As depicted in Figure 5a,b, the difference in the simulation results between cases 2 and 3 for both the center-of-mass velocity and the drag coefficient is invisible. However, in the partly amplified figure, the difference between case 1 and cases 2 and 3 can be observed. Thus, the same mesh density as that used for case 2 was adopted in the following studies considering the simulation accuracy and computation costs.
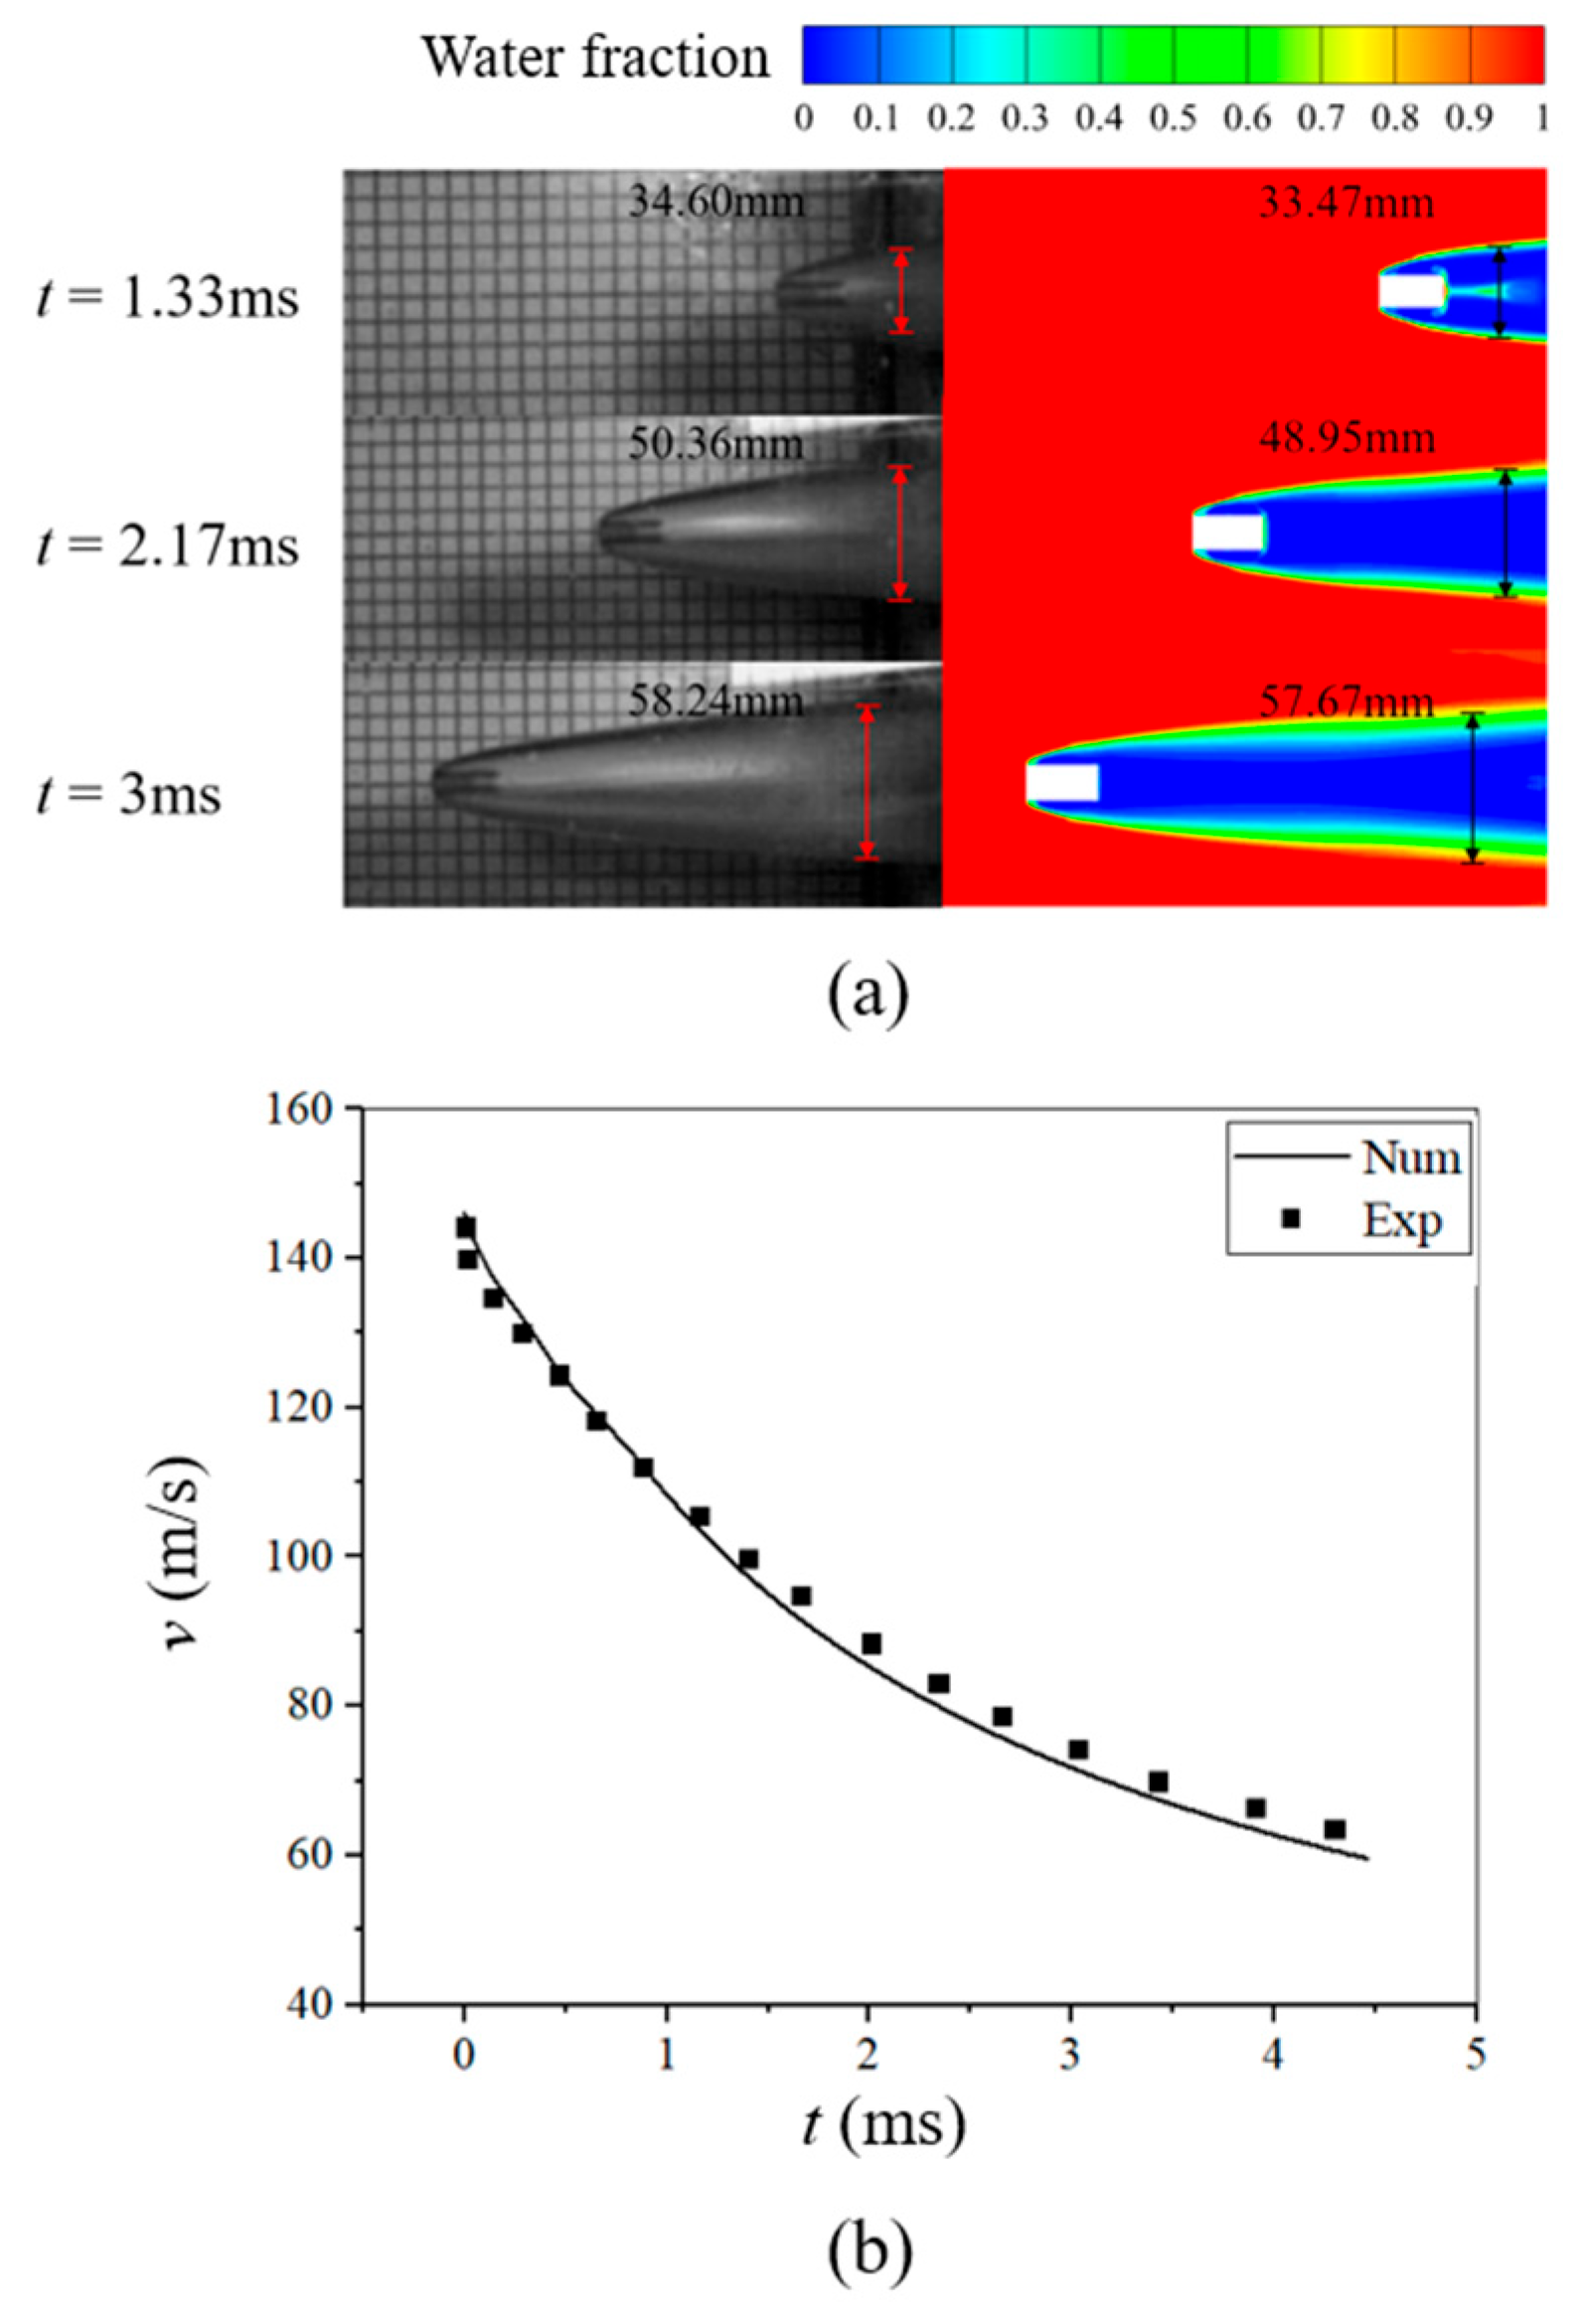
The results obtained from the simulation were compared with the experimental data [28] to test and verify the simulation accuracy. The same geometrical parameters and working conditions as were used in the experiments were used in the simulations. In the experiments, the diameter and the length of the object were 12.66 mm and 25.4 mm, respectively. The mass of the object was 23.5 g, and the initial velocity of the object was 142.6 m/s. Figure 6 gives the comparison between the numerical results and the experimental data. According to the comparison of the cavitation contours (Figure 6a) and velocity changes (Figure 6b), it can be concluded that the agreement between the simulation results and the experimental data was good. The maximum error for the cavitation profile was 3.2% according to the experimental data.

4. Results and Discussion

In this paper, the effects of lateral inflow angles on the underwater movement of a single object and two objects fired in parallel or series were analyzed. In all the numerical simulations, the objects initially moved forward along the x-axis, while the lateral flow was perpendicular to the y-axis. The lateral inflow angle (β) is defined as the angle between the lateral inflow and the x-axis, and a schematic diagram is shown in Figure 7. When the lateral inflow angle β is 90°, the lateral flow is along the z-axis. Five conditions with different lateral inflow angles, namely, 30°, 60°, 90°, 120° and 150°, were studied. According to the direction of the lateral flow seen in Figure 7, the lower zone of the object is called the upstream side, and the upper side is the backflow side or downstream side.

4.1. Effect of the Lateral Flow on a Single Object

When there are lateral flows with different incoming angles, the change in the flow field may influence the movement of the object. In this subsection, the cavity around a single object and its dynamic characteristics under different lateral inlet angles will be analyzed.
In this study, except for the lateral inflow angle, the other parameters were the same for all cases. The initial speed (V0) was set to 70 m/s (Re = 4.1 × 10⁵), and the velocity of the lateral flow (Vc) was 8.5% V0. Five lateral incoming angles were studied. For convenience in explaining the effect of the lateral inflow angle, a condition without lateral flow was also simulated.

4.1.1. Effect on the Supercavitation Profile and the Size of a Single Object

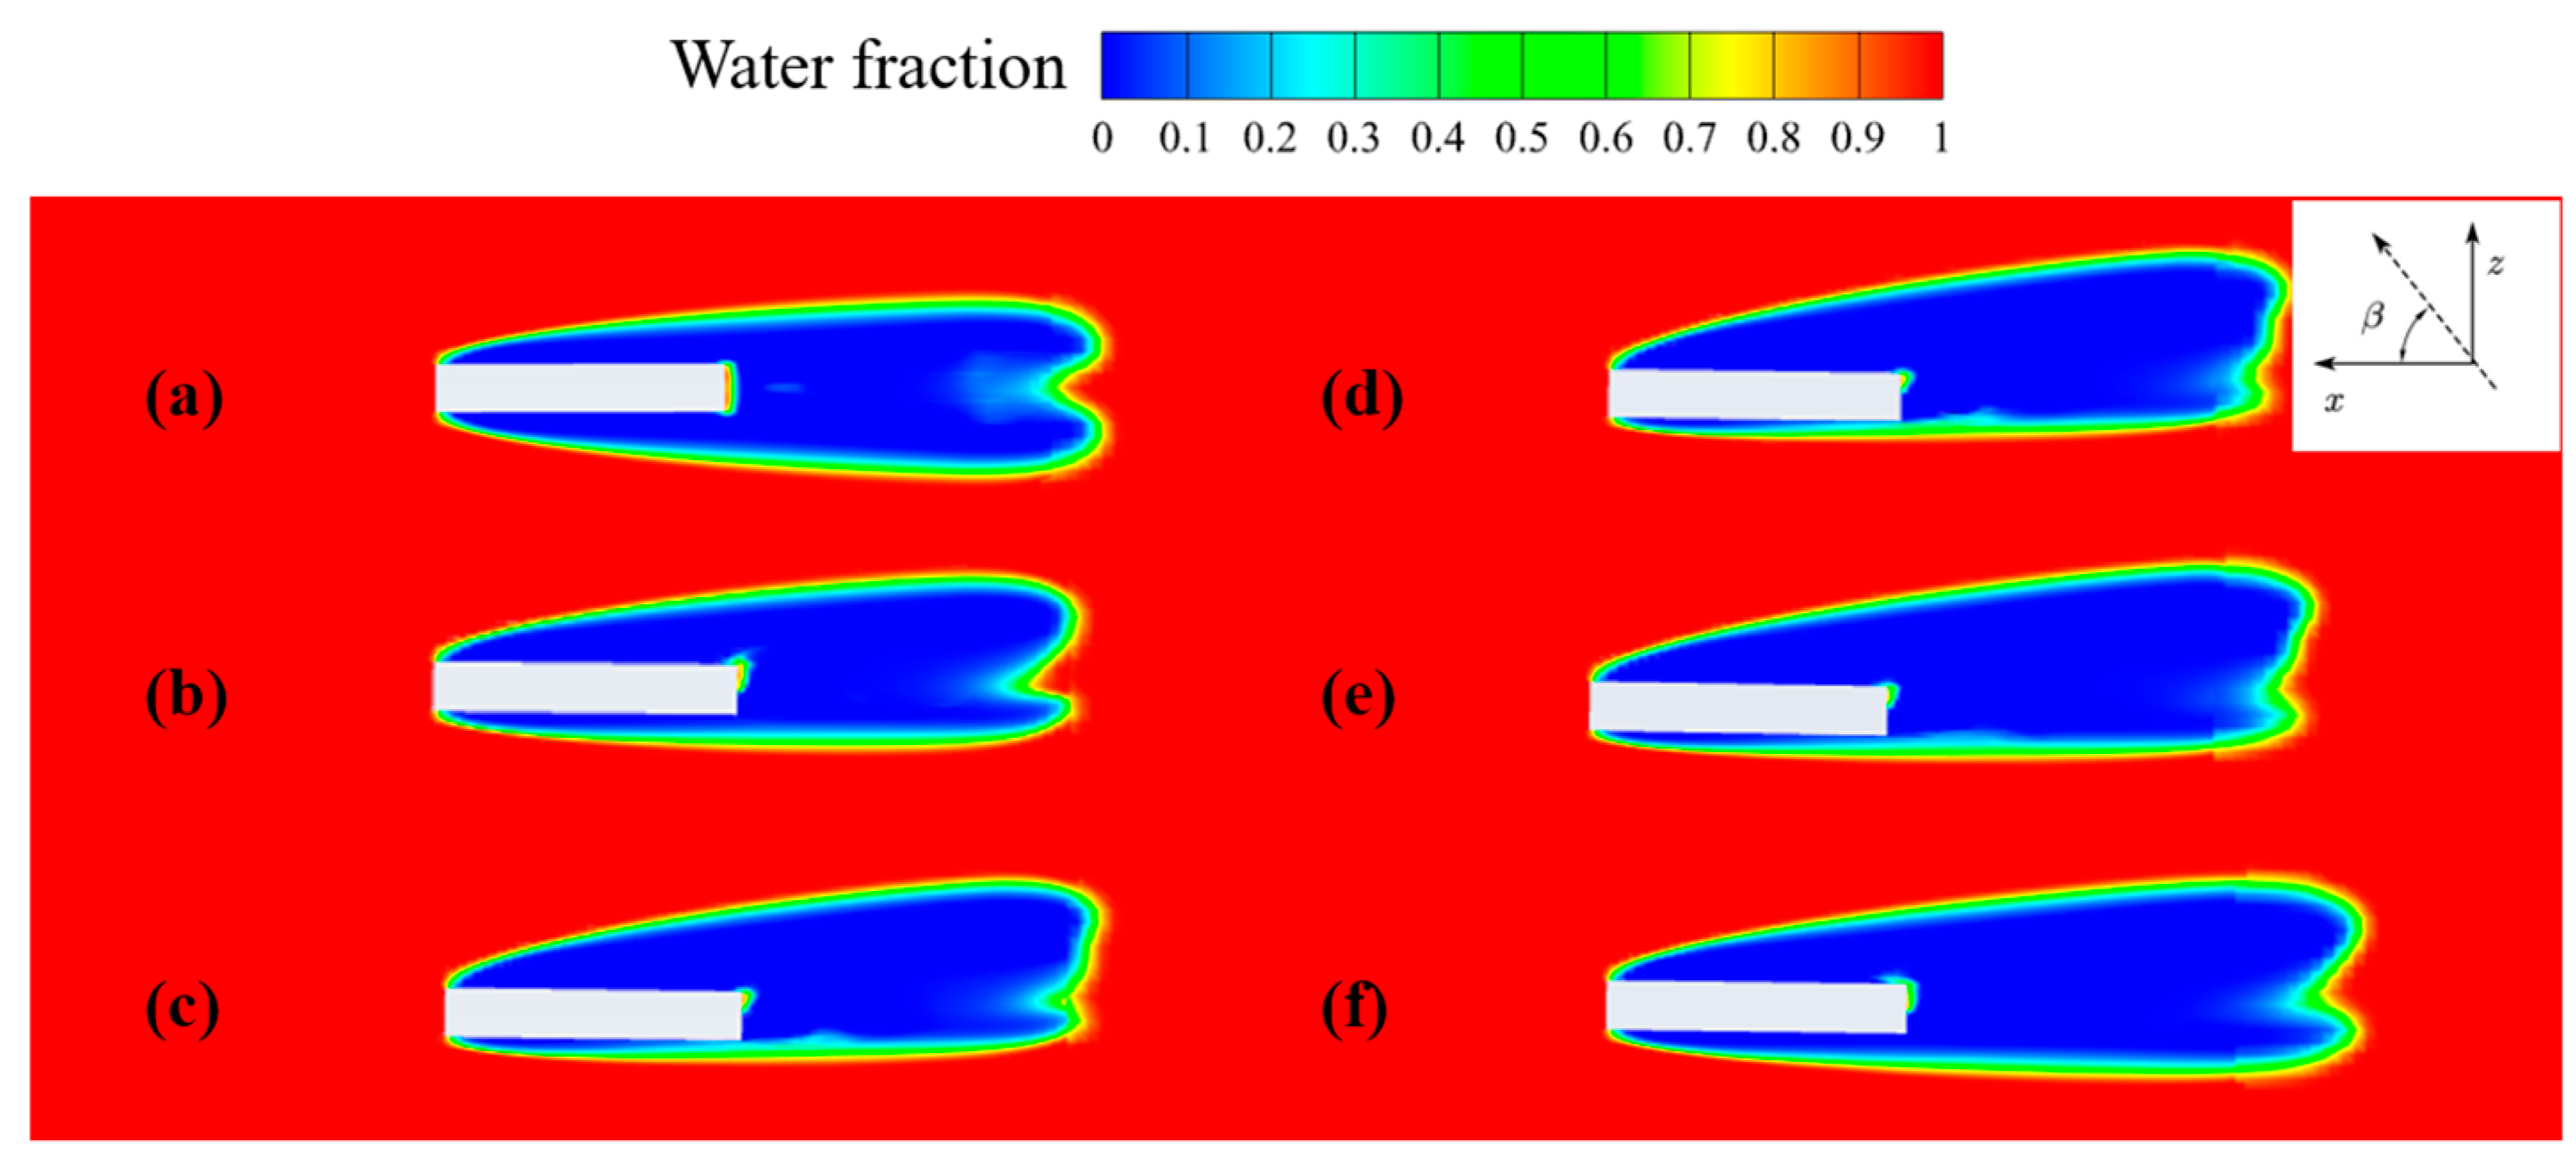
A water-phase diagram of the object in the XOZ plane at t = 1.8 ms for different lateral inflow angles is given in Figure 8. The object moves from right to left. It can be seen that the cavitation profile is symmetrical in Figure 8a in the case without lateral flow but asymmetrical in Figure 8b–f when there is lateral flow. In addition, the asymmetry in Figure 8c–e is stronger than that in Figure 8b,f, which can be more accurately seen in Figure 9.
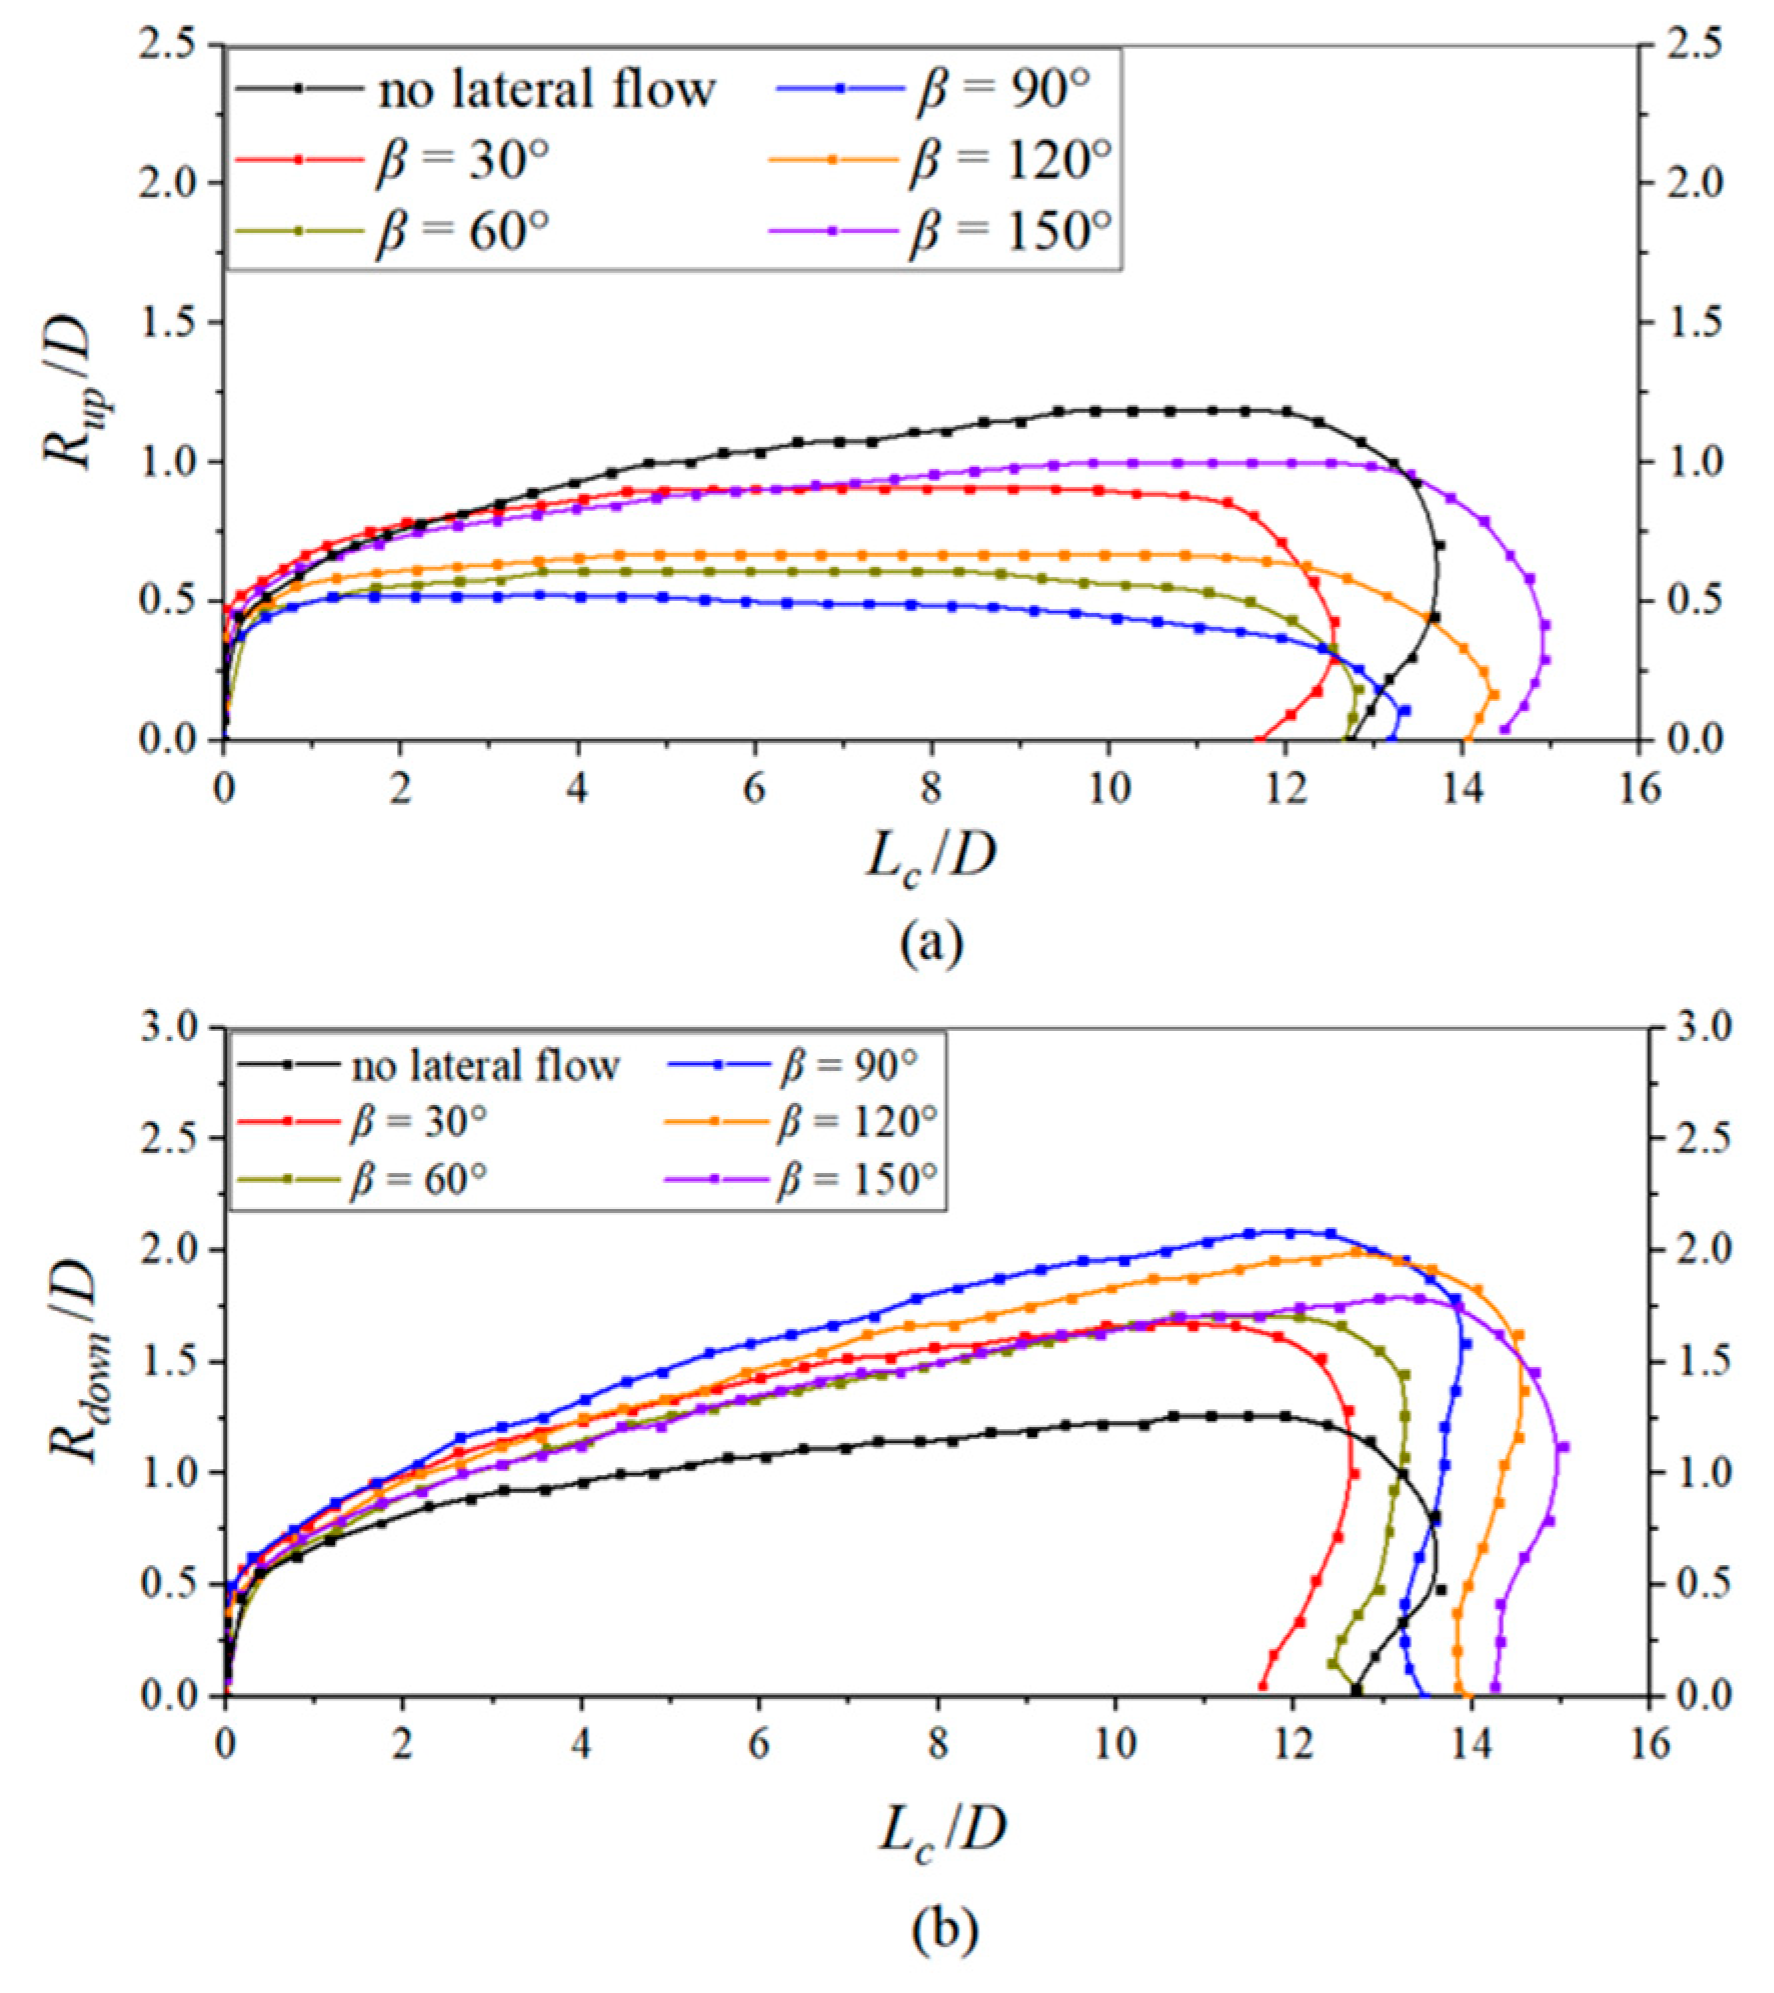
In Figure 9, a quantitative comparison of the cavity profiles in the XOZ cross-section through the object’s axis at t = 1.8 ms for five conditions is given. It should be noted that the cavity profiles appear to be different to the other cross-sections due to their 3D rotational asymmetry. The horizontal coordinate is the dimensionless length (Lc/D), where Lc is the cavity length. The vertical coordinate in Figure 9a,b is the dimensionless radial size (Rup/D and Rdown/D) of the cavity, where Rup and Rdown represent the radial size of the cavity on the upstream and backflow sides, respectively.
As depicted, we can see that the cavity contour is symmetrical along the object axis in the case without lateral flow. If lateral flows exist, the symmetry of the cavity shape disappears. Under different conditions with lateral flow, the radial size of the cavity on the backflow side is bigger than that on the incoming side.
The cavity length becomes larger with the increase in the lateral incoming angle. When the lateral incoming angle is 30°, the cavity length is the smallest, while the cavity length is maximal under the condition of β = 150°. The reason may be that the x-component of the lateral flow varies for different conditions. In the case of β = 30°, there is a maximal positive velocity component of the lateral flow in the direction of object motion, which means that the relative velocity of the object is the highest among all conditions. Conversely, in the case of β = 150°, the velocity component of the lateral flow in the negative x-direction is maximal, which means that the relative velocity of the object in the x-direction is the smallest.
When the lateral incoming angle increases from 30° to 90°, the radial size of the cavity on the incoming side gradually decreases, while, on the other side, the change in the radial size is opposite. That is, the cavity profile becomes more asymmetric when the lateral incoming angle alters from 30° to 90°. However, when the lateral incoming angle continuously increases from 90° to 150°, the change tendency of the cavity profile is just the opposite. That is, from 90° to 150°, the cavity asymmetry is weakened. The reason may be due to the difference in the z-component of the lateral flow when the lateral incoming angle increases from 30° to 150°. For β = 90°, the z-component of the lateral flow is the largest, and thus the asymmetry degree of the cavity contour is the strongest. The z-components of the lateral flow under the conditions of β = 30° and 60° are the same as those under the conditions of β = 150° and 120°, respectively. Thus, the cavity asymmetry under the condition of β = 30° is similar to that under the condition of β = 150°. Correspondingly, the cavity asymmetry between the conditions of β = 60° and 120° is similar.
Figure 10 shows the change in the maximum value of the entire radial size (Dc) and the length (Lc) of the cavity with the lateral incoming angle at t = 1.8 ms, where Dc = Rup + Rdown. The abscissa is the lateral incoming angle. The vertical coordinates on the left and right sides represent the nondimensional cavity length (Lc/L0) and the maximum radial size (Dc/D0), respectively, where D0 and L0 are the maximum radial size and the length of the cavity in the case without lateral flow, respectively. It can be seen that regardless of the operating conditions, the maximum radial size and length of the cavity increase with the increase in the lateral inflow angle, and the growth rate of the cavity length is faster.

4.1.2. Effect on the Hydrodynamic Characteristics and Trajectory of a Single Object

Here, it should be noted that the object initially moves forward along the x-axis. In the XOZ plane, there exists the lateral flow, which is perpendicular to the y-axis.
In this section, only the x- and z-components of the velocity and the deviation angle (α) in the y-direction are discussed. The reason is as follows. Firstly, it should be remembered that the object initially moves forward along the x-axis. In the XOZ plane, there exists the lateral flow, which is perpendicular to the y-axis. From the simulation results, it can be seen that the y-component of the object velocity is negligible. The deviation angles around the x- and z-axes are much smaller than that around the y-axis. Thus, only the x- and z-components of the velocity and the deviation angle (α) in the y-direction are discussed. A schematic diagram of the definition of α is shown in Figure 11. Specifically, it is specified that α is positive if the object rotates around the y-axis counterclockwise and negative in the object’s rotation is clockwise.
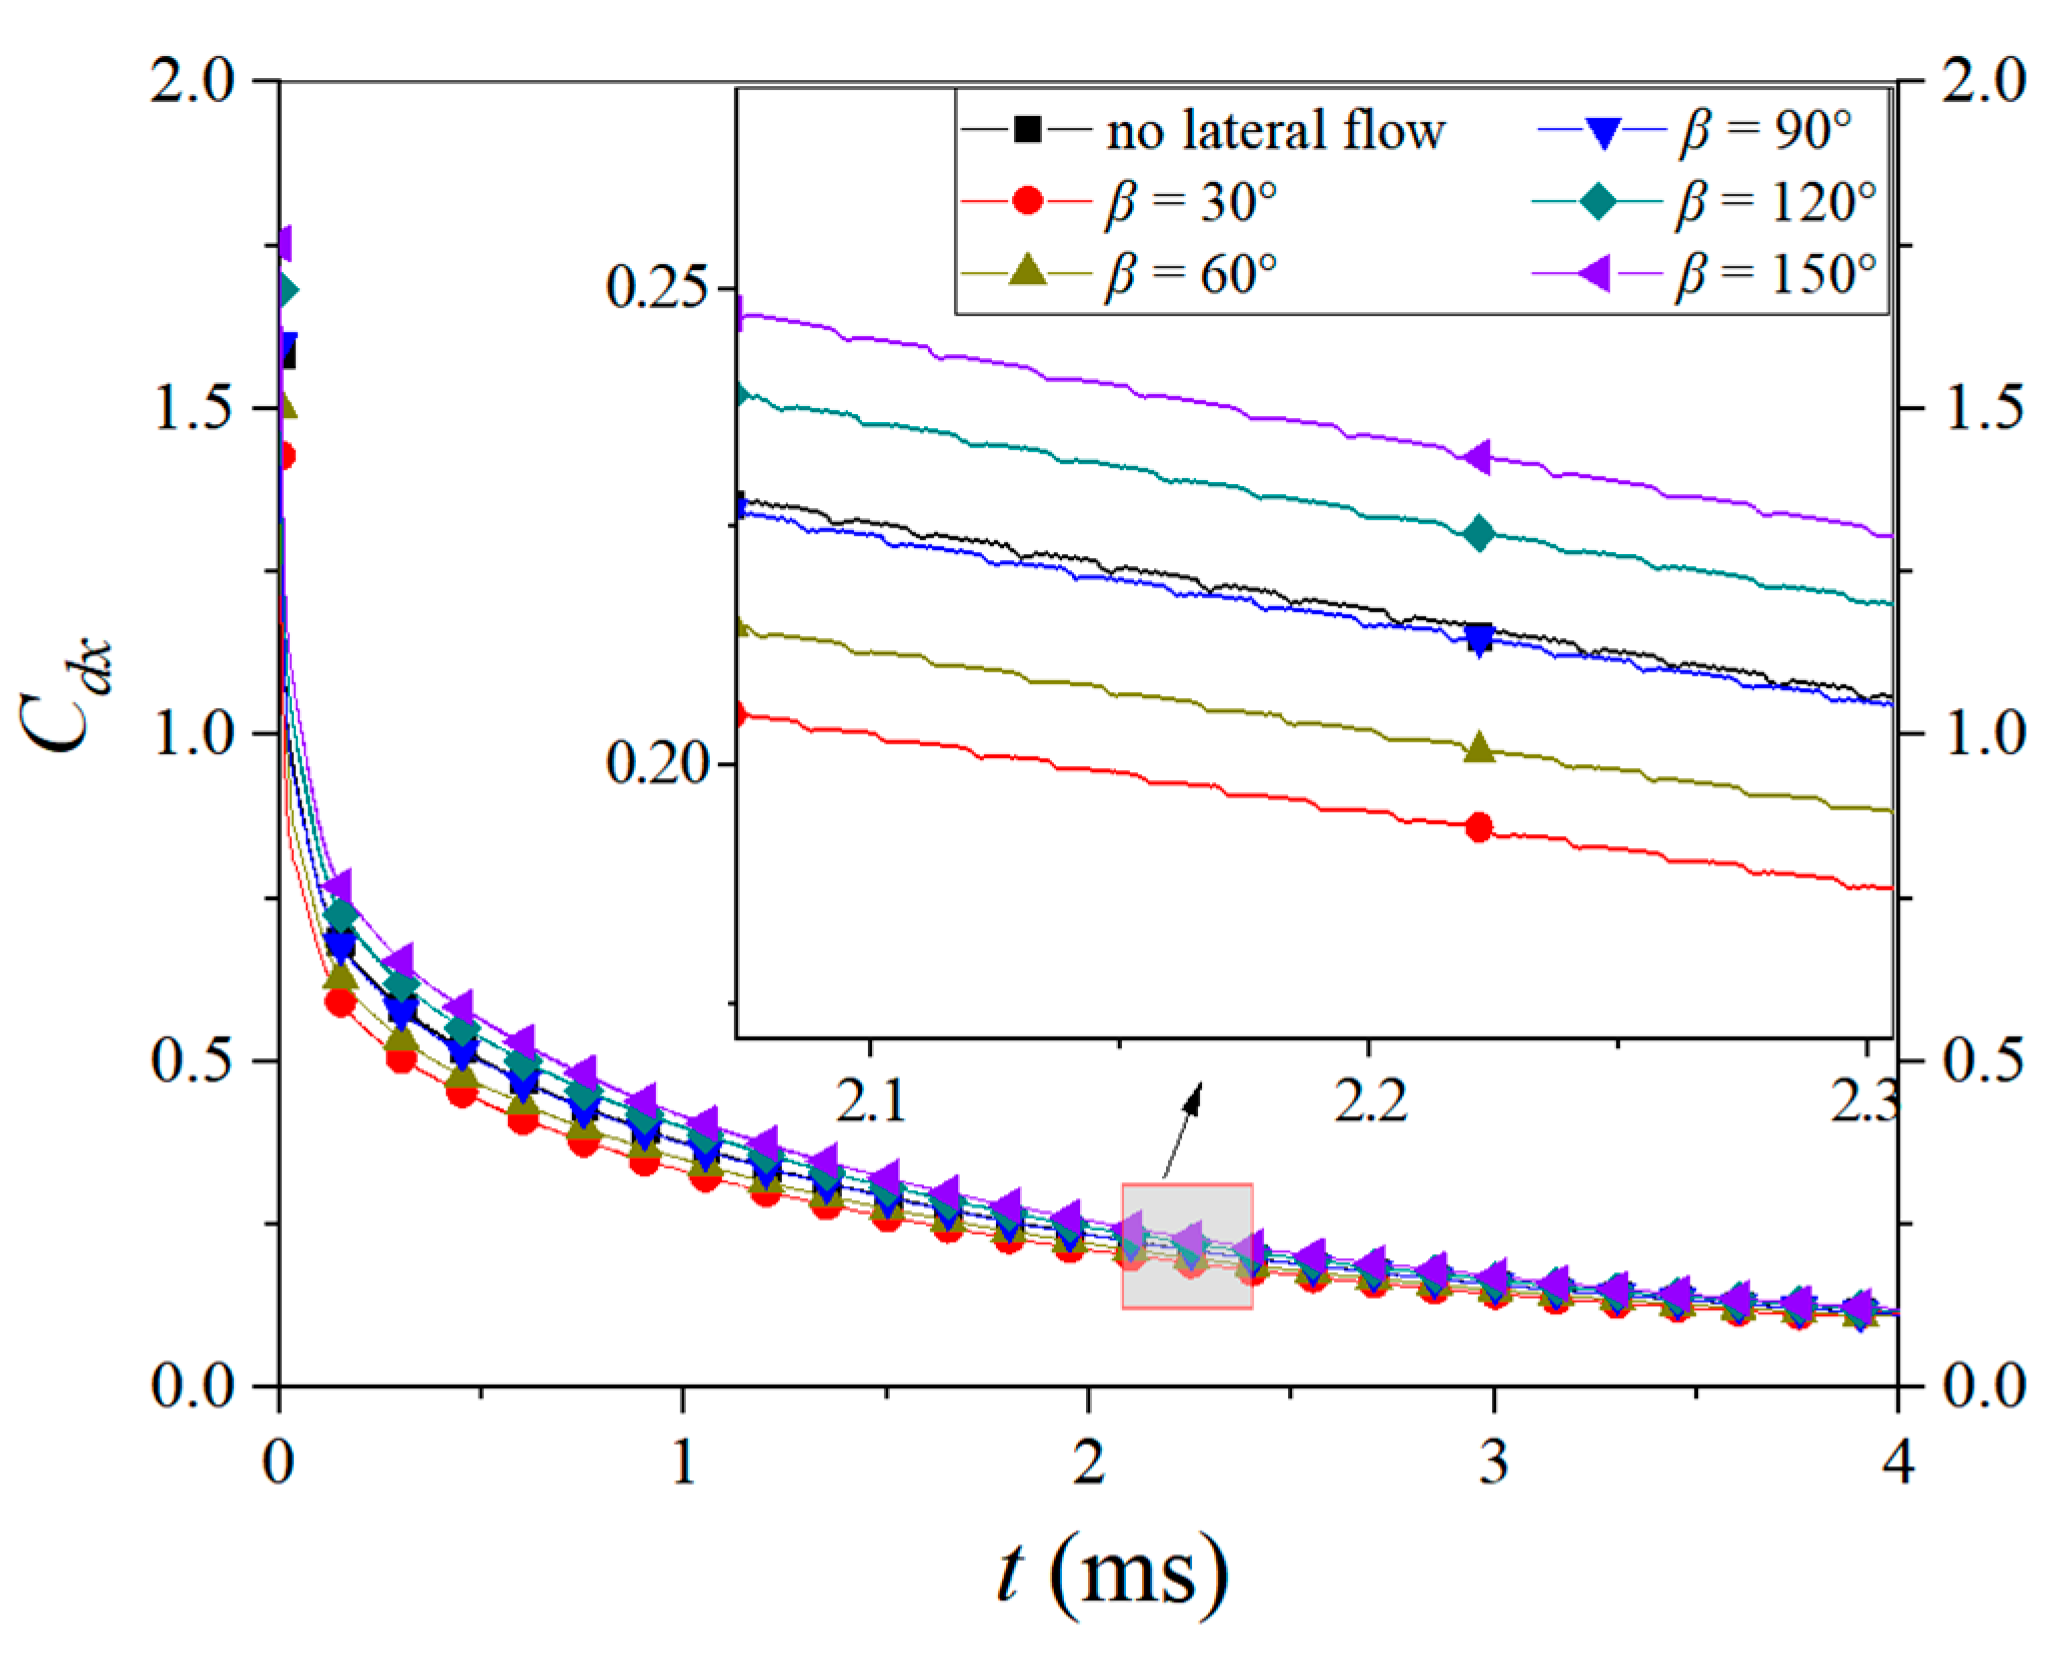
Figure 12 shows a comparison of the drag coefficients (Cdx) of the object in the x-direction under different conditions. The definition of Cdx is given in Equation (12).
C d x = F d 1 2 ρ l V p 2 A
where Fd is the force in the x-direction on the object, A represents the object’s characteristic area and Vp denotes the object’s velocity.
It can obviously be seen that, for all the conditions, the object is subjected to significant drag during the initial movement stage. During this stage, the object has not yet been enveloped by cavities. Soon after, the object is completely enveloped by the cavity, and the drag on the object is rapidly decreased. Afterwards, the drag gradually decreases.
The difference in the drag among the different conditions can be more clearly seen in the locally enlarged diagram. For instance, at t = 2.2 ms, the drag coefficient is the smallest and the biggest in the conditions of β = 30° and 150°, respectively. That is, the drag coefficient increases as the lateral incoming angle becomes bigger. The differences among different conditions gradually decrease with time. When β is less than 90°, the x-component direction of the lateral flow velocity is the same as that of the object’s initial velocity, which is beneficial for the object’s movement. Thus, the drag coefficient is smaller compared with that under the no-crossflow condition. Furthermore, the bigger the x-component, the smaller the drag. Conversely, when β is larger than 90°, the direction of the x-component of the lateral flow velocity is opposite to that of the object velocity, which is adverse for the object’s movement. Thus, the drag coefficient under the condition of β ≥ 90° is larger than that in the case without lateral flow.
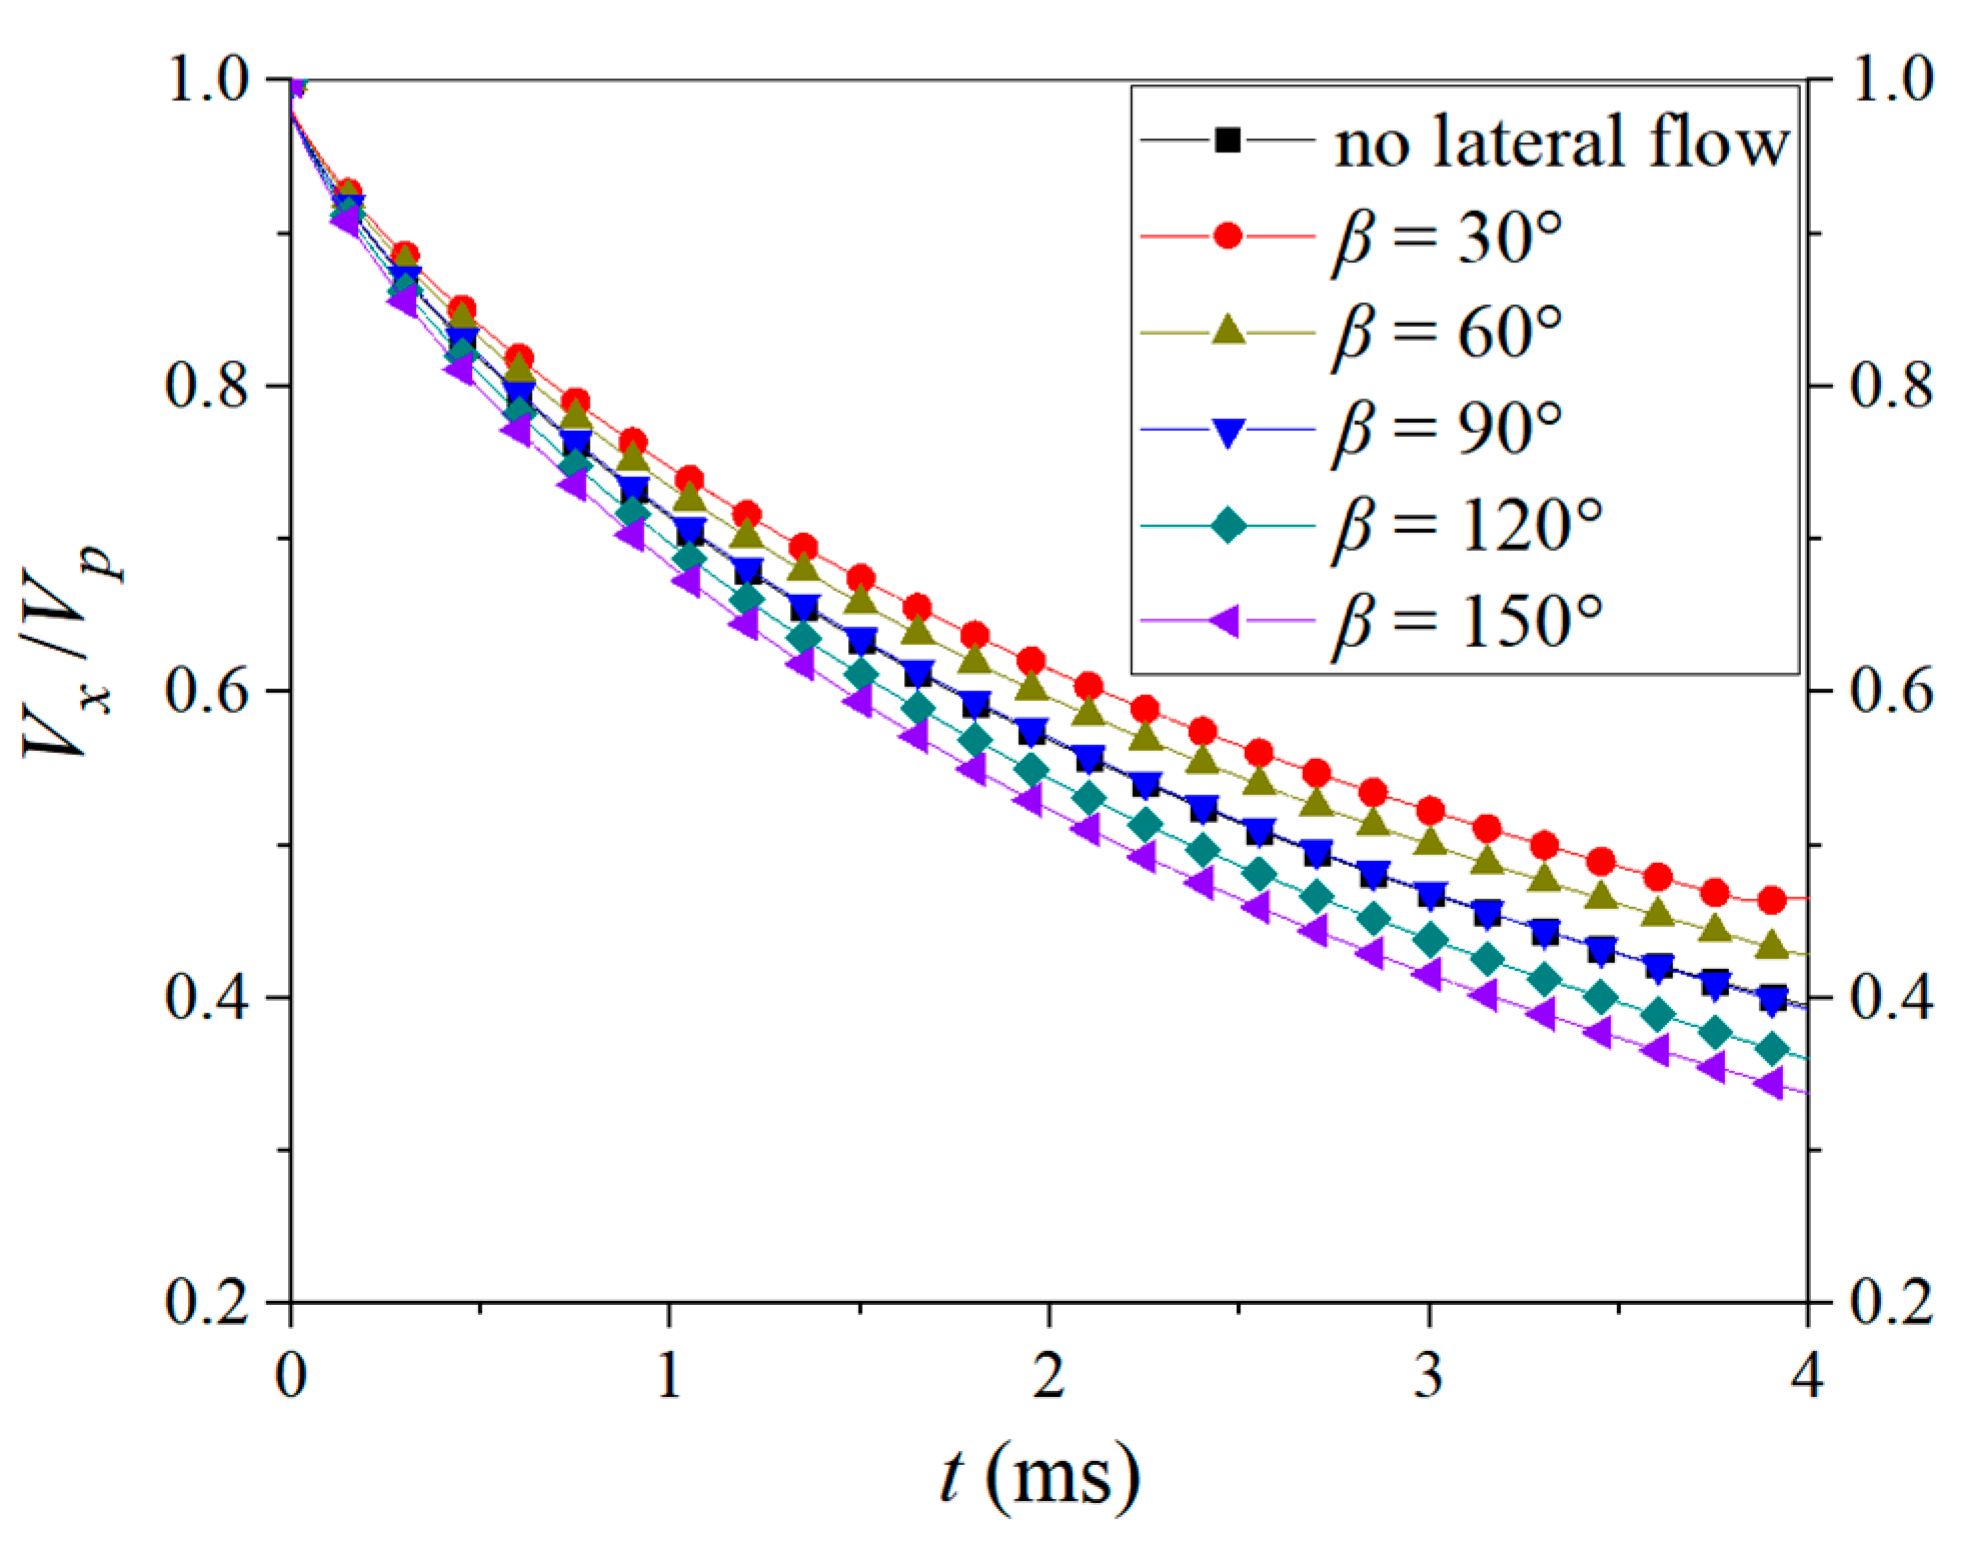
Figure 13 shows the x-component change in the object velocity for different cases. The ordinate is the dimensionless velocity (Vx/V0). As depicted in Figure 13, the velocity decrease in the condition of β = 30° is the slowest, while in the condition of β = 150°, the decrease is the fastest. In other words, the decrease in the axial velocity becomes faster as the lateral oncoming angle grows, which corresponds to the drag coefficient change for all cases. When the lateral incoming angle is 90°, the decrease in the velocity is nearly the same as that in the case of no lateral flow.
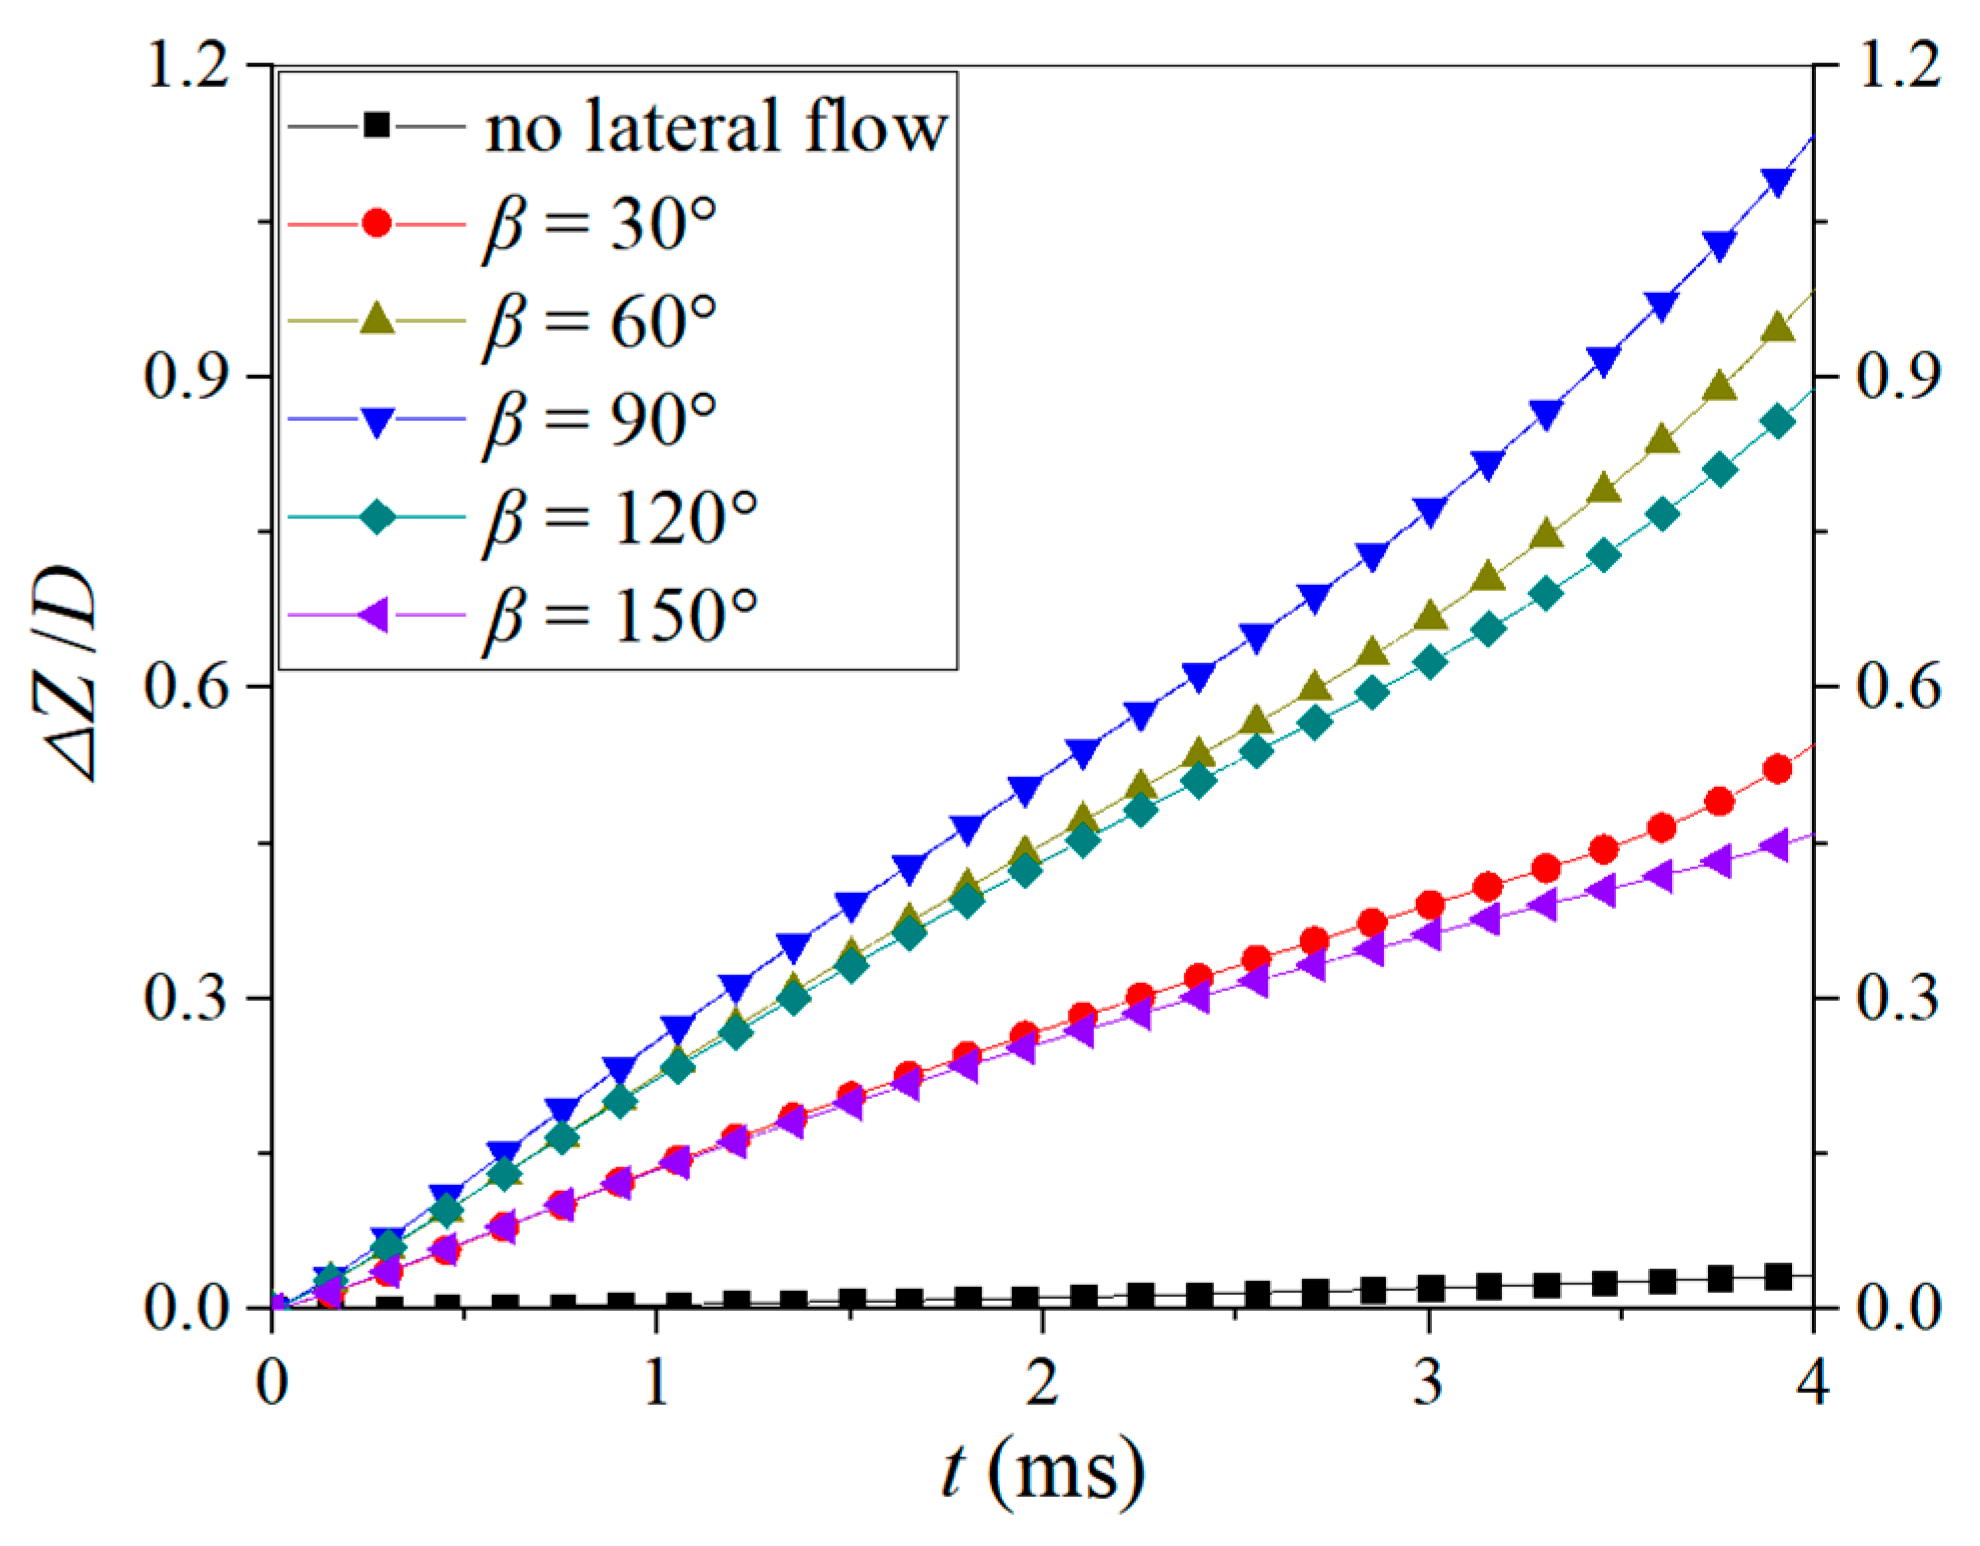
Figure 14 shows the z-component of the object’s velocity under different conditions, which is called the deviation speed. Figure 15 shows the object’s displacement in the z-direction, which is called the deviation displacement. As depicted in Figure 14, the deviation velocity is approximately zero in the case of no lateral flow.
Under the condition of β = 30°, the deviation velocity increases rapidly in the initial stage (before t = 0.25 ms), then slightly decreases between t = 0.25 and 3.25 ms, and, finally, increases gradually. The reason for the change trend may be that, at the beginning, the cavity does not completely envelop the object, the effect of the lateral flow is mainly manifested in the cavity deformation, and the hydrodynamic force acting on the object decreases. After t = 3.25 ms, due to the cavity deformation, the wetting phenomenon appears at the object’s tail. At the wetted zone, the hydrodynamic force increases, and thus the deviation velocity increases (named the second increase).
The change tendency of the deviation velocity in the cases of β = 60°, 90°, 120° and 150° is basically the same as that under the condition of β = 30°, although the magnitude of the deviation velocity under different conditions is different. The above can also be proved by Figure 15. In addition, the time at which the second increase in the deviation velocity occurs is somewhat different.
Under the condition of β = 90°, the deviation velocity is higher than that under the other conditions at all times. For the conditions of β = 30° and 120°, the deviation velocity before t = 3.25 ms is nearly the same. After that, the deviation velocity under the condition of β = 30° begins to increase, while for the condition of β = 150°, the second increase appears at about t = 3.75 ms, which is somewhat later than that under the condition of β = 30°. The reason may be as follows. For these two conditions, the z-component of the lateral flow is the same, that is, the asymmetry of the cavities is nearly the same. However, the relative axial velocity for β = 30° is smaller than that under the condition of β = 150°, that is, the cavity length under the condition of β = 30° is shorter than that for β = 150°. Therefore, the wetting phenomenon at the object’s tail under the condition of β = 30° appears earlier than that for β = 150°. Thus, the time at which the second increase occurs under the condition of β = 30° is earlier.
For the conditions of β = 60° and 120°, the case is similar to that for the conditions of β = 30° and 150°. In addition, the deviation velocity under the conditions of β = 60° and 120° is higher than that for β = 30° or 150°, which is due to the larger z-component of the lateral flow in the cases of β = 60° and 120°.
Figure 16 gives the variation in α with time. As depicted in Figure 15, under the condition of no lateral flow, α remains basically unchanged, meaning that the object moves along the initial movement direction.
Under the condition of β = 30°, the deflection angle is initially clockwise and subsequently counterclockwise. In the earlier period in which the object has not been enveloped by the cavity, the deflection angle is clockwise. The counterclockwise deflection may be caused by the wetted zone at the object’s tail on the incoming side. The variation tendencies for α for β = 60°, 90°, 120° and 150° are similar to that under the condition of β = 30°. However, under the condition of β = 90°, the time at which the object begins to be deflected counterclockwise is the earliest and the deflection angle is the biggest at t = 4.0 ms. In the case of β = 150°, although the deflection angle is still negative at t = 4.0 ms, the clockwise deflection angle begins to decrease, that is, the angular velocity should be counterclockwise.

4.2. Effect of Lateral Inflow Angle on Parallel Objects

In this subsection, the influences of lateral inflow angles are investigated for parallel objects. The object’s initial velocity (V0) and the lateral flow velocity were set to 80 m/s (Re = 4.7 × 10⁵) and 7.5% V0, respectively. The lateral space between objects is ΔHc = D. The lateral incoming angles (β) were taken to be 30°, 60°, 90°, 120° and 150°. The initial movement direction of the objects was the same as that for the single object.

4.2.1. Effect on the Supercavitation Profile and Size of Parallel Objects

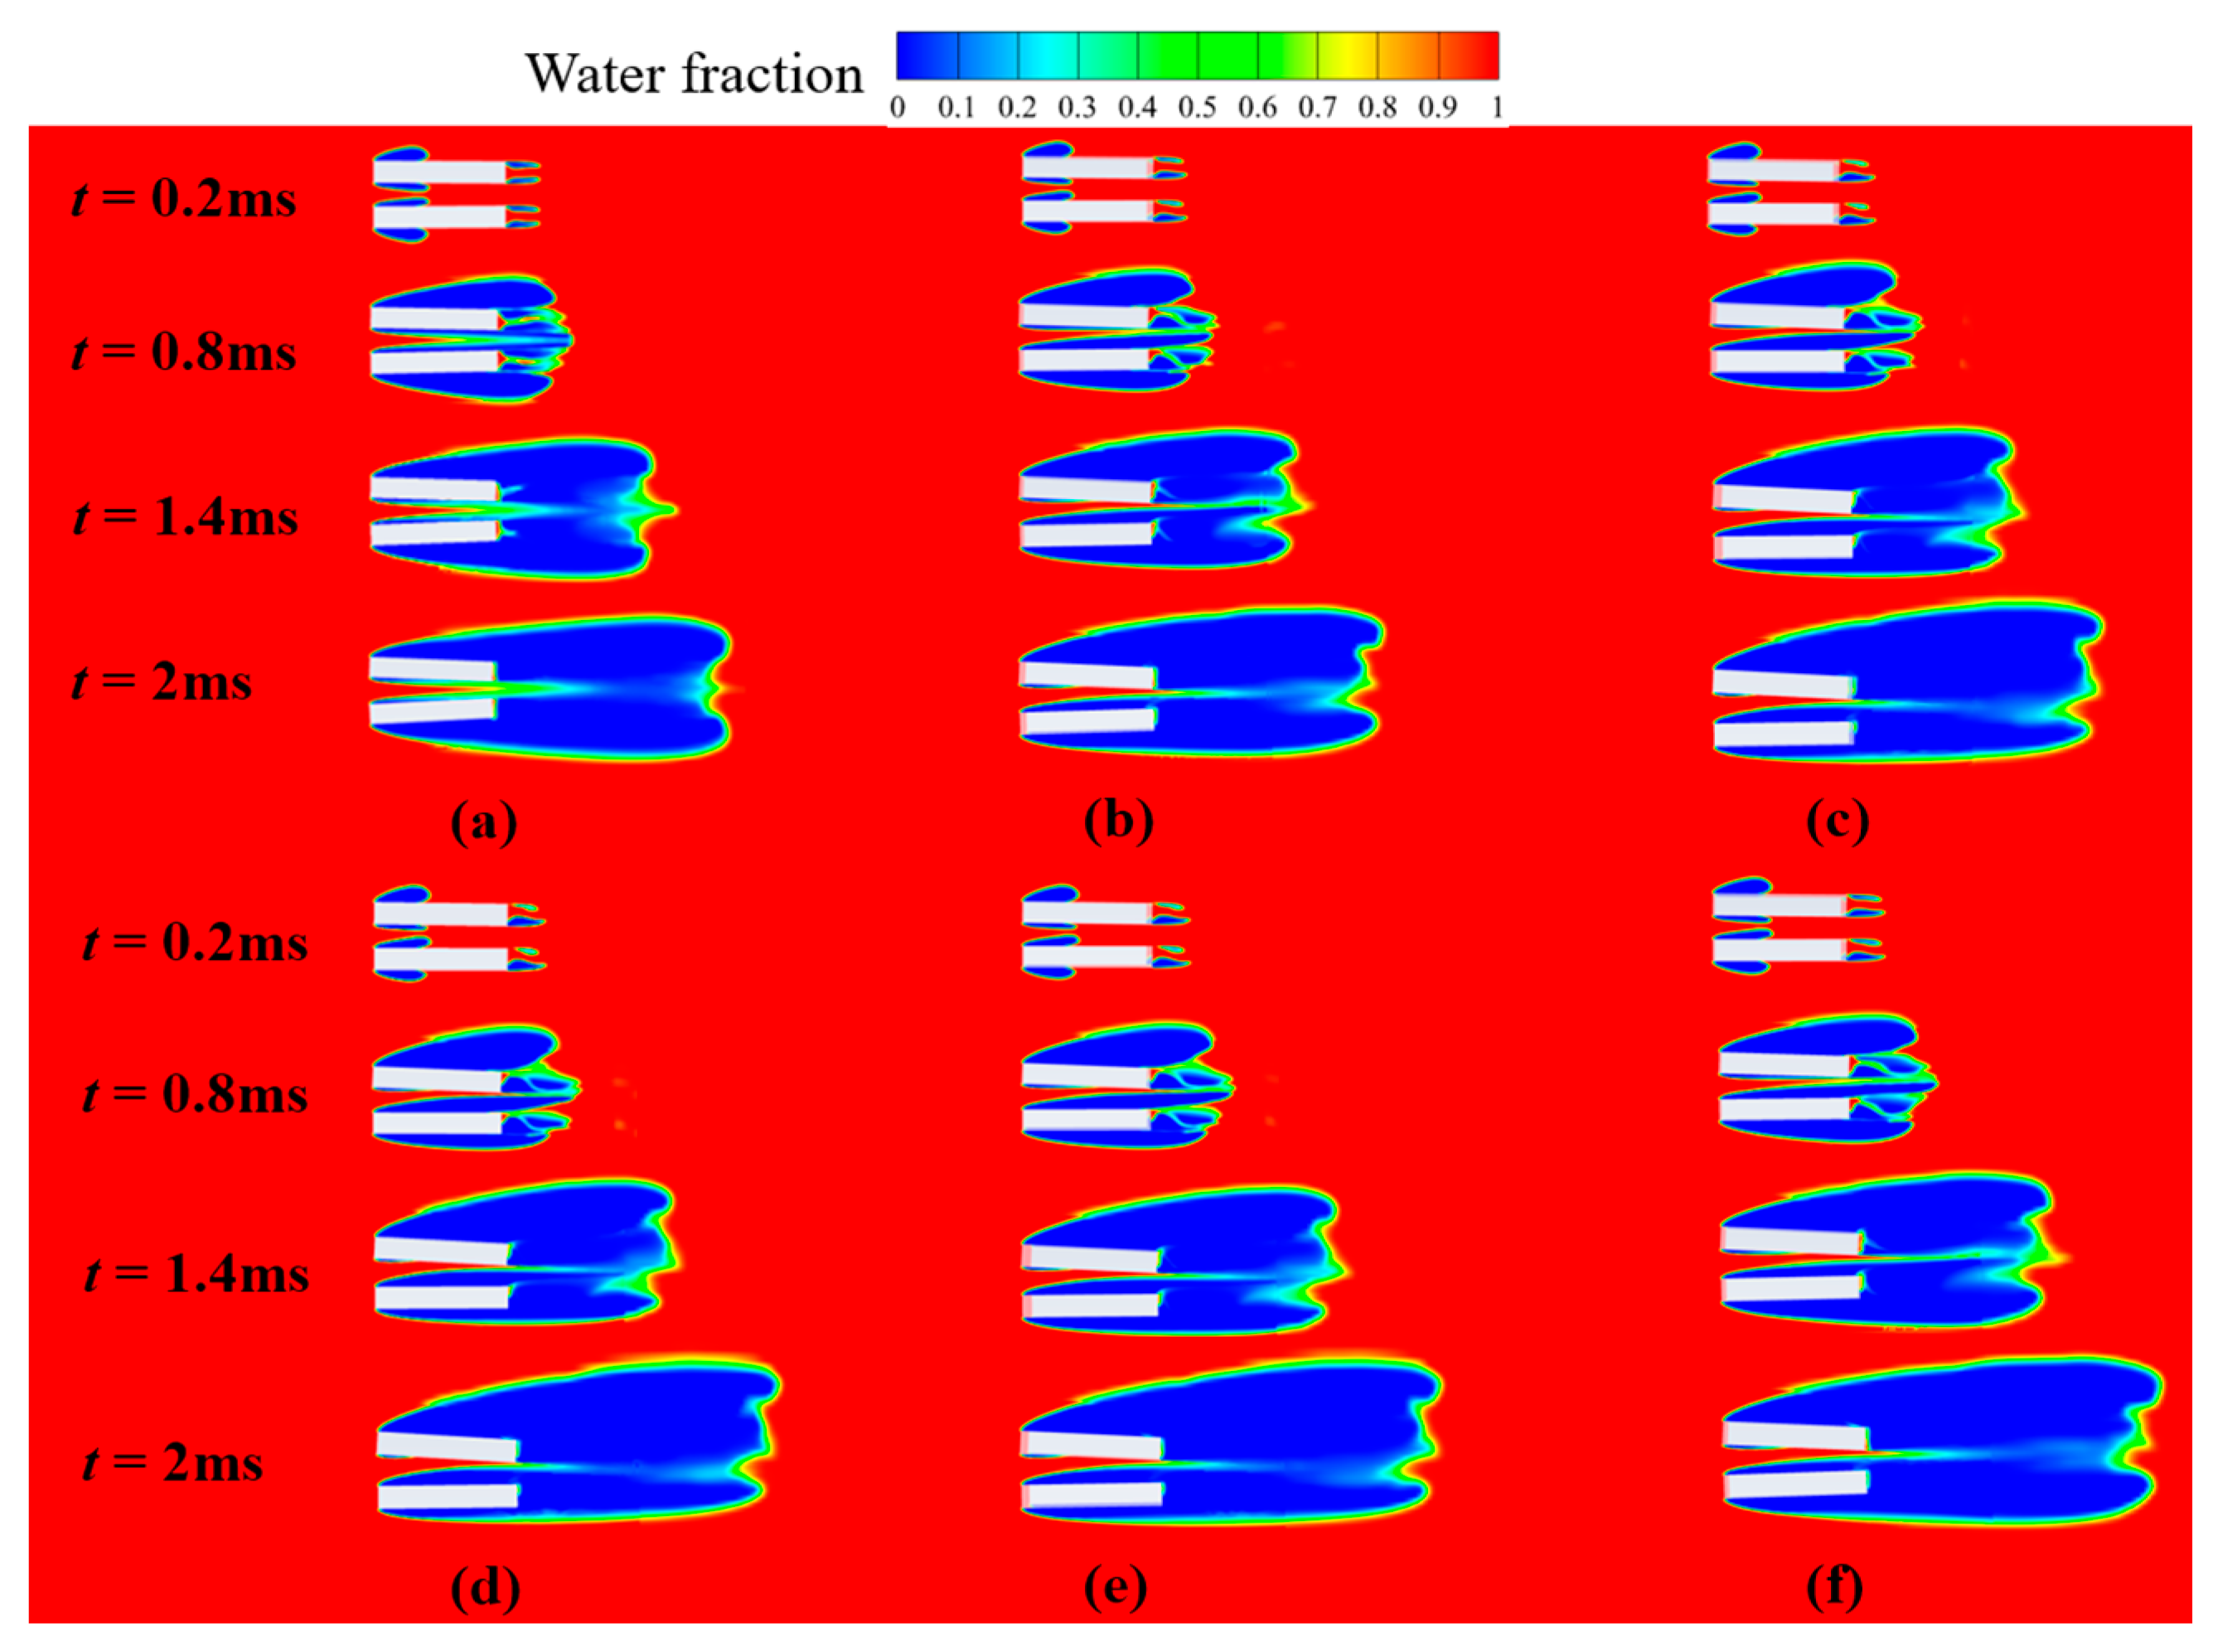
Figure 17a–f show the cavitation evolution when objects move underwater in parallel in the case of different lateral inflow angles. The objects move from the right side to the left side. According to the lateral flow direction, the objects located upstream and downstream of the lateral flow are called objects 1 and 2, respectively, and these two parallel objects are named the parallel objects group.
The results for the case with no lateral flow are given in Figure 17a. It can be seen that the cavities first appear at the shoulders and tails of the two objects at t = 0.2 ms. Then, the size of the cavities increases. At the time of 1.4 ms, two supercavities around the two objects are already connected at the tail, and then the cavity continuously increases. It can be seen that, at any time point, the cavity around the parallel objects group is symmetric. But the cavity around the single one is not symmetrical because of the effect of the nearby object. The cavity radial size for each object in the inner region between the objects is smaller than that in the outer region.
Under the conditions with lateral flow, the cavity profile around the parallel objects group is no longer symmetrical. It can be seen in Figure 17b that the cavity size on the incoming side is smaller than that on the backflow side for the parallel objects group.
For the downstream object, the cavity size on the incoming side is smaller than that on the backflow side, which is similar to that for the single object. But for the upstream object (object 1), the case is just opposite. The reason may be as follows: for the parallel objects, the change in the cavity size is induced by the influence of the nearby object and the lateral flow. For object 1, the effects of the lateral flow and the nearby object are opposite on the backflow side, and thus its cavity shape shows a weakened asymmetry (Figure 17b, t = 1.4 ms). However, for the downstream object (object 2), the high-pressure effect induced by the nearby object and the lateral flow influence are superimposed, and both the lateral flow and the nearby object make the cavity size on the incoming side decrease. Thus, the asymmetry of the cavity shape is increased. At t = 1.4 ms in Figure 17b, the re-wetting phenomenon appears on the downstream side of object 2, which may cause the force to increase and the object’s trajectory to be deflected. It can also be observed in Figure 17 that the trajectory deflection of object 2 is more obvious than that of the upstream one.
Comparing Figure 17b–f, it can be seen that the cavity development processes are similar to each other but that the sizes of the cavities are different. At t = 0.8 ms, it can be seen that the incoming side of the downstream object is surrounded by a thin cavity in Figure 17b, which is similar to that in Figure 17f. However, in Figure 17c–e, the rear part of the downstream object on the inner side has been wetted at t = 0.8 ms, and the wetted area in Figure 17d is somewhat bigger than that in Figure 17c,e.
Under the conditions of β = 30° and 150° (Figure 17b,f), the local wetting phenomenon also appears on the inner side at the tail of the downstream object at the time of 1.4 ms, while under the conditions of β = 60°, 90° and 120°, the wetted parts are larger than those for β = 30° and 150°. In addition, under the conditions of β = 30° and 150°, in the inside zone, the cavity profile of object 1 is slightly thinner than that in the outside zone. But for β = 60°, 90° and 120°, in the inside and outside zones, the cavity thicknesses of object 1 are almost the same. The asymmetry of object 1 is weaker than that of object 2.
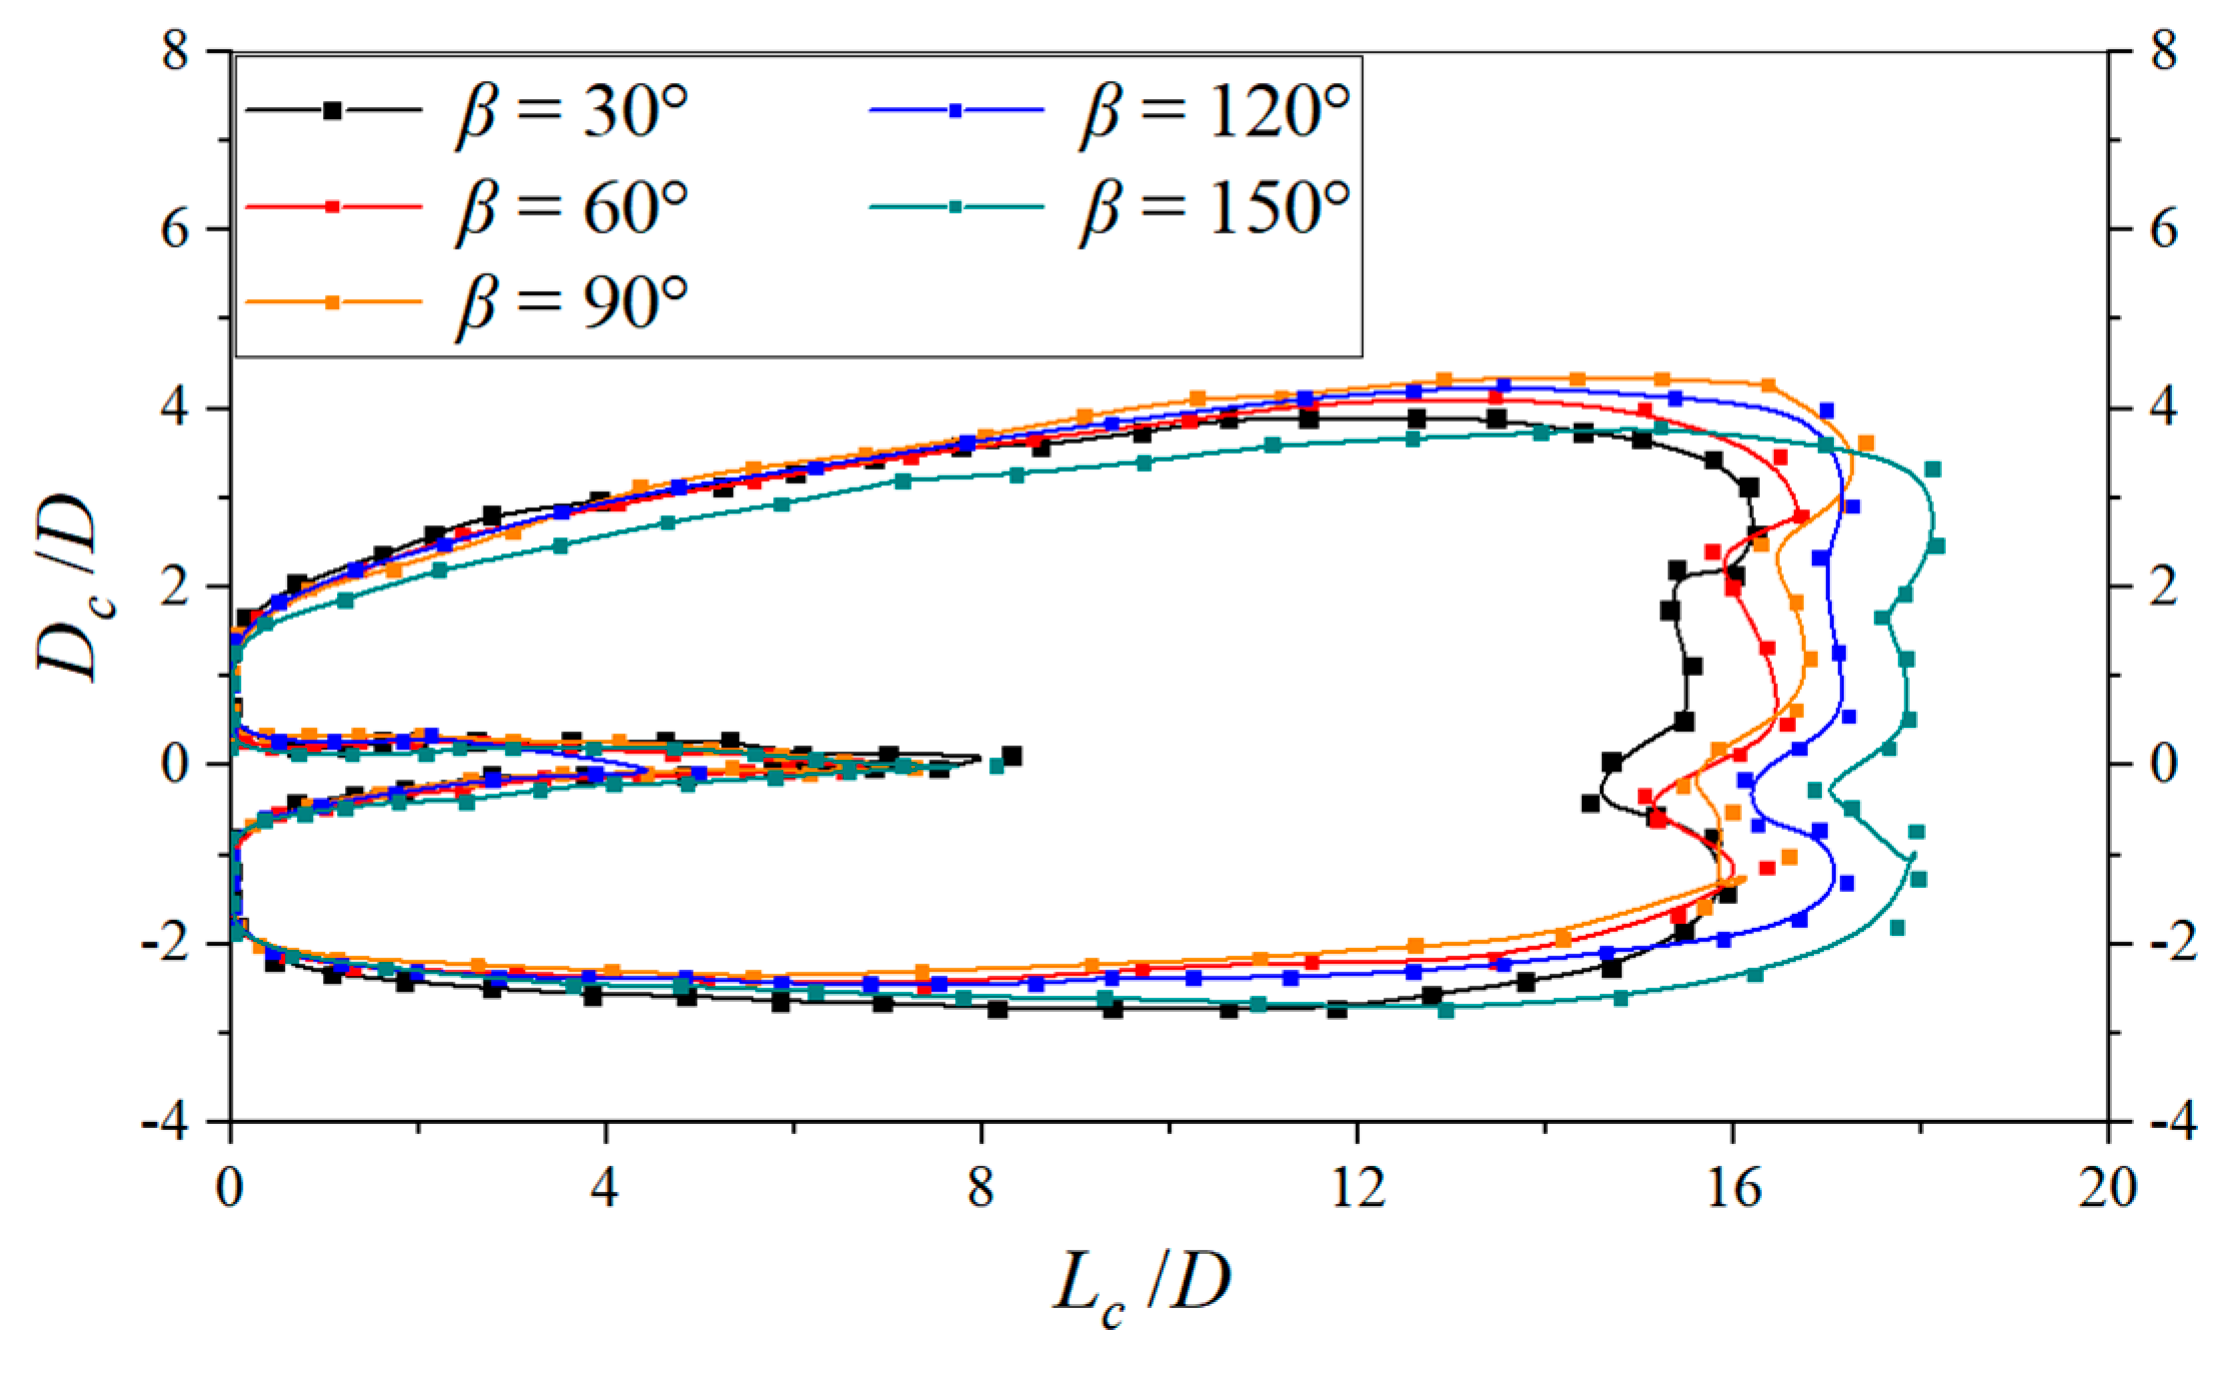
Figure 18 shows the cavity contours under different conditions at t = 2 ms for convenient comparison. Both the horizontal and vertical coordinates are nondimensionalized. As depicted, the whole cavity of the object group shifts towards the downstream object and the cavity is asymmetrical if lateral flow exists.
In addition, the cavity length under the condition of β = 30° is minimal, approximately 16D, due to the minimal relative axial velocity between the object and the water; while under the condition of β = 150°, the cavity length reaches its maximum, nearly 18D, due to the maximal relative axial velocity between the object and the water. That is, the difference in the cavity length is induced by the difference in the relative axial velocity. The cavity length increases with the relative axial velocity.

4.2.2. Effect on the Hydrodynamic Characteristics and Trajectories of Parallel Objects

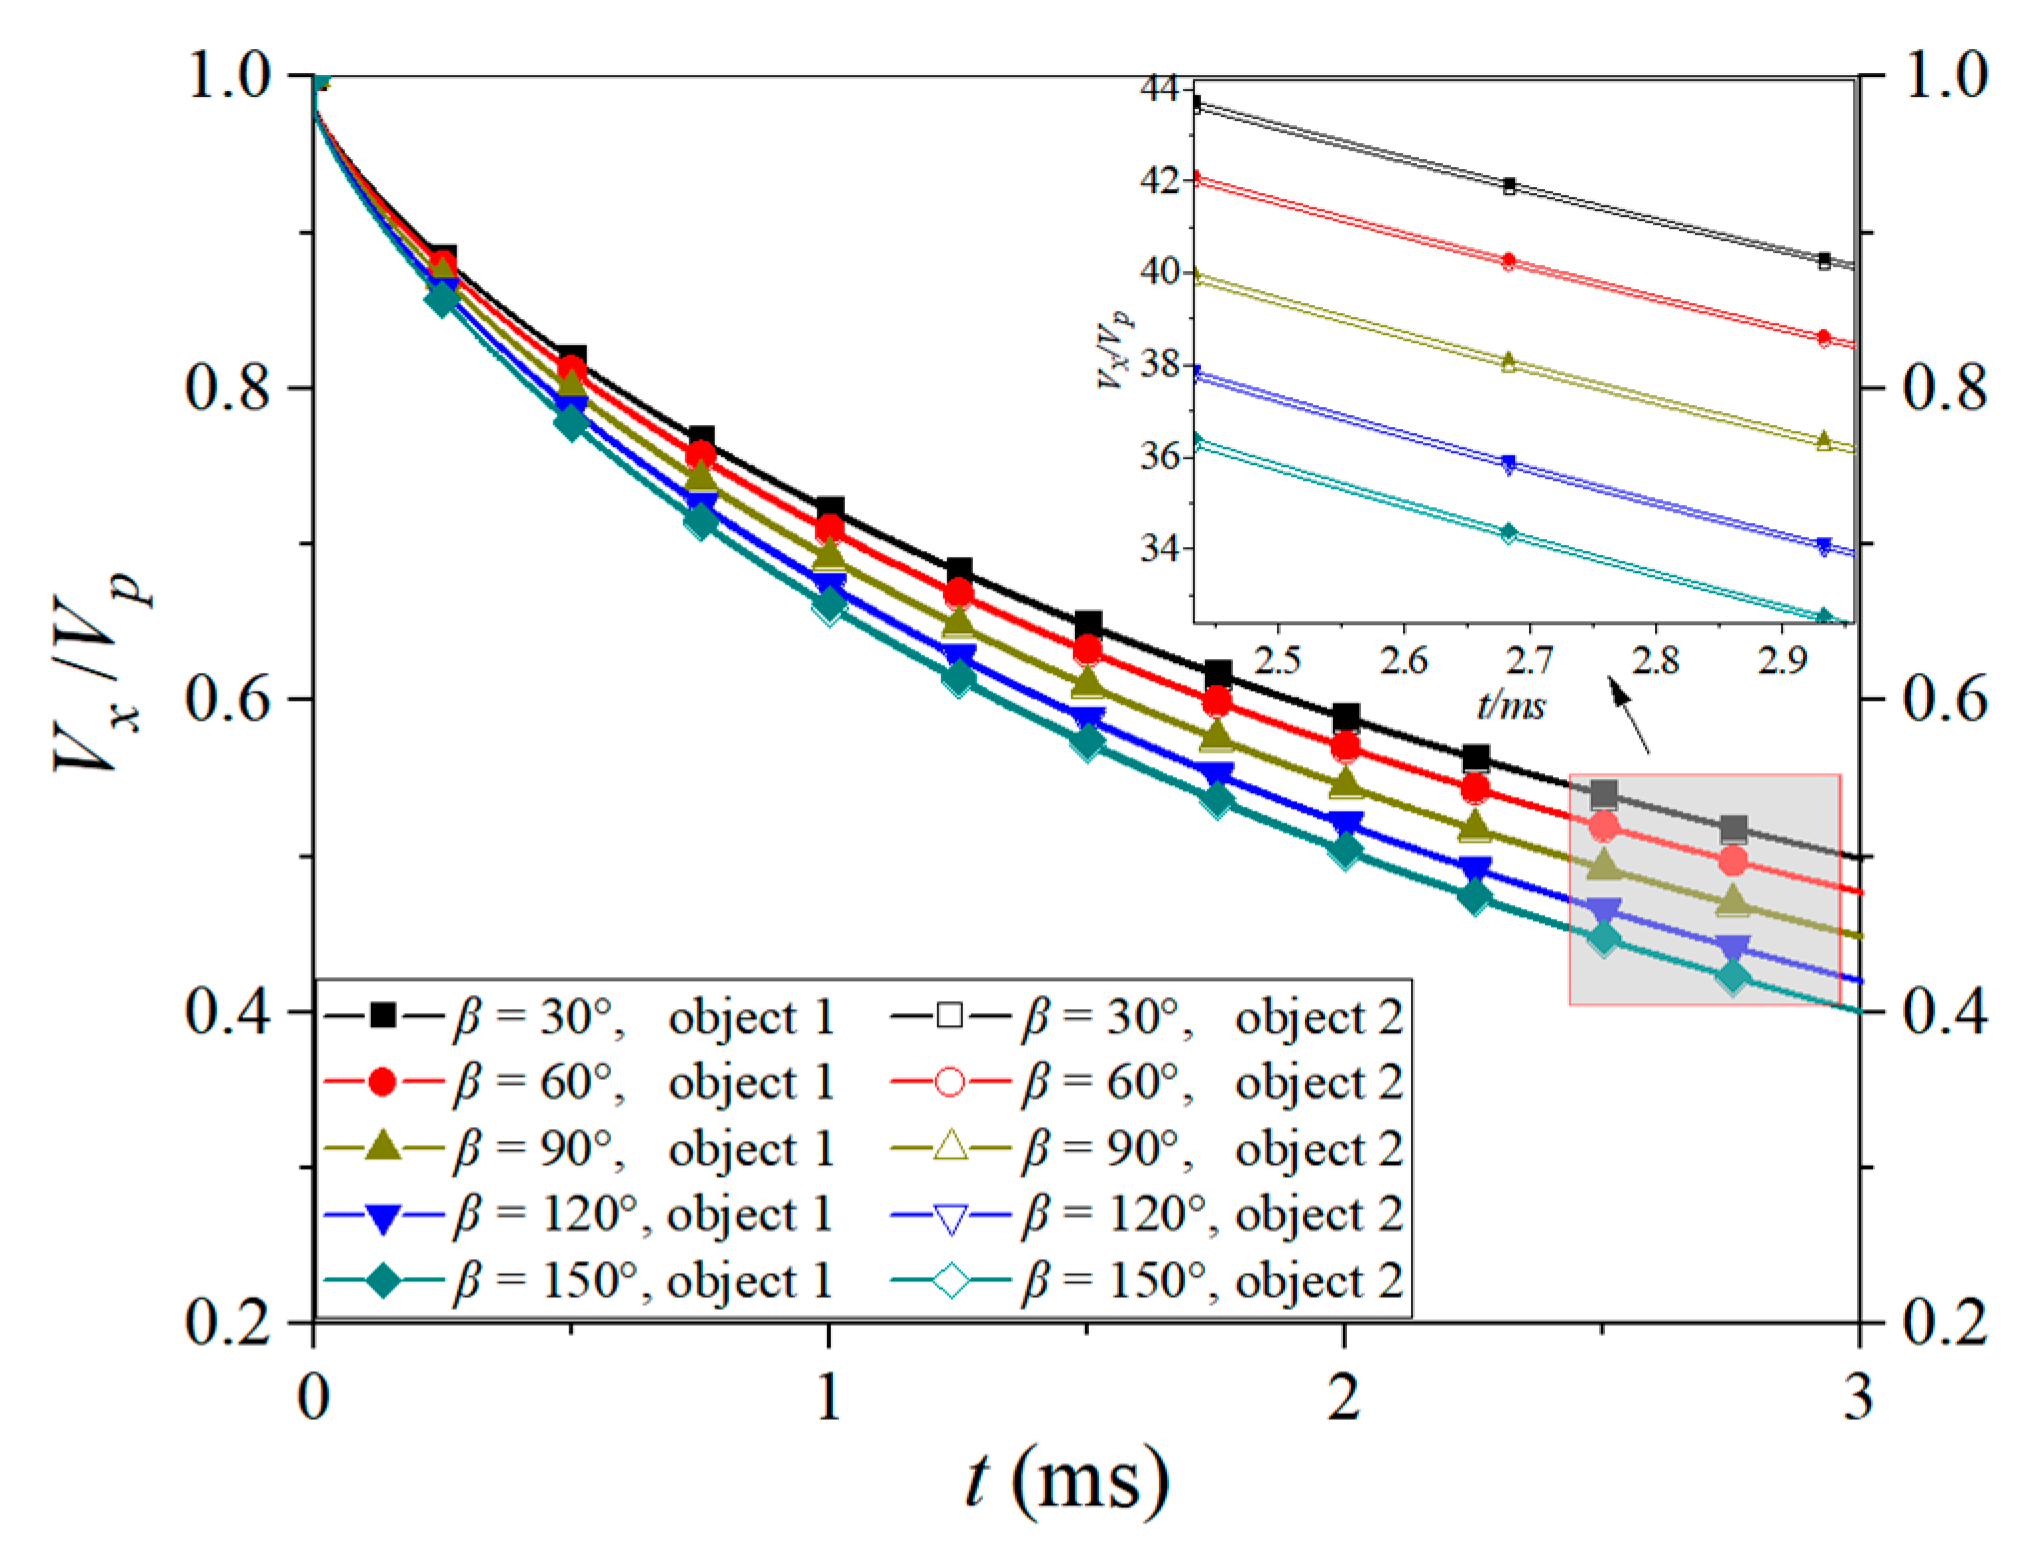
Figure 19 shows the variation in the axial velocities of the objects with time. As depicted, the axial velocities of both objects gradually decrease under all conditions. Under a specified condition, it is difficult to observe the difference in the axial velocity change between the two objects. The decrease in the objects’ velocities become faster with the increase in β. The reason is the same as that for the single object. At t = 3 ms, the axial velocity decreases by about 50% under the condition of β = 30°, while the axial velocity decreases by about 60% under the condition of β = 150°.
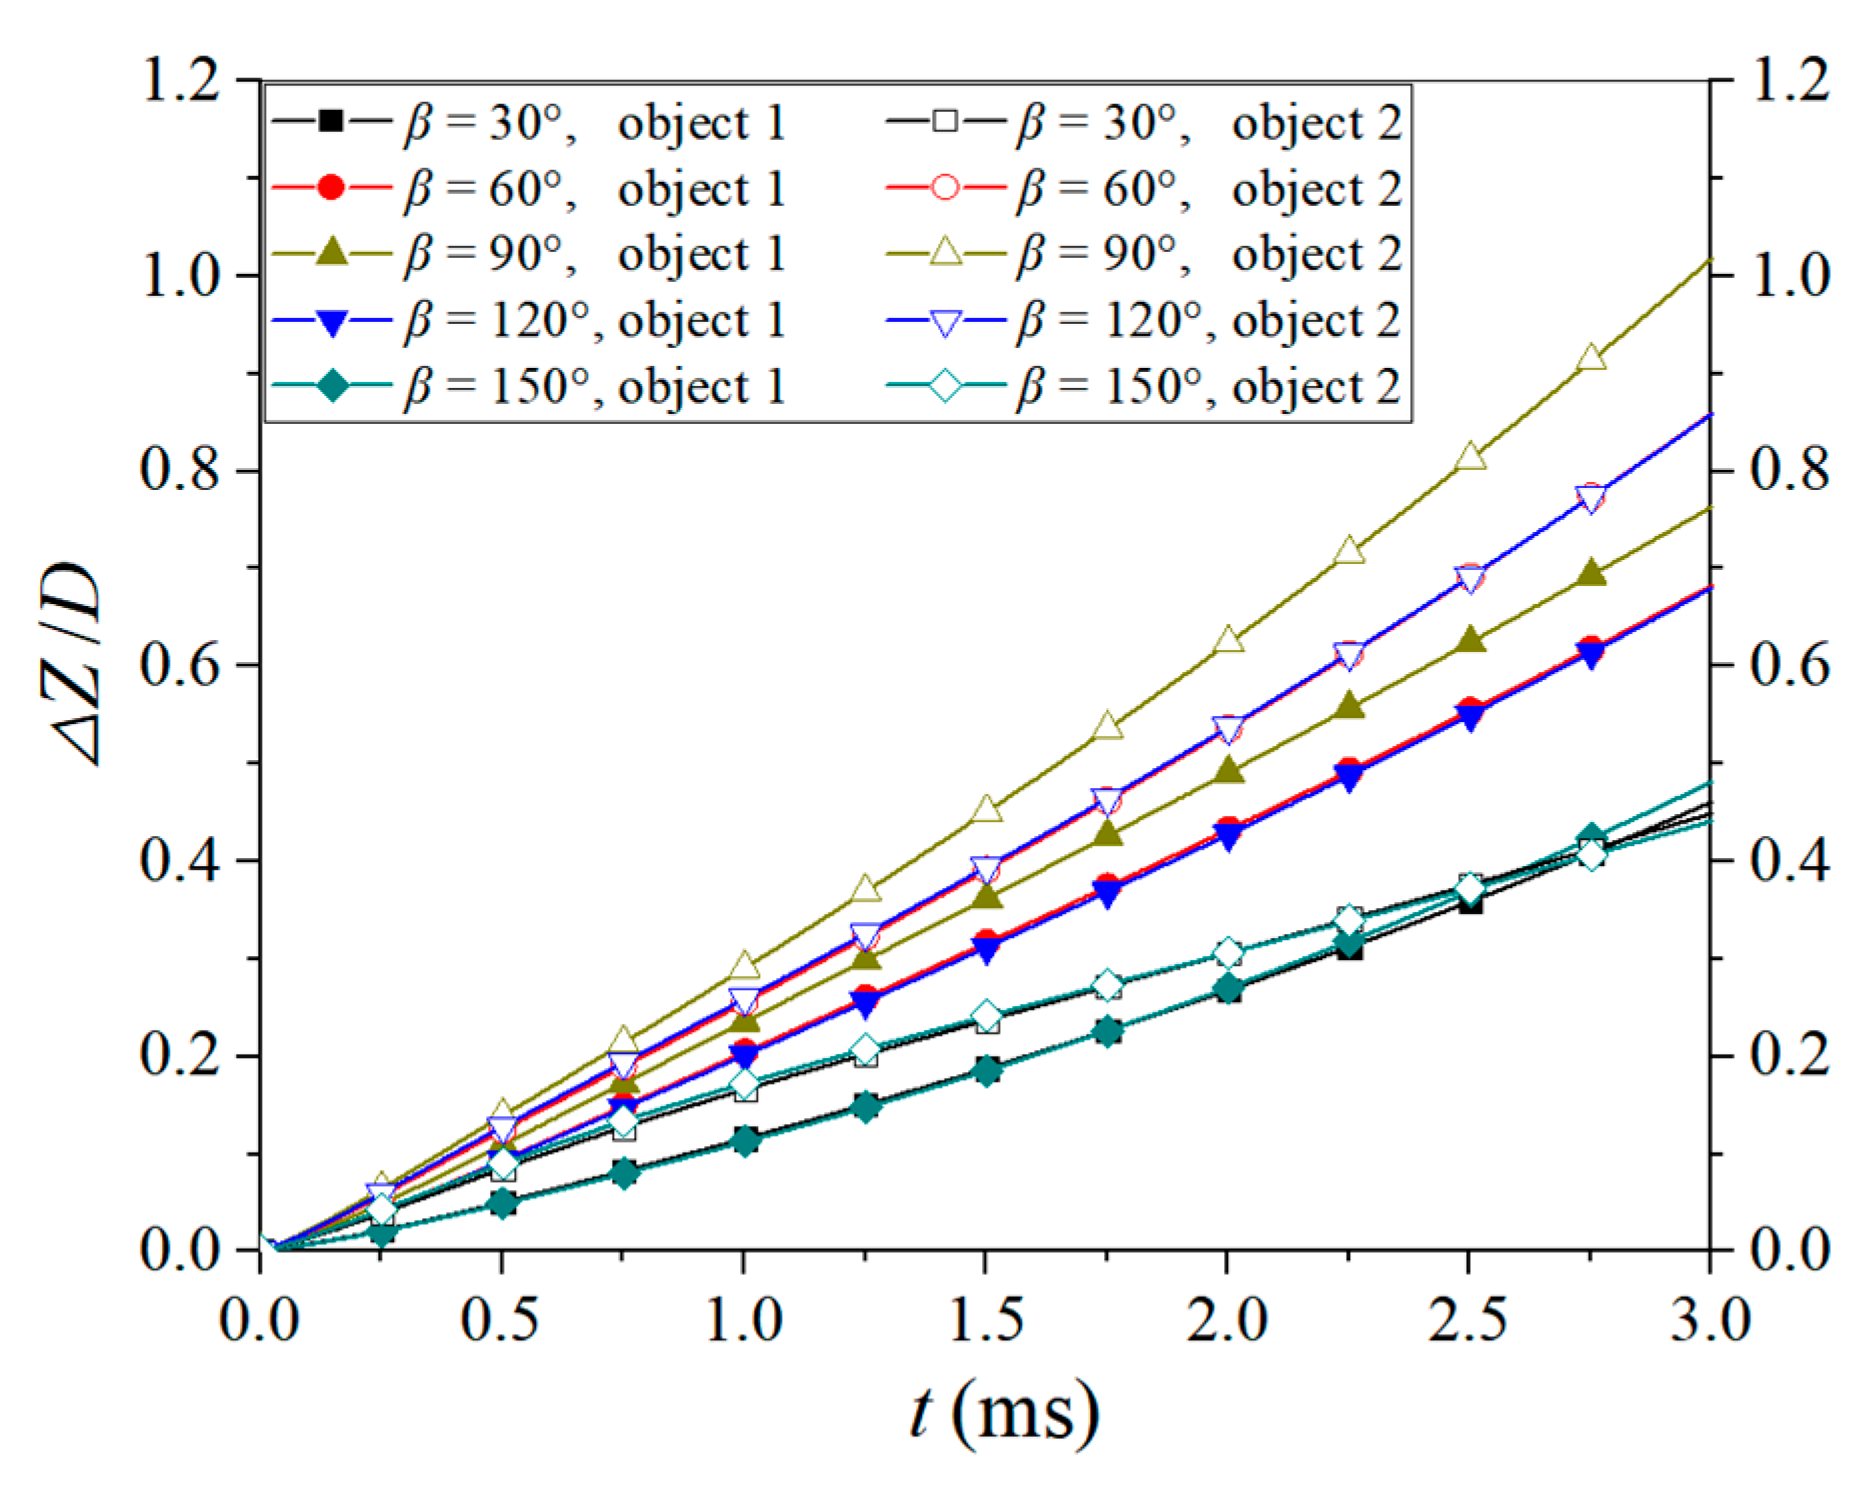
Figure 20 shows the deviation speed of the objects under different conditions. Correspondingly, Figure 21 represents the change in the deviation displacement. As can be observed, the deviation speed of the downstream object is at first mildly higher than that of object 1 and then gradually decreases to become smaller than that of object 1 in the case of β = 30°. The change trend and magnitude of the deviation velocity under the condition of β = 150° are similar to those for β = 30°.
Under the condition of β = 60°, the deviation speed of the downstream object has a larger value than that of object 1, which is similar to that for β = 120°. The deviation speeds of the two objects for β = 60° and 120° are higher than those for the conditions of β = 30° and 150°, which may be due to the fact that the z-component of the lateral flow velocity for β = 60° and 120° is greater than that of the conditions of β = 30° and 150°. Under the condition of β = 90°, the deviation velocities of both objects are greater than those under the other conditions, and the deviation speed of the downstream object is greater than that of object 1.
It can be seen from Figure 21 that the lateral distance between the two objects is basically unchanged for the conditions of β = 30° and 150°. Under the conditions of β = 60° and 120°, the lateral distance between the objects slightly increases and is maximal for β = 90°.
Figure 22 gives the change in α with time under the different conditions. Under the condition of β = 30°, the α of object 1 is counterclockwise and grows with time, while the clockwise deflection angle first increases and then decreases for the downstream object. That is, the deflection trends of objects 1 and 2 are opposite in the initial period. This may be due to the high-pressure effect at the object head between the two objects. Thus, the downstream object is deflected clockwise, and object 1 is deflected counterclockwise. Then, when the re-wetted region appears on the rear part of the downstream object, object 2 is subjected to a counterclockwise torque, which gives object 2 a counterclockwise angular acceleration. As the angular speed of the downstream object decreases to zero, the downstream object rotates counterclockwise under the action of the counterclockwise torque. Consequently, the clockwise deflection angle decreases.
The deflection angles for β = 120° and 150° are close to those for the conditions of β = 60° and 30°, respectively, which may be due to the lateral flow having the same z-component magnitude between the conditions of β = 30° and 150° and between β = 60° and 120°. As the z-component of the lateral flow velocity decreases, the positive α for object 1 increases. But for object 2, with the decrease in the z-component of the lateral flow, the clockwise deflection angle also decreases. Thus, under the condition of β = 90°, at a certain time, the α of object 1 is minimal, and for object 2, the absolute value of α is maximal for all of the conditions.

4.3. Effect of Lateral Inflow Angles on Tandem Objects

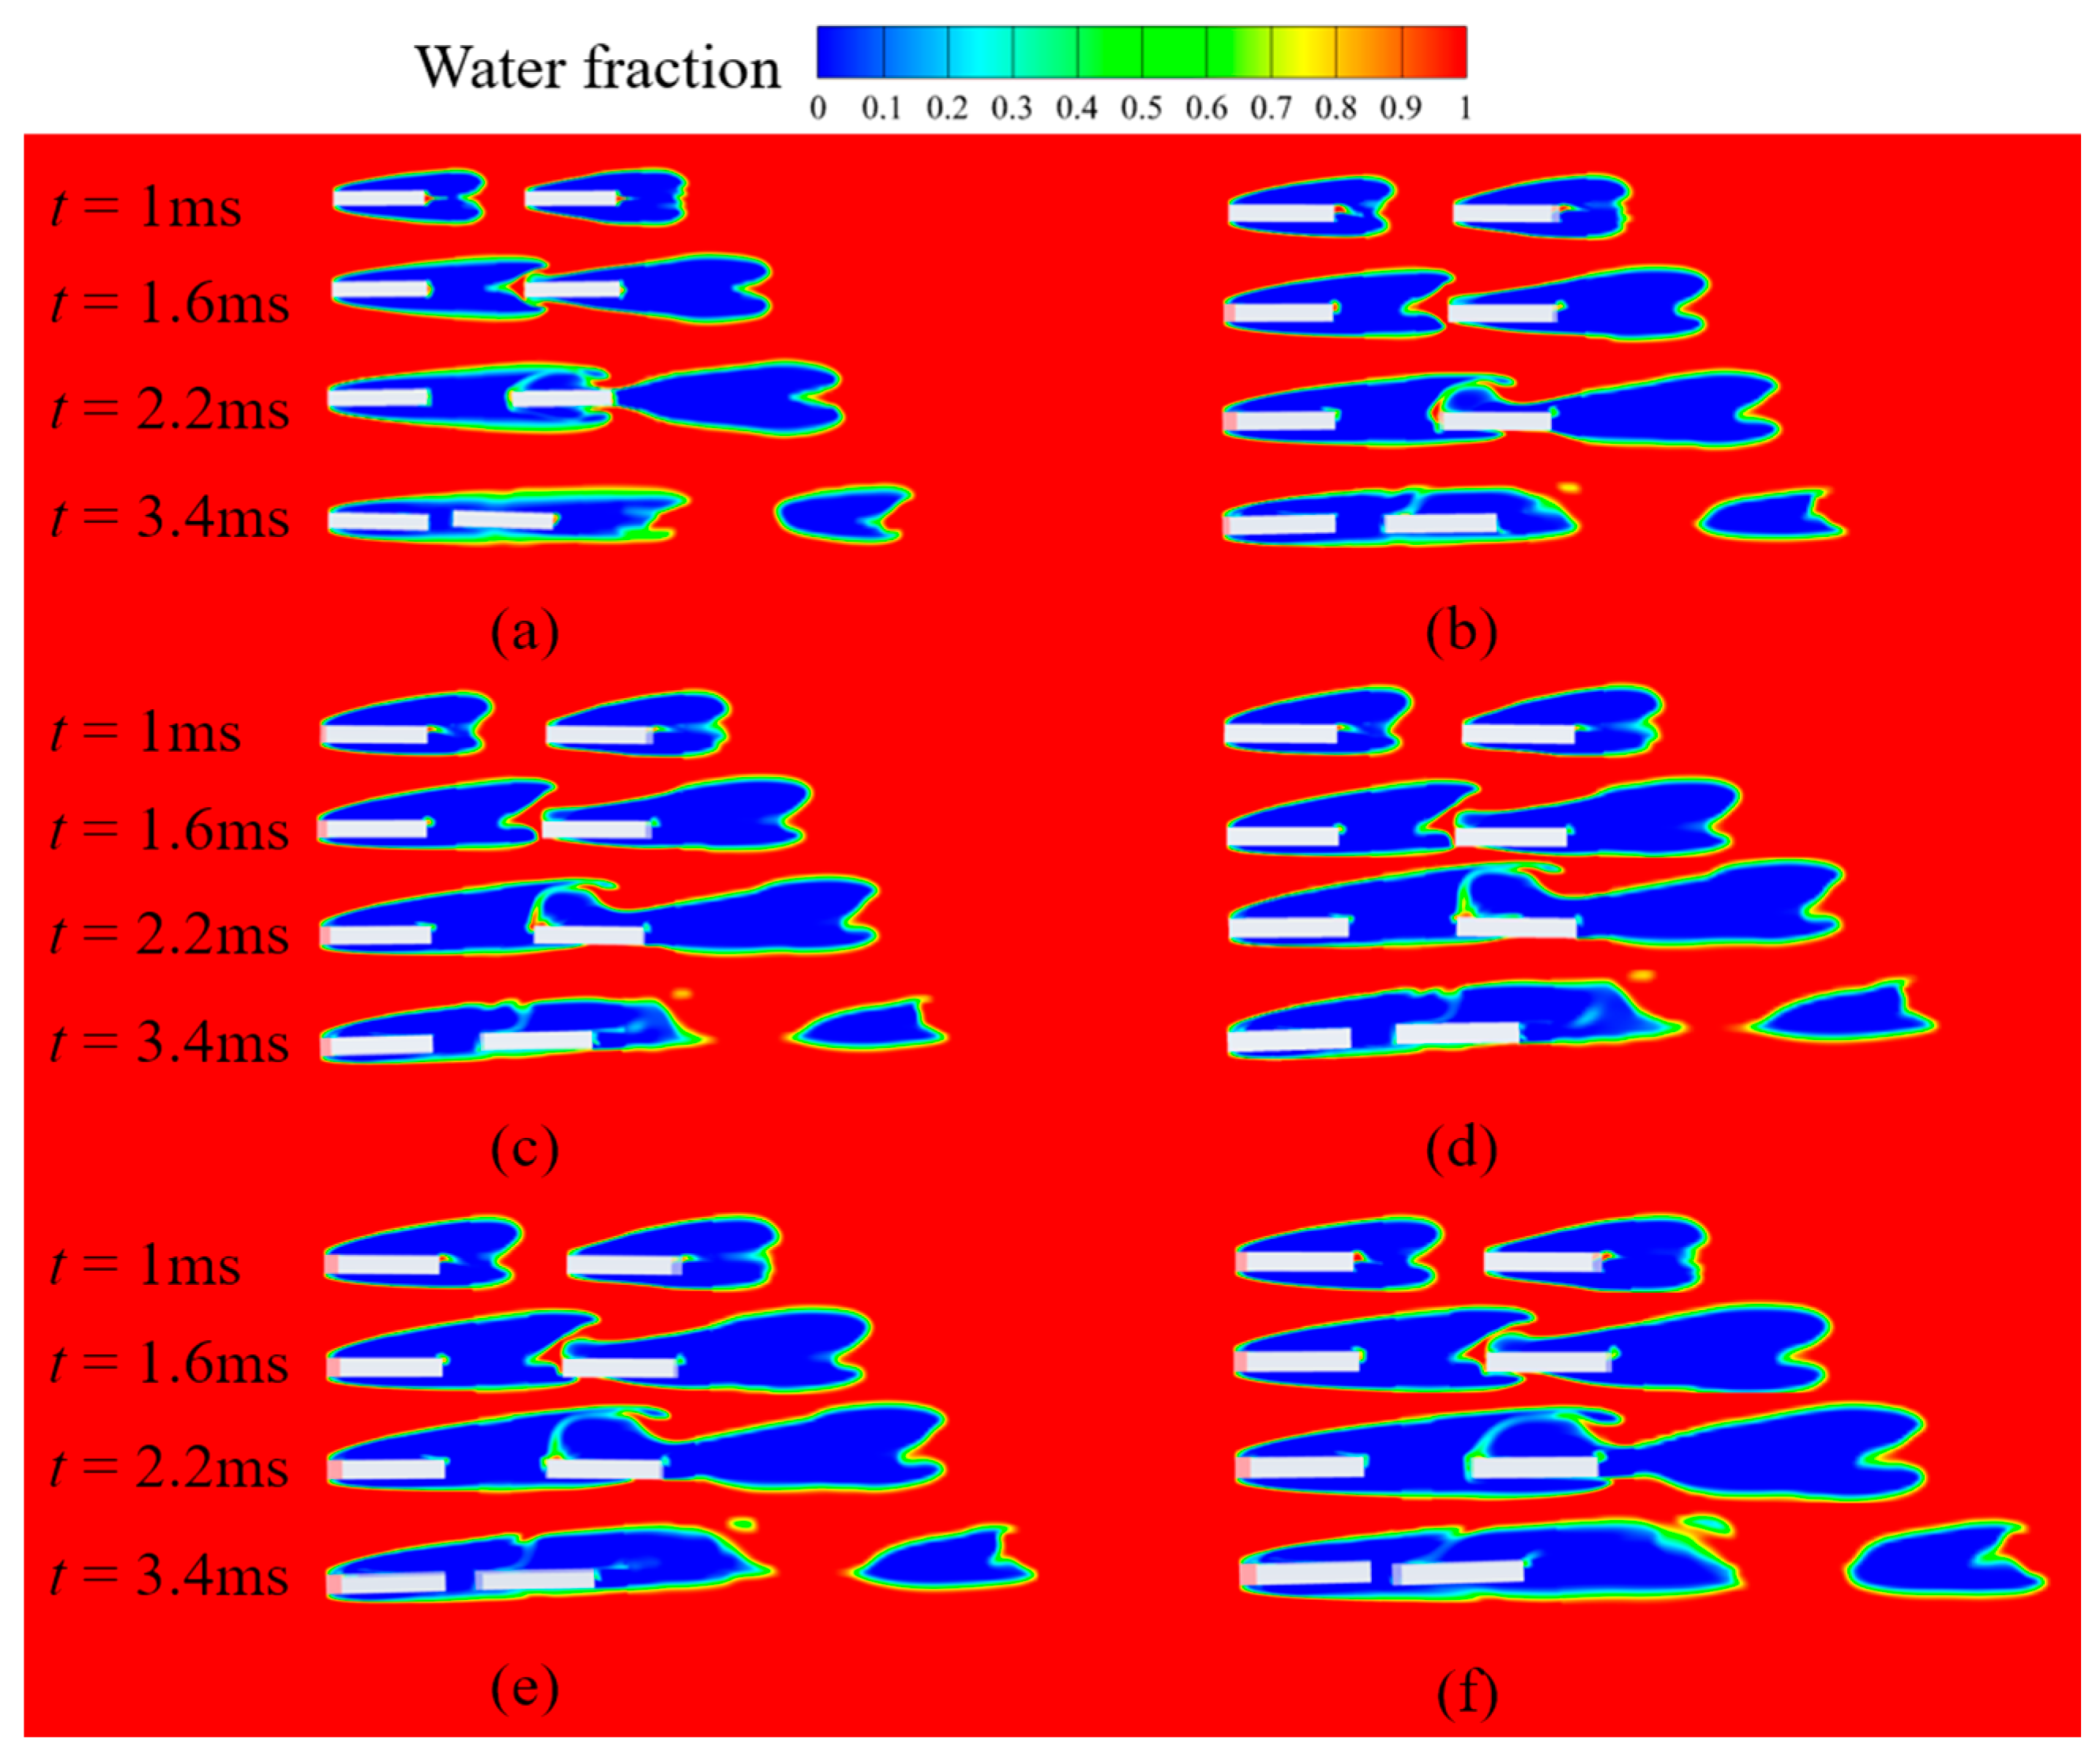
In this subsection, several different conditions for the series objects are discussed. The axial distance between the two series objects is 6D. The other parameters are the same as those for the parallel objects. The investigated incoming angles for the lateral flow are still 30°, 60°, 90°, 120° and 150°. The initial movement direction of the objects is the same as that for the single/parallel object(s).

4.3.1. Effect on the Supercavitation Profile and Size of Tandem Objects

Figure 23 shows the cavitation evolution of the series objects for different cases. Figure 23a gives the results under the condition with no lateral flow. As depicted, both objects are enveloped by their respective cavities at t = 1 ms, and then both cavities independently develop. At t = 1.6 ms, the cavity tail of object 1 has reached the head of object 2. The cavity profile of object 2 deforms due to the existence of the front cavity, and the cavity deformation around object 2 mainly appears at the head. With the continuous development of the cavity of object 1, at t = 2.2 ms, the partial wall of object 2 has been enveloped by the front cavity. At this time, the distance between the two objects is decreased, and the cavitation around object 2 is squeezed to the object’s tail. Finally, the cavity at the tail of object 2 is shed, and object 2 moves inside the cavity of the front object at t = 3.4 ms. Thus, the drag force on object 2 must be much lower than that of the front object. Consequently, the velocity decay of object 2 becomes slower than that of object 1, which can be proved by the decrease in the distance between the objects.
Under the condition of β = 30°, the cavitation evolution of the series objects in this case and in the case of no lateral flow are similar. However, there are differences between the two conditions. At t = 2.2 ms, at the following object’s tail, the two sides are wetted in the case of no lateral flow (Figure 23a). But in Figure 23b, the re-wetted zone only appears on the incoming side, and the whole wall on the backflow side is still enveloped by the cavity. The asymmetry of the wetted zone is induced by the cavity asymmetry for β = 30°.
For β = 60°, on the incoming side of the following object, the re-wetted zone is bigger than that for β = 30° at t = 2.2 ms, which is induced by the increased cavity asymmetry with the increase in the z-component of the lateral flow. Under the condition of β = 90°, the re-wetted zone is nearly the same as that under the condition of β = 60°. With the increase in the lateral incoming angle from β = 90° to 150°, the re-wetted zone on the incoming side of the following object becomes smaller. For β = 150°, at t = 2.2 ms, the front object’s cavity has completely wrapped the following object. The decrease in the wetted zone for β = 120° and 150° may be mainly due to the increase in the cavity length of the front object with a higher relative axial velocity of the objects compared with β = 60° and 30°, respectively.
At the time of 3.4 ms, in the case of no lateral flow, object 2 has already moved in the cavity of object 1, similar to the cases of β = 30° and 150°. However, under the conditions of β = 60° and 90°, on object 2’s incoming side, it seems that there still exists the little wetted zone.
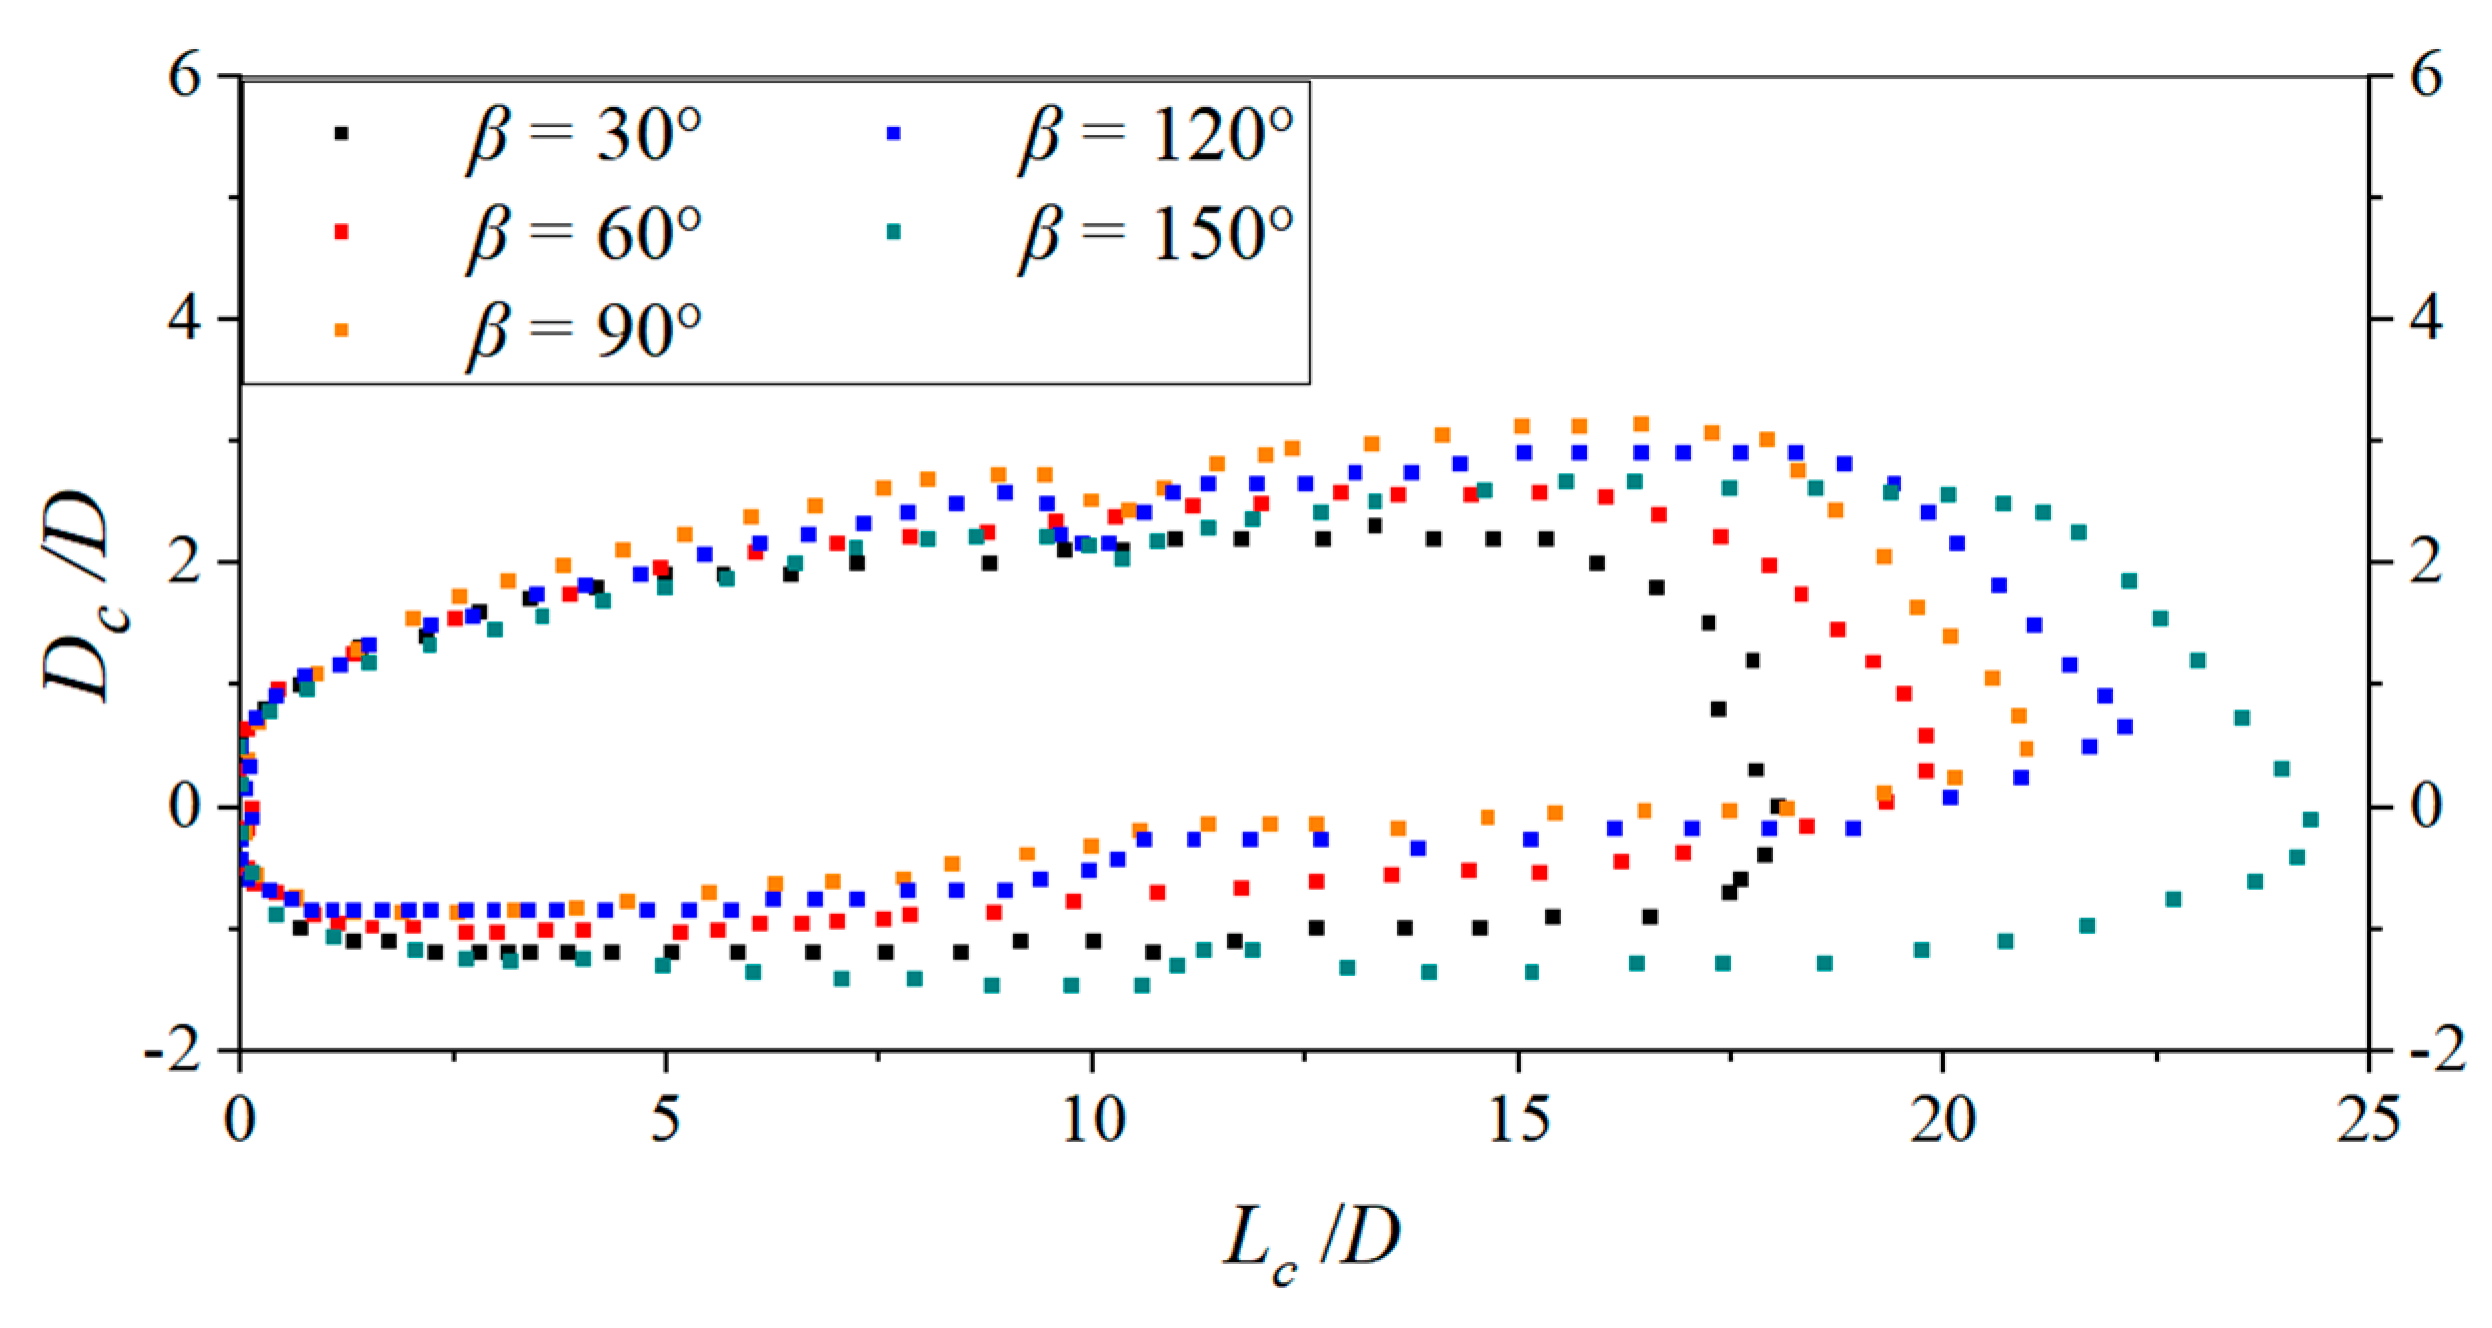
Figure 24 shows the cavity contour at t = 3.4 ms under different conditions, where object 2 is inside the front object’s supercavity. As shown in the figure, as the lateral inflow angle increases, the cavity length grows. Under the condition of β = 30°, the dimensionless cavity length is the smallest, about 1. However, under the condition of β = 150°, the dimensionless cavity length is the greatest, reaching up to about 24.

4.3.2. Effect on the Hydrodynamic Characteristics and Trajectories of Series Objects

Figure 25 shows the variation in the axial velocity of the two series objects in different cases. As depicted, in any case, the front object’s velocity continuously declines. Meanwhile, with the increase in the lateral inflow angle, the axial velocity decay rate of object 1 increases. That is, for β = 30° and 150°, the decay rate of the axial velocity is the slowest and the fastest, respectively. This conclusion is consistent with that for the single or parallel object(s).
For object 2 of the series objects, the variation trend of the axial velocity is different from that of the front object. For all conditions, before the time of 0.75 ms, the axial velocity stably decays, then the decay rate becomes slower between 0.75 and 1.75 ms, and, finally, it is nearly zero after 1.75 ms. The reason for the decay rate change is explained below.
At the time point of 0.75 ms, for object 2, the speed decay rate has slowed down. The reason may be as follows. Object 1 is located in front of object 2. After object 1 passes, the water after object 1 has a small positive velocity, which is beneficial for the movement of object 2. Thereafter, with the elongation of the front cavity and the decrease in the distance between the objects, object 2 is close to the tail of the front cavity and starts to enter it. At this time, the drag force on the following object dramatically decreases. Thus, the velocity of object 2 remains nearly constant.
Under the condition of β = 30°, the decrease in the axial speed of the following object is the smallest. The decrease in the axial velocity under the conditions of β = 90°, 120° or 150° is nearly the same and the highest. The decrease in the axial velocity under the condition of β = 60° is in the middle. Due to the difference in the axial speed between objects 1 and 2, object 2 will catch up with object 1 and collide with it, which is beyond the scope of the discussion of this paper.
Figure 26 shows the deviation velocity change of the series objects under different conditions. As can be observed, for β = 30°, the deviation velocities of objects 1 and 2 are similar before the time of 1.5 ms. Between 1.5 and 2.25 ms, the deviation speed of object 2 rapidly increases and is larger than that of object 1. After 2.25 ms, the following object’s deviation velocity remains nearly constant. For object 2, the rapid growth in the deviation speed occurs in that period when object 2 is close to the tail of the front cavity and then starts to enter it. During this period, the wall of object 2 on the incoming side is wetted, but the wall on the backflow side is still covered by the cavitation. Thus, on object 2, the deviation force increases and then the deviation speed increases. After 2.75 ms, the following object moves inside the front object’s cavity. During this period, the force on object 2 substantially decreases and the deviation velocity remains unchanged.
The variation tendency of the deviation speed of the rear object under the condition of β = 150° is similar to that for β = 30°. However, because the cavity length for β = 150° is longer than that under the condition of β = 30°, the time at which the rear object starts to enter into the front cavity is about 1.4 ms, which is slightly earlier than that under the condition of β = 30°. Thus, at t = 1.4 ms, for the condition of β = 150°, the increase in the deviation speed of the rear object is obvious. In addition, the time at which the rear object entirely enters the front cavity is earlier than that under the condition of β = 30°. That is, the time interval in which object 2 is partly wetted is shorter under the condition of β = 150° than that of β = 30°. Thus, the deviation velocity of object 2 under the condition of β = 150° is smaller than that for β = 30°.
Under the conditions of β = 60°, 90° and 120°, the variation tendencies of the two objects are almost consistent with those under the conditions of β = 30° and 150°. However, the magnitude of the deviation velocity is different for the different conditions. As the z-component of the lateral flow increases, the deviation speed also increases. The deviation velocity under the condition of β = 60° or 120° is higher than that for β = 30° or 150°. The deviation velocities of objects 1 and 2 under the condition of β = 90° are the highest among all the conditions, reaching around 35% and 65% of the transverse flow velocity at 3.5 ms, respectively.
Figure 27 represents the change in α for the series objects with time under the different conditions. A positive α value means a counterclockwise rotation around the y-axis. As can be observed, for the front object, the α value is first negative and then changes to positive under all the conditions.
The variation tendency of α for the rear object in the initial stage is almost the same as that for the front object. However, at about 1.6 ms, there appears to be a turning point on the α curve, which appears during the process in which the rear object enters into the front cavity. During this process, the rear object’s head on the incoming side becomes wetted and the pressure on this zone is higher, resulting in a clockwise deflection of object 2. At t = 2.2 ms, when object 2 enters the inside of the front cavity, the rear object’s cavity is squeezed towards its tail, and at this time the tail wall of the rear object on the incoming side is severely wetted. The pressure at this zone is higher than that at the other zones. Thus, object 2 is deflected counterclockwise.

5. Conclusions

The supercavtiation flow of underwater moving object(s) is simulated using the VOF model and the Sauer–Schnerr cavitation model. Overlapping grids and 6DOF technology were used to consider the movement of the object(s). The influence of the lateral incoming angle on the supercavitation evolution and hydrodynamic characteristics of the object(s) is investigated. The research shows that:
(1)
The cavitation profile exhibits asymmetry because of the effect of the lateral flow. As the z-component of the lateral flow increases, the cavity profile’s asymmetry also increases. The cavity length is related to the relative axial speed between the object(s) and the water.
(2)
In the investigated cases for the parallel objects, the cavity profile is determined by the superimposed influence of the lateral flow and the nearby object. For object 1, the influence of the lateral flow and the nearby object is opposite in the inner zone, and thus the cavity asymmetry is weakened. However, the influence of the lateral flow and the nearby object is superimposed on the incoming side of object 2, and the cavity asymmetry is enhanced. Compared to object 2, the trajectory stability of object 1 is better. As the lateral incoming angle increases, the decay rate of the axial speed for the two objects decreases.
(3)
For the series objects, the supercavity length increases as the lateral incoming angle increases after object 2 enters the front cavity. As the z-component of the lateral flow velocity increases, the deviation speed increases. During the process of object 2 entering the front cavity, the increase in the deviation speed is obvious.

Author Contributions

H.J. and L.Z. designed the investigation; J.C. carried out the validation; R.X. and C.Z. conducted the simulations and data analysis; R.X. and H.J. prepared the original draft; H.J. and L.Z. discussed and revised the draft. All authors have read and agreed to the published version of the manuscript.

Funding

The National Natural Science Foundation of China (grant no. U21A20126) and the Natural Science Foundation of Zhejiang Province, China (grant nos. LQ13A020005 and LY17E060006), funded this research.

Data Availability Statement

The data presented in this study are available on request from the corresponding author due to privacy reasons.

Acknowledgments

The authors are grateful to Honghui Shi and Donghui Zhou for his helpful advice in the research process.

Conflicts of Interest

The authors declare no conflicts of interest.

References

  1. Ceccio, S.L. Friction drag reduction of external flows with bubble and gas injection. Annu. Rev. Fluid Mech. 2010, 42, 183–203. [Google Scholar] [CrossRef]
  2. Logvinovich, G.V. Hydrodynamics of Free-Boundary Flows (Gidrodinamika Techenii so Svobodnymigranitsami); IPST Press: Jersualem, Israel, 1972. [Google Scholar]
  3. Vasin, A.D. The Principle of Independence of the Cavity Sections Expansion (Principle of Logvinovich) as the Basis for Investigation on Cavitation Flows; National Tax Association—Tax Institute of America: Washington DC, USA, 2001. [Google Scholar]
  4. Aristoff, J.M.; Bush, J.W.M. Water entry of small hydrophobic spheres. J. Fluid Mech. 2009, 619, 45–78. [Google Scholar] [CrossRef]
  5. Savchenko, Y.N.; Vlasenko, Y.D.; Semenenko, V.N. Experimental studies of high-speed cavitated flows. Int. J. Fluid Mech. Res. 1999, 26, 365–374. [Google Scholar] [CrossRef]
  6. Hrubes, J.D. High-speed imaging of supercavitating underwater projectiles. Exp. Fluids 2001, 30, 57–64. [Google Scholar] [CrossRef]
  7. Burkin, V.; Akinshin, R.N.; Afanaseva, S.A.; Borisenkov, I.L.; Ishchenko, A.N.; Khabibullin, M.V.; Chupashev, A.V.; Yugov, N.T. Features of high-velocity penetration and motion of supercavitating kinetic strikers in water. J. Eng. Phys. Thermophys. 2018, 91, 655–662. [Google Scholar] [CrossRef]
  8. Nguyen, V.T.; Vu, D.T.; Park, W.G.; Jung, C.M. Navier–stokes solver for water entry bodies with moving chimera grid method in 6dof motions. Comput. Fluids 2016, 140, 19–38. [Google Scholar] [CrossRef]
  9. Zhang, Q.; Zong, Z.; Sun, T.Z.; Chen, Z.; Li, H.T. Experimental study of the evolution of water-entry cavity bubbles behind a hydrophobic sphere. Phys. Fluids 2020, 32, 062109. [Google Scholar] [CrossRef]
  10. Güzel, B.; Korkmaz, F.C. Experimental investigation of water entry of bodies with constant deadrise angles under hydrophobic effects. Exp. Fluids 2021, 62, 107–128. [Google Scholar] [CrossRef]
  11. Watson, D.A.; Bom, J.M.; Weinberg, M.P.; Souchik, C.J.; Dickerson, A.K. Water entry dynamics of spheres with heterogeneous wetting properties. Phys. Rev. Fluids 2021, 6, 044003. [Google Scholar] [CrossRef]
  12. Jia, H.; Xie, R.; Zhou, Y. Experimental investigation of the supercavitation and hydrodynamic characteristics of high-speed projectiles with hydrophobic and hydrophilic coatings. Fluids 2022, 7, 363. [Google Scholar] [CrossRef]
  13. Yun, H.; Lyu, X.; Wei, Z. Experimental study on oblique water entry of two tandem spheres with collision effect. J. Vis. 2020, 23, 49–59. [Google Scholar] [CrossRef]
  14. Mnasri, C.; Hafsia, Z.; Omri, M.; Maalel, K. A moving grid model for simulation of free surface behavior induced by horizontal cylinders exit and entry. Eng. Appl. Comput. Fluid Mech. 2010, 4, 260–275. [Google Scholar] [CrossRef]
  15. Lu, L.; Yan, X.; Li, Q.; Wang, C.; Shen, K.C. Numerical study on the water-entry of asynchronous parallel projectiles at a high vertical entry speed. Ocean Eng. 2022, 250, 111026. [Google Scholar] [CrossRef]
  16. Xu, H.; Wei, Y.; Wang, C.; Lu, J. On wake vortex encounter of axial-symmetric projectiles launched successively underwater. Ocean Eng. 2019, 189, 106382. [Google Scholar] [CrossRef]
  17. Ishchenko, A.N.; Afanaseva, S.A.; Burkin, V.; Dyachkovskii, A.S.; Chupashev, A.V. Studying the mutual influence of a set of strikers during simultaneous high-velocity entry into water. Tech. Phys. Lett. 2019, 45, 1059–1062. [Google Scholar] [CrossRef]
  18. Yun, H.; Lyu, X.; Wei, Z. Experimental study on vertical water entry of two tandem spheres. Ocean Eng. 2020, 201, 107143. [Google Scholar] [CrossRef]
  19. Zhou, D.; Shi, H.; Jia, H. Characteristics of the multiphase flow field with super-cavitation induced by successively fired projectiles under-water and cross-medium. J. Mech. Sci. Technol. 2022, 36, 247–258. [Google Scholar] [CrossRef]
  20. Qi, C.; Wang, X.; Lyu, X. On the flow characteristics of two supercavitating projectiles moving in water side-by-side. Phys. Fluids 2023, 35, 017127. [Google Scholar] [CrossRef]
  21. Yu, D.; Wang, C.; He, C. Numerical simulation of cavitation and motion characteristics during parallel water entry of rotating bodies. J. Harbin Inst. Technol. 2021, 53, 23–32. [Google Scholar]
  22. Wang, M.; Fan, C.; Hou, G. Numerical research of lateral flow influence on supercavitating flow. AIP Adv. 2022, 12, 045214. [Google Scholar] [CrossRef]
  23. Zhang, L.; Zhang, C.; Jia, H.; Dong, R.L. Effects of lateral flows on the super- cavitation and hydrodynamic characteristics of underwater series and parallel high-speed projectiles. J. Mar. Sci. Eng. 2023, 11, 878. [Google Scholar] [CrossRef]
  24. Zhou, L.; Wang, Z. Numerical simulation of cavitation around a hydrofoil and evaluation of a rng k-ε model. J. Fluids Eng. Trans. Asme 2008, 130, 011302. [Google Scholar] [CrossRef]
  25. Schnerr, G.H.; Sauer, J. Physical and numerical modeling of unsteady cavitation dynamics. In Fourth International Conference on Multiphase Flow; ICMF New Orleans: New Orleans, LO, USA, 2001; Volume 1. [Google Scholar]
  26. Patankar, S. Numerical Heat Transfer and Fluid Flow, 1st ed.; CRC Press: Washington, DC, USA, 1980. [Google Scholar]
  27. Muzaferija, S.; Peric, M.; Sames, P.C.; Schellin, T.E. A two-fluid navier-stokes solver to simulate water entry. In Symposium on Naval Hydrodynamics; National Academy Press: Washington, DC, USA, 1988; pp. 277–289. [Google Scholar]
  28. Guo, Z.; Zhang, W.; Xiao, X.; Wei, G.; Ren, P. An investigation into horizontal water entry behaviors of projectiles with different nose shapes. Int. J. Impact Eng. 2012, 49, 43–60. [Google Scholar] [CrossRef]
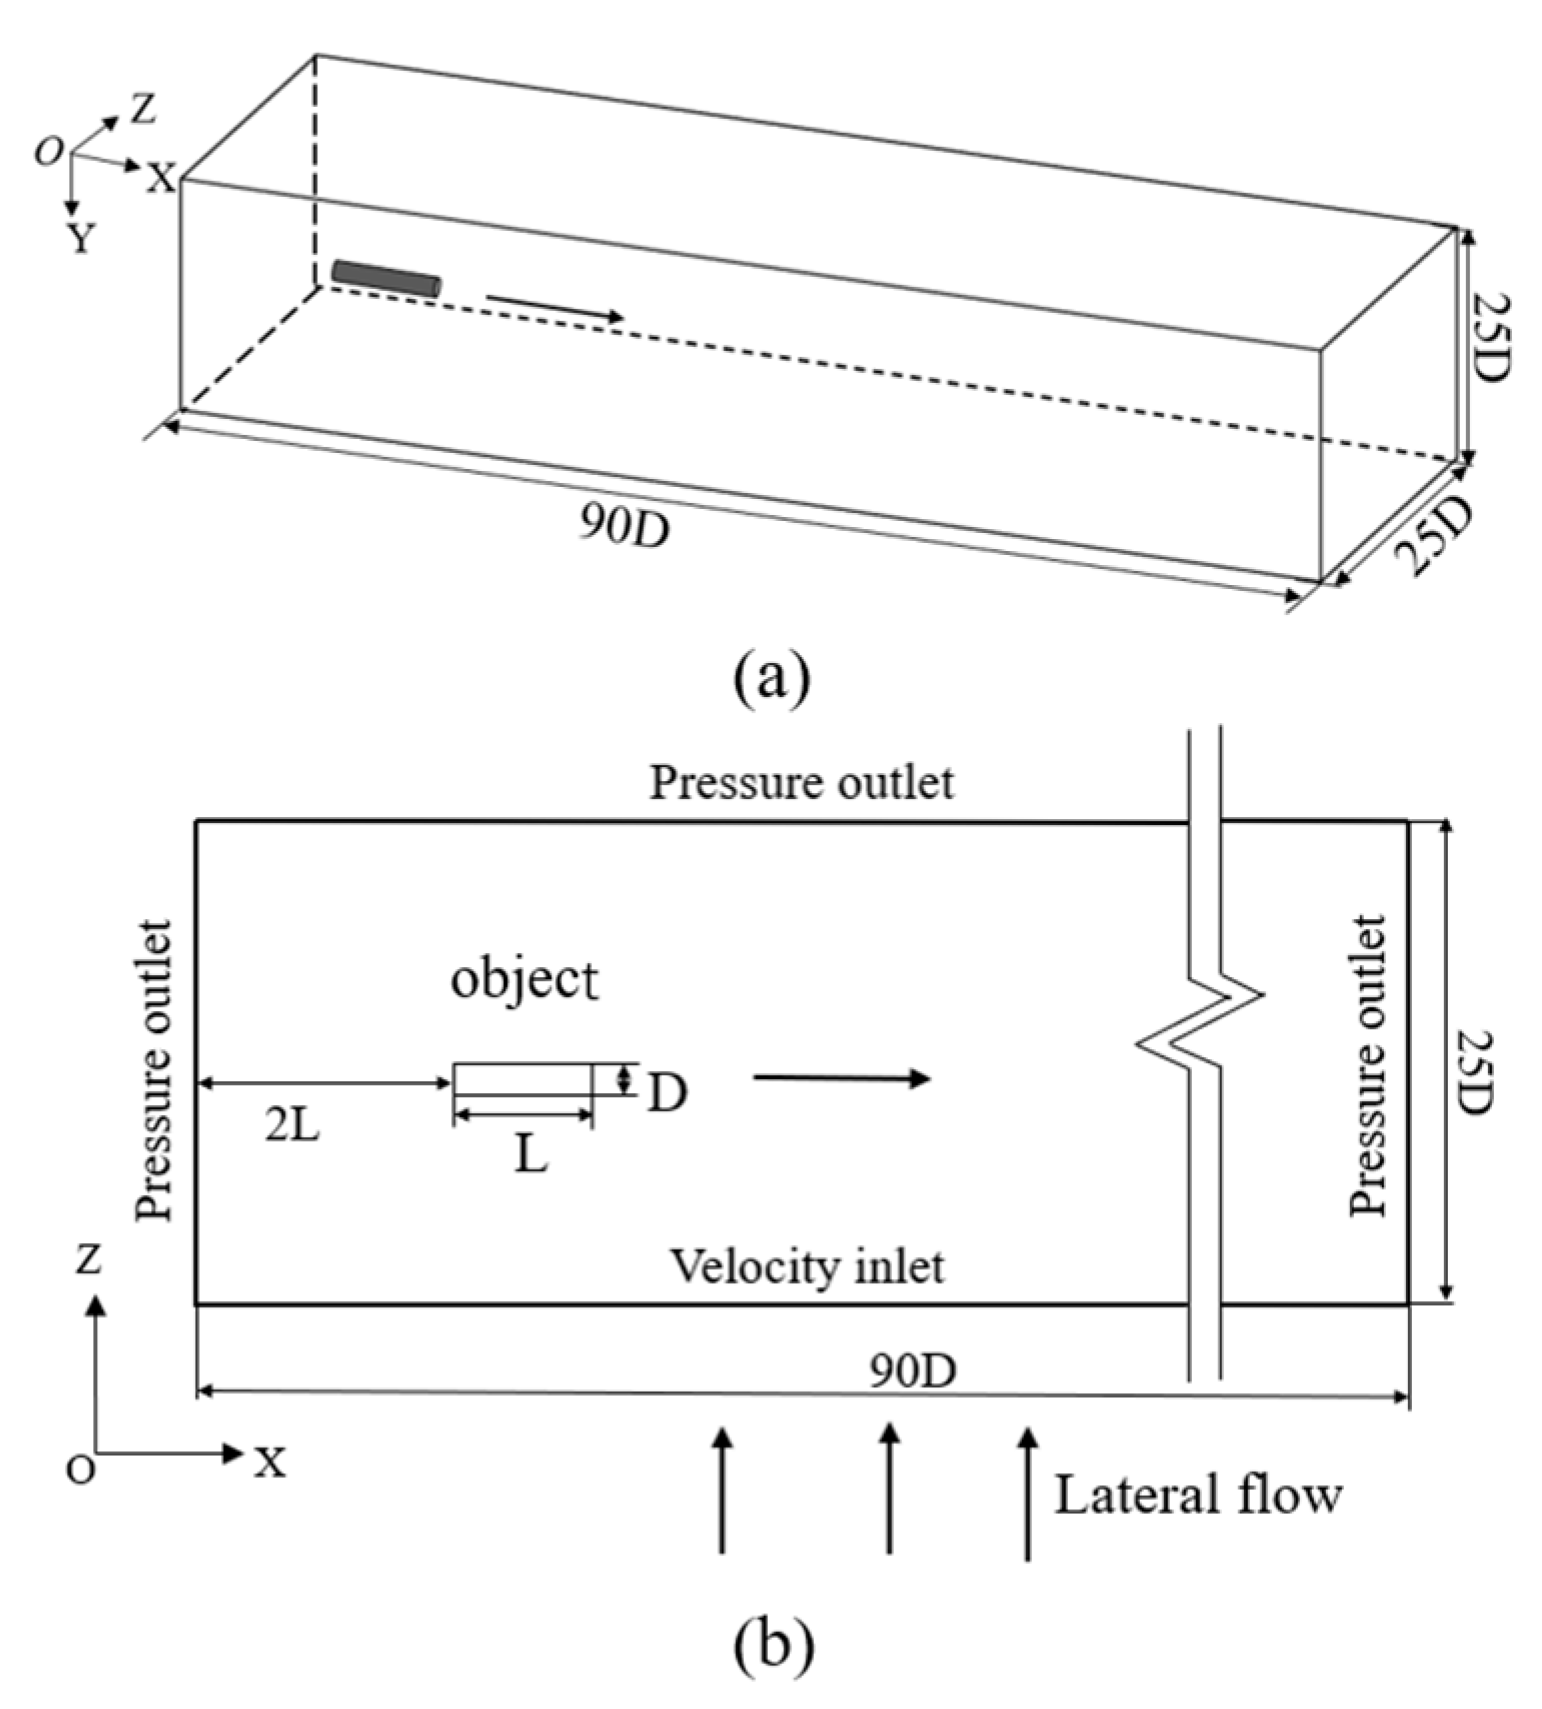
Figure 1. Diagrammatic sketch of the calculation area and boundary conditions for a single object: (a) 3D view and (b) 2D view in the XOZ plane.
Processes 12 01051 g001
Figure 2. Diagrammatic sketch of the calculation area and boundary conditions for objects in parallel: (a) 3D view and (b) 2D view in the XOZ plane.
Processes 12 01051 g002
Figure 3. Diagrammatic sketch of the calculation area and boundary conditions for series objects: (a) 3D view and (b) 2D view in the XOZ plane.
Processes 12 01051 g003
Figure 4. Diagrammatic sketch of the computational mesh in a 2D view: (a) a single object, (b) parallel objects and (c) tandem objects.
Processes 12 01051 g004
Figure 5. Comparison of results with different grid numbers. (a) Change in the velocity with time. (b) Change in the drag coefficient in the x-direction with time.
Processes 12 01051 g005
Figure 6. Supercavitation contour and velocity comparisons between the simulation and experiment [28]: (a) supercavitation contours and (b) velocity.
Processes 12 01051 g006
Figure 7. Schematic diagram of the lateral inflow angle (β).
Processes 12 01051 g007
Figure 8. Water-phase diagram at t = 1.8 ms under different lateral inflow angles: (a) no lateral flow, (b) β = 30°, (c) β = 60°, (d) β = 90°, (e) β = 120° and (f) β = 150°.
Processes 12 01051 g008
Figure 9. Cavity contours under different conditions at t = 1.8 ms: (a) upstream side and (b) backflow side.
Processes 12 01051 g009
Figure 10. Change in the radial size and length of the cavity with the lateral incoming angle.
Processes 12 01051 g010
Figure 11. Schematic diagram of the definition of α.
Processes 12 01051 g011
Figure 12. Drag coefficients in the x-direction under different conditions.
Processes 12 01051 g012
Figure 13. Axial velocity change with time under different conditions.
Processes 12 01051 g013
Figure 14. Change in the deviation velocity with time.
Processes 12 01051 g014
Figure 15. Change in the deviation displacement with time.
Processes 12 01051 g015
Figure 16. Change in the deviation angle (α) with time.
Processes 12 01051 g016
Figure 17. Cavitation evolution of the parallel objects in the XOZ plane: (a) without lateral flow, (b) β = 30°, (c) β = 60°, (d) β = 90°, (e) β = 120° and (f) β = 150°.
Processes 12 01051 g017
Figure 18. Cavity contours under different conditions at t = 2.0 ms.
Processes 12 01051 g018
Figure 19. Axial velocity change in the parallel objects with time.
Processes 12 01051 g019
Figure 20. Change in the deviation velocity with time.
Processes 12 01051 g020
Figure 21. Change in the deviation displacement with time.
Processes 12 01051 g021
Figure 22. Change in the deflection angle (α) with time.
Processes 12 01051 g022
Figure 23. Supercavitation evolution of the series objects in the XOZ plane: (a) without lateral flow, (b) β = 30°, (c) β = 60°, (d) β = 90°, (e) β = 120° and (f) β = 150°.
Processes 12 01051 g023
Figure 24. Cavitation contour around the front object (t = 3.4 ms).
Processes 12 01051 g024
Figure 25. Axial speed change of the series objects.
Processes 12 01051 g025
Figure 26. Change in the deviation speed with time.
Processes 12 01051 g026
Figure 27. Change in the deflection angle (α) with time.
Processes 12 01051 g027
Disclaimer/Publisher’s Note: The statements, opinions and data contained in all publications are solely those of the individual author(s) and contributor(s) and not of MDPI and/or the editor(s). MDPI and/or the editor(s) disclaim responsibility for any injury to people or property resulting from any ideas, methods, instructions or products referred to in the content.