

Parabolic Modeling Forecasts of Space and Time European Hydropower Production


Abstract
1. Introduction
- Energy Planning and Policy Making: Accurate forecasts of hydropower production capacity enable governments and energy planners to make informed decisions about future energy policies and infrastructure investments. Hydropower, a significant component of renewable energy portfolios, requires strategic planning to ensure it complements other energy sources. Forecasts help determine the optimal mix of energy sources, thereby enhancing energy security and reliability;
- Grid Stability and Management: Hydropower plants often play a crucial role in maintaining grid stability due to their ability to quickly ramp up and down production in response to fluctuating demand. By forecasting hydropower capacity, grid operators can better manage the balance between supply and demand, preventing blackouts and ensuring a stable electricity supply. This is particularly important as grids increasingly incorporate variable renewable energy sources like wind and solar power;
- Water Resource Management: Hydropower production is closely linked to water availability, which is subject to seasonal and annual variations. Forecasting helps in the effective management of water resources, ensuring that water storage and release schedules from reservoirs are optimized for power generation and other uses, such as irrigation, flood control, and potable water supply. This is especially critical in regions experiencing water scarcity or competing water demands;
- Climate Change Adaptation: Climate change significantly impacts precipitation patterns, snowmelt, and river flows, affecting hydropower production. Forecasting allows for the anticipation of these changes and the development of adaptive strategies to mitigate adverse effects. These strategies might include modifying operational protocols, enhancing reservoir capacity, or investing in climate-resilient infrastructure;
- Economic Efficiency: Hydropower is a capital-intensive investment, and its economic viability depends on consistent and predictable power generation. Accurate forecasts allow for better financial planning and risk management, giving investors and stakeholders confidence to support long-term hydropower projects. They also aid in setting competitive electricity tariffs, benefiting producers and consumers;
- Environmental Protection: Forecasting hydropower capacity helps minimize the environmental impact of power generation. By optimizing the timing and quantity of water releases, downstream ecosystems and biodiversity can be protected. Additionally, forecasts can aid in planning for fish migration and other ecological considerations often affected by hydropower operations;
- Integration with Other Renewables: As the share of renewable energy increases in the energy mix, hydropower can serve as a reliable backup to intermittent sources like wind and solar. Forecasting hydropower capacity enables better integration and coordination with these sources, ensuring a stable and continuous power supply. This hybrid approach leverages the strengths of different renewable technologies, maximizing overall system efficiency and resilience.
2. Background Literature
3. Materials and Methods
- (a)
- Hydropower production capacity is predictable;
- (b)
- The annual data of the hydropower production capacity are not affected by seasonality, a fact that indicates a simplified trend;
- (c)
- Curve Fit Forecast is a proper modeling tool that lends itself to process data not affected by seasonality;
- (d)
- The simple trend of the data led us to use the Curve Fit Forecast tool as the most suitable tool from the package available in the ArcGIS Time Series Forecasting toolset. Exponential Smoothing Forecasts moderate trends and strong seasonal behavior [68] (Buie, 2020), and Forest-based Forecast is used when the data exhibits intricate trends or seasonal patterns or undergoes changes that do not conform to typical mathematical functions like polynomials, exponential curves, or sine waves [69] (Esri, 2023).
3.1. Quadratic Time Model
3.2. Forecasting Model or Evaluate the Curve to Fit with the Raw Data
3.3. Validation Model or How Well the Curve Generates the Forecast
3.4. Outlier Analysis
3.5. Visualization Space-Time Cube (STC) in 3D and 2D
3.6. Methodological Steps
3.7. Descriptive Statistics and Normality Testing
- (a)
- Identification of a normal variable distribution for the hydropower production capacity in 1990–2021 for Italy, Romania, Sweden, and partially for Denmark and Finland. The normality decision is taken as follows: H0 is accepted after both the Kolmogorov–Smirnov and Shapiro–Wilk tests: in the case of Italy, Romania, and Sweden, p > 0.05 means that the hydropower production capacity has a normal distribution. Denmark and Finland have a normal distribution confirmed by the Kolmogorov–Smirnov test of normality, and France only after the Shapiro–Wilk;
- (b)
- The hypothesis of a normal variable distribution for the hydropower production capacity from 1990 to 2021 for the other 23 countries is rejected.
4. Results
4.1. The Space-Time Cube (STC) Creation for Hydropower Production Capacity
- Synthesis of STC using format netCDF calculates data for hydropower production capacity.
- STC method: Create Space-Time Cube From Defined Locations
- Cod date input: Hydro RA_100
- Time period: 1990–2021
- Time frequency: 1
- Measure unit: MW
- Time management:
- Number of Time Steps to Forecast → 4
- Number of Time Steps to Exclude for Validation → maximum T/4 = 32/4 = 8, 8
- Outlier Option → IDENTIFY
- Outlier Maximal Number—5% (round less) = 1,6 = 1
- Level of Confidence → 90%
- Number of time steps → 32
- Number of locations analyzed → 33
- Number of space-time bins analyzed → 1088
- Forecast management uses the input data from the STC for Hydroproduction netCDF data
- Forecast Method: Curve Fitting
- Curve Type → PARABOLIC
- Summary of accuracy across locations
| Category | Min | Max | Mean | Median | Std. Dev. |
| Forecast RMSE | 0.00 | 1222.18 | 180.74 | 81.05 | 263.10 |
| Validation RMSE | 0.00 | 3877.37 | 566.28 | 235.89 | 836.49 |
- Summary of time series outliers
- Number of locations containing outliers → 7
- Percent of locations containing outliers → 20.59
- Number of outliers by location (Min; Mean; Max) → 0; 0.21; 1
- Number of outliers by time step (Min; Mean; Max) → 0; 0.22; 1
- Time step containing the largest number of outliers
| after | 1990-01-01 00:00:01 |
| to on or before | 1991-01-01 00:00:00 |
4.2. The Countries’ Hierarchy Based on the Parabolic Forecast Model
4.3. Analyses of the Forecast Parabolic Models
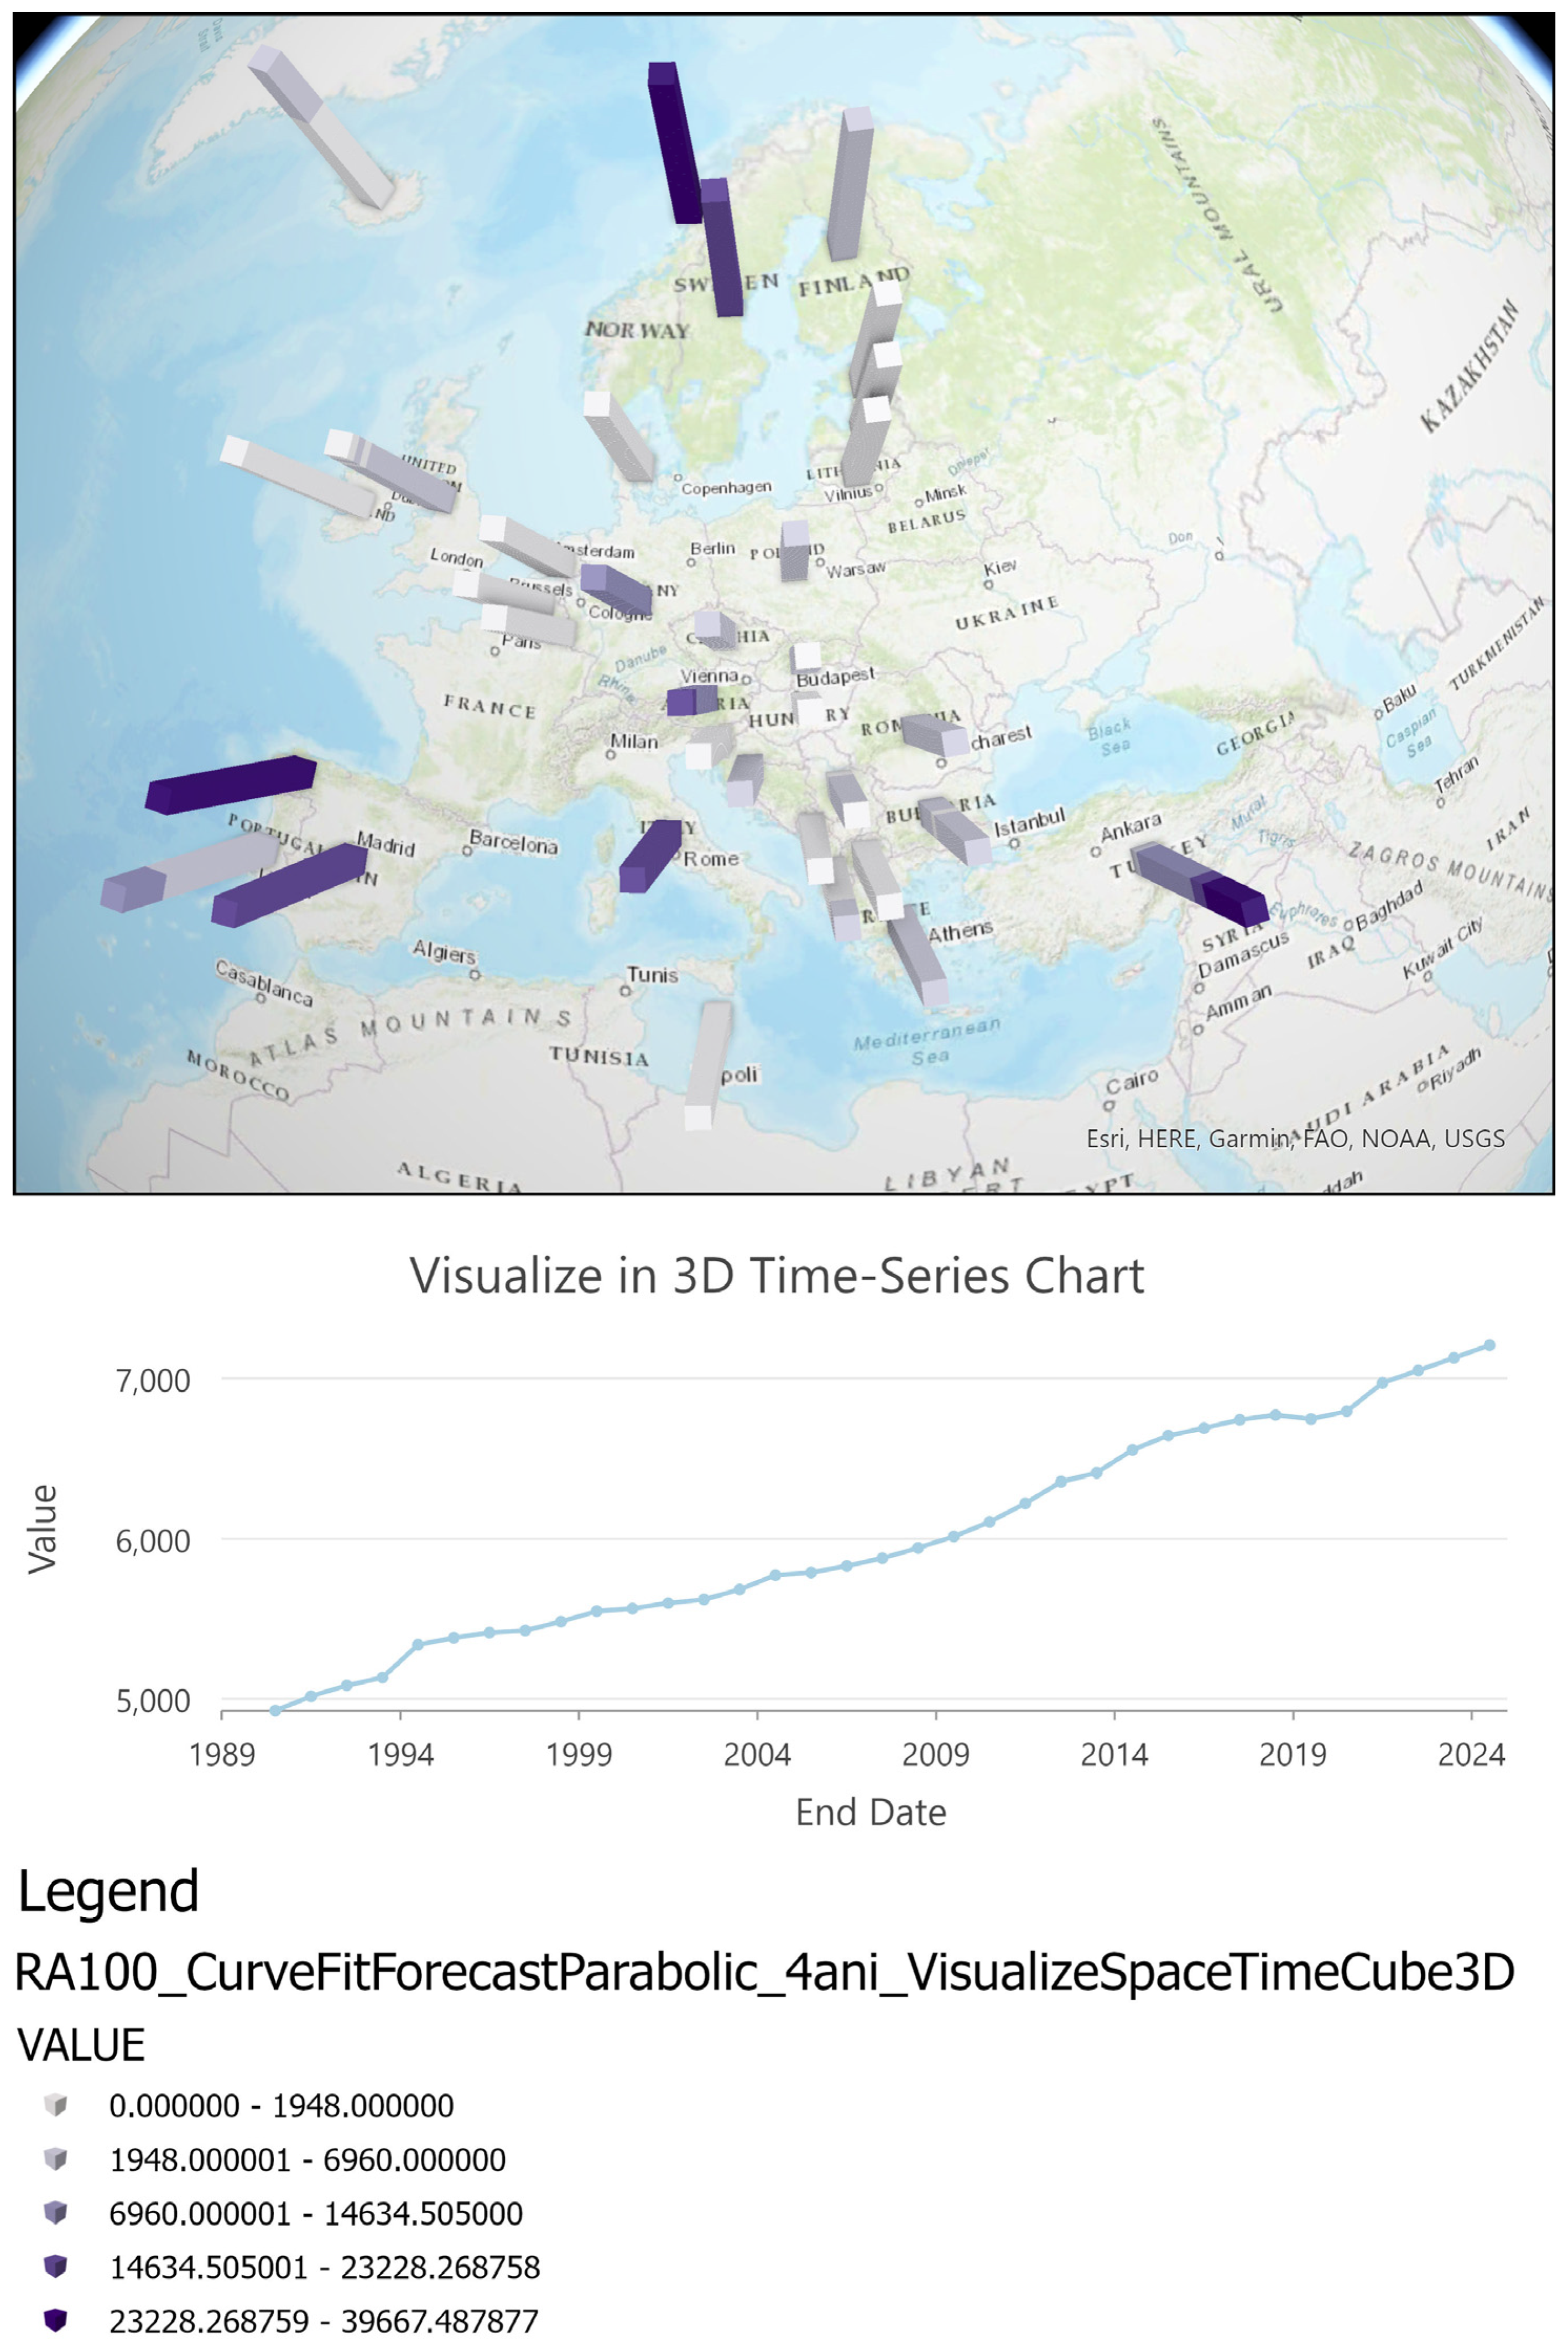
4.4. 3D and 2D Visualization of the Forecast
4.5. Outliers’ Analysis
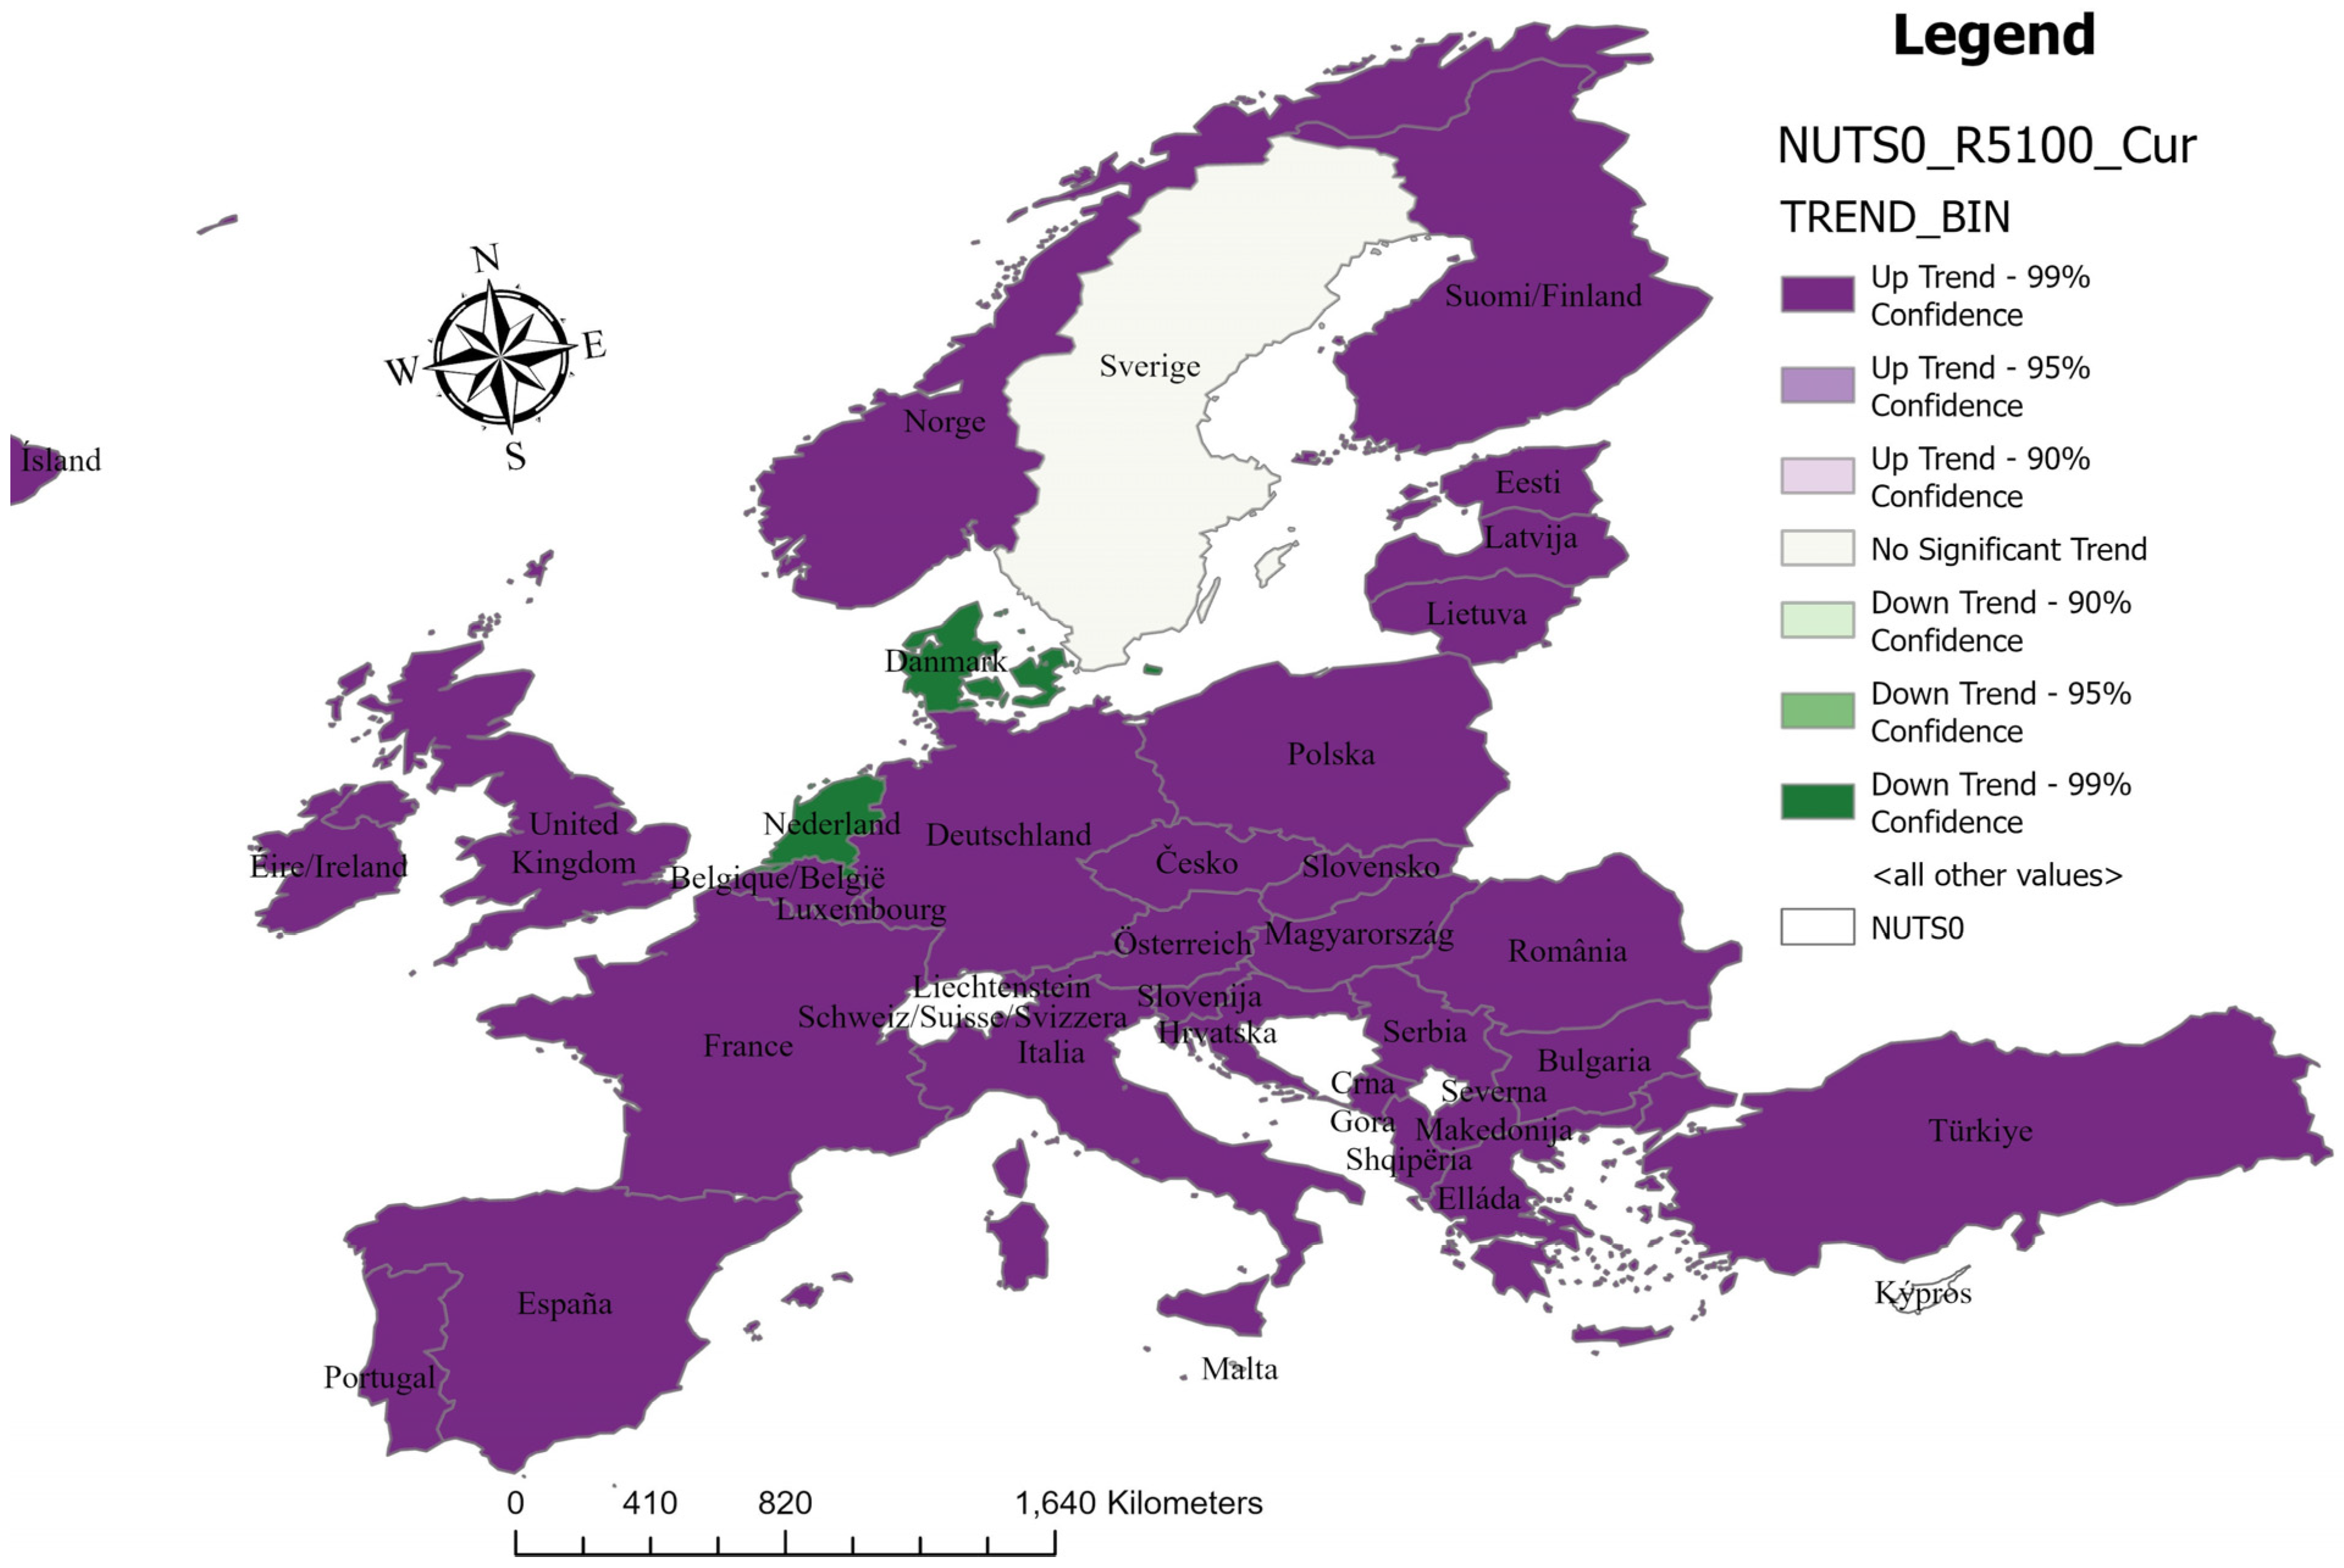
4.6. Confidence Level of the Trend
5. Discussion
- (a)
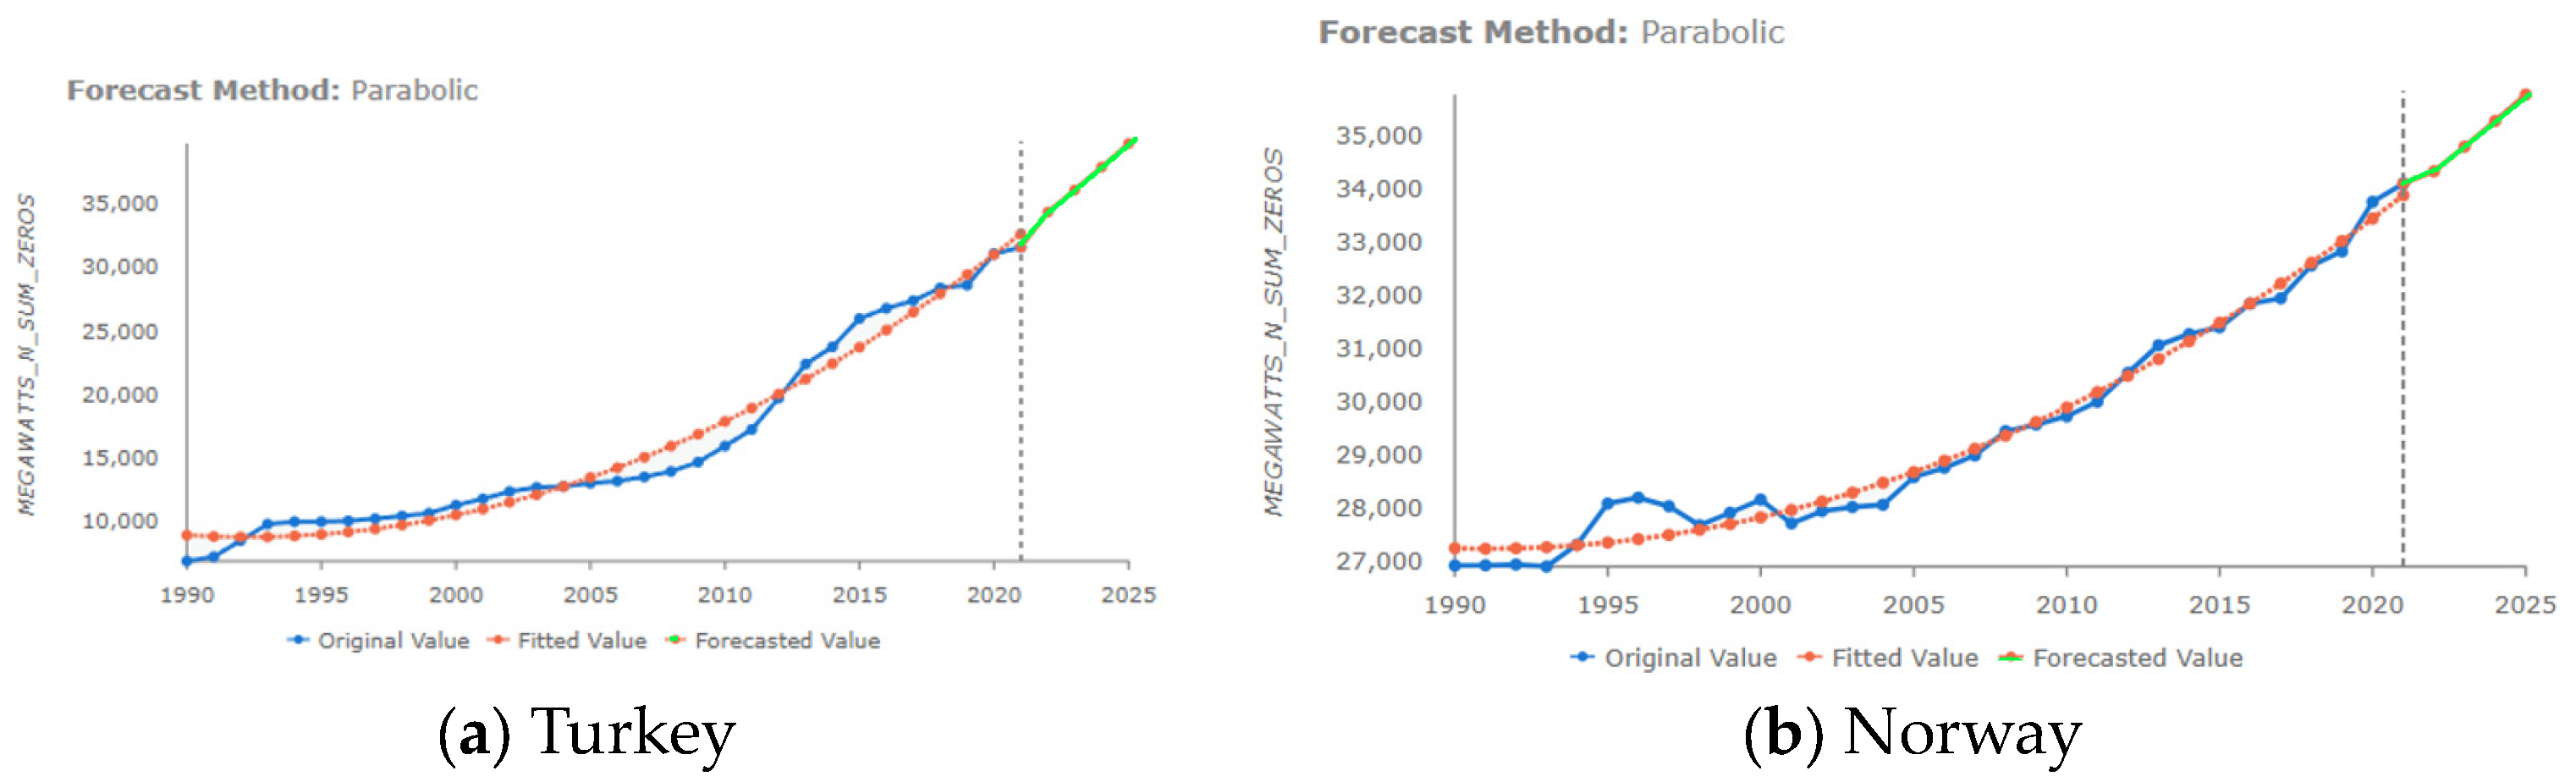
- High positive acceleration (acc > 1): These countries have prospects for intensive expansion, large diversification, and technological modernization of hydro systems. Turkey, Norway, Austria, Portugal, Albania, France, and Luxembourg are countries that specialize in hydropower production and should be considered best practices based on the statistics of the last three decades;
- (b)
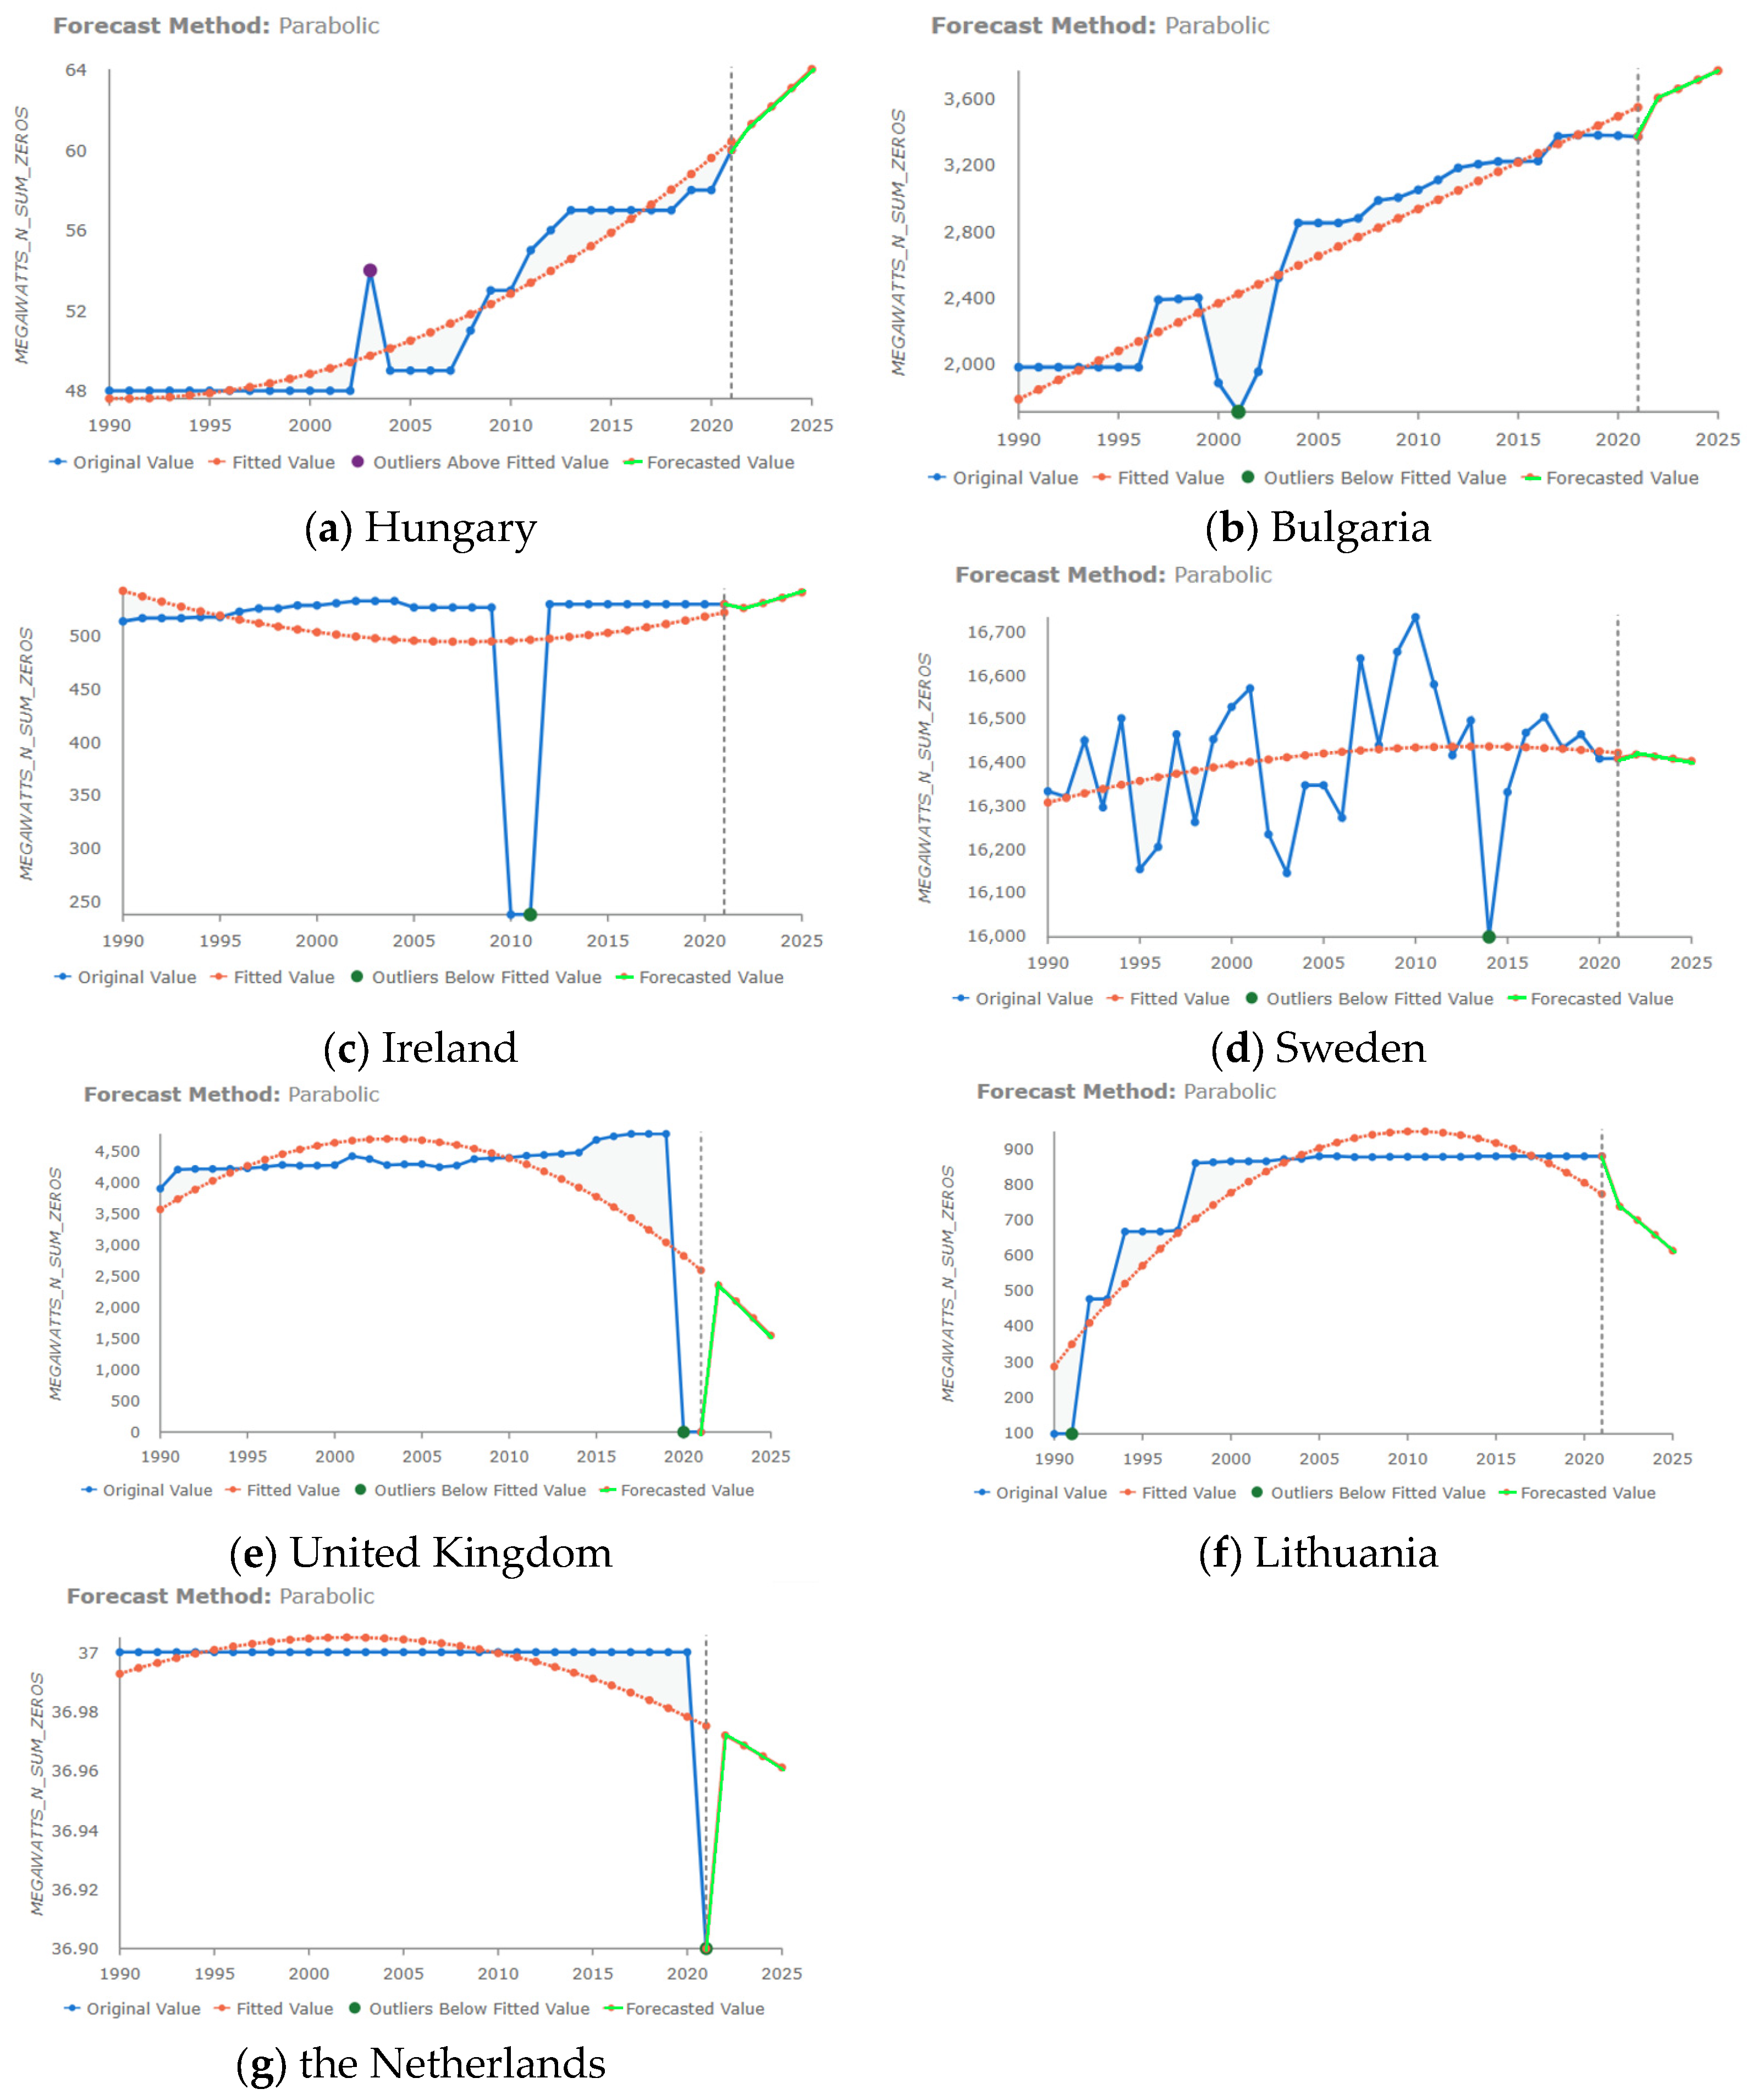
- Moderate positive acceleration (0 < acc < 1): This category includes Croatia, North Macedonia, Slovenia, Ireland, Iceland, and Hungary, with prospects for large, extensive expansion, diversification, and technological modernization of hydro systems. Extensive development is also a pathway to consider for the energetic shift to renewable energy;
- (c)
- Low negative acceleration, deceleration (−1 < acc < 0): These countries are characterized by a decrease in hydropower production capacity. The Netherlands, Estonia, Denmark, Latvia, Bulgaria, Belgium, Montenegro, Sweden, and Italy appear to have hydropower infrastructure but have fewer new investments;
- (d)
- High negative acceleration, rapid deceleration (acc < −1): Finland, Romania, Poland, Greece, Spain, Lithuania, Germany, the United Kingdon, Slovakia, and Serbia show constant negative accelerations, practically indicating an accelerated contraction of the hydro sector with prospects of diminishing physical infrastructure and implicitly without investments in new technologies.
- Hypothesis 1:The curve-fit parabolic forecast model provides a reliable approximation of hydropower production capacities—this was confirmed. The curve fit parabolic forecast model fits 2/3 of the European countries and is a good representation of hydropower production capacities for 1990–2021 in European countries.
- Hypothesis 2: Hydropower production capacities have a general uptrend for the period 1990–2025 in all European countries—yes, the overall data trend for 1990–2021 is an uptrend, with an average annual increase of 8 MW.
- Hypothesis 3: Countries’ capacity to produce electrical hydropower differs by speed and acceleration, and highly accelerated hydropower production capacities are a potential result of digital adoption—yes, there are 13 countries with a positive quadratic tendency of capacity growth, of which 7 present an acceleration over 1. These 7 countries are the countries that apply digital technologies.
- Hypothesis 4: The quadratic model validates the medium-term level forecast of hydropower production capacities for all 33 European countries—no, the validation model indicates accurate forecasts for about 2/3 of the countries, much like those with validated curves that fit the raw data. A long-term perspective regarding hydropower production capacities for these countries is shaped.
- Hypothesis 5: How many outliers does the dataset contain? After applying the Generalized Extreme Studentized Deviate (GESD) test, there were 7 outliers, but after a deep analysis, two outliers were excluded: the United Kingdom and the Netherlands, which have constant hydropower production capacities.
6. Conclusions
6.1. Theoretical Implication
6.2. Managerial Implication
6.3. Limits and Further Developments
Author Contributions
Funding
Data Availability Statement
Acknowledgments
Conflicts of Interest
References
- Grigorescu, A.; Ion, A.E.; Lincaru, C.; Pirciog, S. Synergy analysis of knowledge transfer for the energy sector within the framework of sustainable development of the European countries. Energies 2021, 15, 276. [Google Scholar] [CrossRef]
- European Commission. The European Green Deal, COM (2019) 640 Final, EUR-Lex-52019DC0640-EN-EUR-Lex (europa.eu); European Commission: Brussels, Belgium, 2019. [Google Scholar]
- United Nations Framework Convention on Climate Change (UNFCCC). The Paris Agreement, Denmark; parisagreement_publication.pdf (unfccc.int); United Nations: New York, NY, USA, 2016. [Google Scholar]
- European Commission. A Framework Strategy for a Resilient Energy Union with a Forward-Looking Climate Change Policy/* COM/2015/080 final */; EUR-Lex-52015DC0080-EN-EUR-Lex (europa.eu); European Commission: Brussels, Belgium, 2015. [Google Scholar]
- Energy Institute-Statistical Review of World Energy (2023)—With Major Processing by Our World in Data. “Electricity Generation from Hydropower” [Dataset]. Energy Institute, “Statistical Review of World Energy” [Original Data]. Available online: https://ourworldindata.org/grapher/hydro-consumption-by-region (accessed on 27 March 2024).
- Elavarasan, R.M. The motivation for renewable energy and its comparison with other energy sources: A review. Eur. J. Sustain. Dev. Res. 2019, 3, em0076. [Google Scholar] [CrossRef] [PubMed]
- Ristinen, R.A.; Kraushaar, J.J.; Brack, J.T. Energy and the Environment; John Wiley & Sons: Hoboken, NJ, USA, 2022. [Google Scholar]
- Miskat, M.; Ahmed, A.; Rahman, M.S.; Chowdhury, H.; Chowdhury, T.; Chowdhury, P.; Sait, S.M.; Park, Y.K. An overview of the hydropower production potential in Bangladesh to meet the energy requirements. Environ. Eng. Res. 2021, 26, 200514. [Google Scholar] [CrossRef]
- Hdom, H.A.; Fuinhas, J.A. Energy production and trade openness: Assessing economic growth, CO2 emissions and the applicability of the cointegration analysis. Energy Strategy Rev. 2020, 30, 100488. [Google Scholar] [CrossRef]
- Blakers, A.; Stocks, M.; Lu, B.; Cheng, C. A review of pumped hydro energy storage. Prog. Energy 2021, 3, 022003. [Google Scholar] [CrossRef]
- Kuriqi, A.; Pinheiro, A.N.; Sordo-Ward, A.; Garrote, L. Flow regime aspects in determining environmental flows and maximising energy production at run-of-river hydropower plants. Appl. Energy 2019, 256, 113980. [Google Scholar] [CrossRef]
- Guo, Y.; Xu, Y.P.; Xie, J.; Chen, H.; Si, Y.; Liu, J. A weights combined model for middle and long-term streamflow forecasts and its value to hydropower maximization. J. Hydrol. 2021, 602, 126794. [Google Scholar] [CrossRef]
- Kuriqi, A.; Pinheiro, A.N.; Sordo-Ward, A.; Garrote, L. Influence of hydrologically based environmental flow methods on flow alteration and energy production in a run-of-river hydropower plant. J. Clean. Prod. 2019, 232, 1028–1042. [Google Scholar] [CrossRef]
- Kuriqi, A.; Pinheiro, A.N.; Sordo-Ward, A.; Garrote, L. Water-energy-ecosystem nexus: Balancing competing interests at a run-of-river hydropower plant coupling a hydrologic–ecohydraulic approach. Energy Convers. Manag. 2020, 223, 113267. [Google Scholar] [CrossRef]
- Kos, Ž.; Đurin, B.; Dogančić, D.; Kranjčić, N. Hydro-energy suitability of rivers regarding their hydrological and hydrogeological characteristics. Water 2021, 13, 1777. [Google Scholar] [CrossRef]
- Manzano-Agugliaro, F.; Taher, M.; Zapata-Sierra, A.; Juaidi, A.; Montoya, F.G. An overview of research and energy evolution for small hydropower in Europe. Renew. Sustain. Energy Rev. 2017, 75, 476–489. [Google Scholar] [CrossRef]
- Gernaat, D.E.; Bogaart, P.W.; Vuuren, D.P.V.; Biemans, H.; Niessink, R. High-resolution assessment of global technical and economic hydropower potential. Nat. Energy 2017, 2, 821–828. [Google Scholar] [CrossRef]
- Hoes, O.A.; Meijer, L.J.; Van Der Ent, R.J.; Van De Giesen, N.C. Systematic high-resolution assessment of global hydropower potential. PLoS ONE 2017, 12, e0171844. [Google Scholar] [CrossRef] [PubMed]
- Hunt, J.D.; Byers, E.; Wada, Y.; Parkinson, S.; Gernaat, D.E.; Langan, S.; van Vuuren, D.P.; Riahi, K. Global resource potential of seasonal pumped hydropower storage for energy and water storage. Nat. Commun. 2020, 11, 947. [Google Scholar] [CrossRef] [PubMed]
- Moran, E.F.; Lopez, M.C.; Moore, N.; Müller, N.; Hyndman, D.W. Sustainable hydropower in the 21st century. Proc. Natl. Acad. Sci. USA 2018, 115, 11891–11898. [Google Scholar] [CrossRef] [PubMed]
- Popa, F.; Dumitran, G.E.; Vuta, L.I.; Tica, E.I.; Popa, B.; Neagoe, A. Impact of the ecological flow of some small hydropower plants on their energy production in Romania. J. Phys. Conf. Ser. 2020, 1426, 012043. [Google Scholar] [CrossRef]
- Tiruye, G.A.; Besha, A.T.; Mekonnen, Y.S.; Benti, N.E.; Gebreslase, G.A.; Tufa, R.A. Opportunities and challenges of renewable energy production in Ethiopia. Sustainability 2021, 13, 10381. [Google Scholar] [CrossRef]
- Lehner, B.; Liermann, C.R.; Revenga, C.; Vörösmarty, C.; Fekete, B.; Crouzet, P.; Döll, P.; Endejan, M.; Frenken, K.; Magome, J.; et al. Highresolution mapping of the world’s reservoirs and dams for sustainable river-flow management. Front. Ecol. Environ. 2011, 9, 494–502. [Google Scholar] [CrossRef] [PubMed]
- Zarfl, C.; Lumsdon, A.E.; Berlekamp, J.; Tydecks, L.; Tockner, K. A global boom in hydropower dam construction. Aquat. Sci. 2015, 77, 161–170. [Google Scholar] [CrossRef]
- Ahmad, S.K.; Hossain, F. Forecast-informed hydropower optimization at long and short-time scales for a multiple dam network. J. Renew. Sustain. Energy 2020, 12, 014501. [Google Scholar] [CrossRef]
- Hirth, L. The benefits of flexibility: The value of wind energy with hydropower. Appl. Energy 2016, 181, 210–223. [Google Scholar] [CrossRef]
- Malhan, P.; Mittal, M. A novel ensemble model for long-term forecasting of wind and hydro power generation. Energy Convers. Manag. 2022, 251, 114983. [Google Scholar] [CrossRef]
- Kougias, I.; Szabo, S.; Monforti-Ferrario, F.; Huld, T.; Bódis, K. A methodology for optimization of the complementarity between small-hydropower plants and solar PV systems. Renew. Energy 2016, 87, 1023–1030. [Google Scholar] [CrossRef]
- Kougias, I.; Aggidis, G.; Avellan, F.; Deniz, S.; Lundin, U.; Moro, A.; Muntean, S.; Novara, D.; Pérez-Díaz, J.I.; Quaranta, E.; et al. Analysis of emerging technologies in the hydropower sector. Renew. Sustain. Energy Rev. 2019, 113, 109257. [Google Scholar] [CrossRef]
- Yuksel, I.; Arman, H.; Serencam, U. Hydro energy and environmental policies in Turkey. J. Therm. Eng. 2016, 2, 934–939. [Google Scholar]
- Ahmad, S.K.; Hossain, F. Maximizing energy production from hydropower dams using short-term weather forecasts. Renew. Energy 2020, 146, 1560–1577. [Google Scholar] [CrossRef]
- Yah, N.F.; Oumer, A.N.; Idris, M.S. Small scale hydro-power as a source of renewable energy in Malaysia: A review. Renew. Sustain. Energy Rev. 2017, 72, 228–239. [Google Scholar] [CrossRef]
- Kuriqi, A.; Pinheiro, A.N.; Sordo-Ward, A.; Bejarano, M.D.; Garrote, L. Ecological impacts of run-of-river hydropower plants—Current status and future prospects on the brink of energy transition. Renew. Sustain. Energy Rev. 2021, 142, 110833. [Google Scholar] [CrossRef]
- Barbosa, L.D.S.N.S.; Bogdanov, D.; Vainikka, P.; Breyer, C. Hydro, wind and solar power as a base for a 100% renewable energy supply for South and Central America. PLoS ONE 2017, 12, e0173820. [Google Scholar] [CrossRef] [PubMed]
- Spiru, P. Assessment of renewable energy generated by a hybrid system based on wind, hydro, solar, and biomass sources for decarbonizing the energy sector and achieving a sustainable energy transition. Energy Rep. 2023, 9, 167–174. [Google Scholar] [CrossRef]
- Stadelmann-Steffen, I.; Rieder, S.; Strotz, C. The politics of renewable energy production in a federal context: The deployment of small hydropower in the Swiss cantons. J. Environ. Dev. 2020, 29, 75–98. [Google Scholar] [CrossRef]
- Baloch, Z.A.; Tan, Q.; Kamran, H.W.; Nawaz, M.A.; Albashar, G.; Hameed, J. A multi-perspective assessment approach of renewable energy production: Policy perspective analysis. Environ. Dev. Sustain. 2021, 24, 2164–2192. [Google Scholar] [CrossRef]
- Zafar, U.; Ur Rashid, T.; Khosa, A.A.; Khalil, M.S.; Rashid, M. An overview of implemented renewable energy policy of Pakistan. Renew. Sustain. Energy Rev. 2018, 82, 654–665. [Google Scholar] [CrossRef]
- Drakaki, K.K.; Sakki, G.K.; Tsoukalas, I.; Kossieris, P.; Efstratiadis, A. Day-ahead energy production in small hydropower plants: Uncertainty-aware forecasts through effective coupling of knowledge and data. Adv. Geosci. 2022, 56, 155–162. [Google Scholar] [CrossRef]
- Bordin, C.; Skjelbred, H.I.; Kong, J.; Yang, Z. Machine learning for hydropower scheduling: State of the art and future research directions. Procedia Comput. Sci. 2020, 176, 1659–1668. [Google Scholar] [CrossRef]
- Jurasz, J.; Kies, A.; Zajac, P. Synergetic operation of photovoltaic and hydro power stations on a day-ahead energy market. Energy 2020, 212, 118686. [Google Scholar] [CrossRef]
- Hatata, A.Y.; El-Saadawi, M.M.; Saad, S. A feasibility study of small hydro power for selected locations in Egypt. Energy Strategy Rev. 2019, 24, 300–313. [Google Scholar] [CrossRef]
- Azad, A.S.; Rahaman, M.S.A.; Watada, J.; Vasant, P.; Vintaned, J.A.G. Optimization of the hydropower energy generation using Meta-Heuristic approaches: A review. Energy Rep. 2020, 6, 2230–2248. [Google Scholar] [CrossRef]
- Zhou, F.; Li, L.; Zhang, K.; Trajcevski, G.; Yao, F.; Huang, Y.; Zhong, T.; Wang, J.; Liu, Q. Forecasting the evolution of hydropower generation. In Proceedings of the 26th ACM SIGKDD International Conference on Knowledge Discovery & Data Mining, Virtual, 6–10 July 2020; pp. 2861–2870. [Google Scholar]
- Rahman, M.M.; Shakeri, M.; Tiong, S.K.; Khatun, F.; Amin, N.; Pasupuleti, J.; Hasan, M.K. Prospective methodologies in hybrid renewable energy systems for energy prediction using artificial neural networks. Sustainability 2021, 13, 2393. [Google Scholar] [CrossRef]
- Parvez, I.; Shen, J.; Hassan, I.; Zhang, N. Generation of hydro energy by using data mining algorithm for cascaded hydropower plant. Energies 2021, 14, 298. [Google Scholar] [CrossRef]
- Ding, Z.; Wen, X.; Tan, Q.; Yang, T.; Fang, G.; Lei, X.; Zhang, Y.; Wang, H. A forecast-driven decision-making model for long-term operation of a hydro-wind-photovoltaic hybrid system. Appl. Energy 2021, 291, 116820. [Google Scholar] [CrossRef]
- Hammid, A.T.; Sulaiman, M.H.B.; Abdalla, A.N. Prediction of small hydropower plant power production in Himreen Lake dam (HLD) using artificial neural network. Alex. Eng. J. 2018, 57, 211–221. [Google Scholar] [CrossRef]
- Ichiyanagi, K.; Kobayashi, H.; Matsumura, T.; Kito, Y. Application of artificial neural network to forecasting methods of time variation of the flow rate into a dam for a hydro-power plant. In Proceedings of the Second International Forum on Applications of Neural Networks to Power Systems, Yokohama, Japan, 19–22 April 1992; pp. 349–354. [Google Scholar]
- Stokelj, T.; Golob, R. Application of neural networks for hydro power plant water inflow forecasting. In Proceedings of the 5th Seminar on Neural Network Applications in Electrical Engineering, Belgrade, Yugoslavia, 27 September 2000; pp. 189–193. [Google Scholar]
- Cobaner, M.; Haktanir, T.; Kisi, O. Prediction of hydropower energy using ANN for the feasibility of hydropower plant installation to an existing irrigation dam. Water Resour. Manag. 2008, 22, 757–774. [Google Scholar] [CrossRef]
- Lopes, M.N.G.; da Rocha, B.R.P.; Vieira, A.C.; de Sá, J.A.S.; Rolim, P.A.M.; da Silva, A.G. Artificial neural networks approaches for predicting the potential for hydropower generation: A case study for Amazon region. J. Intell. Fuzzy Syst. 2019, 36, 5757–5772. [Google Scholar] [CrossRef]
- Guo, L.N.; She, C.; Kong, D.B.; Yan, S.L.; Xu, Y.P.; Khayatnezhad, M.; Gholinia, F. Prediction of the effects of climate change on hydroelectric generation, electricity demand, and emissions of greenhouse gases under climatic scenarios and optimized ANN model. Energy Rep. 2021, 7, 5431–5445. [Google Scholar] [CrossRef]
- Bernardes Jr, J.; Santos, M.; Abreu, T.; Prado Jr, L.; Miranda, D.; Julio, R.; Viana, P.; Fonseca, M.; Bortoni, E.; Bastos, G.S. Hydropower operation optimization using machine learning: A systematic review. AI 2022, 3, 78–99. [Google Scholar] [CrossRef]
- Avesani, D.; Zanfei, A.; Di Marco, N.; Galletti, A.; Ravazzolo, F.; Righetti, M.; Majone, B. Short-term hydropower optimization driven by innovative time-adapting econometric model. Appl. Energy 2022, 310, 118510. [Google Scholar] [CrossRef]
- Condemi, C.; Casillas-Perez, D.; Mastroeni, L.; Jiménez-Fernández, S.; Salcedo-Sanz, S. Hydro-power production capacity prediction based on machine learning regression techniques. Knowl.-Based Syst. 2021, 222, 107012. [Google Scholar] [CrossRef]
- Sapitang, M.M.; Ridwan, W.; Faizal Kushiar, K.; Najah Ahmed, A.; El-Shafie, A. Machine learning application in reservoir water level forecasting for sustainable hydropower generation strategy. Sustainability 2020, 12, 6121. [Google Scholar] [CrossRef]
- Sweeney, C.; Bessa, R.J.; Browell, J.; Pinson, P. The future of forecasting for renewable energy. Wiley Interdiscip. Rev. Energy Environ. 2020, 9, e365. [Google Scholar] [CrossRef]
- Brodny, J.; Tutak, M.; Saki, S.A. Forecasting the structure of energy production from renewable energy sources and biofuels in Poland. Energies 2020, 13, 2539. [Google Scholar] [CrossRef]
- Stefenon, S.F.; Ribeiro, M.H.D.M.; Nied, A.; Yow, K.C.; Mariani, V.C.; dos Santos Coelho, L.; Seman, L.O. Time series forecasting using ensemble learning methods for emergency prevention in hydroelectric power plants with dam. Electr. Power Syst. Res. 2022, 202, 107584. [Google Scholar] [CrossRef]
- Jamil, R. Hydroelectricity consumption forecast for Pakistan using ARIMA modeling and supply-demand analysis for the year 2030. Renew. Energy 2020, 154, 1–10. [Google Scholar] [CrossRef]
- Şahin, U. Projections of Turkey’s electricity generation and installed capacity from total renewable and hydro energy using fractional nonlinear grey Bernoulli model and its reduced forms. Sustain. Prod. Consum. 2020, 23, 52–62. [Google Scholar] [CrossRef]
- Pata, U.K.; Aydin, M. Testing the EKC hypothesis for the top six hydropower energy-consuming countries: Evidence from Fourier Bootstrap ARDL procedure. J. Clean. Prod. 2020, 264, 121699. [Google Scholar] [CrossRef]
- Chen, C.; Liu, H.; Xiao, Y.; Zhu, F.; Ding, L.; Yang, F. Power Generation Scheduling for a Hydro-Wind-Solar Hybrid System: A Systematic Survey and Prospect. Energies 2022, 15, 8747. [Google Scholar] [CrossRef]
- Zhang, Y.; Cheng, C.; Cao, R.; Li, G.; Shen, J.; Wu, X. Multivariate probabilistic forecasting and its performance’s impacts on long-term dispatch of hydro-wind hybrid systems. Appl. Energy 2021, 283, 116243. [Google Scholar] [CrossRef]
- Tan, Q.; Wen, X.; Sun, Y.; Lei, X.; Wang, Z.; Qin, G. Evaluation of the risk and benefit of the complementary operation of the large wind-photovoltaic-hydropower system considering forecast uncertainty. Appl. Energy 2021, 285, 116442. [Google Scholar] [CrossRef]
- Klosterman, R.E.; Brooks, K.; Drucker, J.; Feser, E.; Renski, H. Planning Support Methods: Urban and Regional Analysis and Projection; Rowman & Littlefield: Lanham, MD, USA, 2018. [Google Scholar]
- Buie, L. Introducing Time Series Forecasting in ArcGIS Pro. ArcGIS Blog. Available online: https://www.esri.com/arcgis-blog/products/arcgis-pro/announcements/introducing-time-series-forecasting-in-arcgis-pro/ (accessed on 28 July 2020).
- ESRI. How Forest-Based Forecast Works. ArcGIS Pro. Available online: https://pro.arcgis.com/en/pro-app/latest/tool-reference/space-time-pattern-mining/learnmoreforestbasedforecast.htm (accessed on 7 November 2023).
- Seradayan, L.; Mosinyan, A.; Kotolyan, A. Difference between Prediction and Forecast. platAI. Available online: https://plat.ai/blog/difference-between-prediction-and-forecast/ (accessed on 26 June 2023).
- Bakshi, A. What’s New for Spatial Statistics in ArcGIS Pro 2.7? ArcGis Blog. Available online: https://www.esri.com/arcgis-blog/products/arcgis-pro/analytics/whats-new-for-spatial-statistics-in-arcgis-pro-2-7/ (accessed on 23 December 2020).
- Chai, T.; Draxler, R.R. Root mean square error (RMSE) or mean absolute error (MAE)?–Arguments against avoiding RMSE in the literature. Geosci. Model Dev. 2014, 7, 1247–1250. [Google Scholar] [CrossRef]
- Hodson, T.O. Root-mean-square error (RMSE) or mean absolute error (MAE): When to use them or not, Geosci. Model Dev. 2022, 15, 5481–5487. [Google Scholar] [CrossRef]
- ESRI. Arc Gis PRo 3.1, Understanding Outliers in Time Series Analysis ArcGIS Pro 3.1. 2023. Available online: https://pro.arcgis.com/en/pro-app/3.1/tool-reference/space-time-pattern-mining/understanding-outliers-in-time-series-analysis.htm#:~:text=Outliers%20in%20time%20series%20data,outliers%20in%20their%20time%20series (accessed on 1 June 2023).
- Grubbs, F. Procedures for Detecting Outlying Observations in Samples. Technometrics 1969, 11, 1–21. [Google Scholar] [CrossRef]
- Stefansky, W. Rejecting Outliers in Factorial Designs. Technometrics 1972, 14, 469–479. [Google Scholar] [CrossRef]
- Kendall, M.G.; Gibbons, J.D. Rank Correlation Methods, fifth ed.; Griffin: London, UK, 1990. [Google Scholar]
- Eurostat Database. Available online: https://ec.europa.eu/eurostat/databrowser//product/view/NRG_INF_EPCRW (accessed on 5 June 2023).
- GFCS. Energy. Global Framework for Climate Services (GFCS). Global Framework for Climate Services (GFCS). 2017. Available online: https://wmo.int/site/global-framework-climate-services-gfcs (accessed on 2 October 2023).
- Bojariu, R.; Chiţu, Z.; Dascălu, S.I.; Gothard, M.; Velea, L.F.; Burcea, R.; Dumitrescu, A.; Burcea, S.; Apostol, L.; Amihaesei, V.; et al. Schimbările Climatice—De la Bazele Fizice la Riscuri și Adaptare, II a. ed.; Printech: Mangaluru, India, 2021. [Google Scholar]


| N | Mean | Std. Deviation | Minimum | Maximum | |
|---|---|---|---|---|---|
| Austria | 32 | 12,436.82 | 1255.029 | 10,947 | 14,748 |
| Belgium | 32 | 1413.92 | 8.790 | 1401 | 1428 |
| Bulgaria | 32 | 2672.46 | 577.495 | 1705 | 3379 |
| Czechia | 32 | 2037.13 | 317.804 | 1393 | 2285 |
| Germany | 32 | 10,097.69 | 1078.917 | 8182 | 11,436 |
| Denmark | 32 | 9.31 | 1.319 | 7 | 11 |
| Estonia | 32 | 4.02 | 2.650 | 0 | 8 |
| Greece | 32 | 3043.25 | 332.617 | 2408 | 3421 |
| Spain | 32 | 18,074.51 | 1508.427 | 15,657 | 20,132 |
| Finland | 32 | 2971.13 | 167.984 | 2621 | 3171 |
| France | 32 | 25,310.25 | 372.280 | 24,673 | 26,291 |
| Croatia | 32 | 2104.61 | 60.184 | 2046 | 2201 |
| Hungary | 32 | 51.88 | 4.256 | 48 | 60 |
| Ireland | 32 | 507.59 | 71.182 | 237 | 532 |
| Italy | 32 | 20,999.39 | 1144.572 | 18,770 | 22,750 |
| Lithuania | 32 | 773.41 | 211.196 | 95 | 877 |
| Luxembourg | 32 | 1182.83 | 86.584 | 1133 | 1331 |
| Latvia | 32 | 1540.93 | 33.281 | 1487 | 1588 |
| Netherlands | 32 | 37.00 | .018 | 37 | 37 |
| Norway | 32 | 29,380.09 | 2111.476 | 26,868 | 34,075 |
| Poland | 32 | 2246.23 | 148.431 | 1888 | 2400 |
| Portugal | 32 | 5208.98 | 1154.402 | 3341 | 7262 |
| Romania | 32 | 6295.41 | 324.128 | 5687 | 6734 |
| Serbia | 32 | 2482.35 | 1087.467 | 0 | 3085 |
| Sweden | 32 | 16,399.63 | 158.805 | 15,996 | 16,732 |
| Slovenia | 32 | 1033.21 | 236.330 | 734 | 1352 |
| Slovakia | 32 | 2100.09 | 920.077 | 0 | 2548 |
| Türkiye | 32 | 16,194.03 | 7628.186 | 6764 | 31,493 |
| United Kingdom | 30 | 4369.36 | 203.235 | 3897 | 4773 |
| Kolmogorov–Smirnov b | Shapiro–Wilk | |||||
|---|---|---|---|---|---|---|
| Statistic | df | Sig. | Statistic | df | Sig. | |
| Austria | 0.223 | 30 | 0.001 | 0.874 | 30 | 0.002 |
| Belgium | 0.161 | 30 | 0.045 | 0.916 | 30 | 0.021 |
| Bulgaria | 0.208 | 30 | 0.002 | 0.875 | 30 | 0.002 |
| Czechia | 0.316 | 30 | 0.000 | 0.663 | 30 | 0.000 |
| Germany | 0.218 | 30 | 0.001 | 0.860 | 30 | 0.001 |
| Denmark | 0.155 | 30 | 0.062 | 0.893 | 30 | 0.006 |
| Estonia | 0.194 | 30 | 0.006 | 0.900 | 30 | 0.009 |
| Greece | 0.232 | 30 | 0.000 | 0.864 | 30 | 0.001 |
| Spain | 0.173 | 30 | 0.023 | 0.910 | 30 | 0.015 |
| Finland | 0.133 | 30 | 0.187 | 0.915 | 30 | 0.020 |
| France | 0.167 | 30 | 0.033 | 0.939 | 30 | 0.083 |
| Croatia | 0.318 | 30 | 0.000 | 0.758 | 30 | 0.000 |
| Hungary | 0.295 | 30 | 0.000 | 0.759 | 30 | 0.000 |
| Ireland | 0.470 | 30 | 0.000 | 0.335 | 30 | 0.000 |
| Italy | 0.087 | 30 | 0.200 * | 0.962 | 30 | 0.340 |
| Lithuania | 0.397 | 30 | 0.000 | 0.576 | 30 | 0.000 |
| Luxembourg | 0.485 | 30 | 0.000 | 0.498 | 30 | 0.000 |
| Latvia | 0.178 | 30 | 0.017 | 0.928 | 30 | 0.043 |
| Norway | 0.193 | 30 | 0.006 | 0.906 | 30 | 0.012 |
| Poland | 0.217 | 30 | 0.001 | 0.873 | 30 | 0.002 |
| Portugal | 0.188 | 30 | 0.009 | 0.912 | 30 | 0.016 |
| Romania | 0.088 | 30 | 0.200 * | 0.948 | 30 | 0.147 |
| Serbia | 0.489 | 30 | 0.000 | 0.498 | 30 | 0.000 |
| Sweden | 0.110 | 30 | 0.200 * | 0.986 | 30 | 0.957 |
| Slovenia | 0.188 | 30 | 0.009 | 0.866 | 30 | 0.001 |
| Slovakia | 0.432 | 30 | 0.000 | 0.497 | 30 | 0.000 |
| Türkiye | 0.213 | 30 | 0.001 | 0.856 | 30 | 0.001 |
| United Kingdom | 0.187 | 30 | 0.009 | 0.876 | 30 | 0.002 |
| Country/Location | Forecast Equation | a | acc = 2*a | vinit = b | c | |
|---|---|---|---|---|---|---|
| 1 | Türkiye | Xt = a*t^2 + b*t + c; a = 28.935940, b = −130.995913, c = 8805.818937 | 28.93594 | 57.87188 | −130.9959 | 8806 |
| 2 | Norway | Xt = a*t^2 + b*t + c; a = 7.425667, b = −16.026150, c = 27211.444352 | 7.425667 | 14.851334 | −16.02615 | 27211 |
| 3 | Austria | Xt = a*t^2 + b*t + c; a = 4.082474, b = 1.495997, c = 11084.785219 | 4.082474 | 8.164948 | 1.495997 | 11085 |
| 4 | Portugal | Xt = a*t^2 + b*t + c; a = 2.805522, b = 29.781189, c = 3834.176860 | 2.805522 | 5.611044 | 29.78119 | 3834 |
| 5 | Albania | Xt = a*t^2 + b*t + c; a = 2.212243, b = −43.328446, c = 1579.880682 | 2.212243 | 4.424486 | −43.32845 | 1580 |
| 6 | France | Xt = a*t^2 + b*t + c; a = 0.804141, b = 12.049646, c = 24861.734480 | 0.804141 | 1.608282 | 12.04965 | 24862 |
| 7 | Luxembourg | Xt = a*t^2 + b*t + c; a = 0.539666, b = −9.771398, c = 1158.621298 | 0.539666 | 1.079332 | −9.771398 | 1159 |
| 8 | Croatia | Xt = a*t^2 + b*t + c; a = 0.243154, b = −1.771637, c = 2052.923011 | 0.243154 | 0.486308 | −1.771637 | 2053 |
| 9 | North Macedonia | Xt = a*t^2 + b*t + c; a = 0.186550, b = 4.583460, c = 398.602503 | 0.18655 | 0.3731 | 4.58346 | 399 |
| 10 | Slovenia | Xt = a*t^2 + b*t + c; a = 0.169198, b = 19.250367, c = 679.754752 | 0.169198 | 0.338396 | 19.25037 | 680 |
| 11 | Ireland | Xt = a*t^2 + b*t + c; a = 0.153975, b = −5.428837, c = 541.621825 | 0.153975 | 0.30795 | −5.428837 | 542 |
| 12 | Islanda | Xt = a*t^2 + b*t + c; a = 0.128020, b = 48.298374, c = 657.730548 | 0.12802 | 0.25604 | 48.29837 | 658 |
| 13 | Hungary | Xt = a*t^2 + b*t + c; a = 0.013843, b = −0.015288, c = 47.605949 | 0.013843 | 0.027686 | −0.015288 | 48 |
| 14 | Netherlands | Xt = a*t^2 + b*t + c; a = −0.000084, b = 0.002022, c = 36.992731 | −0.000084 | −0.000168 | 0.002022 | 37 |
| 15 | Estonia | Xt = a*t^2 + b*t + c; a = −0.004693, b = 0.406558, c = −0.755281 | −0.004693 | −0.009386 | 0.406558 | −1 |
| 16 | Denmark | Xt = a*t^2 + b*t + c; a = −0.008492, b = 0.163557, c = 9.540506 | −0.008492 | −0.016984 | 0.163557 | 10 |
| 17 | Latvia | Xt = a*t^2 + b*t + c; a = −0.021891, b = 4.029606, c = 1485.598275 | −0.021891 | −0.043782 | 4.029606 | 1486 |
| 18 | Bulgaria | Xt = a*t^2 + b*t + c; a = −0.048620, b = 58.487002, c = 1781.733294 | −0.04862 | −0.09724 | 58.487 | 1782 |
| 19 | Belgium | Xt = a*t^2 + b*t + c; a = −0.060061, b = 2.485544, c = 1394.945705 | −0.060061 | −0.120122 | 2.485544 | 1395 |
| 20 | Montenegro | Xt = a*t^2 + b*t + c; a = −0.127530, b = 35.077630, c = −156.422243 | −0.12753 | −0.25506 | 35.07763 | −156 |
| 21 | Sweden | Xt = a*t^2 + b*t + c; a = −0.239704, b = 11.121065, c = 16305.272059 | −0.239704 | −0.479408 | 11.12107 | 16305 |
| 22 | Italy | Xt = a*t^2 + b*t + c; a = −0.473789, b = 136.156730, c = 19043.174334 | −0.473789 | −0.947578 | 136.1567 | 19043 |
| 23 | Finland | Xt = a*t^2 + b*t + c; a = −0.512895, b = 33.124439, c = 2624.643382 | −0.512895 | −1.02579 | 33.12444 | 2625 |
| 24 | Romania | Xt = a*t^2 + b*t + c; a = −0.542359, b = 50.603248, c = 5687.602515 | −0.542359 | −1.084718 | 50.60325 | 5688 |
| 25 | Poland | Xt = a*t^2 + b*t + c; a = −0.589113, b = 33.103568, c = 1924.885053 | −0.589113 | −1.178226 | 33.10357 | 1925 |
| 26 | Greece | Xt = a*t^2 + b*t + c; a = −0.983569, b = 64.142035, c = 2369.200201 | −0.983569 | −1.967138 | 64.14204 | 2369 |
| 27 | Spain | Xt = a*t^2 + b*t + c; a = −1.268294, b = 196.048588, c = 15448.582875 | −1.268294 | −2.536588 | 196.0486 | 15449 |
| 28 | Lithuania | Xt = a*t^2 + b*t + c; a = −1.586580, b = 64.874423, c = 284.284592 | −1.58658 | −3.17316 | 64.87442 | 284 |
| 29 | Czechia | Xt = a*t^2 + b*t + c; a = −1.833580, b = 84.229781, c = 1328.400393 | −1.83358 | −3.66716 | 84.22978 | 1328 |
| 30 | Germany | Xt = a*t^2 + b*t + c; a = −3.999256, b = 226.911689, c = 7882.314171 | −3.999256 | −7.998512 | 226.9117 | 7882 |
| 31 | United Kingdom | Xt = a*t^2 + b*t + c; a = −6.572286, b = 172.362642, c = 3563.935688 | −6.572286 | −13.144572 | 172.3626 | 3564 |
| 32 | Slovakia | Xt = a*t^2 + b*t + c; a = −6.633771, b = 270.837324, c = 61.407587 | −6.633771 | −13.267542 | 270.8373 | 61 |
| 33 | Serbia | Xt = a*t^2 + b*t + c; a = −7.243957, b = 302.310069, c = 154.454210 | −7.243957 | −14.487914 | 302.3101 | 154 |
| Location | 2022 | 2023 | 2024 | 2025 | FRMSE | VRMSE | Location | 2022 | 2023 | 2024 | 2025 | FRMSE | VRMSE | ||
|---|---|---|---|---|---|---|---|---|---|---|---|---|---|---|---|
| 1 | Netherlands | 37 | 37 | 37 | 37 | 0 | 0 | 1 | Netherlands | 37 | 37 | 37 | 37 | 0 | 0 |
| 2 | Denmark | 6 | 6 | 5 | 5 | 1 | 1 | 2 | Denmark | 6 | 6 | 5 | 5 | 1 | 1 |
| 3 | Estonia | 7 | 8 | 8 | 8 | 1 | 4 | 3 | Estonia | 7 | 8 | 8 | 8 | 1 | 4 |
| 4 | Hungary | 61 | 62 | 63 | 64 | 1 | 5 | 4 | Hungary | 61 | 62 | 63 | 64 | 1 | 5 |
| 5 | Belgium | 1413 | 1412 | 1410 | 1408 | 5 | 15 | 5 | Belgium | 1413 | 1412 | 1410 | 1408 | 5 | 15 |
| 6 | Latvia | 1592 | 1595 | 1597 | 1600 | 11 | 31 | 6 | Croatia | 2245 | 2259 | 2274 | 2289 | 18 | 26 |
| 7 | Croatia | 2245 | 2259 | 2274 | 2289 | 18 | 26 | 7 | Latvia | 1592 | 1595 | 1597 | 1600 | 11 | 31 |
| 8 | N. Maced | 736 | 753 | 770 | 788 | 21 | 45 | 8 | Poland | 2381 | 2376 | 2369 | 2362 | 24 | 38 |
| 9 | Finland | 3159 | 3159 | 3158 | 3156 | 23 | 65 | 9 | N. Maced | 736 | 753 | 770 | 788 | 21 | 45 |
| 10 | Poland | 2381 | 2376 | 2369 | 2362 | 24 | 38 | 10 | Italy | 22,915 | 23,020 | 23,125 | 23,228 | 100 | 55 |
| 11 | Luxembourg | 1399 | 1424 | 1450 | 1478 | 38 | 196 | 11 | Finland | 3159 | 3159 | 3158 | 3156 | 23 | 65 |
| 12 | Romania | 6752 | 6767 | 6781 | 6794 | 52 | 72 | 12 | Romania | 6752 | 6767 | 6781 | 6794 | 52 | 72 |
| 13 | Slovenia | 1469 | 1499 | 1530 | 1561 | 53 | 267 | 13 | France | 26,071 | 26,135 | 26,201 | 26,269 | 118 | 160 |
| 14 | Ireland | 526 | 530 | 535 | 540 | 69 | 205 | 14 | Greece | 3415 | 3415 | 3413 | 3409 | 71 | 185 |
| 15 | Greece | 3415 | 3415 | 3413 | 3409 | 71 | 185 | 15 | Luxembourg | 1399 | 1424 | 1450 | 1478 | 38 | 196 |
| 16 | Albania | 2459 | 2559 | 2664 | 2773 | 75 | 357 | 16 | Ireland | 526 | 530 | 535 | 540 | 69 | 205 |
| 17 | Lithuania | 736 | 697 | 656 | 611 | 87 | 386 | 17 | Slovenia | 1469 | 1499 | 1530 | 1561 | 53 | 267 |
| 18 | Italy | 22,915 | 23,020 | 23,125 | 23,228 | 100 | 55 | 18 | Austria | 15,313 | 15,580 | 15,855 | 16,138 | 177 | 334 |
| 19 | France | 26,071 | 26,135 | 26,201 | 26,269 | 118 | 160 | 19 | Albania | 2459 | 2559 | 2664 | 2773 | 75 | 357 |
| 20 | Czechia | 2146 | 2111 | 2073 | 2030 | 120 | 359 | 20 | Czechia | 2146 | 2111 | 2073 | 2030 | 120 | 359 |
| 21 | Islanda | 2334 | 2391 | 2448 | 2505 | 146 | 678 | 21 | Sweden | 16,416 | 16,411 | 16,406 | 16,401 | 151 | 370 |
| 22 | Sweden | 16,416 | 16,411 | 16,406 | 16,401 | 151 | 370 | 22 | Lithuania | 736 | 697 | 656 | 611 | 87 | 386 |
| 23 | Montenegro | 835 | 862 | 889 | 915 | 152 | 604 | 23 | Norway | 34,302 | 34,769 | 35,251 | 35,747 | 298 | 401 |
| 24 | Austria | 15,313 | 15,580 | 15,855 | 16,138 | 177 | 334 | 24 | Montenegro | 835 | 862 | 889 | 915 | 152 | 604 |
| 25 | Bulgaria | 3604 | 3659 | 3714 | 3769 | 215 | 667 | 25 | Bulgaria | 3604 | 3659 | 3714 | 3769 | 215 | 667 |
| 26 | Portugal | 7660 | 7872 | 8090 | 8313 | 289 | 1240 | 26 | Islanda | 2334 | 2391 | 2448 | 2505 | 146 | 678 |
| 27 | Norway | 34,302 | 34,769 | 35,251 | 35,747 | 298 | 401 | 27 | Spain | 20,423 | 20,537 | 20,648 | 20,757 | 317 | 943 |
| 28 | Spain | 20,423 | 20,537 | 20,648 | 20,757 | 317 | 943 | 28 | Portugal | 7660 | 7872 | 8090 | 8313 | 289 | 1240 |
| 29 | Germany | 11,048 | 11,015 | 10,974 | 10,925 | 363 | 1800 | 29 | Slovakia | 1935 | 1775 | 1601 | 1414 | 450 | 1602 |
| 30 | Slovakia | 1935 | 1775 | 1601 | 1414 | 450 | 1602 | 30 | Germany | 11,048 | 11,015 | 10,974 | 10,925 | 363 | 1800 |
| 31 | Serbia | 2411 | 2242 | 2059 | 1861 | 571 | 2042 | 31 | Serbia | 2411 | 2242 | 2059 | 1861 | 571 | 2042 |
| 32 | UK | 2350 | 2095 | 1827 | 1546 | 906 | 2224 | 32 | UK | 2350 | 2095 | 1827 | 1546 | 906 | 2224 |
| 33 | Türkiye | 34,244 | 35,994 | 37,802 | 39,667 | 1222 | 3877 | 33 | Türkiye | 34,244 | 35,994 | 37,802 | 39,667 | 1222 | 3877 |
Disclaimer/Publisher’s Note: The statements, opinions and data contained in all publications are solely those of the individual author(s) and contributor(s) and not of MDPI and/or the editor(s). MDPI and/or the editor(s) disclaim responsibility for any injury to people or property resulting from any ideas, methods, instructions or products referred to in the content. |
© 2024 by the authors. Licensee MDPI, Basel, Switzerland. This article is an open access article distributed under the terms and conditions of the Creative Commons Attribution (CC BY) license (https://creativecommons.org/licenses/by/4.0/).
Share and Cite
Lincaru, C.; Grigorescu, A.; Dincer, H. Parabolic Modeling Forecasts of Space and Time European Hydropower Production. Processes 2024, 12, 1098. https://doi.org/10.3390/pr12061098
Lincaru C, Grigorescu A, Dincer H. Parabolic Modeling Forecasts of Space and Time European Hydropower Production. Processes. 2024; 12(6):1098. https://doi.org/10.3390/pr12061098
Chicago/Turabian StyleLincaru, Cristina, Adriana Grigorescu, and Hasan Dincer. 2024. "Parabolic Modeling Forecasts of Space and Time European Hydropower Production" Processes 12, no. 6: 1098. https://doi.org/10.3390/pr12061098
APA StyleLincaru, C., Grigorescu, A., & Dincer, H. (2024). Parabolic Modeling Forecasts of Space and Time European Hydropower Production. Processes, 12(6), 1098. https://doi.org/10.3390/pr12061098