
Strategies for Optimizing Shut-In Time: New Insights from Shale Long-Term Hydration Experiments

 ,
,
Abstract
1. Introduction
2. Materials and Methods
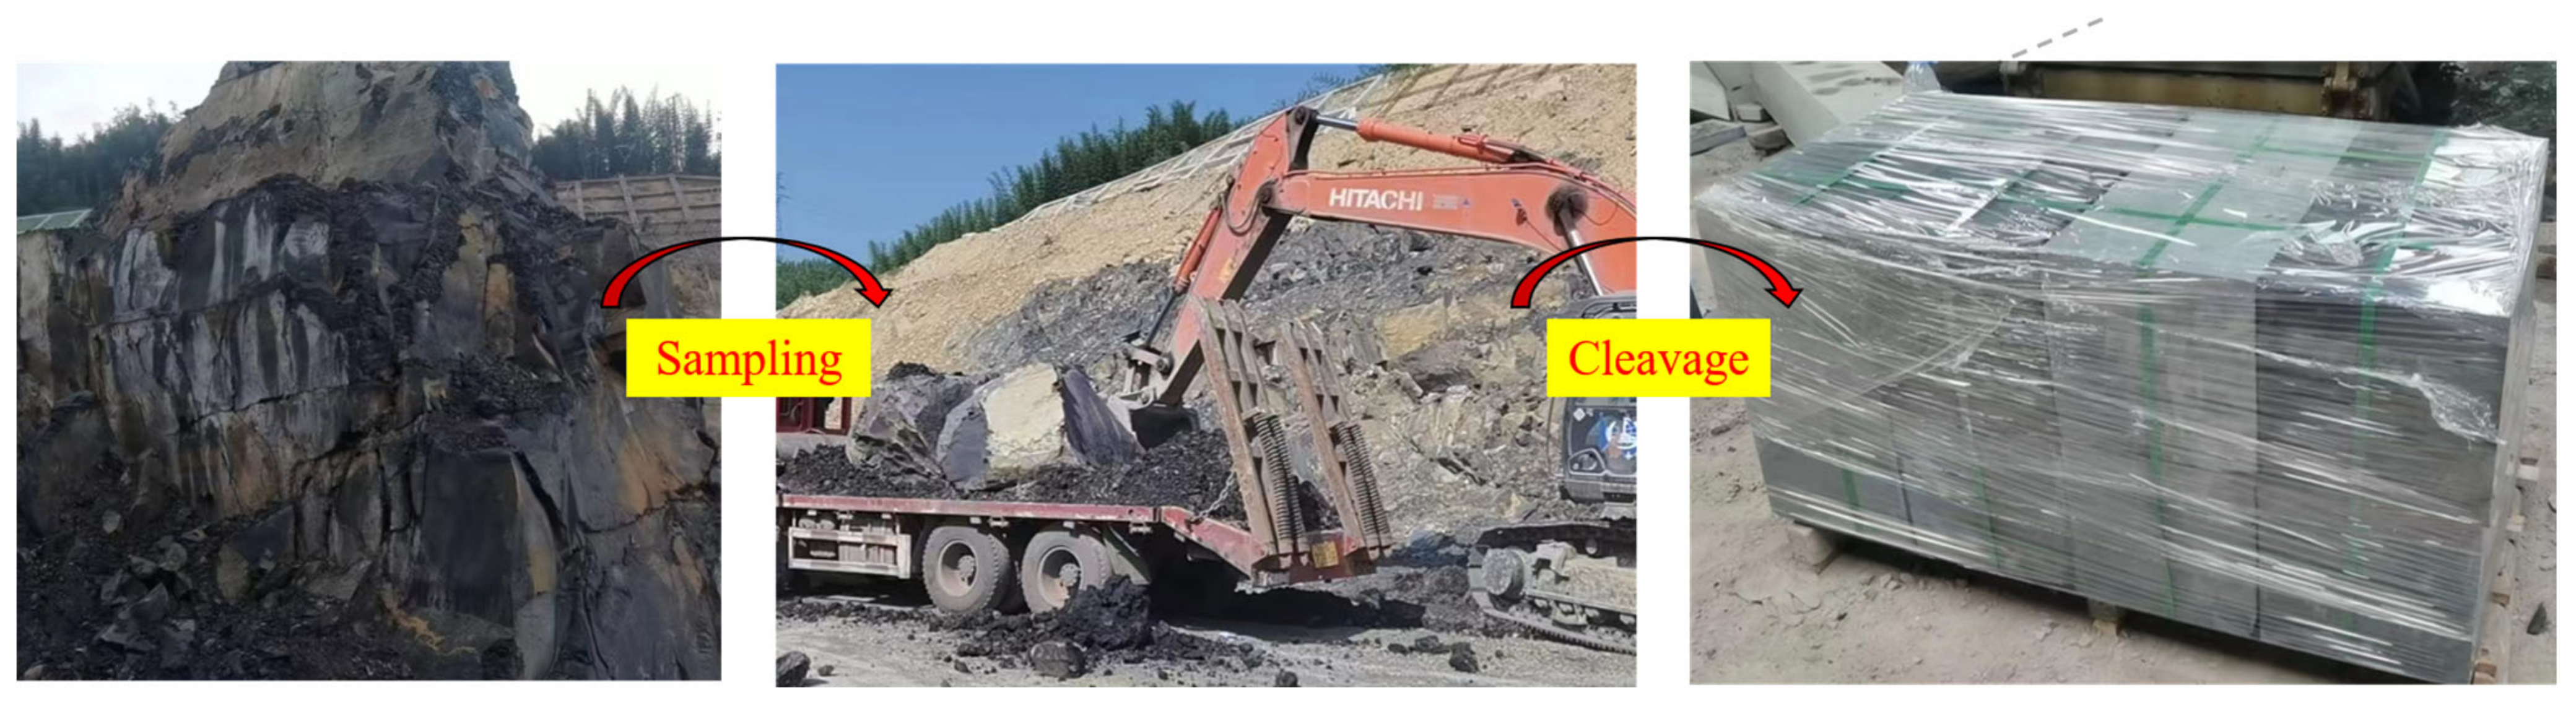
2.1. Experimental Material
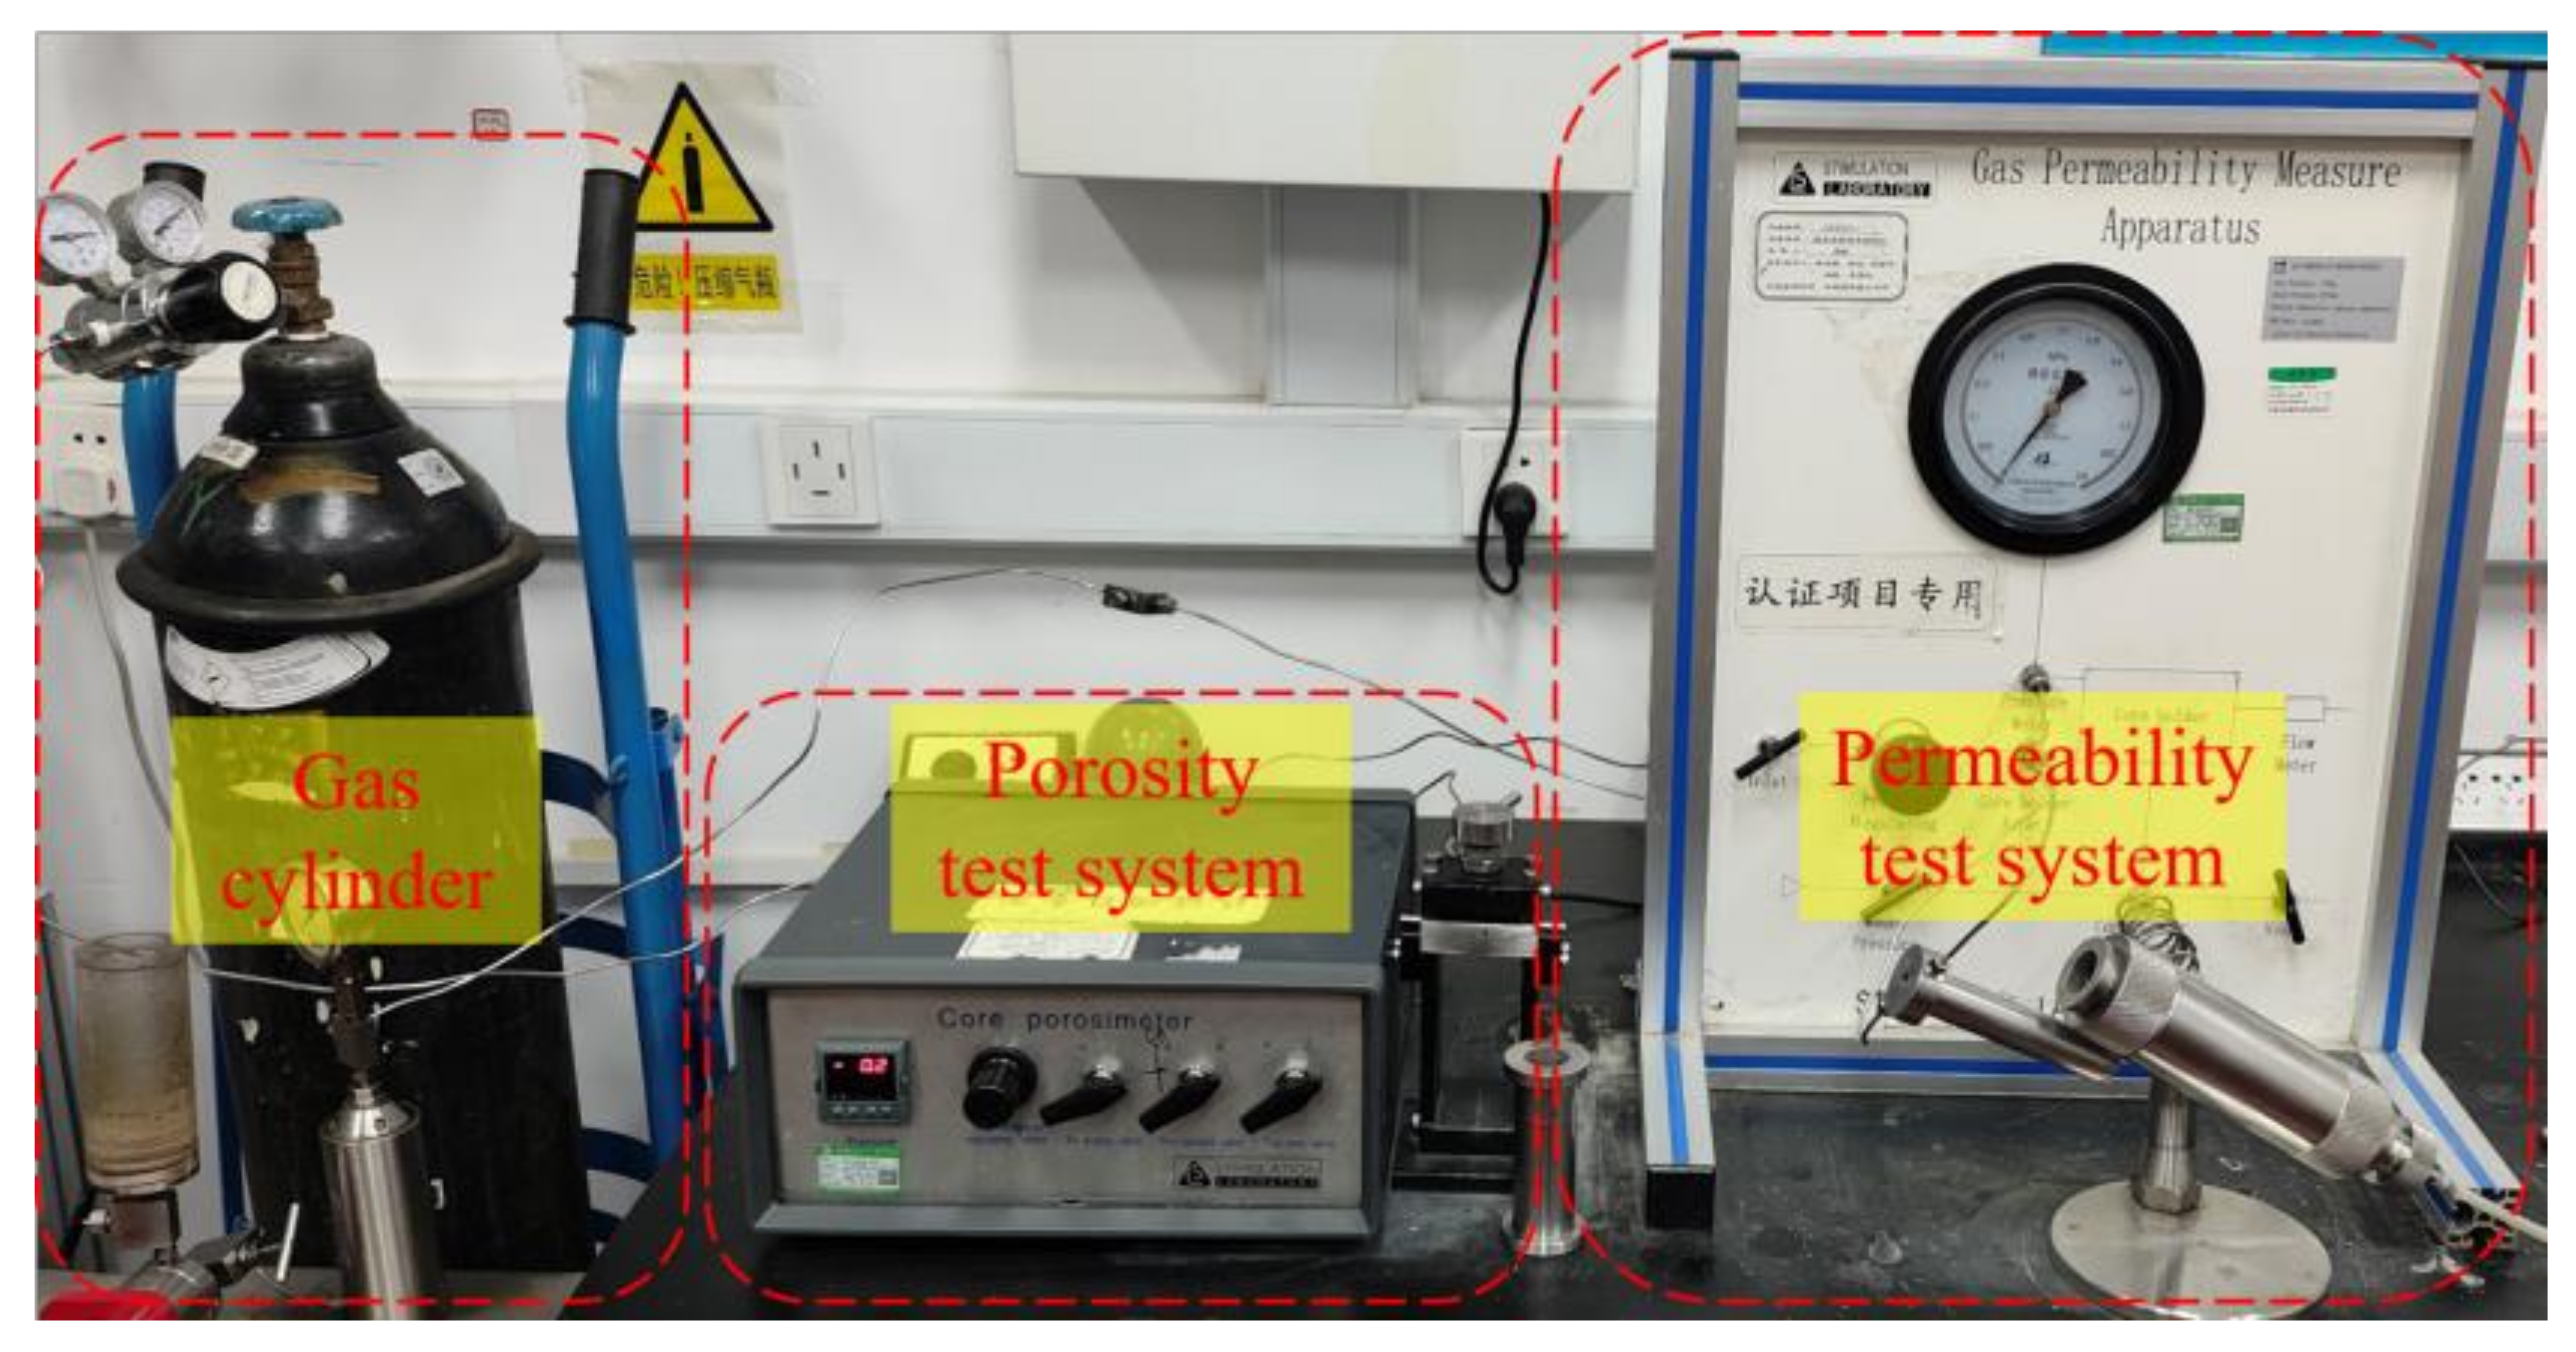
2.2. Experimental Method
3. Results and Discussion
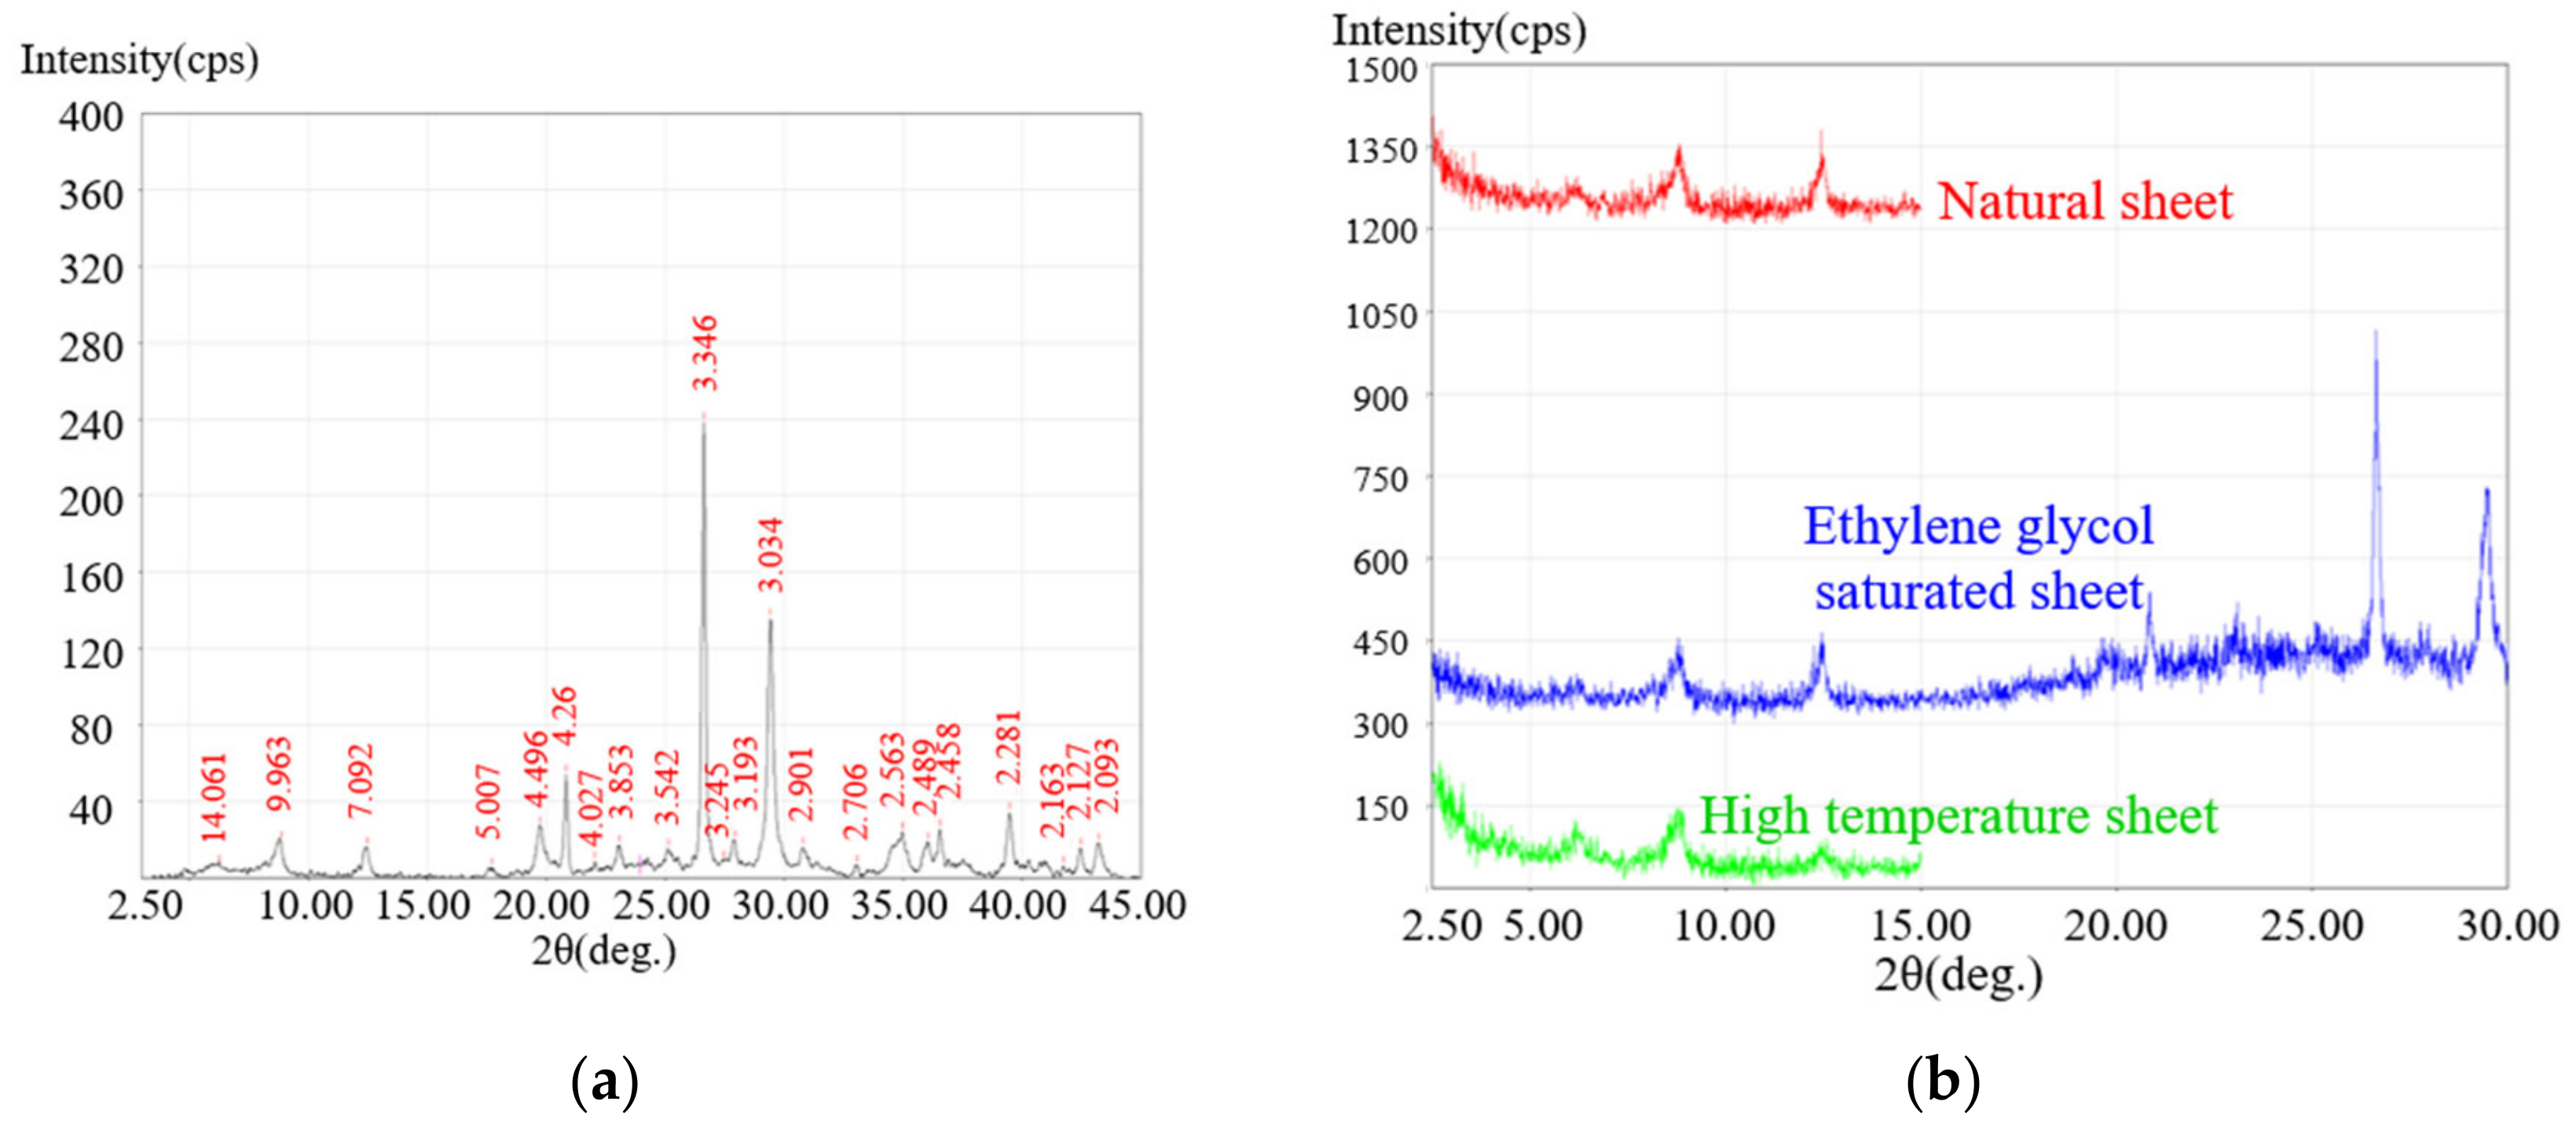
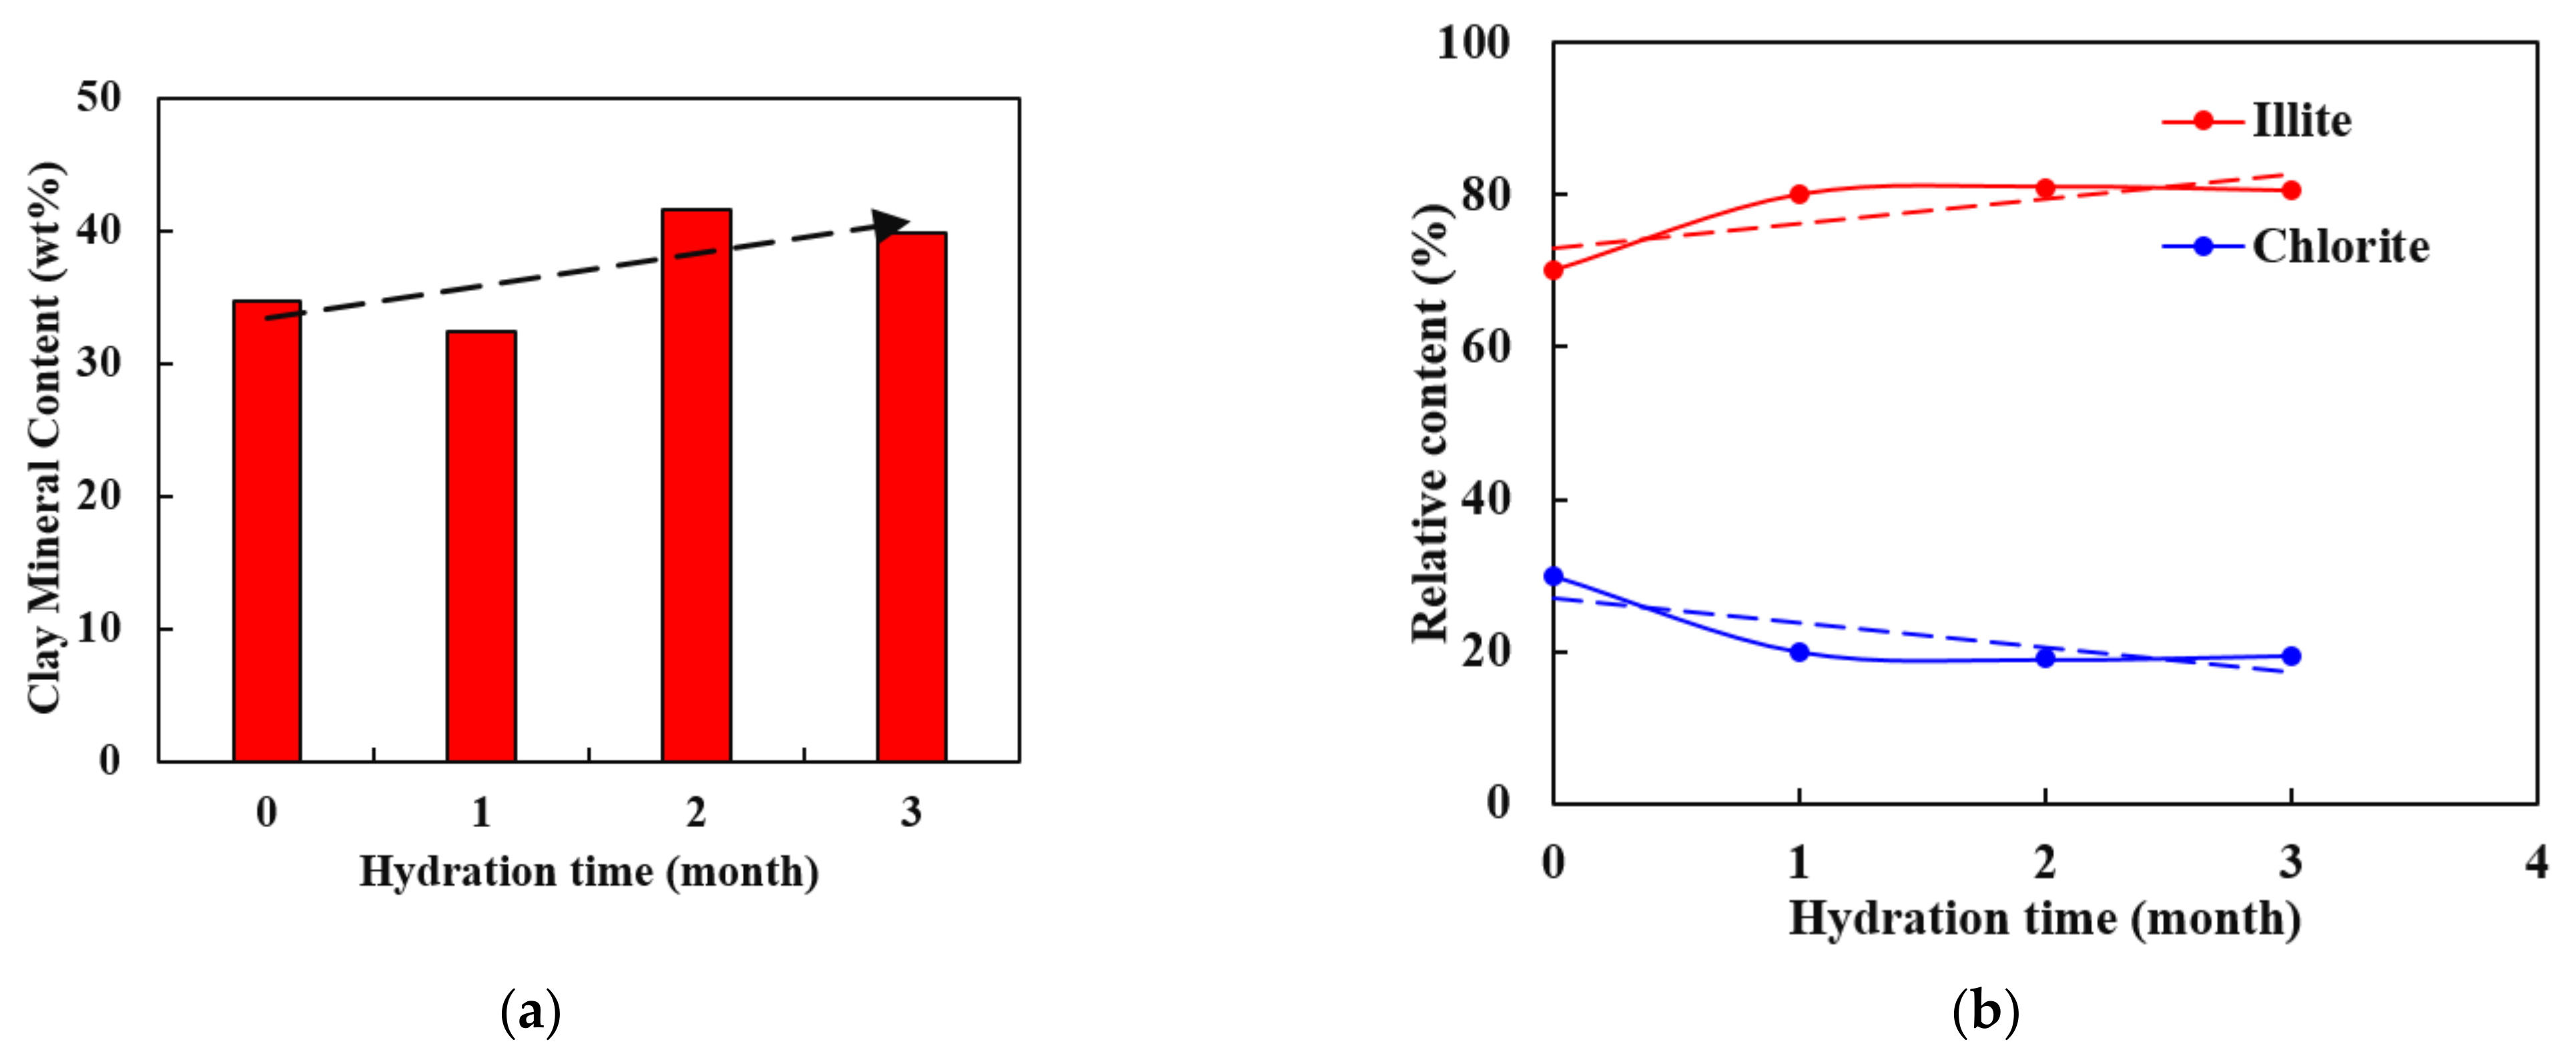
3.1. Testing of Shale Mineral Components Based on XRD Scanning
3.2. Shale Tensile Strength Test Based on Uniaxial Compression Experiment
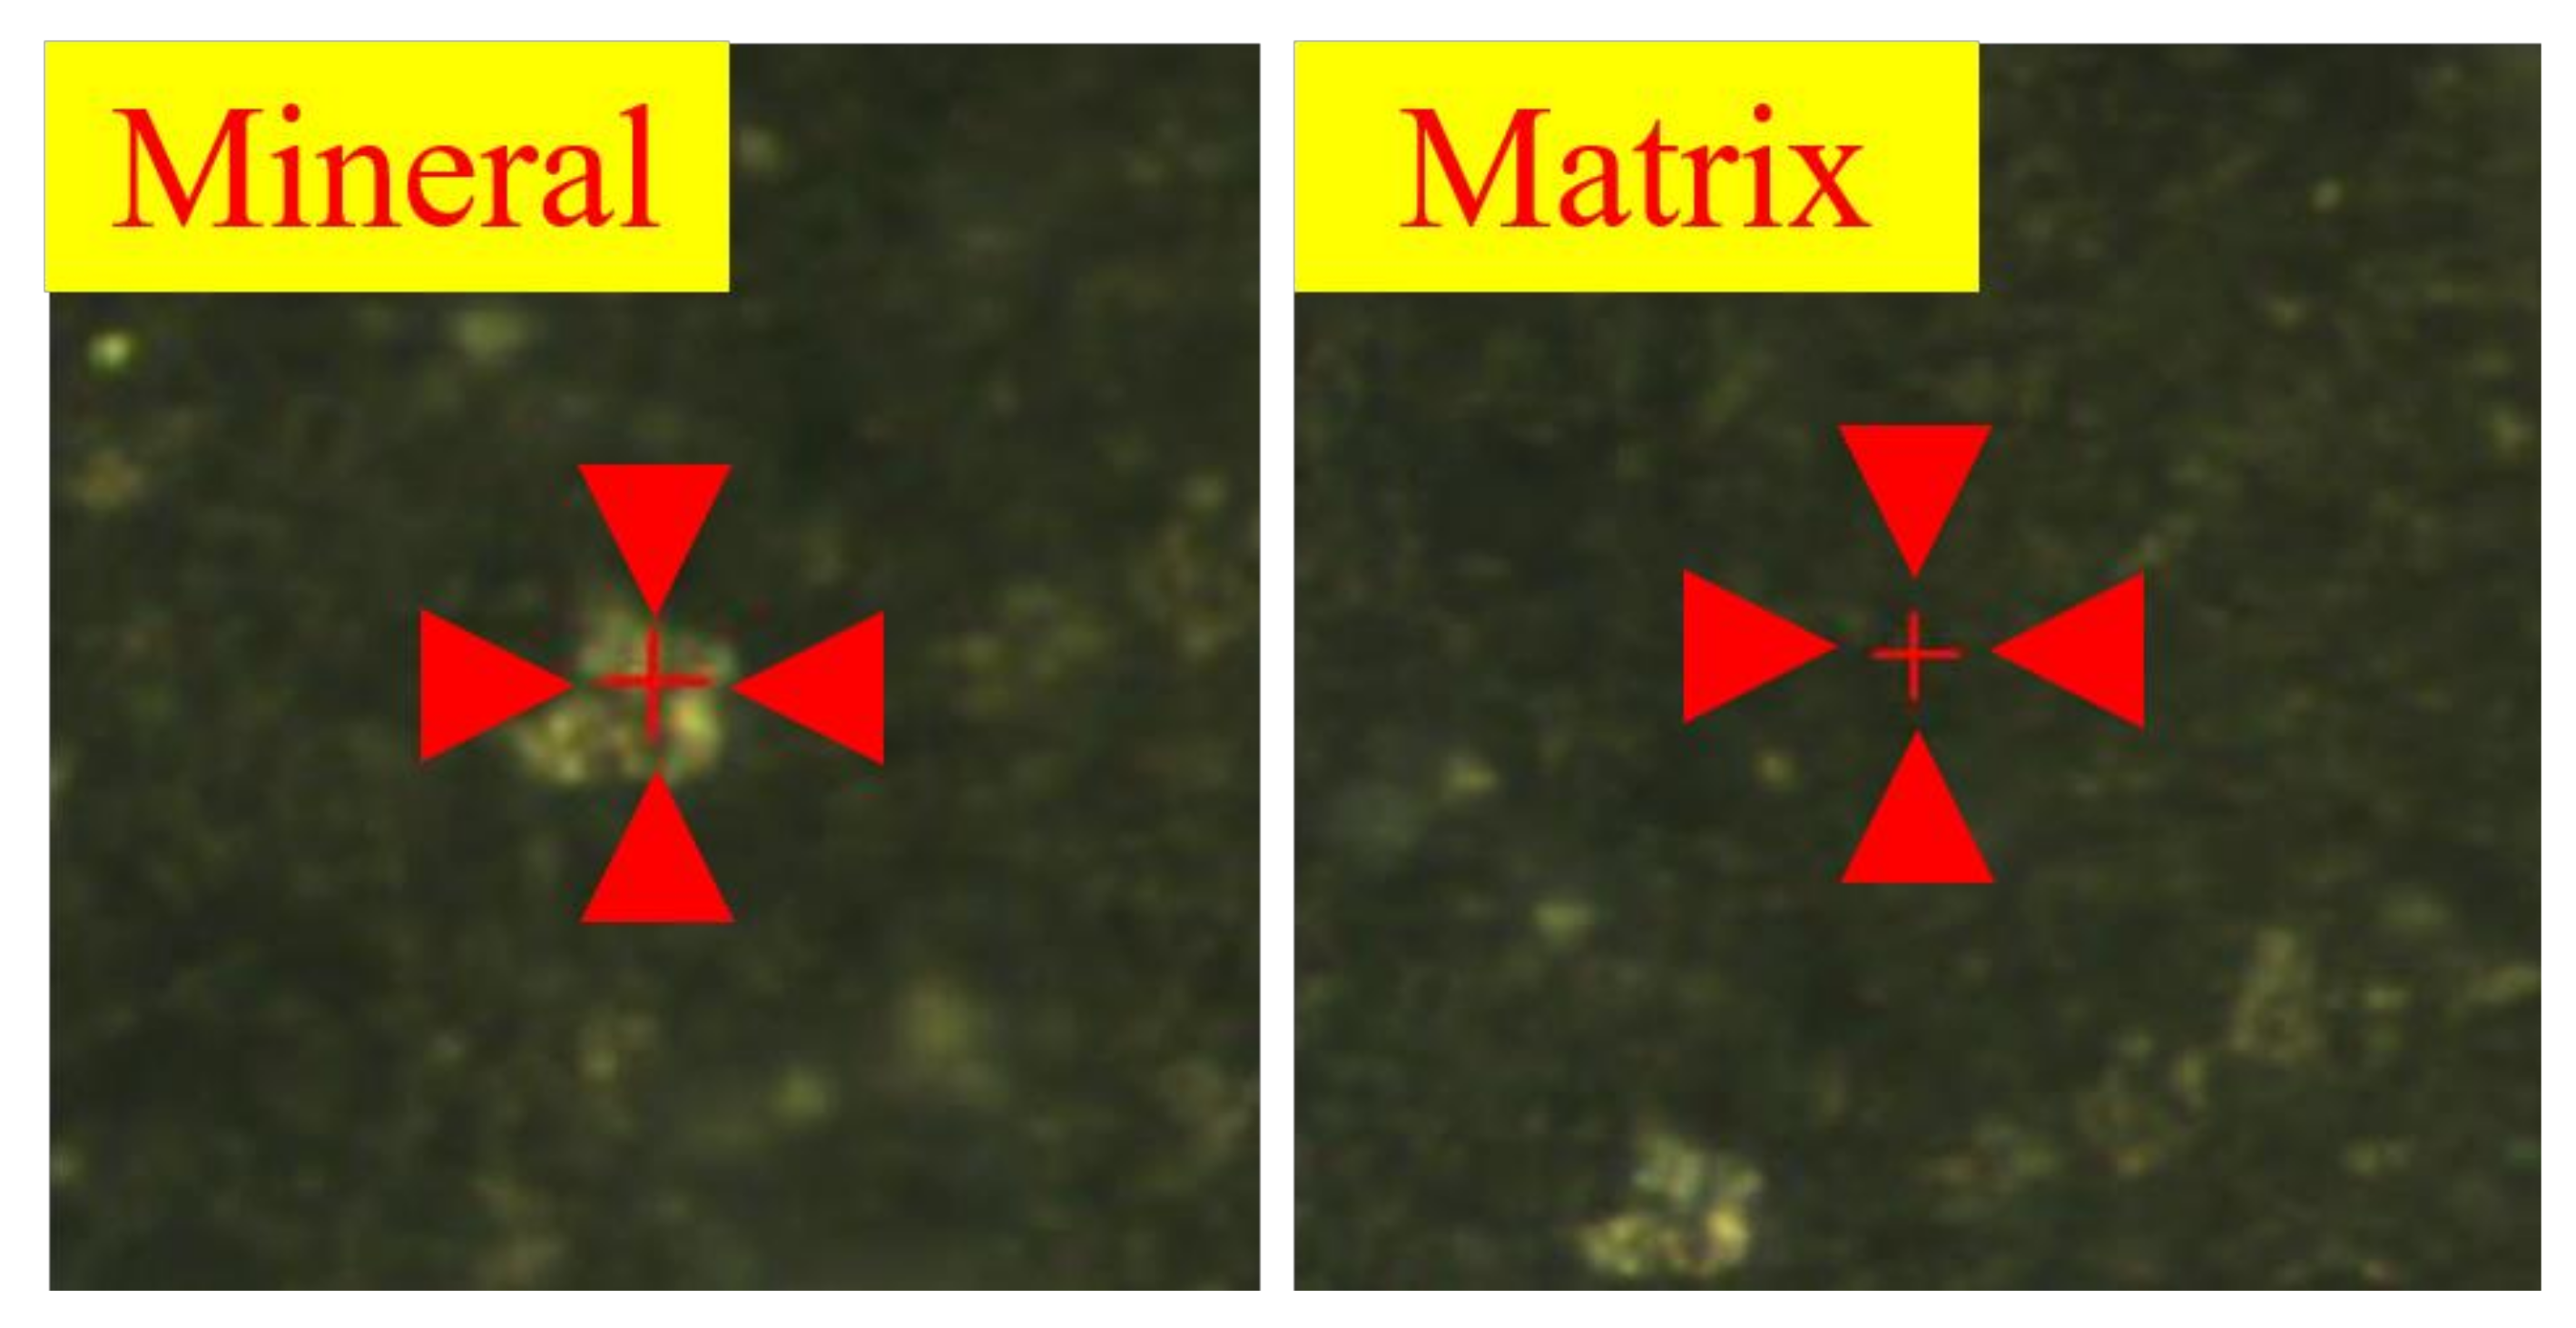
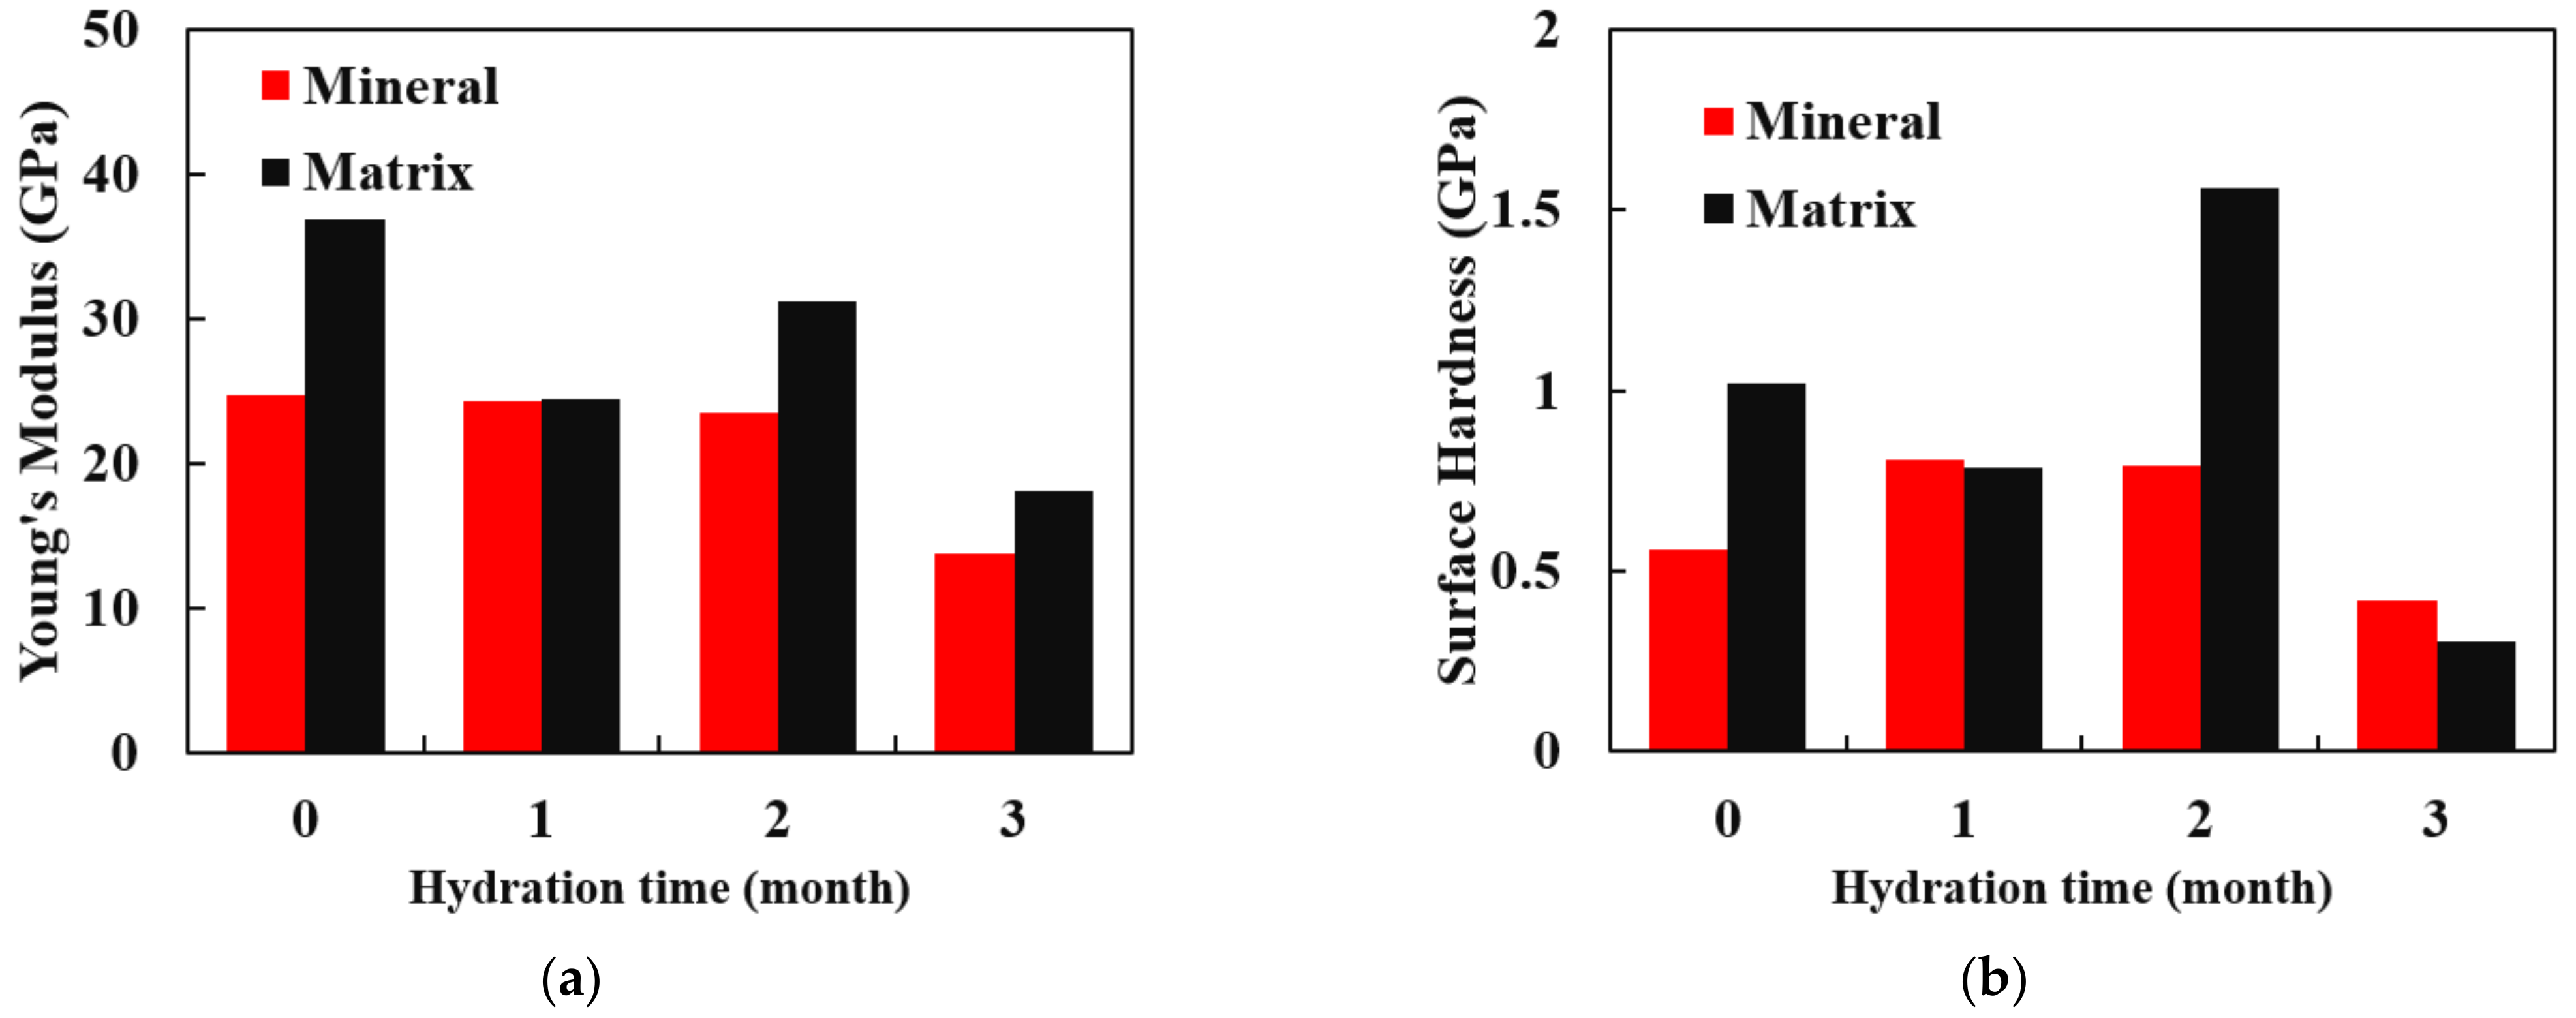
3.3. Mechanical Parameter Testing Based on Nanoindentation
3.4. CT Scan
4. Conclusions
- After three months of the water–shale reaction, the overall mass fraction of clay minerals increases from 34.7% to 39.8%, and the proportion of illite increases from 70% to 80.5%, with an upward trend showing a steep rise at first and then a stable trend.
- The uniaxial compression experiment shows that the tensile strength of the shale specimens decreases significantly by 90.36% in the first three months of the water–shale reaction, indicating that shale pore initiation, connectivity, and fracture expansion significantly reduce the tensile strength. After hydraulic fracturing, prolonging the shut-in time is conducive to reducing shale fracture pressure and promoting micro-fracture propagation.
- The nanoindentation experiment shows that in the first three months of the water–shale reaction, the mineral point Young’s modulus decreases, marking the mineral softening.
- The process of fracture expansion is carefully observed by the CT scanning experiment. Based on the phenomenon of abrupt increases in fracture volume, the critical shut-in time is anchored at four months. The fractures that expand under the influence of the water–shale reaction communicate the discrete pores and natural fractures of oil and gas enrichment, contributing to enhanced oil recovery. This indicates that the shut-in time of 4 months helps to expand the fracture space and increase the recovery. However, after 4 months of shut-in time, adding more time will not contribute much to the stimulation.
Author Contributions
Funding
Data Availability Statement
Acknowledgments
Conflicts of Interest
References
- Zou, C.; Dong, D.; Wang, Y.; Li, X.; Huang, J.; Wang, S.; Guan, Q.; Zhang, C.; Wang, H.; Liu, H.; et al. Shale gas in China: Characteristics, challenges and prospects (II). Pet. Explor. Dev. 2016, 43, 182–196. [Google Scholar] [CrossRef]
- Melikoglu, M. Shale gas: Analysis of its role in the global energy market. Renew. Sustain. Energy Rev. 2014, 37, 460–468. [Google Scholar] [CrossRef]
- Buchner, T.; Kiefer, T.; Zelaya-Lainez, L.; Gaggl, W.; Konegger, T.; Füssl, J. A multitechnique, quantitative characterization of the pore space of fired bricks made of five clayey raw materials used in European brick industry. Appl. Clay Sci. 2021, 200, 105884. [Google Scholar] [CrossRef]
- Feng, J.; Tian, H.; Huang, Y.; Ding, Z.; Yin, Z. Pyrite oxidation mechanism in aqueous medium. J. Chin. Chem. Soc. 2019, 66, 345–354. [Google Scholar] [CrossRef]
- Fathy, D.; Wagreich, M.; Fathi, E.; Ahmed, M.S.; Leila, M.; Sami, M. Maastrichtian Anoxia and Its Influence on Organic Matter and Trace Metal Patterns in the Southern Tethys Realm of Egypt during Greenhouse Variability. ACS Omega 2023, 8, 19603–19612. [Google Scholar] [CrossRef] [PubMed]
- Li, Z.; Li, G.; Li, H.; Liu, J.; Jiang, Z.; Zeng, F. Effects of shale swelling on shale mechanics during shale–liquid interaction. Energy 2023, 279, 128098. [Google Scholar] [CrossRef]
- Liu, Y.; Yang, C.; Wang, J.; Xiong, Y.; Peng, P. New insights into hydration-induced creep behavior of shale: A comparison study of brittle black shale and clayey oil shale at micro-scale. Mar. Pet. Geol. 2022, 138, 105554. [Google Scholar] [CrossRef]
- Li, C.; Jin, Z.; Zhang, L.; Liang, X. Advancing the application of sub- and supercritical water in the in-situ conversion of immature and low-maturity shale. Fuel 2024, 359, 129891. [Google Scholar] [CrossRef]
- Liu, A.; Liu, S.; Zhang, R.; Sang, G.; Xia, K. Cyclical water vapor sorption-induced structural alterations of mine roof shale. Int. J. Coal Geol. 2023, 273, 104267. [Google Scholar] [CrossRef]
- Jin, L.; Rother, G.; Cole, D.R.; Mildner, D.F.; Duffy, C.J.; Brantley, S.L. Characterization of deep weathering and nanoporosity development in shale—A neutron study. Am. Miner. 2011, 96, 498–512. [Google Scholar] [CrossRef]
- Fathy, D.; Baniasad, A.; Littke, R.; Sami, M. Tracing the geochemical imprints of Maastrichtian black shales in southern Tethys, Egypt: Assessing hydrocarbon source potential and environmental signatures. Int. J. Coal Geol. 2024, 283, 104457. [Google Scholar] [CrossRef]
- Chavali, R.V.P.; Vindula, S.K.; Reddy, P.H.R.; Babu, A.; Pillai, R.J. Swelling behavior of kaolinitic clays contaminated with alkali solutions: A micro-level study. Appl. Clay Sci. 2017, 135, 575–582. [Google Scholar] [CrossRef]
- Amorim, C.L.G.; Lopes, R.T.; Barroso, R.C.; Queiroz, J.C.; Alves, D.B.; Perez, C.A.; Schelin, H.R. Effect of clay–water interactions on clay swelling by X-ray diffraction. Nuclear Instruments and Methods in Physics Research Section A: Accelerators, Spectrometers, Detectors and Associated. Equipment 2007, 580, 768–770. [Google Scholar]
- Lin, H.; Sun, X.; Yuan, Y.; Lai, X.; Qu, H.; Luo, C. Experimental investigation on the dynamic volume changes of varied-size pores during shale hydration. J. Nat. Gas Sci. Eng. 2022, 101, 104506. [Google Scholar] [CrossRef]
- Li, N.; Jin, Z.; Zhang, S.; Wang, H.; Yang, P.; Zou, Y.; Zhou, T. Micro-mechanical properties of shale due to water/supercritical carbon dioxide-rock interaction. Pet. Explor. Dev. 2023, 50, 1001–1012. [Google Scholar] [CrossRef]
- Shao, J.; You, L.; Jia, N.; Kang, Y.; Chen, M. Investigation of induced change in pore structure by the reaction of shale with fracturing fluid. Gas Sci. Eng. 2023, 110, 204860. [Google Scholar] [CrossRef]
- Jiang, L.; Zhou, H.; Peng, X. Bio-oxidation of pyrite, chalcopyrite and pyrrhotite by Acidithiobacillus ferrooxidans. Chin. Sci. Bull. 2007, 52, 2702–2714. [Google Scholar] [CrossRef]
- SY/T5163-2010; Analysis Method for Clay Minerals and Ordinary Non-Clay Minerals in Sedimentary Rocks by the X-ray Diffraction. National Energy Administration: Beijing, China, 2010.
- SY/T 5477-2003; The Division of Diagenetic Srages in Clastic Rocks. State Economic and Trade Commission: Beijing, China, 2003.
- Oliver, W.C.; Pharr, G.M. Measurement of hardness and elastic modulus by instrumented indentation: Advances in understanding and refinements to methodology. J. Mater. Res. 2004, 19, 3–20. [Google Scholar] [CrossRef]
- Oliver, W.C.; Pharr, G.M. An improved technique for determining hardness and elastic modulus using load and dis-placement sensing indentation experiments. J. Mater. Res. 1992, 7, 1564–1583. [Google Scholar] [CrossRef]
- Martinez-Angeles, R.; Hernandez-Escobedo, L.; Perez-Rosales, C. 3 D Quantification of Vugs and Fractures Networks in Limestone Cores. In Proceedings of the SPE Annual Technical Conference and Exhibition, Houston, TX, USA, 3–5 October 2022. [Google Scholar]
- Grim, R.E. Clay Mineralogy. Soil Sci. 1953, 76, 317. [Google Scholar] [CrossRef]
- Tournassat, C.; Steefel, C.I.; Bourg, I.C.; Bergaya, F. Natural and Engineered Clay Barriers; Elsevier: Amsterdam, The Netherlands, 2015. [Google Scholar]
- Carrier, B.; Vandamme, M.; Pellenq, R.J.-M.; Van Damme, H. Elastic Properties of Swelling Clay Particles at Finite Temperature upon Hydration. J. Phys. Chem. C 2014, 118, 8933–8943. [Google Scholar] [CrossRef]
- Carrier, B.; Vandamme, M.; Pellenq, R.J.-M.; Bornert, M.; Ferrage, E.; Hubert, F.; Van Damme, H. Effect of Water on Elastic and Creep Properties of Self-Standing Clay Films. Langmuir 2016, 32, 1370–1379. [Google Scholar] [CrossRef] [PubMed]
- Zhang, L.; Lu, X.; Liu, X.; Yang, K.; Zhou, H. Surface Wettability of Basal Surfaces of Clay Minerals: Insights from Molecular Dynamics Simulation. Energy Fuels 2016, 30, 149–160. [Google Scholar] [CrossRef]
- Li, Q.; Li, J.; Zhu, B. Experimental investigation of the influence of sequential water-rock reactions on the mineral altera-tions and porosity evolution of shale. Constr. Build. Mater. 2022, 317, 125859. [Google Scholar] [CrossRef]
- Liao, X.; Chigira, M.; Matsushi, Y.; Wu, X. Investigation of water–rock interactions in Cambrian black shale via a flow-through experiment. Appl. Geochem. 2014, 51, 65–78. [Google Scholar] [CrossRef]


| Serial Number | Specimen Size | Quantity | Application | Parameter | Typical Specimen |
|---|---|---|---|---|---|
| #1 | 200–400 mesh powder | 1000 g | XRD Scan | Scanning Angle 3.5° to 45° |  |
| #2 | 25 mm ×5 mm | 2 | Nanoindentation | Depth 3000 nm |  |
| #3 | 25 mm ×10 mm | 4 | Uniaxial compression | Uniaxial loading to specimen rupture |  |
| #4 | 25 mm ×50 mm | 6 | CT Scan | Layer thickness 0.625 mm, Voltage 120 mV, Electric current 140 mA |  |
| Parameters | Values |
|---|---|
| Intensity Range | 50–1000 |
| Filter-Volume3d | >50 mm3 |
| Serial Number | (A) Matrix Scanning | (B) Matrix–Fracture Contrasting | (C) Fracture Volume Segmentation |
|---|---|---|---|
| #1 |  |  |  |
| #2 | 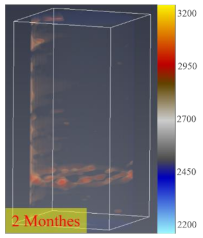 | 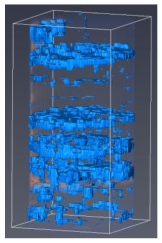 |  |
| #3 | 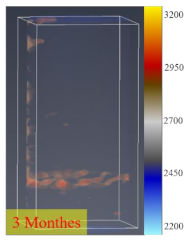 | 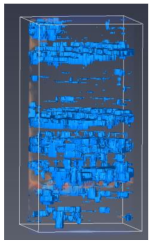 |  |
| #4 |  | 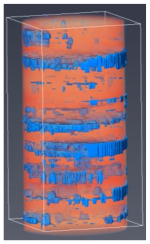 |  |
| #5 | 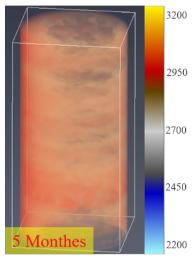 | 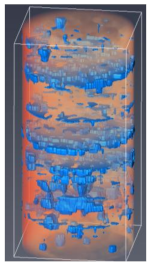 | 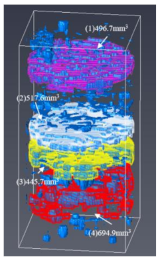 |
| #6 |  |  |  |
| Water–Shale Reaction Time (Months) | Fracture Serial Number | 1 | 2 | 3 | 4 | 5 | 6 |
|---|---|---|---|---|---|---|---|
| Fracture volume (mm3) | (1) | 113.533 | 161.213 | 50.3182 | 115.117 | 496.714 | 152.688 |
| (2) | 248.489 | 384.983 | 423.42 | 454.160 | 517.588 | 492.693 | |
| (3) | 437.014 | 405.483 | 162.469 | 55.416 | 445.671 | 689.304 | |
| (4) | 81.365 | 234.800 | 499.051 | 583.010 | 694.907 | 449.363 | |
| (5) | 507.217 | 431.763 | 374.157 | 329.376 | —— | 625.078 | |
| (6) | 197.798 | 76.421 | 154.317 | 638.536 | —— | 143.042 | |
| (7) | —— | —— | —— | 202.372 | —— | —— | |
| Total volume (mm3) | 1585.416 | 1694.663 | 1663.732 | 2377.987 | 2154.88 | 2552.168 |
Disclaimer/Publisher’s Note: The statements, opinions and data contained in all publications are solely those of the individual author(s) and contributor(s) and not of MDPI and/or the editor(s). MDPI and/or the editor(s) disclaim responsibility for any injury to people or property resulting from any ideas, methods, instructions or products referred to in the content. |
© 2024 by the authors. Licensee MDPI, Basel, Switzerland. This article is an open access article distributed under the terms and conditions of the Creative Commons Attribution (CC BY) license (https://creativecommons.org/licenses/by/4.0/).
Share and Cite
Zeng, B.; Dong, E.; Yao, Z.; Song, Y.; Xiong, Z.; Huang, Y.; Gou, X.; Hu, X. Strategies for Optimizing Shut-In Time: New Insights from Shale Long-Term Hydration Experiments. Processes 2024, 12, 1096. https://doi.org/10.3390/pr12061096
Zeng B, Dong E, Yao Z, Song Y, Xiong Z, Huang Y, Gou X, Hu X. Strategies for Optimizing Shut-In Time: New Insights from Shale Long-Term Hydration Experiments. Processes. 2024; 12(6):1096. https://doi.org/10.3390/pr12061096
Chicago/Turabian StyleZeng, Bo, Enjia Dong, Zhiguang Yao, Yi Song, Zhuang Xiong, Yongzhi Huang, Xiaoyan Gou, and Xiaodong Hu. 2024. "Strategies for Optimizing Shut-In Time: New Insights from Shale Long-Term Hydration Experiments" Processes 12, no. 6: 1096. https://doi.org/10.3390/pr12061096
APA StyleZeng, B., Dong, E., Yao, Z., Song, Y., Xiong, Z., Huang, Y., Gou, X., & Hu, X. (2024). Strategies for Optimizing Shut-In Time: New Insights from Shale Long-Term Hydration Experiments. Processes, 12(6), 1096. https://doi.org/10.3390/pr12061096