Article

Comparison of the Limit of Detection of Paracetamol, Propyphenazone, and Caffeine Analyzed Using Thin-Layer Chromatography and High-Performance Thin-Layer Chromatography

by
Katarzyna Bober-Majnusz
* and
Alina Pyka-Pająk
*
Department of Analytical Chemistry, Faculty of Pharmaceutical Sciences in Sosnowiec, Medical University of Silesia in Katowice, 41-200 Sosnowiec, Poland
*
Authors to whom correspondence should be addressed.
Processes 2024, 12(6), 1153; https://doi.org/10.3390/pr12061153
Submission received: 7 May 2024 / Revised: 29 May 2024 / Accepted: 31 May 2024 / Published: 3 June 2024

Abstract

:
TLC (thin-layer chromatography) and HPTLC (high-performance thin-layer chromatography) in normal (NP) and reversed (RP) phase systems were combined with densitometry to analyze caffeine, propyphenazone, and paracetamol. This work aims to check whether comparable limit of detection (LOD) values can be obtained on TLC and HPTLC plates. Analyses were performed on five (NP) or four (RP) different stationary phases (chromatographic plates), testing, in both cases, three mobile phases. It is shown that by using both TLC and HPTLC plates, it is possible to develop chromatographic conditions that enable the detection of compounds analyzed in amounts ranging from a dozen to several dozen µg/spot. In the RP system, lower LOD values for all tested compounds were obtained using TLC than HPTLC. However, performing analyses in the NP, similar (of the same order) LOD values were obtained for caffeine, propyphenazone, and paracetamol when using both TLC and HPTLC plates. For example, during the NP-HPTLC analysis using silica gel 60F254 plates (#1.05548) and mobile phase B (n-hexane—acetone—ammonia, 25:25:0.5, v/v/v), LOD values for caffeine, propyphenazone, and paracetamol were 0.010, 0.046, and 0.030 μg/spot, respectively. During NP-TLC analysis using silica gel 60F254 (#1.05554 plates) and the mobile phase C (chloroform—toluene—ethyl acetate—methanol—80% acetic acid, 18:18:7.5:6:0.3, v/v), the values of LOD were 0.054, 0.029, and 0.016 μg/spot, respectively. During RP-TLC analysis using TLC RP-18F254 plates (#1.05559) and mobile phase F (methanol-water, 40:10, v/v), the LOD values were 0.019, 0.024, and 0.053 μg/spot, respectively. Therefore, for economical reasons, TLC plates should be recommended for analyses of caffeine, propyphenazone, and paracetamol, which are several times cheaper than HPTLC plates.

1. Introduction

Each analytical method, including pharmaceutical analysis, requires validation. Validation of analytical procedures is carried out based on the guidelines of the International Conference on Harmonization (ICH) [1]. One of the parameters when performing method validation is the detection limit. The limit of detection (LOD) of the analyzed compound is defined usually as the lowest quantity or concentration of a component that can be detected reliably with a given analytical method [2]. There are several methods for determining the limit of detection (LOD), including the signal-to-noise method or preparing the linear regression [3].
Many methods of determination have been developed for substances analyzed in our work, i.e., caffeine, propyphenazone, and paracetamol. All three compounds are popular ingredients of pharmaceutical preparations available on the market. They appear both as the sole active ingredient and in complex preparations. For example, there are known caffeine preparations combined with paracetamol or salicylic acid, and also preparations that contain the three abovementioned compounds [4]. Propyphenazone can be combined with ergotamine or allobarbital. Paracetamol is the most often found in preparations as the only active ingredient, but it also can be combined with tramadol or diphenhydramine. Due to the multitude of pharmaceutical preparations containing the mentioned compounds (caffeine, propyphenazone, and paracetamol), it seems necessary to propose new methods for their determination, for example, due to the need to control their quality or monitor the production process.
The most common methods used in pharmaceutical analysis are chromatographic methods. It is, for example, micellar liquid chromatography for the analysis of caffeine in anti-inflammatory drugs containing caffeine [5]. The method was carried out on a C18-SN column and required daily tedious column washing to remove the mobile phase. In turn, caffeine in combination with ibuprofen was analyzed using gas chromatography at high temperatures [6]. A popular method in chemical, medical, or pharmaceutical analysis is high-performance liquid chromatography (HPLC), and, therefore, many analyses of caffeine, paracetamol, and propyphenazone are carried out using this method. The analyses concern single compounds or multi-component mixtures, also with substances other than those mentioned [7,8,9,10,11,12,13,14,15,16]. Most often, these are preparations available on the pharmaceutical market. Some of them were conducted in combination with HPLC and mass spectrometry [17,18,19,20,21]. Many analysts, however, tend to use a chromatographic method that is simpler, taking into account, for example, sample preparation. This method is thin-layer chromatography. One of the multi-component caffeine preparations (with codeine and paracetamol) was analyzed using two chromatographic methods: HPLC, and TLC [22]. Both methods gave good results, and proved to be proper for both quality control and routine analysis. Egyptian scientists also compared two chromatographic methods [23]. The assay concerned paracetamol, caffeine, and propyphenazone in the presence of two paracetamol impurities: 4-aminophenol, and 4-nitrophenol. RP-HPLC and TLC combined with densitometry were used. Both methods of simultaneous determination of the mentioned compounds have been validated. The comparison showed no significant differences. The literature base also includes studies concerning only thin-layer chromatography analysis, the most often method that is combined with densitometric quantitative analysis of compounds such as caffeine, propyphenazone, and paracetamol [24,25,26,27]. The most commonly used stationary phase are plates pre-coated with silica gel with an agent that allows for the visualization of chromatographic spots under UV light. There are also HPTLC (high-performance thin-layer chromatography) plates that are pre-coated with a thinner layer of a very fine-grained sorbent than in TLC [28]. It allows for greater sensitivity and resolution of the assay, which in practice should translate into a lower LOD value obtained during the determination. An interesting study is the analysis of a four-component preparation with anti-migraine activity (metoclopramide, ergotamine, caffeine, and paracetamol). The green HPTLC method was used for that purpose [29]. Validation parameters were checked using the International Conference of Harmonization guidelines. The analysis gave promising results. Propyphenazone and caffeine were also determined using TLC combined with densitometry in the presence of three other components, i.e., ergotamine tartrate and two impurities: phenazone and theophylline [30]. All compounds have been determined in human plasma and one of the pharmaceutical preparations. The method was found to be economical and eco-friendly.
Methods other than chromatography are also important, although are used less frequently. For example, all compounds analyzed in our work were also determined simultaneously using two electrochemical methods [31]. Both methods were based on square-wave voltammetric detection, and were statistically compared with each other. No significant differences were found between them. Paracetamol, propyphenazone, and caffeine were also determined using UV spectrophotometry [32,33]. Also, an interesting approach was taken by researchers from Bulgaria. The data obtained from the analysis were used to create chemometric models. The models were tested on an external data set at concentrations within the calibration range. Then, the obtained models were successfully used in the determination of active ingredients in pharmaceutical preparations containing paracetamol, caffeine, and propyphenazone.
Our work aimed to compare the LOD of caffeine, propyphenazone, and paracetamol analyzed using TLC and HPTLC, and to check whether it is possible to develop conditions using the TLC technique that would allow us to obtain LOD lower or comparable to the results obtained using the HPTLC technique.

2. Materials and Methods

2.1. Compounds Analyzed and Their Solutions

Three compounds with pharmacological activity were analyzed. These include caffeine (Fluka, Ballwin, MI, USA), propyphenazone (Sigma-Aldrich, Saint Louis, MO, USA), and paracetamol (Sigma-Aldrich, Saint Louis, MO, USA). Initial solutions of the analyzed substances with the following concentrations: 0.05, 0.1, 0.2, 0.3, 0.4, and 0.5 mg/mL were prepared in 99.8% ethyl alcohol (POCh, Gliwice, Poland).

2.2. Thin-Layer Chromatography

In order to determine the LOD, both adsorption (NP) and partition (RP) thin-layer chromatography were performed. Various chromatography plates were used as stationary phases, both for TLC and HPTLC. Seven different stationary phases were used for the analysis: TLC chromatographic plates, i.e., silica gel 60 F254 on aluminum foil (#1.05554), silica gel 60 RP-2 F254 silanized on glass (#1.05747), and silica gel RP-18 F254 (#1.05559) on aluminum foil, as well as HPTLC chromatographic plates: silica gel 60 F254 on aluminum foil (#1.05548), silica gel 60 F254 with a concentration zone on glass (#1.13728), silica gel 60 RP-2 F254s on glass (#1.13726), and silica gel RP-18 F254 with concentration zone on glass (#1.15498). In the work, product numbers, for example, 1.05554, are used to designate the type of stationary phase. All chromatography plates were supplied by Merck, Darmstadt, Germany. Solutions of the tested substances were spotted on chromatographic plates in an amount of 5 µL. Various mobile phases were prepared by mixing organic solvents and/or distilled water. Table 1 shows the volumetric composition and symbols of the mobile phases used.

2.3. Spectrodensitometric and Densitometric Analysis

For the purpose of the quantitative analysis of the tested compounds, densitometric analysis was performed, preceded by a spectrodensitometric analysis, during which λmax was determined for individual compounds. Analyses, both spectrodensitometric and densitometric, were performed using a Camag TLC Scanner 3 densitometer (Camag, Muttenz, Switzerland) and vision CATS version 3.1 (3.1.211093)—Camag Chromatography Software (Camag, Muttenz, Switzerland). Spectrodensitometric analyses was carried out in the wavelength range of 200–400 nm, and the radiation source was a deuterium lamp. Densitometric measurements were made in the absorption mode, with a resolution of 100 μm/step. The slit size was 10.00 × 0.40 mm, and the scanning speed was 20 mm/s. The maximum wavelengths λmax for individual compounds were, respectively: 276 nm for caffeine, 272 nm for propyphenazone, and 248 for paracetamol.

2.4. LOD Calculation

The LOD values of caffeine, propyphenazone, and paracetamol were calculated from the calibration curve data. LOD was calculated according to the formula:
L O D = 3.3 × σ S
where:
  • σ—standard deviation; and s—standard deviation of the intercept (sa) or residual standard deviation (sxy)
For calculations, we only used the results for which the standard solutions of caffeine, propyphenazone, and paracetamol show the following conditions:
10 × L O D > C
L O D < C
where:
  • C—concentration of compound in a solution.

2.5. Statistical Calculation

Calculations were made using Statistica 13 software (IBM Corp., Armonk, NY, USA). Plots were prepared using Excel 2016 and Statistica 13 software.

3. Results and Discussion

Various analytical techniques are used to analyze active pharmaceutical ingredients. The HPLC, TLC, and HPTLC, and also gas chromatography (GC) methods, are the most commonly used pharmacopoeial methods. They can be successfully used to test the identity and determine the quantity of active pharmaceutical ingredients. TLC and HPTLC are complementary methods to HPLC, and can be used to determine active pharmaceutical ingredients in drugs when HPLC is not available in the laboratory. TLC and HPTLC have various features contributing to their popularity and wide applications. Here are some significant advantages of TLC and HPTLC: lower solvent consumption than column chromatography; several different samples can be separated simultaneously on the chromatographic layer; the separation process may be stopped at any time; stepwise or two-way elution can be used; and separated samples do not need to be pre-cleaned. Compared to other analytical methods, TLC and HPTLC are not very labor intensive. TLC and HPTLC are inexpensive chromatographic methods. TLC and HPTLC equipment are generally inexpensive, and consumables such as TLC plates and solvent solutions are widely available and inexpensive. However, chromatographic plates used in TLC are several times cheaper than HPTLC plates. As a result, TLC is a viable option for regular analysis and large-scale applications. The much lower consumption of mobile phases in TLC, and the possibility of simultaneous analysis of up to a dozen samples on a chromatographic plate, contribute to the fact that TLC is a more ecological method than HPLC. When using HPLC, only one sample is analyzed at a time, and large amounts of eluent are used. For this reason, using the example of three biologically active compounds, an attempt was made to check whether TLC can be as sensitive as HPTLC.
The Tables below present a summary of RF and LOD values for the tested compounds obtained using adsorption thin-layer chromatography (Table 2) and partition thin-layer chromatography (Table 3), respectively. The LODs presented in this paper are the average LOD values calculated based on the standard deviation of the intercept (sa) and the residual standard deviation (sxy).
Both NP-TLC and RP-TLC thin-layer chromatography analyses were performed, with plates 1.05554, 1.05548, and 1.13728 used for NP-TLC analysis, plates 1.05559 and 1.15498 used for RP-TLC analysis, and plates 1.13726 and 1.05747 used for both types of analyses. In the case of mobile phase A (acetone—chloroform—ammonia) and chromatographic plates 1.13726, it was impossible to determine the LOD for propyphenazone. The reason was that, under these chromatographic conditions, the analyzed compound migrated with the front of the mobile phase. It was also impossible to determine the LOD for all compounds analyzed using mobile phase D (methanol–water, 25:25, v/v) and 1.15498 chromatographic plates because all compounds remained at the start. Based on Table 2 and Table 3, plots were prepared to show the results of the LOD for individual tested compounds: for caffeine (Figure 1), propyphenazone (Figure 2), and paracetamol (Figure 3) for TLC and HPTLC plates, respectively. When analyzing the LOD values for the conducted analyses, the limit value of the LOD was assumed to be 0.05 μg/spot, and the possibility of detecting caffeine, propyphenazone, and paracetamol was determined based on this value.
For caffeine, in the case of TLC plates, the condition when LOD is less than 0.05 is met by four chromatographic conditions: chromatographic plates 1.05747 and mobile phases A, B, and D, giving the following LOD values, respectively: 0.023, 0.048, and 0.040 μg/spot, and chromatographic plates 1.05559, and mobile phase F with a LOD value of 0.019 μg/spot. For HPTLC plates, only two chromatographic conditions met this condition, only for one stationary phase—1.05548 plates. The LOD are then 0.023 (mobile phase A) and 0.010 μg/spot (mobile phase B), respectively.
In the case of propyphenazone, when using HPTLC plates, more (than in the case of TLC plates) chromatographic conditions give a LOD value of less than 0.05 μg/spot. These are 1.05548 plates and mobile phases B (LOD = 0.046 μg/spot) and C (LOD = 0.039 μg/spot), 1.13728 plates and mobile phases A (LOD = 0.048 μg/spot) and C (LOD = 0.026 μg/spot), 1.13726 plates and mobile phases D (LOD = 0.046 μg/spot) and F (LOD = 0.041 μg/spot), and 1.15498 plates and mobile phases E (LOD = 0.035 μg/spot) and F (LOD = 0.030 μg/spot). However, in the case of HPTLC plates, there are also chromatographic conditions that give the definitely unfavorable LOD values, being much higher than the others—0.175 and 0.247 μg/spot for plates 1.13728 and 1.13726 and the mobile phase B, respectively. For propyphenazone analyzed using the TLC method, the best LOD values were obtained for 1.0554 plates and mobile phase C—the LOD was 0.029 μg/spot for 1.05747 plates—and then the LOD was 0.045, 0.030, and 0.041 μg/spot for mobile phases C, E, and F, respectively. For the mobile phase 1.05559 and mobile phase F, LOD = 0.024 μg/spot.
As in the case of propyphenazone, analysis on HPTLC plates gives more LOD values of paracetamol, which meets the condition that the LOD is less than 0.05 μg/spot. These are 1.05548 plates, mobile phases B and C, LOD 0.030 and 0.037 μg/spot, respectively; plates 1.13728, mobile phases A, B, and C, LOD 0.016, 0.025, and 0.035 μg/spot, respectively; and plates 1.13726 and mobile phase A, LOD = 0.021 μg/spot. For TLC plates, there are only three results: plates 1.05554, mobile phase C, for which the detection limit is 0.016 μg/spot, and plates 1.05747 and mobile phases A and C, for which the LODs are 0.032 and 0.025 μg/spot, respectively. There are also significantly more cases of high LOD values for TLC plates.
The lowest LOD values for individual compounds obtained for caffeine, propyphenazone, and paracetamol are 0.01, 0.024, and 0.016 µg/spot, respectively. For caffeine and propyphenazone, the analysis was performed on TLC plates—1.05548 (caffeine) and 1.05559 (propyphenazone). A value of LOD was 0.016 µg/spot, and was obtained for plates TLC (1.13728) and HPTLC (1.05554) for the paracetamol analysis. The list of the lowest and highest LOD values for tested compounds is shown in Table 4.
This comparison (Table 4) shows that during the RP analysis, lower LOD values for all tested compounds can be obtained using TLC than by HPTLC. However, using analyses in the NP system, similar (of the same order) LOD values are obtained for caffeine, propyphenazone, and paracetamol when using both TLC and HPTLC plates. Therefore, for economical reasons, TLC plates should be recommended for the considered compounds analysis because they are several times cheaper than HPTLC plates. Moreover, a cluster analysis was carried out based on the LOD values obtained. It is presented in Figure 4. Due to missing data, the LOD values for mobile phase A and 1.13726 plates (propyphenazone, in this case, migrates with the front of the mobile phase), and the LOD values for mobile phase D and 1.15498 plates (all analyzed compounds remain at the start during chromatographic analysis) were omitted.
The analysis (Figure 4) indicates several clearly marked five-element clusters and one three-element cluster. These clusters include specific chromatography conditions for compounds investigated. Subsequent clusters indicate similarity in LOD values for specific stationary and mobile phases. The similarities are as follows:
-
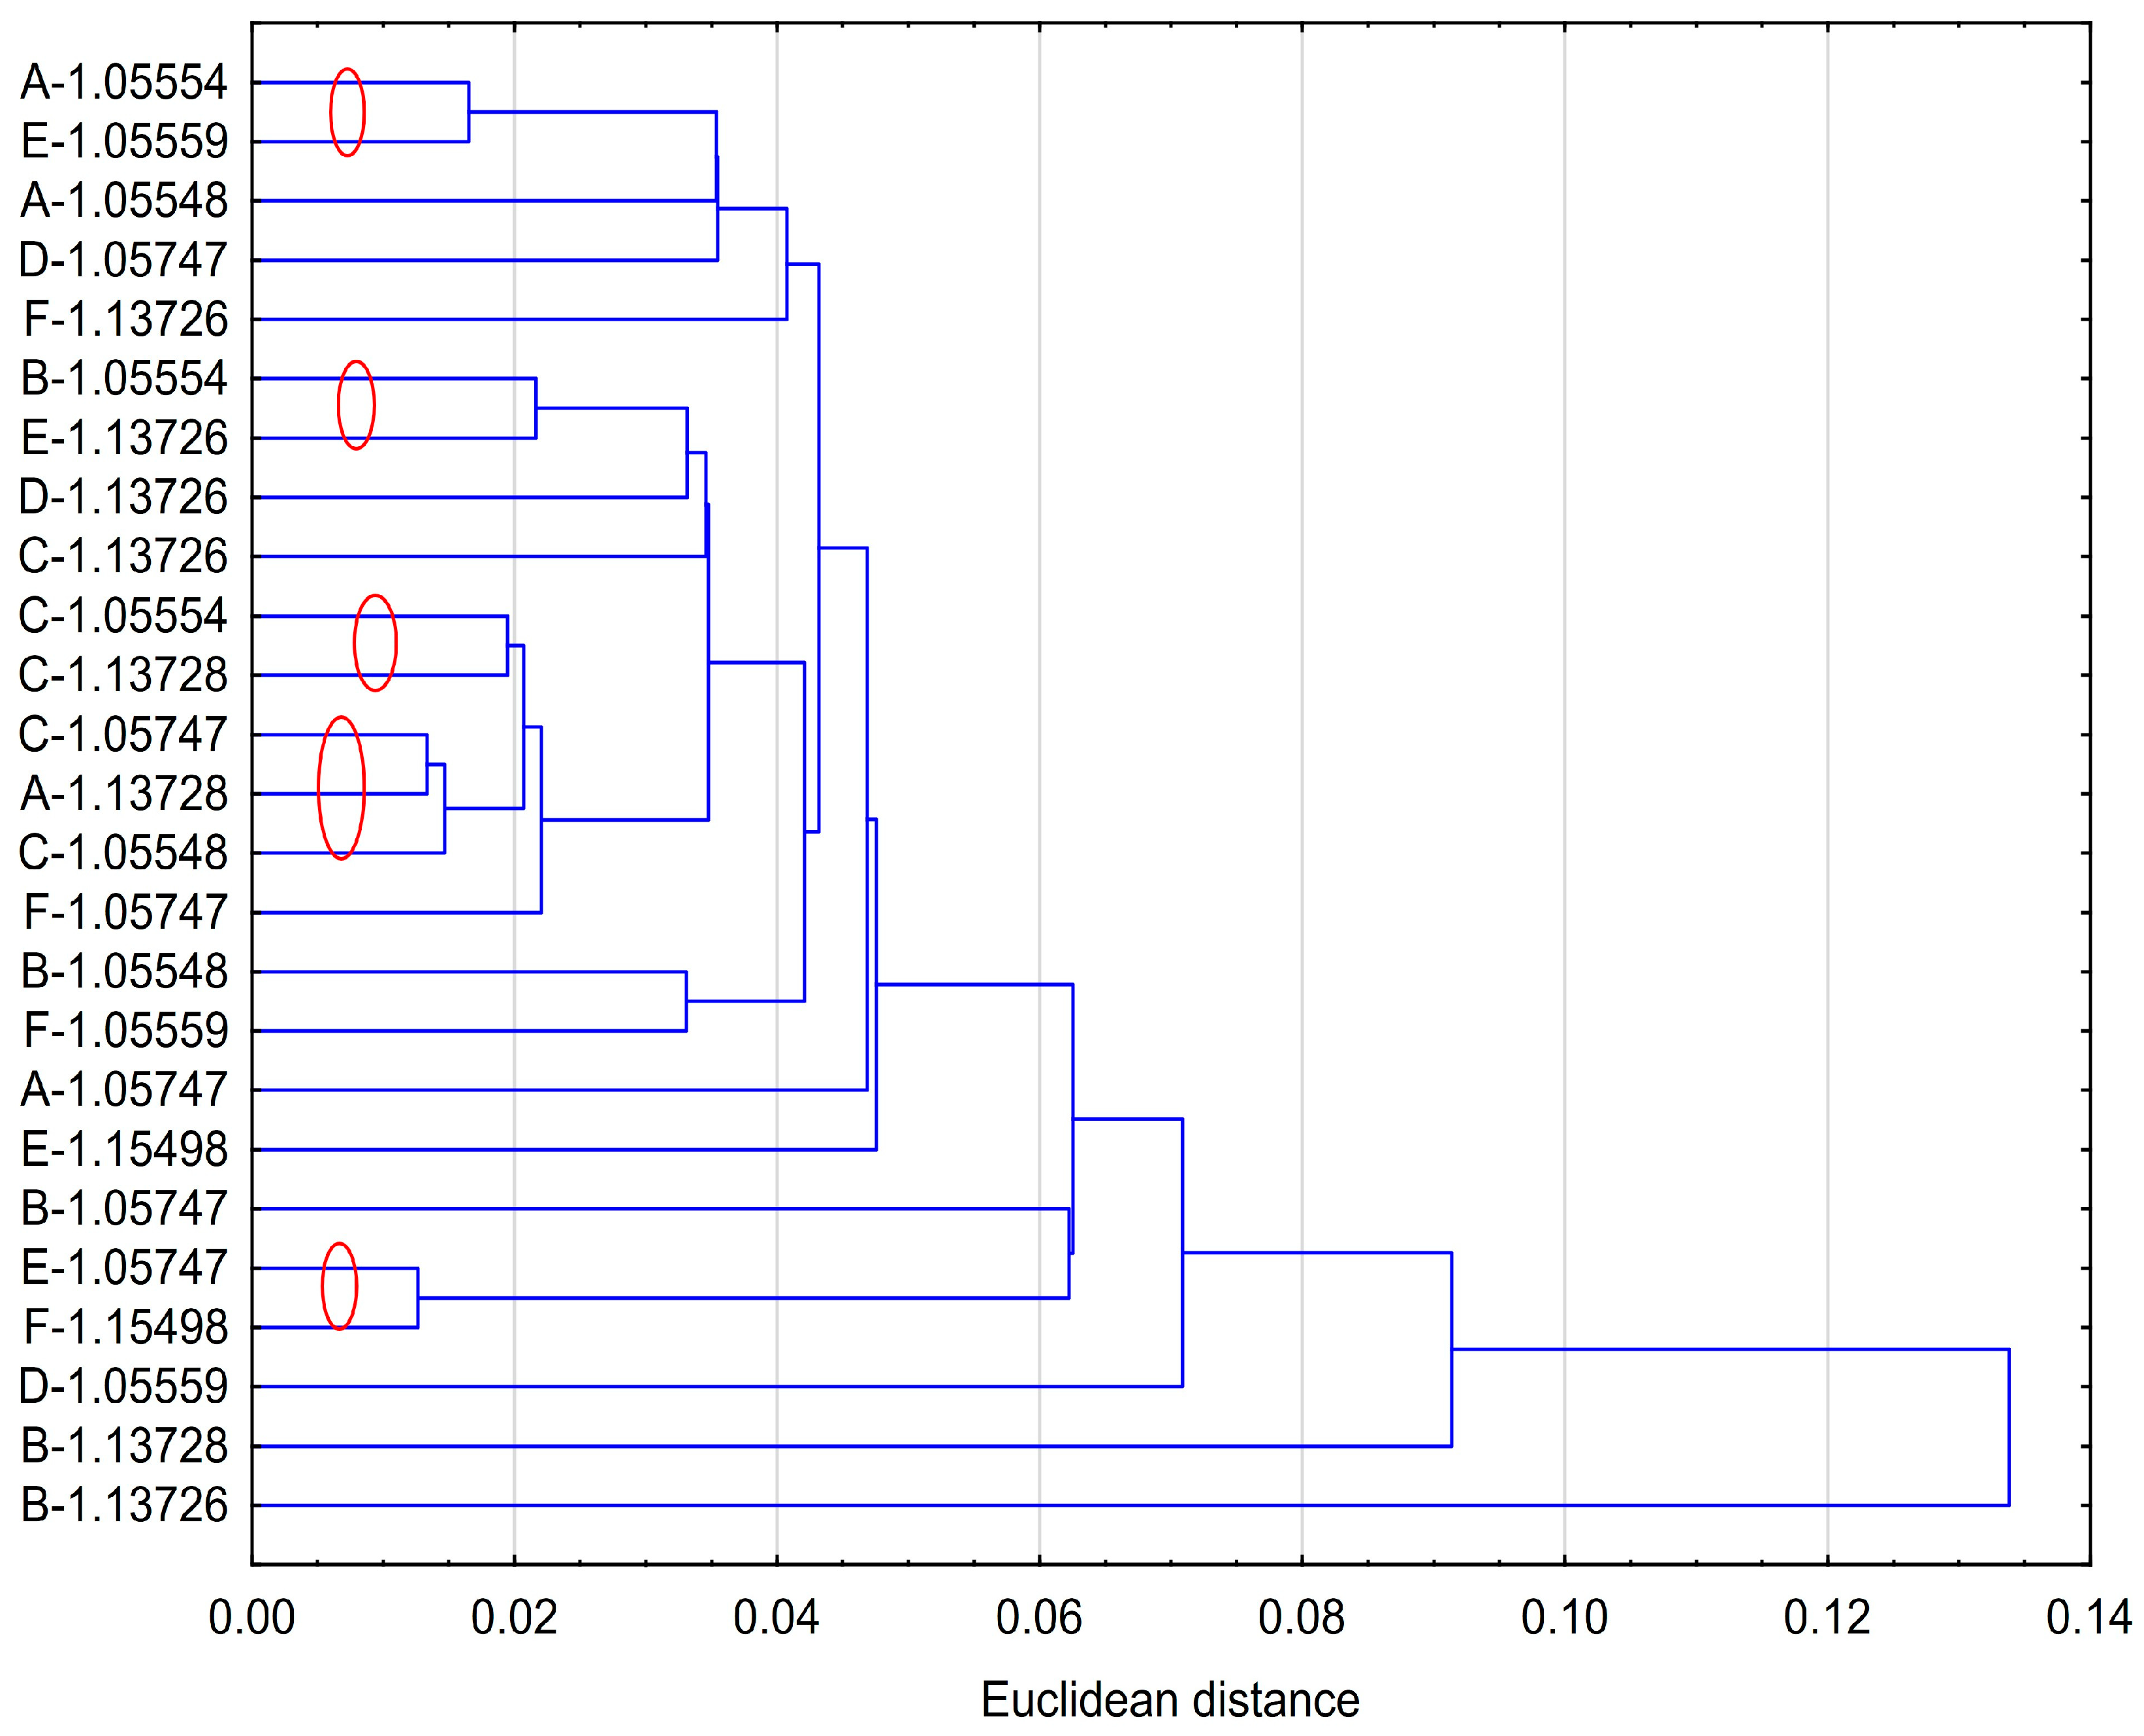
Mobile phase A and 1.05554 plates (TLC), and mobile phase E and 1.05559 plates (TLC).
-
Mobile phase B and 1.05554 plates (TLC), and mobile phase E and 1.13726 plates (HPTLC).
-
Mobile phase C and 1.05554 plates (TLC), and mobile phase C and 1.13728 plates (HPTLC).
-
Mobile phase C and 1.05747 plates (TLC), mobile phase A and 1.13728 plates (HPTLC), and mobile phase C and 1.05548 plates (HPTLC).
-
Mobile phase B and 1.05548 plates (HPTLC), and mobile phase F and 1.05559 plates (TLC)
-
Mobile phase E and 1.05747 plates (TLC), and mobile phase F and 1.15498 plates (HPTLC).
The above cluster analysis for all compounds shows that many chromatographic conditions give similar detection limits for the compounds tested. It is confirmed by the summary in Table 4. This is also confirmed by similarity analyses performed for each mobile phase separately. They are presented in Figure 5.
Only in the case of the mobile phase D (methanol-water, 25:25, v/v), similar results are shown by analyses using the same type of plates, i.e., TLC (1.05559 and 1.05747). In the case of the remaining mobile phases, i.e., A, B, C, E, and F, the highest LOD similarity was obtained for TLC and HPTLC plates, which is also confirmation that cheaper TLC plates can be used and give values similar to those obtained on HPTLC plates.
There are many multi-component preparations containing all the analyzed compounds in the pharmaceutical market. The chromatographic conditions obtained during our work, which give the best results of LOD values, could allow us to determine all components during one analysis. For this purpose, only those values of the LOD considered that their values were less than 0.05 μg/spot, i.e., those that were earlier discussed in terms of the use of chromatographic plates for TLC and HPTLC. A Table giving an overview of the chromatographic conditions and the compounds determined has been prepared (Table 5). It was found that there is only one possibility for the analysis of all three compounds with such a limitation of the LOD value, i.e., using HPTLC plates 1.05548 and mobile phase B (n-hexane—acetone—ammonia, 25:25:0.5, v/v/v). The LOD values for caffeine, propyphenazone, and paracetamol are 0.010, 0.046, and 0.030 μg/spot, respectively, whilst the RF values obtained under these chromatography conditions are 0.38, 0.75, and 0.57, respectively. Differences in these values will allow for a good separation of compounds (Figure 6).
However, also good results that are comparable in quality to the above can be obtained on TLC plates:
(a)
Precoated with silica gel 60 F254 (#1.05554) using mobile phase C (chloroform—toluene—ethyl acetate—methanol—80% acetic acid, 18:18:7.5:6:0.3, v/v). The detection limit values for caffeine, propyphenazone and paracetamol are 0.054, 0.029, and 0.016 μg/spot, respectively. The RF values obtained under these chromatography conditions are 0.47, 0.60, and 0.38 for caffeine, propyphenazone, and paracetamol, respectively (Figure 7).
(b)
Precoated with silica gel 60 F254, modified with C18 groups (#1.05559) using a mobile phase F (methanol–water, 40:10, v/v). The detection limit values for caffeine, propyphenazone, and paracetamol are 0.019, 0.024, and 0.053 μg/spot, respectively. The RF values obtained under these chromatography conditions are 0.51, 0.47, and 0.74 for caffeine, propyphenazone, and paracetamol, respectively.
The overview presented in Table 5 shows that TLC plates may be useful, particularly for the analysis of caffeine for which LOD is less than 0.05 in as many as four chromatographic conditions (plates 1.05747 and mobile phases A, B, and D, and also plates 1.05559 and mobile phase F). Only one chromatographic condition, using HPTLC plates, gave a LOD for caffeine of less than 0.05 (plates 1.05548 and mobile phase B, i.e., n-hexane—acetone—ammonia, 25:25:0.5, v/v/v). The data in Table 5 also indicate the conditions under which the low LOD values can be obtained when testing compounds investigated in single-component and two-component caffeine–paracetamol, caffeine–propyphenazone, and, propyphenazone–paracetamol samples.

4. Conclusions

Caffeine, propyphenazone, and paracetamol were analyzed using thin-layer chromatography combined with densitometry. Analysis was performed in the NP and RP conditions using TLC and HPTLC plates. It showed that analyses performed using TLC chromatographic plates may be as sensitive as those performed on HPTLC plates. It turned out that by using both TLC and HPTLC, it is possible to find chromatographic conditions that allow for the detection of all considered compounds in amounts from several to several dozen µg/spot. In the RP analysis, the smaller LOD values are obtained for all results using TLC rather than HPTLC plates. In the case of analysis in the NP, LOD values are similar (of the same order) for both TLC and HPTLC plates. For example, during the NP-HPTLC analysis using plates 1.05548 and mobile phase B (n-hexane—acetone—ammonia, 25:25:0.5, v/v/v), LOD values for caffeine, propyphenazone, and paracetamol are 0.010; 0.046, and 0.030 μg/spot, respectively. During NP-TLC analysis using 1.05554 plates and the mobile phase C (chloroform—toluene—ethyl acetate—methanol—80% acetic acid, 18:18:7.5:6:0.3, v/v), the values of LOD are 0.054, 0.029, and 0.016 μg/spot, respectively. During RP-TLC analysis using TLC plates 1.05559 and mobile phase F (methanol-water, 40:10, v/v), the LOD values are 0.019, 0.024, and 0.053 μg/spot, respectively. Due to the economical purposes for caffeine, propyphenazone, and paracetamol analyses, the TLC plates can be recommended because they are several times cheaper than HPTLC plates.

Author Contributions

Conceptualization, K.B.-M. and A.P.-P.; methodology, A.P.-P.; software, K.B.-M.; investigation, K.B.-M. and A.P.-P.; writing—original draft preparation, K.B.-M. and A.P.-P.; writing—review and editing, K.B.-M. and A.P.-P. All authors have read and agreed to the published version of the manuscript.

Funding

This research was funded by the Medical University of Silesia under grant number PCN-1-040/K/2/F and BNW-1-005/K/3/F.

Data Availability Statement

Data are contained within the article.

Conflicts of Interest

The authors declare no conflicts of interest.

References

  1. ICH. ICH Harmonised Tripartite Guideline: Validation of Analytical Procedures: Text and Methodology, Q2(R1). 2005. Available online: https://www.ich.org/page/quality-guidelines (accessed on 10 January 2024).
  2. Boque, R.; Heyden, Y.V. The Limit of Detection. LCGC Eur. 2009, 22, 82–85. [Google Scholar]
  3. Shrivastava, A.; Gupta, V.B. Methods for the determination of limit of detection and limit of quantitation of the analytical methods. Chron. Young Sci. 2011, 2, 21–25. [Google Scholar] [CrossRef]
  4. Drug Bank Online. Available online: https://go.drugbank.com/drugs (accessed on 8 April 2024).
  5. El Sherbiny, D.; Wahba, M.E.K. Validation of a Micellar Liquid Chromatographic Method for Determination of Caffeine and Non-Steroidal Anti-Inflammatories. J. Chromatogr. Sci. 2014, 52, 806–813. [Google Scholar] [CrossRef] [PubMed]
  6. Zambakjian, C.; Sakur, A.A. A new gas chromatographic method development and validation for the simultaneous determination of ibuprofen and caffeine in bulk and pharmaceutical dosage form. Future J. Pharm. Sci. 2020, 6, 110. [Google Scholar] [CrossRef]
  7. Soponar, F.; Staniloae, D.; Moise, G.; Szaniszlo, B.; David, V. Simultaneous determination of paracetamol, propyphenazone and caffeine from pharmaceutical preparations in the presence of related substances using a validated HPLC-DAD method. Rev. Roum. Chim. 2013, 58, 433–440. [Google Scholar]
  8. Šatínský, D.; Brabcová, I.; Maroušková, A.; Chocholouš, P.; Solich, P. Green chromatography separation of analytes of greatly differing properties using a polyethylene glycol stationary phase and a low-toxic water-based mobile phase. Anal. Bioanal. Chem. 2013, 405, 6105–6115. [Google Scholar] [CrossRef]
  9. Mladenov, K.; Sunarić, S. Caffeine in hair care and anticellulite cosmetics: Sample preparation. Solid-phase extraction and HPLC determination. J. Cosmet. Sci. 2020, 71, 251–262. [Google Scholar] [PubMed]
  10. Sonone, R.; Tandel, L.; Jain, V. Novel rapid isocratic RP-HPLC method for simultaneous estimation of phenylephrine hydrochloride, paracetamol, caffeine, diphenhydramine dydrochloride. Curr. Pharm. Anal. 2021, 17, 792–800. [Google Scholar] [CrossRef]
  11. Ismail, A.; Gamal, M.; Nasr, M. Optimization of analytical method for simultaneous determination of acetaminophen, caffeine, and aspirin in tablet dosage form. Pharm. Chem. J. 2023, 56, 1682–1688. [Google Scholar] [CrossRef]
  12. Oliphanta, E.; Purohitb, T.J.; Alsweiler, J.M.; McKinlayc, C.J.D.; Hanning, S.M. Validation and application of a simple and rapid stability-indicating liquid chromatographic assay for the quantification of caffeine from human saliva. J. Liq. Chromatogr. Relat. Technol. 2022, 45, 10–17. [Google Scholar] [CrossRef]
  13. Dongala, T.; Katari, N.K.; Palakurthi, A.K.; Jonnalagadda, S.B. Development and validation of a generic RP-HPLC PDA method for the simultaneous separation and quantification of active ingredients in cold and cough medicines. Biomed. Chromatogr. 2019, 33, e4641. [Google Scholar] [CrossRef] [PubMed]
  14. El-Ragehy, N.A.; Ramadan, N.K.; Ragab, M.T.; El-Zeany, B.A. RP-HPLC Method for the simultaneous determination of a quaternary mixture of propyphenazone, flavoxate HCl and two of their official impurities with dissolution profiling of their tablets. J. AOAC Int. 2020, 103, 958–965. [Google Scholar] [CrossRef] [PubMed]
  15. Golubitskiia, G.B.; Ivanov, V.M. Quantitative analysis of some pharmaceuticals by the HPLC method. Mosc. Univ. Chem. Bull. 2009, 64, 210–213. [Google Scholar] [CrossRef]
  16. Delvadiya, K.; Kabra, P.; Kimbahune, R.; Patel, N.; Nargund, L.V.G. High-performance liquid chromatographic determination of paracetamol, propyphenazone, and caffeine in pharmaceutical formulations. Indian J. Pharm. Educ. Res. 2013, 47, 65–72. [Google Scholar] [CrossRef]
  17. Ren, H.; Chen, Y.; Wang, H.; Liu, M.; Ji, L. Simultaneous determination of caffeine. Taurine and five water-soluble vitamins in tobacco products by HPLC–MS/MS. Chromatographia 2019, 82, 1665–1675. [Google Scholar] [CrossRef]
  18. Wang, A.; Sun, J.; Feng, H.; Gao, S.; He, Z. Simultaneous determination of paracetamol and caffeine in human plasma by LC–ESI–M. Chromatographia 2008, 67, 281–285. [Google Scholar] [CrossRef]
  19. Choi, E.J.; Bae, S.H.; Park, J.B.; Kwon, M.J.; Jang, S.M.; Zheng, Y.F.; Lee, Y.S.; Lee, S.J.; Bae, S.K. Simultaneous quantification of caffeine and its three primary metabolites in rat plasma by liquid chromatography–tandem mass spectrometry. Food Chem. 2013, 141, 2735–2742. [Google Scholar] [CrossRef] [PubMed]
  20. Onn Kit Loh, G.; Yii Ling Wong, E.; Goh, C.Z.; Tze Fung Tan, Y.; Lee, Y.L.; Pang, L.H.; Shahridzo, S.H.; Damenthi, N.; Hermansyah, A.; Long, C.M.; et al. Simultaneous determination of tramadol and paracetamol in human plasma using LC-MS/MS and application in bioequivalence study of fixed-dose combination. Ann. Med. 2023, 55, 2270502. [Google Scholar] [CrossRef] [PubMed]
  21. Boltia, A.; Soudi, A.T.; Elzanfaly, L.S.; Zaazaa, H.E. Development and validation of chromatographic methods for simultaneous determination of paracetamol, orphenadrine citrate and caffeine in presence of p-aminophenol; quantification of p-aminophenol nephrotoxic impurity using LC–MS/MS. J. Chromatogr. Sci. 2020, 58, 223–233. [Google Scholar] [CrossRef]
  22. Fekry, R.A.; Kelani, K.M.; Fayez, Y.M.; Tantawy, M.A. Comparative validated chromatographic methods for the simultaneous determination of caffeine, codeine, paracetamol along with the related compound “p-aminophenol” in tablets. J. Planar Chromatogr.-Mod. TLC 2022, 35, 51–59. [Google Scholar] [CrossRef]
  23. Ibrahim, H.; Hamdy, A.M.; Merey, H.A.; Saad, A.S. Simultaneous determination of paracetamol, propyphenazone and caffeine in presence of paracetamol impurities using dual-mode gradient HPLC and TLC densitometry methods. J. Chromatogr. Sci. 2021, 59, 140–147. [Google Scholar] [CrossRef] [PubMed]
  24. Alam, P.; Shakeel, F.; Ali, A.; Alqarni, M.H.; Foudah, A.I.; Aljarba, T.M.; Alkholifi, F.K.; Alshehri, S.; Ghoneim, M.M.; Ali, A. Simultaneous determination of caffeine and paracetamol in commercial formulations using greener normal-phase and reversed-phase HPTLC methods: A contrast of validation parameters. Molecules 2022, 27, 405. [Google Scholar] [CrossRef] [PubMed]
  25. Ferchiou, R.; Soussi, M.A.; Ghedira, D.; Ferchiou, D.; Douki, W.; Najjar, M.F. Development and validation of a simple thin-layer chromatography–smartphone method for plasma paracetamol quantification. J. Planar Chromatogr.-Mod. TLC 2023, 36, 251–256. [Google Scholar] [CrossRef]
  26. Foudah, A.I.; Shakeel, F.; Alqarni, M.H.; Aljarba, T.M.; Alshehri, S.; Alam, P. Simultaneous detection of chlorzoxazone and paracetamol using a greener reverse-phase HPTLC-UV method. Separations 2022, 9, 300. [Google Scholar] [CrossRef]
  27. Wahyuningsih, E.; Isnaeni. Identification of paracetamol and caffeine in jamu powders simultaneously using TLC-densitometry. Berk. Ilm. Kim. Farm. 2023, 10, 18–22. [Google Scholar] [CrossRef]
  28. Gupta, M.K.; Ghuge, A.; Parab, M.; Al-Refaei, Y.; Khandare, A.; Dand, N.; Waghmare, N. A comparative review on High-Performance Liquid Chromatography (HPLC), Ultra Performance Liquid Chromatography (UPLC) & High-Performance Thin Layer Chromatography (HPTLC) with current updates. Curr. Issues Pharm. Med. Sci. 2022, 35, 224–228. [Google Scholar] [CrossRef]
  29. Farid, N.F.; Naguib, I.A.; Abdelhamid, N.S.; Anwar, B.H.; Magdy, M.A. Validated ecofriendly chromatographic method for quantitative determination of anti-migraine quaternary mixture. J. Sep. Sci. 2020, 43, 2330–2337. [Google Scholar] [CrossRef] [PubMed]
  30. Ragab, M.T.; Ramadan, N.K.; El-Ragehy, N.A.; El-Zeany, B.A. Thin layer chromatography–spectrodensitometric determination of a three-component mixture of propyphenazone, caffeine, ergotamine tartrate, and two of their impurities with application to tablets, spiked human plasma, and green profile assessment. J. Planar Chromatogr.-Mod. TLC 2023, 36, 295–305. [Google Scholar] [CrossRef]
  31. Silva, W.P.; Silva, L.A.J.; França, C.H.; Sousa, R.M.F.; Muñoz, R.A.A.; Richter, E.M. Square-wave voltammetric determination of propyphenazone, paracetamol, and caffeine: Comparative study between batch injection analysis and conventional electrochemical systems. Electroanalysis 2017, 29, 1860–1866. [Google Scholar] [CrossRef]
  32. Gergov, G.; Alin, A.; Katsarov, P.; Simeonov, V.; Yankov, D.; Al-Degs, Y. Net analyte signal-based methods for the simultaneous determination of paracetamol. propyphenazone and caffeine by UV spectrophotometry. Bulg. Chem. Commun. 2018, 50, 265–273. [Google Scholar]
  33. Ozgur, M.U.; Alpdogan, G.; Asci, B. A Rapid spectrophotometric method to resolve ternary mixtures of propyphenazone, caffeine, and acetaminophen in tablets. Monatshefte Chem. 2002, 133, 219–223. [Google Scholar] [CrossRef]
Figure 1. Comparison of the LOD of caffeine analyzed under different chromatographic conditions.
Processes 12 01153 g001
Figure 2. Comparison of the LOD of propyphenazone analyzed under different chromatographic conditions.
Processes 12 01153 g002
Figure 3. Comparison of the LOD of paracetamol analyzed under different chromatographic conditions.
Processes 12 01153 g003
Figure 4. Cluster analysis of LOD values for all tested compounds and all chromatographic conditions.
Processes 12 01153 g004
Figure 5. Similarity analyzes performed on the basis of data for each mobile phase separately.
Processes 12 01153 g005
Figure 6. Chromatogram (densitogram) of (A) caffeine (RF = 0.38), (B) propyphenazone (RF = 0.75), and (C) paracetamol (RF = 0.57) analyzed on a silica gel 60F254 HPTLC plate (#1.05548) using mobile phase B (n-hexane—acetone—ammonia, 25:25:0.5, v/v/v).
Processes 12 01153 g006
Figure 7. Chromatogram (densitogram) of (A) caffeine (RF = 0.47), (B) propyphenazone (RF = 0.60), and (C) paracetamol (RF = 0.38) analyzed on a silica gel 60F254 TLC plate (#1.05554) using mobile phase C (chloroform—toluene—ethyl acetate—methanol—80% acetic acid, 18:18:7.5:6:0.3, v/v).
Processes 12 01153 g007
Table 1. Symbols and compositions of the mobile phases used.
SymbolSystemCompositionVolumetric Ratio
ANPacetone—chloroform—ammonia10:40:0.5
Bn-hexane—acetone—ammonia25:25:0.5
Cchloroform—toluene—ethylene acetate—methanol—80% acetic acid18:18:7.5:6:0.3
DRPmethanol—water25:25
Emethanol—water30:20
Fmethanol—water40:10
Mobile phases A, B, and C were used during studies using NP-TLC and NP-HPTLC, while phases D, E, and F were used during studies using RP-TLC and RP-HPTLC analysis. All analyses were repeated five times.
Table 2. LOD values [µg/spot] of caffeine, propyphenazone, and paracetamol obtained by the use of NP-TLC and NP-HPTLC.
Mobile PhaseTechniqueChromatographic PlatesLOD of Caffeine [µg/spot]RFLOD of Propyphenazone [µg/spot]RFLOD of Paracetamol [µg/spot]RF
ANP-TLC1.055540.0590.120.0990.730.1060.13
1.057470.0230.760.0910.830.0320.66
NP-HPTLC1.055480.0230.160.0910.840.0770.16
1.137280.0800.340.0480.860.0160.17
1.137260.1440.52--0.0210.73
BNP-TLC1.055540.1330.150.0760.830.0540.25
1.057470.0480.770.0860.890.1950.86
NP-HPTLC1.055480.0100.380.0460.750.0300.57
1.137280.0900.390.1750.790.0250.40
1.137260.1930.890.2470.940.0900.77
CNP-TLC1.055540.0540.470.0290.600.0160.38
1.057470.0670.760.0450.860.0250.72
NP-HPTLC1.055480.0730.550.0390.720.0370.42
1.137280.0570.520.0260.700.0350.39
1.137260.0910.920.0840.980.0520.84
Table 3. LOD values [µg/spot] of caffeine, propyphenazone, and paracetamol obtained by the use of RP-TLC and RP-HPTLC.
Mobile PhaseTechniqueChromatographic PlatesLOD of Caffeine [µg/spot]RFLOD of Propyphenazone [µg/spot]RFLOD of Paracetamol [µg/spot]RF
DRP-TLC1.057470.0400.520.0860.190.1330.65
1.055590.1200.200.0850.060.1700.55
RP-HPTLC1.137260.1040.480.0460.150.0840.57
1.15498------
ERP-TLC1.057470.0740.600.0300.390.2030.85
1.055590.0720.320.0890.130.1040.65
RP-HPTLC1.137260.1170.620.0620.360.0580.70
1.154980.0510.210.0350.100.1350.48
FRP-TLC1.057470.0840.750.0410.610.0560.85
1.055590.0190.510.0240.470.0530.74
RP-HPTLC1.137260.0550.710.0410.700.0880.79
1.154980.0860.620.0300.600.1990.91
Table 4. The ranges of LOD for the tested compounds using all chromatographic conditions in µg/spot.
TechniqueCaffeinePropyphenazoneParacetamol
Range of LOD [µg/spot]
NP-TLC0.023 ÷ 0.1330.029 ÷ 0.0910.016 ÷ 0.195
NP-HPTLC0.010 ÷ 0.1930.026 ÷ 0.2470.016 ÷ 0.052
RP-TLC0.019 ÷ 0.1200.024 ÷ 0.0890.053 ÷ 0.203
RP-HPTLC0.051 ÷ 0.1170.030 ÷ 0.0620.084 ÷ 0.199
Table 5. The overview of compounds investigated and chromatographic conditions for which LOD is less than 0.05 μg/spot.
PlateSymbol of Mobile Phase
ABCDEF
1.05554 propyphenazone
paracetamol
1.05747caffeine
paracetamol
caffeinepropyphenazone
paracetamol
caffeinepropyphenazonepropyphenazone
1.05559 caffeine
propyphenazone
1.05548 caffeine
propyphenazone
paracetamol
propyphenazone
paracetamol
1.13728propyphenazone
paracetamol
paracetamolpropyphenazone
paracetamol
1.13726paracetamol propyphenazone propyphenazone
1.15498 propyphenazonepropyphenazone
Disclaimer/Publisher’s Note: The statements, opinions and data contained in all publications are solely those of the individual author(s) and contributor(s) and not of MDPI and/or the editor(s). MDPI and/or the editor(s) disclaim responsibility for any injury to people or property resulting from any ideas, methods, instructions or products referred to in the content.

