Article

Study on the Application of Finite Difference in Geological Mine Fault Groups: A Case Study

1
State Key Laboratory of Strata Intelligent Control and Green Mining Co-Founded by Shandong Province and the Ministry of Science and Technology, Shandong University of Science and Technology, Qingdao 266590, China
2
Institute of Mining Engineering, Shandong University of Science and Technology, Tai’an 271019, China
3
Yan Kuang Energy Group Co., Ltd., Zoucheng 273500, China
4
Shandong Energy Group, Jinan 250013, China
5
Shandong Jingtai Engineering Technology Co., Ltd., Zibo 255425, China
6
Linyi City Development Group Co., Ltd., Linyi 276037, China
*
Author to whom correspondence should be addressed.
Processes 2024, 12(6), 1162; https://doi.org/10.3390/pr12061162
Submission received: 23 April 2024 / Revised: 28 May 2024 / Accepted: 3 June 2024 / Published: 5 June 2024

Abstract

:
Fault structures can cause a bad mining environment and increase the stress of surrounding coal pillar faults. The study investigates the stress evolution characteristics within fault structure groups and their surrounding coal pillars and explores the extent to which these fault structure groups influence the stress distribution in coal pillars. Based on three-dimensional modeling technology, a transparent geological model of the geological environment of fault structure groups was constructed and finite difference software was used to generate a numerical simulation model. Two survey lines and four survey points were arranged to analyze the stress distribution of a coal pillar fault. The results show that the fault structure groups have obvious stress barrier effects. There is a 35 m stress reduction zone in the hanging wall of the fault and a 30 m stress increase zone in the footwall of the fault. Both FL-1 and FL-3 faults have a stress barrier effect in the hanging wall. The obvious stress increases in the footwall of the fault are 37.7 MPa and 33.5 MPa, respectively. The stress of the FL-2 fault as a whole appears to be a more obvious superposition at the end of mining, and the peak stress reaches 41.5 MPa.

1. Introduction

With the increasing demand and production capacity of coal, the mining environment [1,2,3,4,5] is becoming more and more complex. The stress redistribution and irregular deformation of coal and rock mass in the long-term geological evolution process of fault structures [6,7,8] will lead to the unstable accumulation of strain energy, which seriously affects the safe production of the coal mine working face. In most parts of China, the geological conditions of mines are complex and the geological structure is developed. In the underground geological structure, fault is the most common structure, which brings great potential safety hazards to coal mine production, safety production and mining technology.
The rise in stress of the coal pillar near the hanging wall and footwall of faults may induce the phenomenon of rock burst [9,10,11], which happens due to the geological structure caused by crustal movement and the phenomenon of violent release of energy caused by the stress change near the coal pillar fault [12,13] caused by mining activities. A lot of research has been carried out to analyze the influence of fault tectonic stress field on coal mining. The sudden instability and failure of surrounding rock mass seriously affect the safety of coal mine production. A fault structure is a common geological structure in coal mine production, which is very common in the world. It has been widely accepted [14] that the strain energy, stored in rock mass due to the imposed induced stresses, plays an important role in inducing strain burst.
In discontinuous deformation of rock mass in the form of faults, Skrzypkowski [15] studied the steel support in the fault structure based on the rock mass model with a fault. Based on analytical calculations, the use of the arch yielding support in the fault zone effectively reduces the total displacement variable. Mark [16] organized a list of coal burst accidents in the U.S. and emphasized that the majority of coal bursts occur in regions experiencing heightened stress linked to fault activity. Maleki and Lawson [17] found that the fault’s structure could cause the stress change of the surrounding pillar, resulting in high stress in the pillar. Li et al. [18] showed that stress mutation resulting from fault instability manifests as a violent energy release triggered by fault slippage. Afraei et al. [19] showed that the initial stress state of underground mining and the possibility and impact strength of rock burst are preliminarily predicted. Several scholars have provided explanations for the frequent association between stress mutation and fault structures. Frith et al. [20] conducted a review of stress mutation occurrences in Australia, highlighting that areas prone to bursts in underground coal mines are consistently linked to fault slip induced by significant horizontal stress. Shen et al. [21] showed that significant alterations in stress states and geotechnical conditions frequently occur in proximity to major fault structures. Deng et al. [22] investigated the initial stress state of the fault model, the residual horizontal displacement after fault slip and the threshold conditions of fault slip events.
In summary, our predecessors have carried out a lot of research on the stress distribution of single fault structures and surrounding rock mass, but research on the occurrence and surrounding stress of fault structure groups is lacking. Therefore, in order to further determine the actual geological occurrence of fault structure groups and their influence on the safety production of the working face, taking Xinglongzhuang coal mine as the engineering background, a real geological model of a three-dimensional coal seam and the occurrence information of fault groups are constructed by two-dimensional plane map. FLAC3D 7.0 finite difference software [23,24,25] is used to analyze the stress of coal pillar faults at the working face and around the fault and to explore the influence of surrounding fault groups and surrounding goaf on the safety production of the working face.

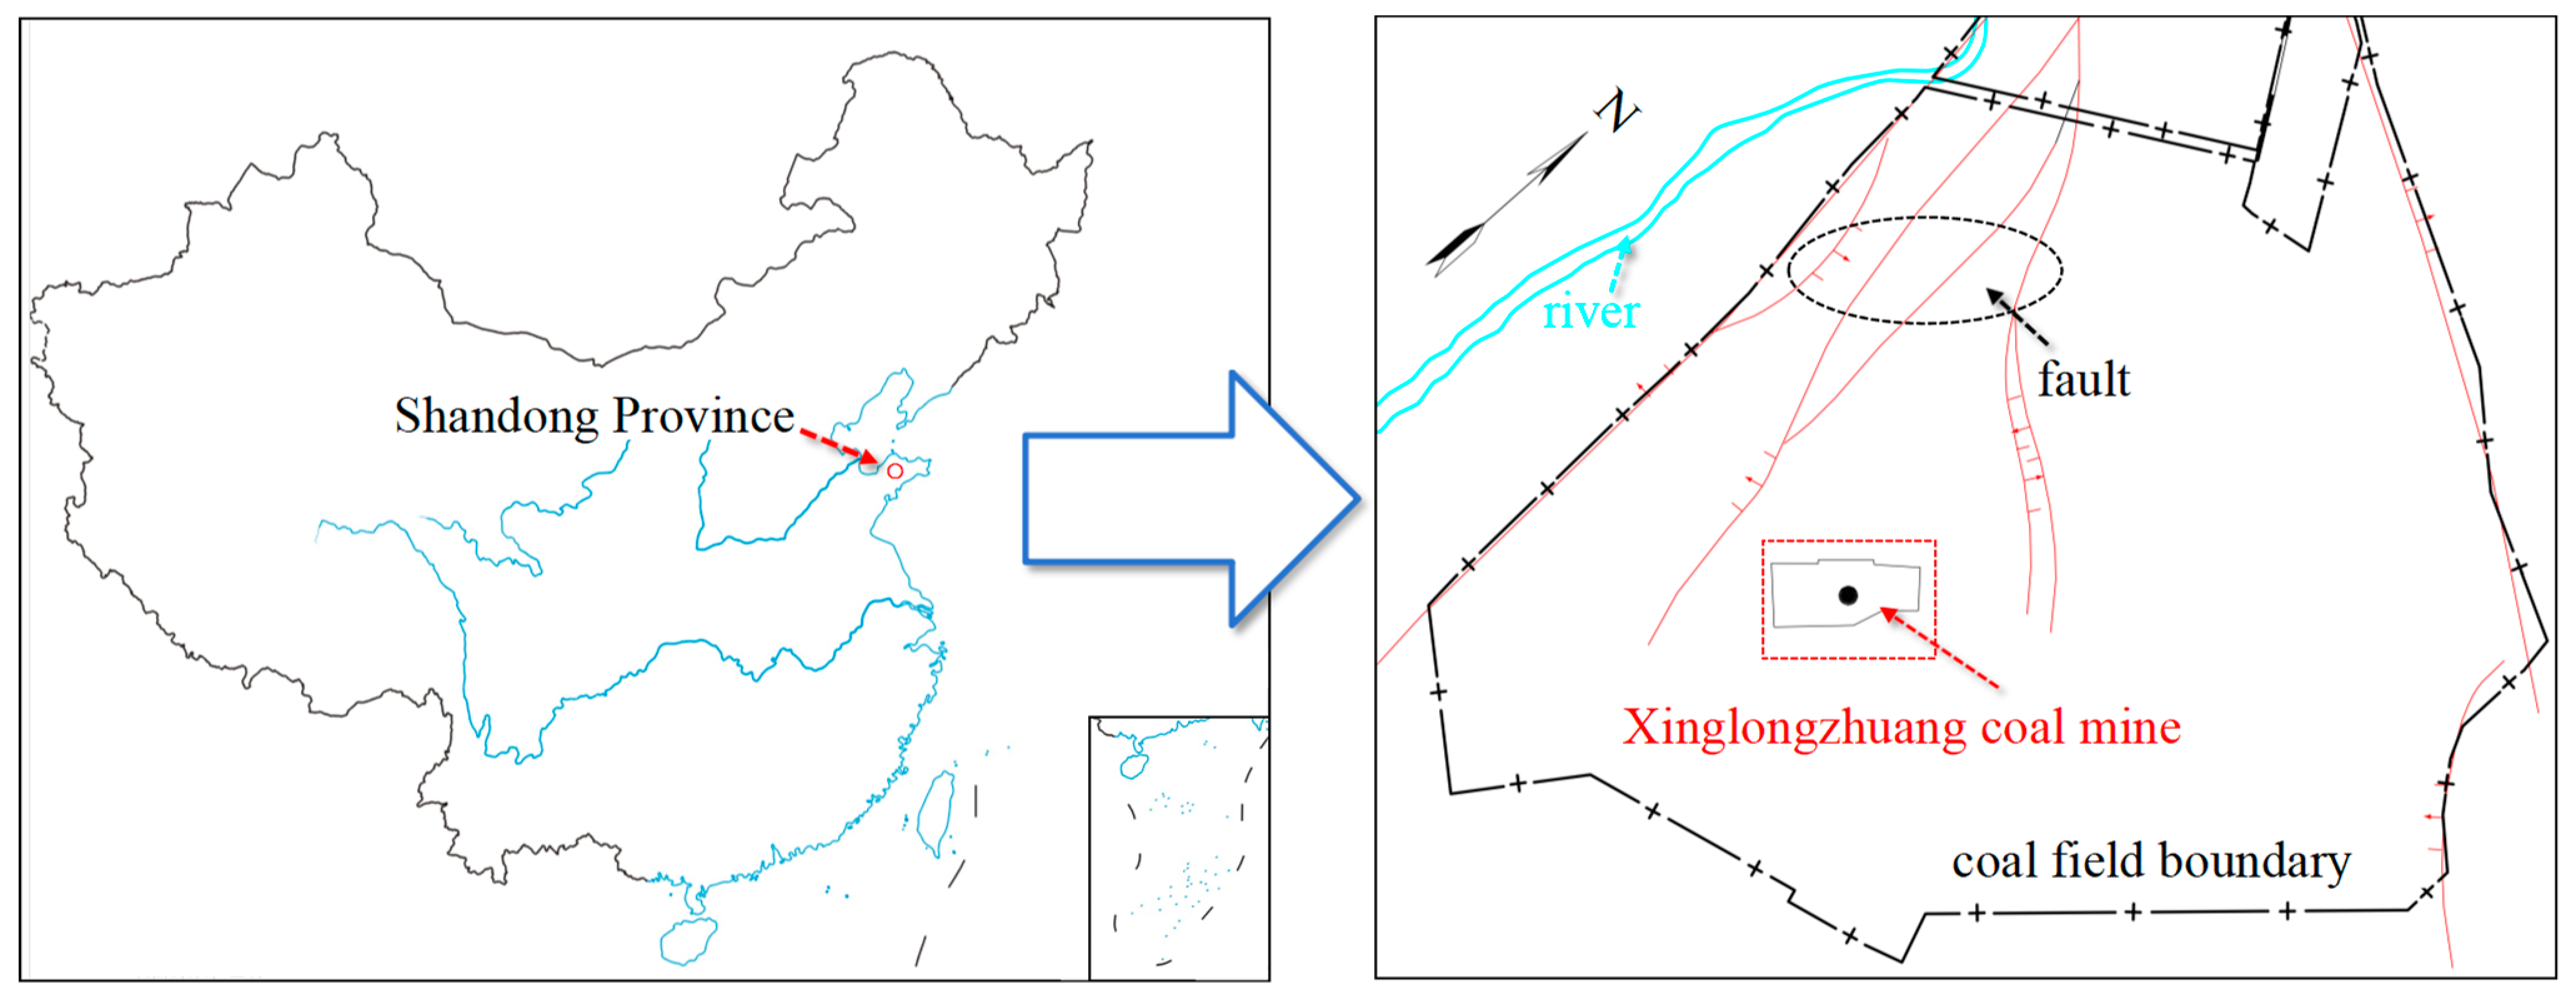
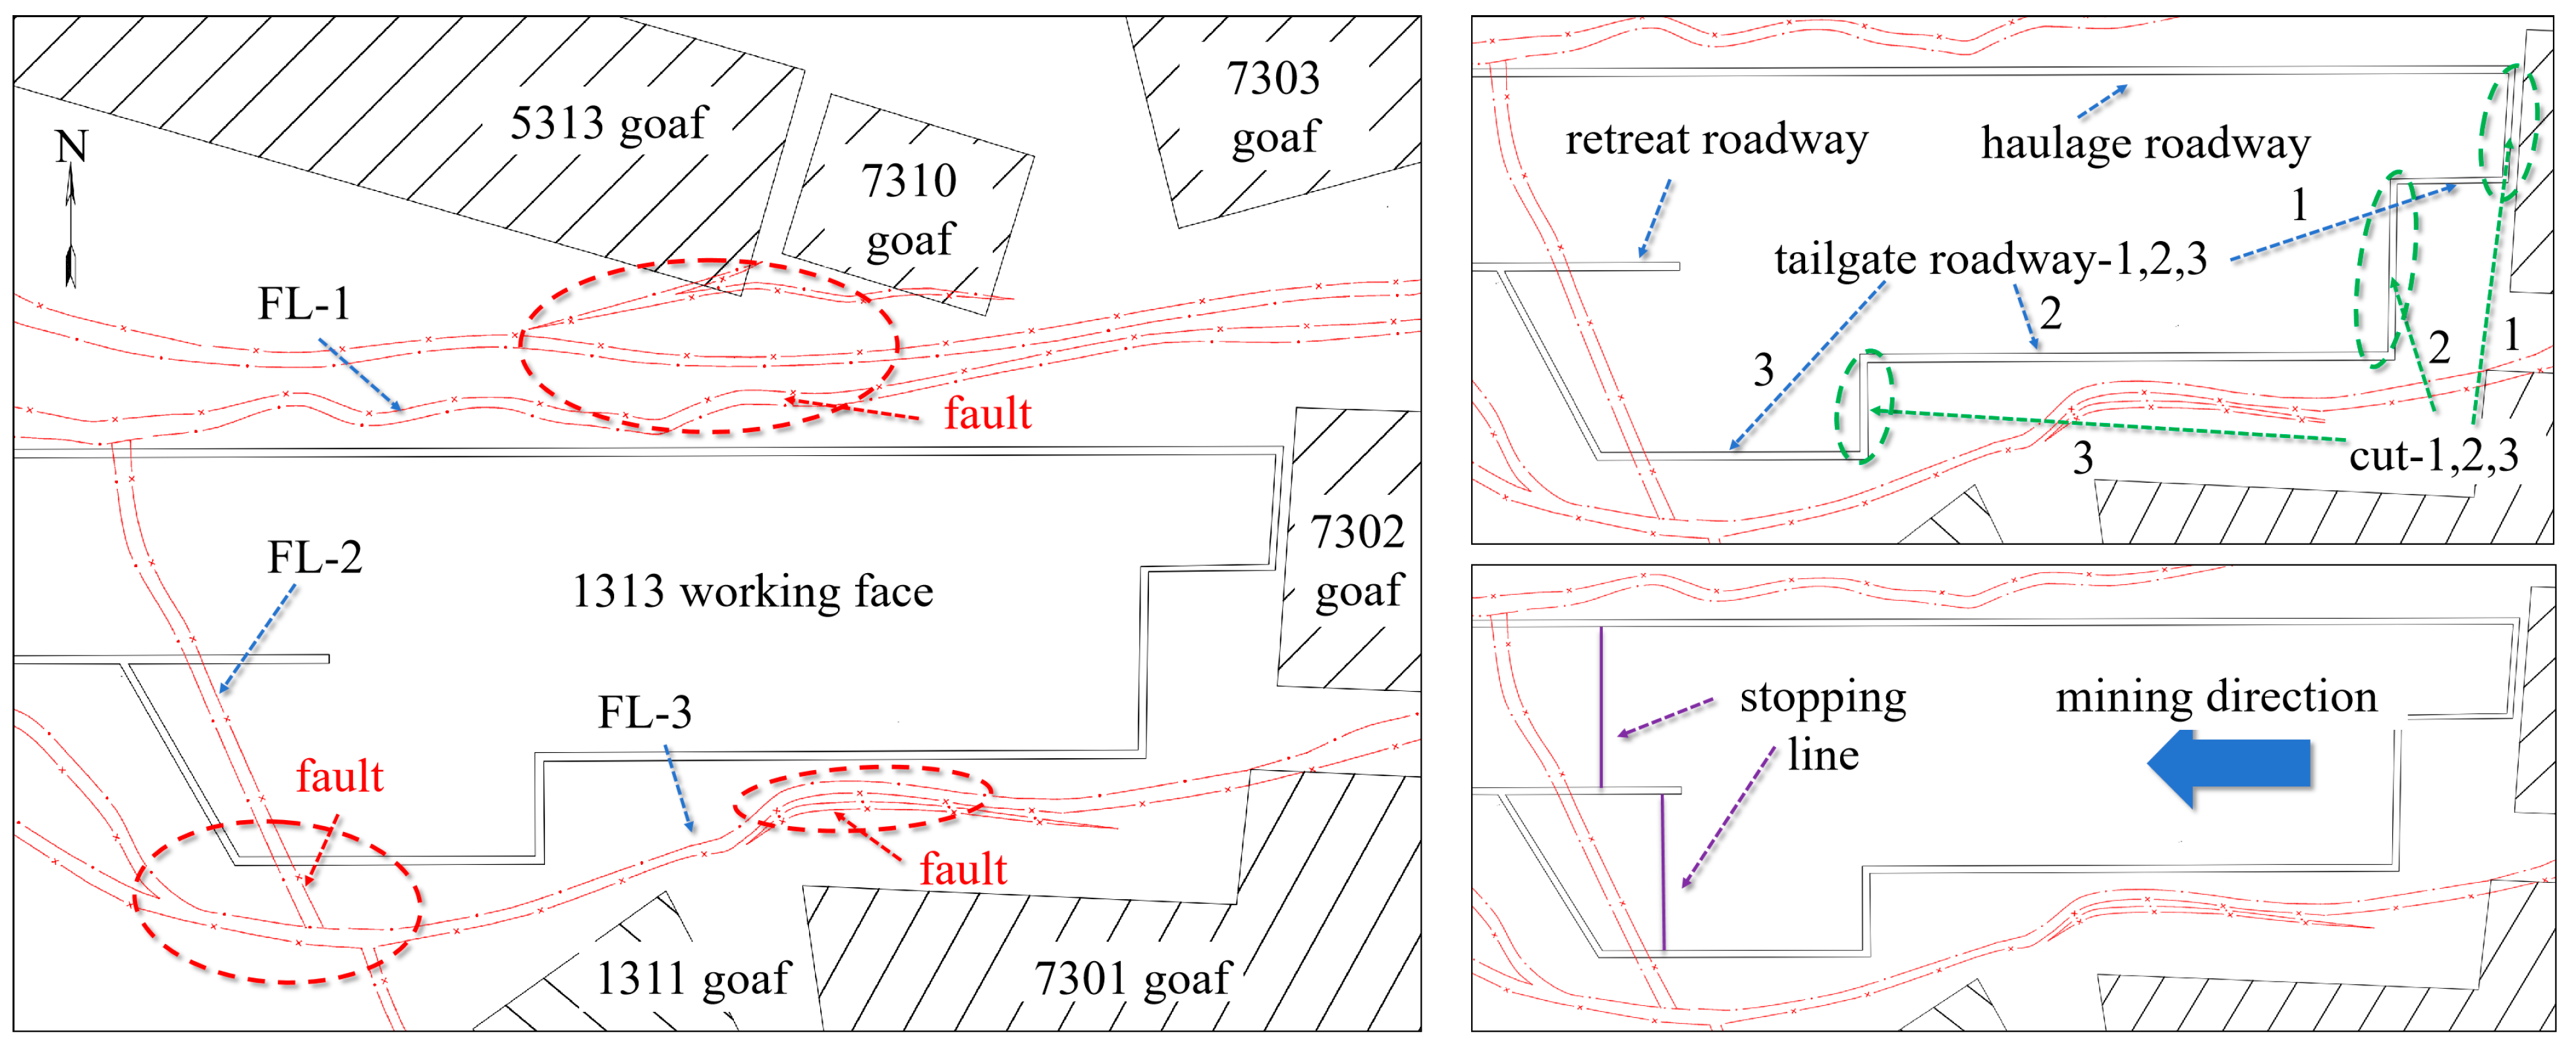
2. Engineering Background

Xinglongzhuang coal mine in Shandong Province, China, is located in the southeast of Yanzhou City, Shandong Province. The plane range of the mine field is irregular, as shown as Figure 1. The Xinglongzhuang coal mine belongs to the Quaternary alluvial plain. The terrain is flat, gradually decreasing from northeast to southwest, and the slope is extremely gentle. The strike length is about 13.1 km, the tilt width is about 6.8 km, the area is 56.2346 km2, and the ground elevation varies from +52 m to +44 m. Since 2020, the production capacity of the construction scale of Xinglongzhuang coal mine has been 600 Mt/a.
The underground position of the 1313 working face is located in the northeast of the first mining area. The ground elevation is +48.4~+49.4 m, with an average of +48.9 m. The south of the 1313 working face is 1311 goaf and 7301 goaf, the east is 7302 goaf, and the north is 5313 goaf, 7310 goaf and 7303 goaf. Therefore, the 1313 working face is surrounded by the goafs and belongs to the island working face, as shown in Figure 2. The 1313 working face is divided into a block, of which the excavation sequence is haulage roadway–cut 1–tailgate roadway-1–cut 2–tailgate roadway-2–cut 3–tailgate roadway-3.
The 1313 working face adopts the comprehensive mechanized coal mining method, one-time mining full-height coal mining technology, and the inclined longwall coal mining method. The cutting height of the coal mining machine can reach 5 m and the roof above the goaf is treated by the full caving method. The coal seam of the 1313 working face is 3 # coal at the bottom of Shanxi Formation of Lower Permian Yuemengou Series, which is mainly bright coal. The dip angle of the coal seam is 1–13° with an average of 7°, which belongs to the near horizontal coal seam. The coal seam structure is complex, and the maximum height of the coal seam is 9.50 m, with an average of 9.12 m of the longwall face, which belongs to the extra-thick coal seam.
The features of the roof and floor strata are shown in Table 1. The 1313 working face is surrounded by fault groups and goaf as a whole, of which the fault structure exposed by the 1313 working face is shown in Table 2.
Figure 2 shows that the haulage roadway and tailgate roadway are mining in the direction of the fault groups. The haulage roadway is excavated along FL-1, the tailgate roadway is basically excavated along FL-2, and the 1313 working face gradually approaches FL-3 during the mining process. From the analysis of the situation of the retreat roadway passing through the FL-2 fault, according to the FL-2 information of the exposed fault, there are few fillers in the FL-2 fault, so this study does not consider the addition of plastic materials in the fault. The 1313 working face is surrounded by fault groups composed of FL-1, FL-2 and FL-3, so it is very important to explore the geological information of the fault groups and construct a transparent geological model of the fault groups.

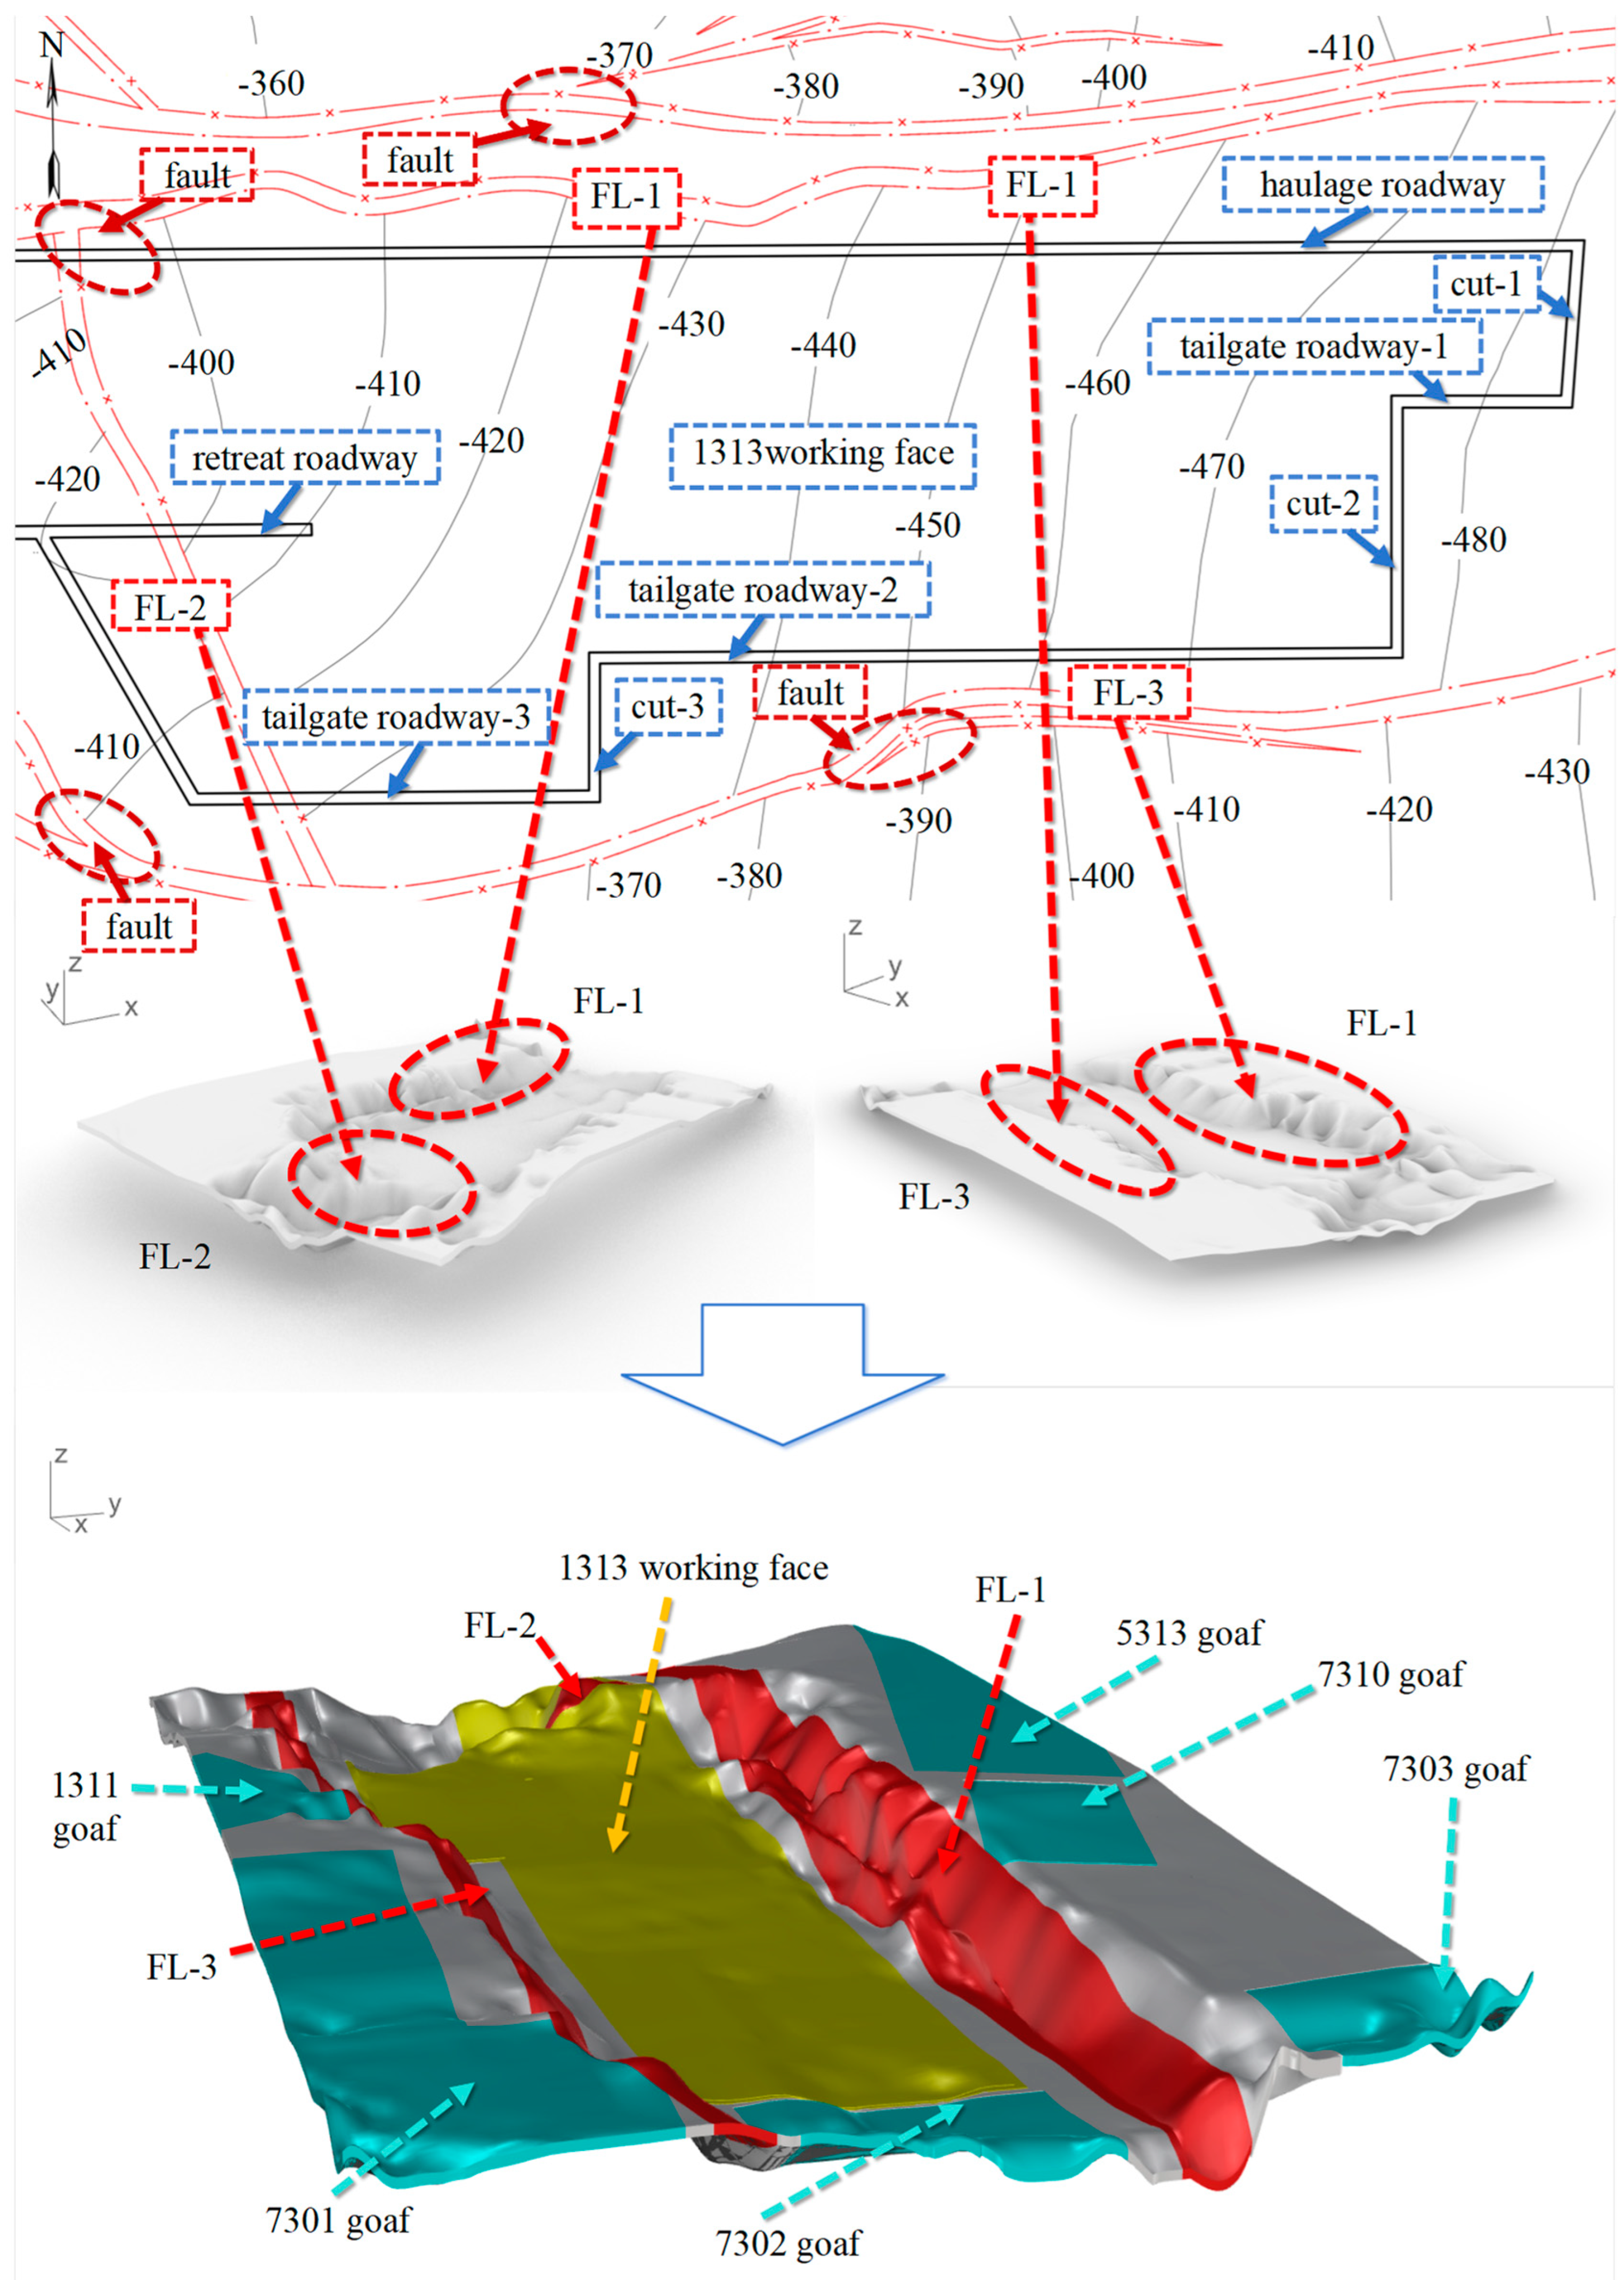
3. Research on 3D Modeling Technology

3.1. Transparent Geological Model

To explore the occurrence information of fault groups, a three-dimensional transparent geological model is constructed. In this study, the author carried out research on the 1313 working face based on the mark point control technology.
According to the coal seam floor contour of the 1313 working face in the Xinglongzhuang coal mine, a sand table model of the coal seam floor contour is constructed. Based on three-dimensional modeling technology, the transparent geological model of the 1313 working face is studied using the Rhino Modeling Software 7.0, as shown in Figure 3. The model is mainly preliminarily processed by the contour line of the coal seam floor, and a three-dimensional model of the coal seam topographic map is constructed on the contour line of the coal seam floor.
To more clearly distinguish the fault drop and the fault groups information, we densify the contour line of the coal seam floor around the working face, taking the 10 m drop as the division standard. The Rhino Modeling Software uses the spacing of 5 to automatically detect the drop, retaining the drop information around the fault.
In addition, the fault drop formed by the contour line can be generated from the two-dimensional plan to the intuitive three-dimensional map. Figure 3 shows that FL-1, FL-2 and FL-3 faults can be clearly expressed, and the structural data of the fault groups model contain an FL-1 drop of 30 m, FL-2 drop of 10 m and FL-3 drop of 36 m.

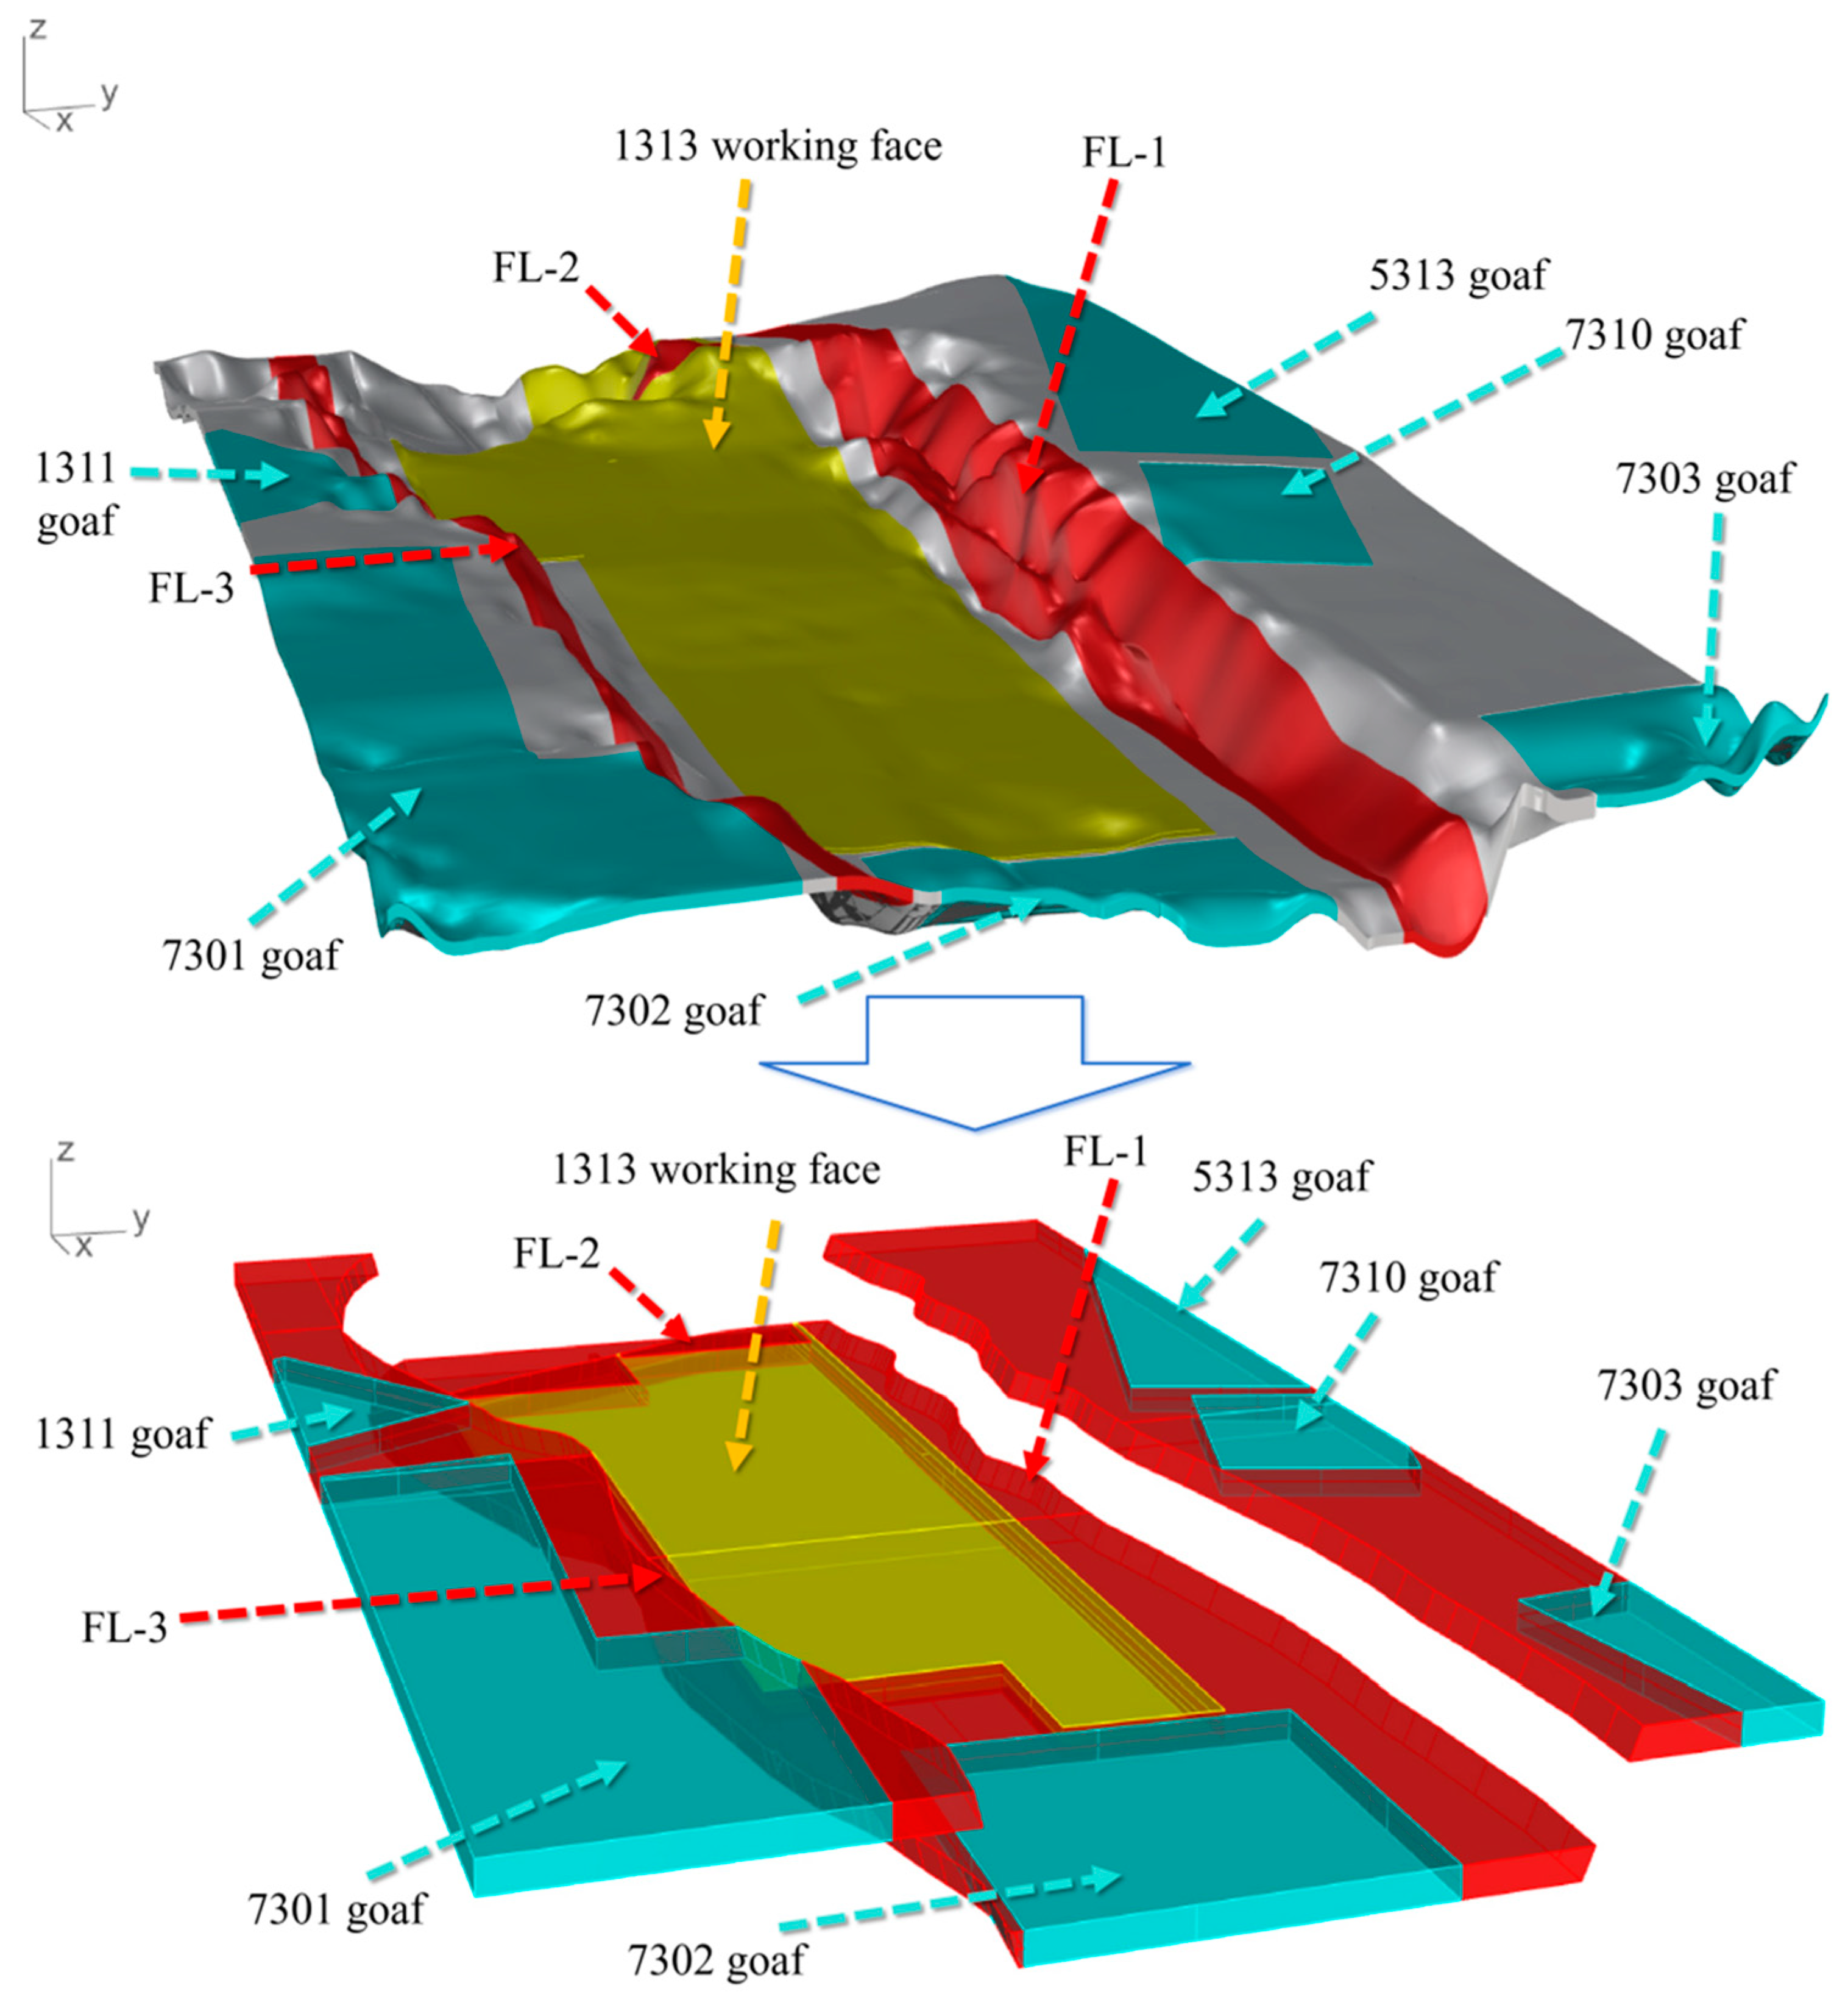
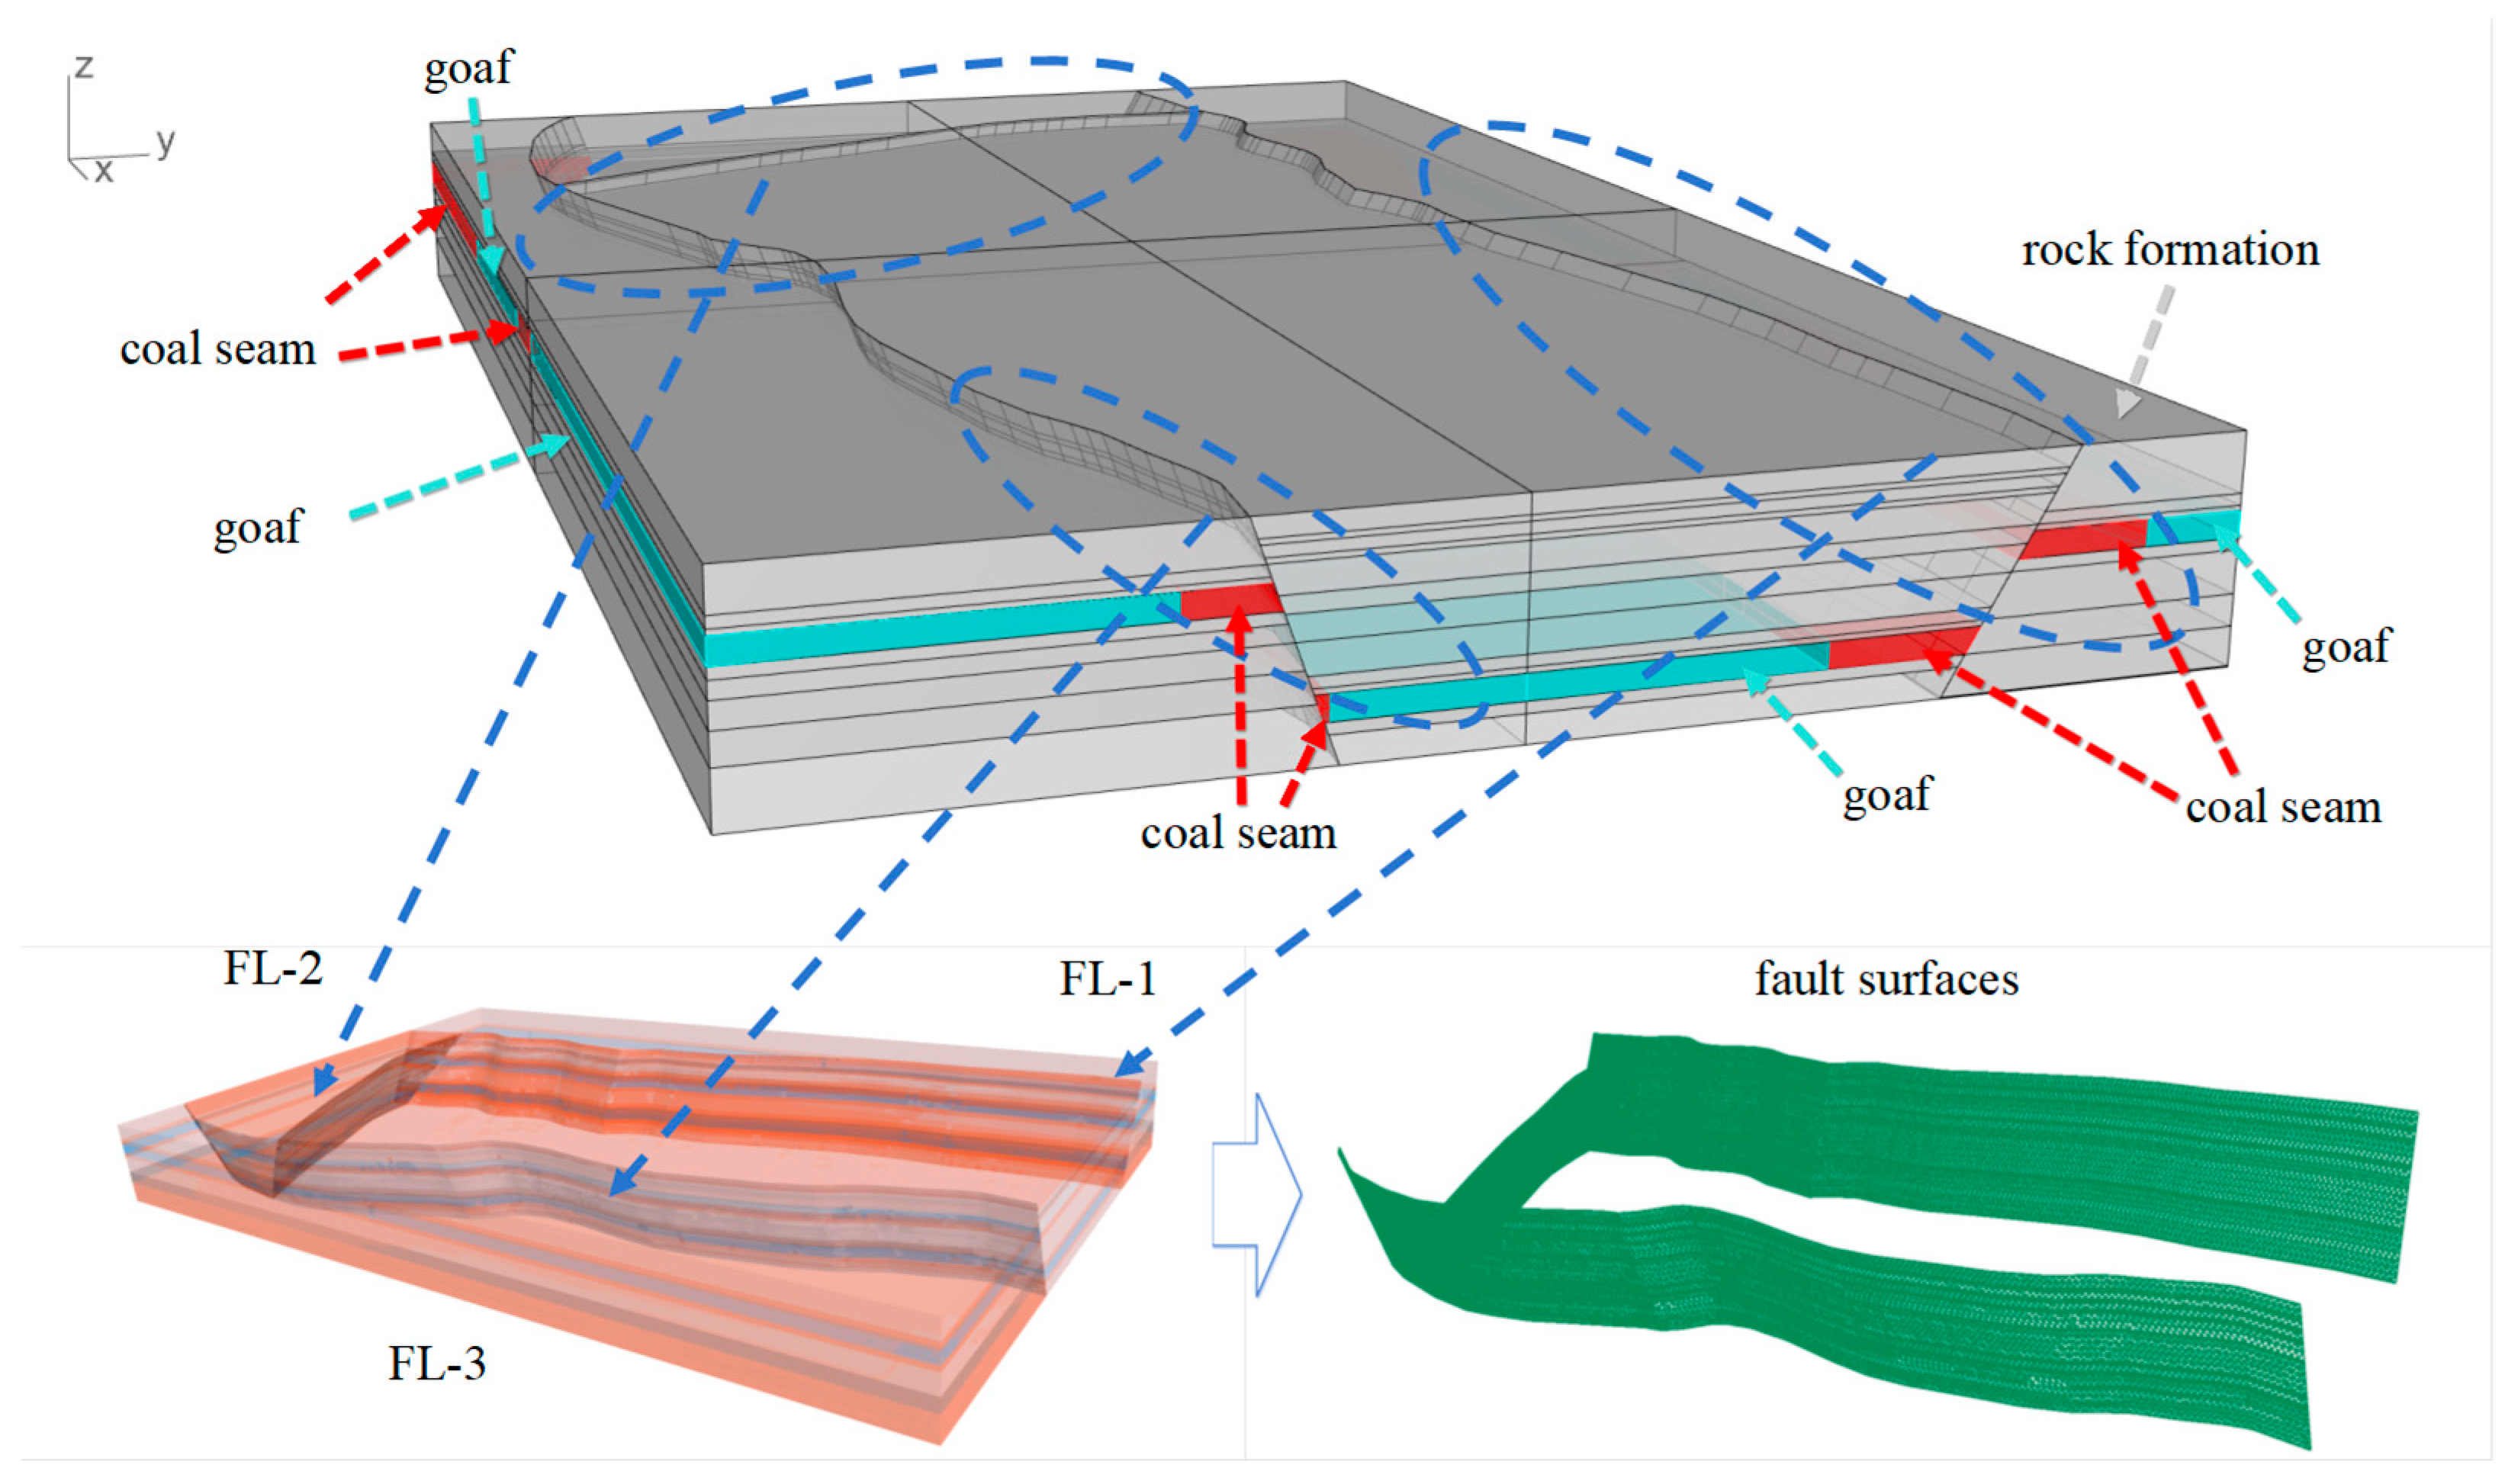
3.2. Three-Dimensional Model Construction

To further construct the numerical model, based on the actual transparent geological research, the actual geological model was optimized, as shown in Figure 4. The whole coal seam conforms to the engineering geology of the 1313 working face and the information of the surrounding goaf. The fault groups retain the fault drop and fault dip, especially for the fault strike and fault dip, to carry out a more realistic geological reduction, so as to restore the fault to form a stress field environment.
The overall modeling process is shown in Figure 5. The overall model is designed with a length × width × height of 820 m × 500 m × 80 m. The coal seam information constructs a 9 m coal seam according to the borehole histogram information, in which the roadway height is set to a square roadway of 4 m, and the coal seam of the 1313 working face is a long-wall top-coal caving.
The optimized real geological 3D model is constructed, which provides technical support for the subsequent stress environment analysis. In the internal space of the 3D modeling, curves and surfaces are used to represent contours and shapes based on Non-Uniform Rational B-Splines [26]. The conversion from NURBS mesh to finite difference mesh can be realized.

3.3. Numerical Model Construction

The three-dimensional fast Lagrangian method is a numerical analysis method based on the three-dimensional explicit finite difference method. It can simulate the three-dimensional mechanical properties of rock and soil. Taking the fault groups as an example, FLAC3D numerical simulation software is based on the three-dimensional fast Lagrangian program, which can better simulate the geological conditions of the coal mining face and geotechnical engineering mechanics problems.
According to the risk assessment report of rockburst at the 1313 working face of the Xinglongzhuang coal mine, the physical and mechanical properties of the rock and coal mass (including bulk modulus, shear modulus, cohesion, internal friction angel, tensilestrength, and density) are shown in Table 3.
In accordance with the geological and mining conditions of the Xinglongzhuang coal mine and three-dimensional model of the transparent coal seam, the numerical model is a coal and rock compound structure of eight layers, with a length × width × height of 820 m × 500 m × 80 m. The coal seam height of the model is set to 9 m. The model takes the coal seam as the dividing line, and the upper part from near to far is 2 m mudstone, 4 m siltstone, 20 m medium sandstone, 6 m siltstone, 10 m fine sandstone, 2 m siltstone, 4 m mudstone and 2 m siltstone. Below the coal seam from near to far is 4 m siltstone, 15 m medium sandstone, 11 m mudstone and 3 m siltstone, as shown in Figure 6. The model has a total of 751,820 zones and 587,796 gridpoints.
The model retains the basic characteristics of the fault occurrence, including the specific construction of fault strike, dip angle and drop, as shown in Figure 7. The faults are simulated by an interface unit, and the numerical simulation of the fault parameters is shown in Table 4.
The 1313 working face is situated in the third layer surrounded by FL-1, FL-2 and FL-3 and the mining direction is the same as the working face design. The Mohr–Coulomb constitutive model was chosen in the simulation. Combined with the condition of working face production, a uniform load of 11 MPa was applied on the top of the model to compensate, and excavation was carried out through the delete command. The boundary displacement of the model was limited by fixed constraints.

4. Results and Discussion

The 1313 working face is mainly surrounded by three normal faults. The fault surface is the interface. The two parts are the hanging wall of the fault and the footwall of the fault. The maximum principal stress σ1 in the normal fault is in the vertical direction. The intermediate principal stress σ2 and the minimum principal stress σ3 are in the horizontal direction. The shear stress is τ and the stress distribution is shown in Figure 8.
It can be seen from the above that the direction of the maximum principal stress when the normal fault is formed is vertical; that is, the size of the maximum principal stress is the gravity of the overlying strata [15]. Taking the fault plane as the interface, the two parts are the hanging wall of the fault and the footwall of the fault, respectively, and the distribution state of the principal stress on the fault plane is analyzed:
σ 1 = γ H
σ 2 = σ 3 = K γ H
In the formula, σ1 is the vertical in situ stress acting on the rock mass under the fault, kN/m2; γ is the average bulk density of overlying rock mass, kg/m2; H is the thickness of overlying strata, m; and K is the lateral pressure coefficient.
Decompose σ1 into
P x = γ H c o s α
P y = γ H s i n α
In the formula, Px is the vertical stress of the fault plane decomposed by the vertical stress, kN/m2; Py is the parallel stress of the fault plane decomposed by the vertical in situ stress, kN/m2; and α is the fault dip angle, °.
From the above formula, it can be seen that the existence of the fault has a direct impact on the rock layer of the footwall, resulting in a significant stress increase near the footwall of the fault. The theoretical mechanical model of the fault during working face mining is shown in Figure 9.
The mining activities of the coal mine have destroyed the original stress state in the coal body. The load of the overlying strata in the goaf will be transferred to the coal seam in front of the coal wall, which will increase the stress inside the coal wall. For the rock burst mine, there is a certain risk of impact. After the surrounding working face is mined to form a goaf, the weight of the upper strata in the goaf will transfer to the new supporting point around the mining area, thus forming a supporting pressure zone around the goaf [27,28]. When the 1313 working face is mined, it gradually gets closer to the FL-2 fault, the stress of the overlying strata is redistributed, and the supporting stress zone is formed in a certain depth of the coal wall. The advanced supporting pressure is formed in front of the working face, and the supporting stress moves forward with the advance of the working face, as shown in Figure 10.
As a result of the combined effects of supporting stress and mining activity, the coal rock within a specific depth of the coal wall experiences damage. Deeper within the coal wall, the supporting stress steadily escalates until reaching its zenith. In order to explore the stress evolution characteristics of the fault structure groups and the surrounding goaf on the 1313 working face area and the coal pillar faults around the fault, the initial stress environment, the spatial structure of the coal seam and the initial stress results of all coal seam areas are first analyzed, as shown in Figure 11.
The 1313 working face area is close to the hanging wall area of the fault, and the stress decreases along the fault strike and the influence range is roughly 35 m. The footwall of the fault puts relatively high stress on the working face, and the influence range is roughly 30 m. Figure 11 shows that the fault structure group as a whole has a barrier effect on the propagation of coal seam stress when it is not affected by the excavation and mining disturbance of the working face. Due to the influence of FL-1 and FL-3 fault structures in this area, the 1313 working face is located on the hanging wall of the FL-1 and FL-3 faults. Compared with the FL-2 structure, the 1313 working face is located on the footwall of the FL-2 fault. The stress reduction difference of the FL-1 fault is the most obvious, and the stress is 3.9 MPa lower than that of the same layer of coal seam. FL-1 and FL-3 fault structures reduce the stress in the 1313 working face area, while the FL-2 fault increases the stress in a certain range at the end of mining in this area, and the stress increase can reach 1.3 MPa.
To further discuss the influence of fault structure groups and surrounding goaf on the coal pillar around the 1313 working face, two survey lines and four survey points are arranged in the 1313 working face area to analyze the stress evolution process of the coal pillar, and the survey points of the survey lines are arranged as shown in Figure 12.
After the initial stress balance of the research model is reached, the vertical stress of the four survey points changes with the time step during the mining of the goaf. The results of the survey points are shown in Figure 13.
Figure 13 shows that the regional stress of the coal seam at the C4 survey point is stable as a whole, the stress of the coal seam in the middle of the deep working face is affected by the goaf, and the stress increases with time. The C2 survey point is less affected by the surrounding goaf and is basically not affected by the goaf. The stress here is 3.1 MPa higher than that of C4, which is mainly affected by the FL-2 fault structure, which is consistent with the results of the initial stress field of the above model. The stress of the C3 and C1 survey points increased relatively due to the influence of goaf. The stress of the C1 survey point increased by 1.2 MPa compared with the initial stress, and the stress of the C3 survey point increased by 0.4 MPa compared with the initial stress, but the stress of the C4 survey point relative to the deep coal seam of the working face was still low, which was mainly affected by the tectonic stress of the FL-3 and FL-1 strike faults. The C1 survey point was 5 m away from the FL-1 fault, and the stress here was reduced more than the C3 survey point 14 m away from the FL-3 fault structure, and the maximum stress difference reached 2 MPa.
On the whole, due to the stress barrier effect of the fault structure groups, the stress change of the 1313 working face is relatively small. Affected by the goaf, FL-1 and FL-3 appear to have a more obvious stress increase, and the stress is mainly concentrated in the coal pillar fault area near it. The coal pillar fault near FL-2 is far away from the goaf and is less affected by the goaf as a whole, and the coal pillar fault is mainly affected by the tectonic stress.
Before and after the model is excavated in the goaf, the stress cloud images of the two survey lines are sliced, as shown in Figure 14. After the initial stress balance of the model, the 1313 working face area of the coal seam is affected by FL-1 and FL-3 faults. The results show that there is a stress barrier effect on the fault, and the stress in the middle area of the working face increases obviously. After the excavation of the goaf, the stress near the goaf is relatively increased due to the influence of the advanced abutment stress of the goaf, and the stress is transferred to the deep coal seam. On the whole, the 1313 working face area is not greatly affected by the stress of the goaf and the fault structure groups. The fault groups have a stress barrier phenomenon, and the vertical stress is mainly concentrated in the coal pillar fault area near the footwall of the fault. Under the tectonic stress of the fault groups, the stress changes obviously.
A survey line runs through the once square area of the 1313 working face. It mainly analyzes the stress evolution characteristics of the FL-3 fault tectonic stress affected by the mining process of the 1313 working face and the stress influence range near the FL-3 fault, as shown in Figure 15.
The model FL-3 fault drop is 36 m, and the FL1 fault drop is 30 m. Under the influence of goaf, the peak stress of the FL-3 fault structure is 37.7 MPa, the peak stress of the FL-1 fault is 33.5 MPa, the peak stress of the FL-3 fault footwall is 6 m, and the stress barrier phenomenon appears in the hanging wall of the fault. Under the influence of 1313 working face mining, the coal pillar fault between FL-3 and the working face causes stress superposition. The stress peak appears at 11 m on the footwall of the FL-1 fault, and the stress barrier appears on the hanging wall of the fault. During the mining of the 1313 working face, the coal pillar fault with the FL-1 fault was about 33 m, and the fault tectonic stress and lateral abutment stress did not cause obvious stress superposition.
The B survey line is mainly used to analyze the end of the FL-2 fault mining. In order to more clearly observe the stress evolution characteristics of the FL-2 fault, the B survey line only selects the data in the 500 m range near the FL-2 fault, as shown in Figure 16.
With the continuous mining of the working face, the advanced abutment stress is continuously transferred with the mining. The influence of the advanced abutment stress of the working face is about 100 m. The peak value of the advance stress is 2.3 MPa to 3.0 MPa and 150 m away from the FL-2 fault, and the influence range of the FL-2 fault is about 20 m. When the mining is at 520 m, the stress of the coal pillar fault at 24 m in the footwall of the FL-2 fault fluctuates. Compared with the initial stress reduction part, when the mining is closer to the stop line, the fault tectonic stress and the advanced abutment stress are superimposed, resulting in an increase in the peak stress, up to 41.5 MPa.
The Xinglongzhuang coal mine is equipped with an SOS microseismic monitoring system. According to the microseismic data of 1313 working face during roadway excavation, the microseismic data of tailgate roadway 2 are collected and analyzed as shown in Figure 17.
During the excavation of the 1313 working face, microseismic events mainly occur behind the heading face and at the corner of the roadway, and most of them are energy events with energy less than 1 × 10³ J. During the excavation of the tailgate roadway-2, it is mainly affected by the adjacent FL-3 fault. The microseismic events are mainly concentrated in the hanging wall area of the FL-3 fault, but the microseismic events are not monitored in the footwall of the fault. Due to the influence of the FL-3 fault stress barrier, the microseismic events at the end of tailgate roadway-2 excavation are less than those at the initial stage. When the roadway is gradually away from the fault, the microseismic events gradually decrease. The influence range of the fault is roughly 35 m, which is consistent with the numerical simulation analysis of the fault influence range.
Because the 1313 working face has not yet been mined, the engineering analogy method is used to compare the field data of another mine working face. During the working face advancing towards the FL6 fault, due to the stress barrier of the FL6 fault, there is stress concentrated in the coal pillar fault area, and the closer the working face is to the FL6 fault in the final mining stage, the higher the risk of rock burst, which then easily causes the release of energy which has accumulated inside of the FL6 fault, resulting in a certain risk of rock burst, as shown in Figure 18.
It can be seen from the distribution of microseismic events in the working face that as the width of the coal pillar fault continues to decrease, the microseismic events show obvious aggregation. The mining process of the working face is affected by the FL6 fault, and the abutment stress of the coal pillar fault is concentrated, releasing more energy. It can be considered that the fault has an impact on the end of the mining face.
Therefore, using the method of engineering analogy, in order to reduce the influence of fault cohesion at the end of mining in the 1313 working face, large diameter pressure relief drilling measures [29] can be used in advance in the early stage of mining in the 1313 working face, and measures of induced blasting are adopted for the coal pillar fault area [30,31,32].

5. Conclusions

Fault structures are a common geological structure in the process of underground coal mining. In this study, a transparent geological model is constructed by using the contour line and borehole data of the coal seam floor and three-dimensional modeling technology. Although the analysis of geological data such as the contour line of the coal seam floor is limited, this method can still clearly display the geological information of fault occurrence. This model retains the obvious structural information of fault groups, simulates the geological background and surrounding conditions of real geological mining, and focuses on the analysis of the stress characteristics and evolution process around fault structure groups. The results show the following:
(1)
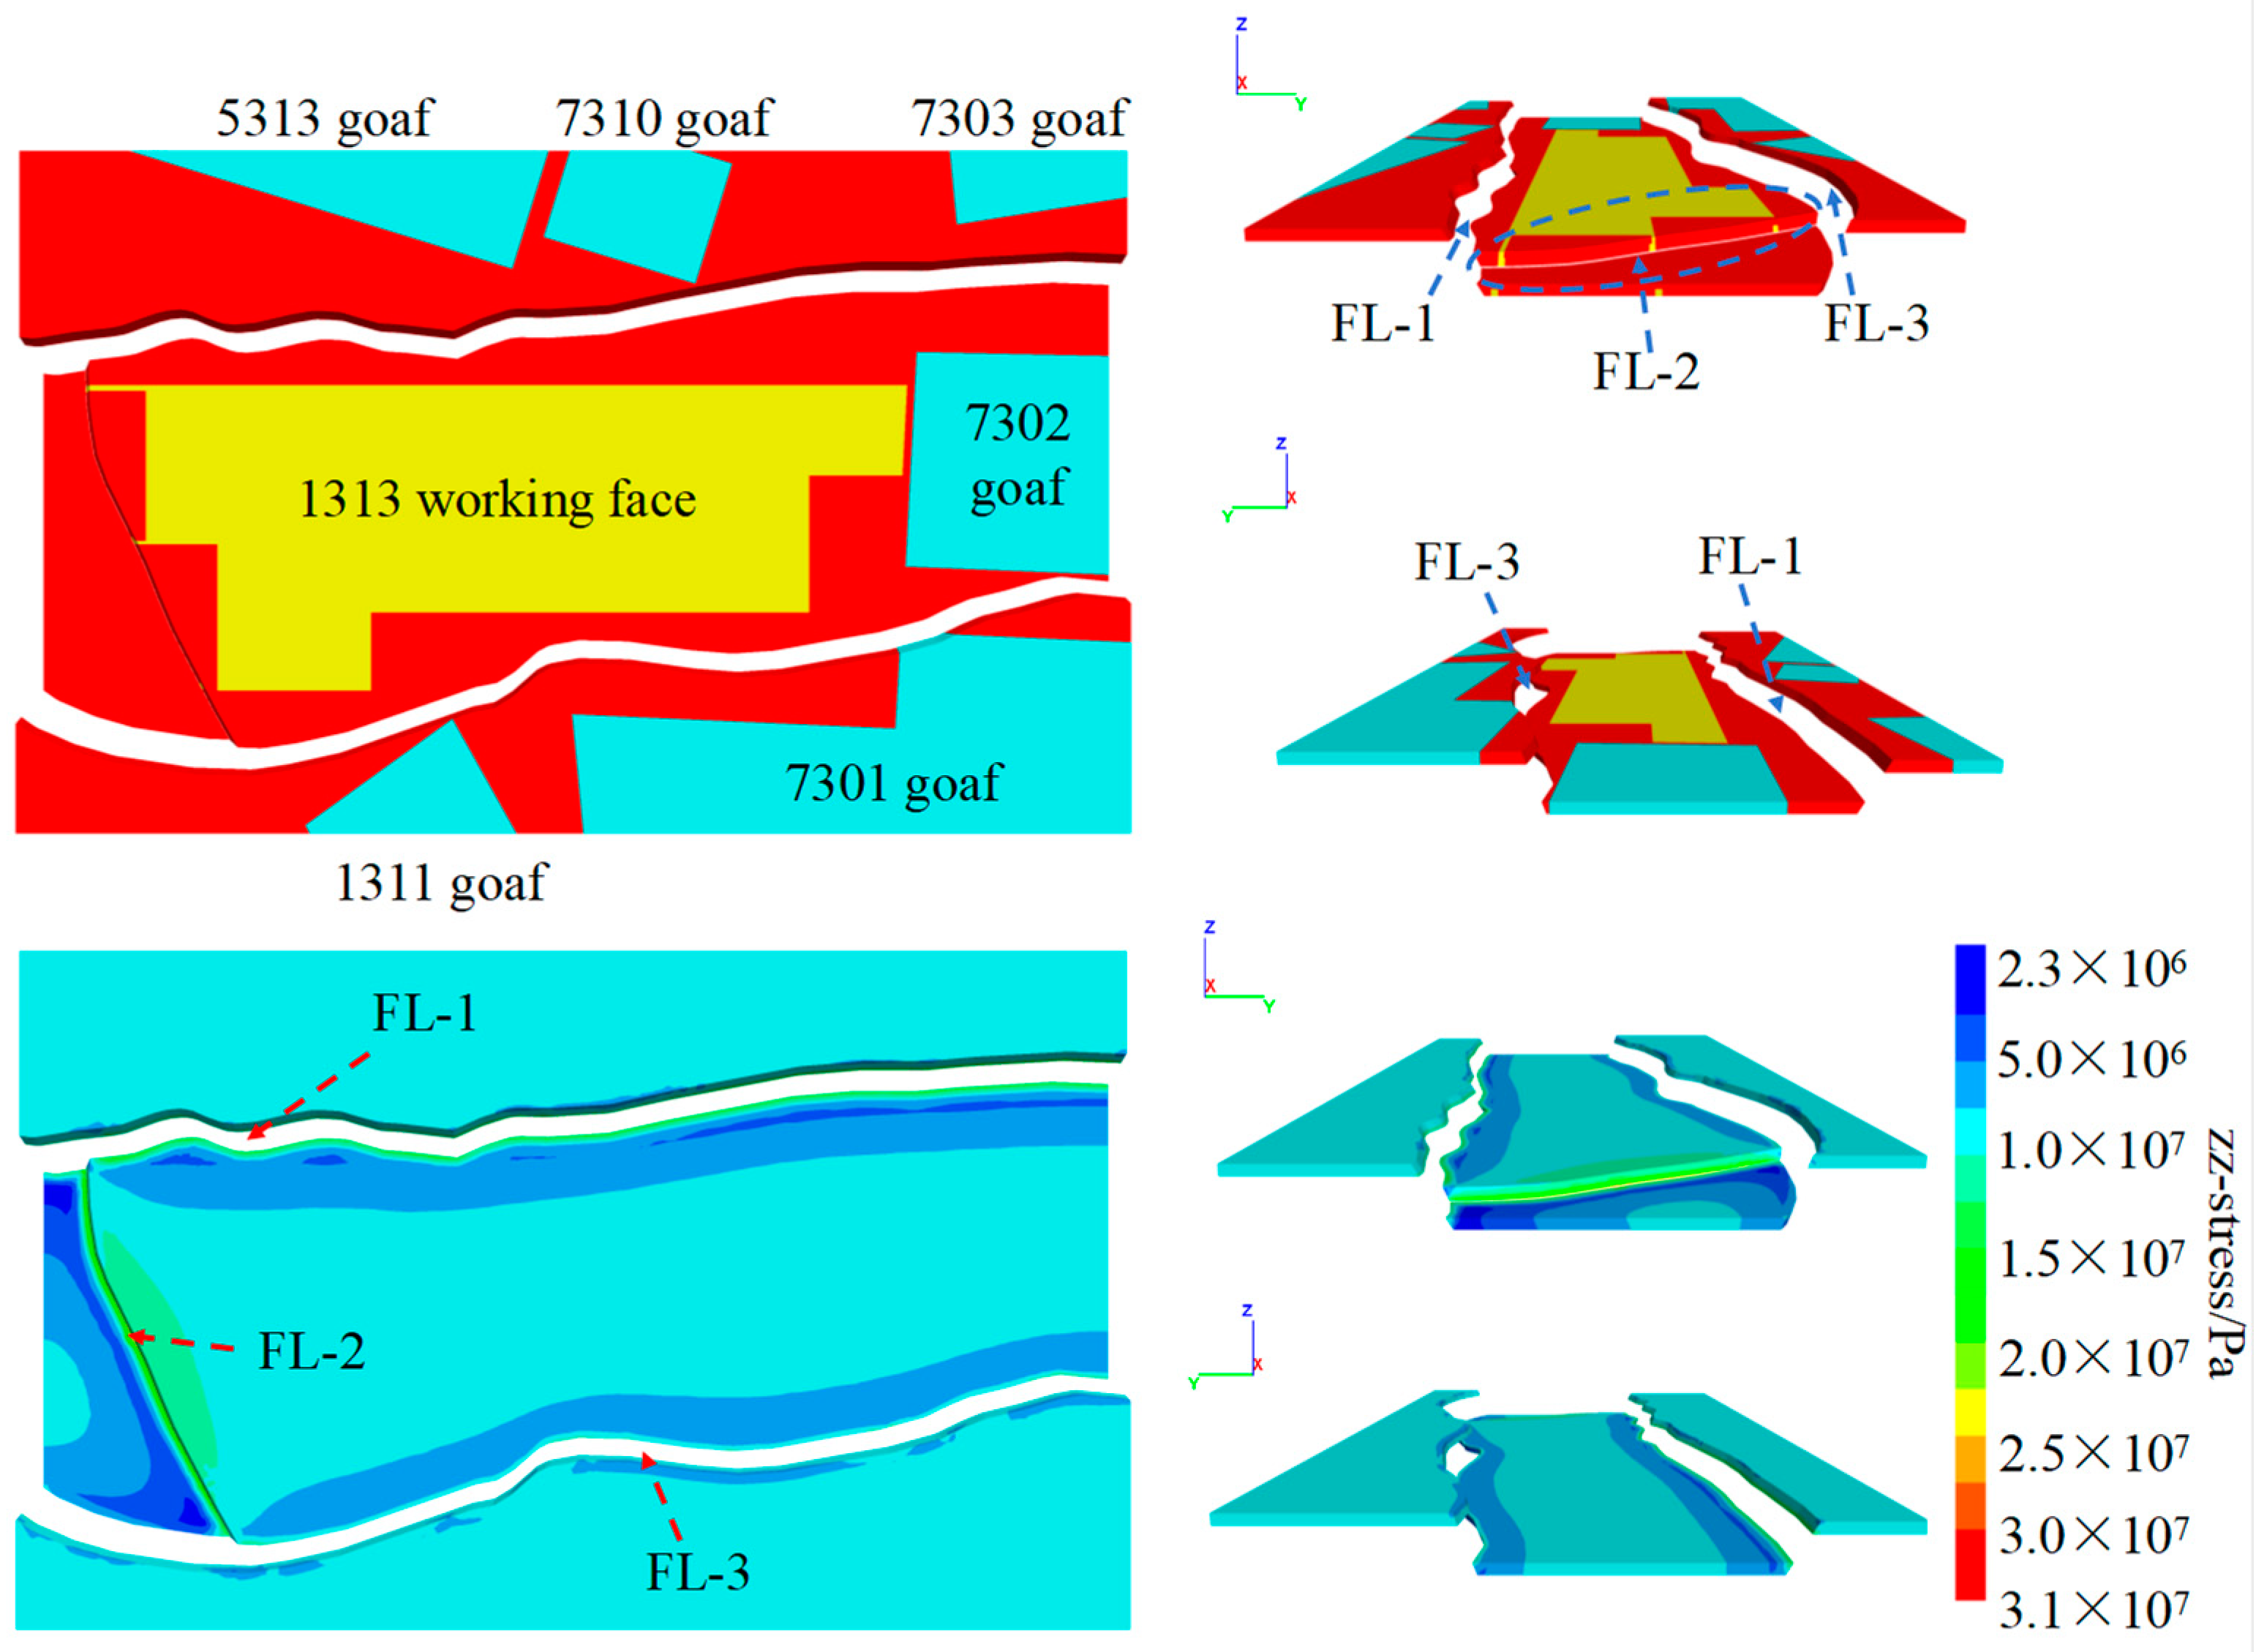
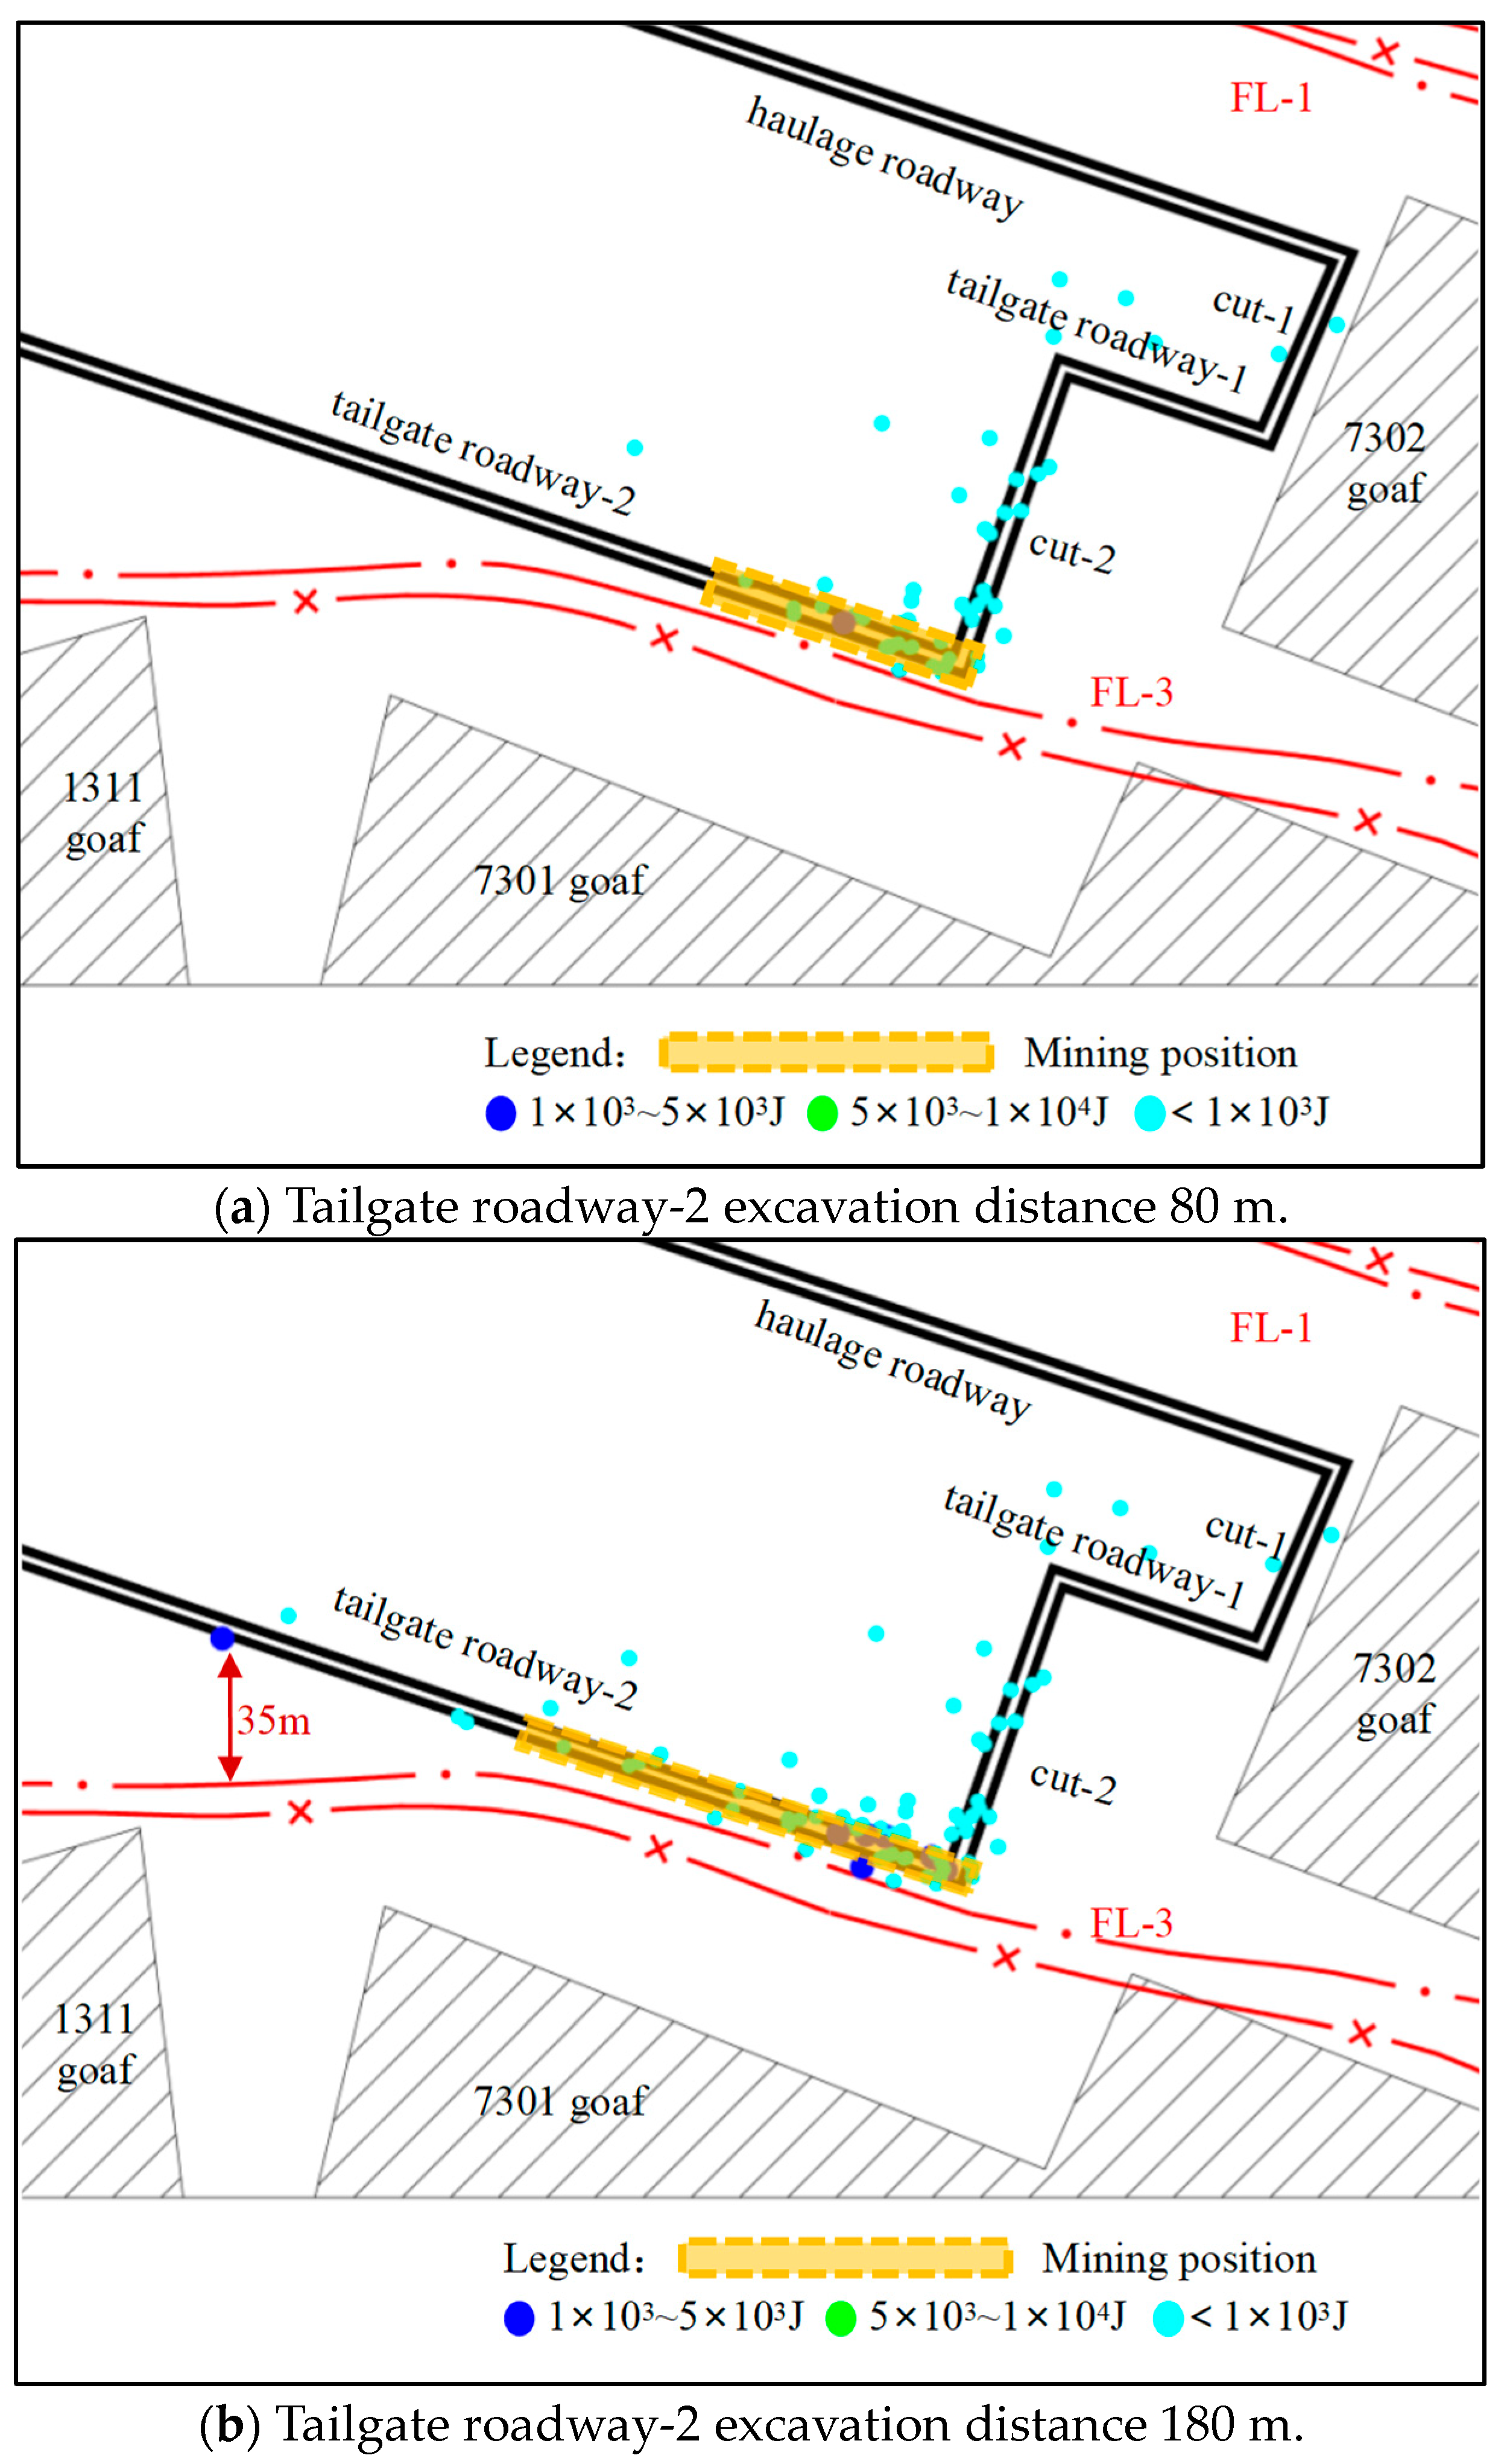
The fault structure groups are composed of FL-1, FL-2 and FL-3, under the influence of no mining disturbance. Under the initial stress balance state, a reduced stress area in the 35 m range appears on the hanging wall of the fault, which is reduced by 3.9 MPa, and an increased stress area of about 30 m appears on the footwall of the fault, which is increased by 1.3 MPa.
(2)
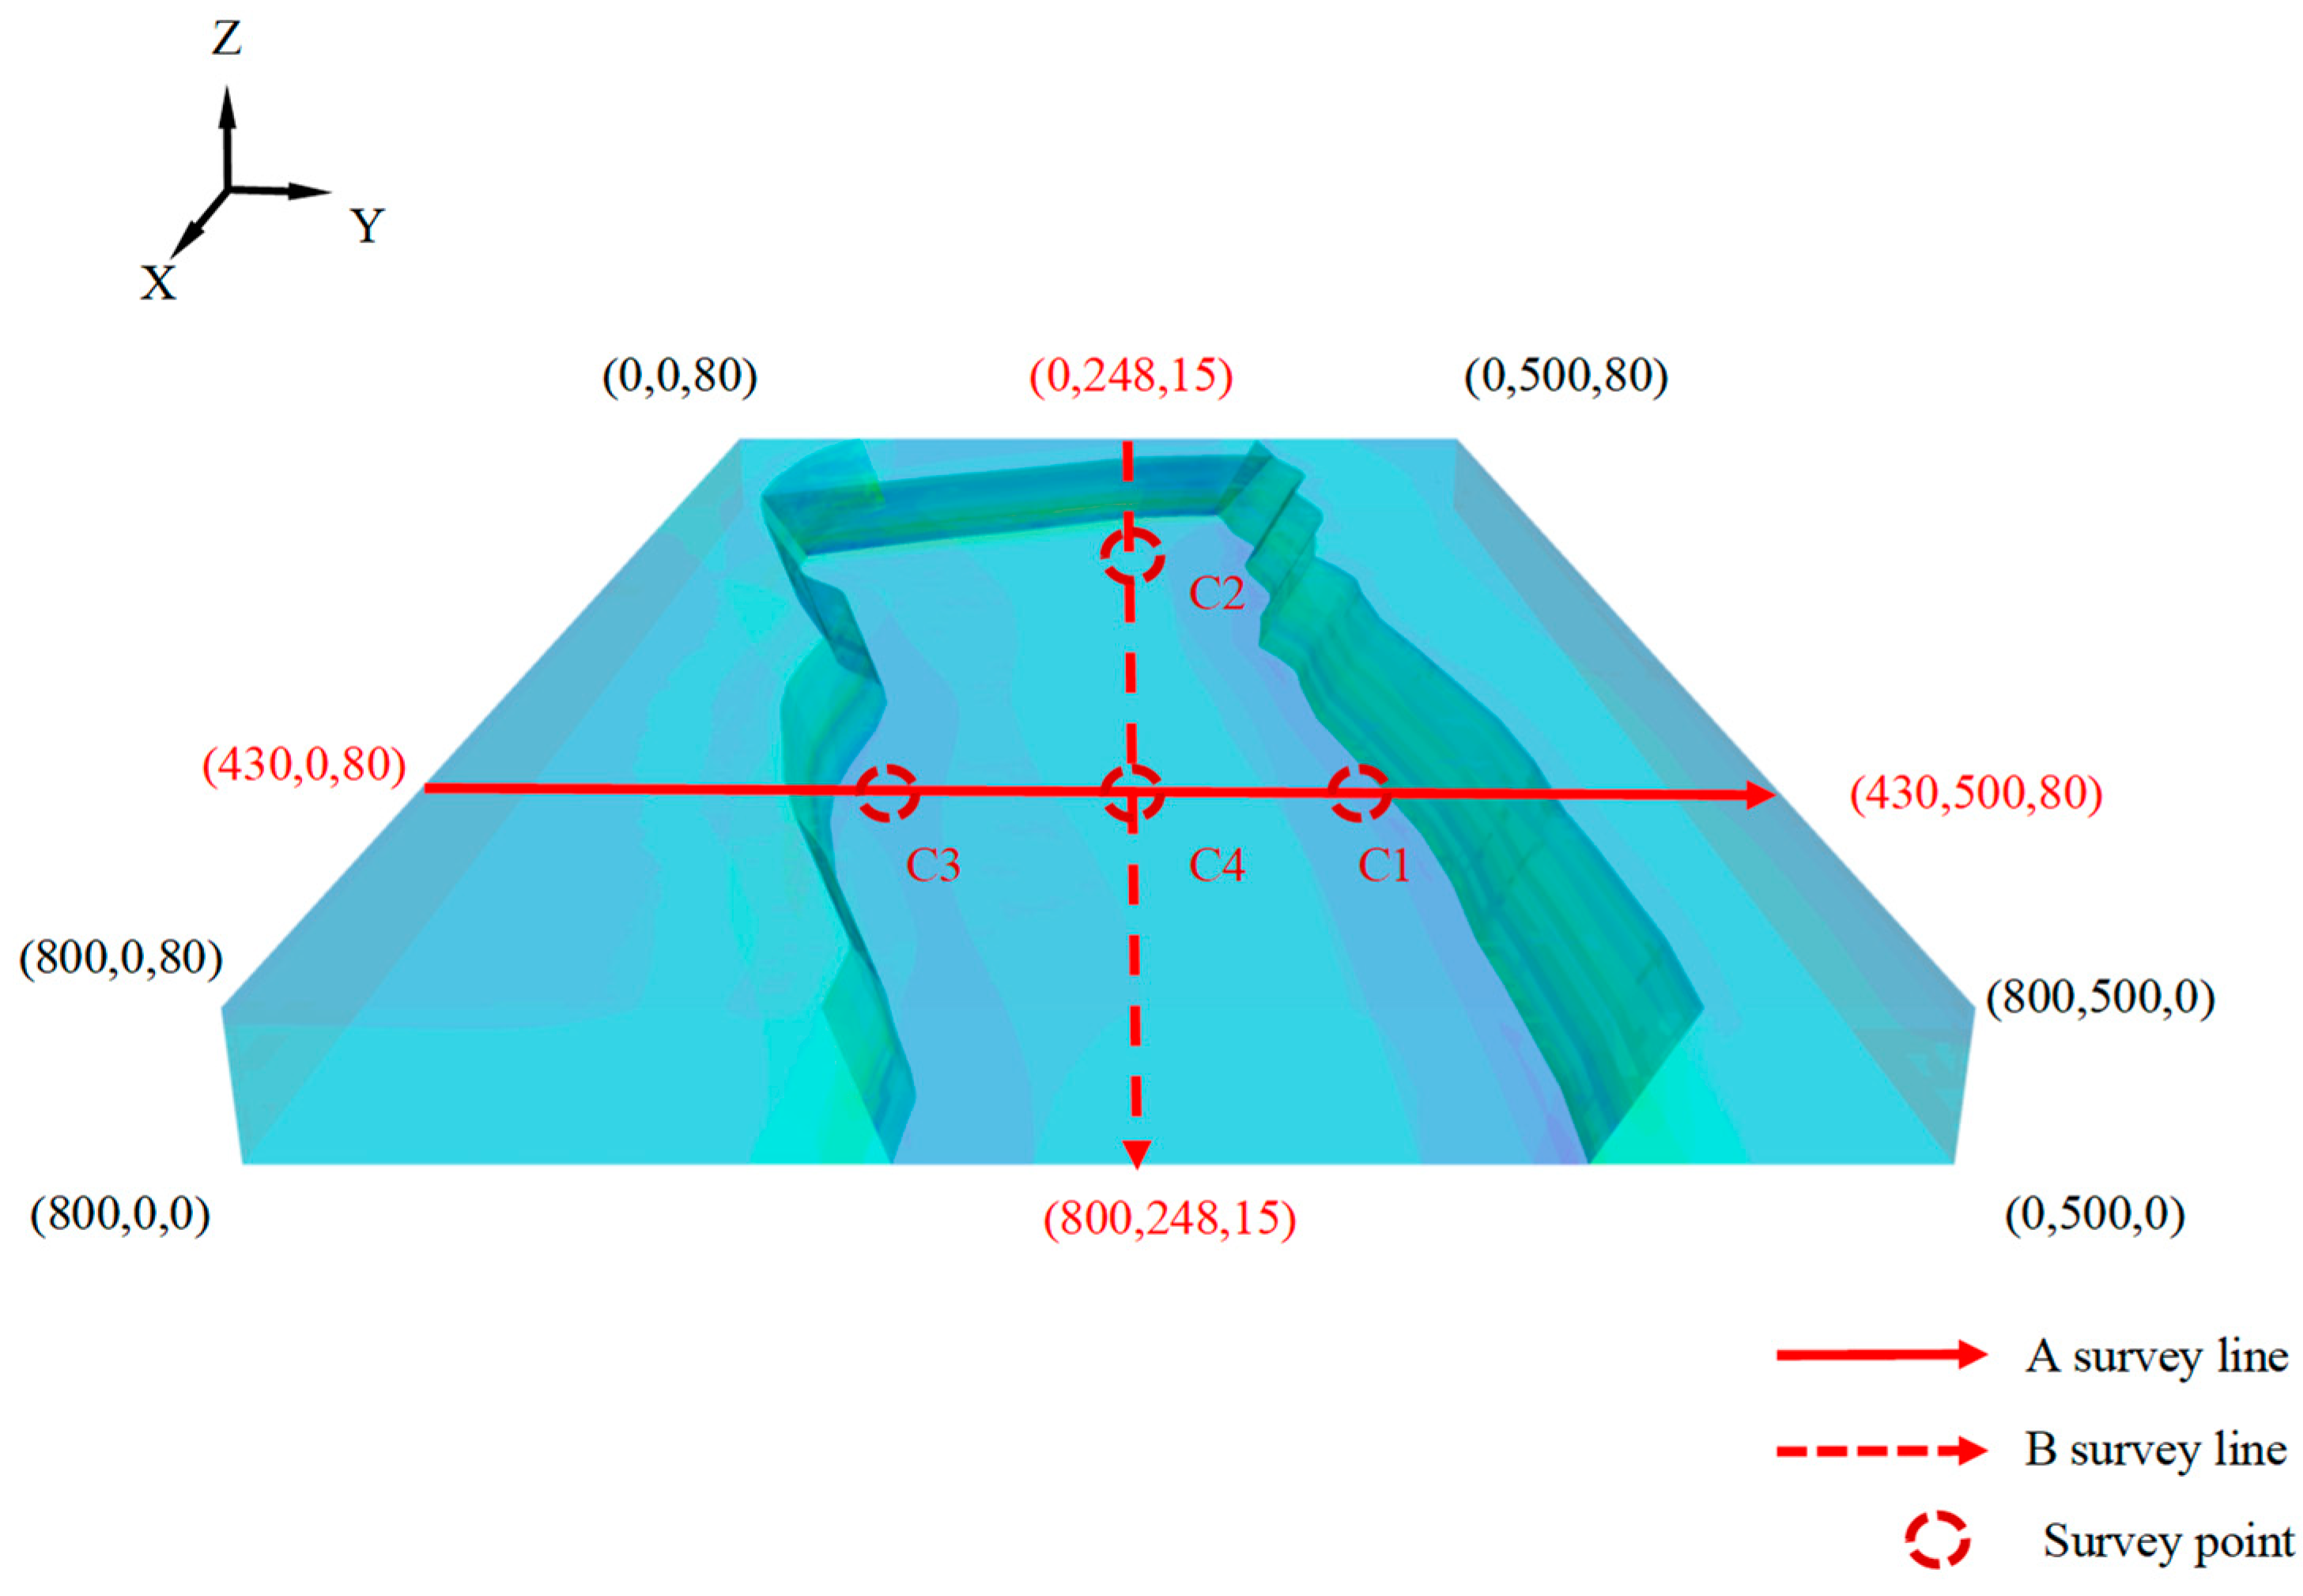
During the excavation of the surrounding goaf, due to the stress barrier effect of the fault structure groups, the coal pillar faults near FL-1 and FL-3 are mainly affected by the goaf. The stress near the measuring points C1 and C3 is relatively increased, and the stress increases are 1.2 MPa and 0.4 MPa, respectively. FL-2 is less affected by the goaf as a whole.
(3)
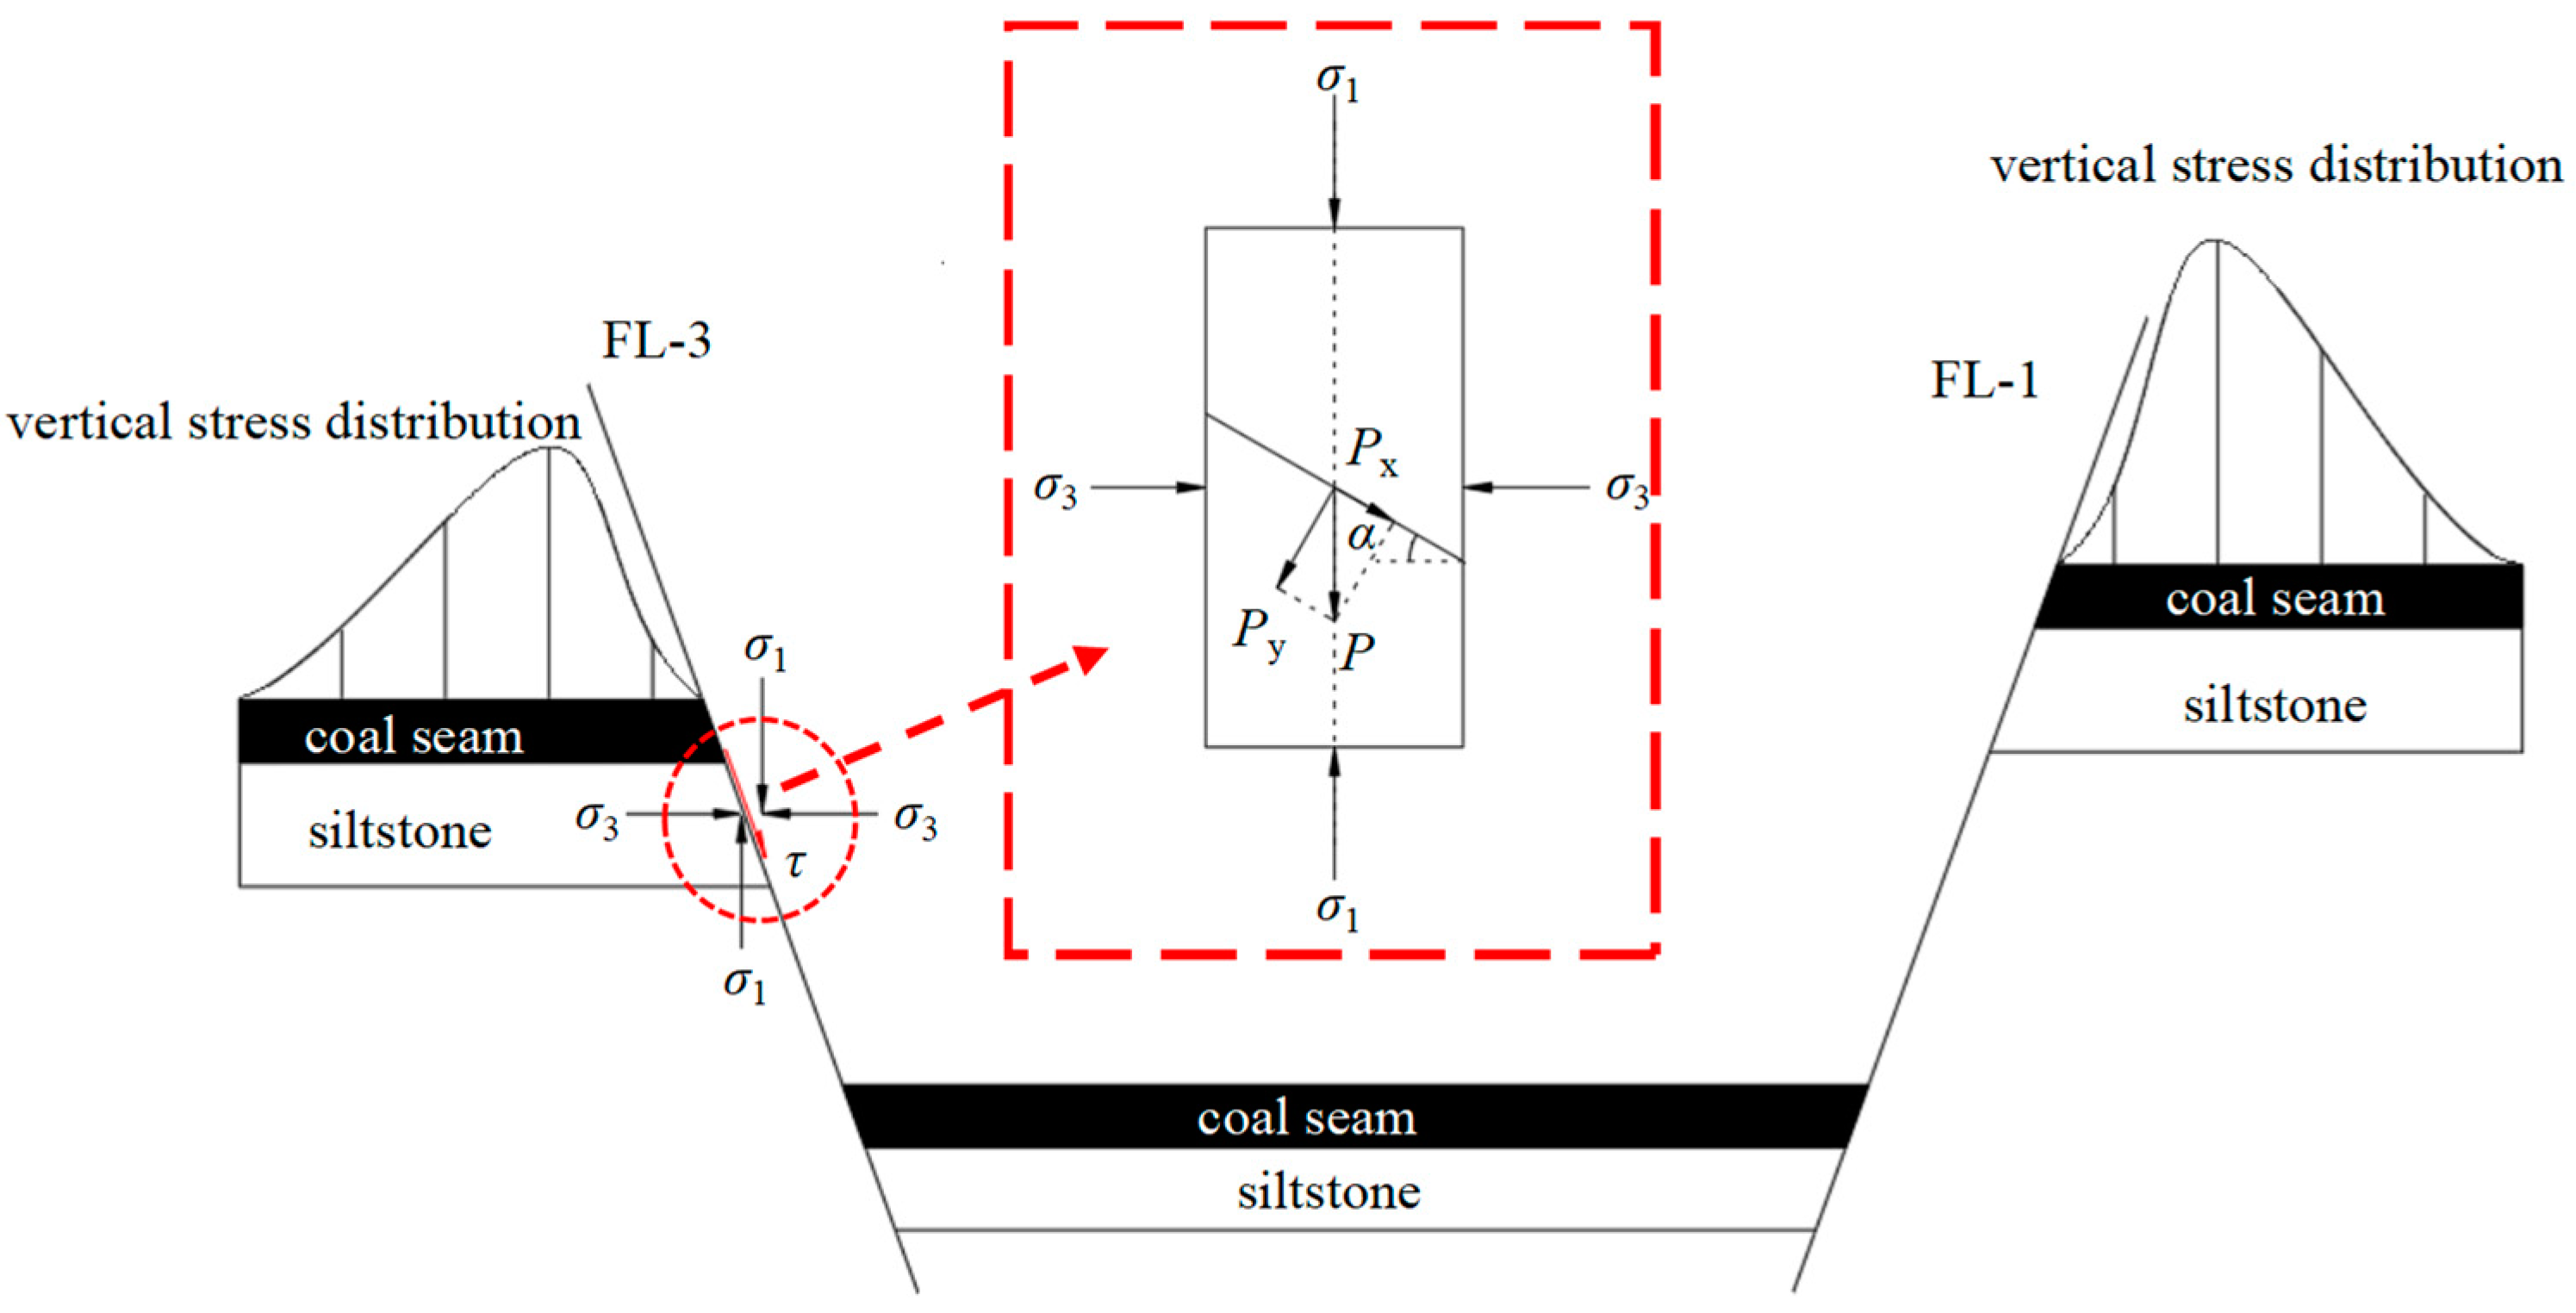
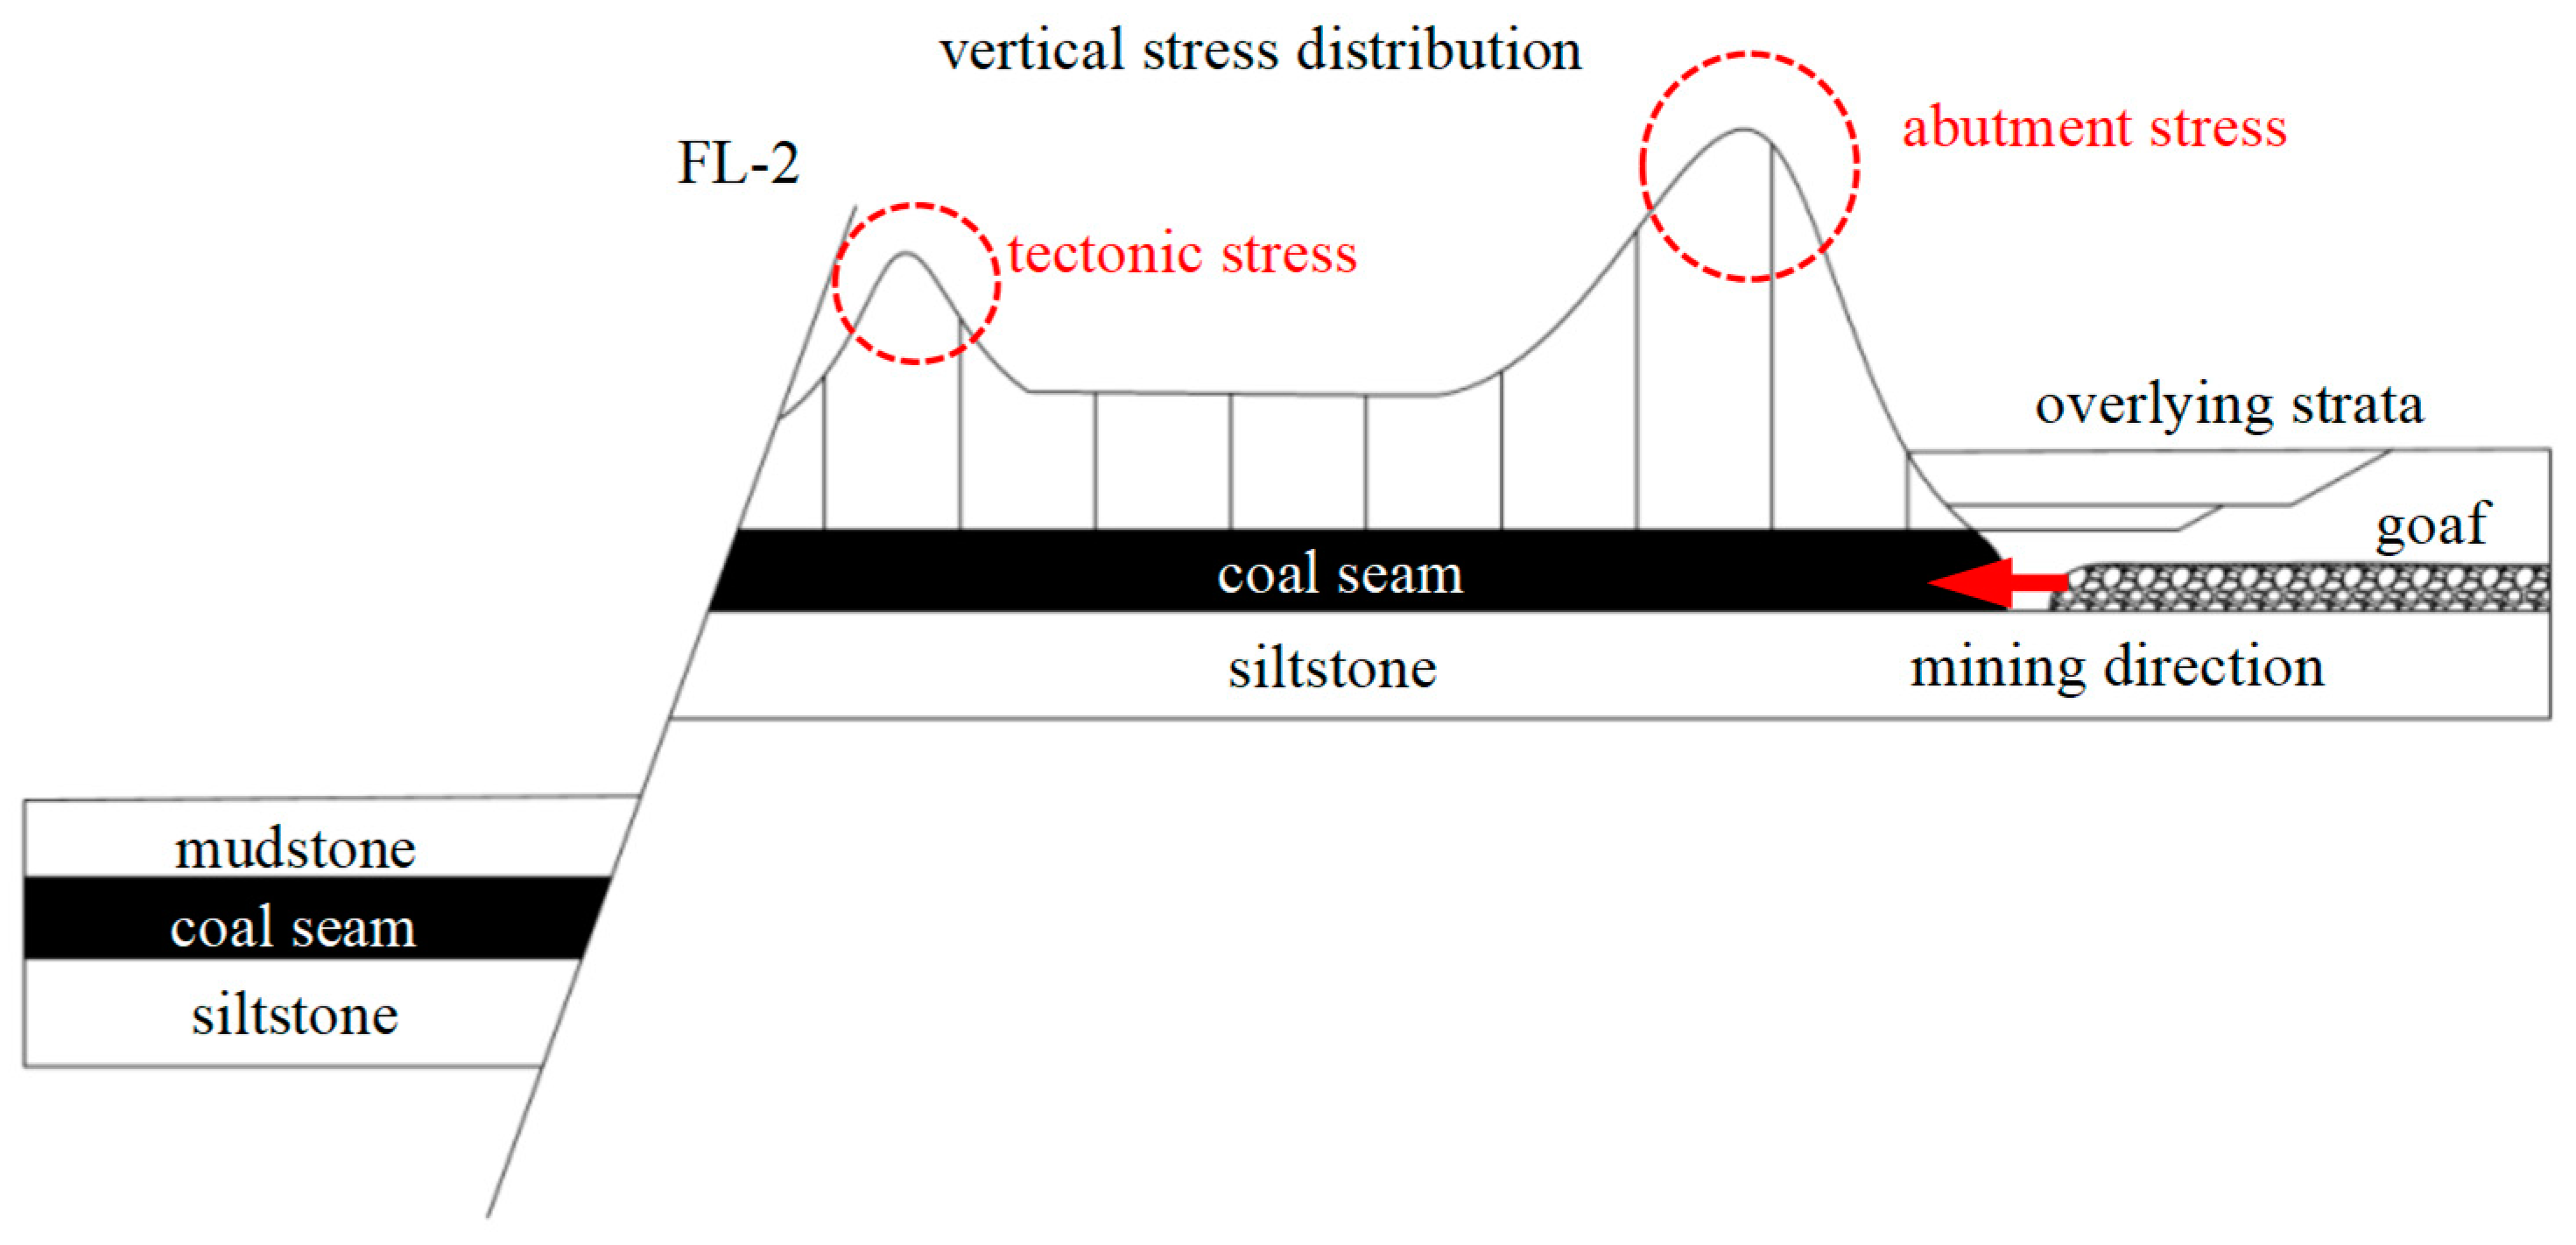
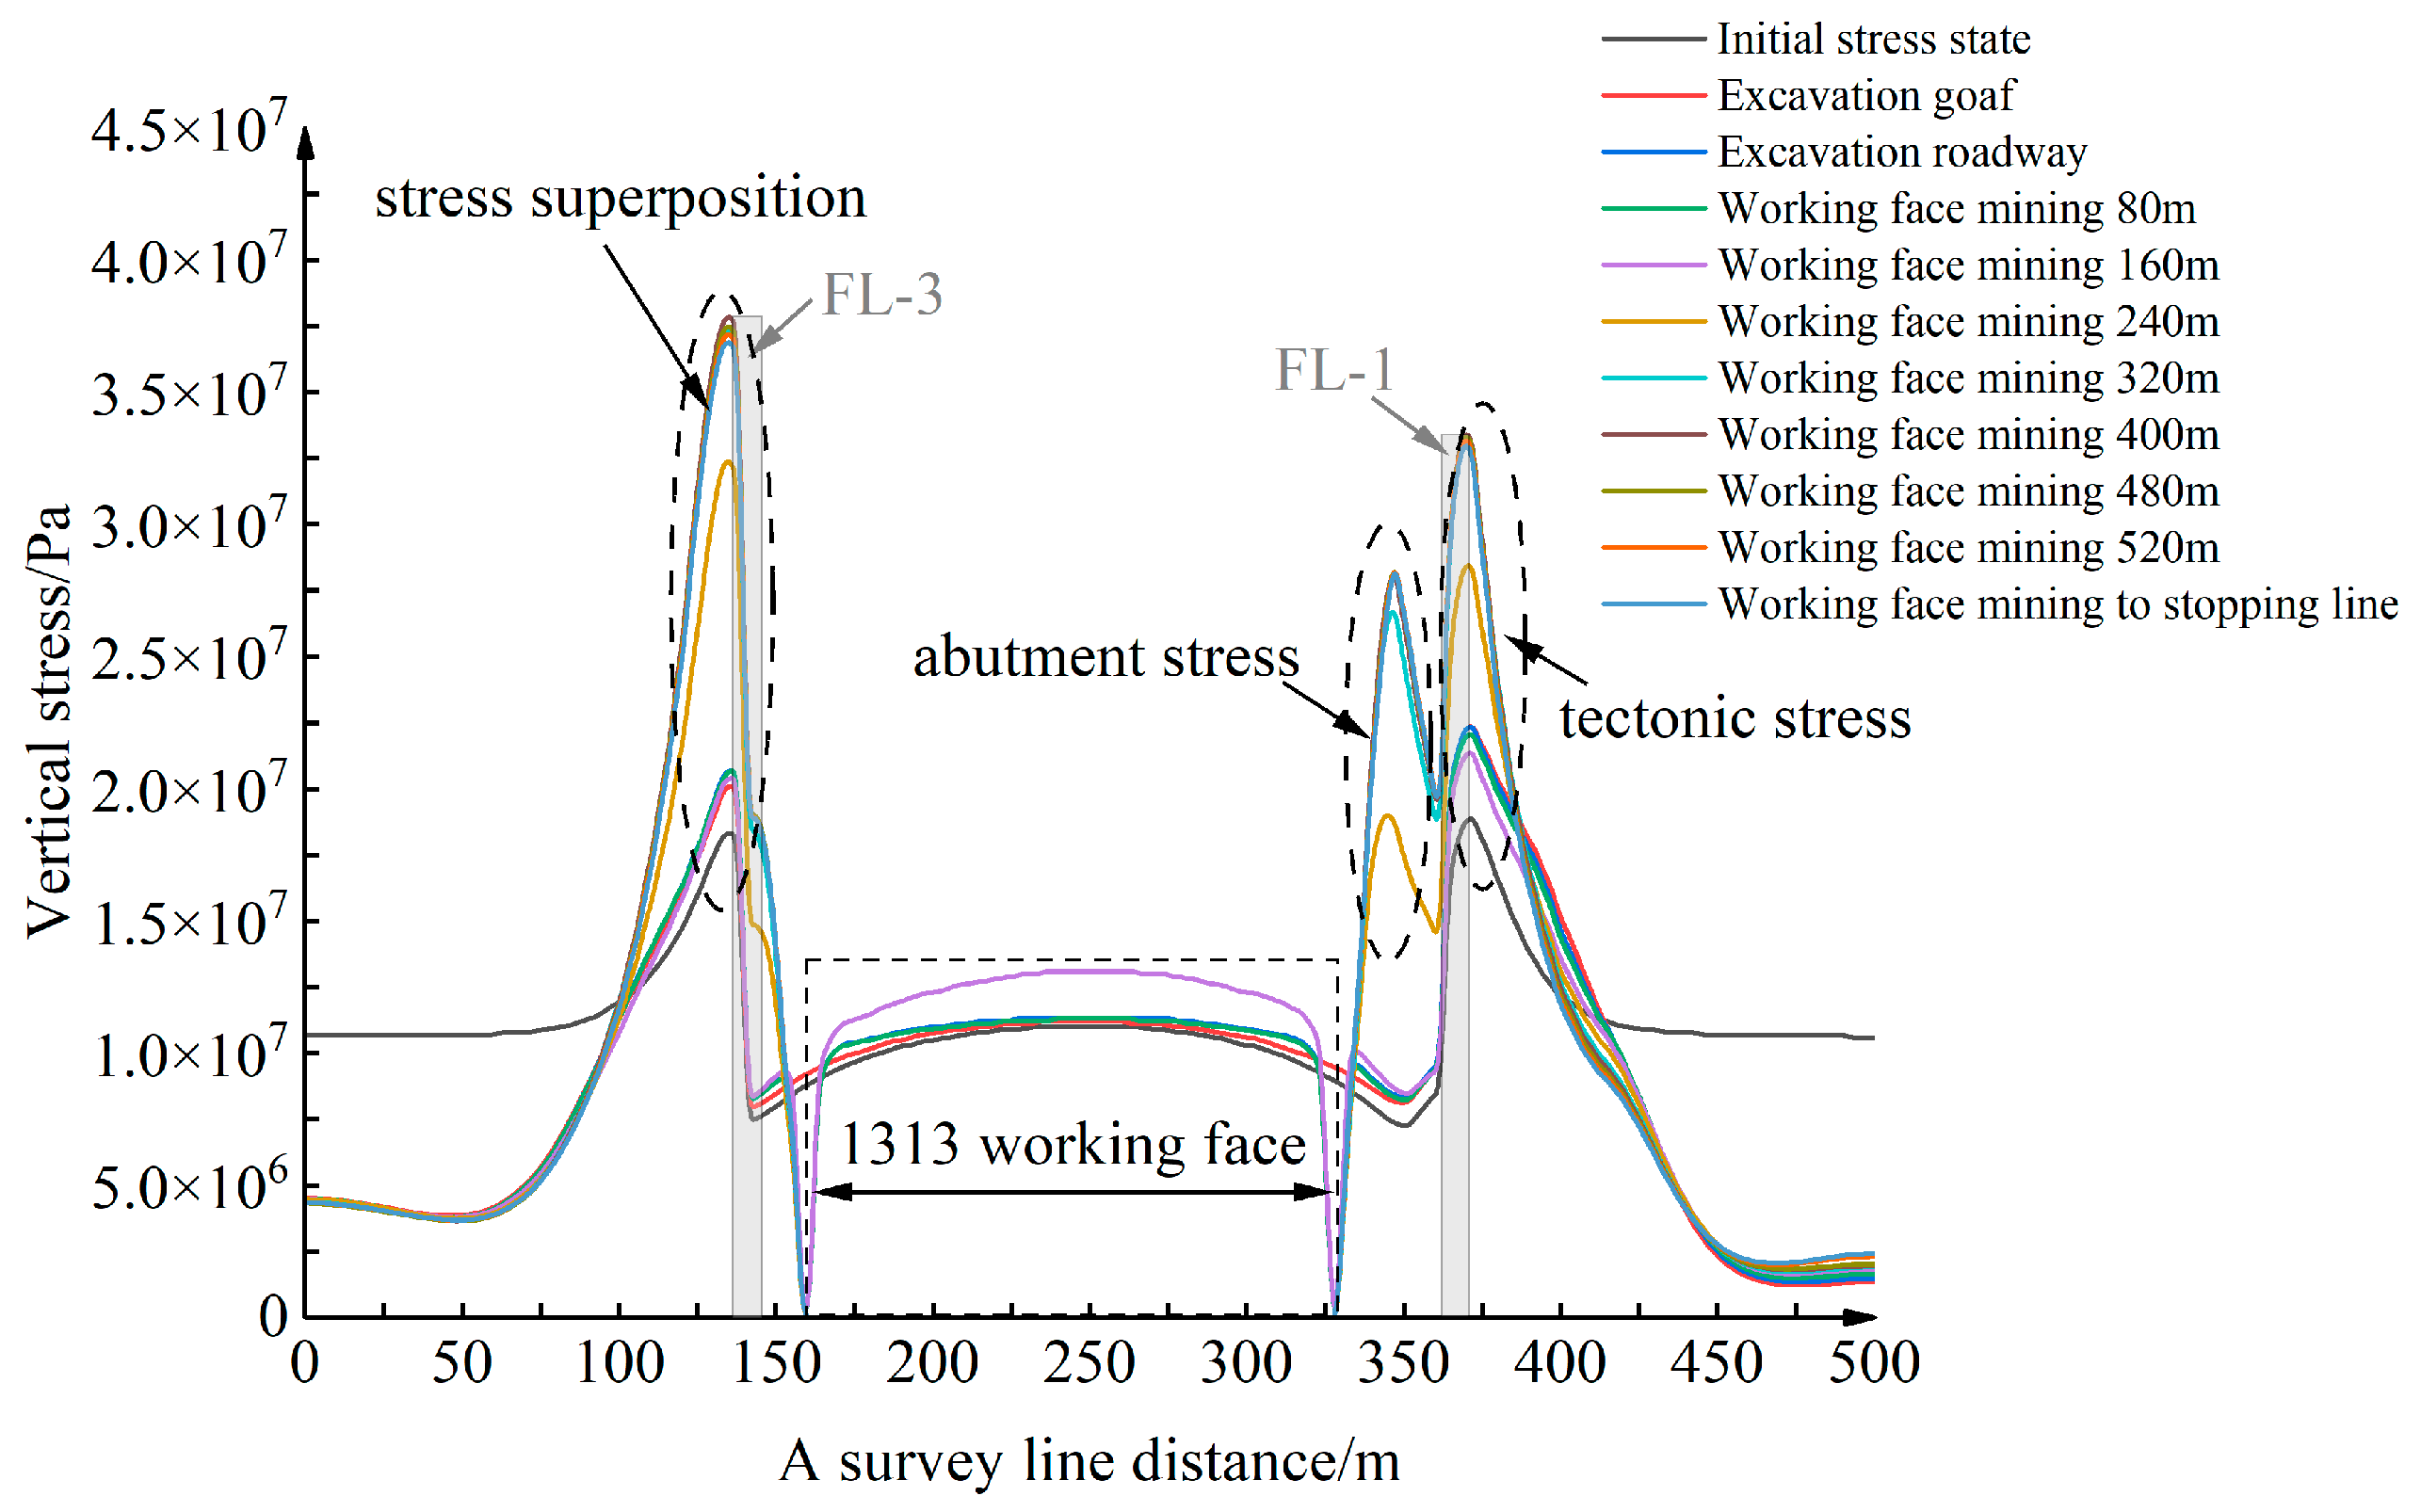
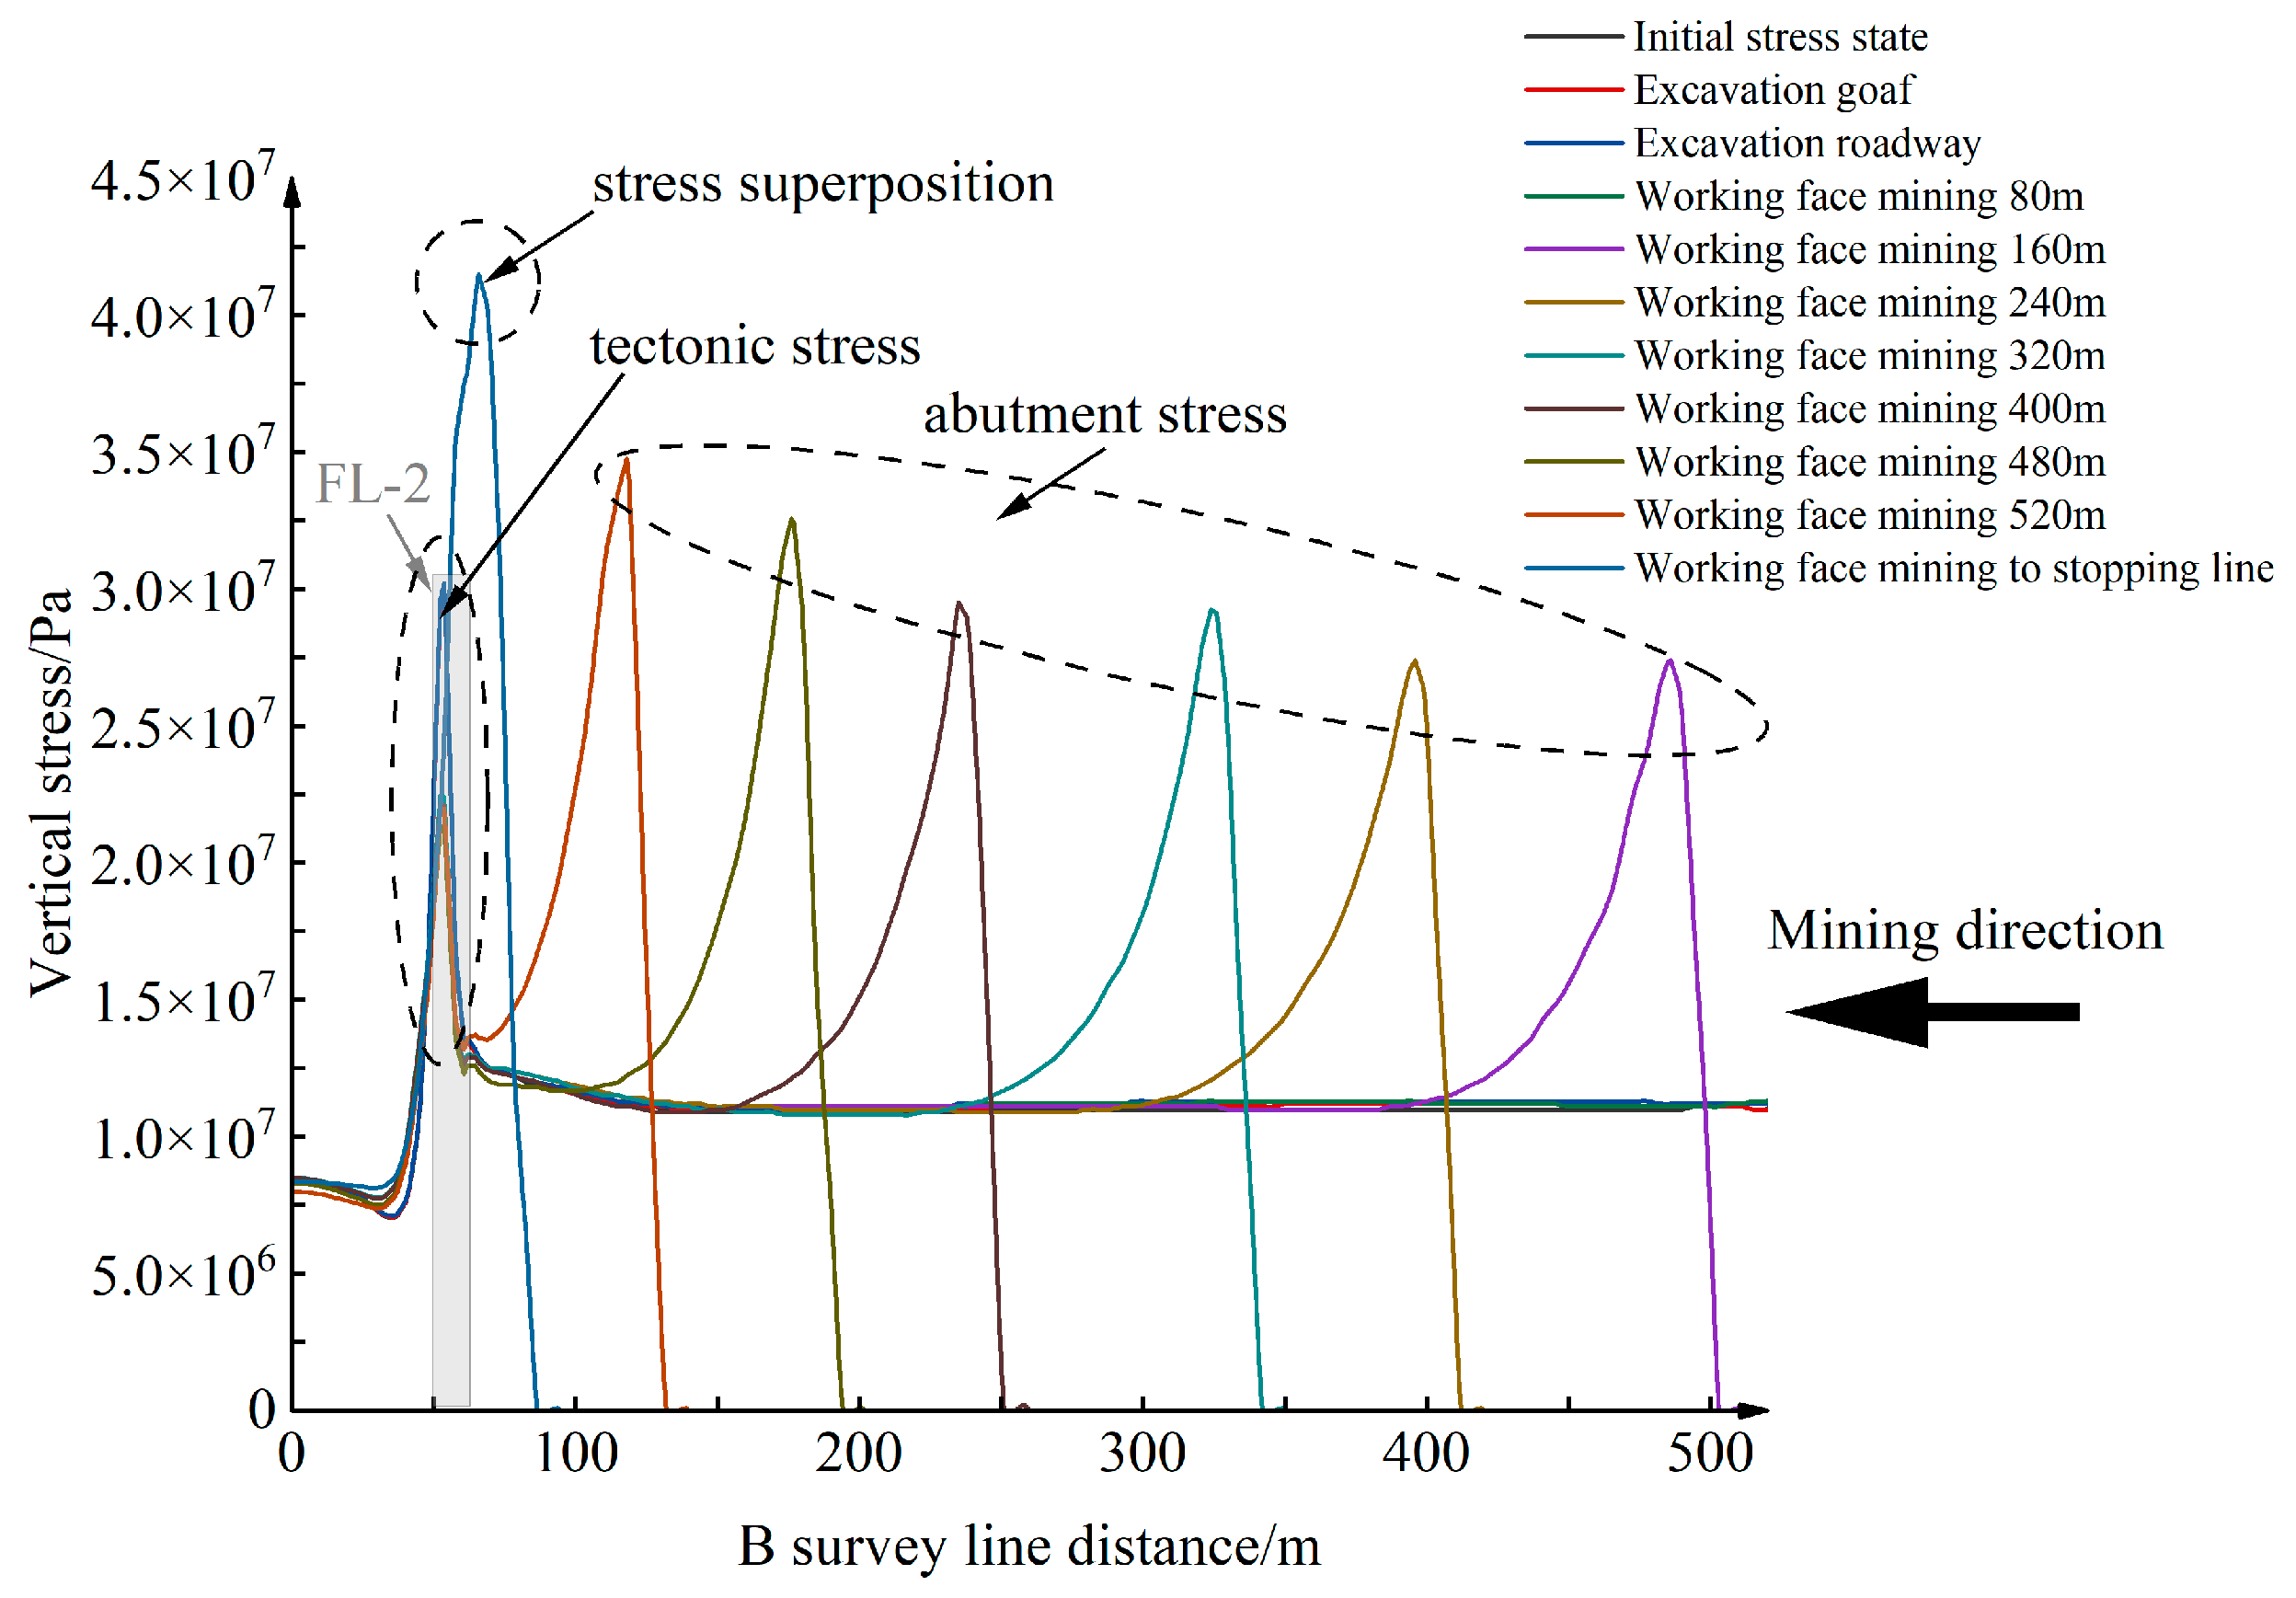
During the mining period of the 1313 working face, the fault structure groups as a whole have a barrier effect on the propagation of coal seam stress. On the A line, the peak stress of the FL-3 coal pillar fault is 37.7 MPa, and the peak stress of the FL-1 coal pillar fault is 33.5 MPa. Both FL-1 and FL-3 have stress peaks in the footwall of the fault, which are in the range of 11 m and 6 m, respectively, and a stress barrier effect occurs in the hanging wall of the fault. At the end of the FL-2 fault mining, the superposition of the advanced support stress and the tectonic stress is more obvious, and the peak stress is up to 41.5 MPa.

Author Contributions

J.Y. (Jianbo Yuan) conducted the field investigation; J.Y. (Jianbo Yuan) and Z.L. proposed the innovative points and conceived the study; C.W., Y.L., J.L. and J.Y. (Jiazheng Yan) discussed the results; W.Y. performed the simulation and monitored the test results; and J.Y. (Jianbo Yuan), Z.L. and W.Y. wrote the paper. All authors have read and agreed to the published version of the manuscript.

Funding

This research received no external funding.

Data Availability Statement

Data is contained within the article.

Acknowledgments

We highly appreciate the contribution of fieldwork from Shandong Energy Group Co., Ltd. (SDE), China.

Conflicts of Interest

Authors Chao Wang, Jingchao Lyu, Yajun Lu were employed by the company Yan Kuang Energy Group Co., Ltd. Zhigang Liu was employed by the company Shandong Energy Group. Wuchao You was employed by the company Shandong Jingtai Engineering Technology Co., Ltd. Jiazheng Yan was employed by the company Linyi City Development Group Co., Ltd. The remaining authors declare that the research was conducted in the absence of any commercial or financial relationships that could be construed as a potential conflict of interest. The Yan Kuang Energy Group Co., Ltd., Shandong Energy Group, Shandong Jingtai Engineering Technology Co., Ltd. and Linyi City Development Group Co., Ltd. had no role in the design of the study; in the collection, analyses, or interpretation of data; in the writing of the manuscript, or in the decision to publish the results.

References

  1. Han, H.; Hu, Z.; Liu, Y.; Zuo, W.; Wang, X.; Shi, C.; He, Y.; Qi, Y. Mining stress formation and distribution: Predictive model based on overburden key strata structure. Energy Sci. Eng. 2024, 12, 1551–1568. [Google Scholar] [CrossRef]
  2. Wang, C.; Si, G.; Zhang, C.; Cao, A.; Canbulat, I. Ground motion characteristics and their cumulative impacts to burst risks in underground coal mines. Geomech. Geophys. Geo-Energy Geo-Resour. 2022, 8, 39. [Google Scholar] [CrossRef]
  3. Zhang, J.; Xu, K.; Reniers, G.; You, G. Statistical analysis the characteristics of extraordinarily severe coal mine accidents (ESCMAs) in China from 1950 to 2018. Process Saf. Environ. Prot. 2020, 133, 332–340. [Google Scholar] [CrossRef]
  4. Keneti, A.; Sainsbury, B.-A. Review of published rockburst events and their contributing factors. Eng. Geol. 2018, 246, 361–373. [Google Scholar] [CrossRef]
  5. Zhang, C.; Canbulat, I.; Hebblewhite, B.; Ward, C.R. Assessing coal burst phenomena in mining and insights into directions for future research. Int. J. Coal Geol. 2017, 179, 28–44. [Google Scholar] [CrossRef]
  6. Wei, C.; Zhang, C.; Canbulat, I.; Huang, W. Numerical investigation into impacts of major fault on coal burst in longwall mining—A case study. Int. J. Rock Mech. Min. Sci. 2021, 147, 104907. [Google Scholar] [CrossRef]
  7. Gao, F.; Kang, H.; Li, J. Numerical simulation of fault-slip rockbursts using the distinct element method. Tunn. Undergr. Space Technol. 2021, 110, 103805. [Google Scholar] [CrossRef]
  8. Li, Z.; Dou, L.; Cai, W.; Wang, G.; He, J.; Gong, S.; Ding, Y. Investigation and analysis of the rock burst mechanism induced within fault–pillars. Int. J. Rock Mech. Min. Sci. 2014, 70, 192–200. [Google Scholar] [CrossRef]
  9. Liu, Z.; Cao, A.; Liu, G.; Li, J. Experimental Research on Stress Relief of High-Stress Coal Based on Noncoupling Blasting. Arab. J. Sci. Eng. 2018, 43, 3717–3724. [Google Scholar] [CrossRef]
  10. Hofmann, G.F.; Scheepers, L.J. Simulating fault slip areas of mining induced seismic tremors using static boundary element numerical modelling. Min. Technol. 2011, 120, 53–64. [Google Scholar] [CrossRef]
  11. Jiao, Z.; Yuan, Q.; Zou, P.; Shi, B. Case Study of the Characteristics and Mechanism of Rock Burst near Fault in Yima Coalfield, China. Shock Vib. 2021, 2021, 9950273. [Google Scholar] [CrossRef]
  12. Guo, Y.; Luo, L.; Wang, C. Research on Fault Activation and Its Influencing Factors on the Barrier Effect of Rock Mass Movement Induced by Mining. Appl. Sci. 2023, 13, 651. [Google Scholar] [CrossRef]
  13. Kong, P.; Liu, R.; Xing, L.; Li, Z.; Xu, C.; Zhang, Z. Study on the dynamic response and the hazard of rock burst under the influence of fault slip. Front. Earth Sci. 2023, 10, 1034332. [Google Scholar] [CrossRef]
  14. Tong, J. Application of Grey System Optimal Theory Model in Forecasting Rockburst. J. North China Inst. Water Conserv. Hydroelectr. Power 2003, 24, 37–40. [Google Scholar]
  15. Skrzypkowski, K.; Zagórski, K.; Zagórska, A.; Apel, D.B.; Wang, J.; Xu, H.; Guo, L. Choice of the Arch Yielding Support for the Preparatory Roadway Located near the Fault. Energies 2022, 15, 3774. [Google Scholar] [CrossRef]
  16. Mark, C. Coal bursts that occur during development: A rock mechanics enigma. Int. J. Min. Sci. Technol. 2018, 28, 35–42. [Google Scholar] [CrossRef]
  17. Maleki, H.; Lawson, H. Analysis of geomechanical factors affecting rock bursts insedimentary rock formations. Procedia Eng. 2017, 191, 82–88. [Google Scholar] [CrossRef]
  18. Li, Z.; Dou, L.; Lu, C.; Mu, Z.; Cao, A. Study on fault induced rock bursts. J. China Univ. Min. Technol. 2008, 18, 321–326. [Google Scholar] [CrossRef]
  19. Afraei, S.; Shahriar, K.; Madani, S.H. Statistical assessment of rock burst potential and contributions of considered predictor variables in the task. Tunn. Undergr. Space Technol. 2018, 72, 250–271. [Google Scholar] [CrossRef]
  20. Frith, R.; Reed, G.; Jones, A. A causation mechanism for coal bursts during roadway development based on the major horizontal stress in coal: Very specific structural geology causing a localised loss of effective coal confinement and Newton’s second law. Int. J. Min. Sci. Technol. 2020, 30, 39–47. [Google Scholar] [CrossRef]
  21. Shen, B.; Duan, Y.; Luo, X.; van de Werken, M.; Dlamini, B.; Chen, L.; Vardar, O.; Canbulat, I. Monitoring and modelling stress state near major geological structures in an underground coal mine for coal burst assessment. Int. J. Rock Mech. Min. Sci. 2020, 129, 104294. [Google Scholar] [CrossRef]
  22. Deng, S.; Li, J.; Jiang, H.; Wang, M. Experimental and theoretical study of the fault slip events of rock masses around underground tunnels induced by external disturbances. Eng. Geol. 2018, 233, 191–199. [Google Scholar] [CrossRef]
  23. Li, G.; Ma, F.; Guo, J.; Zhao, H.; Liu, G. Study on deformation failure mechanism and support technology of deep soft rock roadway. Eng. Geol. 2020, 264, 105262. [Google Scholar] [CrossRef]
  24. Zhang, J.; Li, X.; Qin, Q.; Wang, Y.; Gao, X. Study on overlying strata movement patterns and mechanisms in super-large mining height stopes. Bull. Eng. Geol. Environ. 2023, 82, 142. [Google Scholar] [CrossRef]
  25. Li, M.; Li, K.; Liu, Y.; Wu, S.; Qin, Q.; Yue, R. Goaf risk prediction based on IAOA–SVM and numerical simulation: A case study. Undergr. Space 2024, 15, 153–175. [Google Scholar] [CrossRef]
  26. Dong, M.; Gao, Z.; Liu, L. Model Optimization Method Based on Rhino. Adv. Manuf. Autom. IX 2020, 634, 267–274. [Google Scholar] [CrossRef]
  27. Suchowerska, A.M.; Carter, J.P.; Merifield, R.S. Horizontal stress under supercritical longwall panels. Int. J. Rock Mech. Min. Sci. 2014, 70, 240–251. [Google Scholar] [CrossRef]
  28. Zhang, L.; Shen, W.; Li, X.; Wang, Y.; Qin, Q.; Lu, X.; Xue, T. Abutment Pressure Distribution Law and Support Analysis of Super Large Mining Height Face. Int. J. Environ. Res. Public Health 2023, 20, 227. [Google Scholar] [CrossRef]
  29. Zhang, W.; Li, C.; Jin, J.; Qu, X.; Fan, S.; Xin, C. A new monitoring-while-drilling method of large diameter drilling in underground coal mine and their application. Measurement 2021, 173, 108840. [Google Scholar] [CrossRef]
  30. Sainoki, A.; Mitri, H.S. Dynamic Modelling of Fault Slip Induced by Stress Waves due to Stope Production Blasts. Rock Mech. Rock Eng. 2016, 49, 165–181. [Google Scholar] [CrossRef]
  31. Wu, K.; Zou, J.; Jiao, Y.-Y.; He, S.; Wang, G. Insight and Effectiveness of Working-Face Deep-Hole Blasting for Prevention of Strong Seismicity Induced by Deep Coal Mining. Rock Mech. Rock Eng. 2023, 56, 8693–8709. [Google Scholar] [CrossRef]
  32. Zou, J.; Wu, K.; Zhang, X.; Zhu, J.; Zhou, Z.; Zheng, F.; Xie, H.; Jiao, Y.-Y. Effective evaluation of deep-hole blasting for controlling strong tremors induced by deep coal mining—A case study. Int. J. Rock Mech. Min. Sci. 2022, 159, 105211. [Google Scholar] [CrossRef]
Figure 1. Location and plan of Xinglongzhuang coal mine.
Processes 12 01162 g001
Figure 2. Layout of 1313 working face.
Processes 12 01162 g002
Figure 3. Two-dimensional plan and three-dimensional transparent geological model.
Processes 12 01162 g003
Figure 4. Optimized model of coal seam.
Processes 12 01162 g004
Figure 5. Model construction process and overall model.
Processes 12 01162 g005
Figure 6. Numerical model and local amplification diagram.
Processes 12 01162 g006
Figure 7. Faults model.
Processes 12 01162 g007
Figure 8. Schematic diagram of normal fault principal stress state.
Processes 12 01162 g008
Figure 9. Mechanical diagram of fault model.
Processes 12 01162 g009
Figure 10. Schematic diagram of abutment stress at the end of mining.
Processes 12 01162 g010
Figure 11. Spatial structure and initial stress of coal seam.
Processes 12 01162 g011
Figure 12. Layout of survey lines and survey points.
Processes 12 01162 g012
Figure 13. Vertical stress diagram of survey points.
Processes 12 01162 g013
Figure 14. Vertical stress cloud slice diagram of survey lines.
Processes 12 01162 g014
Figure 15. Vertical stress diagram of the A survey line.
Processes 12 01162 g015
Figure 16. Vertical stress diagram of B survey line.
Processes 12 01162 g016
Figure 17. Tailgate roadway-2 excavation microseismic data distribution.
Processes 12 01162 g017aProcesses 12 01162 g017b
Figure 18. Microseismic data distribution diagram during working face mining.
Processes 12 01162 g018
Table 1. Features of roof and floor strata.
Type of the StrataRock CategoryAverage
Thickness (/m)
Lithological Characteristics
Main roofInterbedding of siltstone-sandstone20.54Gray-white, massive oblique bedding with a diameter of 5 mm in the upper part, locally sandwiched with thin layers of fine sandstone
Immediate roofSiltstone3.66Grey-black, block contains plant fossil fragments, cracks are developed
Immediate floorSiltstone3.12Dark gray, a small amount of charcoal, horizontal thin layer; the top root-bearing fossils contain fine sheep teeth and khoda tree fossils
Main floorMedium sandstone15.52Gray-white, quartz feldspar, muscovite sheet and black carbon debris; the siliceous cementation is hard with black siltstone and developed cracks
Table 2. Fault structure group information.
Fault NameStrike/°Tendency/°Dip/°Drop/m
FL-1104.7~131.4194.7~221.4600~30
FL-2171~181261~271550~15
FL-3161~16971~7970~800~36
Table 3. Numerical simulation experiment parameters.
LithologyBulk Modulus/GPaShear Modulus/GPaCohesion/MPaInternal Friction Angel/
°
Tensile Strength/
MPa
Density/
kg/m3
Medium sandstone6.53.58.3394.22650
3# Coal1.50.61.5230.21300
Mudstone4.12.94.8282.32340
Fine sandstone 5.52.54.9304.22650
Siltstone6.53.58.3353.42750
Table 4. Faults model.
Fault NameStiffness—Shear
/GPa
Stiffness—Normal/GPaCohesion
/MPa
Internal Friction Angel
FL-120.020.02.030
FL-220.020.02.030
FL-320.020.02.030
Disclaimer/Publisher’s Note: The statements, opinions and data contained in all publications are solely those of the individual author(s) and contributor(s) and not of MDPI and/or the editor(s). MDPI and/or the editor(s) disclaim responsibility for any injury to people or property resulting from any ideas, methods, instructions or products referred to in the content.

