Article

Influence of the Material Mechanical Properties on Cutting Surface Quality during Turning

1
Department of Mechanical System, Korea Polytechnic Colleges, Muan 58542, Republic of Korea
2
Department of Marine Police and Fisheries Product System, Gyeongsang National University, Tongyeong 53064, Republic of Korea
*
Author to whom correspondence should be addressed.
Processes 2024, 12(6), 1171; https://doi.org/10.3390/pr12061171
Submission received: 16 May 2024 / Revised: 3 June 2024 / Accepted: 4 June 2024 / Published: 7 June 2024

Abstract

:
In cutting processing, the mechanical properties of the material are very important, and the optimal cutting conditions, depending on strength, hardness, and elongation, affect the quality of the machined surface. Therefore, this study was conducted to obtain optimized cutting conditions such as the tool depth of the cut, cutting speed, and feed rate, considering the mechanical properties of the material. AISI 1045 cold-drawn (CD) bars showed an average tensile strength of 695.31 MPa in the tensile test and an average value of 308.6 HV in the Vickers hardness measurement. AISI 1020 CD bars showed a 22.66% lower average tensile strength of 537.74 MPa and an average of 198.77 HV in the hardness measurement. Therefore, AISI 1020 showed a 32.62% higher elongation than AISI 1045. In the measurement results for surface roughness after cutting, different results were observed depending on the strength and elongation at a feed rate of 0.05 mm/rev. AISI 1045 exhibited the highest machining quality, with a surface roughness of approximately 0.374 µm at a cutting speed of 150 m/min, and the cutting depth was 0.4 mm at a feed rate of 0.05 mm/rev. Alternatively, AISI 1020, which had relatively low strength and hardness with high elongation, exhibited the highest machining quality with a roughness of 0.383 µm with similar cutting parameters as AISI 1045.

Graphical Abstract

1. Introduction

In the production and manufacturing sector, cutting is used in various fields that require precision. Mechanical parts must be cut precisely on the basis of design drawings. In general, turning is very efficient when cutting circular parts. Representative circular parts include the rotating axis or the stationary axis and the circular covers and housings used in combination with bearings in rotating machinery.
Since cutting produces the required geometry while discharging chips, optimal cutting conditions are required depending on the material used in the process and the characteristics of the tool. The surface roughness and precision of the machined parts are influenced by the cutting conditions, and the production speed and efficiency are determined by the tool wear. Owing to the development of various new materials and tools, experimental methods using cutting force, cutting surface roughness, tool wear, computational analysis, and microscopes have been used in the latest research [1,2].
Cutting force assessment is a representative experimental method to quantify the resistance encountered when cutting new steel types, new materials, and difficult-to-cut materials using a tool dynamometer [3].
A tool dynamometer is an experimental device suitable for analyzing the principal force, feed force, and back force that may occur when cutting a material. It can evaluate the cutting force for difficult-to-cut materials and composites that involve high tool wear to maximize production efficiency [4,5].
In general, in turning processes, the cutting resistance generated during machining also changes according to changes in cutting conditions. In particular, increasing the depth of cut and the feed rate are the main factors that increase cutting force, and increasing cutting speed has the effect of reducing cutting resistance.
Therefore, in relation to cutting conditions, research has been conducted on the optimal cutting conditions according to changes in the nose R of the tool [6], and studies using cutting speed and feed rate have been conducted to find the optimal cutting conditions according to the physical properties of the material [7].
Many studies have been conducted using microscopic analysis to analyze the effects of cutting conditions and cutting force on tool wear in relation to productivity [1,8]. Studies have also been conducted on the heat and tool wear that occurs during cutting, as the increase in friction and heat sources caused by interaction between the tool and the workpiece depending on the cutting conditions results in a degradation of hardness [9,10].
The parameters used in cutting studies are essentially the cutting conditions [11,12]. The reason for this is that the characteristics of chip discharge change depending on the cutting conditions, and the chip discharge characteristics have a significant effect on cutting resistance and surface roughness during machining [13,14].
In recent years, various studies have been conducted to analyze tool wear, temperature distribution, and stress concentration areas during machining and to predict the chip discharge characteristics using the finite element method (FEM) after modeling the machining environment and tool geometry [15,16]. In production, with the introduction of cutting force signals and technologies to diagnose the noise generated during machining, studies have been conducted to minimize the acceleration of tool wear during production by constructing a deep-learning production system [17,18]. Since forced vibration and cutting surface quality degradation due to tool wear and damage cannot be avoided, optimal cutting conditions are very important to minimize them. Studies have been conducted to minimize vibrations that may occur during machining due to poor workpiece fastening and tool installation [19,20].
AISI 1045 CD bars are used for the production of various mechanical parts. In particular, they are often used for wear-resistant parts, such as crankshafts and connecting rods inside automobile engines, due to their high mechanical strength and ductility [21,22]. AISI 1020 CD bars, which are made of low-carbon steel, are generally used for various mechanical parts after being improved by carbonitriding [23]. If necessary, they are used for mechanical parts that are not heat-treated and for parts that require welding [24].
In previous studies using the same material, multiple grooves were machined on one workpiece, and cutting conditions were changed or inserts were replaced depending on each grooving point, and the distance of the cutting section was very short [25].
However, in this study, a relatively long surface was machined by applying one cutting condition to one workpiece. As a solution to the heat generated during cutting, the experiment was conducted with the same configuration as the actual production and processing site while spraying cutting fluid.
Therefore, the cutting conditions for finishing machining obtained through the results of this study are very reliable and can be usefully utilized in the field.
In particular, it is important to consider the mechanical properties of the material because the results of the machined surface appear very different depending on the cutting conditions. Generally, as the depth of cut and feed rate of the tool increase during machining, the cutting force increases, and conversely, as the cutting speed increases, the cutting force decreases. Therefore, the cutting force generated during finishing machining is greatly affected by the mechanical properties of the material, and the quality of the cutting surface may decrease as the depth of cut or feed rate increases.
Therefore, our objective was to examine the mechanical properties of each material by means of tensile tests and hardness measurement experiments. In addition, machining was performed for each material after determining the cutting conditions by dividing the cutting speed into low, medium, and high speed categories. Cutting surface quality was evaluated after finishing using surface roughness measuring equipment. In addition, the effects of the mechanical properties of each material on finishing were analyzed by analyzing the experimental results to determine optimal cutting conditions based on the excellent surface roughness.

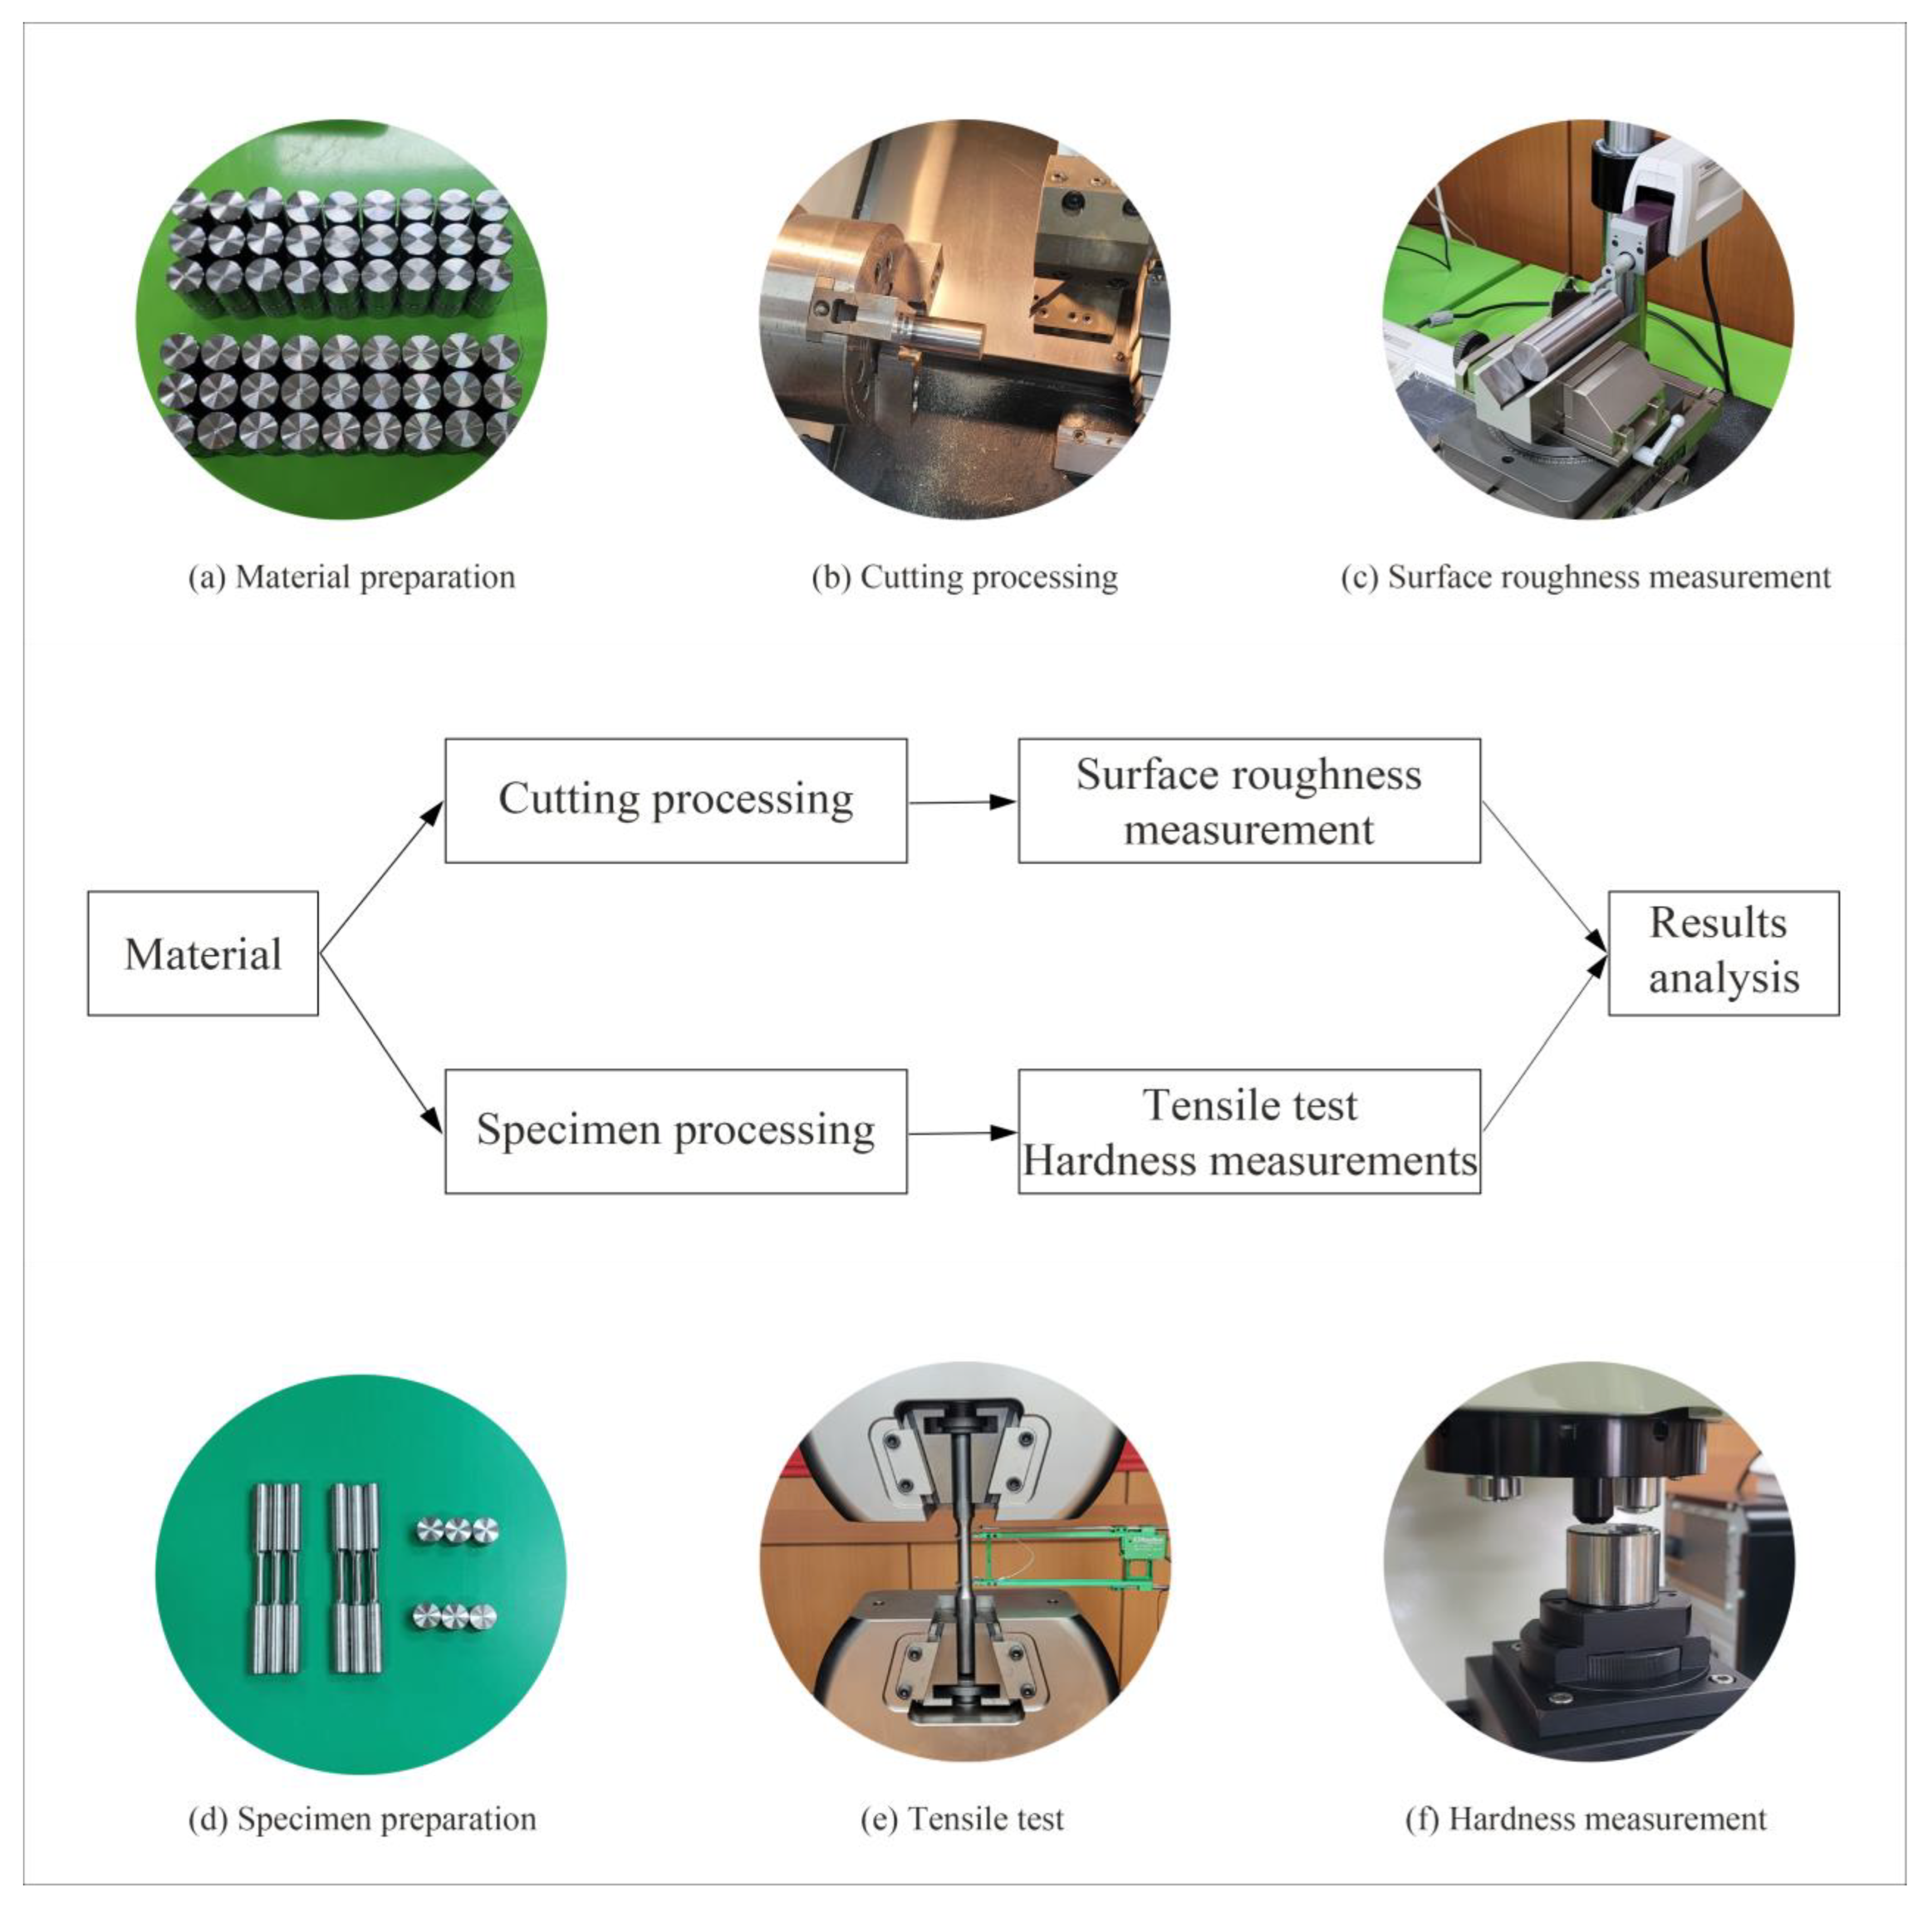
2. Experiment and Methods

The purpose of the experiment in this study is to find optimal cutting conditions by analyzing the effect of mechanical strength on machining quality when cutting CD bars. In this study, test specimens were collected for AISI 1045 and 1020 cold drawn bars, and tensile and hardness tests were performed to confirm the mechanical properties. In addition, cutting conditions were monitored to cut the material to a certain size and shape, and surface roughness was measured to evaluate the quality of the surface after processing. Figure 1 shows the experimental procedure of this study. The results of surface roughness measurement after cutting were compared with the results of strength and hardness measurement after specimen preparation to derive conclusions.

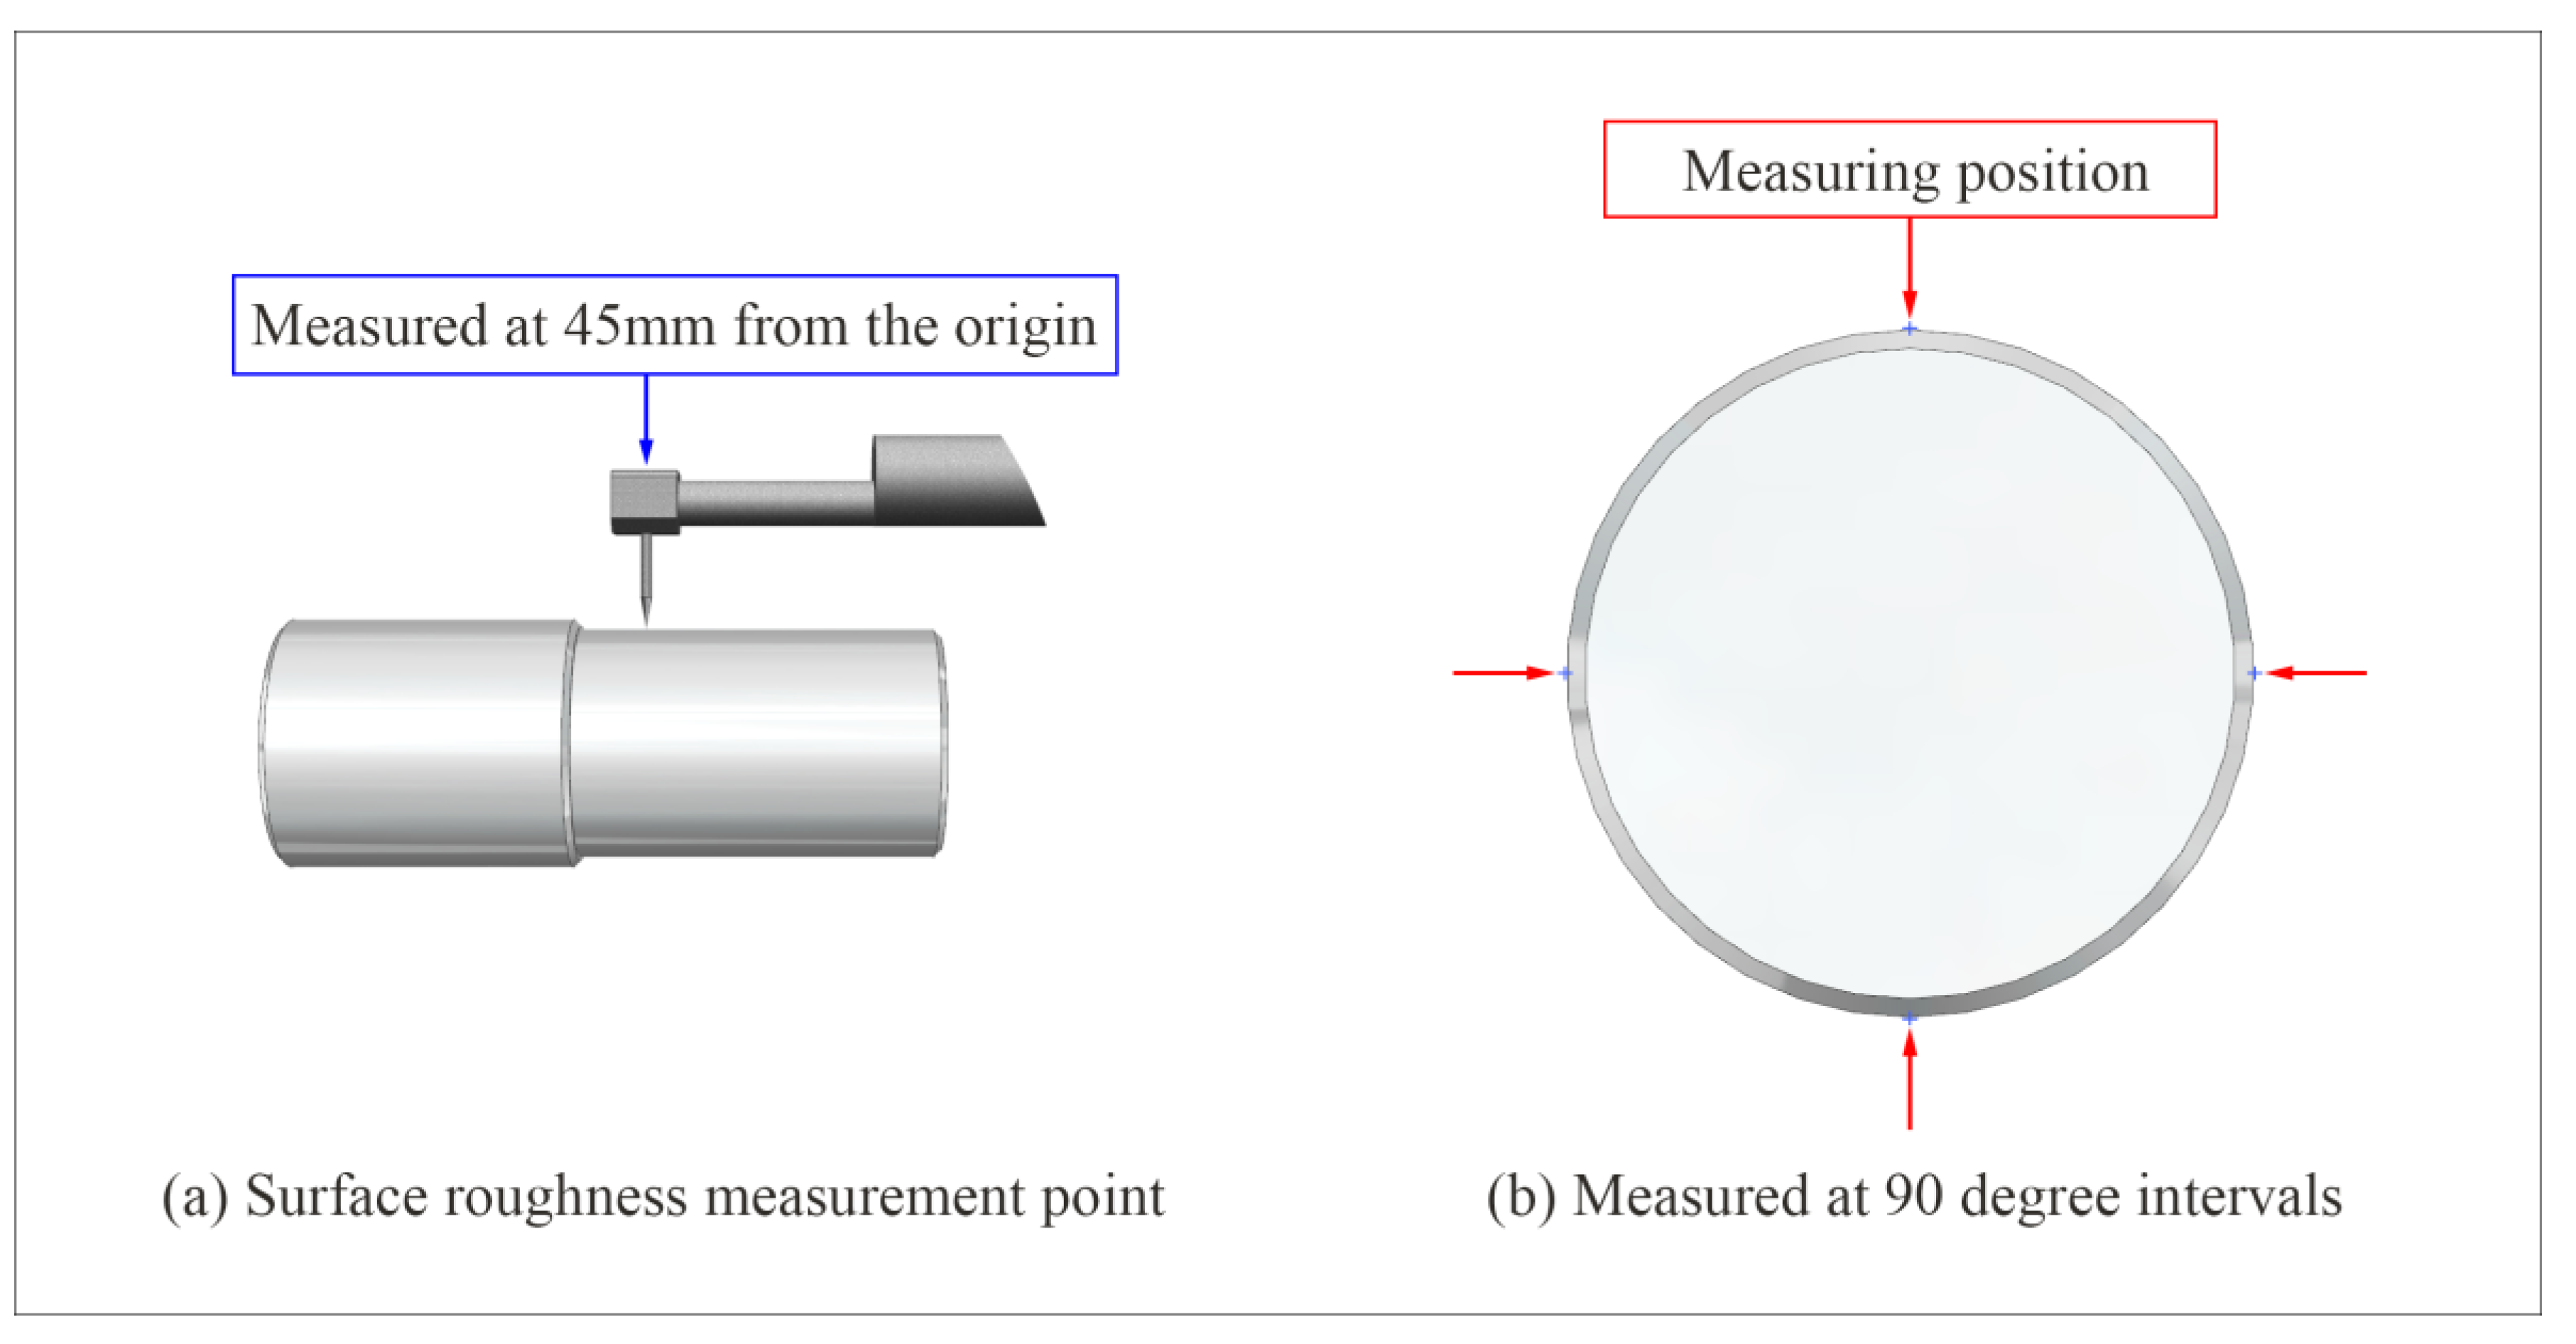
2.1. Workpiece Cutting and Surface Roughness Measurement

In the workpiece cutting task, 54 workpieces of the prepared materials were cut under the cutting conditions for finishing listed in Table 1. The turning insert for finishing was replaced after the machining of one workpiece to minimize tool wear. Figure 1a–c show the experimental process of material preparation for cutting and surface roughness measurement, while Table 2 lists the specifications of the DOOSAN LYNX220 CNC lathe used in the experiment [13].
The tool holder used in the experiment was SVJBR 2525 M16, and VBMT 160404 VF was used as the turning insert [24]. The cutting fluid used in processing is a water-soluble cutting fluid, and is generally used as a general-purpose product with excellent emulsion stability and phase stability at high temperatures through a balanced formulation.
The materials used for cutting were AISI 1020 CD bars with a carbon content of approximately 0.2% and AISI 1045 CD bars with a carbon content of 0.45%. Their chemical compositions are listed in Table 3.
Before machining, the materials had an outer diameter of 37 mm and a length of 102 mm. The target size for finishing after rough machining was an outer diameter of 35 mm. Programming was performed under cutting conditions to meet a cutting section length of 55 mm.
To measure the surface roughness of the cut workpiece, the surface roughness measuring device (Mitutoyo SJ-410) shown in Figure 1c, whose specifications are listed in Table 4, was used.
In this study, the surface roughness of a workpiece was measured four times at 90 ° intervals at 45 mm from the origin, as shown in Figure 2. The diameter of the measurement position is 35 mm, and the sampling length during measurement is 4.0 mm.

2.2. Mechanical Strength and Hardness Measurements

In this study, a tensile test was conducted using a universal testing machine to analyze the mechanical strength and hardness characteristics of the materials used, and a hardness measurement experiment was performed using a Vickers hardness tester.
Figure 1d–f show the procedures for the tensile test and hardness measurement. Table 5 shows the specifications of the universal testing machine (KM&T KUM-9B) used for the experiment, while Table 6 lists the specifications of the Vickers hardness tester (Leeb LHVS-1000Z).
Three samples from each material were taken, and the tensile strength, yield strength, and elongation of each material were analyzed as part of the experiment.
Cylindrical specimens of the materials to be used for the tensile test were prepared according to ASTM E8 [26]. The gauge length of the specimens was 50 mm, the cross-sectional size of the test section was 12.5 mm, the grip diameter was 21 mm, and the total length was 250 mm. To find the yield point, an extensometer was attached to the tensile test specimen as shown in Figure 1e, and a feed rate of 10 mm/min was applied.
In the hardness measurement experiment, three samples were obtained by cutting the processed material into pieces with a diameter of 35 mm and a length of 30 mm, as shown in Figure 3a.
The hardness measurement was performed after treating the surface with 2000-mesh sandpaper. During the hardness measurement, a load of 1000 gf (9.8 N) was applied and the hardness was measured using a 136 ° diamond indenter. As shown in Figure 3b, the hardness was measured at seven measurement positions on a line at 5 mm intervals in the center of the specimen. After the measurement, the area of the indenter was measured using a 40× microscope.

3. Results and Discussion

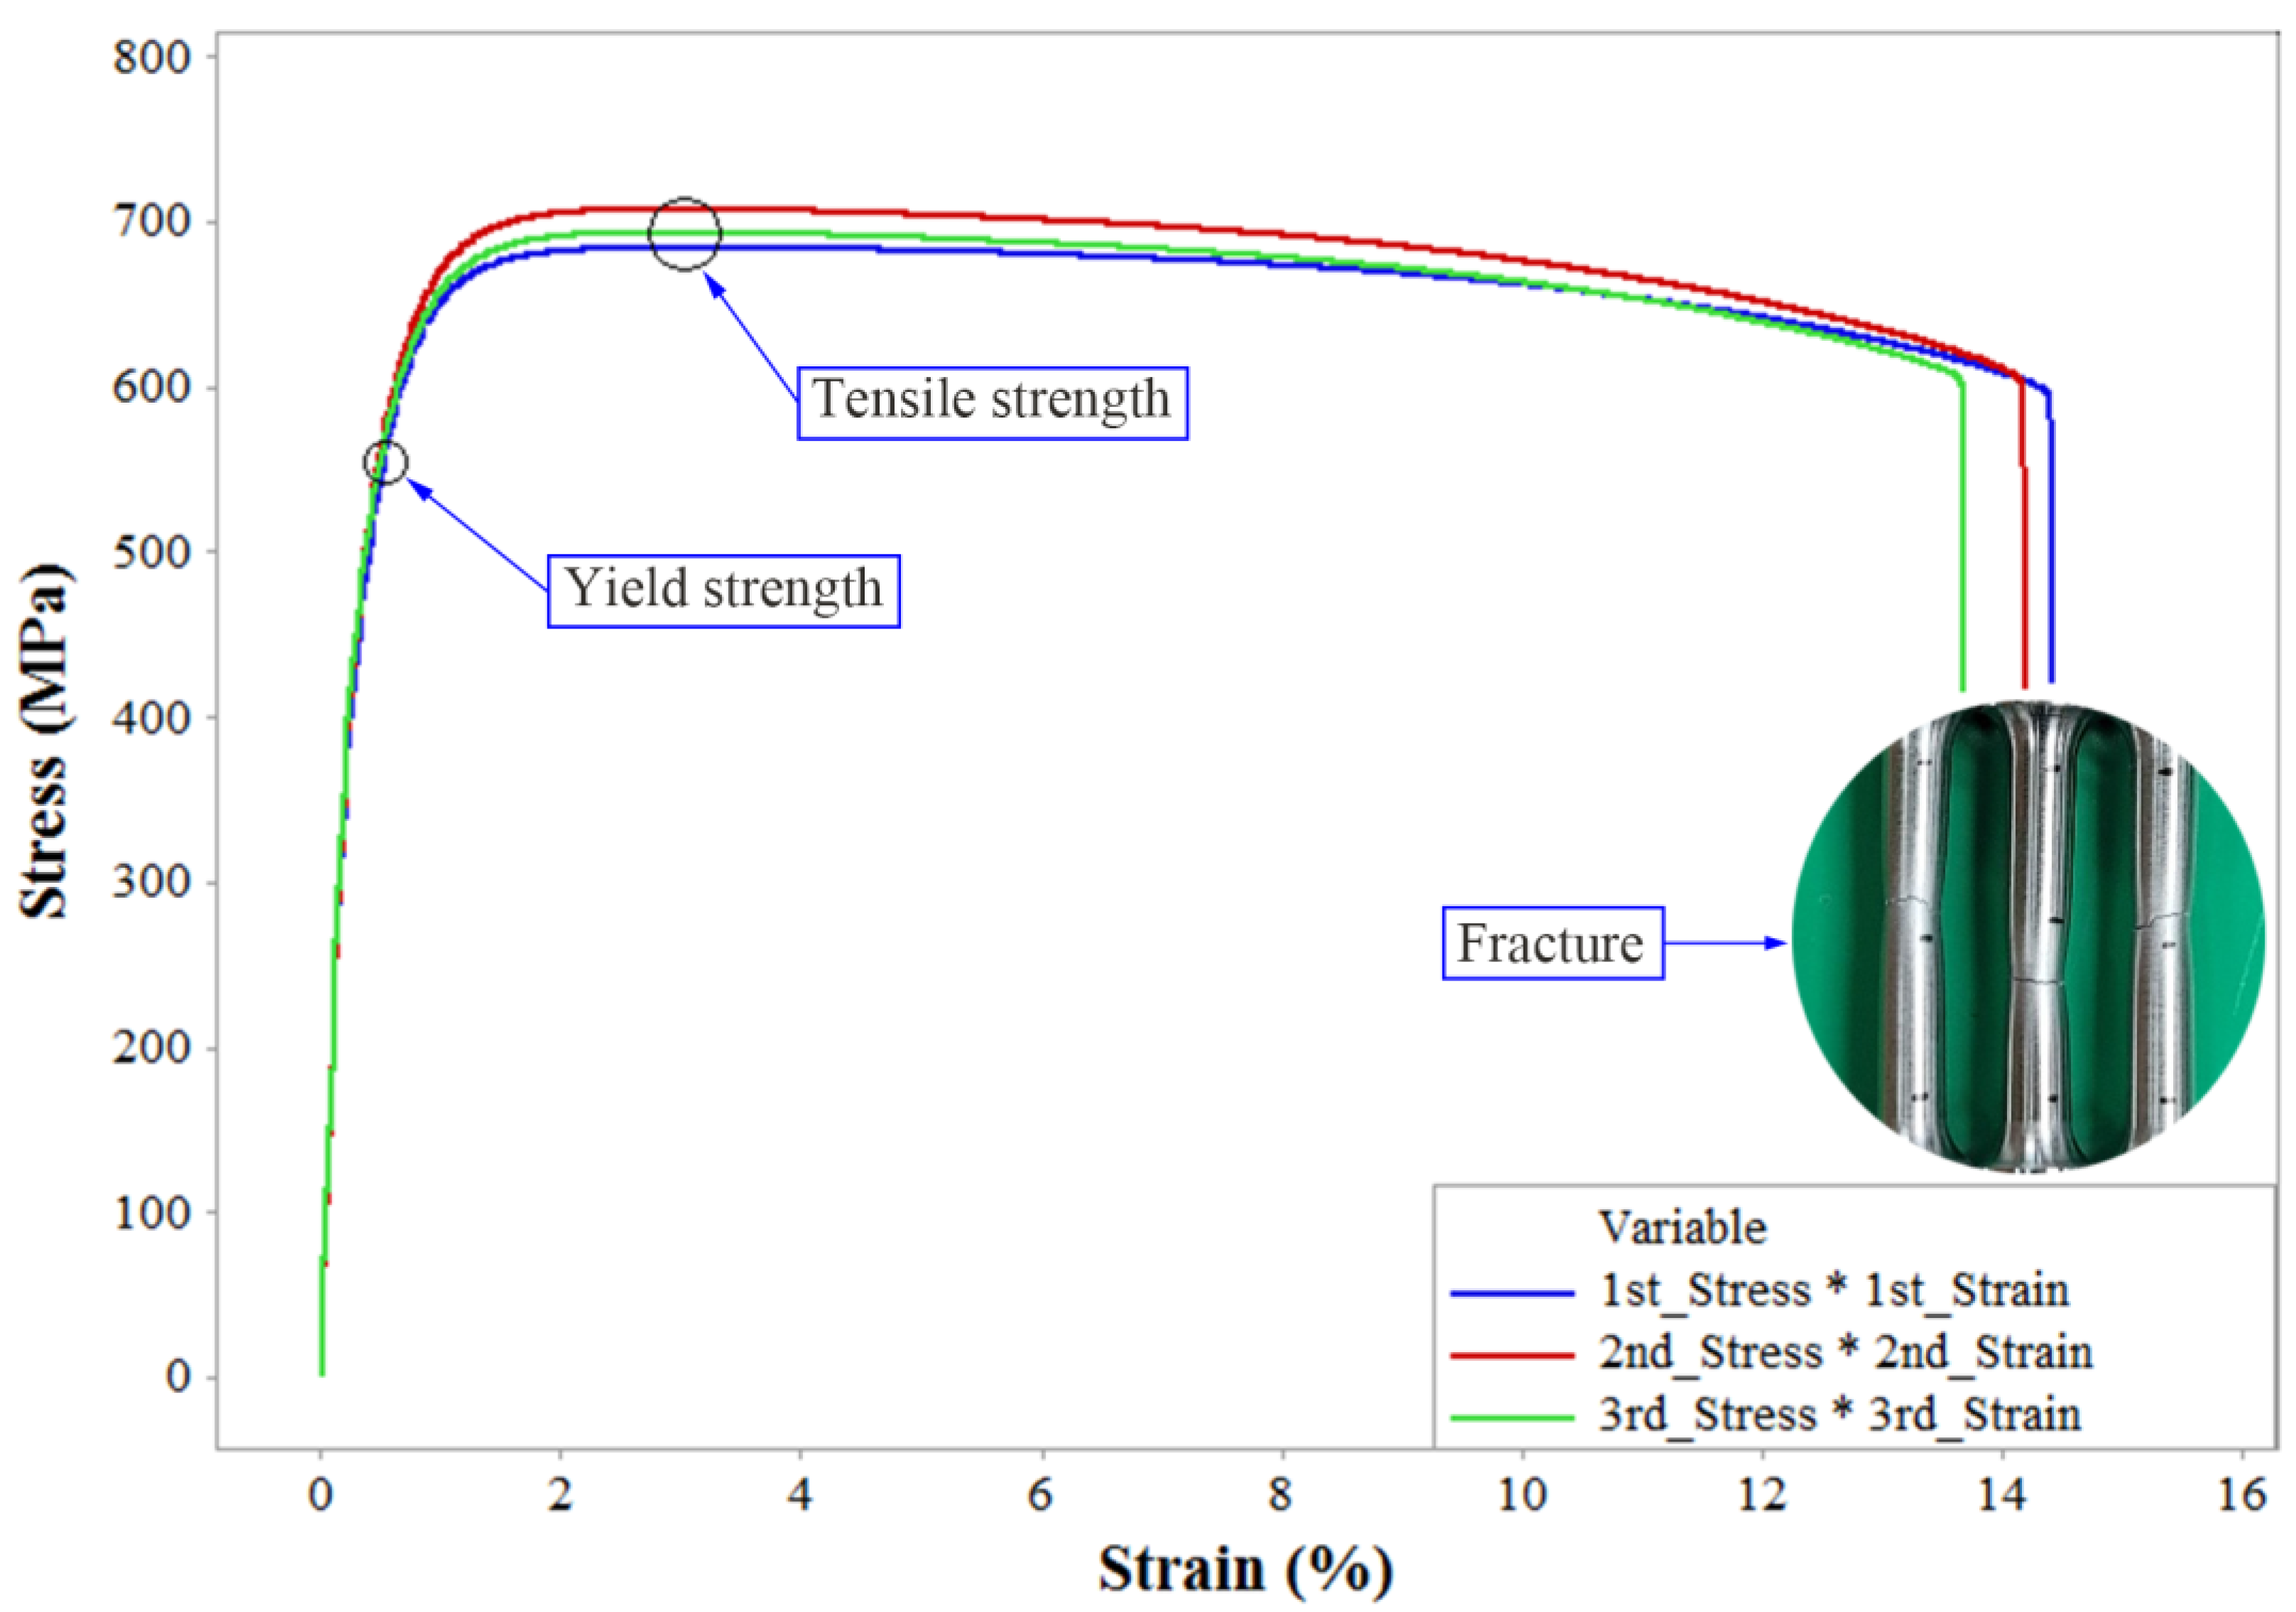
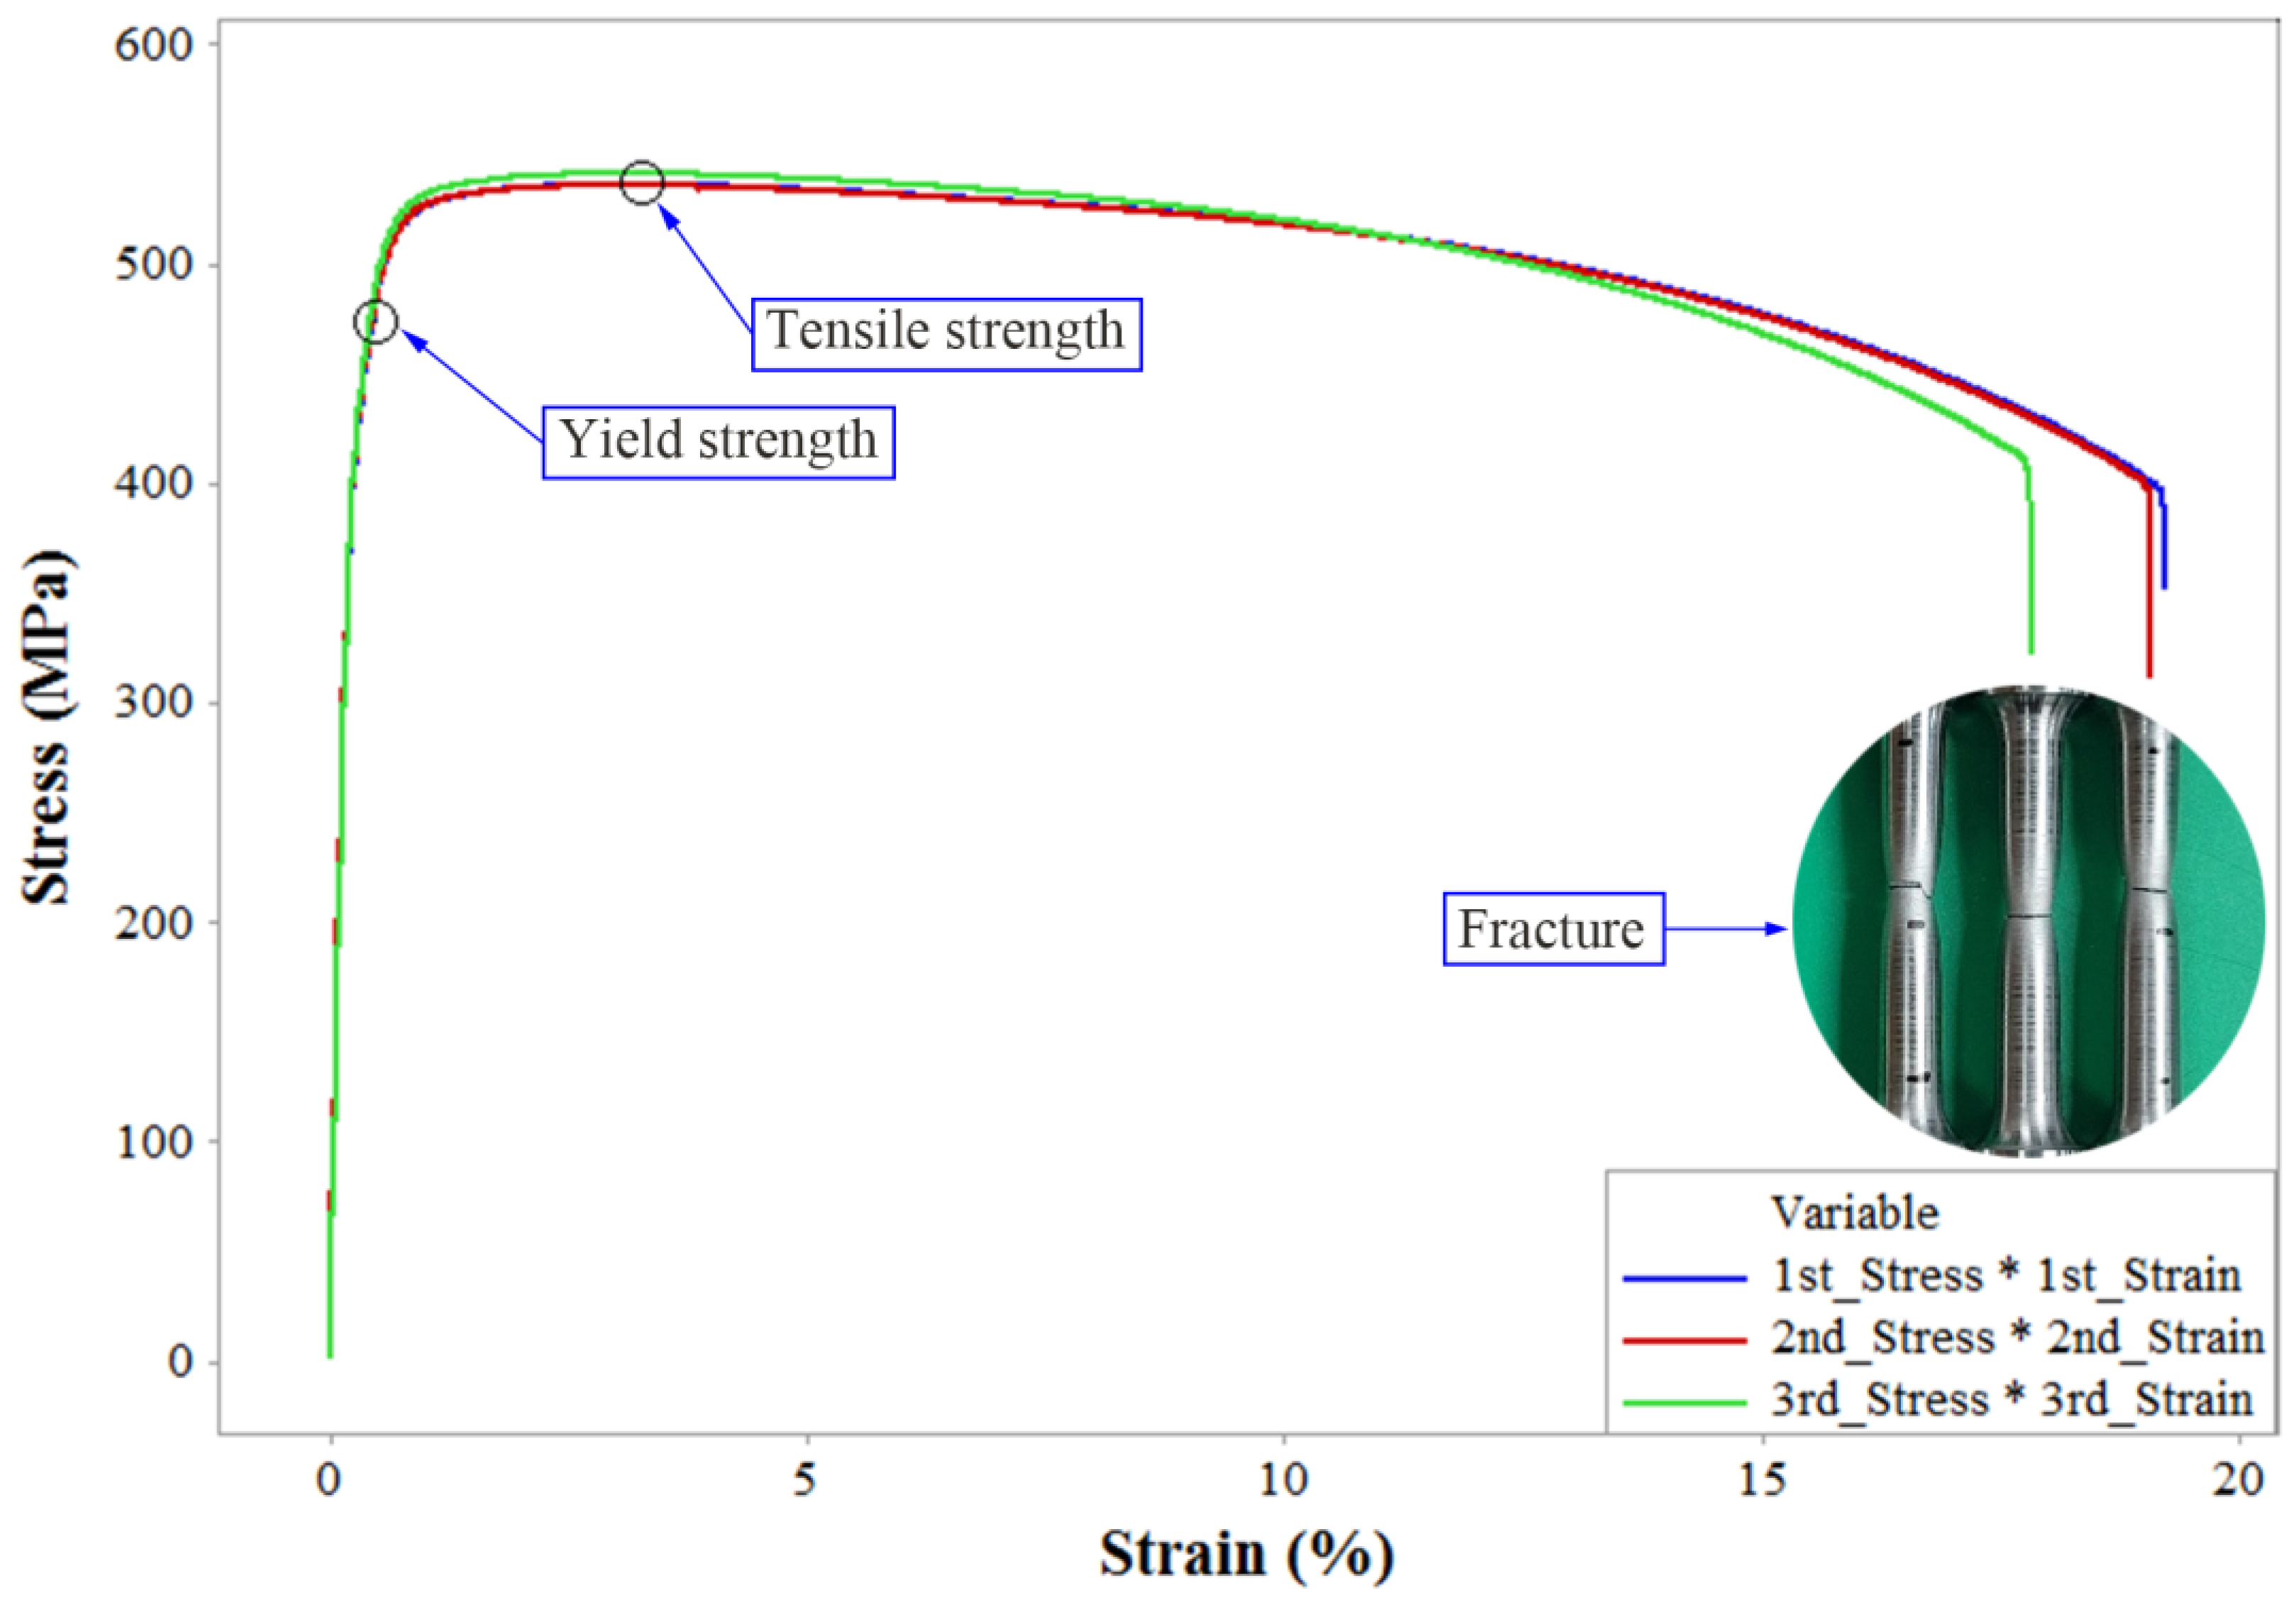
3.1. Analysis of Measured Strength Results

For the tensile test, an extensometer was attached to each specimen to determine the yield strength. Figure 4 and Figure 5 show the stress–strain curves of AISI 1045 and AISI 1020, respectively, which were determined in the tensile test.
As shown in Figure 4, the yield strengths of AISI 1045 for the three samples were 540.73, 557.59, and 553.20 MPa, with a mean value of 550.51 MPa. The tensile strength of the three samples was 684.58, 707.75, and 693.60 MPa, with a mean value of 695.31 MPa. The elongations of the three specimens were 14.42, 14.2, and 13.68%, and the mean value was 14.1%.
The results in Figure 5 show that the yield strengths of AISI 1020 for the three specimens were 474.69, 476.14, and 480.42 MPa, with a mean value of 477.08 MPa. The tensile strengths for the three specimens were 536.13, 535.82, and 541.28 MPa, with a mean value of 537.74 MPa. The elongations of the three specimens were 19.22, 19.08, and 17.82%, and the mean value was 18.7%.
Table 7 shows the arithmetic mean results for the experiment results for the yield strength, tensile strength, and elongation of each material. Compared to AISI 1045, AISI 1020 showed a 13.33% lower yield strength and a 22.66% lower tensile strength. Under the influence of the relatively low strength, it exhibited 32.62% higher elongation.

3.2. Analysis of Measured Hardness Results

Hardness was measured at 5 mm intervals in the center of each specimen. The results are shown in Figure 6a. The measurement results at each measurement position were significantly different between AISI 1045 and AISI 1020. Measured results are shown using interval bars, and the 95% confidence interval for the mean is shown in Figure 6b.
For AISI 1045, the hardness values of the three specimens were 310.0, 310.3, and 305.3 HV, with a mean value of 308.6 HV. For AISI 1020, the hardness values of the three specimens were 195.4, 198.5, and 202.4 HV, and the mean value was 198.8 HV. Compared to AISI 1045, AISI 1020 showed lower hardness values of 36.98, 36.02, and 33.70% for the three specimens and a 35.58% lower value for the arithmetic mean.

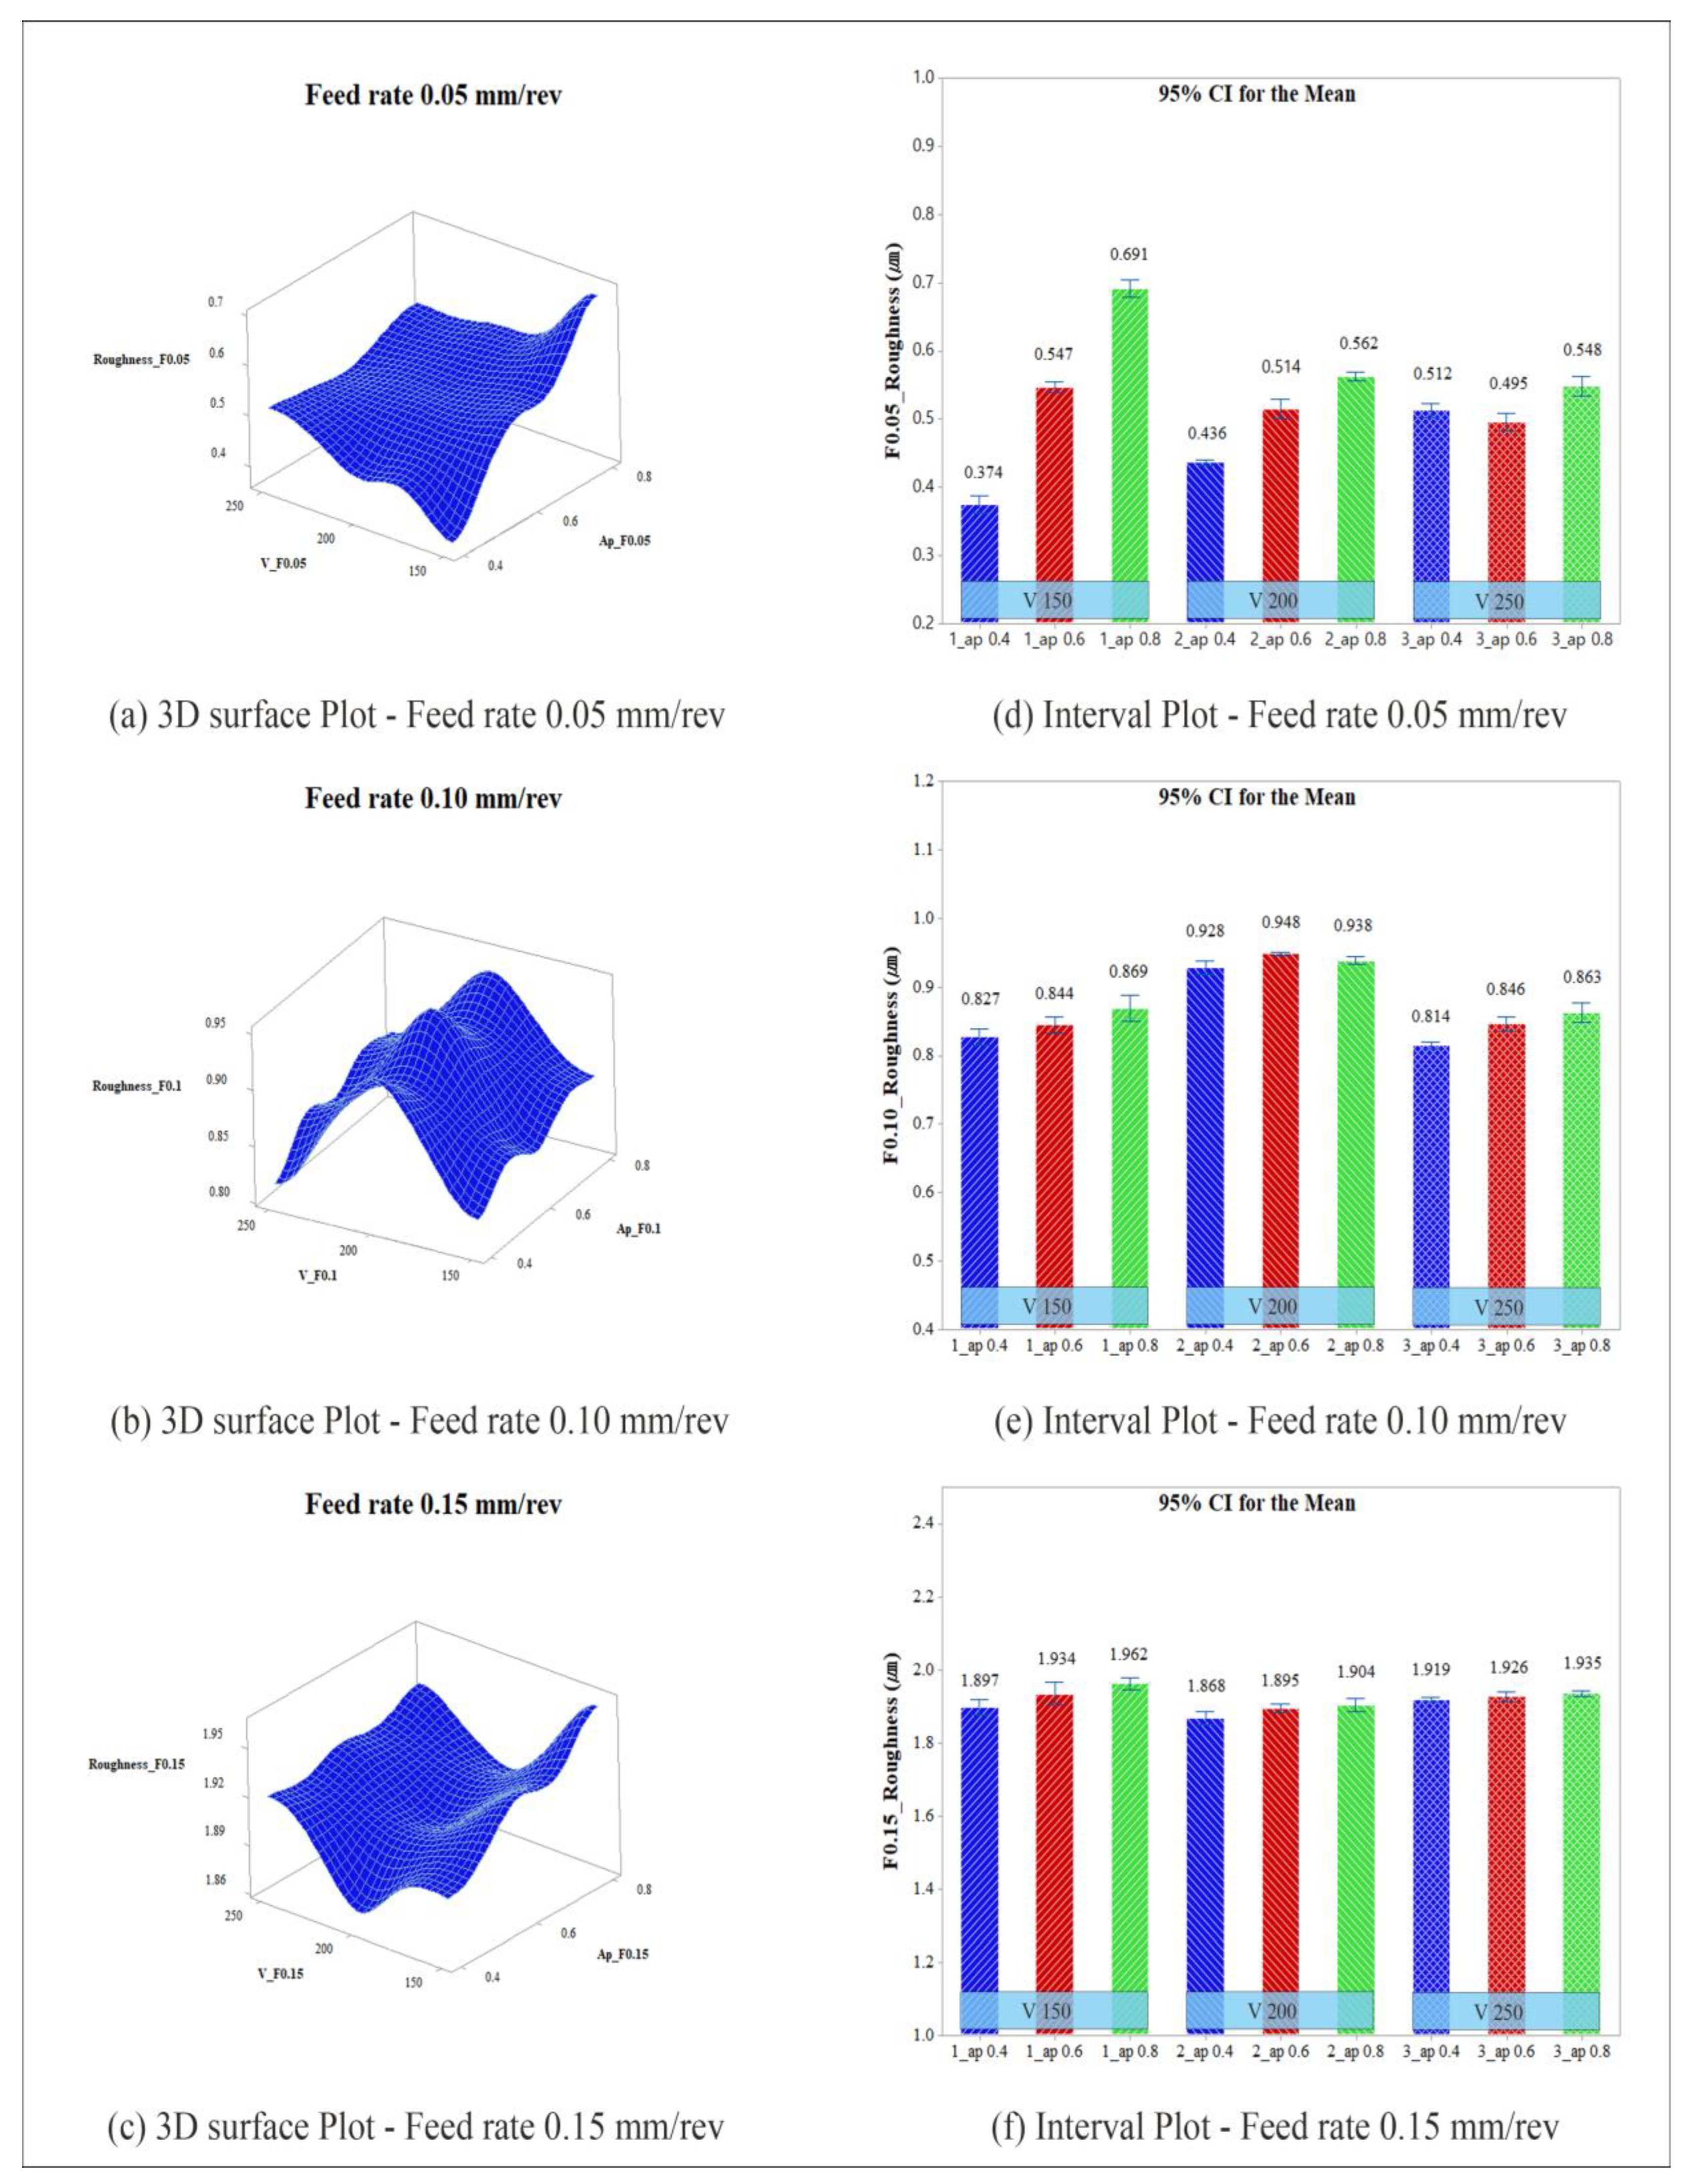
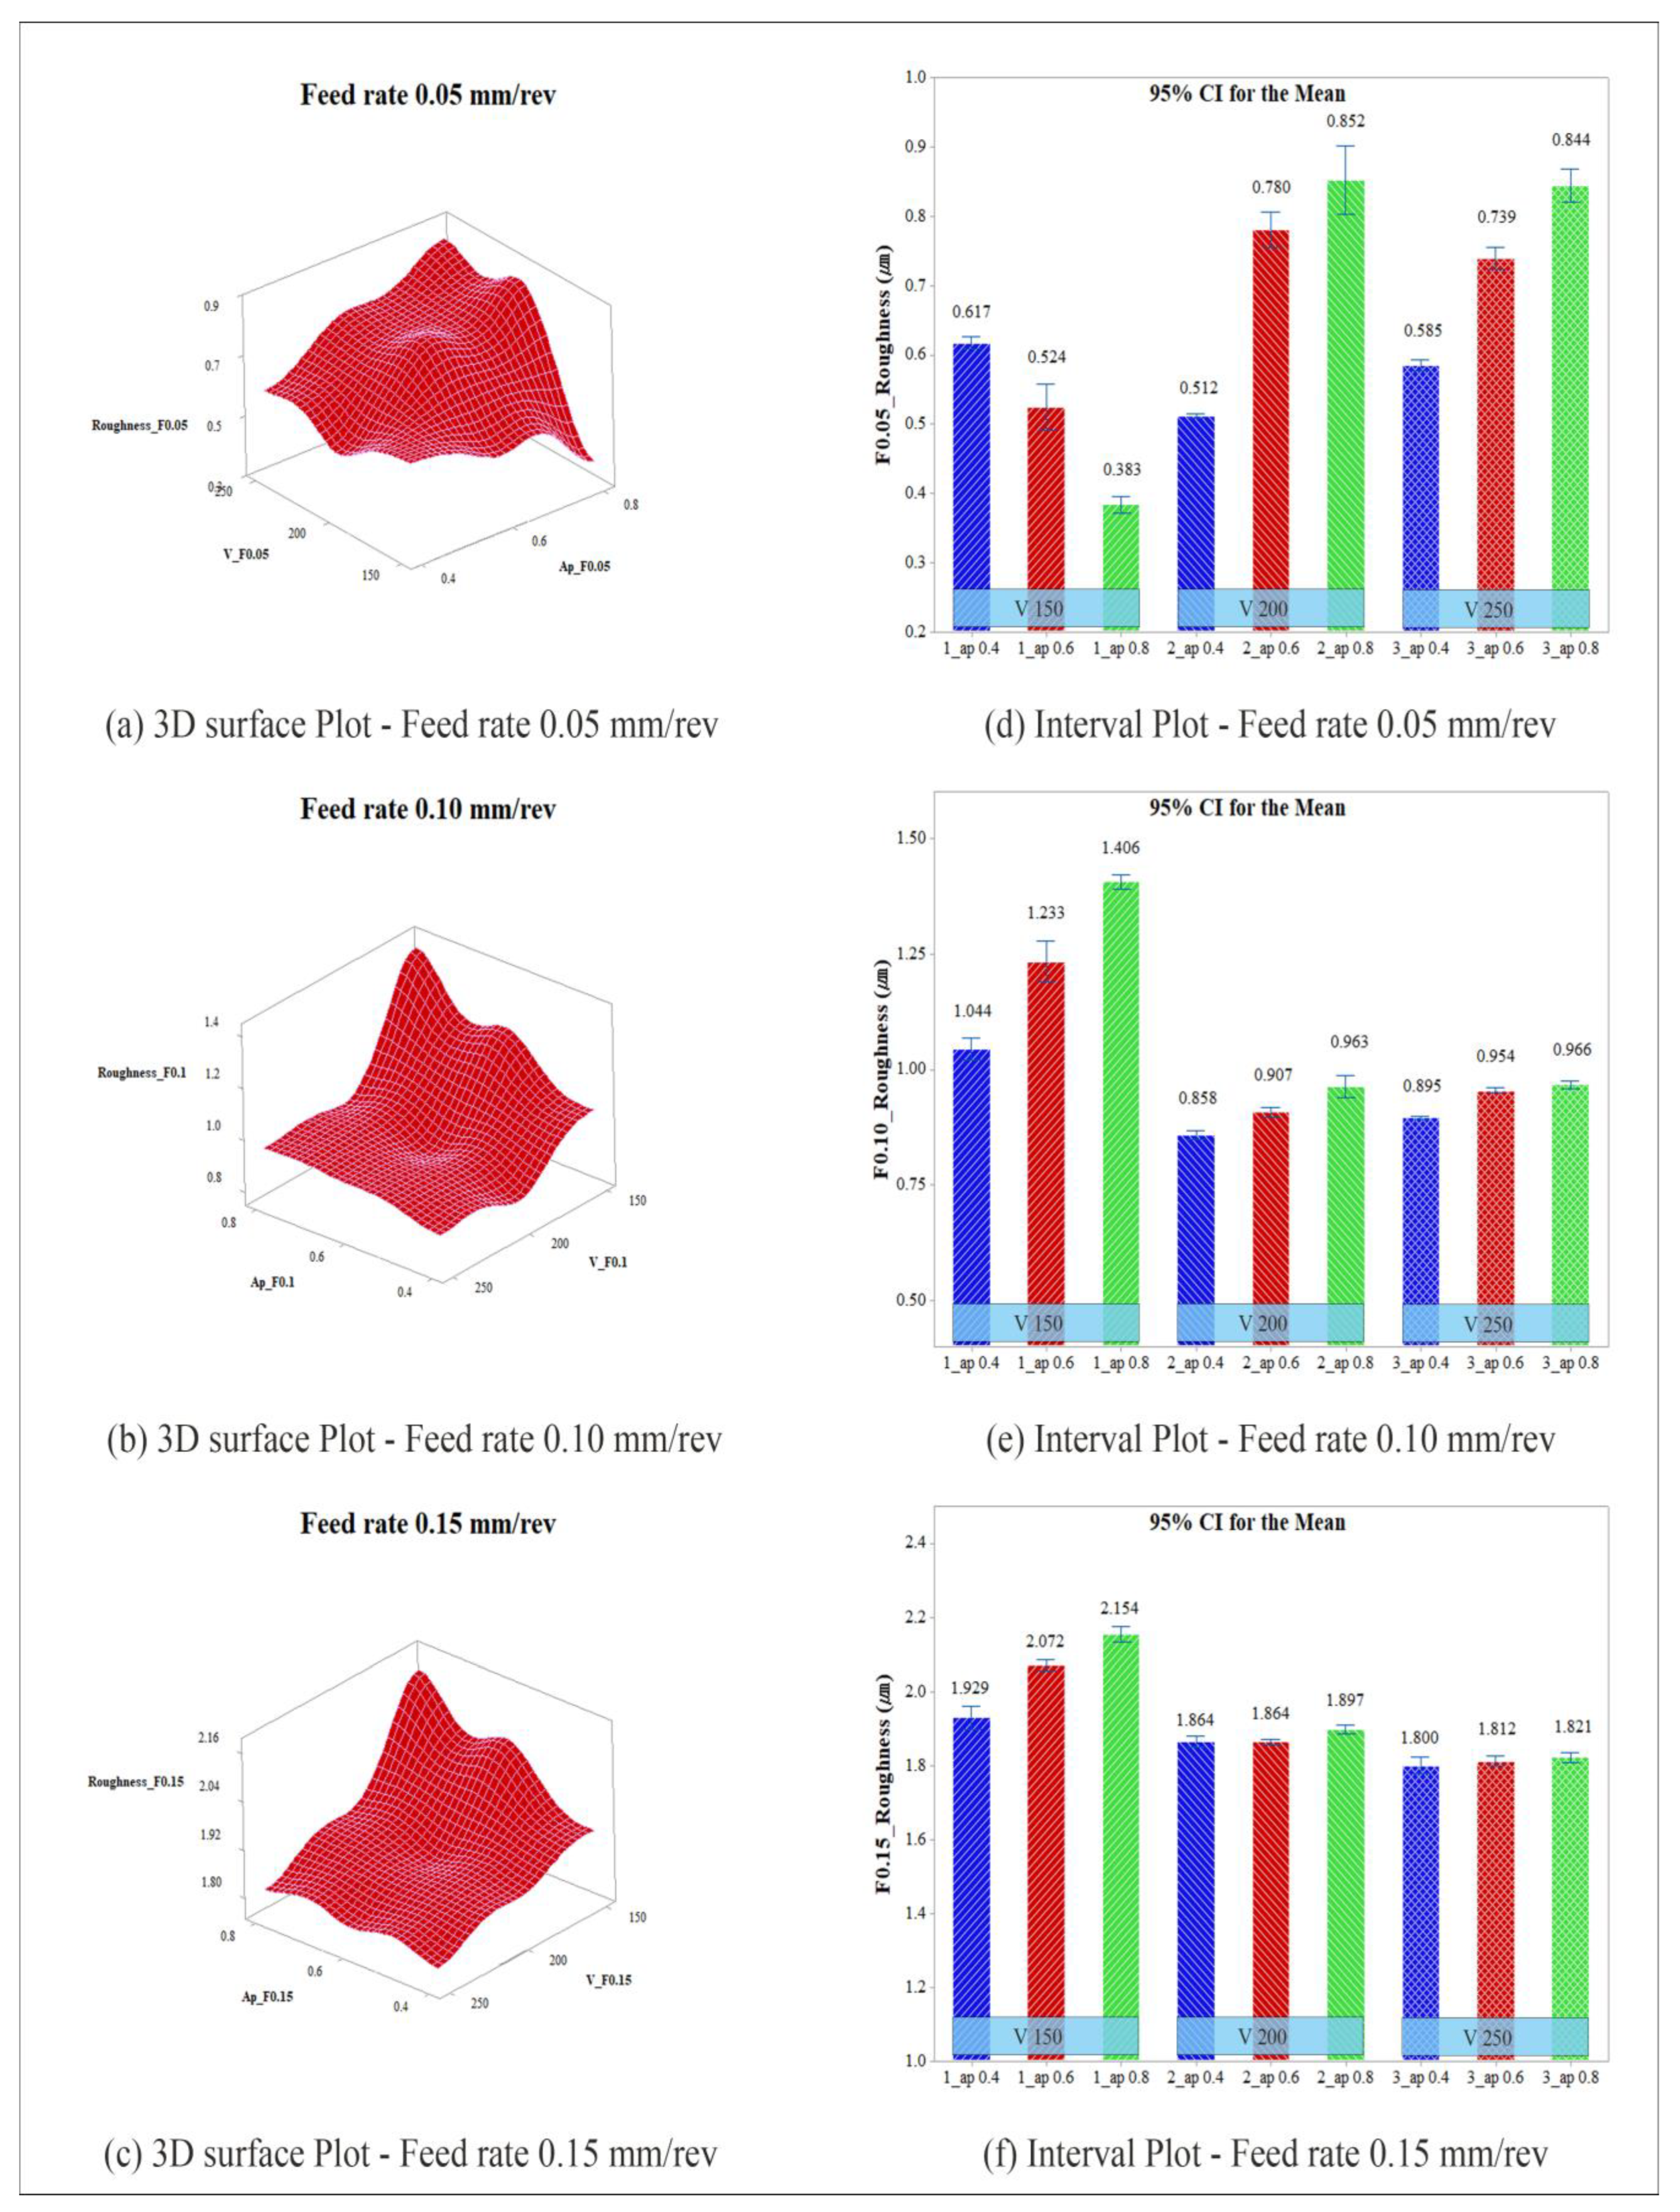
3.3. Analysis of Measured Surface Roughness Results

In general, surface roughness measuring equipment can measure and quantify the fine level of irregularity that may occur after machining, which is an important criterion for machining quality. Therefore, surface roughness varies depending on the characteristics of the materials and tools used for machining, the cutting conditions, and the environment. For machining, the selection of the cutting speed, depth of cut, and feed rate is very important.
In this study, a total of 54 workpieces were subjected to finishing in compliance with the cutting conditions, and the measured surface roughness results are shown in Figure 7 and Figure 8.
Figure 7 shows the results of AISI 1045 and Figure 8 shows the results of AISI 1020. The surface roughness results show the mean values of four measurements, and the arithmetic mean of roughness (Ra), a representative expression method, was used. The 3D surface plot was expressed as an arithmetic mean value using surface roughness, cutting speed, and depth of cut. The interval plot used surface roughness and depth of cut, and the sample size used for one bar was four. Equation (1) is related to the arithmetic mean of roughness [11].
R a = 1 L 0 L f ( x ) d x
Figure 7a,d and Figure 8a,d show the results of cutting each material at a feed rate of 0.05 mm/rev. Surface roughness under each cutting condition can be seen. Due to the lowest feed rate, the highest quality was observed in the measured surface roughness results.
In particular, in Figure 7d the highest machining quality was observed with a minimum surface roughness of approximately 0.374 µm at a cutting speed of 150 m/min and a cutting depth of 0.4 mm. Under the same conditions, however, the quality of the surface roughness decreased with increasing cutting depth. At a cutting depth of 0.8 mm, a low machining quality was observed with a maximum surface roughness of approximately 0.691 µm (84.7% increase).
In contrast, in Figure 8d, the highest machining quality was observed with a minimum surface roughness of approximately 0.383 µm at a cutting speed of 150 m/min and a cutting depth of was 0.8 mm. Under the same cutting conditions, the quality of the surface roughness decreased with decreasing cutting depth. At a cutting speed of 200 m/min and a cutting depth of 0.8 mm, a low machining quality with a maximum surface roughness of approximately 0.852 µm (122.5% increase) was observed.
Therefore, when cutting with a feed rate of 0.05 mm/rev, the best processing quality can be obtained by applying a cutting speed of 150 m/min. For a material with high ductility, it is possible to achieve a high machining quality by reducing the thickness ratio of generated chips by applying a high depth of cut. Alternatively, for a material with low ductility, it is possible to achieve a high machining quality by increasing the thickness ratio of generated chips by applying a low depth of cut.
Figure 7b,e and Figure 8b,e show the results of cutting each material at a feed rate of 0.10 mm/rev. Surface roughness under each cutting condition can be seen. Due to the increased feed rate, the measured surface roughness values generally increased.
In Figure 7e, high machining quality was observed with a surface roughness of approximately 0.814 µm at a cutting speed of 250 m/min and a cutting depth of 0.4 mm. At a cutting speed of 200 m/min and cutting depth of 0.6 mm, low machining quality with a 16.5% increased surface roughness of 0.948 µm was observed. Overall, surface roughness quality decreased with increasing cutting depth.
In Figure 8e, a high machining quality with a surface roughness of approximately 0.858 µm was observed at a cutting speed of 200 m/min and a cutting depth of 0.4 mm. At a cutting speed of 150 m/min and a cutting depth of 0.8 mm, a low machining quality with a 63.9% increase in surface roughness of 1.406 µm was observed. When the cutting depth was increased at cutting speeds of 200 and 250 m/min, the overall surface roughness quality decreased slightly, by approximately 4 to 13%. However, at a cutting speed of 150 m/min, a relatively large difference of approximately 63.8% occurred.
Therefore, when cutting with a feed rate of 0.10 mm/rev, set a cutting speed of 200 or 250 m/min depending on the material. And if you apply the tool depth of cut corresponding to the nose radius (0.4 mm), excellent surface roughness can be obtained. In particular, in the case of AISI 1020 material, which has relatively low strength, the greatest surface roughness resulted at a cutting speed of 150 m/min and a feed rate of 0.10 mm/rev, and it was confirmed that this was a very unsuitable cutting condition.
Figure 7c,f and Figure 8c,f show the results of cutting each material at a feed rate of 0.15 mm/rev. The surface roughness under each cutting condition can be seen. With the highest feed rate, the measured surface roughness values also increased significantly.
In Figure 7f, a cutting speed of 200 m/min, and a depth of cut of 0.4 mm resulted in a surface roughness of 1.868 µm, showing excellent machining quality under the same conditions. At a cutting speed of 150 m/min and a cutting depth of 0.8 mm, a low machining quality with a 5.0% increase in surface roughness of 1.962 µm was observed. Overall, the surface roughness quality decreased slightly by approximately 1.4 to 5.0% with increasing depth of cut. Considering the productivity aspect at a feed rate of 0.15 mm/rev, the surface roughness result increased by 2.73%; however, it is more efficient to select a cutting speed of 250 m/min.
In Figure 8f, a cutting speed of 250 m/min and a depth of cut of 0.4 mm resulted in a surface roughness of 1.801 µm, showing excellent machining quality under the same conditions. At a cutting speed of 150 m/min and a cutting depth of 0.8 mm, a low machining quality was observed, with a 19.6% increase in surface roughness to 2.154 µm. Overall, the surface roughness quality decreased by approximately 0.67 to 19.6% with increasing depth of cut.
Therefore, when cutting with a feed rate of 0.15 mm/rev, set a cutting speed of 200 or 250 m/min, depending on the material. And if you apply the tool depth of cut corresponding to the nose radius (0.4 mm), excellent surface roughness can be obtained.
In particular, in the case of AISI 1020 material, which has relatively low strength, the greatest surface roughness resulted at a cutting speed of 150 m/min and a feed rate of 0.15 mm/rev, and it was confirmed that this was a very unsuitable cutting condition.
After finishing AISI 1045 and AISI 1020 under the same cutting conditions based on the experiment results, the measured surface roughness results were compared and analyzed. Basically, the results need to be examined in terms of machining quality, efficiency, and productivity.
Therefore, if machining quality is the top priority, it is necessary to apply a low feed rate of 0.05 mm/rev and a low cutting speed of approximately 150 m/min. It is very important to vary the depth of cut, taking into account the strength, hardness, and elongation of the material. For AISI 1045 with relatively high strength and low elongation, excellent surface roughness can be achieved by applying the same depth of cut as for a turning insert nose R size of 0.4 mm. For AISI 1020 with relatively low strength and high elongation, excellent surface roughness can be achieved when the depth of cut is 0.8 mm, which is larger than the size of the turning insert nose R.
For a slight increase in productivity, it is necessary to increase the cutting speed to approximately 250 m/min and apply the same cutting depth as the size of the turning insert nose R. In this way, an excellent surface roughness can be achieved compared to the high production speed.
To simultaneously achieve high machining quality and productivity, it is advisable to use a feed rate of roughly 0.1 mm/rev. Increasing the feed rate will result in a drop in surface roughness quality, but it allows for good machining quality to be achieved when compared to high production speeds. However, tool wear must be considered from a perspective of production efficiency.
Finally, a feed rate of 0.15 mm/rev is a very inefficient cutting condition. Basically, the quality of cutting surface roughness severely deteriorates as the feed rate increases. This is because the result of surface roughness is the quality of the cutting surface that can be sufficiently achieved with the turning inserts used for rough machining or semi-finishing. It is also a cutting condition with very low production efficiency, as tool wear is also accelerated very quickly despite the very high production speed.
Therefore, through the results of this experiment, optimal cutting conditions were obtained, as shown in Table 8. From these results, feed rates of 0.05 and 0.1 mm/rev were able to obtain excellent surface roughness suitable for the purpose of finishing machining.
Since the feed rate F 0.15 mm/rev is not suitable for finishing machining, it would be more efficient to process it using a roughing tool.

4. Conclusions

In this study, a tensile test, a hardness measurement, and a measurement of surface roughness after finishing were performed to analyze the effects of strength and elongation of AISI 1045 and AISI 1020 cold-drawn (CD) bars on machining characteristics. The results of this study can be summarized as follows.
The results of the tensile test show that AISI 1045 CD bars have an average yield strength of 550.51 MPa and an average tensile strength of 695.31 MPa. In contrast, AISI 1020 CD bars exhibited a 13.33% lower average yield strength of 477.08 MPa and a 22.66% lower average tensile strength of 537.74 MPa. Therefore, under the influence of relatively low strength, AISI 1020 showed a 32.62% higher elongation than AISI 1045.
For the Vickers hardness measurement results, AISI 1045 exhibited 308.6 HV on average, while AISI 1020 showed a 35.57% lower hardness value of 198.8 HV on average. It was possible to confirm the mechanical strength and hardness characteristics of each material.
From the results of the surface roughness measurement after finishing, different results were observed depending on strength and elongation at a feed rate of 0.05 mm/rev. AISI 1045, which exhibited relatively high strength and stiffness at low elongation, exhibited the highest machining quality, with a surface roughness of approximately 0.374 µm when the cutting speed was 150 m/min and the cutting depth was 0.4 mm, at a feed rate of 0.05 mm/rev. In contrast, AISI 1020, which had relatively low strength and hardness with high elongation, exhibited the highest machining quality, with a roughness of approximately 0.383 µm at a cutting speed of 150 m/min and a cutting depth of 0.8 mm and at a feed rate of 0.05 mm/rev. This confirmed that the cutting conditions that are significantly affected by the strength, hardness, and elongation of the material are the low-speed feed rate and the cutting speed. In addition, the depth of cut is most significantly affected by these factors.
If the production speed at relatively high surface roughness is important, the cutting speed can be increased to approximately 250 m/min. Applying the depth of cut at the same level as the turning insert nose R size can satisfy both production speed and high surface roughness.

Author Contributions

Conceptualization, I.-S.K.; methodology, T.-H.L.; validation, I.-S.K. and T.-H.L.; formal analysis, I.-S.K.; investigation, I.-S.K.; resources, I.-S.K.; writing—original draft preparation, I.-S.K.; writing—review and editing, I.-S.K.; visualization, I.-S.K.; supervision, T.-H.L.; project administration, I.-S.K.; funding acquisition, I.-S.K. All authors have read and agreed to the published version of the manuscript.

Funding

This research received no external funding.

Data Availability Statement

Data are contained within the article.

Conflicts of Interest

The authors declare no conflicts of interest.

References

  1. Sivalingam, V.; Zhou, Q.; Ross, N.S.; Tiwari, S.; Selvam, B.; Sun, J.; Gupta, M.K. Identification of tool wear and surface morphology measurements in sustainable milling of Al 6082 hybrid metal matrix composite. J. Mater. Res. Technol. 2023, 27, 7570–7581. [Google Scholar] [CrossRef]
  2. Zhou, K.; Zhang, C.; Du, S. Cutting Force Prediction for Trochoid Milling of 300M Ultra-High Strength Steel. Processes 2022, 10, 2617. [Google Scholar] [CrossRef]
  3. Rafanelli, F.; Campatelli, G.; Scippa, A. Effects of cutting conditions on forces and force coefficients in plunge milling operations. Adv. Mech. Eng. 2015, 7, 1687814015589547. [Google Scholar] [CrossRef]
  4. You, S.H.; Lee, J.H.; Oh, S.H. A study on cutting characteristics in turning operations of titanium alloy used in automobile. Int. J. Precis. Eng. Manuf. 2019, 20, 209–216. [Google Scholar] [CrossRef]
  5. Lee, J.H.; Ge, J.C.; Song, J.H. Study on Burr Formation and Tool Wear in Drilling CFRP and Its Hybrid Composites. Appl. Sci. 2021, 11, 384. [Google Scholar] [CrossRef]
  6. Petropoulos, P.G. The effect of feed rate and of tool nose radius on the roughness of oblique finish turned surfaces. Wear 1973, 23, 299–310. [Google Scholar] [CrossRef]
  7. Shouckry, A.S. The effect of cutting conditions on dimensional accuracy. Wear 1982, 80, 197–205. [Google Scholar] [CrossRef]
  8. Maruda, R.W.; Szczotkarz, N.; Michalski, M.; Arkusz, K.; Wojciechowski, S.; Niesłony, P.; Khanna, N.; Królczyk, G.M. Evaluation of tool wear during turning of Ti6Al4V alloy applying MQL technique with Cu nanoparticles diversified in terms of size. Wear 2023, 532, 205111. [Google Scholar] [CrossRef]
  9. Yin, G.; Shen, J.; Wu, Z.; Wu, X.; Jiang, F. Experimental Investigation on the Machinability of PCBN Chamfered Tool in Dry Turning of Gray Cast Iron. Processes 2022, 10, 1547. [Google Scholar] [CrossRef]
  10. Chen, Z.; Ding, F.; Zhang, Z.; Gu, D.; Liao, Q.; Chen, M.; Wang, B. The study on the effect of various tool wear indicators on the machining of MMCs. J. Mater. Res. Technol. 2024, 30, 231–244. [Google Scholar] [CrossRef]
  11. Grzesik, W.; Kiszka, P.; Kowalczyk, D.; Rech, J.; Claudin, C. Machining of nodular cast iron (PF-NCI) using CBN tools. Procedia CIRP 2012, 1, 483–487. [Google Scholar] [CrossRef]
  12. Leksycki, K.; Maruda, R.W.; Feldshtein, E.; Wojciechowski, S.; Habrat, W.; Gupta, M.K.; Królczyk, G.M. Evaluation of tribological interactions and machinability of Ti6Al4V alloy during finish turning under different cooling conditions. Tribol. Int. 2023, 189, 109002. [Google Scholar] [CrossRef]
  13. Kang, I.S.; Lee, T.H. Effect of Changing Belt Tension on Machining Surface of CNC Lathe Spindle. Processes 2023, 11, 1079. [Google Scholar] [CrossRef]
  14. Bouzid, L.; Yallese, M.A.; Chaoui, K.; Mabrouki, T.; Boulanouar, L. Mathematical modeling for turning on AISI 420 stainless steel using surface response methodology. Proc. Inst. Mech. Eng. Part B J. Eng. Manufact. 2015, 229, 45–61. [Google Scholar] [CrossRef]
  15. Wang, R.; Yang, D.; Wang, W.; Wei, F.; Lu, Y.; Li, Y. Tool wear in nickel-based superalloy machining: An overview. Processes 2022, 10, 2380. [Google Scholar] [CrossRef]
  16. Aich, Z.; Haddouche, K.; Djellouli, K.; Ghezal, A. An improved thermomechanical modeling for orthogonal cutting of AISI 1045 steel. Results Eng. 2023, 17, 100789. [Google Scholar] [CrossRef]
  17. Bombiński, S.; Kossakowska, J.; Jemielniak, K. Detection of accelerated tool wear in turning. Mech. Syst. Signal Process 2022, 162, 108021. [Google Scholar] [CrossRef]
  18. Bilgili, D.; Kecibas, G.; Besirova, C.; Chehrehzad, M.R.; Burun, G.; Pehlivan, T.; Uresin, U.; Emekli, E.; Lazoglu, I. Tool flank wear prediction using high-frequency machine data from industrial edge device. Procedia CIRP 2023, 118, 483–488. [Google Scholar] [CrossRef]
  19. Abouelatta, O.B.; Madl, J. Surface roughness prediction based on cutting parameters and tool vibrations in turning operations. J. Mater. Process Technol. 2001, 118, 269–277. [Google Scholar] [CrossRef]
  20. Kiyak, M.; Kaner, B. Determination of the actual deflection of the cutting tool ın turning by the Castigliano theorem. J. Radiat. Res. Appl. Sci. 2023, 16, 100744. [Google Scholar] [CrossRef]
  21. Ham, G.S.; Kreethi, R.; Kim, H.J.; Yoon, S.H.; Lee, K.A. Effects of different HVOF thermal sprayed cermet coatings on tensile and fatigue properties of AISI 1045 steel. J. Mater. Process Technol. 2021, 15, 6647–6658. [Google Scholar] [CrossRef]
  22. Almaraz, G.D.; Vilchez, J.R.; Dominguez, A. Ultrasonic fatigue on the automotive steels: AISI/SAE 4140T and 1045. Procedia Struct. Integr. 2019, 18, 594–599. [Google Scholar] [CrossRef]
  23. Selçuk, B.; Ipek, R.; Karamış, M.B. A study on friction and wear behaviour of carburized, carbonitrided and borided AISI 1020 and 5115 steels. J. Mater. Process Technol. 2003, 141, 189–196. [Google Scholar] [CrossRef]
  24. Kang, I.S.; Lee, T.H. Effect of Cutting Conditions on the Cutting Surface when Cutting AISI 1020 CD-Bar. Korean Soc. Mech. Technol. 2023, 25, 308–315. [Google Scholar]
  25. Munoz-Escalona, P.; Cassier, Z. Influence of the critical cutting speed on the surface finish of turned steel. Wear 1998, 218, 103–109. [Google Scholar] [CrossRef]
  26. ASTM E8/E8M-11; Standard Test Methods for Tension Testing of Metallic Materials. ASTM International: West Conshohocken, PA, USA, 2011.
Figure 1. Schematic representation of the experimental procedures for cutting and strength measurements. (a) Process of material preparation; (b) process of cutting the prepared material; (c) process of measuring surface roughness after cutting processing; (d) preparation of specimens for tensile and hardness tests; (e) tensile test after attaching an extensometer to the specimen; (f) Vickers hardness measurement on the prepared specimen surfaces.
Processes 12 01171 g001
Figure 2. Schematic representation of the measuring points and methods for surface roughness. (a) Measuring point for surface roughness; (b) surface roughness measured at 90-degree intervals.
Processes 12 01171 g002
Figure 3. Schematic representation of specimen collection and hardness measurement method. (a) Cutting of specimens from machined materials; (b) hardness measurement points and intervals.
Processes 12 01171 g003
Figure 4. Stress–strain curve of AISI 1045, determined in the tensile test.
Processes 12 01171 g004
Figure 5. Stress–strain curve of AISI 1020, determined in the tensile test.
Processes 12 01171 g005
Figure 6. Vickers hardness results measured at each measurement position. (a) Vickers hardness results measured through each experiment; (b) interval plot using measured Vickers hardness results.
Processes 12 01171 g006
Figure 7. Surface roughness results measured after cutting AISI 1045; (ac) are 3D surface plot results and (df) are interval plot results.
Processes 12 01171 g007
Figure 8. Surface roughness results measured after cutting AISI 1020; (ac) are 3D surface plot results and (df) are interval plot results.
Processes 12 01171 g008
Table 1. Cutting conditions used in the experiment.
DescriptionSpecification
Cutting speed150 m/min (low speed)
200 m/min (medium speed)
250 m/min (high speed)
Depth of cut0.4, 0.6, and 0.8 mm
Feed rate0.05 mm/rev (low speed)
0.1 mm/rev (medium speed)
0.15 mm/rev (high speed)
Table 5. Specifications of the universal testing machine used in the experiment.
DescriptionSpecification
Max. Loading Capacity500 kN
Resolution0.01%
Cross Head Speed 0.01–500.00 mm/min
Driving SystemAC Servo Motor
Table 6. Specifications of the micro-Vickers hardness tester used in the experiment.
DescriptionSpecification
Test force 10, 25, 50, 100, 200, 300, 500 and 1000 gf
Min. Measuring Unit0.03125 µm
Max. Height of Specimen 90 mm
Distance of Indenter from Wall120 mm
Measuring Range8~2900 HV
Table 2. Specifications of the CNC lathe used in the experiment.
DescriptionSpecification
Max. Turning Diameter320 mm
Max. Turning Length 320 mm
Standard chuck size20.3 cm (8 inch)
Max. Spindle speed4000 rpm
Max. Spindle power11 kw
Table 3. Chemical composition of AISI 1020 and 1045 steel by Wt.
ElementAISI 1020 (wt %)AISI 1045 (wt %)
C0.18~0.230.43~0.50
Mn0.30~0.600.60~0.90
P0.040 (Max)0.040 (Max)
S0.050 (Max)0.050 (Max)
Table 4. Specifications of the surface roughness measuring instrument used in the experiment.
DescriptionSpecification
Measuring speed0.05, 0.1, 0.5, 1 mm/s
Detector measuring force0.75 mN
Measuring methodSkidless/skidded
Measuring range800 µm, 80 µm, 8 µm
Traverse50 mm
Table 7. Arithmetic mean values for each tensile test result.
MaterialTensile StrengthYield StrengthElongation
AISI 1045695.31 MPa550.51 MPa14.1%
AISI 1020537.74 MPa477.08 MPa18.7%
Table 8. Optimal cutting conditions obtained through analyzed experimental results.
Feed Rate
[mm/rev]
AISI 1020
[m/min], [mm]
AISI 1045
[m/min], [mm]
Arithmetic Mean of Surface Roughness
1020 [µm]1045 [µm]
0.05V 150, ap 0.8V 150, ap 0.40.3830.374
0.10V 200, ap 0.4V 250, ap 0.40.8580.814
0.15V 250, ap 0.4V 250, ap 0.41.8001.919
Disclaimer/Publisher’s Note: The statements, opinions and data contained in all publications are solely those of the individual author(s) and contributor(s) and not of MDPI and/or the editor(s). MDPI and/or the editor(s) disclaim responsibility for any injury to people or property resulting from any ideas, methods, instructions or products referred to in the content.

