Article

Comparison of Mechanical, Fatigue, and Corrosion Properties of Fusion-Welded High-Strength AA6011 Alloy Using Three Filler Wires

1
Department of Applied Science, University of Québec at Chicoutimi, Saguenay, QC G7H 2B1, Canada
2
Arvida Research and Development Center, Rio Tinto Aluminum, Saguenay, QC G7S 4K8, Canada
*
Author to whom correspondence should be addressed.
Processes 2024, 12(6), 1172; https://doi.org/10.3390/pr12061172
Submission received: 15 May 2024 / Revised: 31 May 2024 / Accepted: 1 June 2024 / Published: 7 June 2024
(This article belongs to the Special Issue Advances and Implementation of Welding and Additive Manufacturing)

Abstract

:
In this study, the welding performance of three filler wires, ER4043, ER5356, and the newly developed FMg0.6, were systematically investigated in the gas metal arc welding of high-strength AA6011-T6 plates. An extensive analysis of the microstructural evolution, mechanical properties, fatigue resistance, and corrosion behavior of different weldments was conducted. The ER4043 and FMg0.6 joints exhibited finer grain sizes in the fusion zone (FZ) than the ER5356 joint. The as-welded ER5356 and FMg0.6 joints exhibited higher hardness and tensile strength values than the ER4043 joint. The FMg0.6 joint demonstrated the highest mechanical strength among all of the joints with superior fatigue resistance under both the as-welded and post-weld heat treatment (PWHT) conditions. In the as-welded state, the ER5356 joint exhibited the lowest corrosion resistance, attributed to the precipitation of β-Al2Mg3 at the grain boundaries. The FMg0.6 joint, characterized by a high-volume fraction of eutectic Mg2Si in the as-welded state, exhibited a higher corrosion rate than that of the ER4043 joint. However, the PWHT effectively improved the corrosion resistance of the FMg0.6 joint. Given its excellent tensile properties, superior fatigue properties, and satisfactory corrosion resistance, particularly with PWHT, the newly developed FMg0.6 filler has emerged as a promising candidate for welding high-strength 6xxx alloys.

1. Introduction

Aluminum alloys, particularly Al-Mg-Si 6xxx series alloys such as AA6061 and AA6011, play a pivotal role in diverse industries including architecture, automotive, and transportation owing to their excellent mechanical properties and resistance to corrosion. To ensure the widespread applicability of high-strength AA6xxx alloys, it is crucial that they are easily weldable. Their susceptibility to hot cracking can be mitigated by the incorporation of ER4043 or ER5356 filler metals during fusion welding. However, the success of this mitigation strategy depends on meticulous welding design and the expertise of skilled personnel [1,2]. Fusion welding is an important method for joining aluminum components using conventional arc welding techniques, such as metal inert gas (MIG) and tungsten inert gas (TIG) welding [3].
The mechanical properties of welded joints are influenced by several factors, including the welding parameters, base metal (BM), and type of filler metal. Among these factors, the filler type is the predominant element in determining the mechanical and material properties of the joints. Commercial fillers such as ER4043 (Al–5Si) and ER5356 (Al–5Mg) are commonly employed to achieve satisfactory welding efficiency. The ER4043 filler induces changes in the chemistry of the melt pool, leading to a decrease in joint strength and an unfavorable color match for anodized applications. Conversely, when utilizing ER5356, their anodization color-matching is favorable. However, this advantage comes at the expense of the joint corrosion resistance, high-temperature stability, and weld pool fluidity [2,4]. Welds with ER4043 typically exhibit enhanced weldability with low sensitivity to cracking, good cosmetic appearance, and smooth surfaces, whereas welds with ER5356 offer superior shear strength. Naing et al. [5] observed that a repair joint with ER5356 filler exhibited higher tensile strength than a repair joint utilizing ER4043 filler. Recognizing the potential for enhancement, researchers have explored modifications to the chemistry of these fillers. One notable approach involves incorporating ceramic nanoparticles into aluminum filler metals to enhance their mechanical properties and address welding issues such as cracking [6]. However, in a study involving the addition of TiB2 nanoparticles to ER4943 and utilizing the TIG technique [7], the results indicated only marginal improvements in the mechanical properties compared with the standard filler.
Corrosion is a critical concern, particularly in welded joints that experience corrosive environments such as sea water. The protective layer of Al2O3 on the surface plays a crucial role in shielding the bulk alloy from extensive oxidation [8,9]. Despite this protective mechanism, AA6xxx alloys are susceptible to localized corrosion when exposed to aggressive environments, which is primarily attributed to the presence of Fe-rich intermetallics and Mg2Si [10]. Zhang et al. [11] investigated the corrosion tendencies of AA6061-T6 joints produced by laser-arc hybrid welding and reported notable occurrences of severe pitting in the fusion zone (FZ) and intergranular cracking in the heat-affected zone (HAZ). Strategies to enhance the corrosion resistance of welded joints involve reducing the precipitate size, controlling their distribution, and dissolving coarsened precipitates [12]. Nam et al. [13] found that surfaces with finer grains exhibited higher corrosion resistance, which was attributed to an increased formation of a passive protective film. In contrast, Osorio et al. [14] reported that coarse-grained regions may better resist corrosion owing to the presence of fewer corrosion sites. By investigating the galvanic corrosion of a laser-welded AA6061 aluminum alloy, Rahman et al. [15] reported that the cathodic process occurred in the FZ, contributing to high corrosion susceptibility. Yan et al. [9] conducted a potentiodynamic polarization test on AA6061 welds using ER4043 and ER5356 fillers and reported that the corrosion current density of the ER4043 joints was slightly higher than that of the ER5356 joints.
The corrosion susceptibility of heat-treatable aluminum alloys can be attributed to the precipitation of different phases, which is further influenced by the heat treatment, grain characteristics, environmental conditions, and applied loading [12,16]. The application of post-weld heat treatment (PWHT) is effective for improving both the mechanical and chemical characteristics of fusion-welded joints; this treatment reduces the residual stresses and modifies the microstructure in the HAZ and FZ [17]. In multi-pass welding, the high heat input gradually degrades the microstructure in the HAZ, exposing the welded area to temperatures in the solution treatment and over-aging ranges. This necessitates the application of a PWHT to mitigate the cumulative impacts of these thermal cycles [2,18].
The objective of this study is to systematically investigate the welding performance of high-strength AA6011-T6 thick plates using the commercial ER4043and ER5356 fillers and the newly developed FMg0.6 filler. The tensile properties and fatigue characteristics of the welded joints are assessed under both the as-welded (AW) and PWHT conditions. Furthermore, the corrosion resistances of the BM, HAZ, and all FZs are evaluated. The aim of this study is to elucidate the chemical attributes of the joints and provide a comprehensive analysis of their relevance to industrial applications.

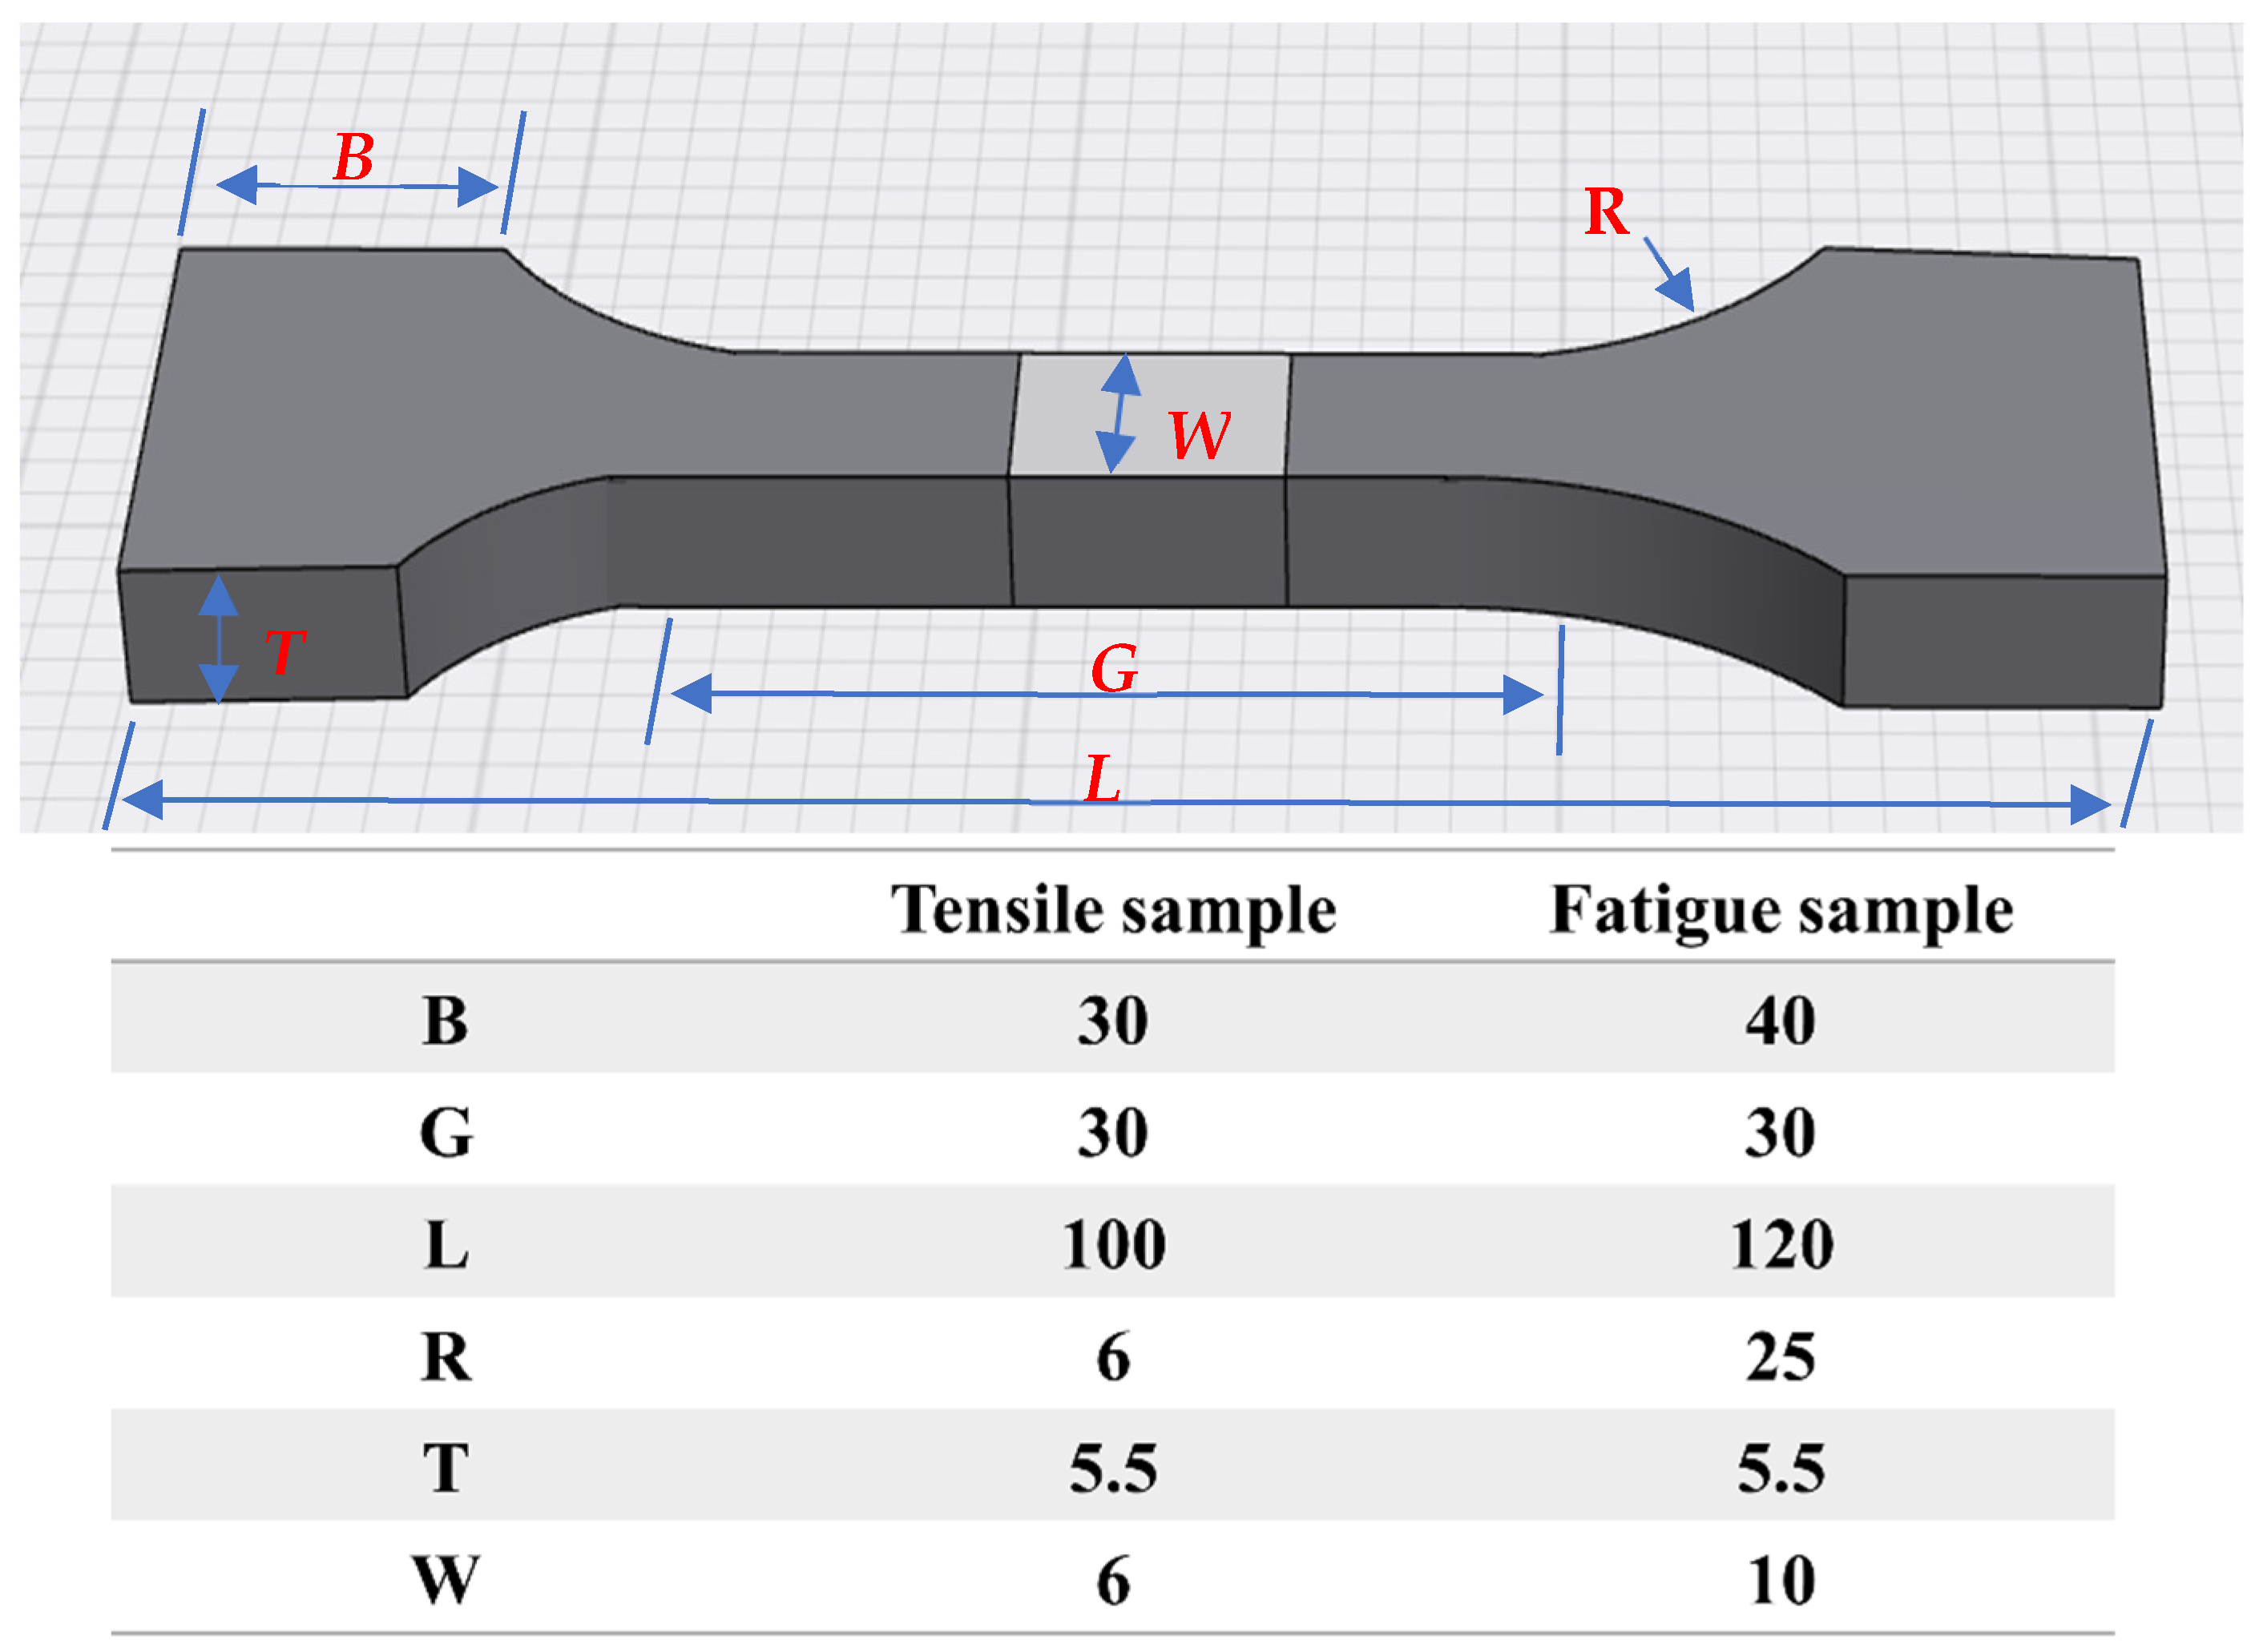
2. Materials and Methods

AA6011 aluminum plates with dimensions of 500 mm × 75 mm × 6 mm were produced via direct chill casing and extrusion, heat-treated to the T6 temper, and used as the base material (BM). The BMs were welded using the MIG technique with two commercial filler wires, ER4043 and ER5356, and a newly developed filler named FMg0.6. Table 1 presents the chemical compositions of the BM and three filler wires. The production route for the novel filler wire was detailed in our previous study [19]. Welding was performed by using a Fronius Transpulse Synergic 5000-CMT (Fronius International GmbH, Pettenbach, Austria) mounted on a Motoman UP50N robot (Yaskawa Electric Co. Beijing, China). Before welding, the plates were prepared by clamping in a butt joint configuration with a single V groove. To fill the groove space between two sheets with the filler wire, the welding process involved two passes with specific parameters listed in Table 2. After welding, the T6 PWHT was applied to a part of samples, consisting of a solution treatment at 550 °C for 1 h followed by water quenching, natural aging for 24 h, and subsequently artificial aging at 180 °C for 8 h. This heat treatment was optimized to restore the mechanical property loss during welding and regain the original T6 strength of the BM prior to welding.
After welding, an X-ray radiography test was performed to examine the weld defect and porosity. Tensile and fatigue samples were selected from low porosity zones (less than 1%) to minimize its effect on the properties. Welded microstructures were examined by optical microscopy (OM) and scanning electron microscopy (SEM). Microhardness profiles were measured using an NG-1000 CCD microhardness tester (NexrGen Material Testing Inc, Vancouver, BC, Canada), applying a 50 g load with a 20 s dwell time. The hardness measurements were performed 1 mm from the root side for the first pass and at 1 mm from the cap side for the second pass. Tensile and high cyclic fatigue tests were conducted on an Instron 8801 servo-hydraulic machine in both AW and PWHT conditions. The tensile test was performed at a crosshead speed of 1 mm/min and ambient temperature using standard subsized samples. Fatigue tests were carried out at ambient temperature, applying a sinusoidal waveform with a frequency of 30 Hz and a cyclic stress ratio of 0.1. The tensile and fatigue samples were machined according to ASTM E8-04 [20] and ASTM E466-96 [21], as shown in Figure 1. The fatigue S-N curves were plotted using the ISO 12107:2003 statistical approach [22]. As aluminum alloys typically lack a fatigue limit, the fatigue tests were halted after 107 cycles.
Potentiodynamic polarization (PD) tests were conducted at ambient temperature utilizing the Flat Cell Kit with a naturally aerated 3.5% NaCl solution (w/w) serving as the electrolyte. The three-electrode system comprised a platinum mesh counter electrode, saturated Ag/AgCl reference electrode, and the cold-mounted samples as the working electrode. The FZs were cut along the fusion line and separated from the HAZ. The entire FZ (for both passes) was used as the working electrode. The HAZ was assumed to have a length of 10 mm from the fusion line and a width equal to the BM thickness (6 mm). The BM samples were cut from the cross-section of the unwelded plates with the same area as that of the HAZ (10 × 6 mm). The BM, HAZ, and FZs in both the AW and PWHT conditions underwent cold mounting and polishing, followed by a cleaning with acetone and methanol for 2 min. The current values were normalized to the actual surface area of the electrode to calculate the current density for each electrode. The PD measurements were recorded after stabilization of the open-circuit potential (OCP) of the working electrodes in the solution of 3.5 wt.% NaCl for 1 h. PD measurements were carried out with a sweeping rate of 1 mV/s over the potential range of −1175 mV to 200 mV versus the reference electrode. The current density measured in the PD test was used to calculate the corrosion rate using Equation (1), according to ASTM G102-89 [23].
Corrosion   rate = 3.27 × i c o r r   ×   E W ρ       µ m year
where i c o r r is the corrosion current density, and EW and ρ are the equivalent weight and density of Al, respectively.
Immersion tests were performed based on the GB/T 19746-2005 [24] standard using test specimens with dimensions of 50 mm × 10 mm × 5 mm, with the FZ in the middle of the sample length, as shown in Figure 2a. The specimens were mechanically ground with SiC papers (240 to 1200 mesh) and cleaned using pure alcohol. They were weighed precisely using an electronic balance (±0.01 mg) before being immersed in a naturally aerated 3.5% NaCl solution; the specimens were placed about 30 mm below the liquid level in glass jars (Figure 2b). To remove corrosion products, the samples were treated with a chromic acid solution at 80 °C, following the GB/T 16545-1996 [25] standard. The mass loss was calculated for the three specimens, and the average value was reported [26].

3. Results and Discussion

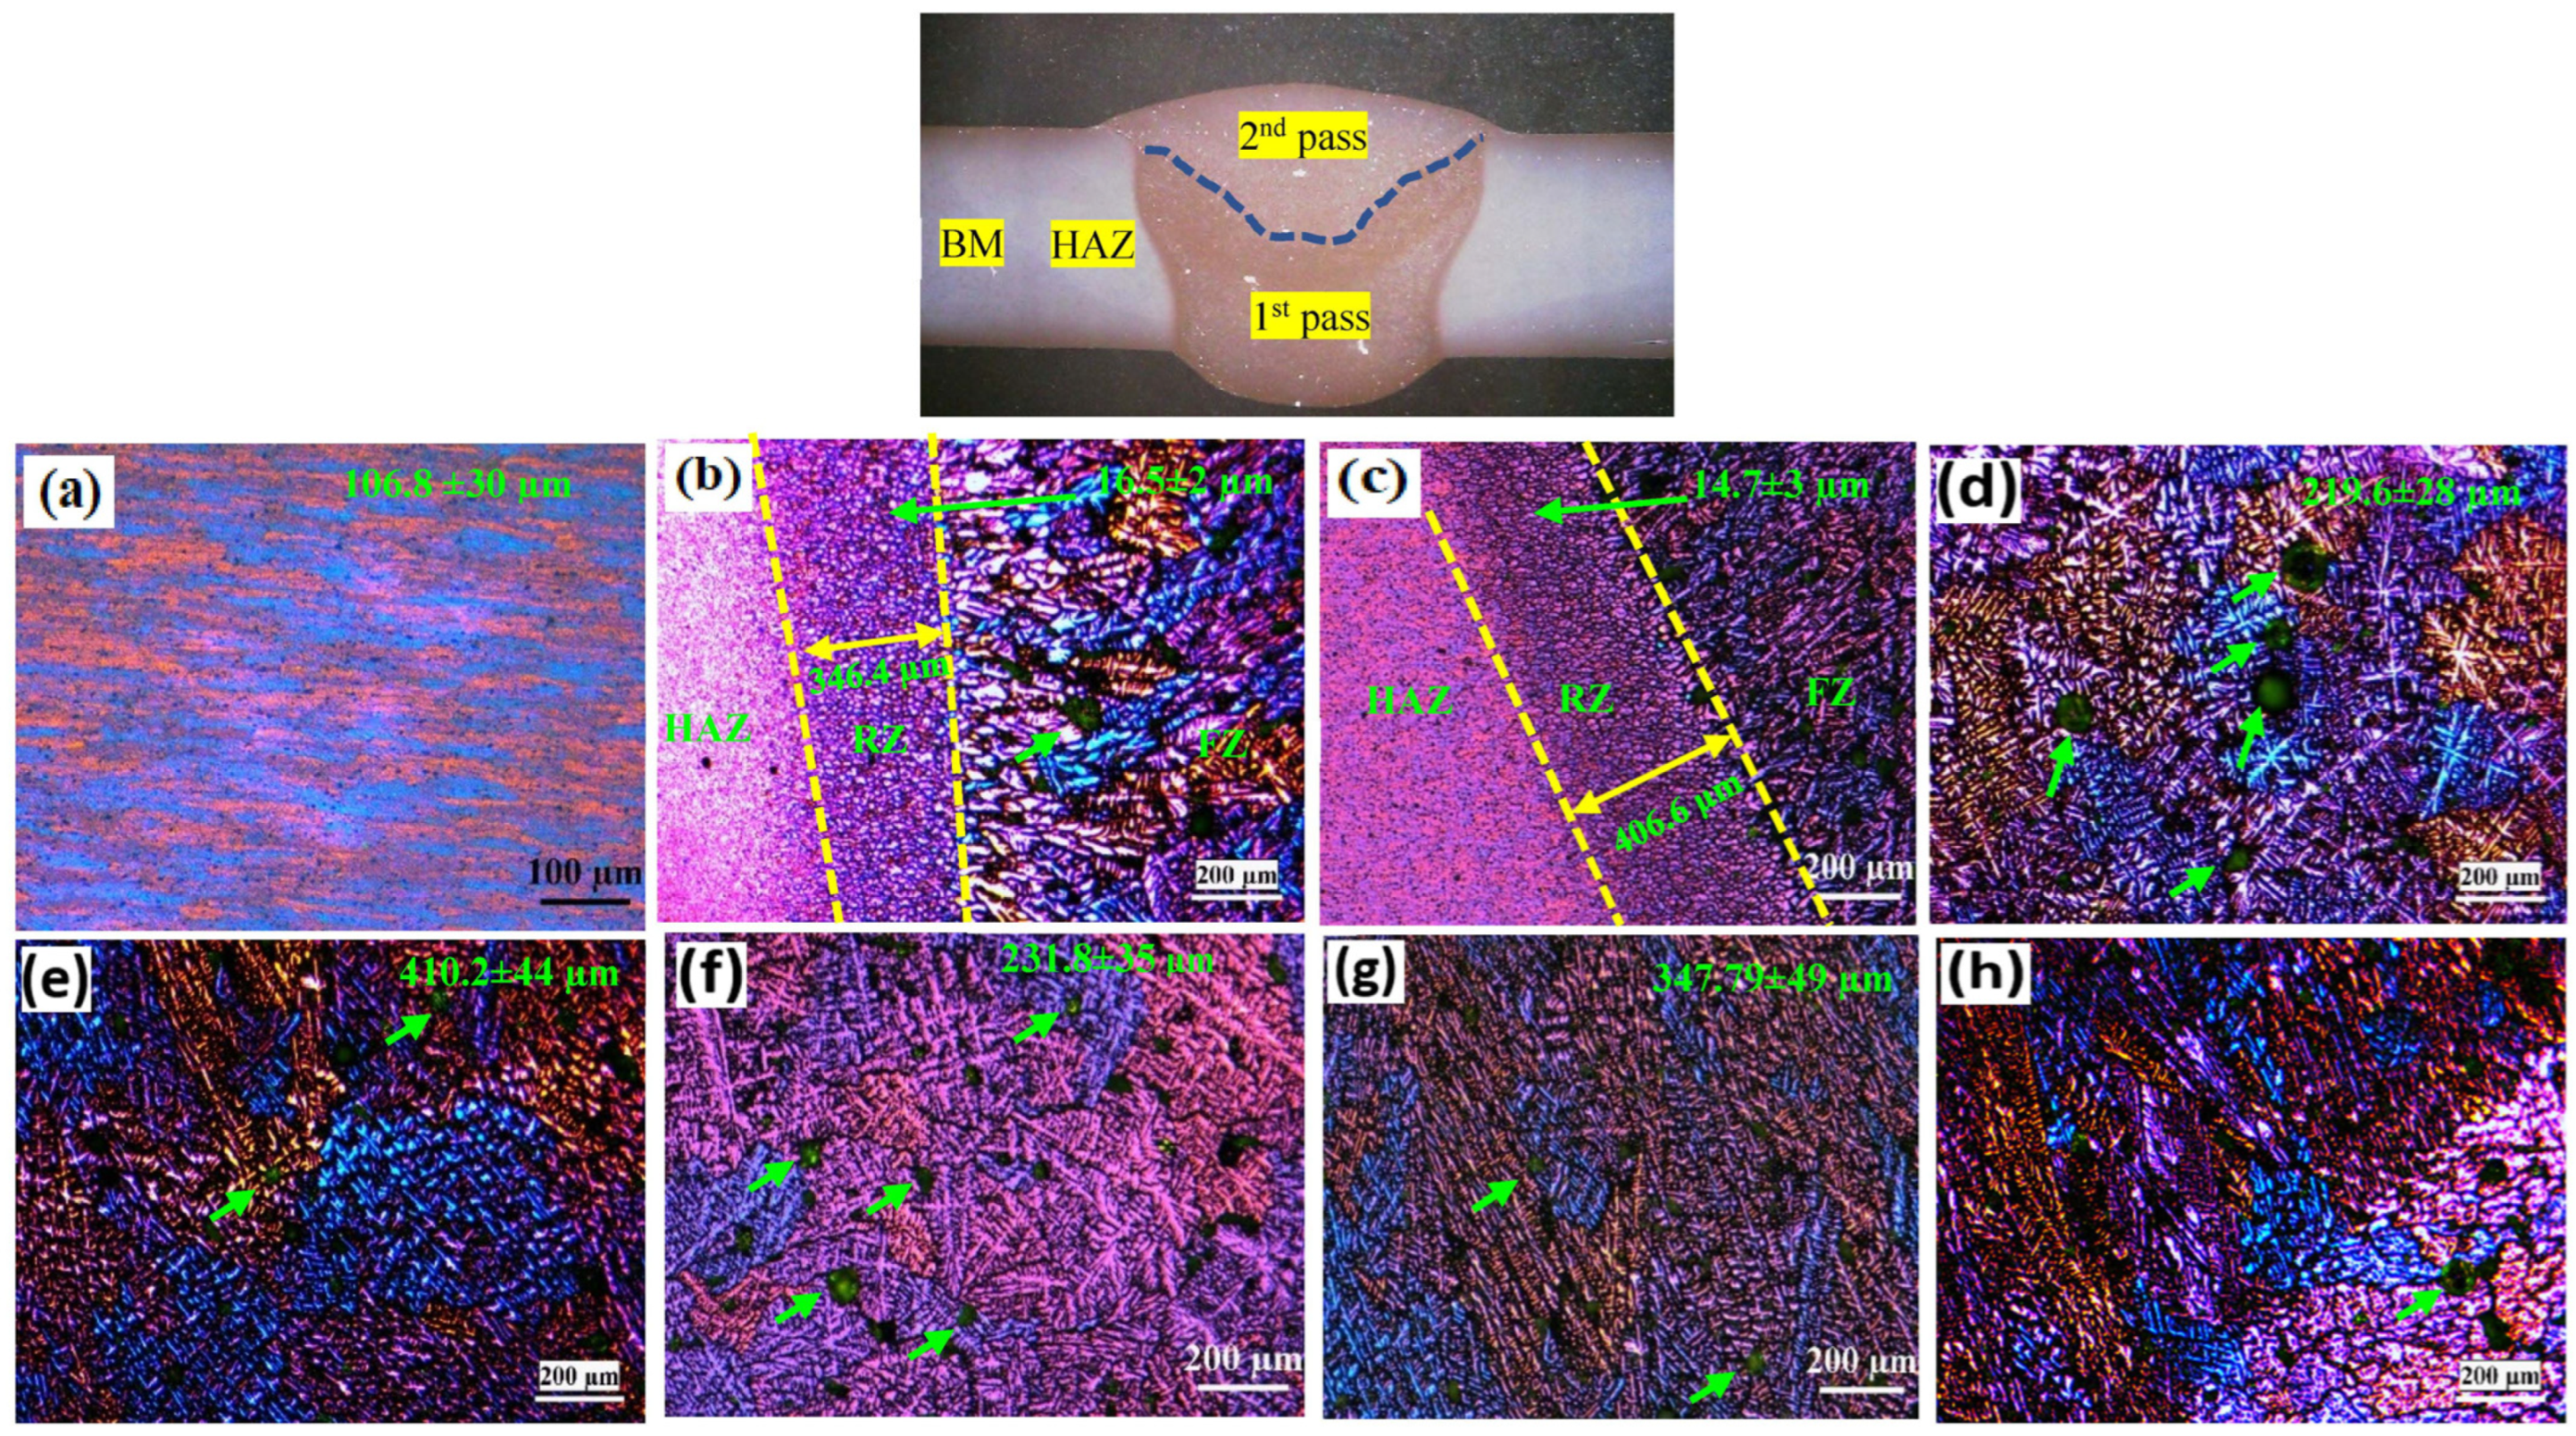
3.1. Microstructures

Figure 3 shows the grain morphologies of the OM in the BM, HAZ, and FZ under polarized light. The BM displays elongated grains in the extrusion direction with an average size of 107 µm (Figure 3a). Between the HAZ and FZ, a fine recrystallized zone (RZ) is observed close to the FZ (Figure 3b,c), and its width is influenced by the heat input from the welding arc. Typically, the HAZ after the RZ experiences partial recrystallization due to the temperature gradient, in which the grain size is smaller than that of the BM. In 4xxx filler joints, the width of the RZ is approximately 407 µm, which is wider than that of the ER5356 joints (346 µm). This change in the RZ is attributed to the higher welding current in both passes used in the 4xxx fillers than in the ER5356 filler, as indicated in Table 2. The RZs in ER5356 and the 4xxx fillers exhibit similar grain sizes of 16.5 ± 2 and 14.7 ± 3 µm, respectively. In the FZ of the ER5356 joint (Figure 3d,e), the grain size in the first pass is 219.6 ± 28 µm, which is significantly smaller than that in the second pass (410.2 ± 44 µm). This difference is attributed to the greater heat input (132 A) and faster cooling rate during the first pass compared with the relatively lower heat input (87 A) and slower cooling rate in the second pass [27,28]. Similarly, in the FZs of 4xxx filler joints (Figure 3f,g), the grain size in the first pass is smaller than that in the second pass (231.8 ± 35 µm vs. 347.79 ± 49 µm), owing to the differences in the heat input and cooling rate. The grain morphology between the two passes shows epitaxial grain growth, as illustrated in Figure 3h. For the porosity, the average equivalent pore diameter in the first pass is similar in all filler joints, 54 ± 8 µm. In the second pass, the ER4043 and FMg0.6 filler joints exhibit smaller pore sizes than that of the ER5356 joint (63 ± 17 µm vs. 103 ± 21 µm).
The microstructures of the BM and FZs under AW conditions are shown in Figure 4. The BM microstructure contains α-Al(FeMn)Si, Mg2Si, and Q-AlMgSiCu intermetallic phases. Owing to the extrusion process, all of the intermetallic phases are oriented in the extrusion direction (Figure 4a,b). The microstructure of the ER5356 joint consists of β-Al2Mg3 and Mg2Si phases (Figure 4c). The ER5356 filler contains no Si; however, a few granular Mg2Si particles are formed because of the diffusion of Si from the BM dilution [29]. The main phases in the ER4043 joint are eutectic Si, Fe-rich intermetallics, and Mg2Si (Figure 4d). It can be observed that the Fe-rich intermetallics have two forms, namely the platelet-like β-AlFeSi and the less harmful α-Al (FeMn)Si. The phases in the FMg0.6 joint are similar to those of the ER4043 joint (Figure 4e). However, the volume fraction of Mg2Si in the FMg0.6 joint is higher than that in the ER4043 joint (0.75% ± 0.21% vs. 0.15% ± 0.08%). A similar trend is observed in the volume fraction of α-Al(FeMn)Si: 1.68% ± 0.32% and 0.88% ± 0.24% for FMg0.6 and ER4043 joints, respectively. This occurs owing to the addition of 0.25% Mn in the FMg0.6 filler (see Table 1), which modifies the harmful β-Fe intermetallic to the less harmful α-Fe intermetallic, as shown in Figure 4e [30].
The microstructures of the FZs after PWHT are shown in Figure 4f–h. The ER5356 joint shows the formation of β-Al2Mg3 at the grain boundaries and dispersed within the grains (Figure 4f). Because the 5xxx alloy is not heat-treatable, PWHT can homogenize the matrix microstructure, leading to improved mechanical properties, as described in the following sections. In the ER4043 and FMg0.6 joints (Figure 4g,h), PWHT produces a significant effect on the matrix. All of the Mg2Si phases in both joints are completely dissolved in the microstructure. Moreover, the eutectic Si morphology is transformed from a fibrous structure in the AW condition to a spheroid morphology after PWHT [29]. The Fe-rich intermetallics undergo partial fragmentation [31,32,33].

3.2. Microhardness

The microhardness profiles of the three filler joints in the AW condition are presented in Figure 5a,b. The highest HV of 145 ± 3 is observed in the BM. A soft region of approximately 74 HV is present in the HAZ. With movement from this soft zone to the FZ, the HV gradually increases owing to dissolution of the original β″-Mg2Si precipitates in the BM, leading to solution strengthening. In contrast, from the BM to the soft zone, the HV exhibits a decreasing trend owing to the effect of the welding heat on enhancing the dissolution of β″ precipitates [19]. The HVs in the FZ of the first pass of the ER4043 joint and in both passes of the ER5356 joints show similar values, 78 ± 3 HV, whereas the HV in the FZ of the first pass of the FMg0.6 joint exhibits a higher value of 88 ± 2 HV. The second passes of the ER5356 and FMg0.6 joints produce slight differences in the HV values of 85 ± 5 and 89.2 ± 4 HV, respectively, as shown in Figure 5b. The HV of ER4043 has the lowest value in the second pass, 66 ± 2 HV, owing to the low Mg in the filler and low BM dilution [34]. The highest HVs in two passes of the FMg0.6 joint can be attributed to the high Mg content (0.6%) in the filler composition. The similarity in the HVs for both passes of the ER5356 joint is attributed to the limited solubility of Mg in the Al matrix at room temperature. According to Pozank et al. [35], the solubility of Mg in Al is less than 1 wt.%, leading to the similar Mg contents in the Al matrix of both passes.
The HV profiles of all of the joints after PWHT are shown in Figure 5c,d. The HAZ completely disappears in all joints. The HVs in the FZ of the ER4043 joint exhibit large variations between the two passes. The first pass produces a higher HV than the second pass (135 ± 3 vs. 100 ± 5 HV), which is attributed to the increased BM dilution in the first pass compared with the second pass, which results in a higher concentration of β″ precipitates during PWHT in the first pass. The ER5356 joint shows similar HV values in both passes, 100 ± 3 HV, owing to the limitation of Mg solubility discussed in the AW case. It is worth noting that the HVs of ER5356 are higher than that of the AW condition (78 ± 3 HV) owing to the applied heat treatment, which leads to homogenization of the microstructure and reduces the residual stress induced by the welding process [36]. In addition, some Si diffuses from the BM dilution in both passes, which can lead to the formation β″ precipitates during PWHT [37,38,39]. The joint of the newly developed filler, FMg0.6, shows the highest HV of 145 ± 2 HV compared to the two commercial fillers. This is attributed to the high Mg content in the FZ, which leads to sufficient precipitation of coherent β″ precipitates, as described in our previous studies [19,29].

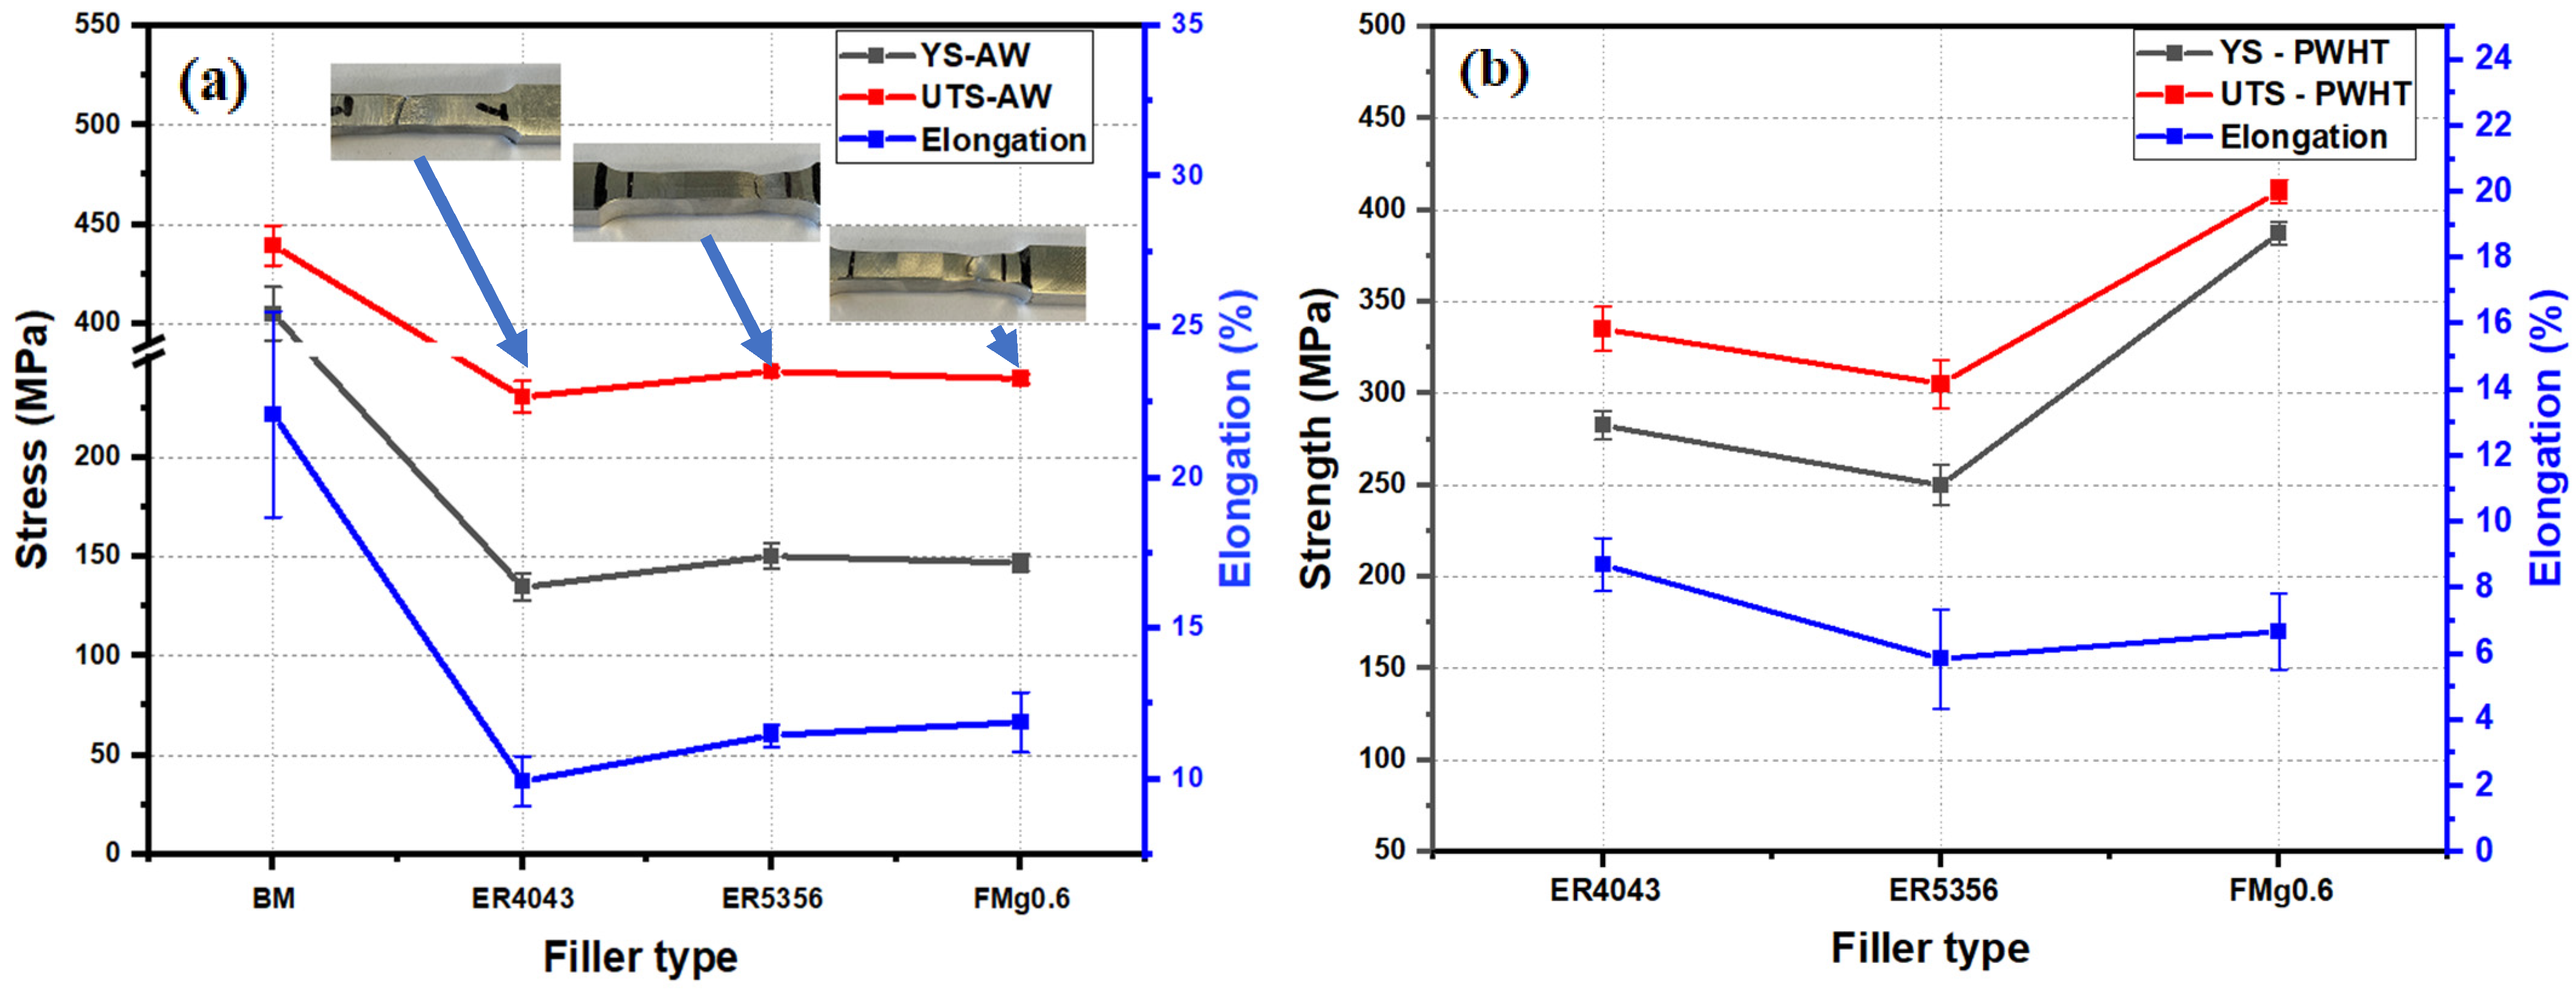
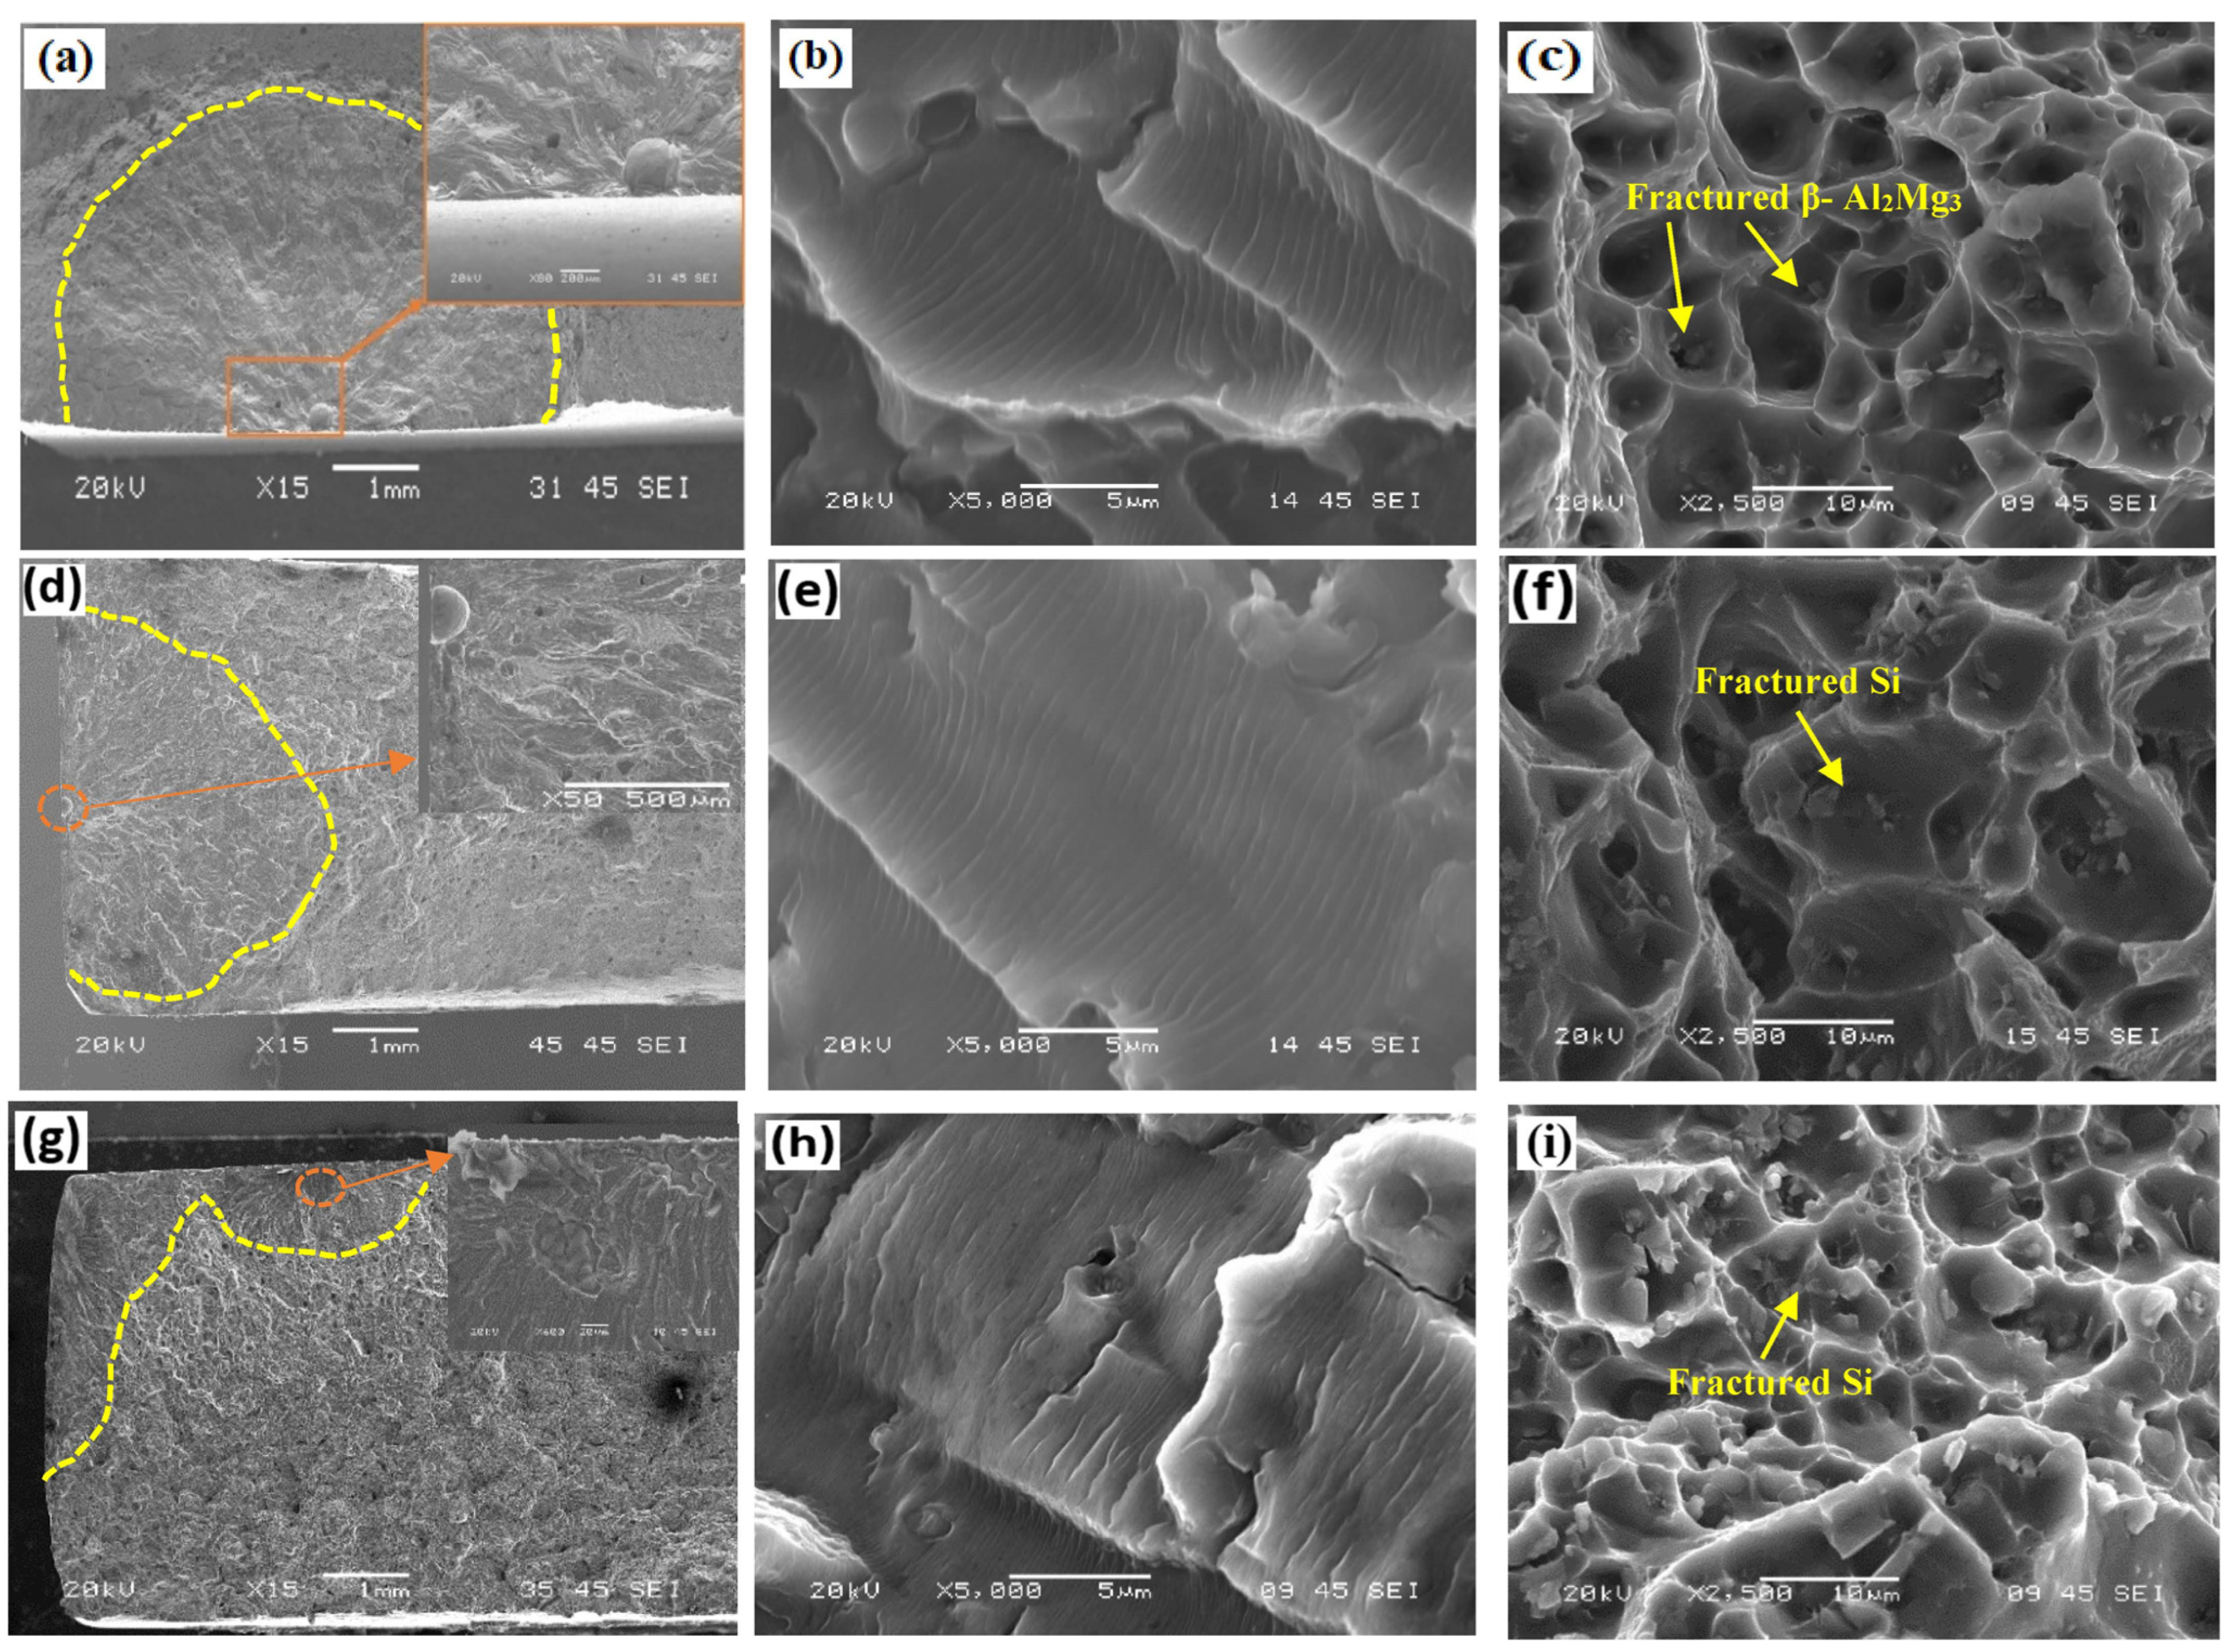
3.3. Tensile Properties

Figure 6a shows the tensile properties of the AW joints. The BM exhibits the highest ultimate tensile strength (UTS) and yield strength (YS) of 437 ± 6 and 397 ± 10 MPa, respectively. The ER5356 and FMg0.6 joints exhibit similar UTS and YS values of 240 ± 2 and 148 ± 5 MPa, respectively. This similarity occurs because the HAZ is the weakest zone in both joints and has the lowest HV (Figure 5a), and thus, fracture occurs in the HAZ of the tensile samples (insets in Figure 6a). The ER4043 joint shows the lowest UTS and YS of 230 ± 7 and 135 ± 5 MPa, respectively, and the fracture occurs in the FZ. This result is consistent with the HV results because the FZ of ER4043 exhibits the lowest HV in the second pass (Figure 5b). Although the grain sizes in each pass of the ER4043 and FMg0.6 joints are similar (Figure 3), the tensile strength of the FMg0.6 joint is higher than that of the ER4043 joint owing to the addition of Mg to the filler, which increases the solution strengthening of the joint [19,29]. The elongation of the BM has the highest value of 23% ± 3%. All three joints show lower elongation values because of the inhomogeneous microstructures, such as coarse equiaxed and columnar grains, as well as the porosity in the FZs (Figure 3). The ER4043 joint has the lowest elongation of all three joints, 10% ± 0.8%, while the ER5356 and FMg0.6 joints exhibit a similar elongation of approximately 12%.
The tensile properties of the PWHT joints are shown in Figure 6b. The ER4043 joint exhibits UTS and YS of 335 ± 12 and 282 ± 8 MPa, respectively, which are higher than those in the AW condition because of the formation of some nanosized β″ precipitates that originates from the BM dilution [19,34]. The ER5356 joint exhibits the lowest UTS and YS of 305 ± 12 and 250 ± 8 MPa, respectively, in the PWHT condition. This is a result of the adverse influence of the brittle Al3Mg2 phase at the grain boundaries (Figure 4f) [9]. However, the strength of the ER5356 joint surpasses that of the AW condition. This enhancement in strength is attributed to the homogenization effect of the heat treatment and the potential formation of a few β″ precipitates owing to Si diffusion from the BM dilution [38,39]. The highest tensile strength in the welded joints is observed in the FMg0.6 joint, which has UTS and YS of 410 ± 6 and 387 ± 6 MPa, respectively. This strength is achieved via the precipitation of a high number of β″-Mg2Si precipitates after PWHT, as reported in our previous studies [19,29,33]. It is worth noting that the dilution in the second pass is low because of the groove geometry and use of thick BM. The high Mg content in the FMg0.6 filler compensates for the decrease in the dilution and supports the FZ in the FMg0.6 joint with sufficient Mg content to make it efficient in the T6 aging treatment [40,41]. The ER4043 joint exhibits the highest elongation of all of the welded joints: 8.7% ± 0.8%. The elongations of the FMg0.6 and ER5356 joints are 6.8% ± 1% and 5.7% ± 1.5%, respectively. The precipitation of brittle β-Al3Mg2 in the ER5356 joint (Figure 4f) and the formation of micropores near these precipitates result in a premature fracture and reduction in the elongation, as reported by Wen et al. [42].

3.4. Fatigue Properties

The fatigue properties in the AW condition are shown in Figure 7a. The BM exhibits the highest fatigue strength compared with the welded joints owing to the minimal number of flaws and microdefects in the matrix [34]. It is common in metallic alloys that a higher tensile strength improves the cyclic performance and fatigue behavior of the material, assuming good surface conditions and less influence from microdefects [9,29]. Fractures during tensile testing are observed in different zones for the ER4043, ER5356, and FMg0.6 joints; however, fatigue failure consistently occurs in the FZ for all joints owing to the presence of welding defects such as micropores and coarse grains. The ER5356 joint exhibits the lowest fatigue strength owing to the higher pore size compared with the ER4043 and FMg0.6 joints (Figure 3). The FMg0.6 joint exhibits the highest fatigue strength compared with the two commercial fillers. The order of fatigue strength can be defined as FMg0.6 > ER4043 > ER5356. The better fatigue properties of FMg0.6 relative to the ER4043 joint are related to the hindering effect of the dislocation motion by the Mg solute atoms in the Al matrix during cyclic loading, as reported in our previous study [29].
Figure 7b shows the fatigue properties of the PWHT joints. The fatigue strengths of the PWHT samples are significantly improved relative to those of the AW joints (Figure 7a). The order of the fatigue strengths after PWHT is the same as that in the AW condition: FMg0.6 > ER40433 > ER5356. The fatigue strengths in the heat-treated ER4043 and FMg0.6 joints are enhanced owing to the strengthening effect of β″ precipitates. Increasing the Mg in the FMg0.6 joint results in a higher density of β″ precipitates compared with the ER4043 joint, thus resulting in a higher fatigue strength [33]. In the ER5356 joint, owing to the homogenization effect of the heat treatment, the fatigue strength is enhanced relative to the AW condition. However, the fatigue strength of the ER5356 joint remains lower than those of the ER4043 and FMg0.6 joints, likely owing to the precipitation of the brittle β-Al3Mg2 phase at grain boundaries [17] and the presence of fewer β″ precipitates in the Al matrix because of the lack of Si solutes.
The fatigue fracture surfaces of the PWHT joints are shown in Figure 8. The fatigue fracture normally consists of three zones: initiation, propagation, and final fracture. For all joints, the initiation zone is located on the surface or in pores near the surface (Figure 8a,d,g), as reported by several researchers [9,17,43]. The propagation zone starts directly from the initiation zone (pores) and ends when the total crack length reaches a critical size, as indicated by the yellow dashed lines, where the final fracture zone continues to the end of the sample. The striation width is measured at 1 mm from the initiation zone in all welded joints, which represents the incremental increase in the fatigue crack with each loading cycle, referring to the fatigue crack propagation rate. The striation widths are measured as 431 ± 27, 573 ± 63, and 715 ± 51 nm for the FMg0.6, ER4043, and ER5356 joints, respectively. Therefore, the fatigue crack propagation rates increase markedly from the FMg0.6 to ER4043 and ER5356 joints. The joint with the newly developed FMg0.6 filler exhibits the lowest fatigue crack propagation rate, which results in the highest fatigue life. The ER5356 joint exhibits the highest crack propagation rate because the presence of a few β″ precipitates can retard the dislocation motion. When the propagation zone is completed, the remaining part of the fatigue sample can no longer endure the cyclic loads, leading to a normal fracture resembling that of a tensile test when the UTS is surpassed. The final fracture zone of the ER4043 joint shows larger dimples than that of the FMg0.6 joint owing to the low Mg content in the ER4043 filler. Fractured Si particles are observed at the bottom of all of the dimples in the ER4043 and FMg0.6 joints, indicating a mechanism of dimple formation due to brittle Si particles. The final fracture zone of the ER5356 joint has smaller and shallower dimples compared to the E4043 joint owing to the presence of β-Al2Mg3 particles [44].

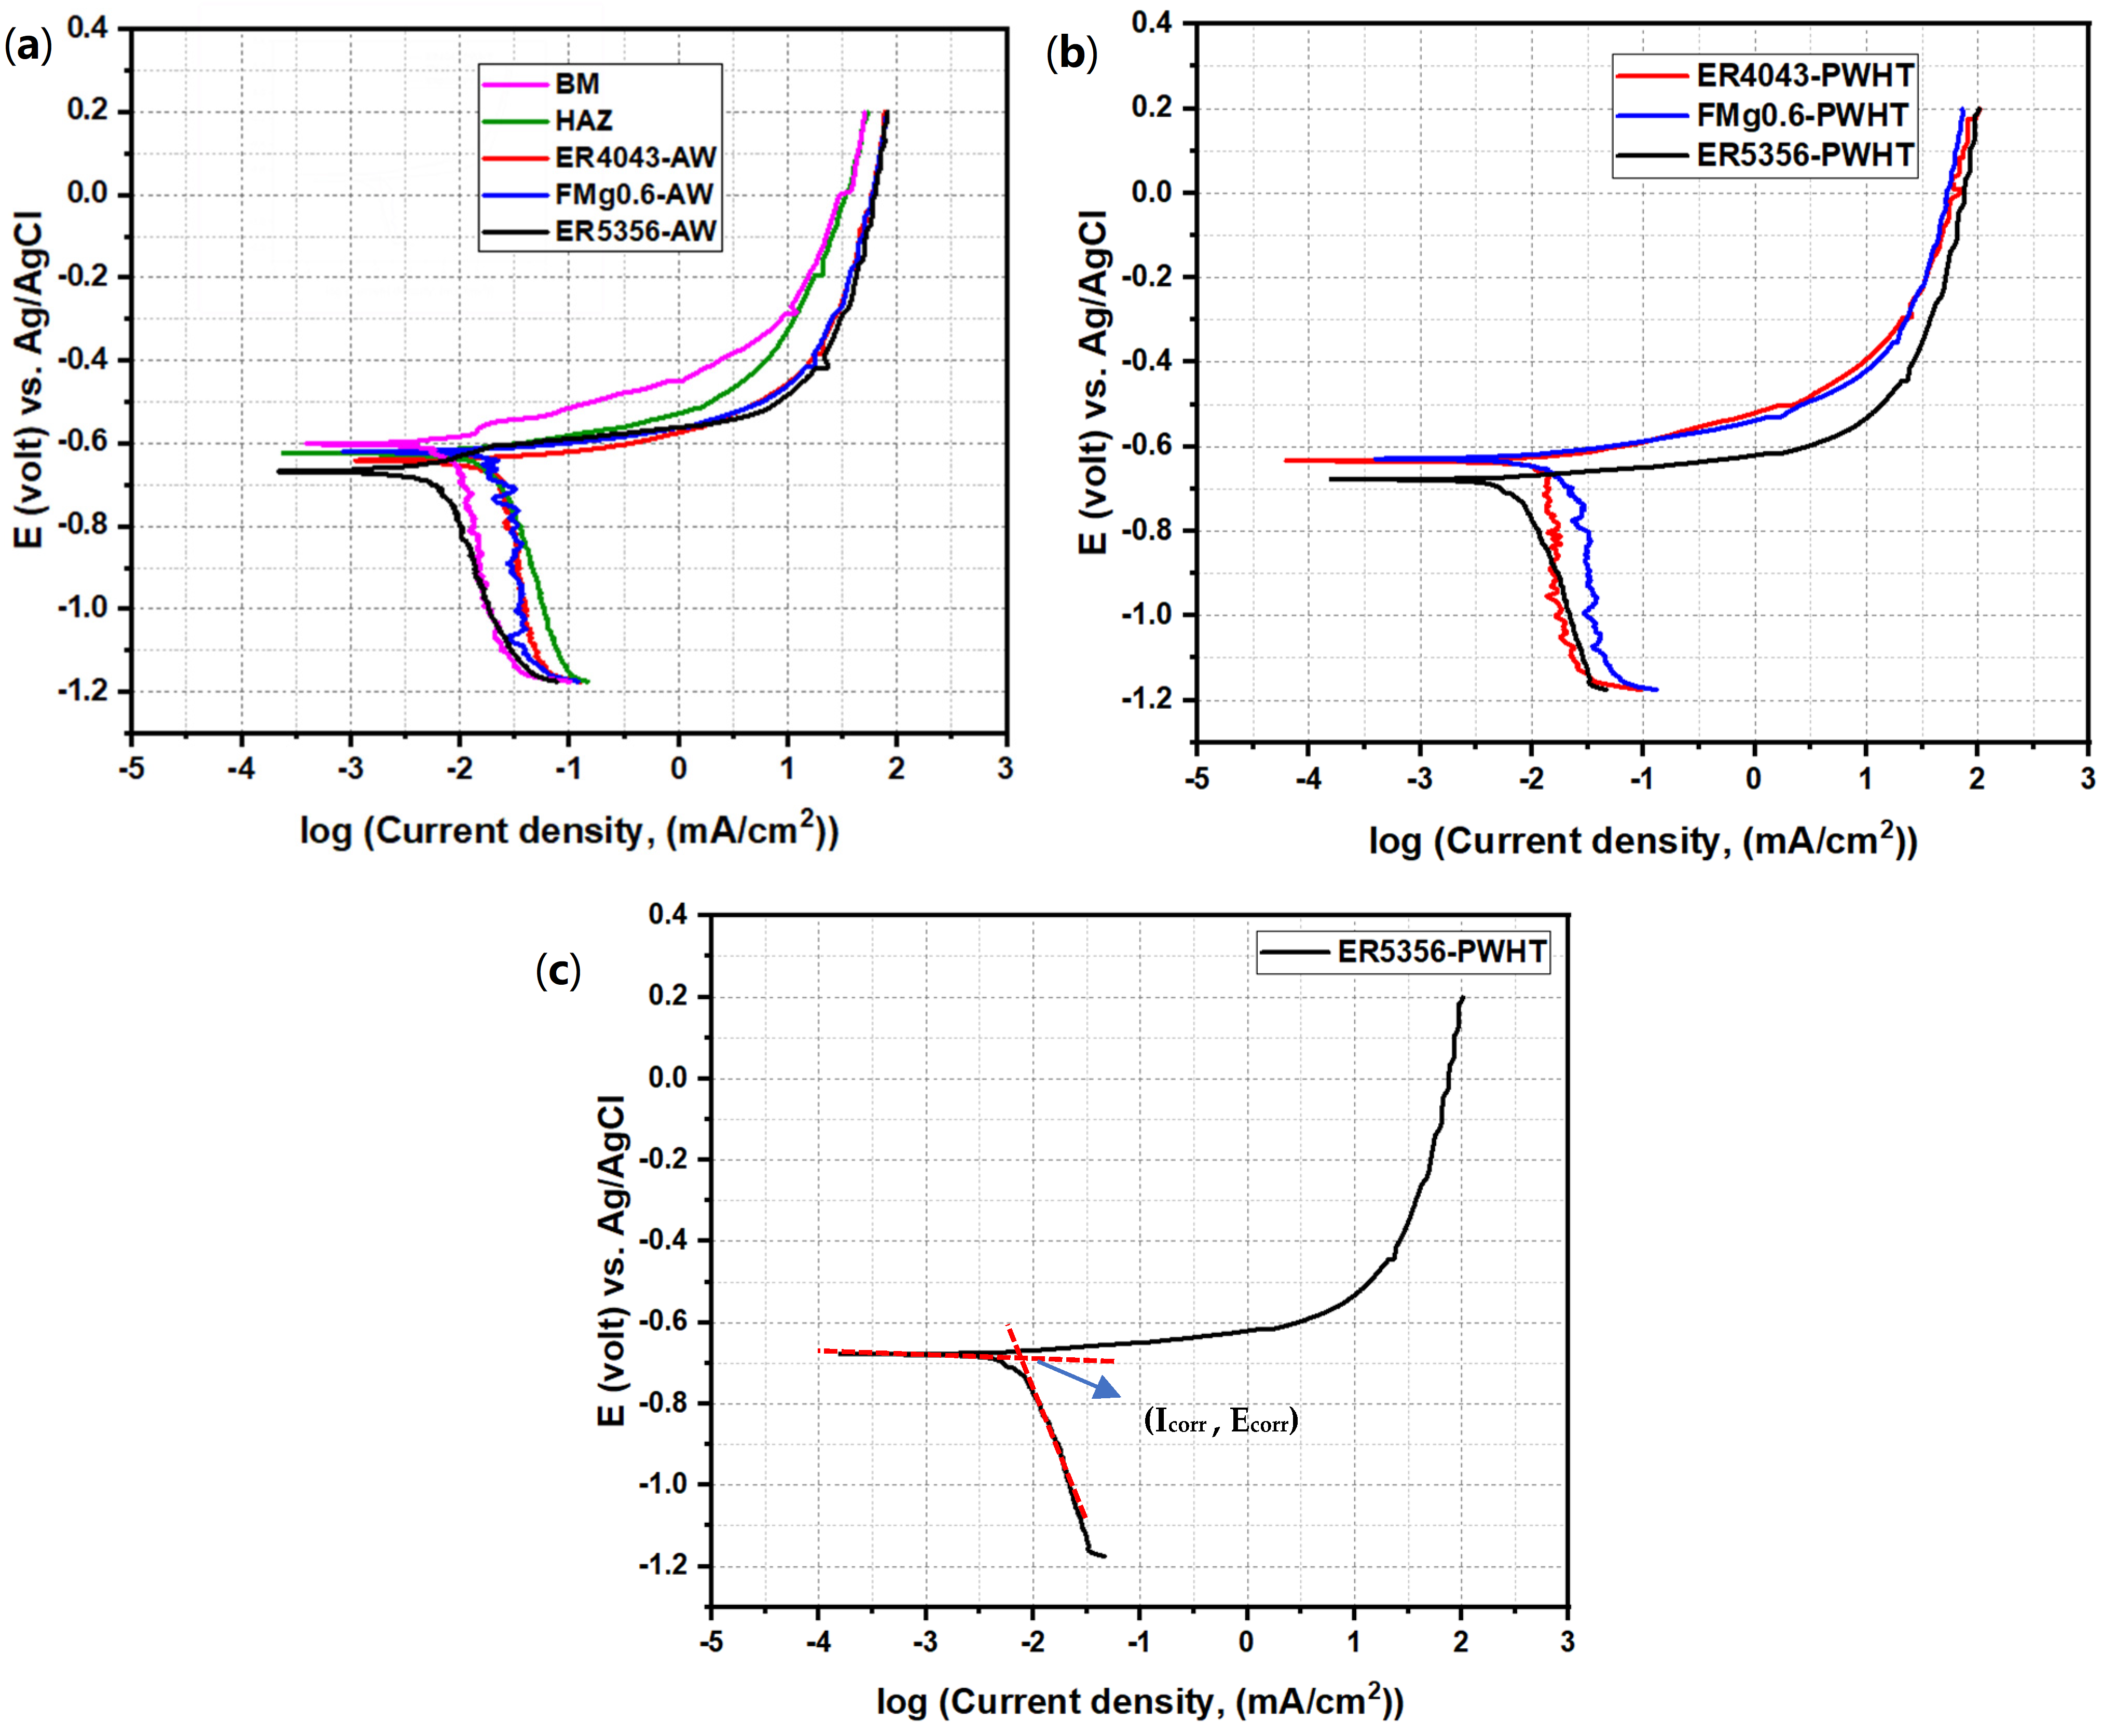
3.5. Corrosion Resistance

3.5.1. Potentiodynamic Polarization

Figure 9a shows the typical PD curves of the BM and AW joints. The corrosion parameters obtained are summarized in Table 3 for both the AW and PWHT conditions. These were measured using the Tafel extrapolation method according to ASTM G59-97 [45], as shown in Figure 9c. The anodic polarization branches of the curves (from the corrosion potential, E c o r r , moving in the positive direction) exhibit similar behavior, indicating the same corrosion mechanism in the salty medium. The BM shows the highest E c o r r of −602.9 mV and the lowest corrosion rate of 24.25 µm/y, representing the highest corrosion resistance compared with all of the welded joints. The HAZ exhibits a diminished corrosion resistance with a corrosion rate of 113.5 µm/y relative to the BM. This reduction in the corrosion resistance is caused by fine recrystallized grains in the RZ and partially recrystallized grains in the HAZ (Figure 3b,c), which increase the grain boundary area, and hence, the susceptibility to intergranular corrosion (IGC) [46]. The ER5356 joint exhibits the lowest E c o r r of −666.7 mV and the highest corrosion rate of 167.18 µm/y. The excessive Mg content in the ER5356 joint leads to a reduction in corrosion resistance because of the low reduction potential of Mg relative to that of Al [47,48]. The FMg0.6 joint shows a higher corrosion rate than the ER4043 joint (99.45 vs. 78.33 µm/y). This is attributed to the high content of eutectic Mg2Si and Fe-rich intermetallics relative to the ER4043 joint (Figure 4d,e). Eutectic Mg2Si and Fe-rich intermetallic particles act as anodes and cathodes, respectively, relative to the matrix, leading to increased corrosion [15,17,48].
The PD curves of the PWHT samples are shown in Figure 9b. The anodic and cathodic reactions are the same in the AW condition. The ER5356 joint exhibits the lowest corrosion resistance with an Ecorr of −680.36 mV and the highest corrosion rate of 178.76 µm/y, owing to the formation of the anodic-susceptible β-A3Mg2 at the grain boundaries and its sensitization effect [49,50,51]. However, PWHT leads to an increase in the corrosion resistance relative to the AW condition in both the ER4043 and FMg0.6 joints (Table 3). This behavior is due to the dissolution of eutectic Mg2Si and the partial fragmentation of Fe-rich intermetallics in the matrix (Figure 4f,g) [52]. The ER4043 and FMg0.6 joints show slightly different corrosion rates (60 vs. 53 µm/y), which are lower than those in the AW condition by 23% and 46.8%, respectively. Overall, the joint with the newly developed FMg0.6 demonstrates excellent corrosion resistance, similar to that of the commercial ER4043 filler.

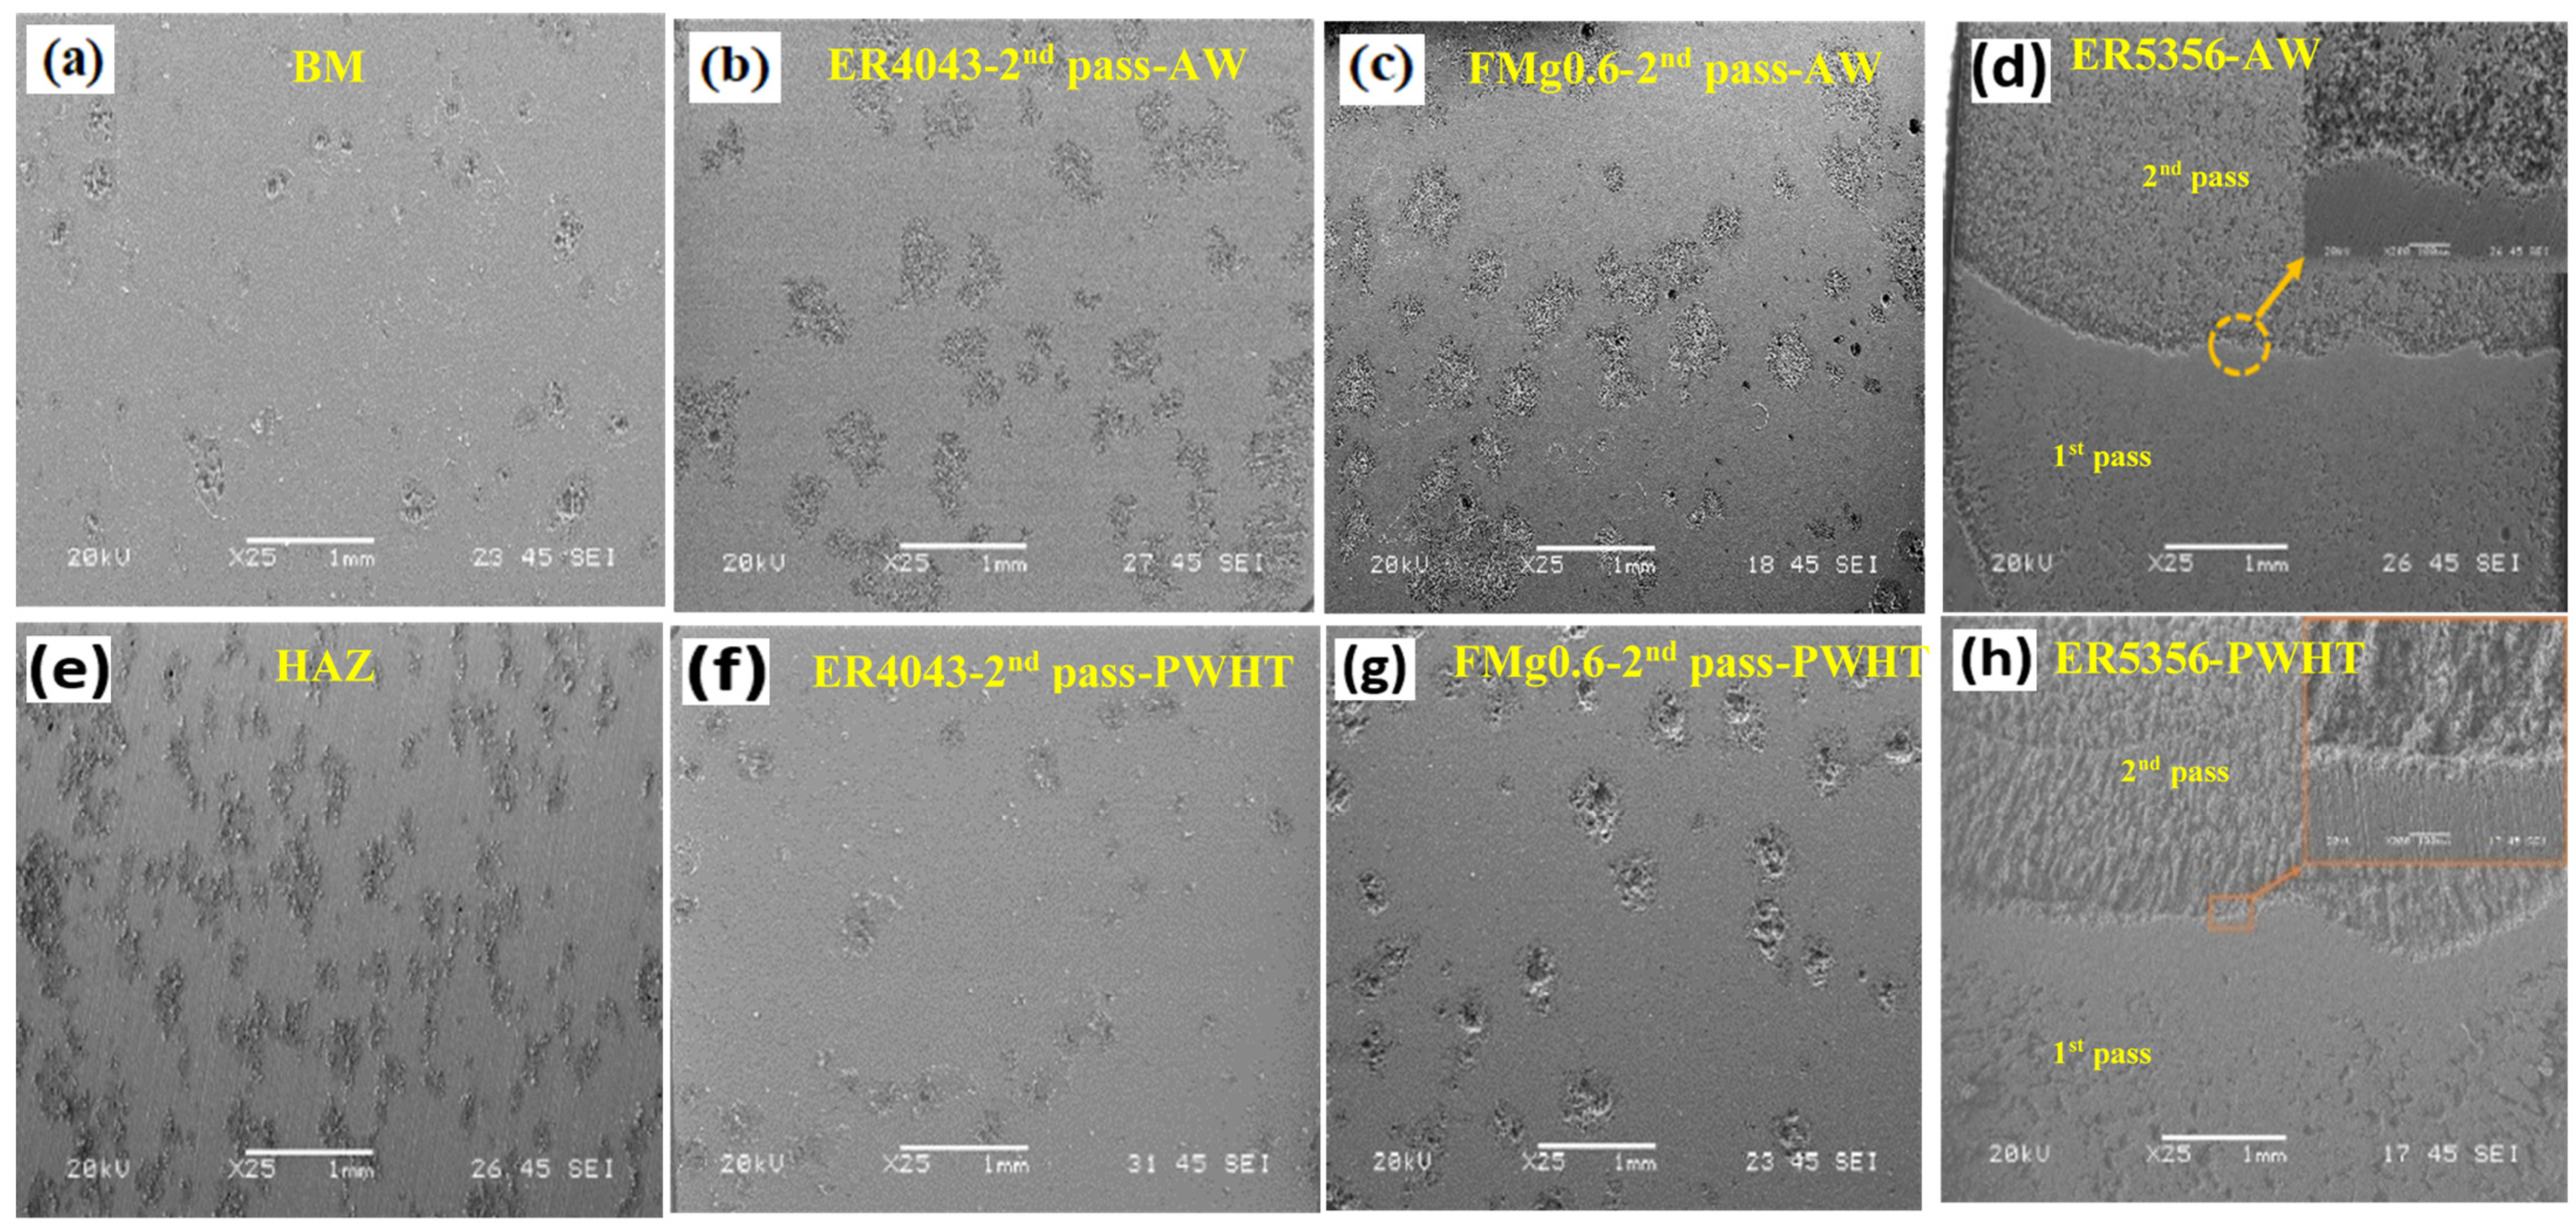
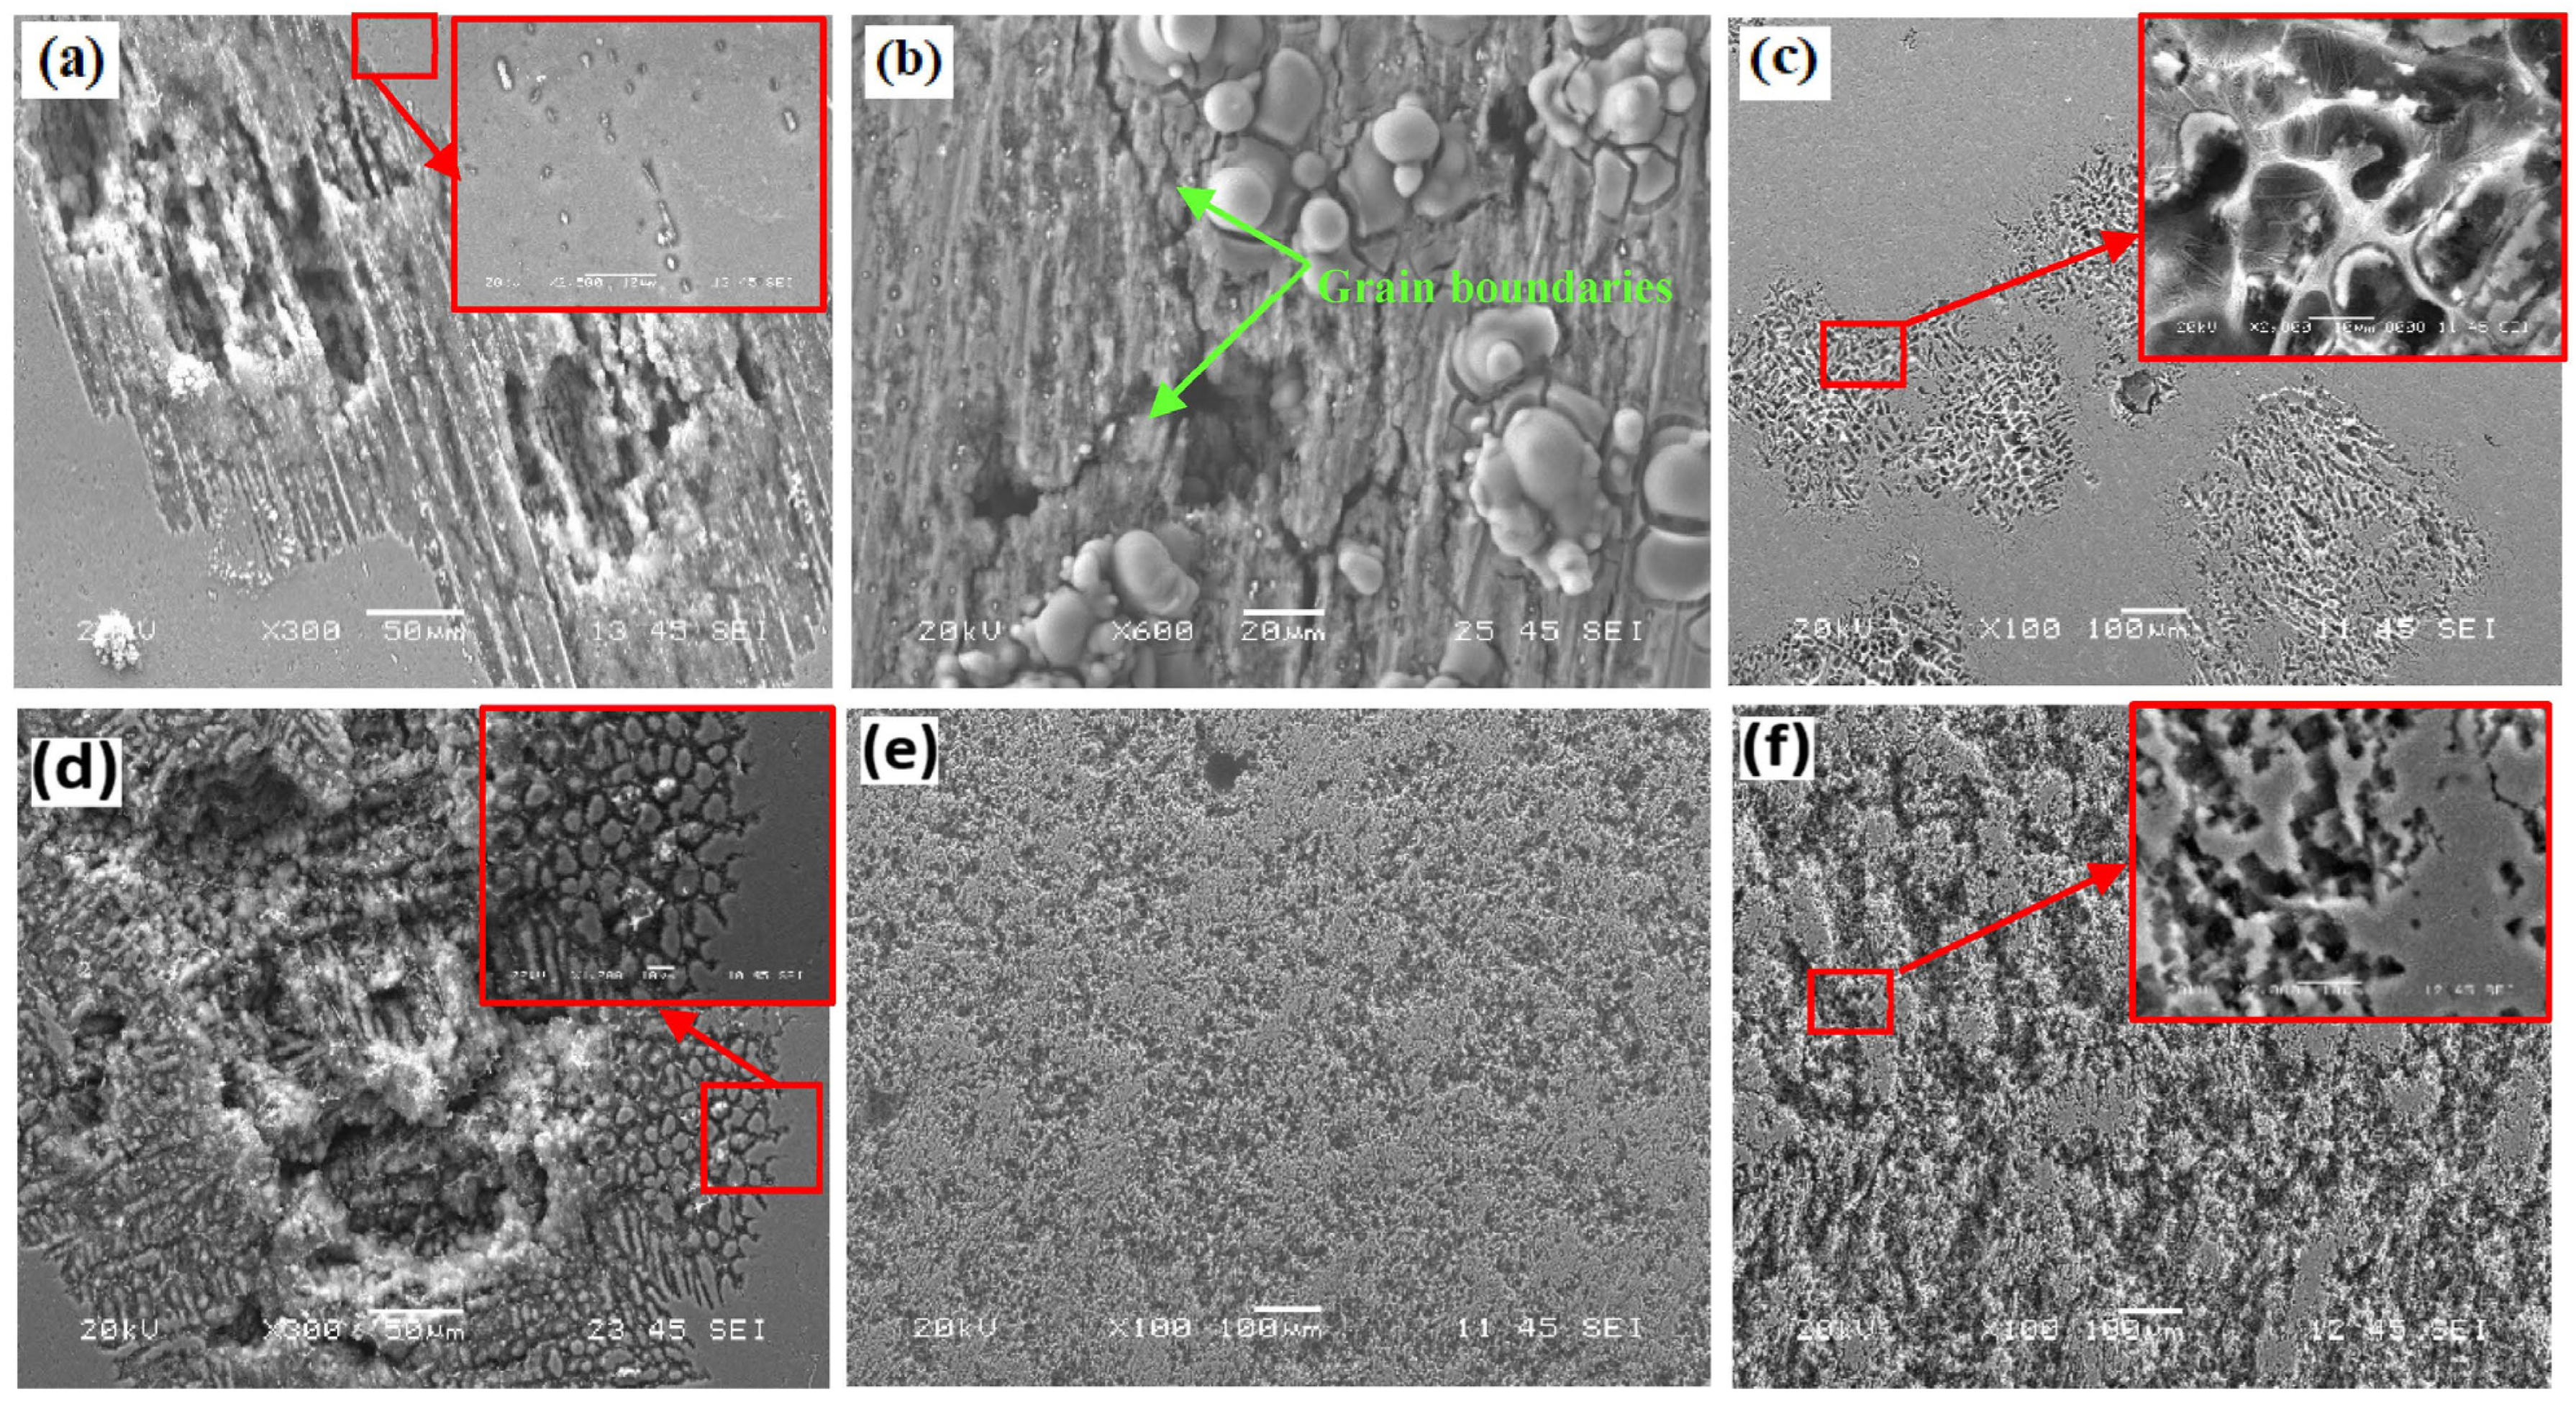
3.5.2. Surface Morphologies of Corroded Samples

Figure 10a–d show macroscopic images of the corroded surfaces of the BM and AW joints after the PD tests. The BM has a lower pit content compared with the welded joints (Figure 10a). The HAZ exhibits a large number of pits compared with the BM (Figure 10e) because of its smaller grain size relative to that of the BM and the presence of more grain boundaries [8]. The second passes of the ER4043 and FMg0.6 joints are selected to show the significant differences between the joints (Figure 10b,c). The ER4043 joint has fewer pits than the FMg0.6 joint owing to the lower content of eutectic Mg2Si. The ER5356 joint suffers from the worst pitting corrosion because the high Mg content in the matrix leads to a greater dissociation of Mg in the solution. Furthermore, the dispersed β-Al2Mg3 phase in the AW condition acts as an anode, promoting pit formation in the FZ. Additionally, the first pass of the ER5356 joint has a lower Mg content than the second pass owing to the high dilution. This difference in Mg content results in a significant difference in the potential for each pass. Therefore, many more pits are observed in the second pass, and the most severe material loss is observed at the boundaries [15,50].
Macro views of the PWHT joints after the PD tests are shown in Figure 10f–h. The pit contents are reduced in the ER4043 and FMg0.6 joints compared to those in the AW condition. This is because of the reduction in the phases acting as anodes in the matrix, such as eutectic Mg2Si, and the partial fragmentation of Fe-rich intermetallics (see Figure 4c,f) [53]. The ER5356 joint shows more severe and higher pit contents in both passes relative to the AW condition owing to dispersion of the anodic β-Al2Mg3 at the grain boundaries and within the grains (Figure 4d).
Figure 11 illustrates the pitting corrosion in detail for both the AW and PWHT joints. The BM pits are elongated in the extrusion direction (Figure 11a) owing to the distribution of intermetallics in the extrusion direction (Figure 4a) [54]. The intermetallics, such as Q-AlMgSiCu and the Fe-rich phases, act as cathodes relative to the matrix; hence, the material around such phases is dissociated. In the HAZ, IGC and pits are observed along the grain boundaries because of the presence of anodic Mg2Si particles, which precipitate in this zone and completely dissolve in the NaCl solution (Figure 11b) [12,55]. The AW ER4043 and FMg0.6 joints in the second pass (shown in Figure 11c) exhibit a dendritic structure susceptible to localized corrosion, a phenomenon consistently observed across all tested samples, particularly alongside eutectic Si and Fe-rich intermetallic phases. The morphology of the pits in the first pass of the ER4043 and FMg0.6 joints is found to resemble that in the second pass. Figure 11e illustrates a case of aggressive corrosion observed in the AW ER5356 joint, where the pits are found not only at the dispersed β-Al2Mg3 phase but also throughout the matrix, leading to coalescence of the pits and severe damage of the FZ.
Figure 11d shows the morphology of the pitting corrosion in the first and second passes of the ER4043 and FMg0.6 joints after PWHT. The fine and spheroidized Si particles, as well as the fine Fe intermetallics, lead to localized dissolution of the matrix around the particles, as shown in the attached image in Figure 11d. Moreover, the larger the Fe-rich intermetallic particles, the deeper the pit formed around them will be (Figure 11d). Figure 11f shows the pitting corrosion in the ER5356 joint under the PWHT condition, featuring a wider distribution, coalescence, and deeper pits compared with the AW condition. Additionally, the occurrence of IGC is attributed to the presence of β-Al2Mg3, distinguishing it from the ER4043 and FMg0.6 joints.

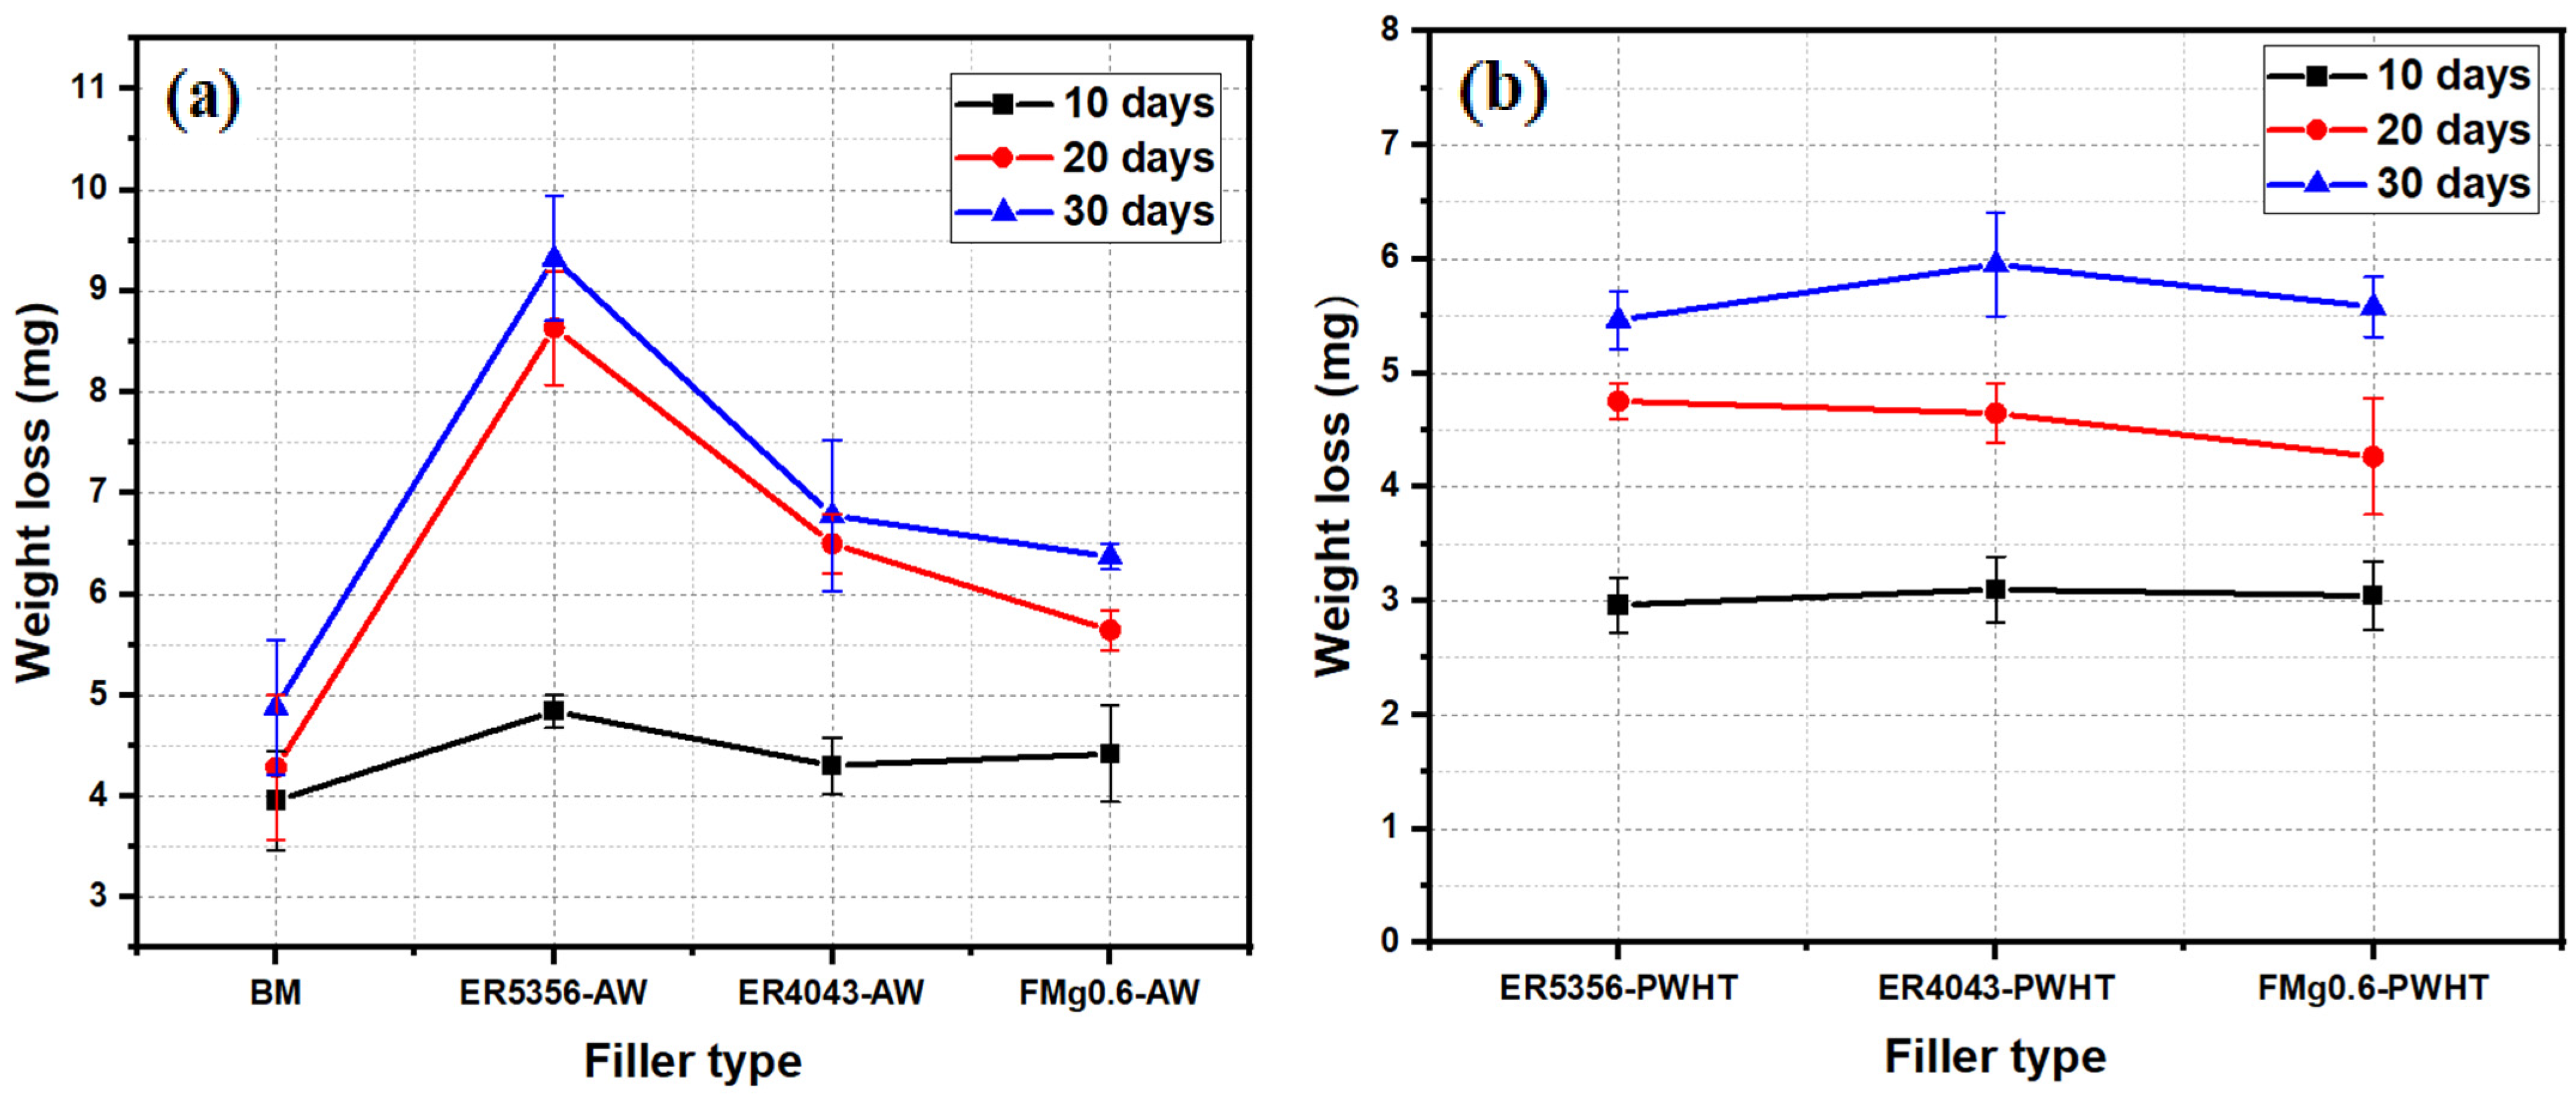
3.5.3. Immersion Tests

Immersion tests are a common method used to evaluate the corrosion behavior of welded aluminum alloys based on the weight loss over a certain period. The higher the weight loss, the lower the corrosion resistance of the material. The weight losses from the immersion tests for the AW specimens are shown in Figure 12a. The BM exhibits the lowest weight loss because of its high corrosion resistance, as indicated by its high corrosion potential (Ecorr). The ER5356 joint exhibits the highest weight loss over time because its FZ acts as an anode relative to the BM and HAZ, leading to an increased tendency toward galvanic corrosion, as reported by Nikseresht et al. [52]. This joint shows significant potential differences between the BM and FZ (Ecorr(BM) > Ecorr(FZ)) and between the HAZ and FZ (Ecorr(HAZ) > Ecorr(FZ)), as indicated in Table 3, simultaneously promoting corrosion in the HAZ and FZ. Conversely, the ER4043 and FMg0.6 joints initially exhibit lower weight losses than the ER5356 joint. The weight loss of both joints increases over a period of 20 d owing to electrolyte corrosion. After 30 d, the weight loss of the ER4043 joint remains stable, while the FMg0.6 joint exhibits a slight increase, possibly because of oxide layer formation [8,56]. The lower potential differences between the HAZ and FZ in these joints contributes to less weight loss compared with the ER5356 joint.
Figure 12b shows the immersion test results for the PWHT joints. The weight losses in all PWHT joints are generally lower than those in the AW condition owing to the absence of the HAZ. All of the HAZ areas are similar to the BM after PWHT (Figure 5c,d); hence, the exposed anodic zone is only the FZ. Moreover, PWHT leads to modification of the microstructure by dissolving most of the eutectic Mg2Si and spheroiding the eutectic Si. This leads to a reduction in the microgalvanic cells between the phase and the matrix; hence, lower corrosion potentials are obtained compared to the AW condition (Table 3). For each immersion period, the weight losses of the three joints are similar. This is due to the limited area of the anode (only the FZ), which leads to a reduction in the diffusion rate of Al ions in the electrolyte, thus resulting in low Al oxidation kinetics [57].

4. Discussion

These results demonstrate that the use of commercial ER4043 and ER5356 fillers for welding high-strength AA6xxx alloys results in inferior tensile and fatigue strengths. This is attributed to the low dilution and insufficient Mg content in the weldments of ER4043, and the non-heat-treatable nature and presence of brittle β-Al2Mg3 in the ER5356 joint. The augmentation of Mg in the FMg0.6 filler results in an increased Mg content in the FZ, leading to high solid-solution strengthening in the AW condition. The strengths of both the ER5356 and FMg0.6 joints in their AW condition are primarily determined by the strength of the HAZ, which is the weakest region in the entire joint. Consequently, the FMg0.6 joint with a high Mg content does not significantly improve the tensile strength in the AW condition compared with the ER5356 joint. In the case of the AW ER4043 joint, the tensile strength is marginally lower than that of the FMg0.6 joint owing to the relatively low Mg content in the FZ. Regarding the fatigue strength, the FMg0.6 joint demonstrates superior performance compared to the two commercial filler joints. The ER5356 joint shows the worst corrosion resistance among the three joints studied, while that of the AW FMg0.6 joint is slightly inferior to that of ER4043.
Compared with the commercial ER4043 and ER5356 filler joints, the PWHT FMg0.6 joint exhibits the highest tensile and fatigue strengths (Figure 6b and Figure 7b) owing to precipitation of a high-number density of strengthening β″-Mg2Si precipitates in the FZ during PWHT [36,42]. The lower tensile and fatigue strengths in the PWHT ER4043 and ER5356 joints are attributed to the low Mg content in the FZ and precipitation of the brittle β-Al2Mg3, respectively. The corrosion performances of both the ER4043 and FMg0.6 joints are remarkably improved after PWHT because of the dissolution of the eutectic Mg2Si, and the FMg0.6 joint shows a similar corrosion rate and weight loss to those of the ER4043 joint. However, the ER5356 joint exhibits the highest corrosion rate, which is attributed to precipitation of β-Al2Mg3 at the grain boundaries and inside of the grains. In brief, the incorporation of 0.6% Mg in the FMg0.6 filler significantly enhances both the tensile and fatigue properties of the joints with satisfactory corrosion resistance when welding the high-strength AA6011 alloy.

5. Conclusions

  • The ER4043 and FMg0.6 joints exhibited finer grain sizes in the fusion zone than the ER5356 joint in the AW condition. After PWHT, precipitation of brittle β-Al2Mg3 was observed at the grain boundaries and inside of grains in the ER5356 joint. In contrast, the ER4043 and FMg0.6 joints underwent spheroidization of eutectic Si and partial fragmentation of the Fe-rich intermetallics.
  • Owing to the high Mg content in the FZs, the AW ER5356 and FMg0.6 joints exhibited higher microhardness values and tensile strengths than the ER4043 joint. The fractures in the former occurred in the softest HAZ, whereas the fractures in the ER4043 joint occurred in the FZ. After PWHT, the FMg0.6 joint exhibited the highest tensile strength among the three joints studied.
  • The FMg0.6 joint presented the highest fatigue strength and best fatigue life compared with the commercial ER4043 and ER5356 joints in both the AW and PWHT conditions, which was attributed to the modification of its filler composition with the addition of Mg. The striation widths of the PWHT samples were in the order of FMg0.6 < ER4043 < ER5356, indicating the lowest fatigue crack propagation rate in the FMg0.6 joint. The fatigue strength and life of the PWHT joints were significantly improved compared with those of their AW counterparts.
  • The ER5356 joint exhibited the lowest corrosion resistance among the three joints studied under all conditions. In the AW state, the FMg0.6 joint exhibited a slightly higher corrosion rate than the ER4043 joint, which was attributed to the high-volume fraction of eutectic Mg2Si. After PWHT, the corrosion resistances of both the ER4043 and FMg0.6 joints improved to a similar level.
  • Considering the overall welding performance, including high tensile strength, superior fatigue properties, and satisfactory corrosion resistance, the FMg0.6 joint outperformed the commercial ER4043 and ER5356 joints studied. Therefore, the newly developed FMg0.6 filler wire is a promising filler metal for welding high-strength 6xxx alloys.
Overall, this study provides valuable insights into the importance of the filler chemistry and post-weld heat treatment for welding performance and properties. The increase in Mg level in Al-Si-Mg 4xxx filler metals can remarkably improve tensile and fatigue strengths and achieve satisfactory corrosion resistance of joints. The main findings obtained by comparing the mechanical and material properties of different filler joints are interesting for the welding industry, thereby laying an excellent initiative for developing novel filler metals for high-strength aluminum fusion welding.

Author Contributions

M.A.: Investigation, formal analysis, writing—original draft preparation; M.J.: Conceptualization, methodology, validation, writing—review and editing, A.M.: Conceptualization, validation, writing—review and editing; X.-G.C.: Conceptualization, methodology, validation, writing—review and editing, project administration. All authors have read and agreed to the published version of the manuscript.

Funding

This research was funded by Natural Sciences and Engineering Research Council of Canada under Grant No. CRDPJ 514651-17, the Mitacs Acceleration under Grant No. IT25424, and Rio Tinto Aluminum. Special thanks are given to Fatemeh Mirakhorli of the National Research Council of Canada, Saguenay, Québec for the welding tests.

Data Availability Statement

Supporting data could be made available upon reasonable request.

Conflicts of Interest

The authors declare no conflicts of interest.

References

  1. Benedyk, J. Aluminum alloys for lightweight automotive structures. In Materials, Design and Manufacturing for Lightweight Vehicles; Elsevier: Amsterdam, The Netherlands, 2010; pp. 79–113. [Google Scholar]
  2. Sokoluk, M.; Yao, G.; Pan, S.; Cao, C.; Li, X. High Strength Nanotreated Filler Material for TIG Welding of AA6061. In Light Metals 2020; Springer: Berlin/Heidelberg, Germany, 2020; pp. 380–385. [Google Scholar]
  3. Verma, R.P.; Pandey, K.; Sharma, Y. Effect of ER4043 and ER5356 filler wire on mechanical properties and microstructure of dissimilar aluminium alloys, 5083-O and 6061-T6 joint, welded by the metal inert gas welding. Proc. Inst. Mech. Eng. B J. Eng. Manuf. 2015, 229, 1021–1028. [Google Scholar] [CrossRef]
  4. Fattahi, M.; Rostami, M.; Amirkhanlu, F.; Arabian, N.; Ahmadi, E.; Moayedi, H.J.D. Fabrication of aluminum TIG welding filler rods reinforced by ZrO2/reduced graphene oxide hybrid nanoparticles via accumulative roll bonding. DRM 2019, 99, 107518. [Google Scholar] [CrossRef]
  5. Naing, T.H.; Muangjunburee, P. Metallurgical and mechanical characterization of MIG welded repair joints for 6082-T6 aluminum alloy with ER 4043 and ER 5356. Trans. Indian Inst. Met. 2022, 75, 1583–1593. [Google Scholar] [CrossRef]
  6. Sokoluk, M.; Cao, C.; Pan, S.; Li, X. Nanoparticle-enabled phase control for arc welding of unweldable aluminum alloy 7075. Nat. Commun. 2019, 10, 98. [Google Scholar] [CrossRef]
  7. Bethea, J.F. Gas Tungsten Arc Welding of Aluminum Alloys with Nanocomposite 4943 Filler Material. Master’s Thesis, University of California, Los Angeles, CA, USA, 2019. [Google Scholar]
  8. Hu, Z.; Wan, L.; Lü, S.; Zhu, P.; Wu, S. Research on the microstructure, fatigue and corrosion behavior of permanent mold and die cast aluminum alloy. Mater. Des. 2014, 55, 353–360. [Google Scholar] [CrossRef]
  9. Yan, S.; Xing, B.; Zhou, H.; Xiao, Y.; Qin, Q.-H.; Chen, H. Effect of filling materials on the microstructure and properties of hybrid laser welded Al-Mg-Si alloys joints. Mater. Charact. 2018, 144, 205–218. [Google Scholar] [CrossRef]
  10. Bach, L.; Son, D.; Phong, M.; Thang, L.; Bian, M.; Nam, N. A study on Mg and AlN composite in microstructural and electrochemical characterizations of extruded aluminum alloy. Compos. B. Eng. 2019, 156, 332–343. [Google Scholar] [CrossRef]
  11. Zhang, D.-Q.J.; Gao, X.; Joo, L.-X.; Lee, H.G.; Yong, K. Effect of laser–arc hybrid welding on fracture and corrosion behaviour of AA6061-T6 alloy. Mater. Sci. Eng. A 2011, 528, 2748–2754. [Google Scholar] [CrossRef]
  12. Majeed, T.; Mehta, Y.; Siddiquee, A.N. Precipitation-dependent corrosion analysis of heat treatable aluminum alloys via friction stir welding, a review. Proc. Inst. Mech. Eng., Part C 2021, 235, 7600–7626. [Google Scholar] [CrossRef]
  13. Nam, N.; Dai, L.; Mathesh, M.; Bian, M.; Thu, V. Role of friction stir welding–traveling speed in enhancing the corrosion resistance of aluminum alloy. Mater. Chem. Phys. 2016, 173, 7–11. [Google Scholar] [CrossRef]
  14. Osório, W.R.; Freire, C.M.; Garcia, A. The role of macrostructural morphology and grain size on the corrosion resistance of Zn and Al castings. Mater. Sci. Eng. A 2005, 402, 22–32. [Google Scholar] [CrossRef]
  15. Rahman, A.M.; Kumar, S.; Gerson, A. Galvanic corrosion of laser weldments of AA6061 aluminium alloy. Corros. Sci. 2007, 49, 4339–4351. [Google Scholar] [CrossRef]
  16. Donatus, U.; Thompson, G.; Omotoyinbo, J.; Alaneme, K.; Aribo, S.; Agbabiaka, O. Corrosion pathways in aluminium alloys. Trans. Nonferrous Met. Soc. China 2017, 27, 55–62. [Google Scholar] [CrossRef]
  17. Fadaeifard, F.; Matori, K.A.; Garavi, F.; Al-Falahi, M.; Sarrigani, G.V. Effect of post weld heat treatment on microstructure and mechanical properties of gas tungsten arc welded AA6061-T6 alloy. Trans. Nonferrous Met. Soc. China 2016, 26, 3102–3114. [Google Scholar] [CrossRef]
  18. Haryadi, G.D.; Kim, S.J. Influences of post weld heat treatment on fatigue crack growth behavior of TIG welding of 6013 T4 aluminum alloy joint (Part 1. Fatigue crack growth across the weld metal). J. Mech. Sci. Technol. 2011, 25, 2161–2170. [Google Scholar] [CrossRef]
  19. Ahmed, M.; Javidani, M.; Mirakhorli, F.; Maltais, A.; Chen, X.G. Developing High-Strength Al-Si-Mg Filler Metals for Aluminum Fusion Welding. J. Mater. Eng. Perform. 2023, 32, 2218–2227. [Google Scholar] [CrossRef]
  20. ASTM E8-04; Standard Test Methods for Tension Testing of Metallic Materials. ASTM International: West Conshohocken, PA, USA, 2004.
  21. ASTM E466-96; Standard Practice for Conducting Force Controlled Constant Amplitude Axial Fatigue Tests of Metallic Materials. ASTM International: West Conshohocken, PA, USA, 2002.
  22. ISO 12107:2003; Metallic Materials, Fatigue Testing, Statistical Planning and Analysis of Data. ISO Standard: Geneva, Switzerland, 2003.
  23. ASTM G102-89; Standard Practice for Calculation of Corrosion Rates and Related Information from Electrochemical Measurements. ASTM International: West Conshohocken, PA, USA, 1999.
  24. GB/T 19746-2005; Corrosion of Metals and Alloys, Alternate Immersion Test in Salt Solution. GBT Standard: Beijing, China, 2005.
  25. GB/T 16545-1996; Corrosion of Metals and Alloys, Removal of Corrosion Products from Corrosion Test Specimens. GBT Standard: Beijing, China, 1996.
  26. Peng, W.; Wu, G.; Lu, R.; Lian, Q.; Zhang, J. The Evaluation on Corrosion Resistance and Dross Formation of Zn–23 wt% Al–0.3 wt% Si–x wt% Mg Alloy. Coatings 2019, 9, 199. [Google Scholar] [CrossRef]
  27. Wang, B.; Xue, S.; Ma, C.; Wang, J.; Lin, Z. Effects of porosity, heat input and post-weld heat treatment on the microstructure and mechanical properties of TIG welded joints of AA6082-T6. Metals 2017, 7, 463. [Google Scholar] [CrossRef]
  28. Easton, M.A.S.; David, H. Improved prediction of the grain size of aluminum alloys that includes the effect of cooling rate. Mater. Sci. Eng. A 2008, 486, 8–13. [Google Scholar] [CrossRef]
  29. Ahmed, M.; Javidani, M.; Maltais, A.; Chen, X.-G. Welding of AA6061-T6 Sheets Using High-Strength 4xxx Fillers: Effect of Mg on Mechanical and Fatigue Properties. Materials 2023, 16, 3832. [Google Scholar] [CrossRef]
  30. Seifeddine, S.; Svensson, I.L. The influence of Fe and Mn content and cooling rate on the microstructure and mechanical properties of A380-die casting alloys. Metall. Res. Technol. 2009, 27, 11–20. [Google Scholar]
  31. Kumar, S.; Grant, P.S.; O’Reilly, K.A.Q. Fe bearing intermetallic phase formation in a wrought Al–Mg–Si alloy. Trans. Indian Inst. Met. 2012, 65, 553–557. [Google Scholar] [CrossRef]
  32. Moustafa, M.A. Effect of iron content on the formation of β-Al5FeSi and porosity in Al–Si eutectic alloys. Mater. Process. Technol. 2009, 209, 605–610. [Google Scholar] [CrossRef]
  33. Ahmed, M.; Javidani, M.; Maltais, A.; Chen, X.-G. Microstructure and Mechanical Properties of High-Strength AA6011 Aluminum Alloy Welding with Novel 4xxx Filler Metals. Materials 2024, 17, 380. [Google Scholar] [CrossRef]
  34. Pérez, J.S.; Ambriz, R.R.; López, F.F.C. Recovery of mechanical properties of a 6061-T6 aluminum weld by heat treatment after welding. Metall. Mater. Trans. A 2016, 47, 3412–3422. [Google Scholar] [CrossRef]
  35. Poznak, A.; Freiberg, D.; Sanders, P. Automotive wrought aluminium alloys. In Fundamentals of Aluminium Metallurgy; Elsevier: Amsterdam, The Netherlands, 2018; pp. 333–386. [Google Scholar]
  36. Leo, P.; D’Ostuni, S.; Casalino, G. Hybrid welding of AA5754 annealed alloy: Role of post weld heat treatment on microstructure and mechanical properties. Mater. Des. 2016, 90, 777–786. [Google Scholar] [CrossRef]
  37. Liu, K.; Algendy, A.; Gu, J.; Chen, X.-G. Evolution of Microstructure and Dispersoids in Al-Mg 5xxx Alloys Under Wire+ Arc Additive Manufacturing and Permanent Mold Casting. In TMS 2021 150th Annual Meeting & Exhibition Supplemental Proceedings; Springer: Berlin/Heidelberg, Germany, 2021; pp. 165–175. [Google Scholar]
  38. Ha, S.H.; Yoon, Y.O.; Kim, S.K. Effects of Si Addition on the Microstructure and Tensile Property of Al-xMg Alloys with Al2Ca during Heat Treatment (x: 5 and 7 Mass%). In Materials Science Forum; Trans Tech Publications Ltd.: Bäch, Switzerland, 2017; pp. 109–113. [Google Scholar]
  39. Johannesson, B.; Cáceres, C. Effect of Si additions and heat treatment on the mechanical behaviour of an Al–5Mg casting alloy. Int. J. Cast Met. Res. 2004, 17, 94–98. [Google Scholar] [CrossRef]
  40. Coniglio, N.; Cross, C.E.; Michael, T.; Lammers, M. Defining a critical weld dilution to avoid solidification cracking in aluminum. Weld. J. 2008, 87, 237s–247s. [Google Scholar]
  41. Mousavi, M.G.; Cross, C.E.; Grong, Ø.; Hval, M. Controlling weld metal dilution for optimised weld performance in aluminium. Sci. Technol. Weld. Join. 1997, 2, 275–278. [Google Scholar] [CrossRef]
  42. Wen, W.; Zhao, Y.; Morris, J.G. The effect of Mg precipitation on the mechanical properties of 5xxx aluminum alloys. Mater. Sci. Eng. A 2005, 392, 136–144. [Google Scholar] [CrossRef]
  43. Ma, M.; Lai, R.; Qin, J.; Wang, B.; Liu, H.; Yi, D. Effect of weld reinforcement on tensile and fatigue properties of 5083 aluminum metal inert gas (MIG) welded joint: Experiments and numerical simulations. Int. J. Fatigue 2021, 144, 106046. [Google Scholar] [CrossRef]
  44. Ren, L.; Gu, H.; Wang, W.; Wang, S.; Li, C.; Wang, Z.; Zhai, Y.; Ma, P. Effect of Mg content on microstructure and properties of Al–Mg alloy produced by the wire arc additive manufacturing method. Materials 2019, 12, 4160. [Google Scholar] [CrossRef]
  45. ASTM G59-97; Standard Test Method for Conducting Potentiodynamic Polarization Resistance Measurements. ASTM International: West Conshohocken, PA, USA, 2003.
  46. Won, S.; Seo, B.; Park, J.M.; Kim, H.K.; Song, K.H.; Min, S.H.; Ha, S.-K.; Park, T.K. Corrosion behaviors of friction welded dissimilar aluminum alloys. Mater. Charact. 2018, 144, 652–660. [Google Scholar] [CrossRef]
  47. Adeosun, S.; Sekunowo, O.; Balogun, S.; Obiekea, V. Corrosion behaviour of heat-treated aluminum-magnesium alloy in Chloride and exco environments. Int. J. Corros. 2012, 2012, 927380. [Google Scholar] [CrossRef]
  48. Wei, R.P.; Liao, C.-M.; Gao, M. A transmission electron microscopy study of constituent-particle-induced corrosion in 7075-T6 and 2024-T3 aluminum alloys. Metall. Mater. Trans. A 1998, 29, 1153–1160. [Google Scholar] [CrossRef]
  49. Choi, I.-K.; Cho, S.-H.; Kim, S.-J.; Jo, Y.-S.; Kim, S.-H. Improved corrosion resistance of 5xxx aluminum alloy by homogenization heat treatment. Coatings 2018, 8, 39. [Google Scholar] [CrossRef]
  50. Gupta, R.K.; Zhang, R.; Davies, C.H.J.; Birbilis, N. Influence of Mg content on the sensitization and corrosion of Al-xMg (-Mn) alloys. Corrosion 2013, 69, 1081–1087. [Google Scholar] [CrossRef]
  51. Lin, Y.K.; Wang, S.H.; Chen, R.Y.; Hsieh, T.S.; Tsai, L.; Chiang, C.C. The effect of heat treatment on the sensitized corrosion of the 5383-H116 Al-Mg alloy. Materials 2017, 10, 275. [Google Scholar] [CrossRef] [PubMed]
  52. Nikseresht, Z.; Karimzadeh, F.; Golozar, M.; Heidarbeigy, M. Effect of heat treatment on microstructure and corrosion behavior of Al6061 alloy weldment. Mater. Des. 2010, 31, 2643–2648. [Google Scholar] [CrossRef]
  53. Abuaisha, R. Corrosion Behaviour of Friction Stir Welded AA5xxx Aluminium Alloys; The University of Manchester: Manchester, UK, 2013. [Google Scholar]
  54. Chen, G.C.; Wang, Q.; Du, B.; Ming, Z. Microstructure evolution and tensile mechanical properties of thixoformed high performance Al-Zn-Mg-Cu alloy. Met. Mater. Int. 2015, 21, 897–906. [Google Scholar] [CrossRef]
  55. Xie, W.H.; Yang, T.; Fan, C.; Lin, S.; Xu, W. Comparison of microstructure, mechanical properties, and corrosion behavior of Gas Metal Arc (GMA) and Ultrasonic-wave-assisted GMA (U-GMA) welded joints of Al–Zn–Mg alloy. J. Mater. Process. Technol. 2020, 277, 116470. [Google Scholar] [CrossRef]
  56. Zaid, B.; Saidi, D.; Benzaid, A.; Hadji, S. Effects of pH and chloride concentration on pitting corrosion of AA6061 aluminum alloy. Corros. Sci. 2008, 50, 1841–1847. [Google Scholar] [CrossRef]
  57. Cramer, S.D.; Covino, B.S., Jr. Corrosion: Fundamentals, Testing, and Protection, Volume 13A, ASM Handbook. J. Therm. Spray Technol. 2003, 12, 459. [Google Scholar]
Figure 1. Dimensions of the tensile and fatigue samples in mm.
Processes 12 01172 g001
Figure 2. Schematic drawing of the immersion test, (a) sample dimensions, and (b) the test set up. All dimensions are in mm.
Processes 12 01172 g002
Figure 3. Grain morphologies of the different zones under AW condition. (a) BM, (b,c) welded zones in ER5356 and ER4043 joints, respectively; (d,e) the FZs in the 1st and 2nd passes in ER5356 joint, respectively; (f,g) the FZs in the 1st and 2nd passes in FMg0.6 joint, respectively; (h) the boundary between the 1st and the 2nd passes in ER4043 joint. The values in green indicate the grain size, and the green arrows point to the porosity.
Processes 12 01172 g003
Figure 4. (a,b) Microstructure of the BM. (ce) microstructures of the 2nd pass of ER5356, ER4043, and FMg0.6 joints under AW condition, respectively. (fh) Microstructures of the second pass of the ER5356, ER4043, and FMg0.6 joints after PWHT, respectively.
Processes 12 01172 g004
Figure 5. Microhardness profiles, (a,b) the first and second passes in AW condition; (c,d) the first and second passes after PWHT.
Processes 12 01172 g005
Figure 6. The tensile properties of the joints: (a) in AW condition, and the insets showing the typical fractures occurred in the tensile sample; (b) in PWHT condition.
Processes 12 01172 g006
Figure 7. The S-N curves of the welded joints, (a) in AW condition, and (b) in PWHT condition.
Processes 12 01172 g007
Figure 8. Fatigue fractures in the PWHT condition, (ac) the initiation, propagation, and final zones of ER5356 joint; (df) the initiation, propagation, and final zones of ER4043 joint; (gi) the initiation, propagation, and final zones of FMg0.6 joint.
Processes 12 01172 g008
Figure 9. Potentiodynamic polarization curves (a) in AW, (b) in PWHT conditions, and (c) an example showing the Tafel extrapolation for determining Icorr and Ecorr.
Processes 12 01172 g009
Figure 10. Macroscopic images of the pitting corrosion in the corroded surfaces, (a) BM, (e) HAZ, (bd) three welded joints in AW condition; (fh) three welded joints in PWHT condition.
Processes 12 01172 g010
Figure 11. Surface morphology of pits after polarization in 3.5 wt.% NaCl solution, (a) BM, (b) RZ in HAZ, (c,d) the second pass of FMg0.6 joint in AW and PWHT conditions, respectively. (e,f) The second pass of ER5356 joint in the as-welded and PWHT conditions, respectively.
Processes 12 01172 g011
Figure 12. Results of the immersion corrosion tests (a) in AW and (b) in PWHT conditions.
Processes 12 01172 g012
Table 1. Chemical compositions of BM and three filler wires (wt.%).
SiMgMnFeCu
BM (6011)0.920.750.450.170.64
ER40434.970.0240.020.16-
ER53560.0650.10.150.01
FMg0.66.230.60.230.140.011
Table 2. The welding parameters used.
Current
(Amp.)
Voltage
(V)
Travel Speed
(m/min)
Wire Feed Speed
(m/min)
Pass 1Pass 2Pass 1Pass 2Pass 1Pass 2Pass 1Pass 2
ER53561328718.817.20.50.2753.2
ER4043 & FMg0.6163 ± 4110 ± 521.5 ± 0.522 ± 0.70.50.274.5 ± 0.33.2
Table 3. The corrosion parameters obtained from the potentiodynamic polarization tests.
SamplesEcorr (mV)Icorr (µA/cm2)Corrosion Rate (µm/y)
BM−602.912.2324.31
HAZ−623.210.42113.58
ER5356-AW−666.1513.35145.52
ER4043-AW−635.027.1978.37
FMg0.6-AW−620.279.1399.52
ER5356-PWHT−680.3516.4178.76
ER4043-PWHT−630.075.5160.06
FMg0.6-PWHT−628.124.8552.87
Disclaimer/Publisher’s Note: The statements, opinions and data contained in all publications are solely those of the individual author(s) and contributor(s) and not of MDPI and/or the editor(s). MDPI and/or the editor(s) disclaim responsibility for any injury to people or property resulting from any ideas, methods, instructions or products referred to in the content.

