Abstract
Rooftop photovoltaic (RPV) systems are valuable clean-energy-efficient technology that facilitates the transition toward energy sustainability in residential buildings. Hence, the government in Jordan implemented the feed-in-tariffs (FiT) policy to motivate residents’ willingness to install RPV systems. However, the quality of RPV products and services is a key determinant of social acceptance to install RPV systems. Hence, manufacturers and suppliers are working closely with adopters to design and manufacture RPV systems that meet or exceed their expectations. Still, there is a need to develop a quantitative assessment to examine the effects of this FiT policy and the quality of RPV systems on energy security. This study, therefore, develops a system dynamics model to examine the effects of the FiT policy and the quality of RPV products and services on social acceptance to install RPV systems. To achieve this objective, several hypotheses were established related to the main model factors, including the quality of services, complaint reduction, performance ratio, payback period and warranty, and FiT price, with a willingness to install RPV systems. Then, a system dynamics model was constructed. The simulation results reveal the significant factor that impacts energy goals. Moreover, from the end of the year 2030 to the end of 2050, RPV installations, generated power, and CO2 emission reductions are expected to increase from 0.681 GW to 72.83 GW, from 1.07 to 125.74 TWh, and from 0.680 to 79.59 million tons of CO2, respectively. Optimization was performed to maximize the three objectives under the uncertainty of key model variables. The optimal factor values can significantly increase the current energy goals by about 20%. In conclusion, collecting, analyzing, and evaluating adopter input and feedback on RPV systems regarding their design and technology and manufacturing and the post-services of RPV systems significantly influence energy sustainability in residential buildings. In addition, government support through investing in the FiT policy can boost RPV installations in residential buildings.
1. Introduction
Rooftop solar photovoltaic (RPV) technology plays a key role in achieving significant economic, energy sustainability, and environmental gains [1]. The RPV market has developed rapidly, resulting in cutting down expensive energy consumption [2]. RPV installations make up 50% of the total rooftop area and generate a maximum of 1.132 GWh/year of electricity generation. Studies [3,4] show that RPV systems can provide approximately 50% to over 100% of the electricity needed to run units of residential buildings. Consequently, governments and manufacturers are challenged to implement effective plans to motivate adopters to boost RPV adoption, secure clean energy, and reduce dependency on traditional nonenvironmentally friendly and scarce energy sources [5,6].
Enhancing adopter satisfaction to install RPV systems is the key determinant for moving toward the sustainability and security of solar energy [7,8]. Adopter satisfaction is the overall affective response to a perceived discrepancy between prior expectations and perceived changes in energy consumption and environmental impacts after installing solar RPV systems [9,10,11]. A poor manufacturing and service quality of RPV products and systems could negatively affect satisfaction with RPV systems [6,12,13,14]. Hence, to gain a competitive advantage and enhance adopter satisfaction, manufacturers and suppliers should regularly keep increasing contact with adopters to understand their requirements and expectations of RPV systems. The assessment of adopter satisfaction with RPV systems regarding various technical and economic aspects, including the quality of service, complaints, performance ratio, and payback period and warranty, is a key activity for the continual improvement of RPV systems and products [15,16,17]. The collected input information and feedback on the quality of manufactured/supplied RPV systems and post-delivery services should be utilized to develop and manufacture high-quality, reliable, and cost-effective RPV systems and products and enhance adopters’ satisfaction with RPV systems and products [18].
Furthermore, increasing willingness to install is important to achieve energy security. Hence, there is government support through adopting effective policies, including the feed-in-tariffs (FiT) policy [19,20]. Through the FiT policy, governments support adopters to own renewable energy generation systems on a net measurement basis to cover their consumption and earn profits for their surplus generated electricity transferred into the grid [21]. The annual FiT costs are paid to adopters directly proportional to the surplus amount from the power generated and the FiT price. Typically, when the FiT price increases, the rate of investment improves and thereby increases the annual RPV system installations. The FiT cost depends on the electricity price, initial cost, rate of investment, and FiT price. The effects of these cost elements should be carefully determined to maximize RPV systems and product installations.
Jordan has massive solar energy potential, with the average solar radiation ranging between 5 and 7 (kWh/m2). The majority of Jordanian cities have sun irradiation of greater than 5.3 kWh/m2/day [22,23]. The residential market accounts for 72% of the rapid expansion in the building and construction industry [24]. This has resulted in rapid domestic demand for RPV systems, resulting in cutting down expensive energy consumption in households. Residential buildings consume about 43% of the total electrical energy consumption in Jordan, and demand for energy increases at an annual rate of 3% [25,26]. Furthermore, imported conventional energy resources contribute to a very high level of greenhouse gas emissions (GHG) per capita at about 0.06% of the world’s total CO2 emissions [27,28]. Consequently, effective renewable policies are necessary to increase willingness to install RPV technology and thereby boost installations of RPV technology in residential buildings. The adoption of the FiT policy is an attractive decision to achieve energy goals. Moreover, effective manufacturers and supplier initiatives are important to increase adopter satisfaction with the technical and economic aspects of RPV systems and products and thereby achieve economic and environmental benefits.
Generally, the quality of RPV systems can significantly affect the adopter intention to install RPV systems. Manufacturers are, therefore, required to identify adopter preferences on RPV systems to design and manufacture high-quality RPV systems that meet or exceed adopter satisfaction. Then, support from local governments can boost the adoption of RPV systems and products. Most previous studies were conducted to explore the impact of renewable policies, including subsidies and FiT policies on energy goals. However, the combined effect of adopter satisfaction and willingness to install through the FiT energy policy has rarely been examined in previous studies. Further, system dynamics is an effective technique to establish causal relationships and carry out computer simulations to explore the nonlinear behavior of renewable energy systems over time [29,30,31]. In these regards, this research contributes to the renewable energy literature by developing a system dynamics model to investigate the causal relationships between adopters’ overall satisfaction with RPV systems’ technical and economic aspects and willingness to install RPV systems on energy and environmental objectives. Sensitivity analysis is conducted to assess the impacts of uncertainties in the key model parameters, such as the quality of service, complaints, performance ratio, payback period and warranty, and FiT price, on energy goals. The results of this research may provide valuable feedback to decision-makers in the energy sector, as well as the manufacturers of RPV systems, on how to boost the adoption of RPV systems for rooftop residential buildings and maintain high and stable levels of economic growth in the renewable energy sector. The remainder of this research is outlined as follows: Section 2 presents a literature review on RPV systems. Section 3 outlines the proposed system dynamics model. Section 4 analyzes and discusses the research results. Section 5 summarizes the research conclusions.
2. Literature Review
Recently, examining the impacts of renewable energy (RE) policies on energy goals has become a main research interest. Hsu [32] evaluated the impacts of the FiT price and subsidies on solar RPV adoption in Taiwan using a system dynamics approach. Ahmad et al. [20] evaluated the effects of the FiT policy in promoting solar RPV investments in Malaysia using system dynamics. Zhang et al. [33] reviewed the European feed-in-tariffs and changing PV efficiencies and costs. Radomes and Arango [34] employed breakeven and cost-benefit analyses to examine the effects of subsidies and FiT policies on the diffusion of RPV systems in Colombia. Al-Refaie and Lepkova [2] examined the effects of RE policies on energy goals in the case of the small-scale sector using system dynamics. A simulation was then conducted to predict energy objectives under each policy. Energy prediction was also estimated under both FiT and subsidy policies. Al-Refaie and Lepkova [35] proposed a system dynamics model to examine the impacts of saving rates and subsidy policies on RPV installations and CO2 emissions. The results reveal the significant positive effect of saving rates and subsidy policies on energy objectives. Al-Refaie et al. [36] used system dynamics to investigate the effects of satisfaction with RPV systems, advertising, and competition on energy security and CO2 emissions in Jordan. A simulation was used to determine accumulated RPV installation, generated power, and CO2 emission reduction. Al-Refaie and Lepkova [37] employed system dynamics to examine the effects of overall satisfaction with RPV systems and subsidy policy on accumulated RPV installation, generated power, and CO2 emission reduction. The results show that satisfaction with RPV systems is a key factor for enhancing energy goals.
On the other hand, the social acceptance of RPV systems was examined in several previous studies. Mukai et al. [13] investigated the factors affecting adopters’ satisfaction with RPV systems and evaluated the extent to which RPV users understand specification, reliability, and failure risks in Kakegawa City. The results validate the strong causal relationship between adopters’ expectations and their level of satisfaction. Komatsu et al. [6] conducted an econometric analysis of the characteristics of RPV systems in Bangladesh and identified the factors that affect adopters’ satisfaction with RPV systems. The results reveal that frequent battery repairs and replacements of RPV systems negatively influenced adopters’ satisfaction. However, the quality of RPV equipment was found to be positively related to adopters’ satisfaction with RPV systems. Tarigan [38] performed an analysis using a simulation RPV system for electricity power generation at the University of Surabaya, Indonesia. The results show that RPV panels could supply up to 80% of the campus energy demand. Agathokleous and Kalogirou [7] evaluated various alternatives for the installation of RRPV systems on Cyprus Island. The results reveal that the electricity demand can be 100% covered when over 70% of the existing residential stock installs a 3 kW RPV system. Haryadi et al. [39] employed primary survey data from households and industries and an exploratory factor analysis to investigate customer interest in using RPV systems in Indonesia. It was found that education, residence location, and income can positively and significantly influence RPV adoption probability. Qadourah [23] conducted a feasibility analysis for the installation of RPV systems in Jordan under various climate areas and then determined the potential power generation from such systems over their lifetime. Simulation was used to quantify electricity production and consumption under different tariff schemes, capacities, and installation areas. Pan et al. [40] studied four installation scenarios based on rooftop area data and analyzed the technical and economic potential of RPV power generation in China. They found that Guangzhou is suitable for RPV installation, with a maximum potential power generation capacity of 44.06–72.12 billion kWh per year.
This research proposes an extension to the ongoing studies on RPV systems by examining the combined impacts of the social acceptability of RPV systems and the FiT policy on energy goals using a system dynamics approach. This study also assesses the influence of quality determinants, such as the quality of services, complaints, performance ratio, payback period and warranty, and FiT price on the accumulated RPV installations, generated energy, and CO2 emission reductions.
3. Model Development
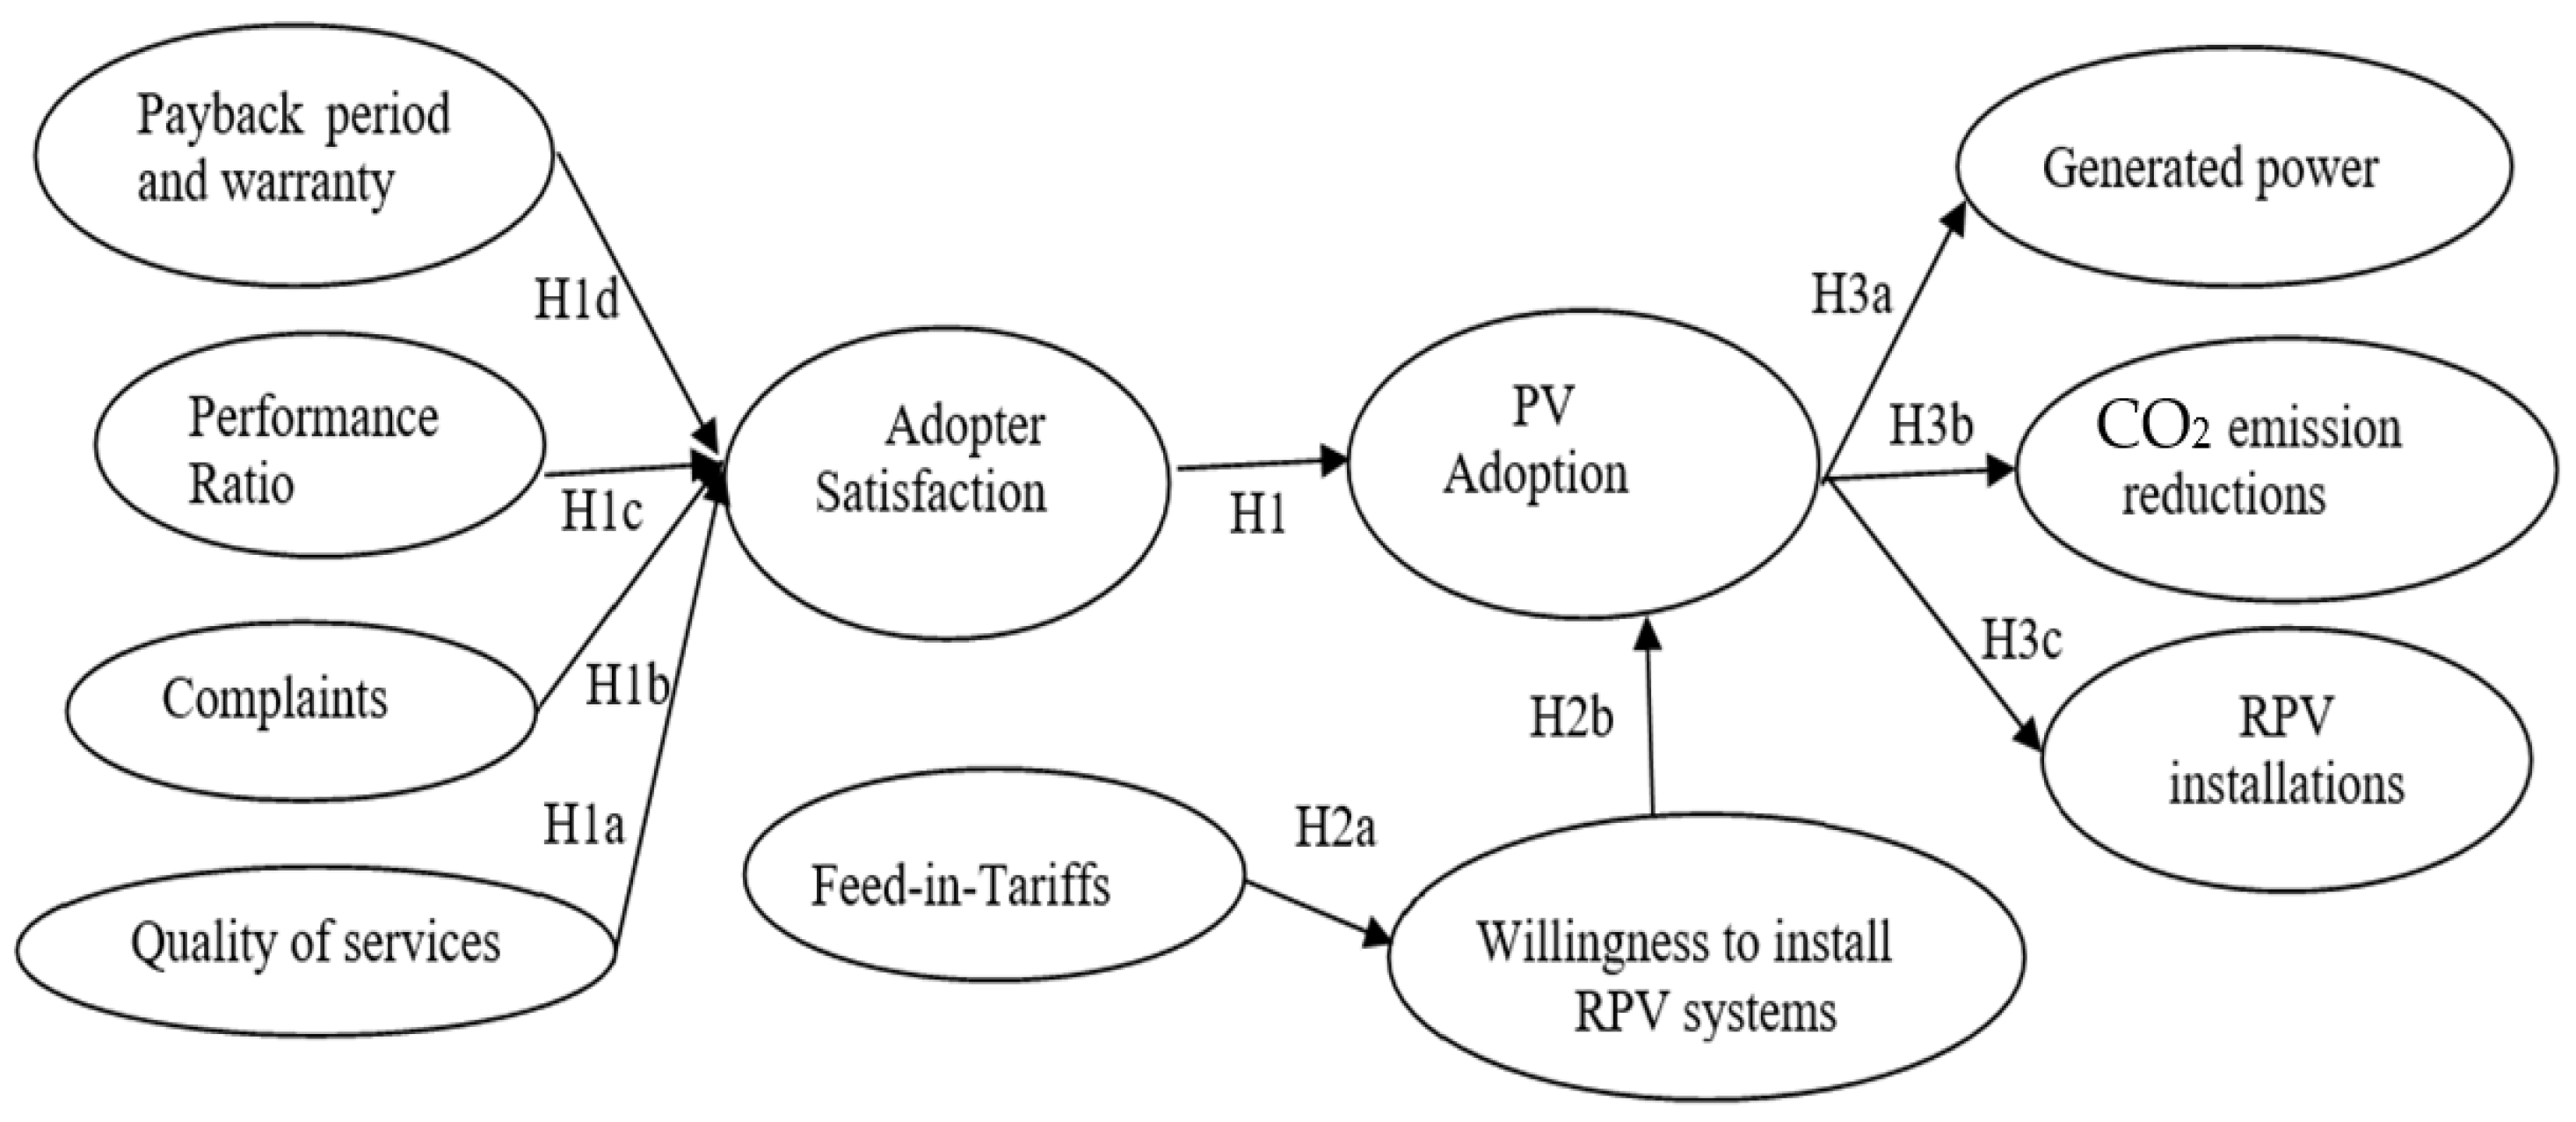
Figure 1 depicts the structural model for the relationships between adopter satisfaction with RPV systems and the FiT policy and willingness to install RPV systems, energy goals, maximum RPV installations, generated power, and CO2 emission reductions. In this figure, the adopter satisfaction with RPV systems has several dimensions, including the quality of services, complaints, performance ratio, and payback period. It is hypothesized that increased adopter satisfaction with RPV systems positively influences the adoption of RPV systems. Moreover, the FiT policy enhances willingness to install RPV systems and increases RPV installations. Finally, increased RPV adoption would lead to enhanced energy objectives measured by RPV installations, generated power, and CO2 emission reductions.

Figure 1.
Model hypotheses.
3.1. Adopter Satisfaction
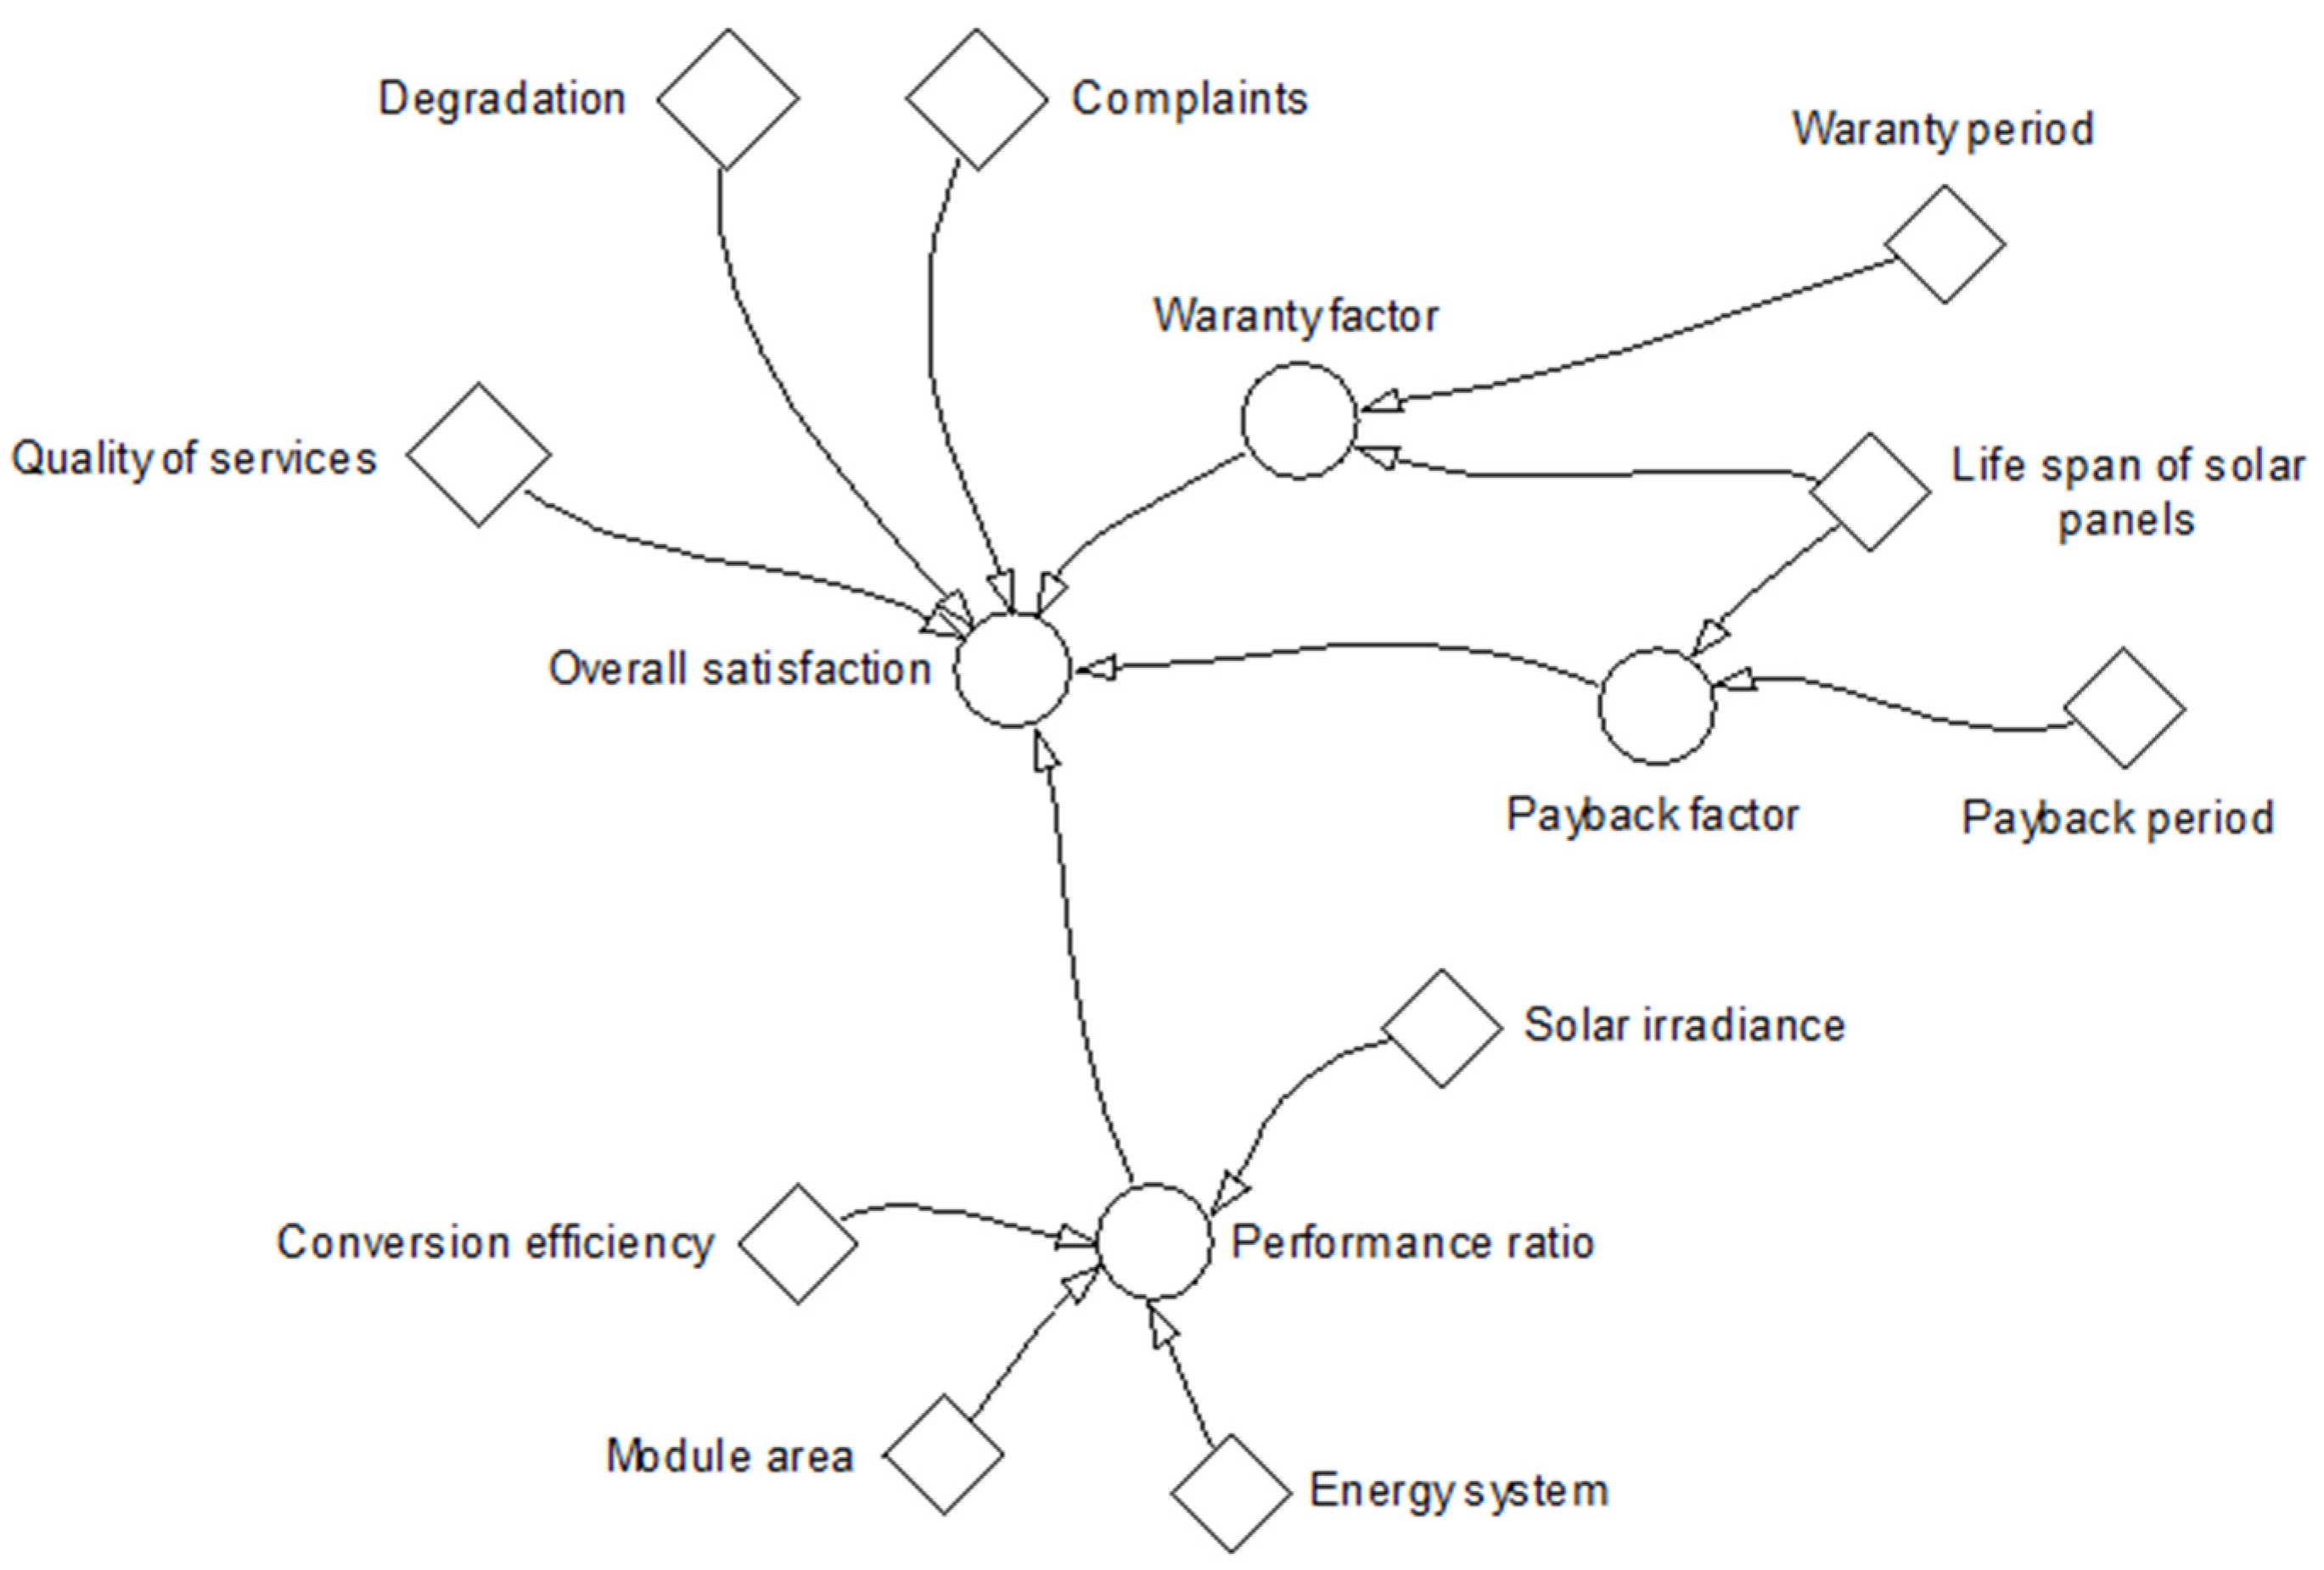
The system dynamics model for the main factors affecting adopter satisfaction with RPV systems is displayed in Figure 2. The main factors that affect adopter satisfaction with RPV systems include the quality of service, complaints, performance ratio, and payback period and warranty. Generally, beneficial changes in factor levels lead to an increased adopter satisfaction with RPV systems and influence attitudes during the pre-choice evaluation of alternative service providers. These factors are presented as follows:
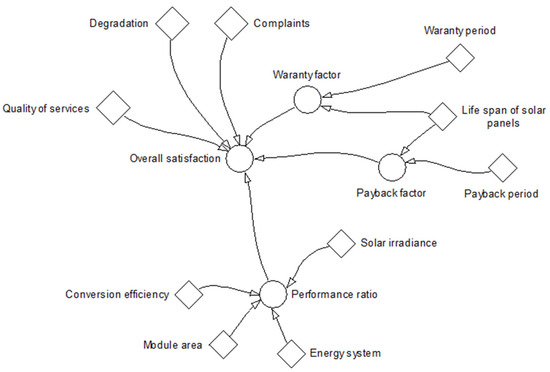
Figure 2.
Satisfaction model.
- (a)
- Quality of services
The quality of services plays an important role in maximizing the economic and environmental gains from RPV systems and products. The RPV service covers the installation and post-sales services, including a warranty against manufacturing flaws, environmental issues, and premature wear and tear. A higher quality of services for RPV systems and products should lead to higher adopter satisfaction.
- (b)
- Complaints
Complaints cover product and service quality problems during all stages of RPV system installation, use, and post-services. In practice, degradation can occur due to manufacturing flaws resulting from poor-quality material or assembly, or flawed cell packaging. Complaints about RPV systems and products can result in decreased satisfaction with RPV systems;
- (c)
- Performance ratio
An RPV system’s efficiency depends on the installation of certain high-tech products. New designs of products can improve RPV quality and thereby enhance adopter satisfaction. The performance ratio (PI) calculated using Equation (1) measures the performance of an RPV system while considering environmental factors (temperature and solar irradiation).
PI = Energy system/(Solar irradiance × Module area × Conversion efficiency)
Based on standard test conditions, the solar irradiation is 1 KW/m2 [2,36,37]. In addition, the performance ratio depends on the module area, solar irradiance, energy system, and conversion efficiency of the installed RPV modules. Generally, the performance ratio ranges from 60% to 90% due to different environmental conditions;
- (d)
- Payback period
Generally, RPV modules can operate reliably with minimal service interruption for a 20- to 25-year duration under a warranty period of 10 years. The payback period is the time needed to cover the initial capital costs and is around 3.4 years. Further, complaint reductions can significantly affect adopters’ satisfaction and can thus reduce the total number of RPV installations.
In reality, satisfied adopters can inform up to 10 out of 20 non-adopters about their poor experience with RPV systems. Therefore, manufacturers and suppliers should work closely with RPV adopters and conduct market research to collect, analyze, and evaluate customer input and feedback to develop RPV systems and products that meet or exceed their expectations.
3.2. FiT Policy Model
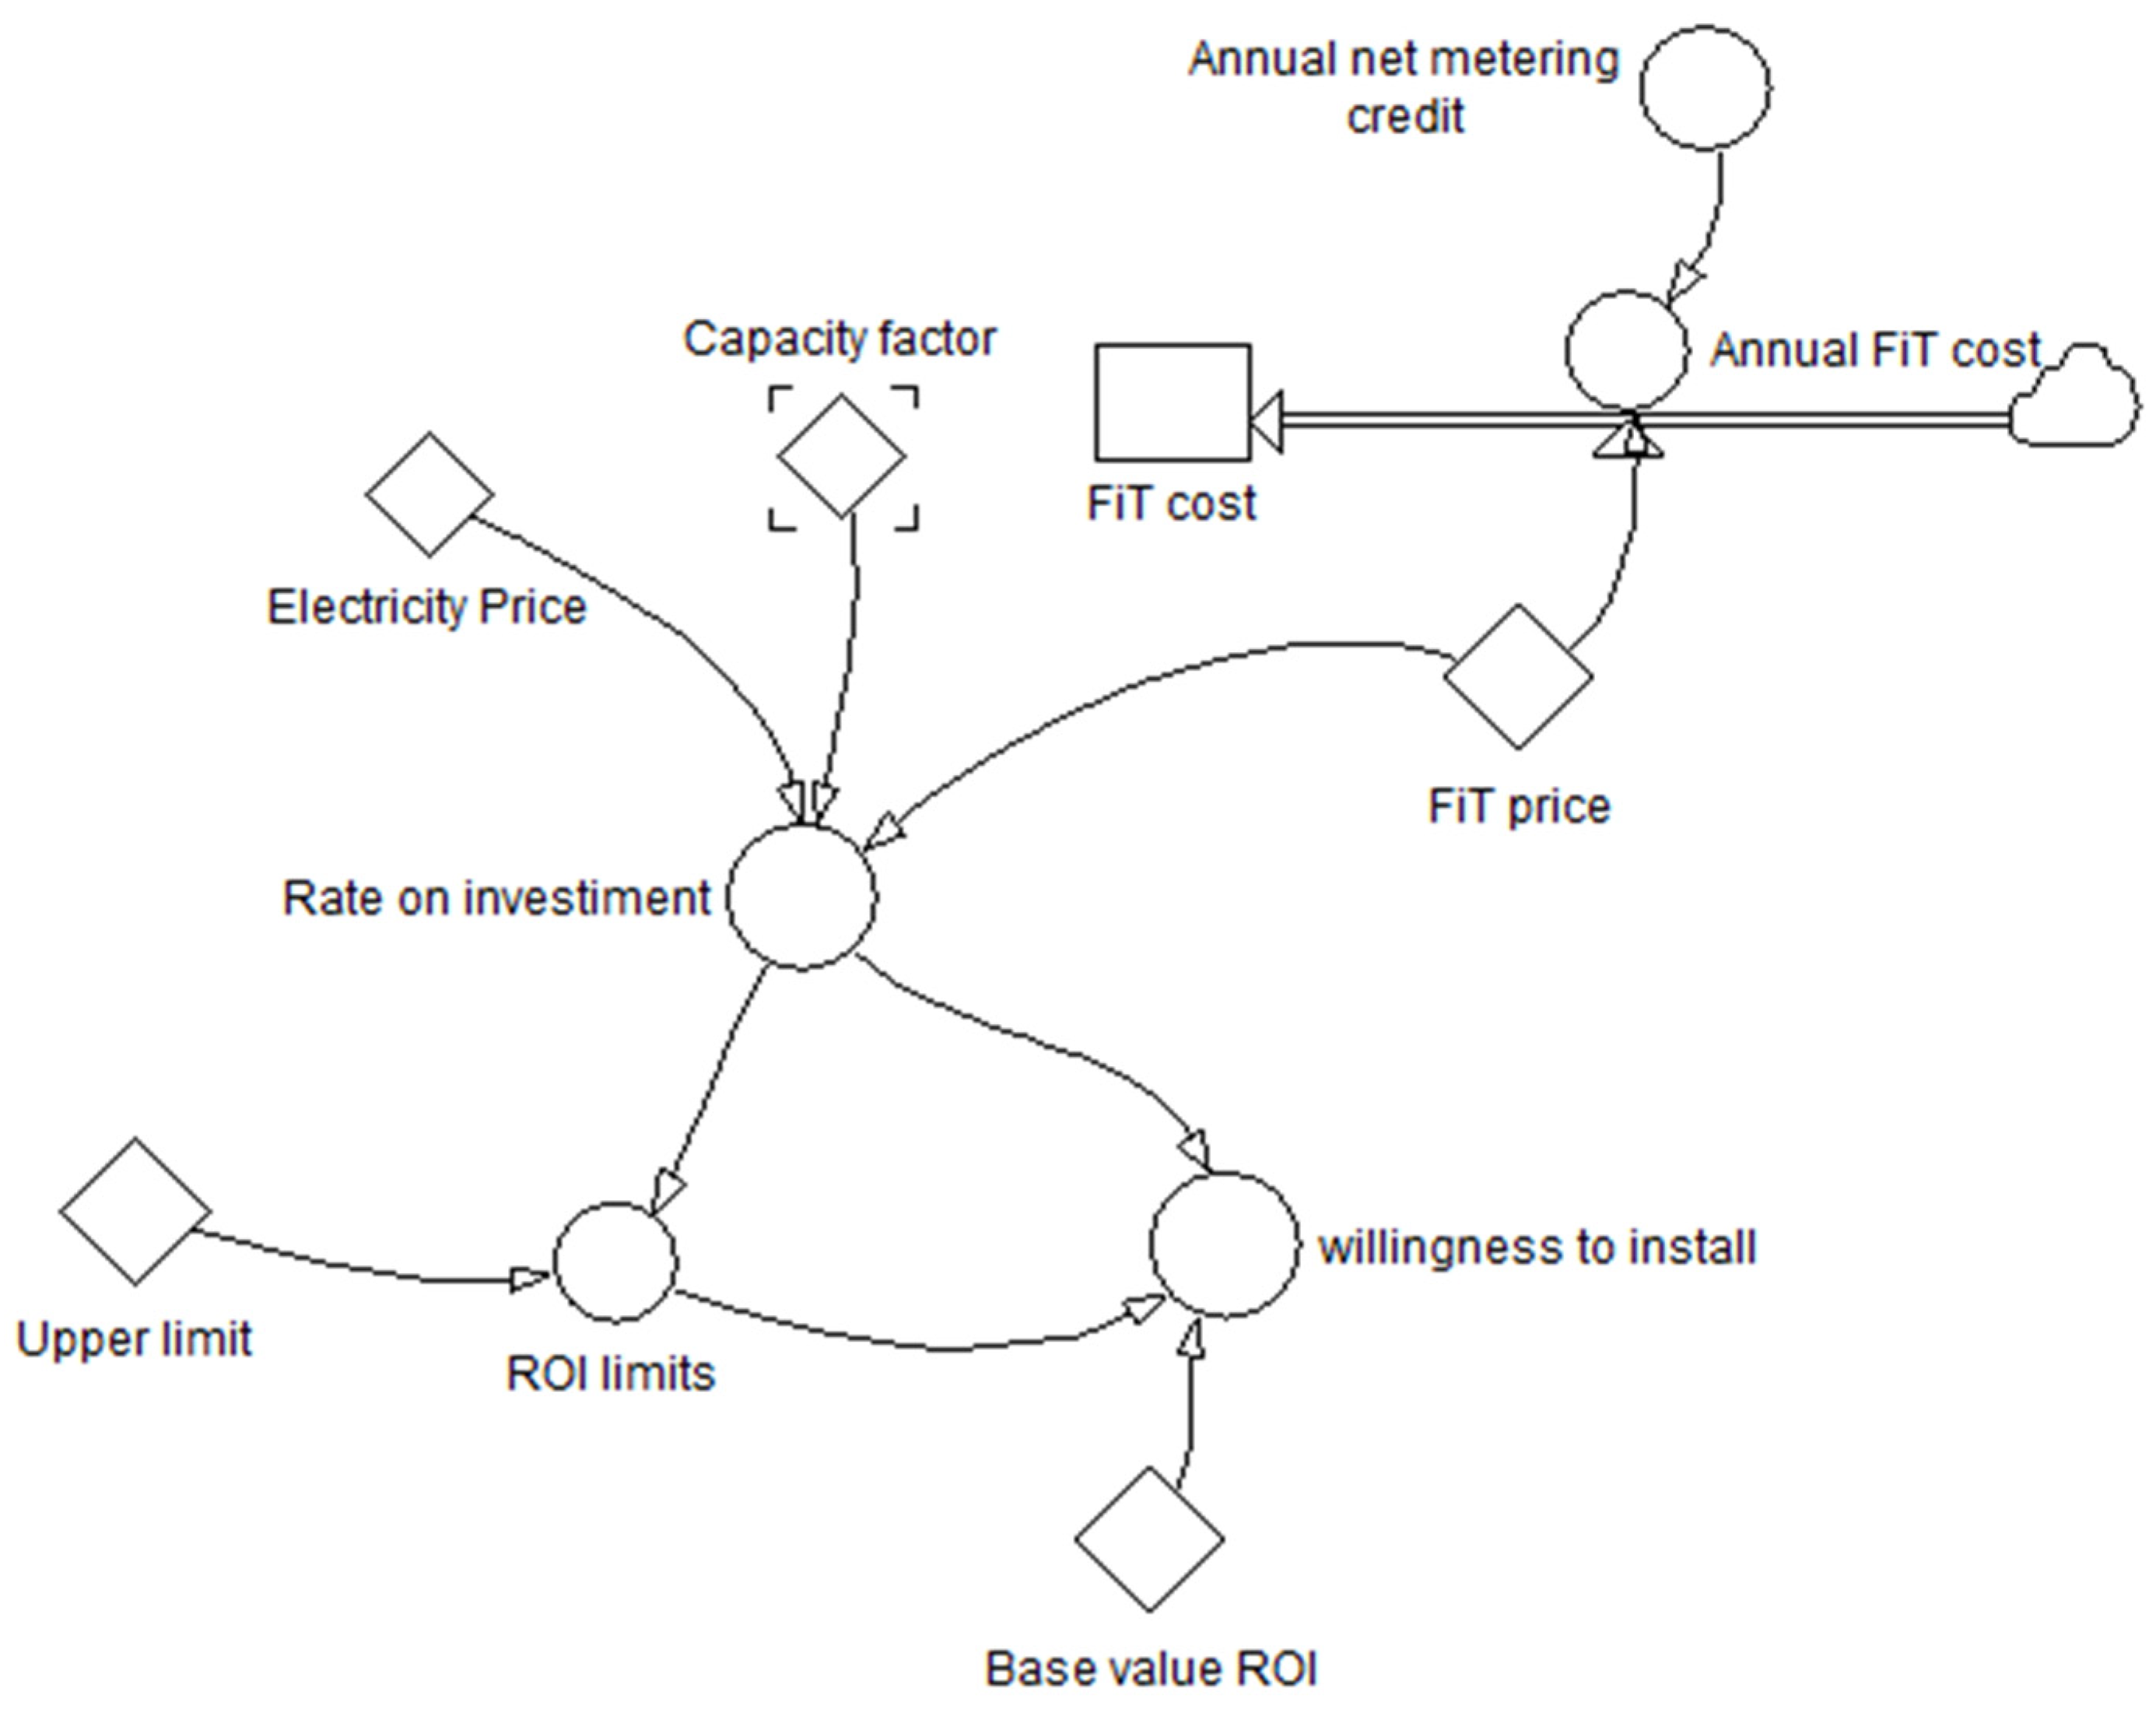
The FiT policy can contribute to influencing non-adopter willingness and intentions to install RPV systems and consequently increase the number of RPV installations. The FiT policy model is shown in Figure 3. The main factors of this model include annual net metering, the FiT price and cost, the electricity price, the rate of investment (ROI) base and upper limit, and willingness to install RPV systems. The idea is that the increase in the ROI generated from the FiT price can result in increasing willingness to install RPV systems. The government pays the FiT cost to adopters based on annual net metering credit.
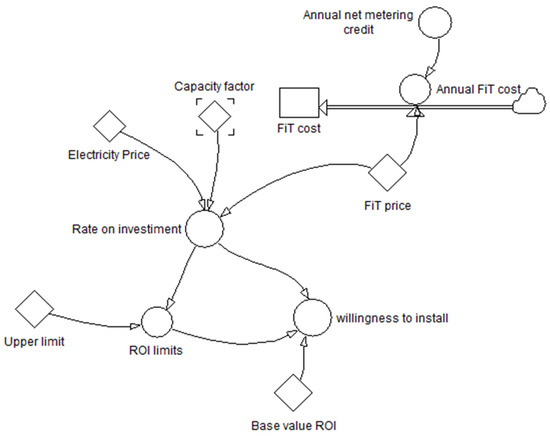
Figure 3.
FiT policy model.
3.3. Energy Objectives Model
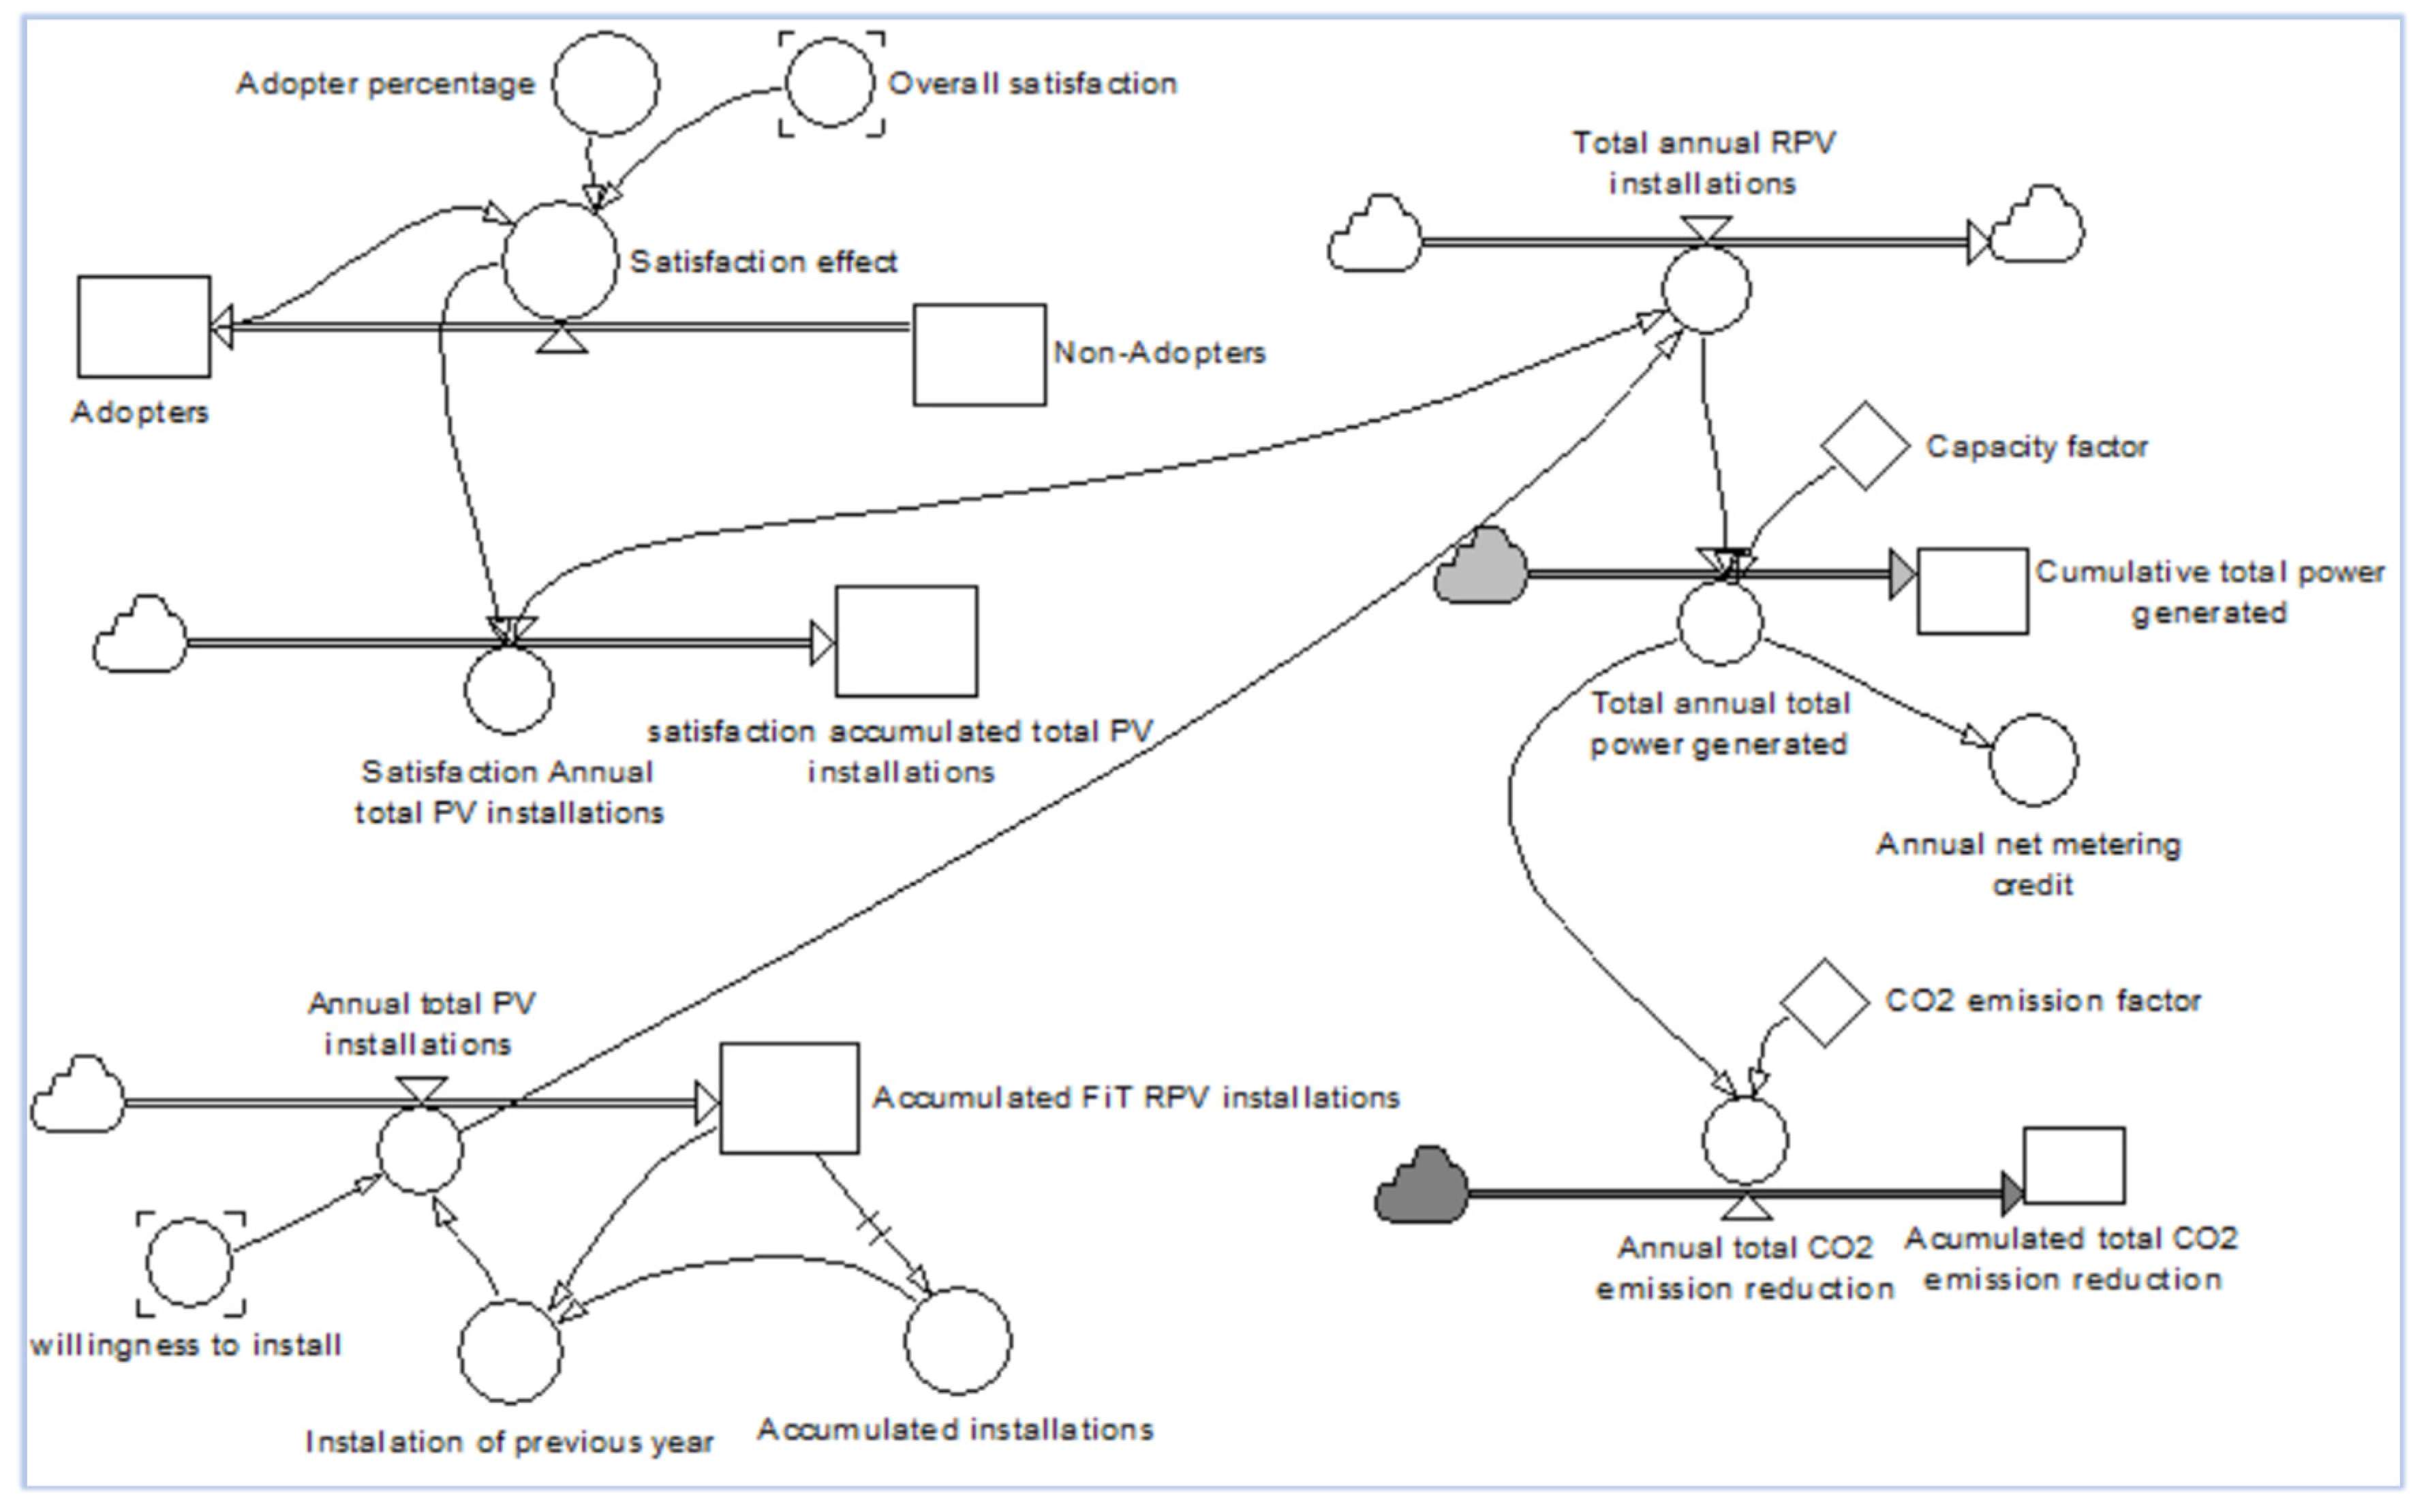
Figure 4 depicts the proposed system dynamics model for examining the relationships between satisfaction and willingness to install due to the FiT policy with generated power and CO2 emission reductions. Satisfaction with RPV systems and willingness to install RPV technology should lead to an enhancement in the number of RPV installations. The increase in the number of RPV systems installations increases the amount of energy generated from RPV systems and contributes to reducing CO2 emissions. It is clean energy and has a much smaller impact on the environment in comparison to conventional energy technologies.
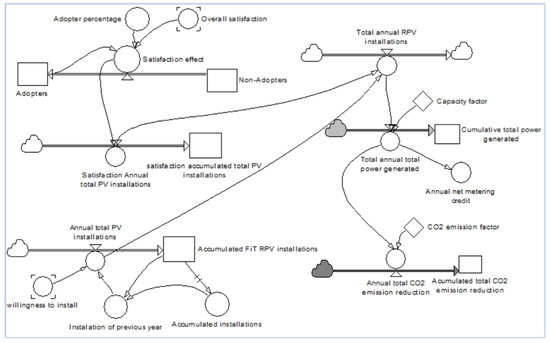
Figure 4.
Adopter satisfaction and FiT policy relationships with energy objectives.
4. Research Results and Discussion
4.1. Results of the Main Model
The proposed model shown in Figure 4 was run by simulation using Powersim Studio 5 Software to predict the expected RPV installations (KW), generated power (KWh), and CO2 emission reduction (kg·CO2) during the years 2024 to 2050. Table 1 displays the general input parameters of the proposed system dynamics model. Table 2 displays the main parameters of the satisfaction model.

Table 1.
General input parameters.
Table 2.
Parameters of the satisfaction model.
The obtained simulation results are as follows:
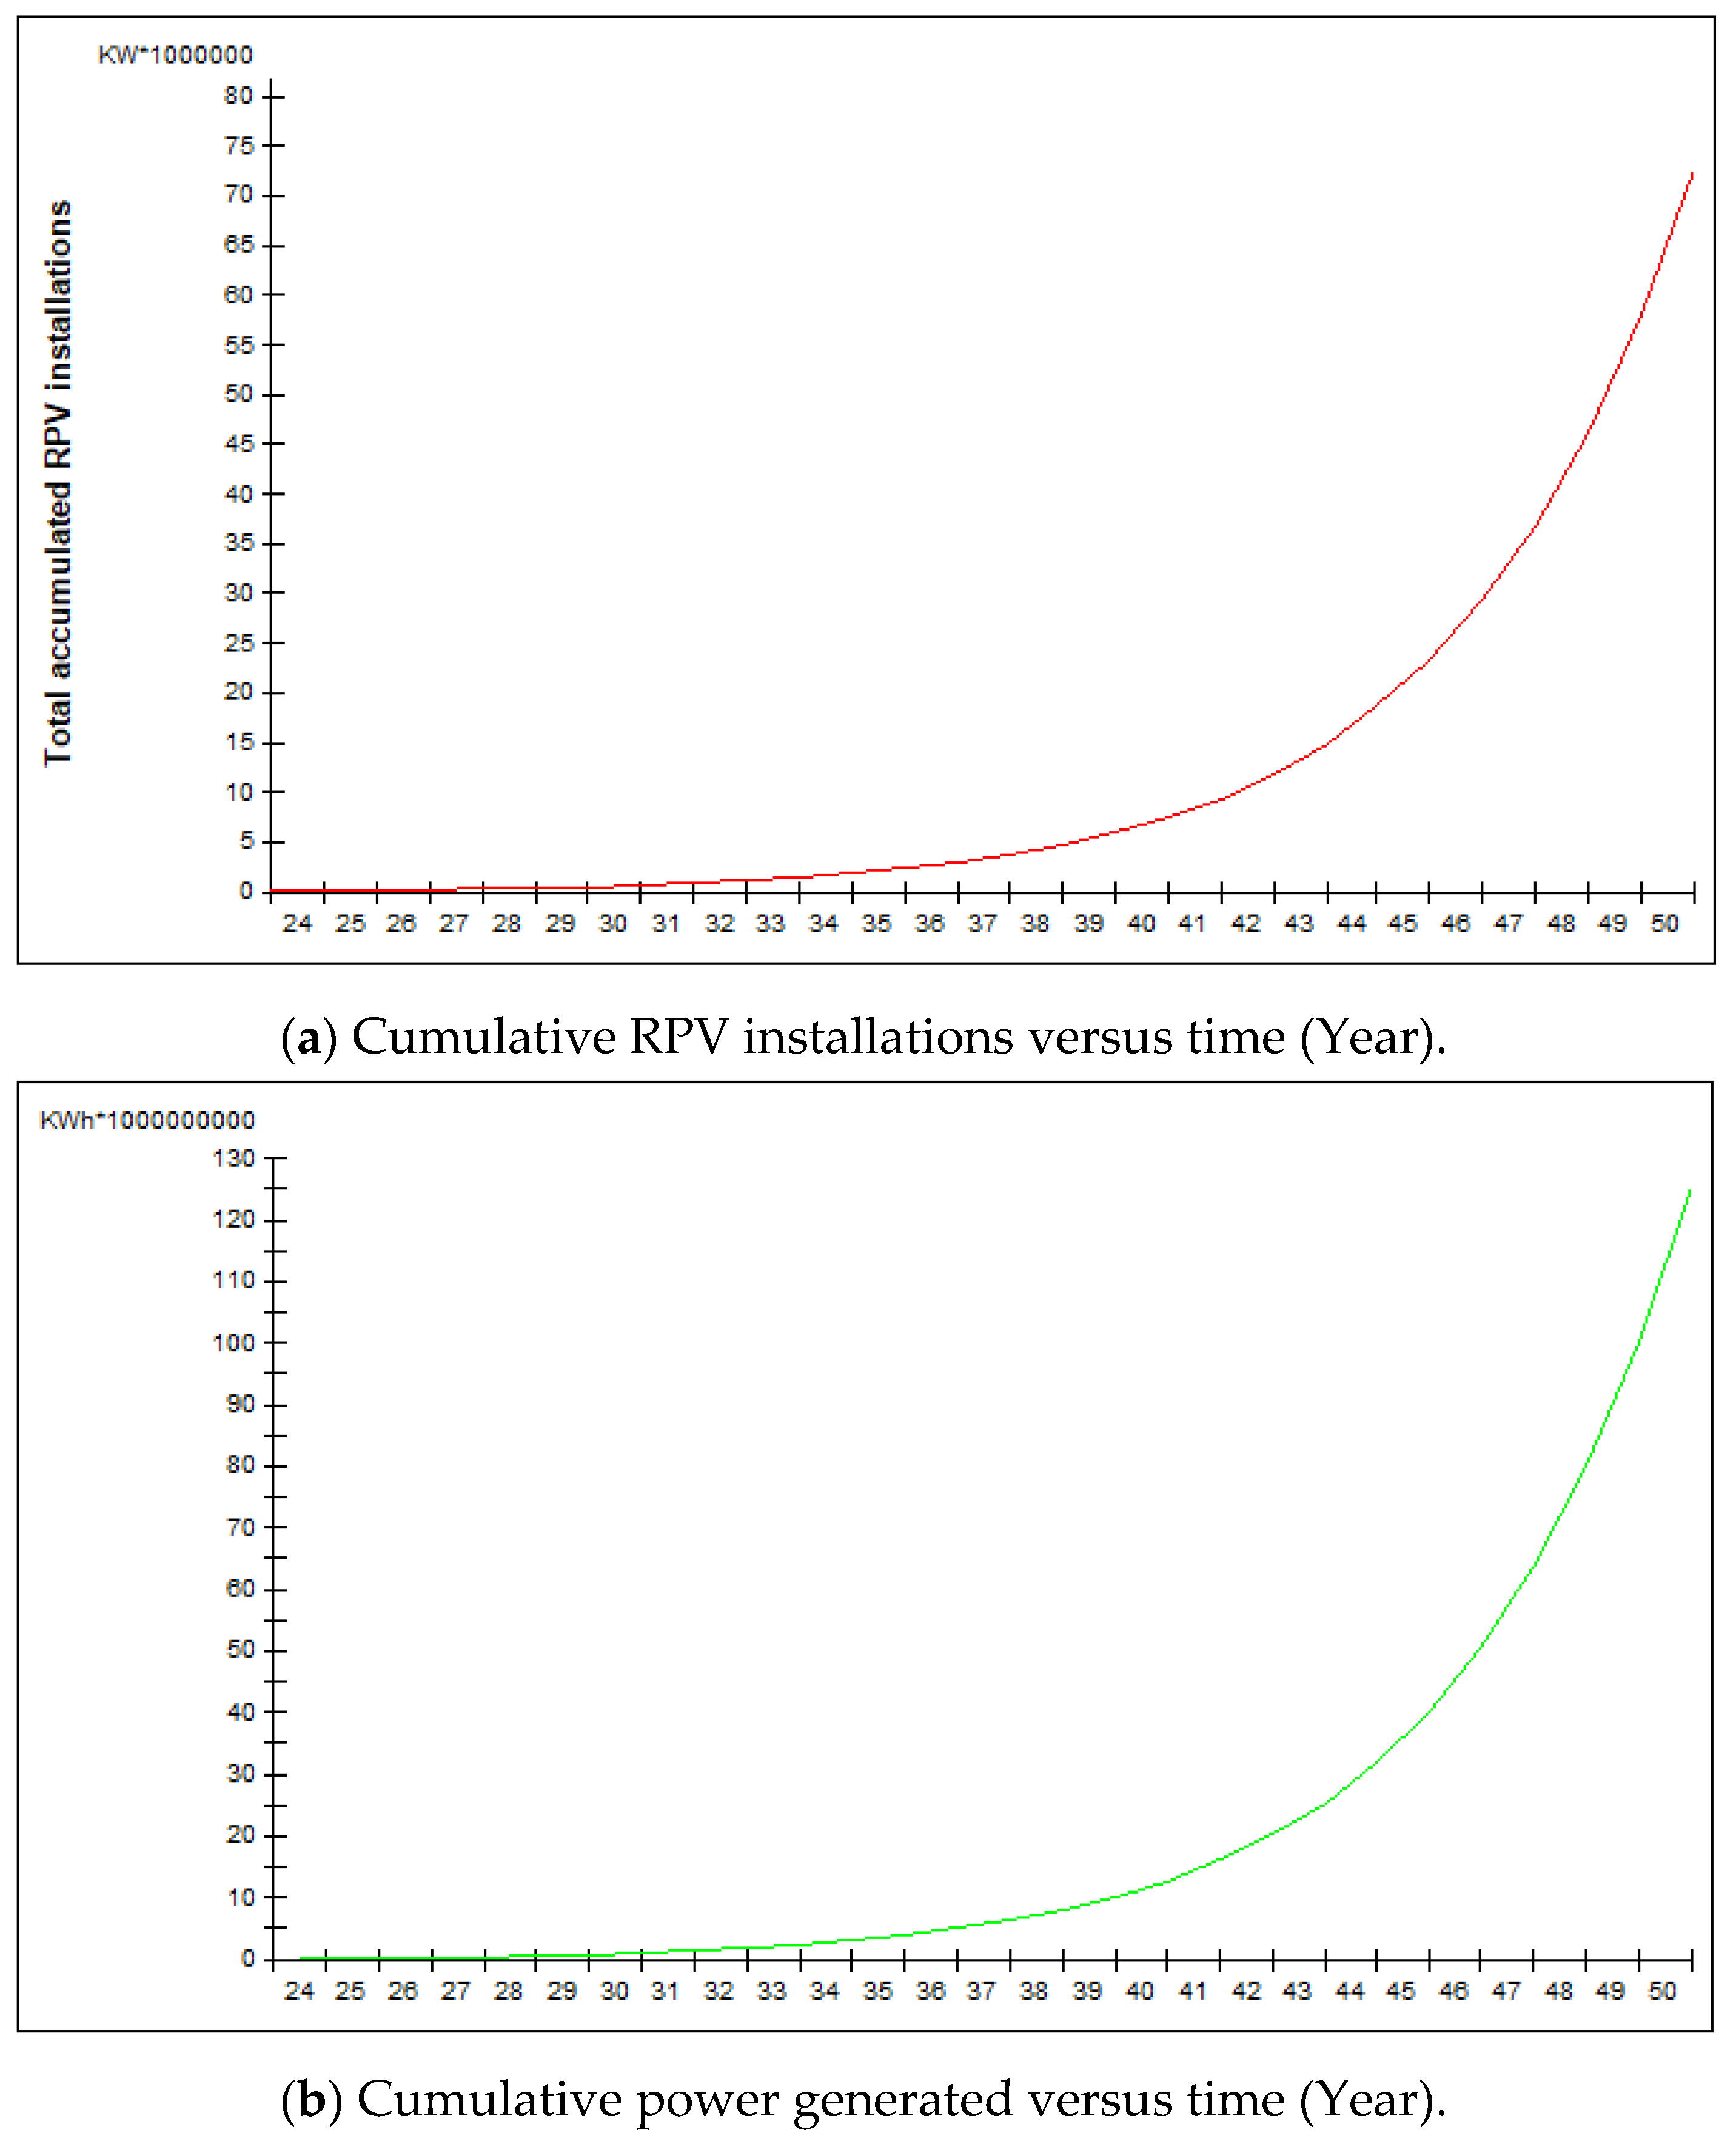
- The cumulative RPV installations increase over time, as shown in Figure 5a. RPV installations are expected to increase from 681.3 MW at the end of year 2030 to 7.45 GW in 2040. The cumulative RPV installations will reach 72.83 GW by the end of 2050;
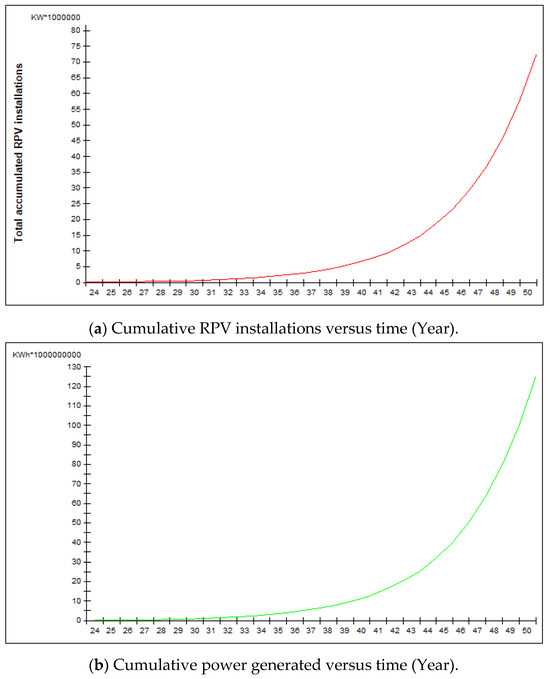
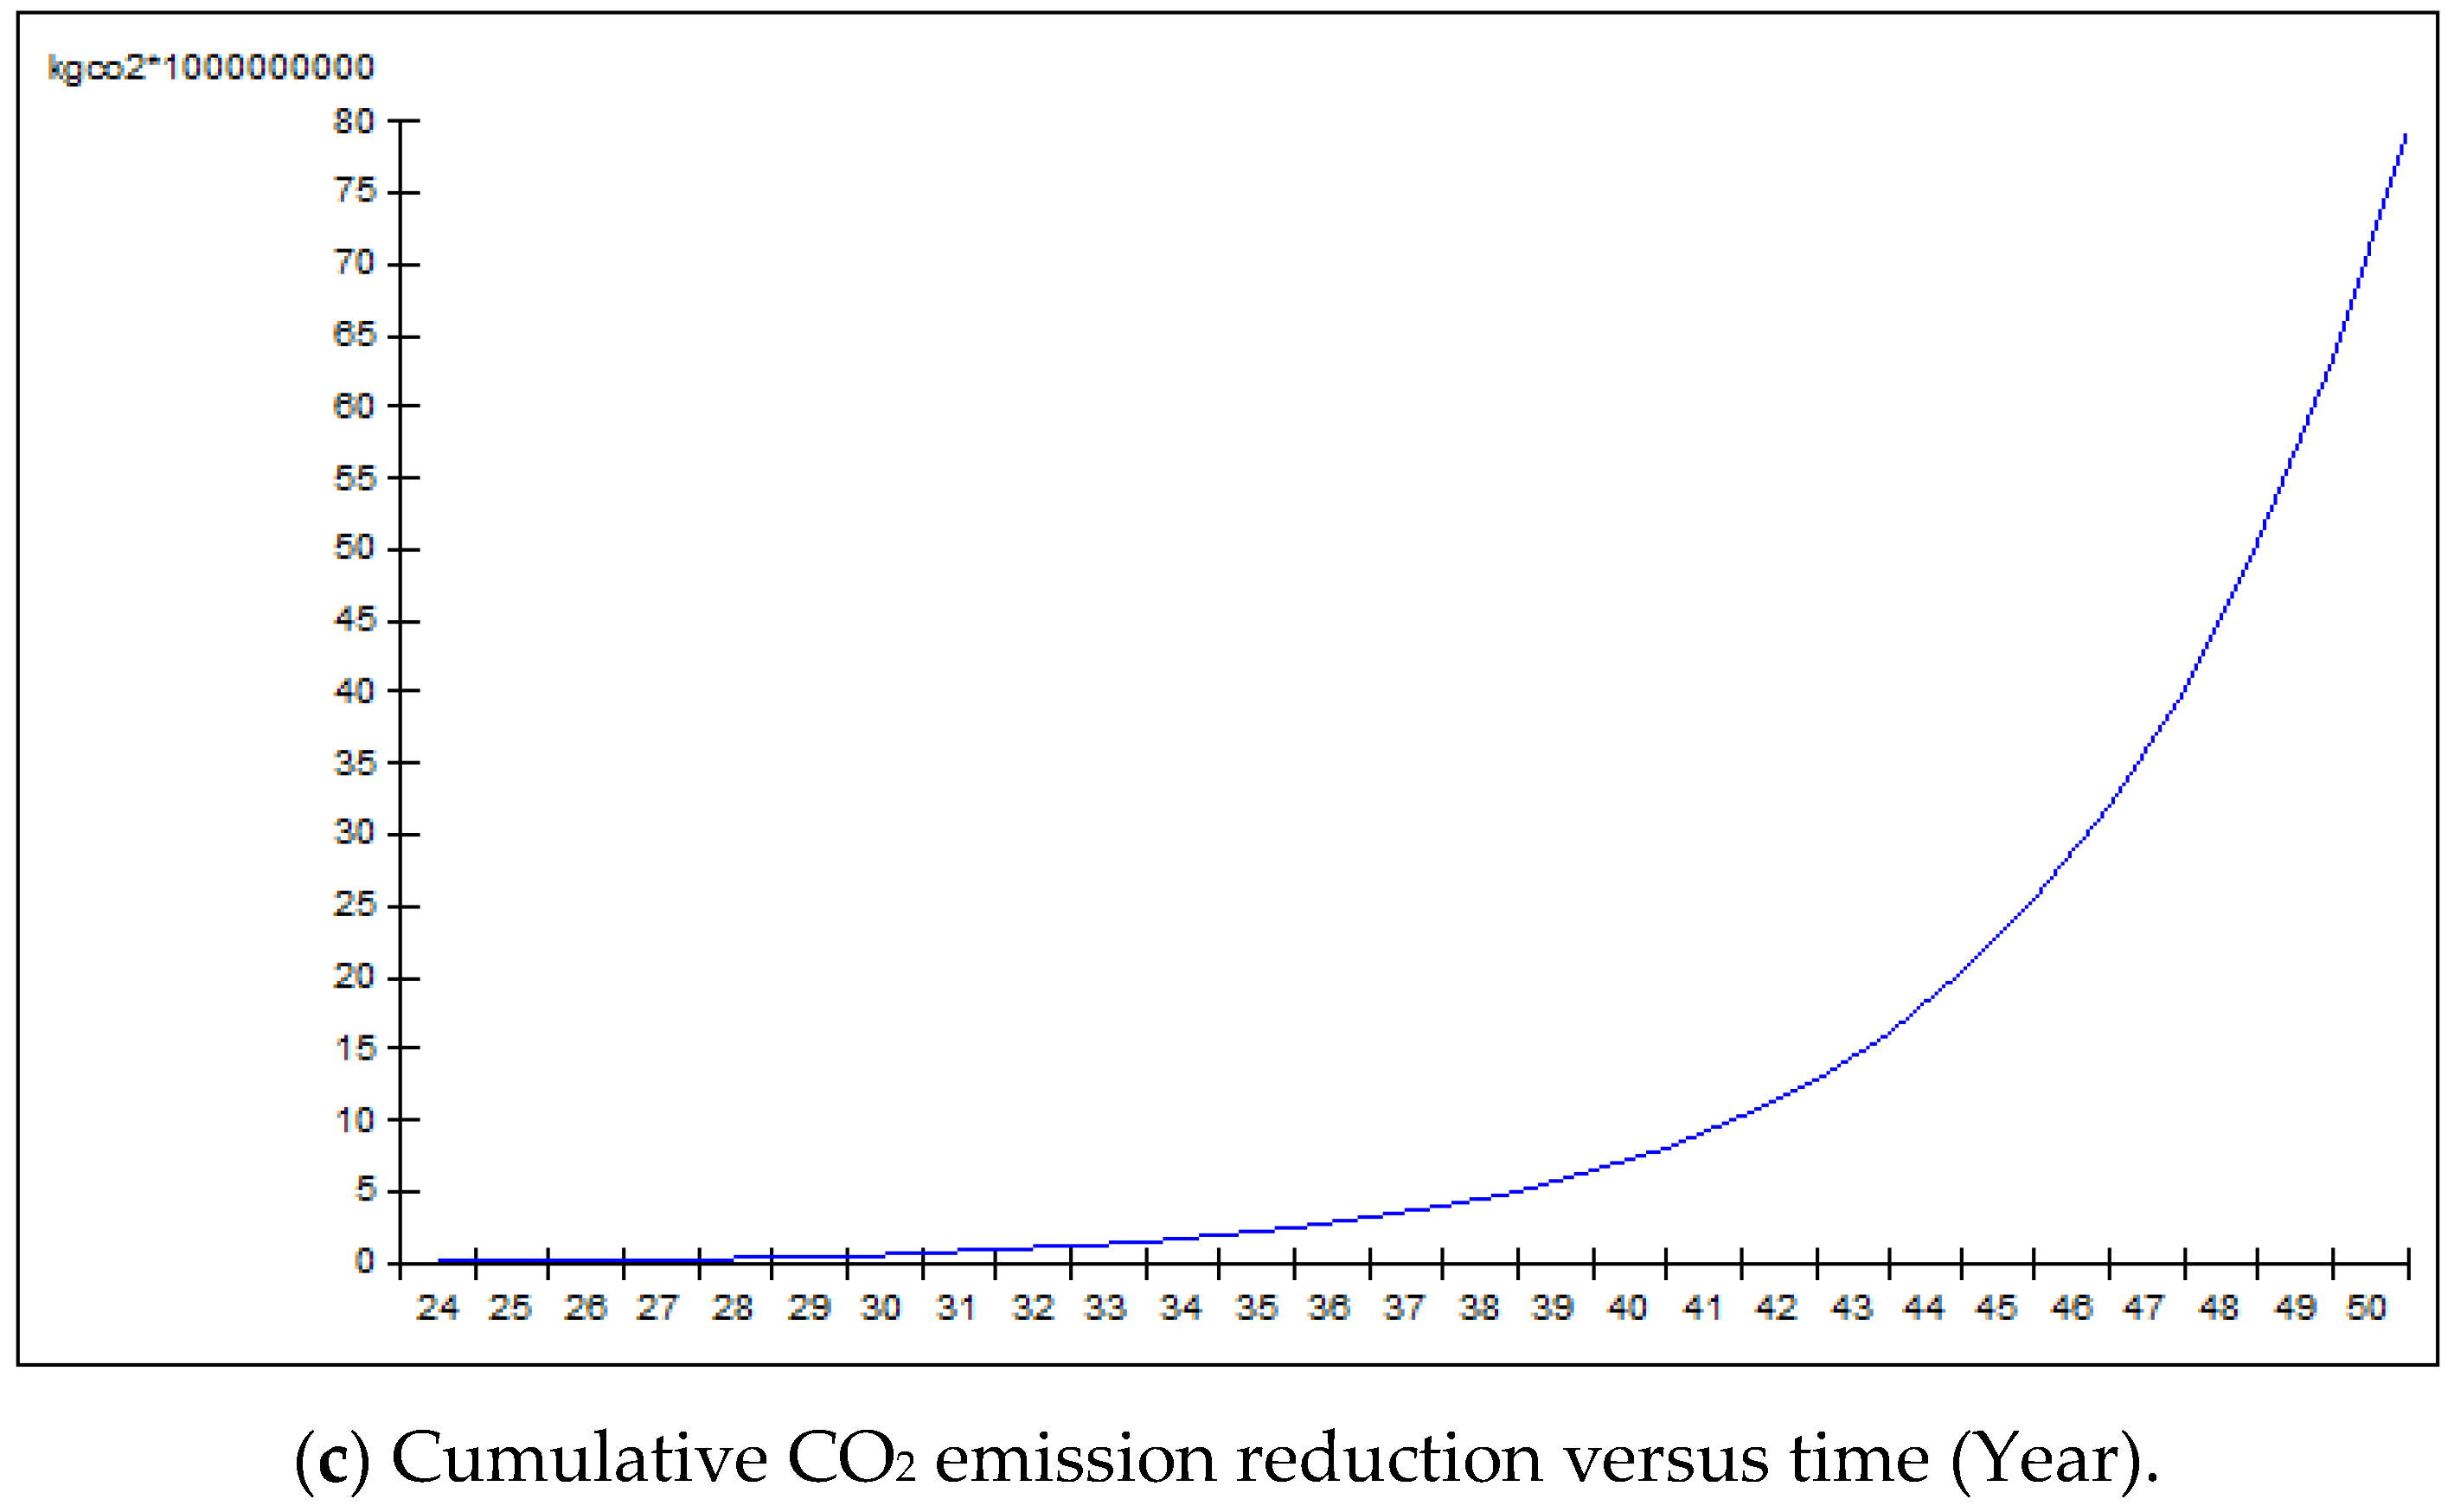
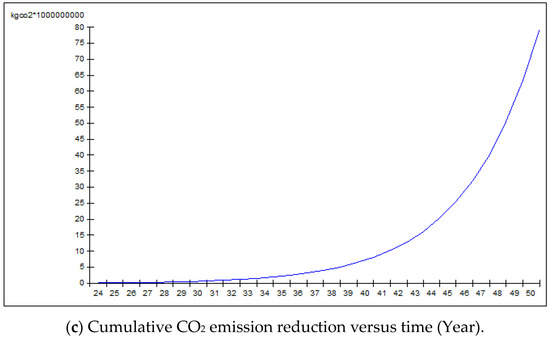 Figure 5. Simulation results.
 - In Figure 5b, the cumulative generated power increases linearly over time. The cumulative generated power will increase from 1.07 TWh in 2030 to 12.76 TWh in 2040. The cumulative generated power will reach 125.74 TWh by the end of 2050;
- The cumulative CO2 emission reductions, as shown in Figure 5c, increase linearly over time. The cumulative CO2 emission reductions increase from 680 million Kg of CO2 by the end of 2030 to 8.08 million tons of CO2 by the end of 2040. The cumulative CO2 emission reductions will reach 79.59 million tons of CO2 at the end of 2050.
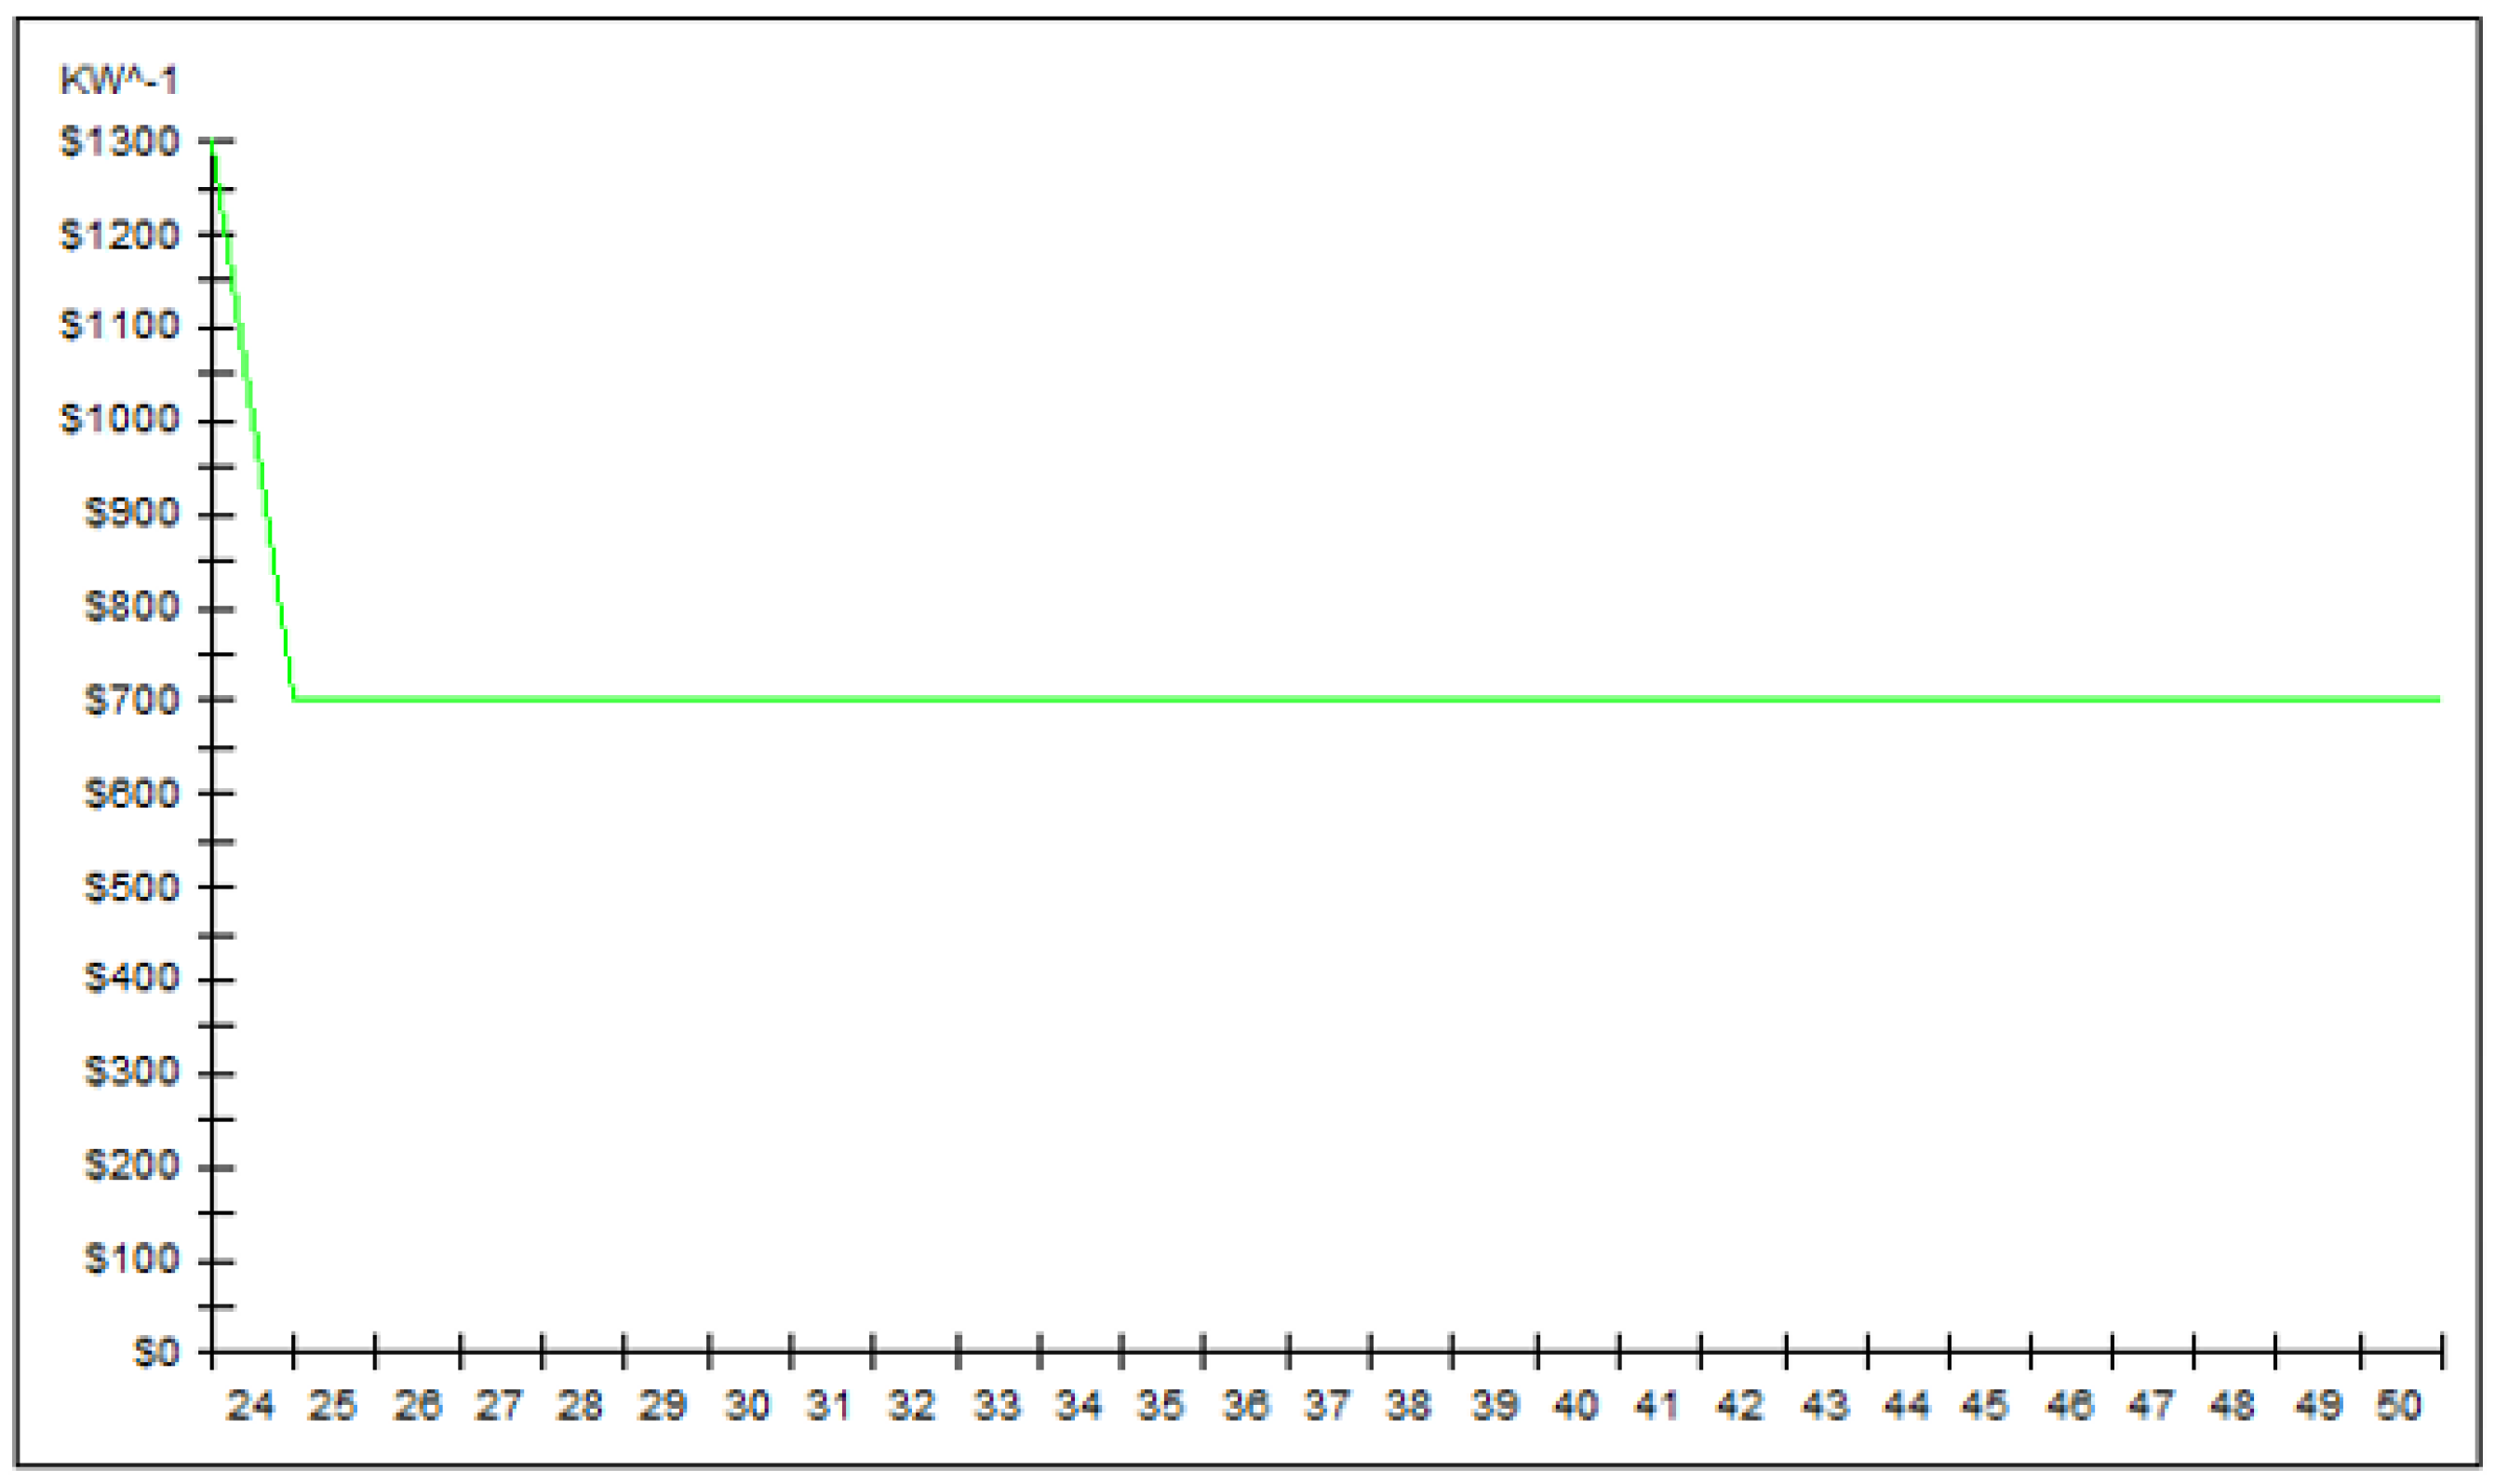
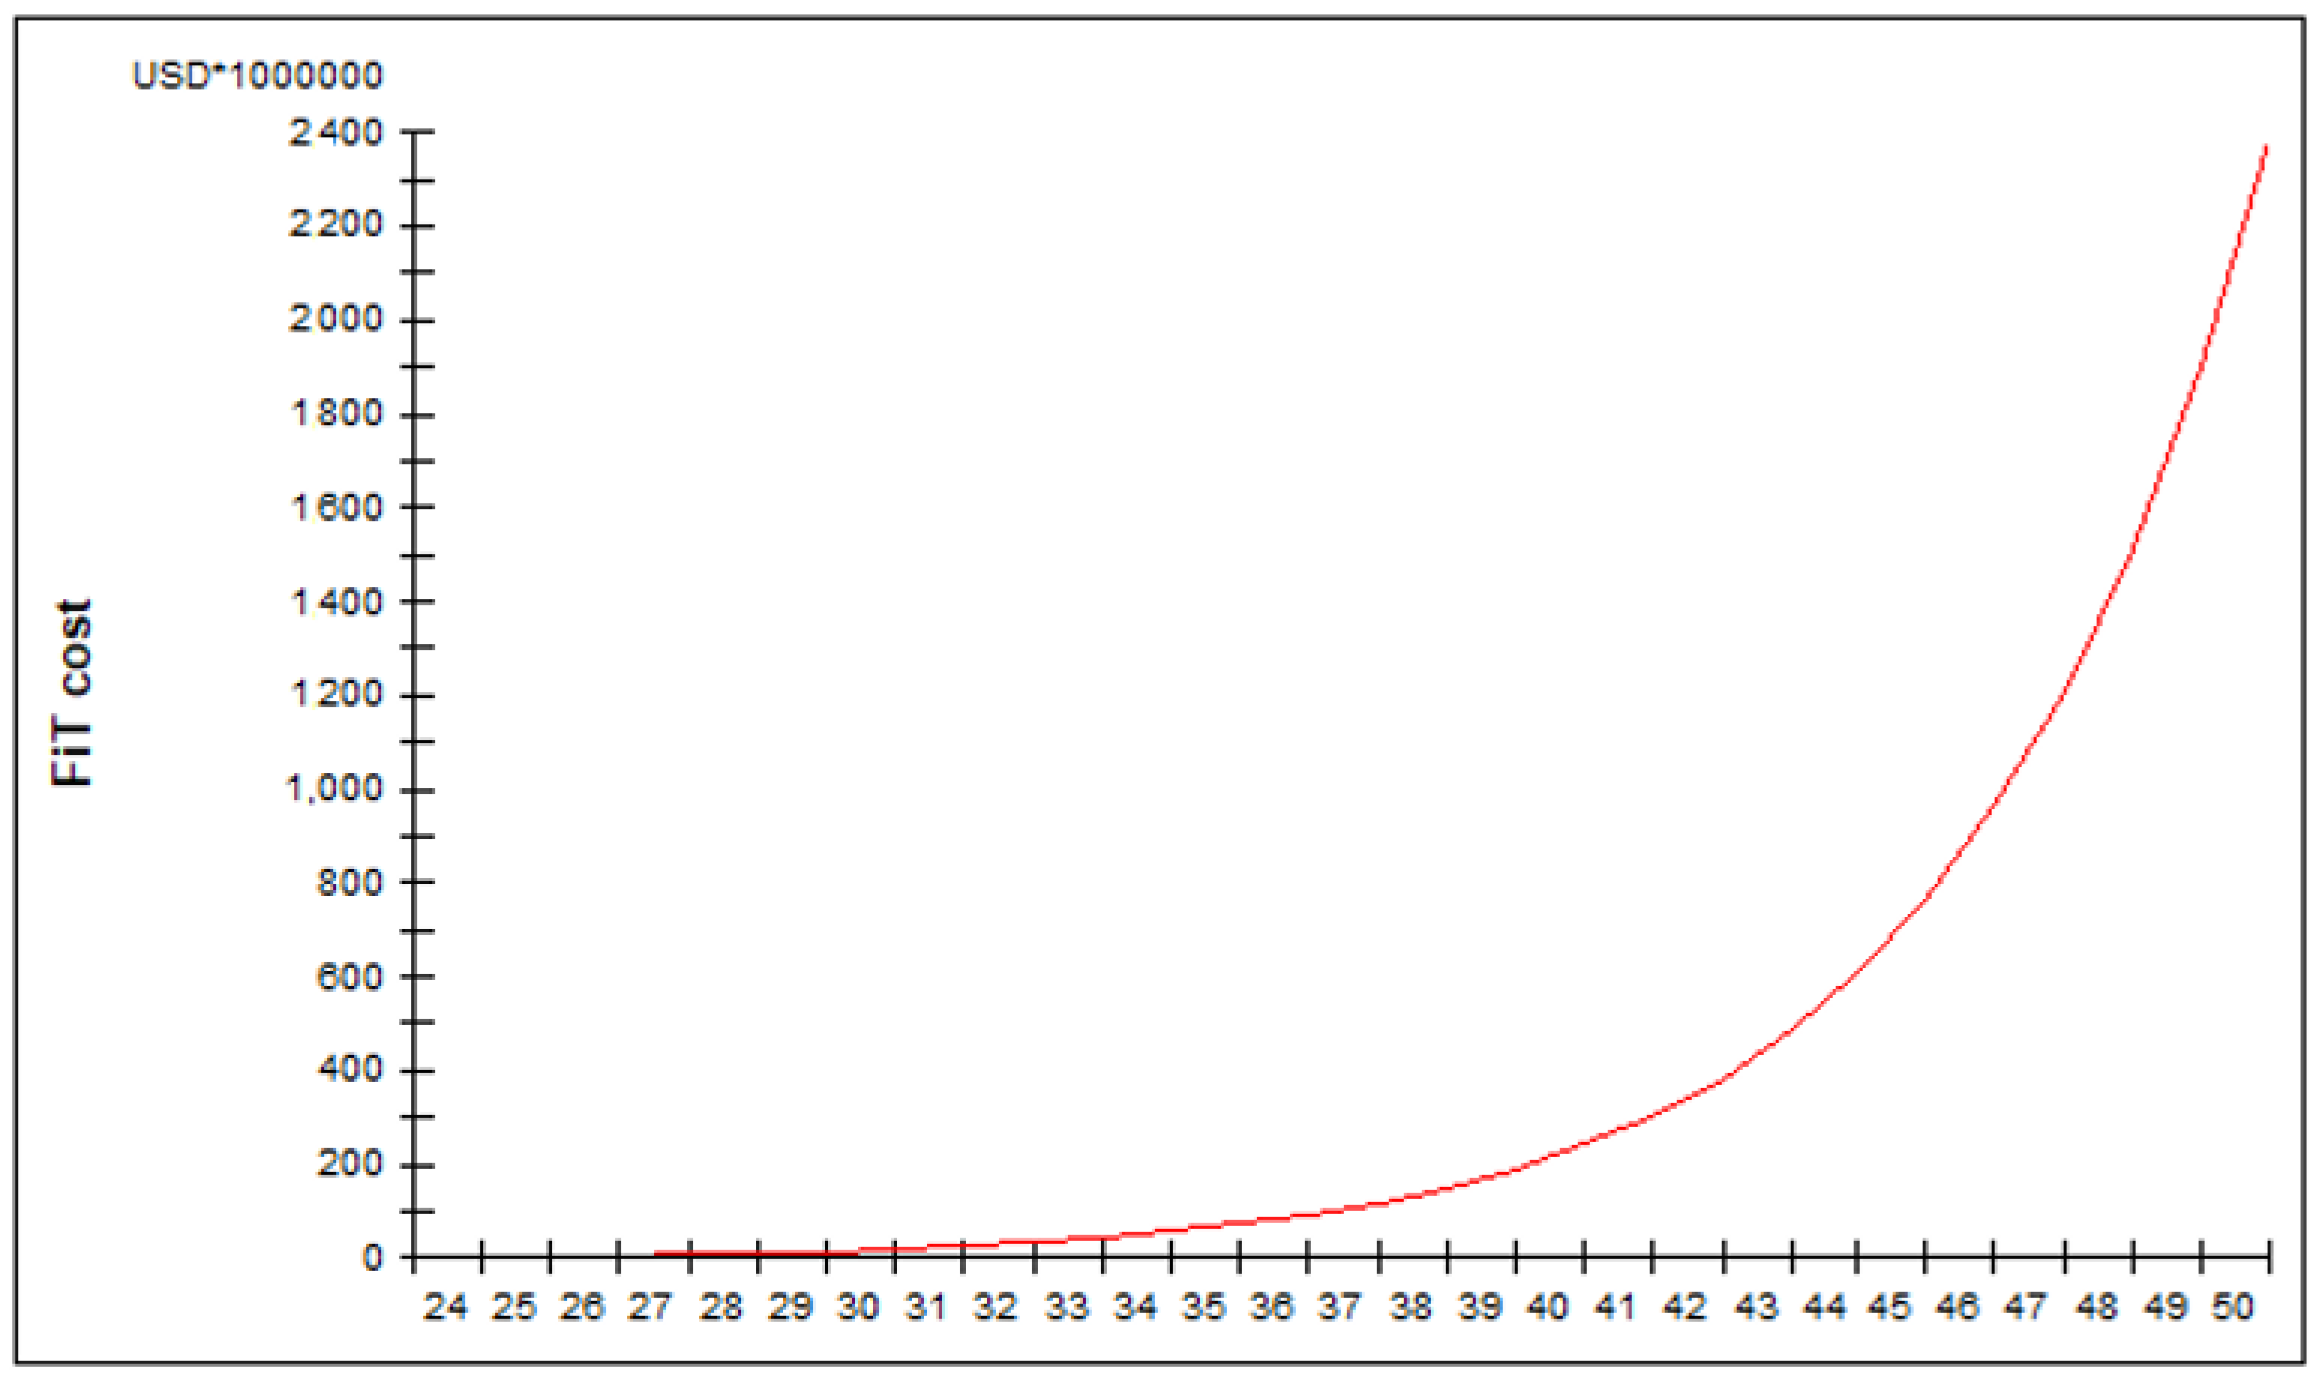
Further, the cost of RPV systems during the years 2024 to 2050 is shown in Figure 6, where it is expected that RPV systems will decrease from USD 1300 in the year 2025 to USD 701.31. Furthermore, the cumulative FiT cost is expected as shown in Figure 7 to increase from USD 20.4 million at the end of 2030 to USD 242.47 million at the end of the year 2040 and to USD 2.39 billion at the end of 2050.
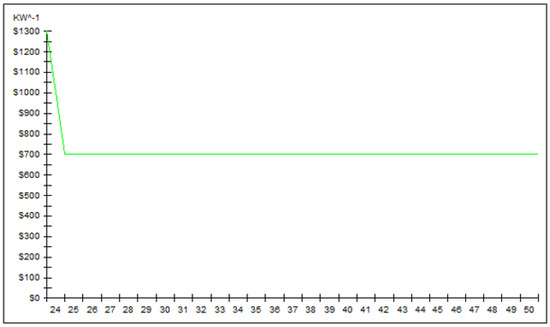
Figure 6.
The cost of RPV systems (USD) versus time (Year).
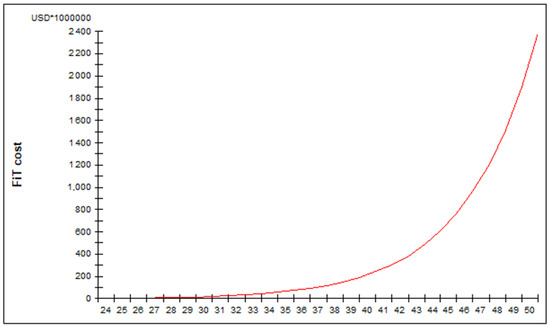
Figure 7.
The cumulative FiT cost (USD million) versus time (Year).
4.2. Effect of Model Factors
- (a)
- Effect of quality of service
The relationships between changes in the quality of service and adopter satisfaction with RPV systems (H1a) were evaluated as follows: The quality of service was assumed to be normally distributed with a mean (and standard deviation) of 0.95 (0.02), 0.9 (0.02), and 0.75 (0.02). The corresponding expected cumulative RPV installations, generated power, and CO2 emission reductions are displayed in Table 3, where it is noted that satisfaction with RPV systems increases from 80% at the end of the year 2030 to 83% at the end of the year 2040 and to 86% at the end of the year 2050. This increase results in an increase in the number of RPV installations, thereby increasing the generated power and reductions in CO2 emissions. For illustration, at the end of the year 2050, the quality of services is normally distributed with a mean and standard deviation of 0.75 and 0.05, respectively, and the expected cumulative generated power is 6768 MWh. When the quality of services has a mean and standard deviation of 0.95 and 0.02, respectively, the expected generated power is 7206 MWh, which indicates an increase in the power generated by 6.5% of that at the mean and standard deviation of 0.75 and 0.02, respectively. Satisfaction with RPV systems increases by 7.5%;
Table 3.
Effect of quality of services on energy measures.
- (b)
- Effect of complaints
The effect of complaints about RPV systems on overall satisfaction with RPV systems (H1b) was examined as follows: Complaints were assumed to be normally distributed with means and standard deviations as shown in Table 4, where it is noted that as the mean of the complaints decreases RPV installations decrease. A decrease in the mean of complaints from 5% to 1% results in an increase in RPV installations by 0.82% and enhances satisfaction with RPV systems from 82% to 84%;
Table 4.
Effect of complaints (%) on energy measures.
- (c)
- Effect of performance ratio
The effect of the changes in the performance ratio on adopter satisfaction with RPV systems (H1c) was examined for the energy systems of 1760, 1860, and 1960 KWh. The simulation results are displayed in Table 5, and it was found that increasing the energy system from 1760 KWh to 1960 KWh results in reducing RPV installations, generated power, and CO2 emissions by 3.8%. Satisfaction with RPV systems (the performance ratio) increased from 83% (0.87) to 86% (0.97);
Table 5.
Effect of performance ratio on energy measures.
- (d)
- Effect of payback period and warranty period
The effect of uncertainty in the payback period and warranty period on adopter satisfaction with RPV systems (H1d) was investigated as follows: The payback period (warranty period) was assigned the values shown in Table 6, where it is noted that the payback period and warranty period of 3.0 and 12.5 years provide the largest satisfaction level of 91%. At the end of the year 2050, RPV installations (4134 KW) at the payback period (3.4 years) and warranty period (10 years) are expected to increase to 4518 KW at the payback period (3.0 years) and warranty period (12.5 years). This results in about a 9.3% increase in the generated power and reductions in CO2 emissions. Further, increasing the warranty period to 12.5 years and maintaining the payback period at 3.4 years results in increasing RPV installations at the end of the year 2050 by 5.8%. Reducing the payback period to 3 years at the warranty period of 10 years results in increasing RPV installations at the end of the year 2050 by 3.9%;
Table 6.
Effect of payback period (warranty period) on energy measures.
- (e)
- Effect of FiT policy
The FiT policy was examined at the FiT prices of 0.19 and 0.21 USD/KWh. The base ROI was assigned values of 0.49 and 0.50. The upper ROI limit, electricity price, and capacity factor are 1.5, USD 0.23/KWh, and 0.20, respectively. Table 7 lists the energy measures for different combinations of the FiT price and base ROI. In Table 7, the largest amount of RPV installations (78.09 GW) at the end of the year 2050 corresponds to the FiT price and base ROI of 0.21 USD/KWh and 0.49, respectively. An increase in the base ROI from 0.49 to 0.5 at the FiT price of 0.21 USD/KWh results in a 20.8% reduction in generated power. Moreover, an increase in the FiT price from 0.19 to 0.21 USD/KWh results in a reduction in CO2 emissions and an increase in generated power by 8.94% at the end of the year 2050. This result shows the significant effects of the FiT price and ROI on energy goals.
Table 7.
Effect of FiT price (base ROI) on energy measures.
4.3. Practical Implications
This research examined the effects of changes in the quality of service, complaints, payback period and warranty, and FiT price on RPV installations, generated power, and reductions in CO2 emissions. The simulation results reveal the following:
- (1)
- Variations in the quality of service (H1) resulted in significant positive impacts on the amount of RPV installations, generated power, and CO2 emission reduction. Thus, suppliers of RPV systems and products should continually collect, analyze, and then evaluate feedback on the quality of service for the delivered RPV systems to enhance the overall satisfaction with RPV systems;
- (2)
- A reduction in the complaint percentage significantly enhanced the amount of RPV installations, generated power, and CO2 emission reduction. Consequently, developing an effective system for handling adopter complaints can enhance overall satisfaction with RPV systems and thereby improve the number of RPV system installations. Moreover, manufacturers can utilize adopter complaints to identify opportunities for enhancing the design and manufacture of high-quality and reliable RPV systems and products that meet or exceed adopter expectations;
- (3)
- The performance ratio mainly depends on the solar irradiance, energy system, and conversion efficiency. Changes in these factors resulted in significant improvements in the amount of RPV installations, generated power, and CO2 reductions. Typically, a larger performance ratio results in better performance. This requires developing RPV products that can produce more system energy that is close to the theoretical energy amount. The design and/or adoption of supplied and/or manufactured high-tech components, products, and systems can significantly enhance the performance ratio and thereby increase overall satisfaction with RPV systems;
- (4)
- The payback period and warranty depend on the base rate of investment, initial cost, electricity cost, life span, and FiT cost. Reducing the payback period and increasing the warranty period increased RPV installations, and the generated power and CO2 emission reduction were significantly enhanced. Hence, manufacturers should carefully decide the initial cost of the RRPV systems and offer an appropriate warranty for the installed systems that leads to improving overall satisfaction with RPV systems;
- (5)
- Changes in the FiT price contribute the largest positive impacts on RPV installations, generated power, and CO2 emissions. Despite the huge FiT cost, governments should support RPV system installations based on net metering to enhance willingness to install RPV systems and thereby increase reliance on clean sources of electricity.
In summary, all the proposed hypotheses are accepted. Therefore, RPV system manufacturers should collaborate with RPV adopters to understand their requirements and expectations, design and develop high-quality RPV products and systems at affordable prices, continually evaluate RPV design, operation, and post-services, enhance the quality of RPV products and services, and offer a wide range of innovative RPV products and systems. Furthermore, the adoption of the FiT policy has had significant impacts on RPV installations, generated power, and CO2 emission reductions. Consequently, governments should provide sufficient funds to motivate and support the installation of RPV solar systems. In the end, decision-makers in the energy sector should regularly monitor the status of installations of renewable electricity and assess the impact of the FiT cost to make effective decisions to enhance willingness to install RPV systems and products and thereby achieve sustainable energy security and reduce nonenvironmentally friendly energy-scarce sources.
4.4. Optimization of Model Factors
The optimization of decision variables, including the FiT price, payback period, warranty period, quality of services, and energy systems, was conducted under simultaneous changes in the electricity price, complaints, base ROI, and CO2 emission factors. The objective functions were to maximize RPV installations, generated power, and reductions in CO2 emissions. The optimization results are displayed in Table 8.
Table 8.
Optimization results.
From Table 8, it is noticeable that the quality of services (0.89), the FiT price (0.21), the payback period (3.29 years), the warranty period (11.43 years), and the energy system (1857.24 kWh) enhance RPV installations, generated power, and reductions in CO2 emissions from 72.83 to 88.9, 125.74 to 152.12, and 79.59 to 96.39 million tons of CO2, respectively. These results prove the importance of satisfaction with RPV systems by enhancing their main components—the quality of services, warranty period, payback period, and energy system—along with increasing the FiT price, as this can result in significant gains in energy objectives.
5. Conclusions
This research developed system dynamics models to predict the impacts of satisfaction with RPV systems and the FiT policy on RPV installations, generated power, and reductions in CO2 emissions during the period 2024 to 2050. Two models were developed, including satisfaction with RPV systems and the FiT policy. The satisfaction model considered five factors: the quality of services, complaints, payback period, warranty period, and performance ratio. The FiT policy model included the FiT price, electricity price, base ROI, and willingness to use RPV systems. The simulation results for the year 2050 reveal that the expected cumulative RPV installations, generated power, and reductions in CO2 emissions will reach 72.83 GW, 125.74 TWh, and 79.59 million tons of CO2. The changes in the RPV satisfaction and FiT model factors were then examined. The results reveal the significant impacts of these changes on energy goals. Finally, optimization was conducted to decide the optimal model factors. At the optimal values of the quality of services (0.89), the FiT price (USD 0.21), the payback period (3.29 years), the warranty period (11.43 years), and the energy system (1857.24 KWh), RPV installations, generated power, and reductions in CO2 emissions are increased by 20% of that at the current factor condition. Therefore, RPV system manufacturers should develop high-quality RPV products and systems at affordable prices and continually enhance the RPV design, operation, and post-service activities to enhance satisfaction with RPV systems. Furthermore, the government plays a key role in enhancing the adoption of RPV installations by offering attractive FiT prices.
Author Contributions
Conceptualization, methodology, A.A.-R.; software, A.A.-R.; validation, A.A.-R. and N.L.; formal analysis, A.A.-R. and N.L.; investigation, A.A.-R. and N.L.; resources, A.A.-R. and N.L.; data curation, A.A.-R.; writing—original draft preparation, A.A.-R. and N.L.; writing—review and editing, A.A.-R.; visualization, A.A.-R.; supervision, A.A.-R. and N.L. All authors have read and agreed to the published version of the manuscript.
Funding
This research received no external funding.
Data Availability Statement
The original contributions presented in the study are included in the article, further inquiries can be directed to the corresponding author.
Acknowledgments
The Deanship of Scientific Research at the University of Jordan supports this research, project #865.
Conflicts of Interest
The authors declare no conflicts of interest.
References
- Pereira, L.; Cavaleiro, J.; Barros, L. Economic assessment of solar-powered residential battery energy storage systems: The case of Madeira Island, Portugal. Appl. Sci. 2020, 10, 7366. [Google Scholar] [CrossRef]
- Al-Refaie, A.; Lepkova, N. Impacts of renewable energy policies on CO2 emissions reduction and energy security using system dynamics: The case of small-scale sector in Jordan. Sustainability 2022, 14, 5058. [Google Scholar] [CrossRef]
- Koch, H.; Lechner, S.; Erdmann, S.; Hofmann, M. Assessing the Potential of Rooftop Photovoltaics by Processing High-Resolution Irradiation Data, as Applied to Giessen, Germany. Energies 2022, 15, 6991. [Google Scholar] [CrossRef]
- Monna, S.; Juaidi, A.; Abdallah, R.; Itma, M. A Comparative Assessment for the Potential Energy Production from RPV Installation on Residential Buildings. Sustainability 2020, 12, 10344. [Google Scholar] [CrossRef]
- Bódis, K.; Kougias, I.; Jäger-Waldau, A.; Taylor, N.; Szabó, S. A high-resolution geospatial assessment of the rooftop solar photovoltaic potential in the European Union. Renew. Sustain. Energy Rev. 2019, 114, 109309. [Google Scholar] [CrossRef]
- Komatsu, S.; Kaneko, S.; Ghosh, P.P.; Morinaga, A. Determinants of user satisfaction with solar home systems in rural Bangladesh. Energy 2013, 61, 52–58. [Google Scholar] [CrossRef]
- Agathokleous, R.A.; Kalogirou, S.A. RPV roofs as the first step towards 100% RES electricity production for Mediterranean islands: The case of Cyprus. Smart Energy 2021, 4, 100053. [Google Scholar] [CrossRef]
- Jacoby, J.; Jaccard, J.J. The sources, meaning, and validity of consumer complaint behavior: A psychological analysis. J. Retail. 1981, 57, 4–24. [Google Scholar]
- Ahmad, W.; Zhang, Q. Green purchase intention: Effects of electronic service quality and customer green psychology. J. Clean. Prod. 2020, 267, 122053. [Google Scholar] [CrossRef]
- Al-Refaie, A.; Bata, N.; Eteiwi, D.; Jalham, I. Examining Factors that Affect Passenger’s Overall Satisfaction and Loyalty: Evidence from Jordan Airport. Jordan J. Mech. Ind. Eng. 2014, 8, 94–101. [Google Scholar]
- Al-Refaie, A.; Tahat, M.D.A.; Bata, N. CRM/e-CRM effects on banks performance and customer-bank relationship quality. Int. J. Enterp. Inf. Syst. (IJEIS) 2014, 10, 62–80. [Google Scholar] [CrossRef]
- Gharaibeh, B.; Al-Refaie, A.; Goussous, J.; Shurrab, M. Effect of CCMS on customer satisfaction and loyalty in Jordanian banks. Information 2012, 15, 6227–6237. [Google Scholar]
- Mukai, T.; Kawamoto, S.; Ueda, Y.; Saijo, M.; Abe, N. Residential RPV system users’ perception of profitability, reliability, and failure risk: An empirical survey in a local Japanese municipality. Energy Policy 2011, 39, 5440–5448. [Google Scholar] [CrossRef]
- Formica, T.J.; Khan, H.A.; Pecht, M.G. The effect of inverter failures on the return on investment of solar photovoltaic systems. IEEE Access 2017, 5, 21336–21343. [Google Scholar] [CrossRef]
- Chen, K.K. Assessing the effects of customer innovativeness, environmental value and ecological lifestyles on residential solar power systems install intention. Energy Policy 2014, 67, 951–961. [Google Scholar] [CrossRef]
- Hansla, A.; Gamble, A.; Juliusson, A.; Gärling, T. Psychological determinants of attitude towards and willingness to pay for green electricity. Energy Policy 2008, 36, 768–774. [Google Scholar] [CrossRef]
- Sun, P.C.; Wang, H.M.; Huang, H.L.; Ho, C.W. Consumer attitude and purchase intention toward rooftop photovoltaic installation: The roles of personal trait, psychological benefit, and government incentives. Energy Environ. 2020, 31, 21–39. [Google Scholar] [CrossRef]
- Maqbool, R.; Deng, X.; Rashid, Y. Stakeholders’ satisfaction as a key determinant of critical success factors in renewable energy projects. Energy Sustain. Soc. 2020, 10, 28. [Google Scholar] [CrossRef]
- Aslani, A.; Helo, P.; Naaranoja, M. Role of renewable energy policies in energy dependency in Finland: System dynamics approach. Appl. Energy 2014, 113, 758–765. [Google Scholar] [CrossRef]
- Ahmad, S.; Tahar, R.; Muhammad-Sukki, M.F.; Munir, A.B.; Abdul Rahim, R. Role of feed-in tariff policy in promoting solar photovoltaic investments in Malaysia: A system dynamics approach. Energy 2015, 84, 808–815. [Google Scholar] [CrossRef]
- Kiwan, S.; Al-Gharibeh, E. Jordan toward a 100% renewable electricity system. Renew. Energy 2020, 147, 423–436. [Google Scholar] [CrossRef]
- Azzuni, A.; Aghahosseini, A.; Ram, M.; Bogdanov, D.; Caldera, U.; Breyer, C. Energy security analysis for a 100% renewable energy transition in Jordan by 2050. Sustainability 2020, 12, 4921. [Google Scholar] [CrossRef]
- Qadourah, J.A. Energy and economic potential for photovoltaic systems installed on the rooftop of apartment buildings in Jordan. Results Eng. 2022, 16, 100642. [Google Scholar] [CrossRef]
- Albatayneh, A.; Albadaineh, R.; Juaidi, A.; Abdallah, R.; Montoya, M.D.G.; Manzano-Agugliaro, F. Rooftop photovoltaic system as a shading device for uninsulated buildings. Energy Rep. 2022, 8, 4223–4232. [Google Scholar] [CrossRef]
- Solar Review. Solar Panel Cost Jordan: Prices & Data 2022. From the World Wide Web. 2022. Available online: https://www.solarreviews.com/solar-panel-cost/new%20york/jordan (accessed on 1 April 2024).
- IRENA. Renewable Capacity Statistics 2022. From the World Wide Web. 2022. Available online: https://www.irena.org/Publications/2022/Apr/Renewable-Capacity-Statistics-2022 (accessed on 1 April 2024).
- Harmon, C. Experience Curves of Photovoltaic Technology; IIASA: Laxenburg, Austria, 2000. [Google Scholar]
- Jeon, C.; Shin, J. Long-term renewable energy technology valuation using system dynamics and Monte Carlo simulation: Photovoltaic technology case. Energy 2014, 66, 447–457. [Google Scholar] [CrossRef]
- Nair, K.; Shadman, S.; Chin, C.M.M.; Sakundarini, N.; Yap, E.H.; Koyande, A. Developing a system dynamics model to study the impact of renewable energy in the short- and long-term energy security. Mater. Sci. Energy Technol. 2021, 4, 391–397. [Google Scholar] [CrossRef]
- Al-Refaie, A.; Abdelrahim, D.A.Y. A system dynamics model for green logistics in a supply chain of multiple suppliers, retailers and markets. Int. J. Bus. Perform. Supply Chain. Model. 2021, 12, 259–281. [Google Scholar] [CrossRef]
- Moumouni, Y.; Ahmad, S.; Baker, R.J. A system dynamics model for energy planning in Niger. Int. J. Energy Power Eng. 2014, 3, 308–322. [Google Scholar] [CrossRef]
- Hsu, C.-W. Using a system dynamics model to assess the effects of capital subsidies and feed-in tariffs on solar RPV installations. Appl. Energy 2012, 100, 205–217. [Google Scholar] [CrossRef]
- Zhang, H.L.; Van Gerven, T.; Baeyens, J.; Degrève, J. Photovoltaics: Reviewing the European feed-in-tariffs and changing PV efficiencies and costs. Sci. World J. 2014, 2014, 404913. [Google Scholar] [CrossRef]
- Radomes, A.A., Jr.; Arango, S. Renewable energy technology diffusion: An analysis of photovoltaic-system support schemes in Medellín, Colombia. J. Clean. Prod. 2015, 92, 152–161. [Google Scholar] [CrossRef]
- Al-Refaie, A.; Lepkova, N. Examining the impact of saving rate and subsidy policy on RPV installations and CO2 emissions using system dynamics. In Proceedings of the 13th Mediterranean Conference on Power Generation, Transmission, Distribution and Energy Conversion (MEDPOWER 2022), Valletta, Malta, 7–9 November 2022; IET: Stevenage, UK, 2022; Volume 2022, pp. 566–570. [Google Scholar]
- Al-Refaie, A.; Lepkova, N.; Hadjistassou, C. Using system dynamics to examine effects of satisfaction with RPV systems, advertising, and competition on energy security and CO2 emissions in Jordan. Sustainability 2023, 15, 14907. [Google Scholar] [CrossRef]
- Al-Refaie, A.; Lepkova, N. Effects of Overall Satisfaction with RPV Systems and Subsidy Policy on Energy Security for Rooftop Buildings Using System Dynamics. In Proceedings of the 14th International Scientific Conference on Modern Building Materials, Structures and Techniques, MBMST 2023, Vilnius, Lithuania, 5–6 October 2023; Lecture Notes in Civil Engineering. Volume 392 LNCE, pp. 517–525. [Google Scholar]
- Tarigan, E. Simulation and feasibility studies of rooftop RPV system for university campus buildings in Surabaya, Indonesia. Int. J. Renew. Energy Res. 2018, 8, 895–908. [Google Scholar]
- Haryadi, F.N.; Hakam, D.F.; Ajija, S.R.; Simaremare, A.A.; Aditya, I.A. The analysis of residential rooftop RPV in Indonesia’s electricity market. Economies 2021, 9, 192. [Google Scholar] [CrossRef]
- Pan, D.; Bai, Y.; Chang, M.; Wang, X.; Wang, W. The technical and economic potential of urban rooftop photovoltaic systems for power generation in Guangzhou, China. Energy Build. 2022, 277, 112591. [Google Scholar] [CrossRef]
Disclaimer/Publisher’s Note: The statements, opinions and data contained in all publications are solely those of the individual author(s) and contributor(s) and not of MDPI and/or the editor(s). MDPI and/or the editor(s) disclaim responsibility for any injury to people or property resulting from any ideas, methods, instructions or products referred to in the content. |
© 2024 by the authors. Licensee MDPI, Basel, Switzerland. This article is an open access article distributed under the terms and conditions of the Creative Commons Attribution (CC BY) license (https://creativecommons.org/licenses/by/4.0/).