Article

IoT-Based Data Mining Framework for Stability Assessment of the Laser-Directed Energy Deposition Process

by
Sebastian Hartmann
1,2,*,
Bohdan Vykhtar
3,
Nele Möbs
3,
Ingomar Kelbassa
3,4 and
Peter Mayr
1
1
Materials Engineering of Additive Manufacturing, Technical University of Munich, Freisinger Landstraße 52, 85748 Munich, Germany
2
Siemens AG, Frauenauracher Straße 80, 91056 Erlangen, Germany
3
Fraunhofer Research Institution for Additive Manufacturing Technologies IAPT, 21029 Hamburg, Germany
4
Industrialization of Smart Materials, Technical University of Hamburg, Eißendorfer Straße 40, 21073 Hamburg, Germany
*
Author to whom correspondence should be addressed.
Processes 2024, 12(6), 1180; https://doi.org/10.3390/pr12061180
Submission received: 19 May 2024 / Revised: 4 June 2024 / Accepted: 4 June 2024 / Published: 7 June 2024
(This article belongs to the Special Issue Monitoring and Control of Processes in the Context of Industry 4.0)

Abstract

:
Additive manufacturing processes are prone to production errors. Specifically, the unique physical conditions of Laser-Directed Energy Deposition (DED-L) lead to unexpected process anomalies resulting in subpar part quality. The resulting costs and lack of reproducibility are two major barriers hindering a broader adoption of this innovative technology. Combining sensor data with data from relevant steps before and after the production process can lead to an increased understanding of when and why these process anomalies occur. In the present study, an IoT-based data mining framework is presented to assess the stability of processing Ti6Al4V on an industrial-grade DED-L machine. The framework employs an edge-cloud computing methodology to collect data efficiently and securely from various steps in the part lifecycle. During manufacturing, multiple sensors are employed to monitor the essential process characteristics in situ. Mechanical properties of the 160 printed specimens were obtained using appropriate destructive testing. All data are stored on a central database and can be accessed via the web for data analytics. The results prove the successful implementation of the proposed IoT framework but also indicate a lack of process stability during manufacturing. The occurring part errors can only be partially correlated with anomalies in the in situ sensor data.

1. Introduction

The unique characteristics of additive manufacturing (AM) have led to its increasing adoption in numerous industries and academic fields. AM is a general term for multiple production technologies that construct physical objects by a layer-wise deposition of material at pre-defined positions [1]. This production methodology stands in contrast to traditional, subtractive manufacturing technologies, where parts are manufactured by removing material from a larger workpiece. Laser-Directed Energy Deposition (DED-L), a metal AM technology, is of particular interest in academia and industry due to its superb trade-off between production time and part complexity [2,3]. In DED-L, a high-power laser is utilized to create a melt pool consisting of blown metal powder on a substrate material. By moving either the laser head or the base plate, and melting the existing structures and newly applied powder, metallic structures with unique designs and material parameters can be created layer by layer [4]. Nonetheless, the lack of product quality and the resulting costs for the extensive trial and error iterations to achieve defect-free part fabrication hinder the broader adoption of DED-L in industrial applications [5]. The typical quality issues associated with DED-L are porosity, residual stress, cracking, and the high surface roughness of the final parts [4]. This missing process stability associated with DED-L can be correlated with the complex physical phenomena involved in the laser-powder interaction as well as the cyclic thermal loading of the layer-wise manufacturing process [6,7].
To address this persisting issue, various scientific and industrial efforts have been started to enhance the understanding of the process–structure–property relationship for DED-L [8]. These investigations are focused on correlating the properties of the final part to the conditions during the printing process. In this regard, Chen et al. [9] pointed out that a proper qualification of the metal powder before the printing process is of utmost importance for the properties of the final part. Measurements obtaining the particle size distribution, the flowability, and the degree of sphericity have proven to be crucial factors in the final part quality. During the process, the collection and analysis of in situ data enhance the understanding of when and why process instabilities occur [10]. Tang et al. [11] and Liu et al. [12] condensed the field of sensor systems and monitoring techniques that are applicable to DED-L. Multiple scientific publications indicated that the essential characteristic to be monitored in situ during the DED-L process is the melt pool created by the high-power laser [11,13,14]. The monitoring of the melt pool is generally carried out with cameras in the visible and infrared spectrum [11]. In addition to its temperature and geometrical features, the distance between the melt pool and the deposition head is another critical factor in assessing the stability of the DED-L process [15].
The combination of such monitoring data with the data obtained from the DED-L machine results in a virtual representation of the real manufacturing process. Such a representation, often referred to as a digital twin (DT), can also be utilized to enhance the understanding of the DED-L process [16]. By combining the sensor and machine data, the DT of the process creates transparency in understanding what kind of measurements were obtained at which location and point in time during the manufacturing process [17]. As a result, errors in the final part can be traced back to anomalies in the process data. Hartmann et al. [18], Reisch et al. [19], and Chen et al. [20] showcased the applicability of fusing data streams from multiple sensors with the Tool Center Point (TCP) of AM systems. The resulting DTs of the respective AM process can be used for sophisticated data analytics to find outliers, anomalies, and correlations to the quality of the final part. Different destructive and non-destructive techniques can be used to assess the final part quality after the process. Yang et al. [21] provided an extensive review of different analytical methods and concluded that destructive techniques are the most reliable tools to accurately assess the capability of DED-L parts. In summary, it can be stated that data from multiple steps of the part production process must be collected and analyzed to further the understanding of the process–structure–property relationship for DED-L.
The collection and analysis of such data can be facilitated by incorporating elements of Industry 4.0 in the part production process [22,23]. The term Industry 4.0 defines the fourth industrial revolution, characterized by the integration of digital technologies into manufacturing processes, such as the Internet of Things (IoT), artificial intelligence (AI), cloud computing, and big data analytics. Efficiency, productivity, and adaptability of manufacturing processes are hereby increased while the resulting smart factories are capable of making decentralized and data-based decisions [22,23,24]. As Luściński [25] pointed out, the convergence toward such smart factories is currently still in progress. A necessity to unlock this potential is the consistent collection of data from the relevant processes and machines [25,26].
Edge computing has proven to be a crucial computing paradigm to increase the efficiency of consistent communication between data sources and central data storage [27]. Edge devices are specialized computing units positioned at the edge of a network, meaning close to the processes and machines from which data is generated. The incoming data is immediately processed and pre-defined data points are subsequently transferred to a cloud server [28]. In comparison to a direct connection between the data-producing entity and the cloud, applying edge devices has been shown to improve latency, reliability, and computational load management in Industry 4.0 applications [27]. Moreover, edge devices can also ensure a secure and private data transfer that is in line with Industry 4.0 requirements [28].
In the context of AM, Wang et al. [29] proposed a framework for a smart AM factory that is capable of collecting data from all parts of the AM value chain. In this framework, all relevant data points are collected in a centralized cloud computer and made accessible via a structured database. To ensure effective information processing, a computing architecture, consisting of multiple edge IPCs that are efficiently collecting and processing data, is presented. However, the actual application for a real AM system was not in the scope of this research work. The work of Guo et al. [30] showcased a real application of a cloud-edge architecture for visualization and control of the Fused Deposition Modeling (FDM) process. The authors utilize an edge IPC to process and upload the monitoring data as well as to control the FDM system. The cloud serves as the central data-gathering entity on which machine learning models and other analytical tools are trained. While the benefits of this approach are clearly presented, the application is still limited to a low-cost FDM printer unsuited for industrial-grade manufacturing operations. The same limitation is valid for the SMART Manufacturing System presented by Demčák et al. [31]. The authors also employ a desktop FDM printer in combination with a camera and laser displacement sensor to monitor the printing process in situ. The presented quality control system combines the in situ data with information derived from the process preparation and multiple post-process instruments. A different application of an IoT-based AM framework in the field of FDM is proposed by Wang et al. [32]. The developed cloud platform is the basis for the training of neural networks capable of evaluating the final part quality. The approach is very convincing but the authors state that more sophisticated IoT tools, such as edge computing, are needed for further industrial applications. Majeed et al. [33] combined IoT devices (smart sensors, RFID tags, and scanners) with AM and sustainable manufacturing into a framework for improved decision-making during the manufacturing process. Big-data-based analytics are utilized to improve decision-making by visualizing the hidden knowledge from the process data. This approach integrates multiple steps in the value chain of the AM part production but is implemented solely for the selective laser melting technology. Moreover, the framework neglects the need for an edge device capable of working with and ensuring the timewise accuracy of high-frequency data that is produced by the in situ monitoring of AM processes [34]. Another relevant framework was described by Haghnegahdar et al. [35], who deem AM an “inherently suitable solution for integration into cloud-based systems”. Their approach is centred around the concept of an intelligent cloud system that is continuously monitoring and controlling AM processes. However, no real application of the cloud-based system has been presented in their research work. The most advanced IoT-based framework for AM was proposed by Liu et al. [36]. Multiple edge devices were deployed at all stages of the AM product lifecycle to collect and transfer data to the central cloud storage. The lifecycle stages included product design, process planning, manufacturing, post-processing, and quality measurements. While this approach is the most extensive exploration in the field of IoT-based data management for industrial AM, it is only applied to the production of eight samples with one metal Powder Bed Fusion (PBF) technology. Other metal AM technologies were not considered, and assessments of the overall process stability were not presented due to the low number of tested samples. To the authors’ best knowledge, the only application of an IoT-based metal AM framework outside of metal PBF is the industrial IoT system monitoring the Laser Wire-DED technology developed by Martikkala et al. [37]. The architecture is based on multiple edge IPCs processing the data streams from different sensors. The processed data are saved in the time-series database InfluxDB and visualized with the open-source software Grafana (https://grafana.com/). Nonetheless, the scope of this research work was limited to only collecting data from the sensor systems and did not include data from other stages in the product lifecycle.
With regard to the presented literature for applying Industry 4.0 frameworks to AM, it can be stated that the implementation of an IoT-based architecture for the DED process category, incorporating data from multiple steps in the product lifecycle is a goal yet to be reached. This research work presents such a framework and applies it to the production of multiple DED-L parts with titanium. Real-time, in situ monitoring data is collected from multiple sensors and the DED-L system with an edge device. The DED-L process data is combined with pre-process feedstock evaluations, process planning information as well as post-process part quality assessment data into one centralized cloud database. Statistical data mining techniques are subsequently employed to extract knowledge from the data sets. The overall stability of the DED-L process is hereby evaluated and measures to improve the monitoring setup are derived.

2. Materials and Methods

This section describes the overall setup of the IoT framework employed to assess the process stability of the DED-L process. The description starts with the employed hardware systems for printing and analyzing the parts and feedstock. Following this, the utilized sensor systems, monitoring the DED-L process, are presented and their integration in the production setup is explained. Afterward, the proposed digital architecture for collecting and analyzing the process data is outlined. The interaction with this process data in the front end is subsequently described, while the presentation of the experimental methodology to assess the stability of the DED-L process marks the end of this section.

2.1. Hardware Systems

To fulfill the prerequisites of the proposed study, several machines must be deployed across the entirety of the process chain. The process chain is divided into three distinct phases: the pre-processing, the process itself, and the post-processing, each depending on specific types of machinery, as described below. Additional information for all machines is summarized in Table A1 of Appendix A.

2.1.1. Pre-Process Machines for Feedstock Assessment

In the pre-processing analysis, the delivered powder Ti6Al4V grade 5 is tested for several characteristics with a Hall flowmeter, Camsizer X2, and Granudrum machines. The Hall flowmeter (custom-made) provides the results of the flow rate, the bulk and tap density as well as the Hausner ratio of the powder, by the used Hallow-system test. The Camsizer X2 (Microtrac Retsch GmbH, Haan, Germany) measures the particle size distribution through dynamic image analysis according to ISO 13322-2 [38]. The Granudrum (Granutools, Awans, Belgium) measures the avalanche angle of response. Those characteristics describe the powder material and must lie within the thresholds provided by the powder manufacturer Eckart TLS GmbH. As Ti6Al4V is highly reactive, an oxygen level of less than 50 parts per million (ppm) must be obtained throughout all print jobs [39].

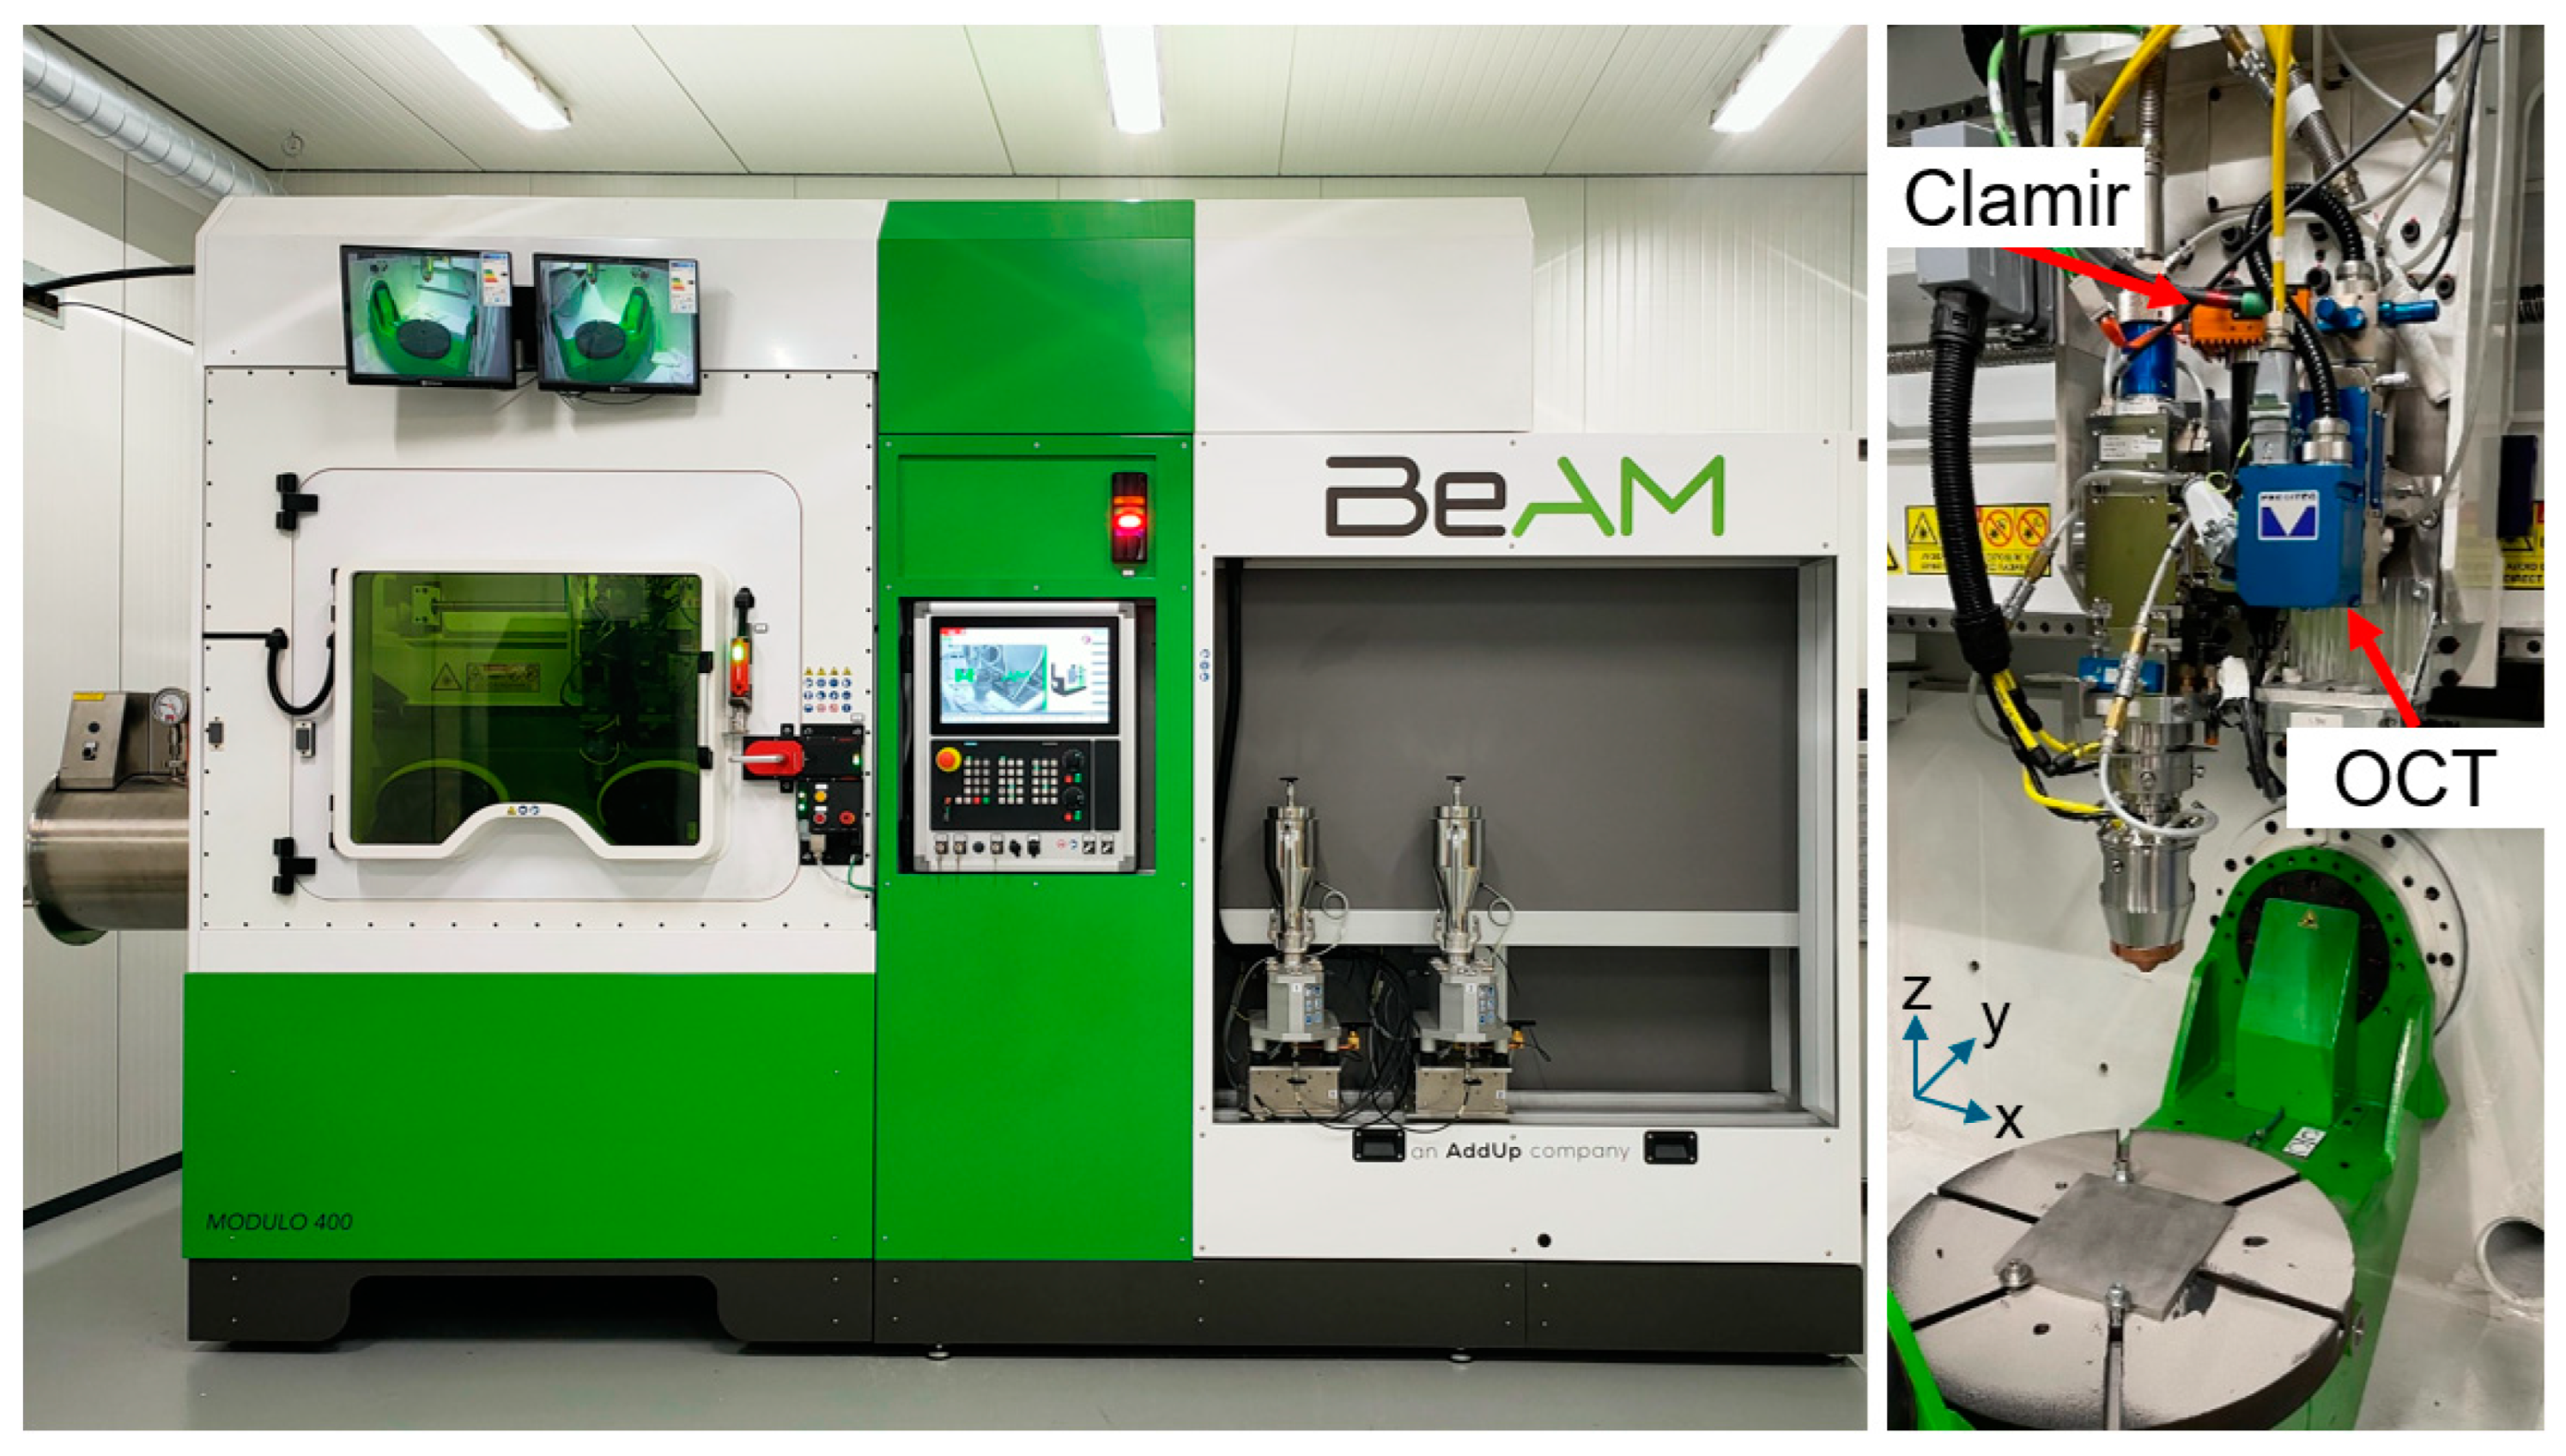
2.1.2. Industrial Grade DED-L System

The DED-L system employed for this study is a BeAM Modulo 400 (AddUp, Cébazat, France), presented in Figure 1 (left). This machine is used in industrial processes for repair and cladding operations, the addition of features to existing components as well as the creation of near-net shape geometries. It consists of an IPG YLS 2000 laser (IPG Photonics Corporation, Oxford, MA, USA) and its chiller, with a maximum laser power of 2 kW with a wavelength of 1070 nm, and a gantry Computer Numerical Control (CNC) (Siemens AG, Munich, Germany) machine. The unique characteristic of this machine is the inert gas process chamber, which can be flooded with Argon, to reduce the oxygen level. As a result, the risk of oxidation during manufacturing is mitigated, enabling the processing of highly reactive materials such as titanium and Inconel [40]. Typically, the processed powder has a grain diameter of 45–100 µm. The powder is delivered via a vibratory feeder, traversing through hoses to reach the nozzle. This nozzle is mounted on the Z-axis of a CNC machine. The nozzle moves in three linear axes, while the build platform consists of two rotational axes. The typical build rate for this nozzle of the Modulo 400 is 90–150 cm3/h [40]. Figure 1 illustrates the DED-L machine with the integrated sensor systems.

2.1.3. Post-Processing Machines for Heat Treatment and Quality Assessment

After the specimens are produced on the substrate plate, the residual stress must be released first. Only after the stress release, further machining of the specimens is possible. For this, a Nabertherm N41/h furnace (Nabertherm GmbH, Lilienthal, Germany) is used. This furnace enables to heat the parts to 1280 °C [41]. Therefore, it can release the residual stress common for steel and titanium parts manufactured with DED-L. After the residual stress release, the near-net shape produced specimens are machined with the milling machine DMU 50 ecoline (DMG Mori, Nagoya, Japan) to the desired contour of a DIN 50125 Form E specimen [42]. Subsequently, these contours are cut from the substrate plate with the wire Electrical Discharge Machine (EDM) Fanuc ROBOCUT α-C600iB (Fanuc Corporation, Oshino-mura, Japan) to their final form.
Several material tests are performed on the specimens, starting with the material testing machine from ZwickRoell Z100 (ZwickRoell, Ulm, Germany). The Z100 is designed for quasi-static and static tests in tensile and compression directions with a load of up to 100 kN. The load may vary from rapid, static, oscillating, or alternating. Every displacement and force peak is recorded in high resolution and time-synchronized at 500 Hz on all measuring channels [43]. The machine measures the Young’s modulus, tensile strength, yield strength, and several additional parameters, which are less relevant for this study. Finally, the remaining specimens are prepared for density and porosity analysis, which is carried out by microscopy with a VHX-5000 microscope (Keyence Corporation, Ōsaka, Japan). The approach for the density analysis is derived from the work of Möller [44] and Jothi Prakash et al. [45], who presented a viable procedure to assess the porosity and density of Ti6Al4V-parts manufactured with DED-L via microscopy.

2.2. Sensors

For this study, a total of 18 sensor systems were employed for data collection within and outside of the BeAM Modulo 400. The sensor systems are divided into two categories. As was already pointed out in Section 1, the melt pool remains the most important characteristic to be monitored during DED-L [11,13,14]. Therefore, category A incorporated all data streams directly concerned with the monitoring of the melt pool. Those included the integrated Optical Coherence Tomography (OCT) system and near-infrared camera detailed in Section 2.2.1 and Section 2.2.2 as well as the data coming from the DED-L machine. The second category, category B, consists of the sensor systems employed to collect data from the environment inside and outside of the machine. These sensor systems are presented in Section 2.2.3. The data points from category A were sampled with a 500 Hz frequency since this was the maximum obtainable frequency for the machine data. For category B, lower frequencies were deemed sufficient as changes within and outside of the build chamber environment do not occur rapidly during the DED-L process [46]. The product specifications and frequencies for all employed sensor systems can be found in Table A2 of Appendix A.

2.2.1. Integrated OCT-System

In DED-L, the stand-off distance between the melt pool and the nozzle is a critical parameter to be observed during the printing process. Only a constant stand-off distance guarantees a stable and safe part production [15]. To be able to observe the stand-off distance, the OCT (Precitec GmbH & Co. KG, Gaggenau, Germany) system from Precitec was integrated into the machine, presented in Figure 1 (right). The system works by emitting laser light waves into the deposition spot and measures the back-reflected laser light. Interferometry is used to detect the interference patterns created by the reflected laser light, allowing a precise 1D measurement with a frequency of up to 70 kHz [47]. The measurement data is filtered by a median filter internally on the field-programmable gate array of the OCT system. Subsequently, the filtered data are provided via analog output to the Industrial Edge with a 500 Hz frequency. Nevertheless, the quality of the OCT data in the DED-L process is still a field of research due to the disturbance of the signal through the moving powder.

2.2.2. Integrated Near-Infrared Camera

To observe the melt pool dimensions, the near-infrared camera Clamir (New Infrared Technologies, Madrid, Spain) with a resolution of 64 × 64 pixels was integrated into the optical path of the processing laser, as shown in Figure 1 (right). In contrast to the OCT system, the camera detects the emitted light of the melt pool due to thermal radiation. The emitted radiation is subsequently translated into the width of the melt pool by a real-time processing unit positioned on top of the camera [48]. After the calibration of the pixel-to-mm ratio, the measured values are also transmitted via analog output to the Industrial Edge with a 500 Hz frequency. These data are later used to validate the stability of the process.

2.2.3. Integrated Environment Sensors

To monitor the environment within and outside of the machine, 16 sensors were employed to collect process data. Most of these sensor systems are positioned within the build chamber and create transparency regarding the temperatures, gas flows, inert chamber gas properties, and pressures present during the experimental runs. Those signals are read directly through the programmable logic control (PLC) of the machine. In order to also observe the environment of the machine cell, Balluff environmental sensors BCM0002 (Balluff GmbH, Neuhausen a.d.F., Germany) are placed on top of the machine [49]. These sensors capture the outer machine environment by monitoring the temperature, humidity, pressure, and vibration throughout the manufacturing processes. The Balluff sensors are connected via I/O-Link to an OPC-UA master, which provides the data through an OPC-UA connection to the Industrial Edge.

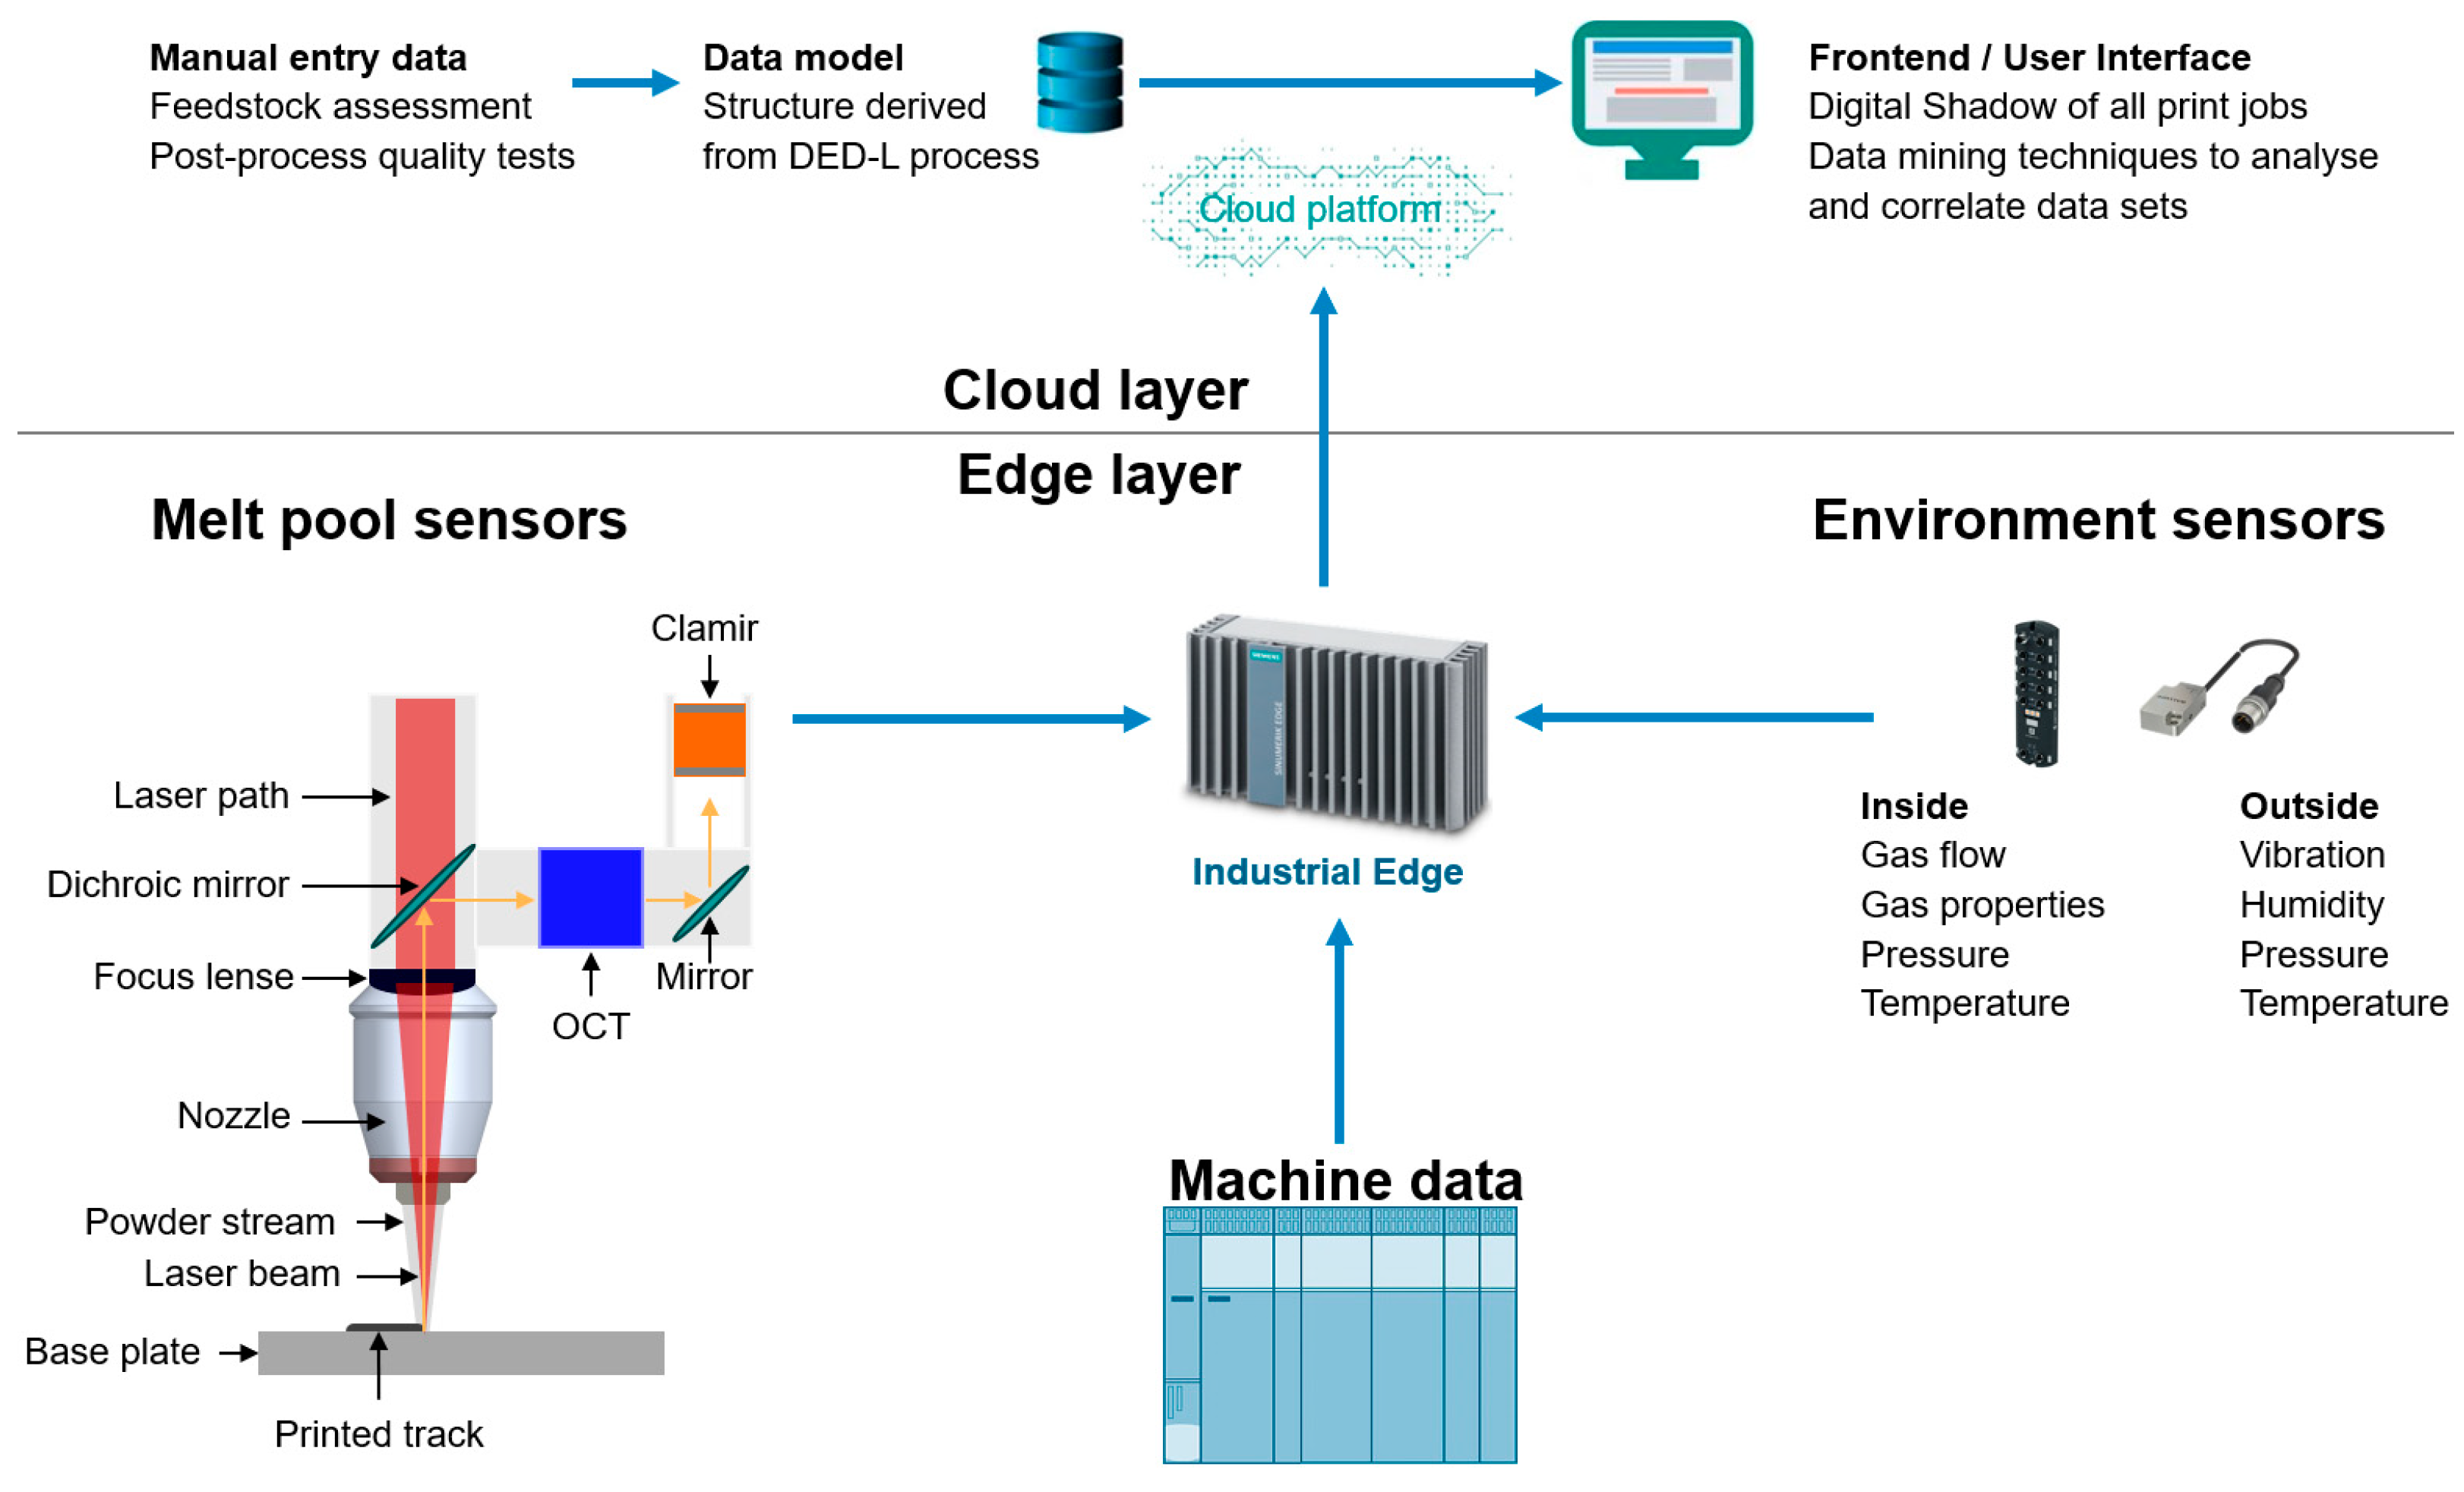
2.3. Digital Architecture

The hardware systems, analytical processes, and sensor systems described in the previous sections produce data at different steps in the DED-L product lifecycle. The obtained data points from the pre-process and post-process qualification machines (see Section 2.1.1 and Section 2.1.3) are manually inserted into the cloud database. During the process, the Industrial Edge IPC from Siemens AG (Siemens AG, Munich, Germany) functions as the central data processing entity for all machine and sensor data streams. The runtime of this edge device is based on an industrial-grade Linux system with Open Container Initiative (OCI) standards to ensure secure data processing on the device. Moreover, the edge-cloud communication is handled via an SSL-secured HTTPS connection providing an encrypted data transfer between the edge and the cloud [50]. As it was pointed out by Jia et al. [34], time synchronization between multiple, independent data streams remains one of the toughest challenges to be solved within IoT frameworks. In the present architecture, the edge device functions as the Network Time Protocol (NTP) server to which all other monitoring devices are assigned. As a result, all devices run on the same clock which minimizes errors in the synchronization of the data streams on the edge IPC. Figure 2 shows the digital architecture connecting all systems with the cloud platform.
All in situ data points are processed on the edge device and subsequently transferred to the cloud where they are combined with data coming from the other stages of the DED-L product lifecycle. As it was pointed out by Liu et al. [36], the structure of a database representing a product lifecycle is crucial for efficient data management and analysis. Therefore, a customized AM data model structure containing four DED-L product lifecycle steps was defined. The considered product lifecycle starts with the feedstock assessment where the powder is identified and qualified. Subsequently, the process planning parameters describing the actual printing process must be defined. All data points generated before printing are inserted manually into the data model. Once the process starts, in situ data from the machine and the sensors are automatically transferred to the database via the cloud-edge framework. After the build job is finished, post-process analytical data characterizing the final part quality are manually entered into the database. The data model was implemented with TimescaleDB (2.7.0, Timescale Inc., New York, NY, USA), an open-source time-series database built upon PostgreSQL (14, PostgreSQL Global Development Group). The central entity of the DED-L data model is the respective print job. All related data coming from feedstock assessment, process planning, in-process data monitoring, and post-process part quality analytics are mapped to their respective print job. The structure of the DED-L data model is depicted in Figure 3.

2.4. Front End with Digital Shadow

The data stored in the created data model structure can be accessed via a web-based user interface (UI). The UI is a web application built using Typescript with Angular (13.1.2, Alphabet Inc., Mountain View, CA, USA). It runs on a local Linux server with an internet connection. All required applications, like the database, Data Transfer Object (DTO) modeling, and the front end itself, are run on isolated Docker containers and are connected within a Docker Compose (2.6.0, Docker, Inc., Palo Alto, CA, USA) network. Registered users can enter the UI via the web and insert new entries in the database with standard REST-API commands for HTTP. Figure 4 depicts the UI of the analytics platform showcasing an exemplary sensor outlier detection for melt pool width data from a print job (blue), the corresponding rolling average (red), and the lower and upper bounds (grey) derived from the standard deviation of the rolling mean average. All relevant entries from the database and necessary logical operators can be selected via pre-defined dropdown menus. The corresponding views are directly displayed on the web page. The users can also directly compare the data of different print jobs and utilize a direct connection to Tableau and Jupyter Notebook for more sophisticated data analytics.
The main purpose of the analytics platform is the visualization and analysis of the DED-L process data. As was already established, such virtual representations of real processes are often referred to as digital twins (DT). However, the term DT encompasses a multitude of meanings in the academic and industrial sphere [51]. For the present work, the definition to be used in the following is derived from the work of Kritzinger et al. [52]. The authors presented a three-term methodology to differentiate between the various applications of DTs. The distinction was made between a digital model, a digital shadow, and a digital twin. The digital model does not use any automated data exchange between the physical and the digital object. The digital shadow does so in one direction while the digital twin has an automated, bidirectional data flow between the real and digitized object. In the proposed framework, the data transfer from the actual DED-L process to the cloud is automated but not bidirectional. Therefore, the correct term for the present virtual representation of the in situ data is digital shadow. The digital shadow consists of the data points from the employed sensor systems and the data collected from the DED-L machine. In the described framework, the digital shadow can also be accessed and analyzed in the front-end user interface. Figure 5 showcases an example of a digital shadow of the DED-L process, combining the position data with the measured melt pool width.

2.5. Methodology

To assess the stability of the DED-L process, a total of 160 specimens were printed and analyzed. These 160 specimens were derived from 10 printing processes each comprising four sub-print jobs to test the machine’s capability when handling different build strategies. From each of the four sub-print job sections, four samples for post-process analytics were taken. The design of the printed parts with the respective sub-print jobs can be viewed in Figure 6. In total, each printed part consisted of eight walls and two cuboids. The eight walls are dissected into two groups of four walls each. For the first group (a), the build strategy was layer-wise, meaning that all four layers were built up simultaneously layer-by-layer. For the second group (b), every wall was built one at a time before moving to the next one. For the cuboids, two build strategies were employed. The first cuboid (c) was printed with a parallel build strategy of depositing layer next to layer along the long axis. For the second cuboid (d), the build strategy changed to a 45° zigzag build visualized in Figure 6.
Through systematic analysis of all data points described in Section 2.3, an effective evaluation of the overall performance of the DED-L process can be achieved. The first step in the analysis process is the utilization of descriptive statistics to understand the main features of each dataset obtained. By employing mean, median, and quantile calculations, insights about the central tendencies, variabilities, and distributions of the respective data set can be perceived. To identify anomalies in the data sets, two strategies were followed. For the feedstock assessment and the post-process quality characteristics, pre-defined thresholds were used for data evaluation. These thresholds were either taken from the literature or material supplier and are detailed in the respective Section 3.1 and Section 3.4. The second strategy concerned the in situ data coming from the sensor systems monitoring the melt pool and process environment. Due to the extreme physical conditions in DED-L, the in situ monitoring is prone to noise as lots of outliers can be expected throughout an experimental run [6]. As the goal of the present study is the overall evaluation of process stability across multiple DED-L print jobs, critical boundaries have to be defined within which a print job can be deemed acceptable. These boundaries should focus on the overall distribution of process data and not on specific outlier data points. To define such boundaries, the present study employs the empirical method which suggests that 68%, 95%, and 99.7% of all data in a given set fall into one, two, and three standard deviations of the mean, respectively [53]. The employed sample standard deviation (Equation (1)) was conducted using the python-library pandas with the method pandas.DataFrame.std(), where x i is an individual data point in the data set x while x ¯ stands for the mean, and n contains the number of all data points in the data set x [54].
s = i = 1 n x i x ¯ 2 n 1
The standard deviation from the mean is used as the basis for the boundary setting to determine which print jobs can be identified as acceptable. However, an important distinction must be made between the in-process data from the melt pool (Section 2.2.1 and Section 2.2.2) and the environment (Section 2.2.3) sensor systems. As was already pointed out, the melt pool is the essential characteristic to be monitored during DED-L [11,13,14]. The environment sensors are also important tools to monitor the DED-L process. However, their respective monitored process characteristics have a less significant influence on the final part quality. The authors consequently propose a rigorous boundary setting when analyzing the melt pool monitoring data and a less strict setting when dealing with the environmental data.
In the proposed approach, the boundaries for the melt pool data are set based on one standard deviation from the mean. For the environmental data, the boundaries are set based on two standard deviations from the mean. In both cases, a print job is declared to be acceptable when the respective boundary is not crossed by the box displaying the interquartile range (IQR) for the considered sensor data. The IQR contains the middle 50% of an ordered data set and is calculated as the difference between its 75th (Q3) and the 25th percentile (Q1). A visualization of this approach with three exemplary box plots can be seen in Figure 7.
Box plots are commonly used for visualizing the distribution of a dataset by displaying the IQR (green box), median (black line in the green box), and whiskers (horizontal lines outside of the green box). The whiskers extend the IQR to the maximum and minimum values within 1.5 times the IQR from the first and third quartile, respectively. For the proposed approach, the example in the middle, showcasing the IQR box slightly crossing the threshold, would be deemed a borderline print job for which the acceptability must be further evaluated based on the post-process data.

3. Results

This section presents the results of the stability assessment of the DED-L process derived from the described IoT-based data mining framework. A total of 160 specimens were manufactured and tested to validate the prescribed framework and assess the stability of the DED-L process. The 160 specimens resulted from ten print jobs with four build strategies each. Of these four build strategies, four specimens were cut each leading to 16 specimens per print job. Each print job produced data at all four steps in the described lifecycle of DED-L parts (see Figure 3). The subsequent sections cover the analysis of data derived from the feedstock assessment (Section 3.1), the process planning (Section 3.2), the in situ data from the sensors systems (Section 3.3), and the post-process tests evaluating the final parts (Section 3.4). Based on these analyses, the overall stability of the DED-L process is discussed in Section 4.

3.1. Feedstock Assessment

For the first step in the lifecycle, the feedstock assessment, the described machines in Section 2.1.1 were used to quantify the quality of the metal powder batches. In total, two material batches were used during the production runs. The first batch was used for print jobs 1 to 8 and the second batch for print jobs 9 and 10, respectively. For both batches, the flow rate, bulk, Hausner ratio, particle size distribution, and avalanche angle of response were all within the acceptable thresholds provided by the powder manufacturers. Therefore, no outliers were spotted for the feedstock assessment lifecycle step.

3.2. Process Planning

Before assessing the stability of the DED-L process, a suitable process parameter set had to be found. Several parameter sets with varying feed rates and laser powers were tested by printing test samples and analyzing them subsequently. After finding the optimal process parameters, they remained constant throughout all experiments. As a result, the only dynamic process planning parameter during each production run then was the build strategy which was altered four times for every part, as described in Section 2.5. The manufacturing of complex parts generally requires the combination of different build strategies in one print job. Therefore, the approach of changing the build strategy multiple times during each production run further quantifies the process’ capability to be used in the production of complex and critical parts. Regarding the process planning step, the respective data sets therefore contained no anomalies or unexpected deviations from the norm.

3.3. In Situ Process Data

As mentioned in Section 2.2, the in-process sensors were divided into category A, containing the integrated sensor systems directly monitoring the melt pool, as well as category B, consisting of the environmental sensors positioned within and outside of the build chamber. For the first, melt-pool-related category, the data coming from the Clamir and OCT systems were considered. Unfortunately, the OCT data can not be utilized for analysis since calibration issues resulting in insufficient data remained during the experimental runs. Therefore, the melt pool width data coming from the Clamir system was taken as the sole indicator for process stability in category A. Derived from the logic presented in Section 2.5, Figure 8 shows the box plots of the melt pool width data for all print jobs and the four build strategies employed. The red lines represent the single standard deviation which is added to and subtracted from the mean of the entire data set of the respective build strategy.
Regarding the overall distribution of the melt pool width data, it can be stated that print jobs 1 to 5 tend to have bigger IQRs and a more skewed distribution for the two wall-related build strategies when compared to their counterparts for print jobs 6 to 10. The wider spread in the middle 50% of the data points shows a more heterogeneous distribution within those data sets. This could imply a less stable manufacturing process for those print jobs which must be quantified with the post-process quality analytics. For the two cuboid build strategies, this effect can not be seen as the IQR boxes indicate a more consistent spread for those data sets.
As detailed in Section 2.5, all print jobs falling within the red lines should be deemed acceptable. Consequently, there are several borderline and outlier cases indicating anomalies in the melt pool width data. The two obvious outlier cases are print job 4 for the wall layer-by-layer sub-print job and print job 1 for the cuboid parallel build strategy. The IQRs of these two print jobs cross the red standard deviation mark. Moreover, for the wall layer-by-layer build strategy, print jobs 1, 2, 3, and 10 as well as print jobs 1, 3, and 5 for the wall one-by-one build strategy can be considered borderline print jobs as they almost touch the standard deviation mark. For the cuboid parallel build strategy, multiple print jobs can further be identified that are close to crossing the standard deviation, namely print jobs 6, 7, and 9. For the cuboid zigzag print jobs, the data are more evenly distributed, indicating a more stable manufacturing process for this build strategy.
When summarising the analysis of the melt pool data, it can therefore be stated that multiple print jobs within the two wall-related build strategies as well as the cuboid parallel build strategy do not show the characteristics of a stable melt pool data distribution. Solely for the cuboid zigzag build strategy, a stable process can be estimated, as all print jobs are evenly distributed without touching the single standard deviation mark.
In addition to the melt pool-related category A, the data coming from the environmental sensors inside and outside of the machine also contained relevant insights into the experimental runs. As pointed out in Section 2.2.3, a total of 16 sensors were used to capture the environmental conditions inside and outside of the machine. The threshold boundaries within which a print job can be deemed acceptable for the environmental data were set to two standard deviations above and below the mean.
Inside the building chamber, the data from the employed sensor systems can be grouped into gas flow, pressure, gas properties, and temperature data sets. The respective sensors within each group showed similar behavior throughout the experiments. Figure 9 presents an example for each data group collected within the build chamber across all print jobs for the sub-print job wall layer-by-layer. The first group, the gas flow sensors, remained constant throughout all experimental runs. As the monitored gas flows are directly controlled by the PLC of the machine, this consistency in the data can be expected. Consequently, no outliers were detected for the gas flow sensors. The pressure sensors showed some dynamic behavior across the print jobs but the respective IQRs never came close to the threshold boundaries. It can be assumed that the pressure within the build chamber is influenced by the extreme physical conditions created by the high-power laser system. Moreover, the movement of the axes during production might also cause variations in the pressure measurements. The observed dynamic behavior can consequently be expected when considering the pressure data within the build chamber. Regarding the inert chamber gas properties, measuring the humidity and oxygen level, a low dynamic behavior can be attested, too. However, this data group showed clear deviations during the experiments as can be seen in Figure 9 on the lower left side. The fourth data group covering the temperature sensors within the build chamber shows very dynamic behavior and outliers crossing the two standard deviation mark. As the high-power laser heats the substrate and metal powder, temperature variations can be expected subsequently within the build chamber.
In addition to some of the sensors within the build chamber, the sensor systems placed outside of the machine show dynamic behavior throughout all print jobs. Figure 10 visualizes the process data for the employed vibration, temperature, humidity, and pressure sensors across all print jobs for the sub-print job wall layer-by-layer. The dynamic behavior of the vibration can be directly attributed to the movements of the machine during the manufacturing processes. The same is valid for the temperature sensor as the machine is emitting heat from its build chamber to the environment. Even though the DED-L system is positioned within a sealed-off room, strong dynamics can also be observed for the humidity and pressure sensors positioned outside of the machine. It can be assumed that the opening of the door or windows in the sealed-off room during the experiments might have resulted in the observed humidity and pressure behavior. For all sensors positioned outside of the machine, outliers were detected.
To summarise the environmental data coming from the sensors within and outside of the build chamber, it can be stated that several print jobs outside of the pre-defined threshold of two standard deviations were identified. Within the build chamber, strong differences in the dynamic behavior can be observed for the different sensor data groups. In contrast, the sensor systems positioned outside of the build chamber showed dynamic behavior throughout all experimental runs. As multiple critical print jobs were identified, the informative value of the different sensor systems will be further evaluated in Section 4 based on the post-process data detailed in the next paragraph.

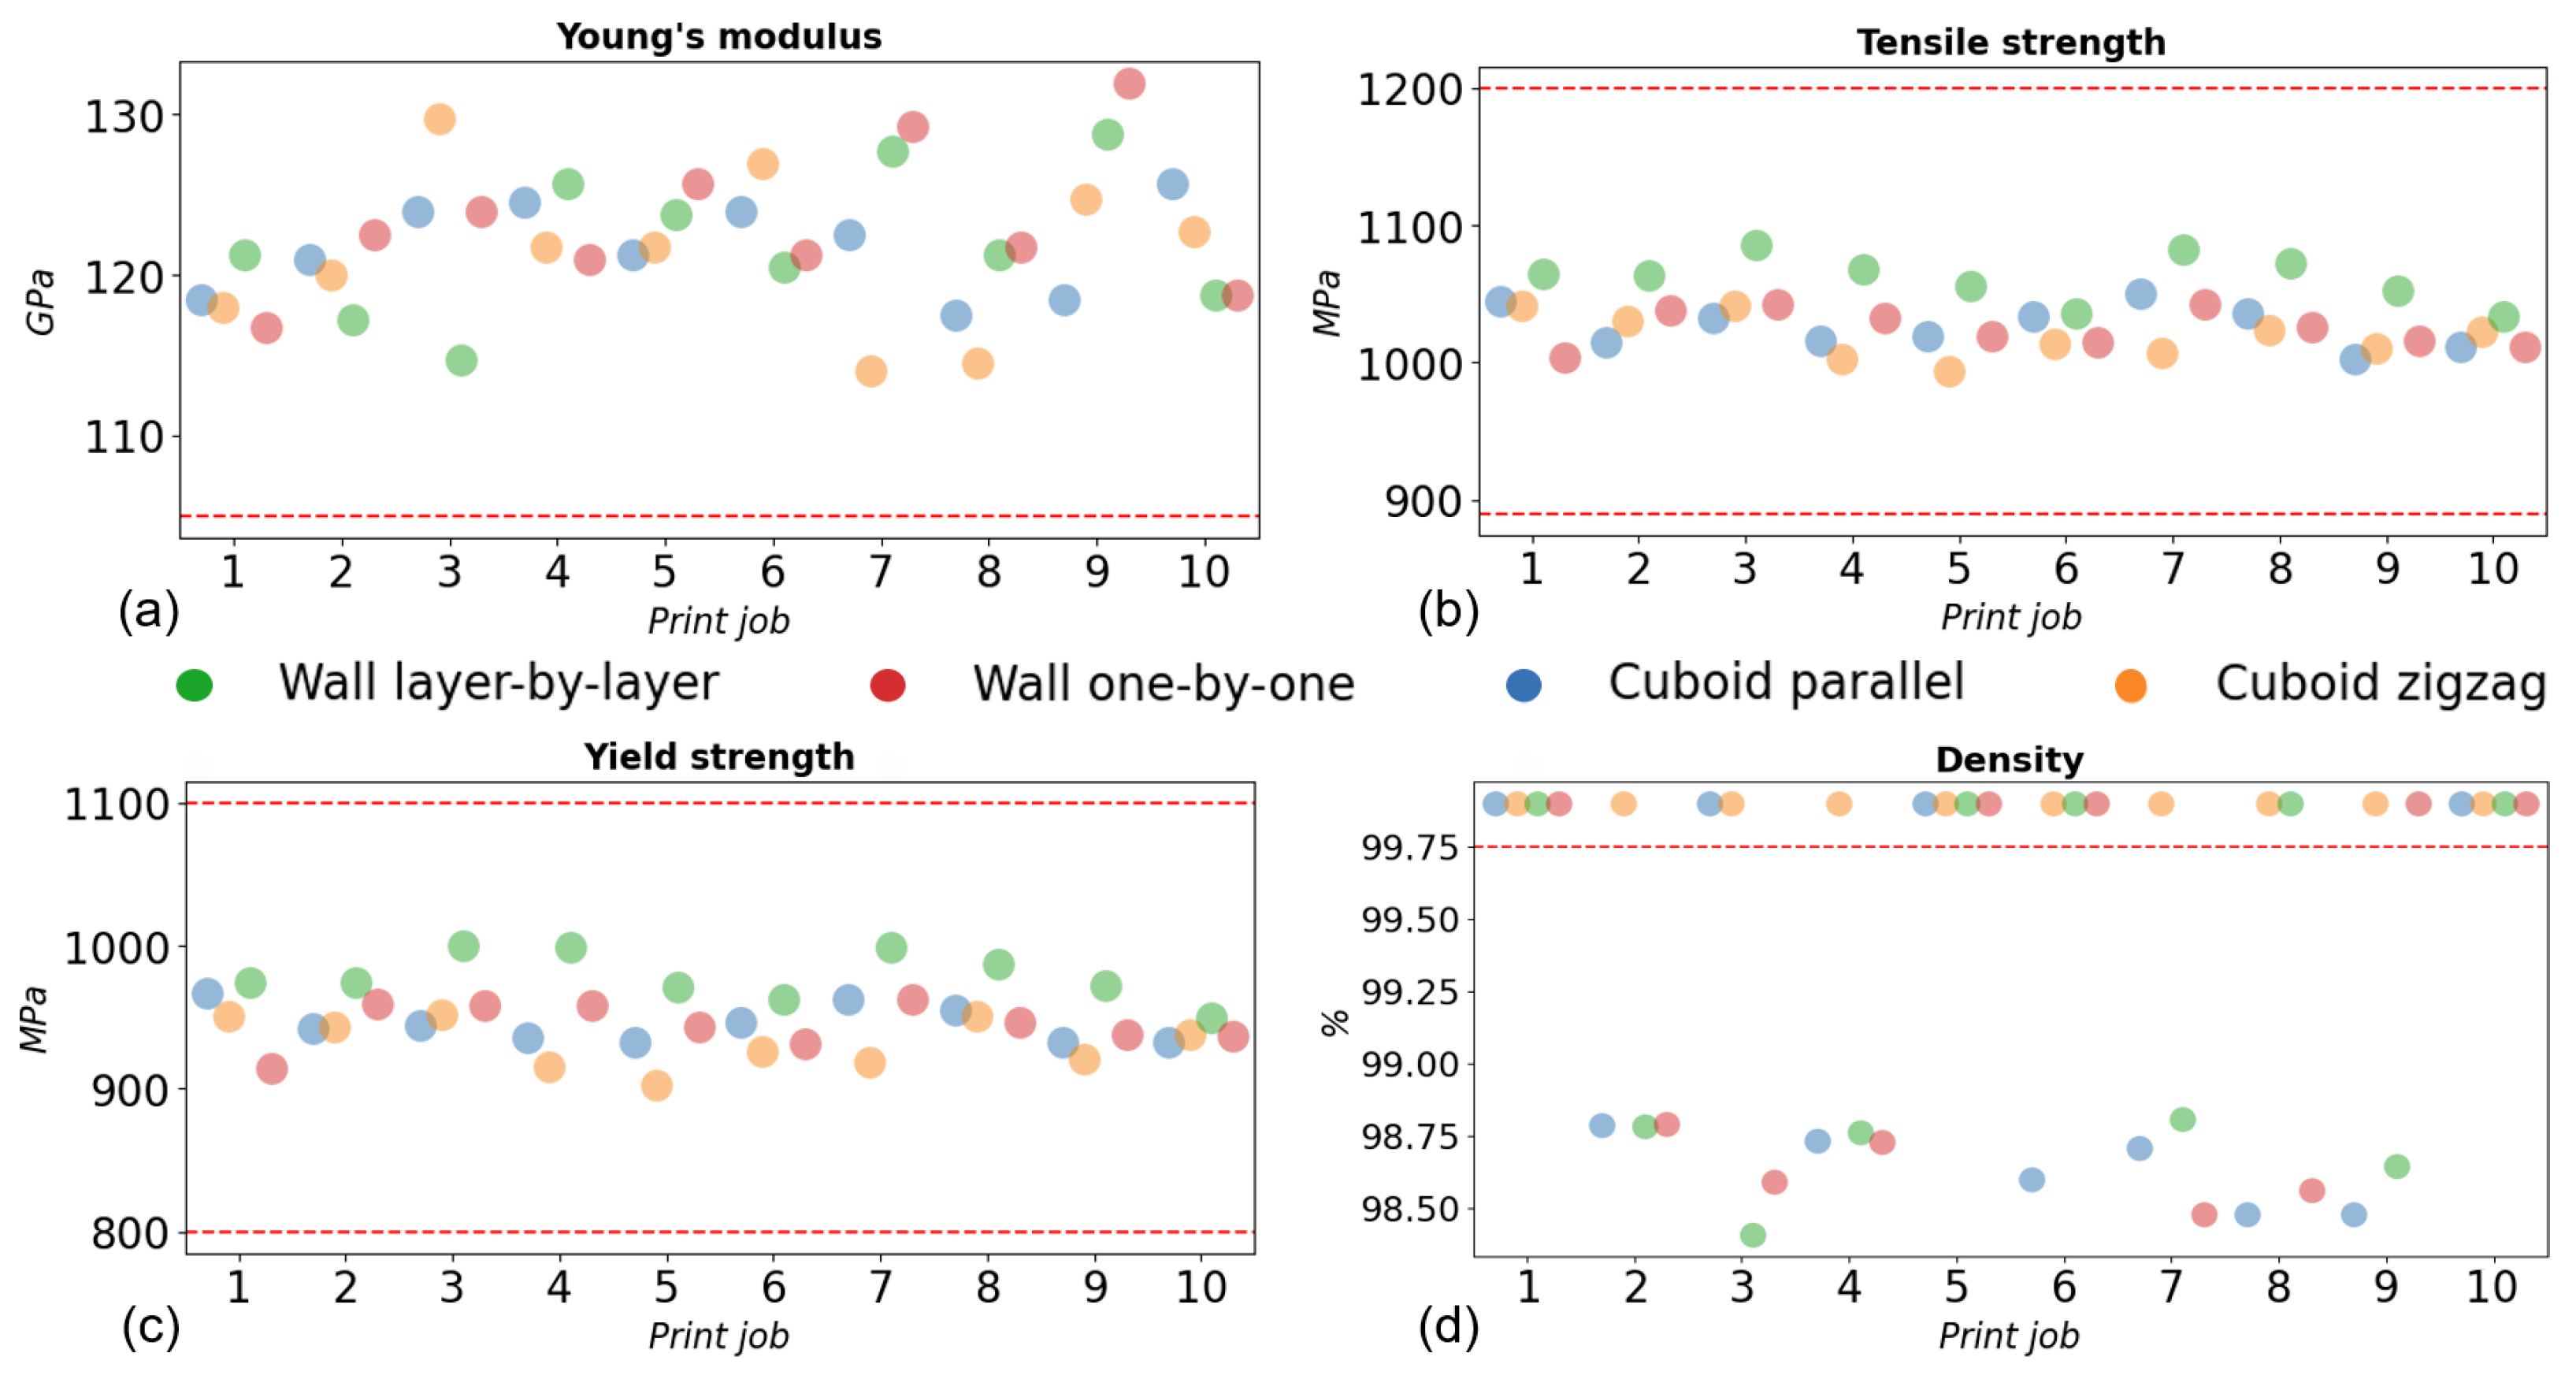
3.4. Post-Process Data

As the in-process data analysis indicated a lack of process stability based on multiple outliers detected in the sensor data, post-process part testing is used to validate this assumption. The tests and machinery described in Section 2.1.3 were employed to quantify the quality of the 160 specimens. The resulting information evaluating the Young’s modulus, tensile strength, yield strength, and density of each specimen indicated some degree of variability during the print jobs. Figure 11 displays the mean values of all quality characteristics of the four specimens taken from every build strategy for all ten print jobs. The thresholds for each test are displayed as red lines and are derived from the work of Möller [44].
All print jobs are within the acceptable range for the Young’s modulus, tensile strength, and yield strength measurements. In contrast, the density measurements show multiple outliers. The discrepancy in the measurement results between the first three and the fourth test can be attributed to the different measurement objectives. For the Young’s modulus, tensile strength, and yield strength, the objective is to quantify the strength of the parts along the printed track. For the density measurements, the inter-layer robustness is tested. The measured density values below the threshold of 99.75% indicate a lack of fusion between adjacent layers during the build-up, which can be interpreted as cracks inside the specimen. Since the tensile tests were performed along the track, this lack of fusion does not influence the shown parameters, which are in the given boundaries. The lack of fusion can have three different origins. The first origin might be the stand-off distance between the nozzle and the part. Since the powder stream and the processing laser have a defined focus, a deviation in the stand-off distance leads to less induced energy and less molten powder. As mentioned in Section 2.2.1, the observation with the OCT system used was not feasible at the time of this study. The second origin could be the fluctuation in the powder stream, which was not measured during this study since industrial in situ powder stream measuring solutions at the current time are not present in the market. The third cause of the lack of fusion could be the cooling and shrinking of the part, which again results in an increased stand-off distance. Especially for the layer-by-layer wall build strategy, with an increased time between each layer, this could have been an important issue.
Broken down into the respective sub-print jobs, the wall layer-by-layer build strategy shows five, the wall one-by-one five, and the cuboid parallel six faulty print jobs. As Ruiz et al. [55] pointed out, the observed porosities are typical but detrimental defects in DED-L manufactured parts. The respective print jobs can hence not be deemed acceptable even though the other post-process measurements might be in line with their respective thresholds. As a result, a total of 16 sub-print jobs show inadequate part characteristics.

4. Discussion

Based on the findings of Section 3.3 and Section 3.4, it can be summarized that the DED-L process did not run stable throughout the ten print jobs. This instability is most obvious when considering the density measurements indicating porosities and lack of fusion for 16 sub-print jobs. The results imply the need to further optimize the process parameter sets for the different sub-print jobs. By investigating different variations in the laser power and feed rate for each sub-print job, a more stable process across all print jobs could be achieved.
While the data from the melt pool width and environmental sensors also indicate a lack of process stability, it must be stated that a clear correlation between sensor data and post-process data can not be established. This statement is best shown when considering the detected outlier print jobs for the melt pool width data. Based on the presented boundary approach, using a single standard deviation from the mean, two print jobs clearly intersect the upper threshold boundary. These are the wall layer-by-layer section of print job 4 as well as the cuboid parallel section of the first print job. Print job 4 also shows an outlier in the density data for the wall layer-by-layer sub-print job. For print job 1, however, no outlier can be detected in the post-process quality tests. The same is valid for the skewed print jobs 1 to 5 for the wall sub-print job types. Here, the IQRs of the melt pool width data are skewed and multiple borderline cases can be identified. Nevertheless, print jobs 1 and 5 are not prone to any outliers in the post-process data for either of the wall sub-print jobs. Moreover, the borderline print job 10 of the wall layer-by-layer strategy, does not correspond to any outlier in the post-process tests as well. Considering the cuboid parallel strategy, the melt pool width data indicates anomalies for print jobs 6, 7, and 9. Based on the post-process measurements, these print jobs are indeed outliers, but subpar density measurements were detected for print jobs 2, 4, and 8, too. Derived from these inconsistencies, the obtained melt pool width data can only be deemed capable of tracking the process in situ to some extent. Derived from the presented approach of using a single standard deviation to identify outliers, the data correctly showed that the overall process stability was not given throughout all print jobs. The proposed boundaries for the melt pool width data also correctly implied that the cuboid zigzag sub-print jobs should not be prone to errors in the final part quality. For the three remaining sub-print job types, the detected outliers only partially correspond with the measured quality outliers in the post-process tests. It can therefore be assumed that more dedicated calibration efforts and the inclusion of additional sensor data, such as the presented OCT system, might lead to more tangible results in future research works.
The environmental data shows even less correlation with the post-process measurements. Although multiple sensor systems indicated outliers for different print jobs, no systematic trace back to the post-process quality measurements can be observed. This implies that no environmental sensor contains informative value about the final part quality for the ten print jobs. This could be explained by considering that the occurring manufacturing error, the lack of fusion, is not monitorable by the environmental sensor set. Subsequently, the proposed threshold strategy of using two standard deviations to identify outliers does not lead to tangible results either. Nonetheless, the dynamic behavior of the sensor systems shows that they are capable of tracking the process conditions inside and outside of the machine. It can hence be assumed that major environmental shifts within and outside of the DED-L system can be detected with these sensor systems in future production runs.

5. Conclusions

Considering all data sets presented, the proposed implementation of an IoT-based data mining architecture for the DED process category, incorporating data from multiple steps in the product lifecycle, has been achieved. Data from the feedstock assessment, process planning, in situ sensors, and post-process quality tests were combined into one data model tailored toward the DED-L process. The major results of the presented research work are summarized below:
  • A total of 18 sensors were integrated into an industrial-grade DED-L system to collect data from the melt pool and machine environment during multiple printing processes.
  • An edge IPC was employed to pre-process and fuse the data streams from the sensors with the data coming from the DED-L machine to create a digital shadow of each print job.
  • All in situ data points were transferred into the cloud and subsequently stored in a database alongside the corresponding data sets from all other lifecycle steps.
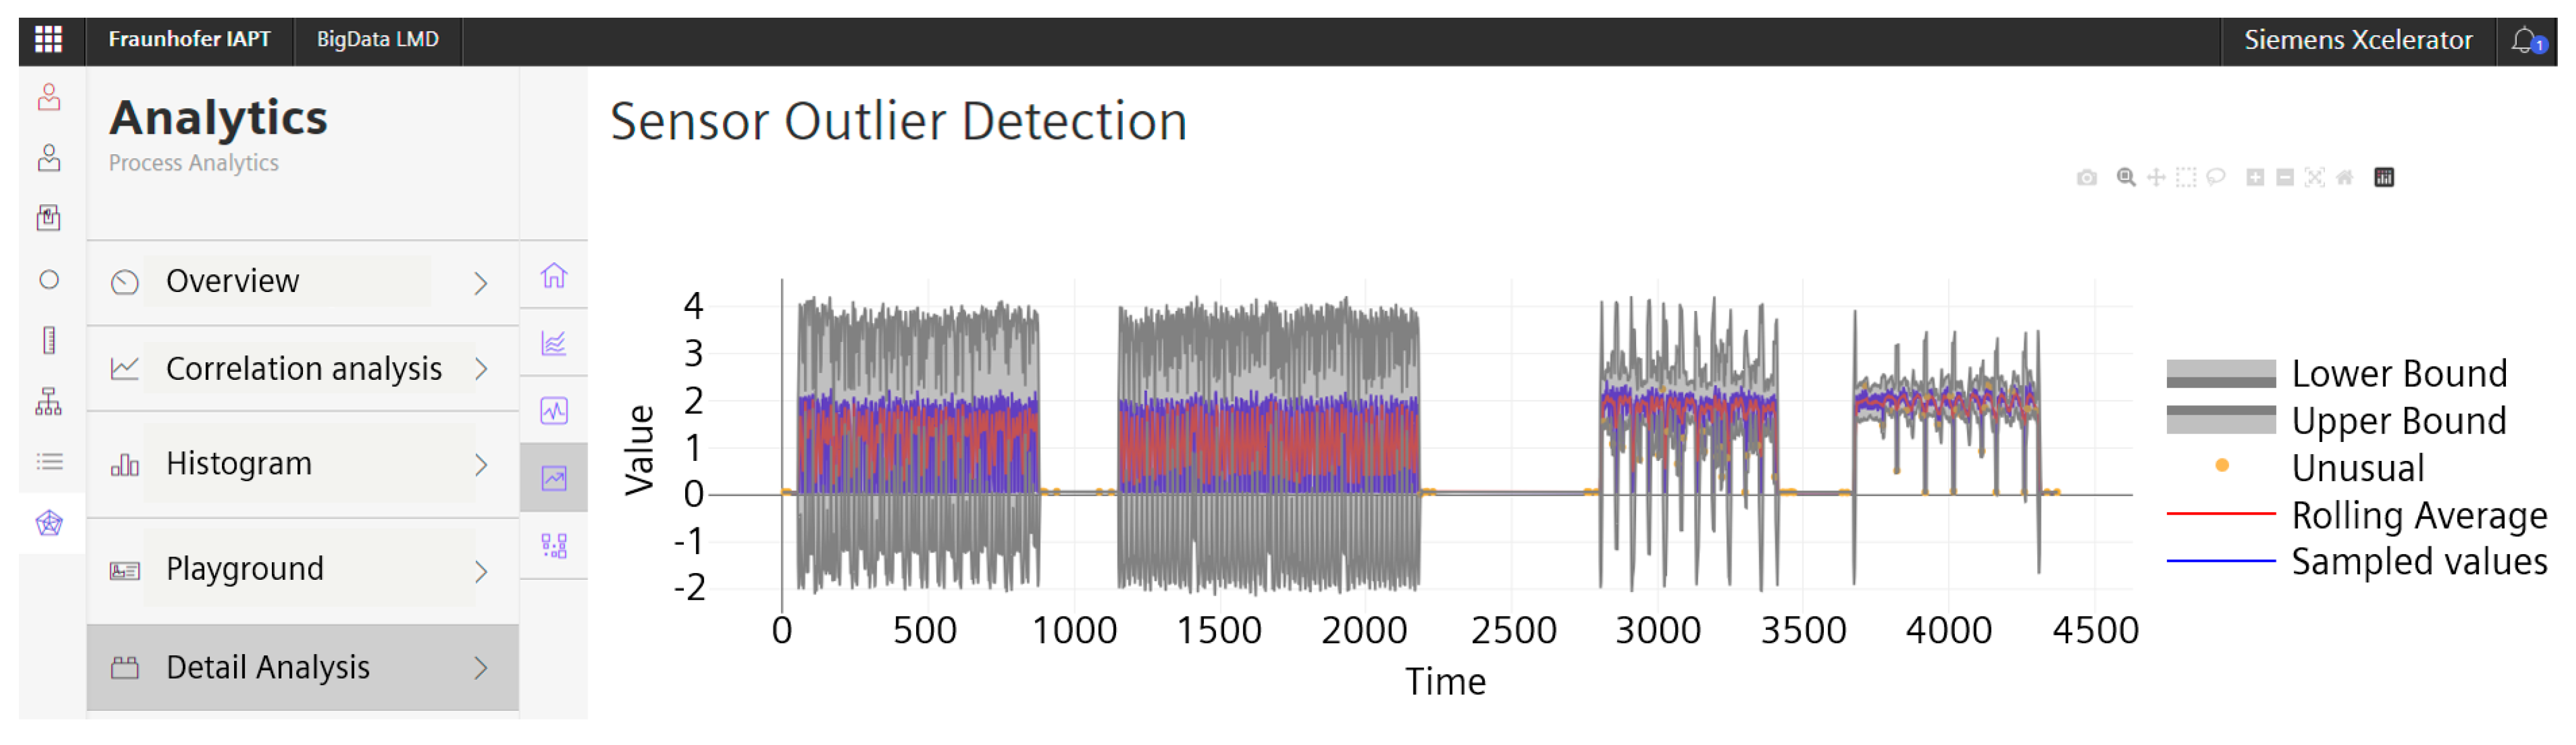
  • To identify anomalies in the sensor data, thresholds were defined based on the standard deviation from the mean and the interquartile range of the respective data sets.
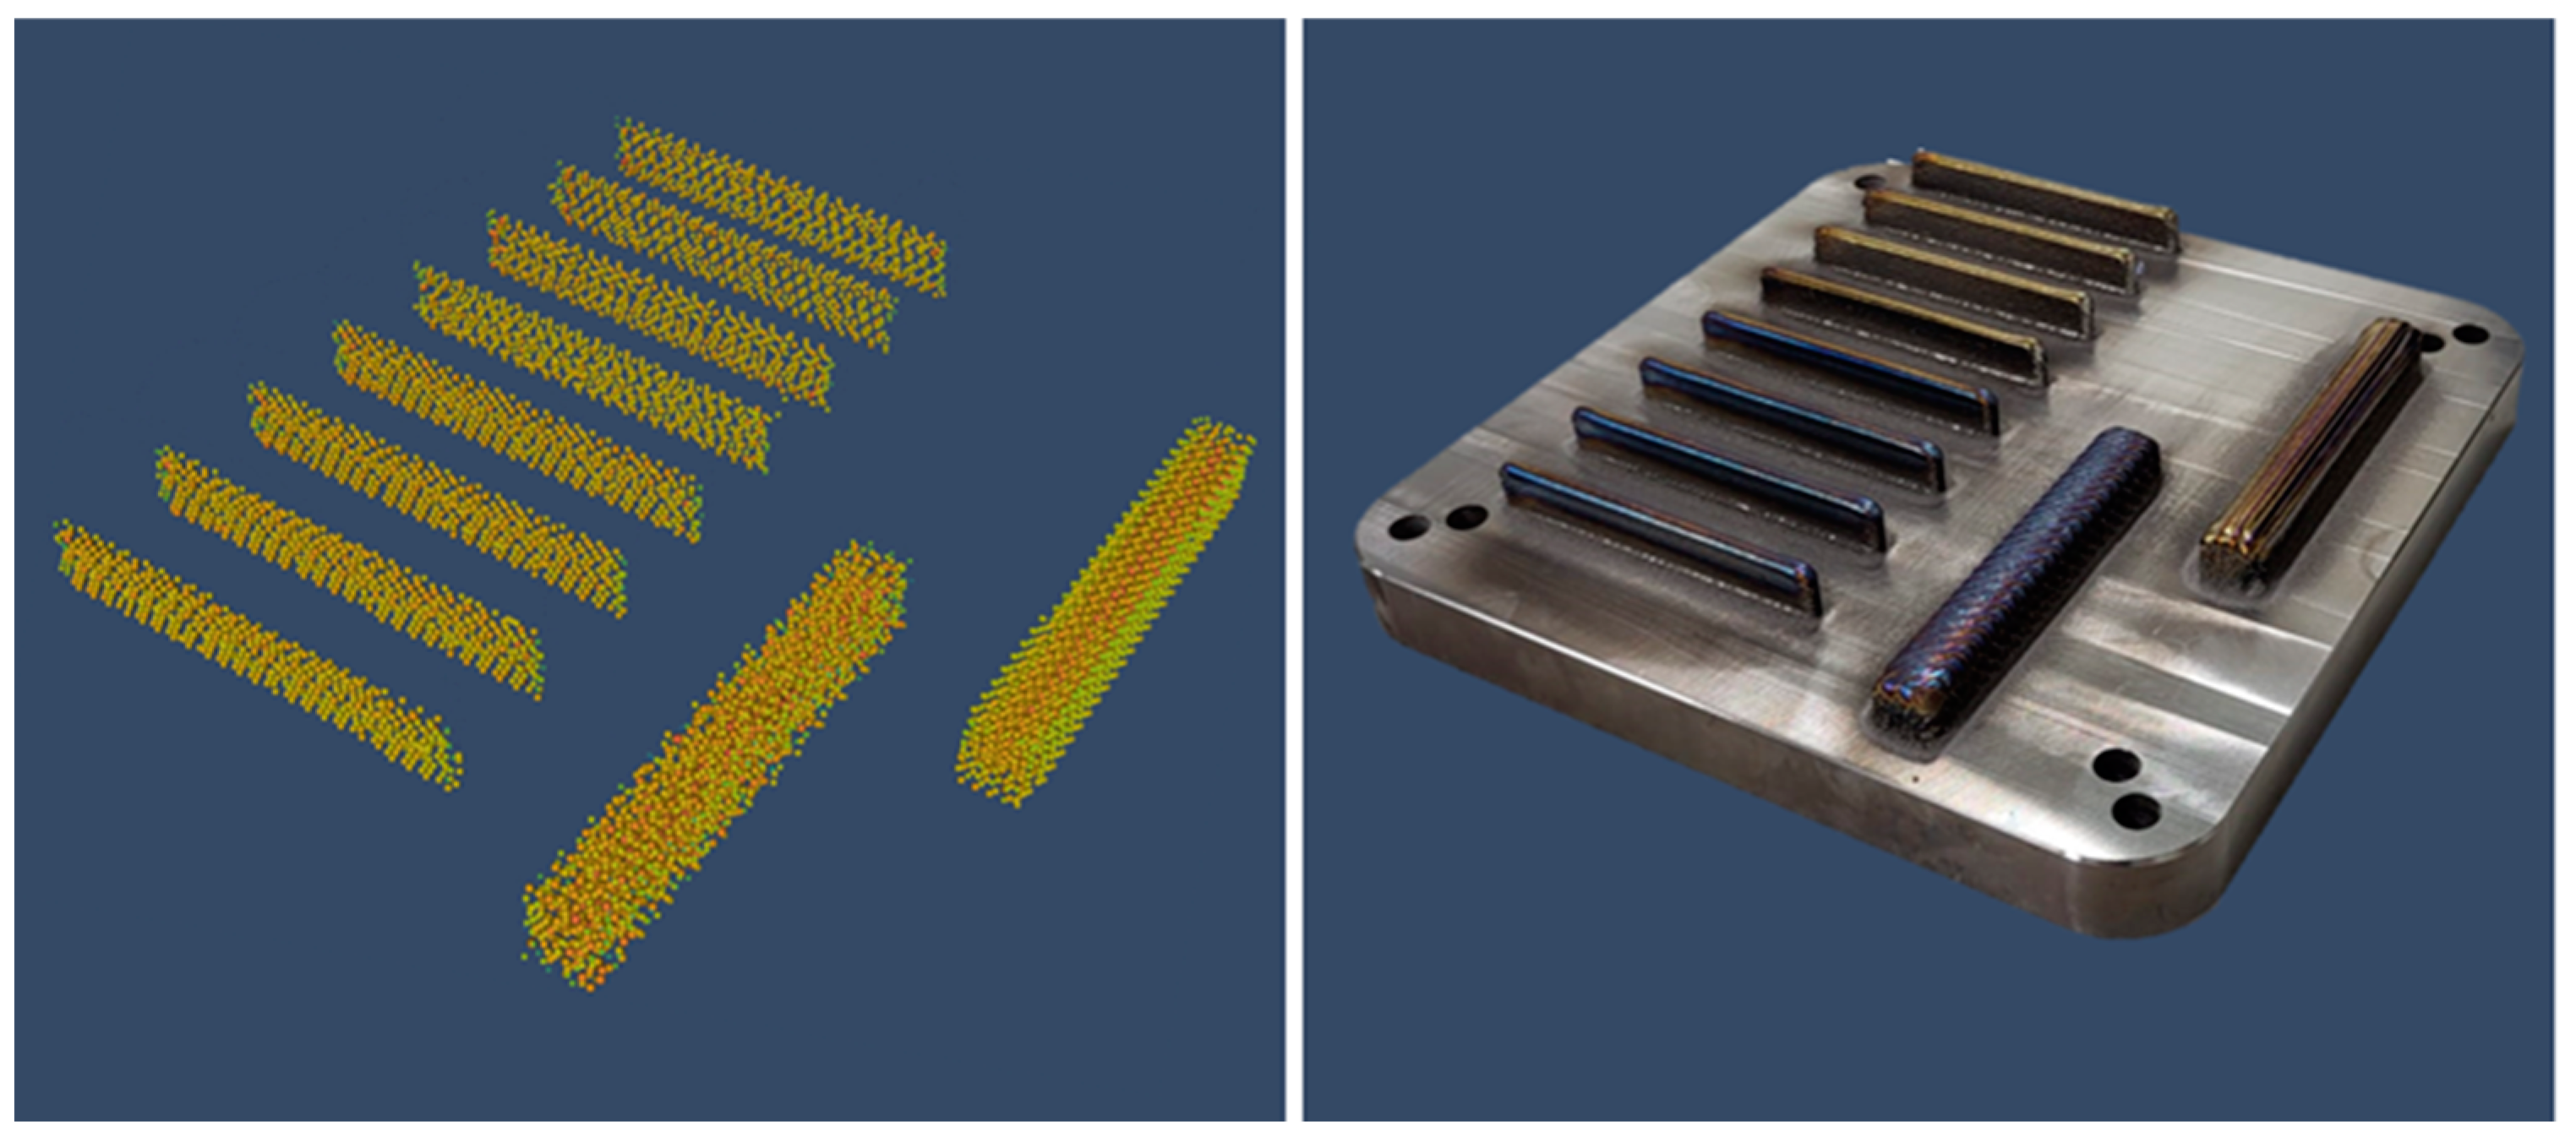
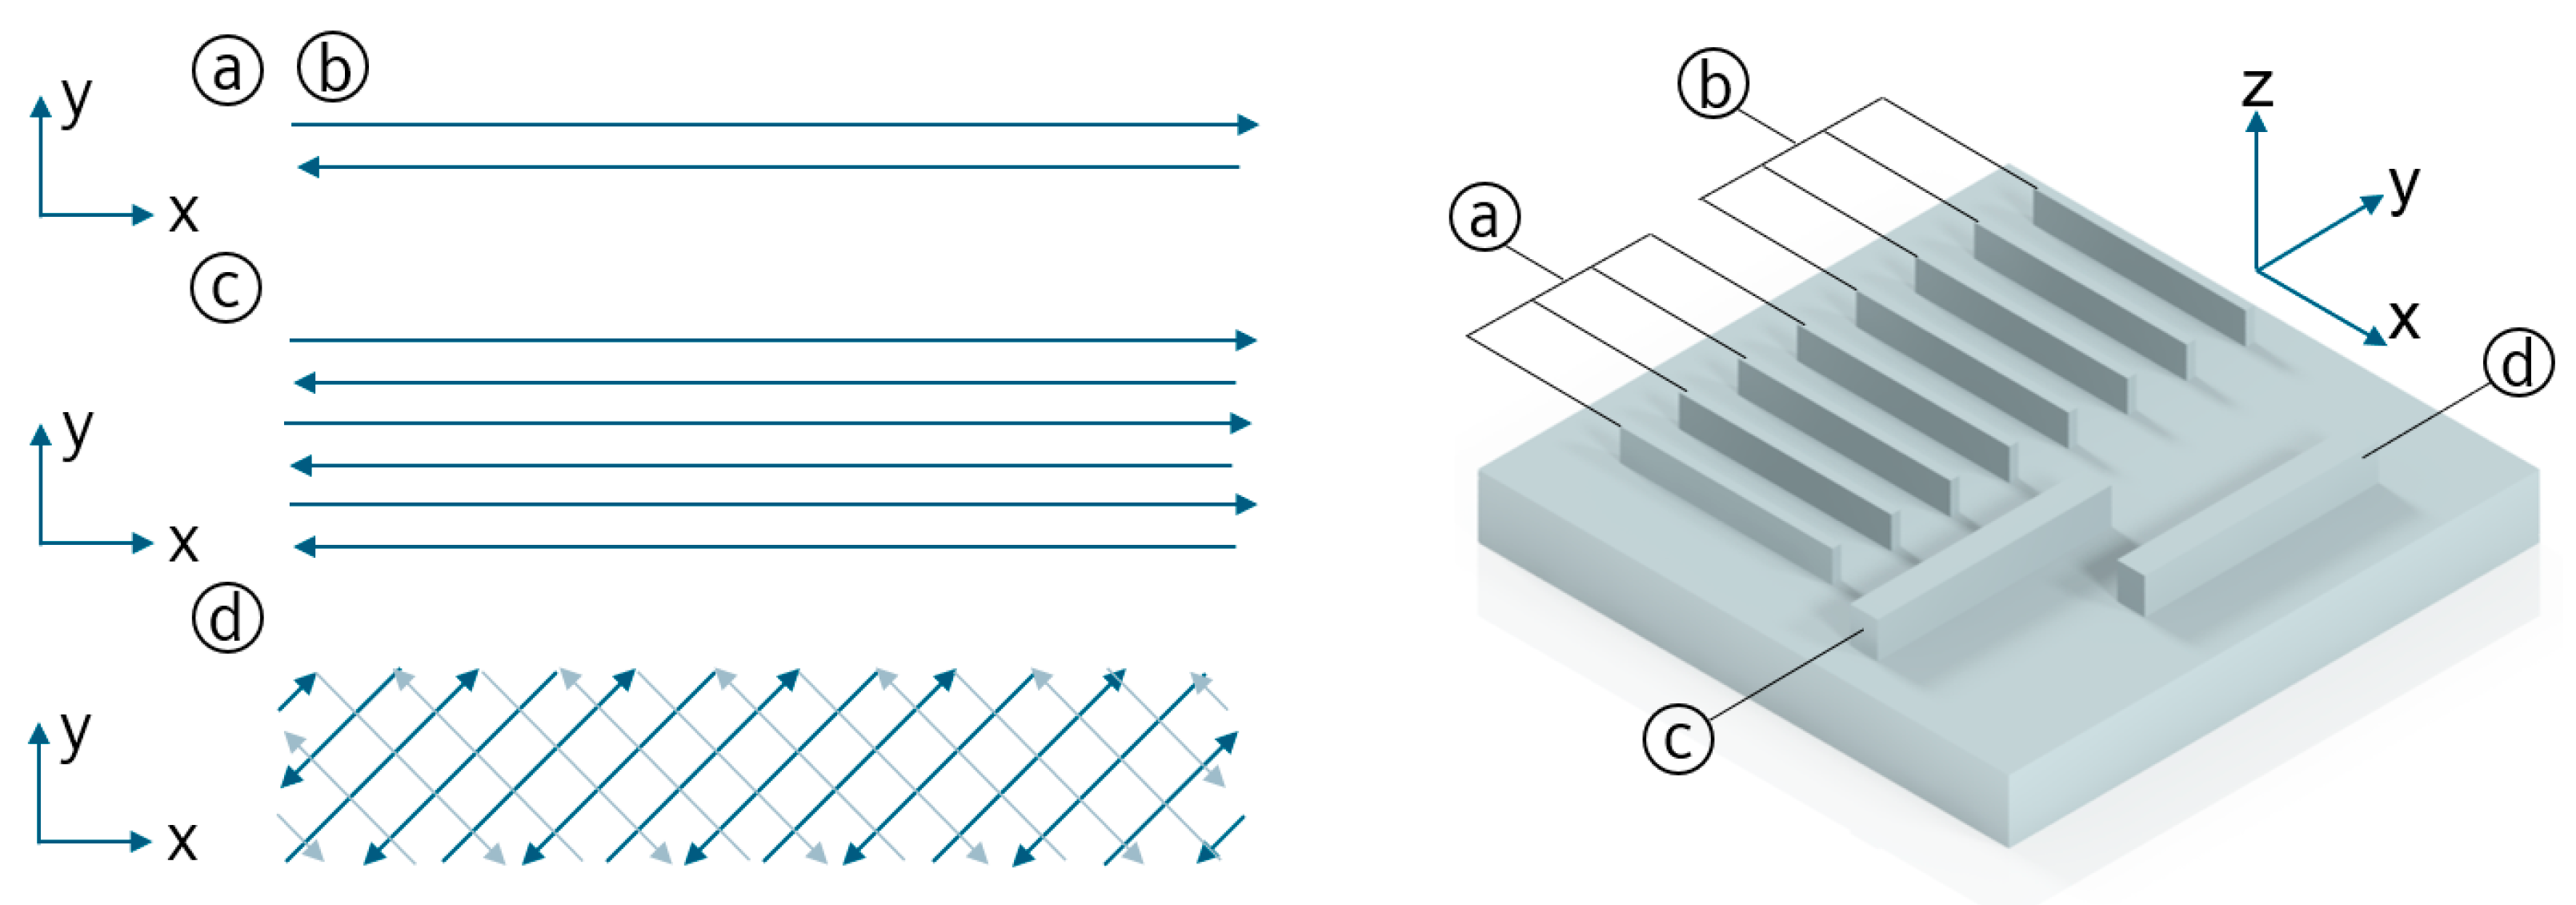
  • Ten print jobs consisting of four sub-print jobs, each representing a different build strategy, were manufactured to test the capabilities of the proposed framework.
  • For the feedstock assessment as well as the process planning stage, no anomalies were detected in the data.
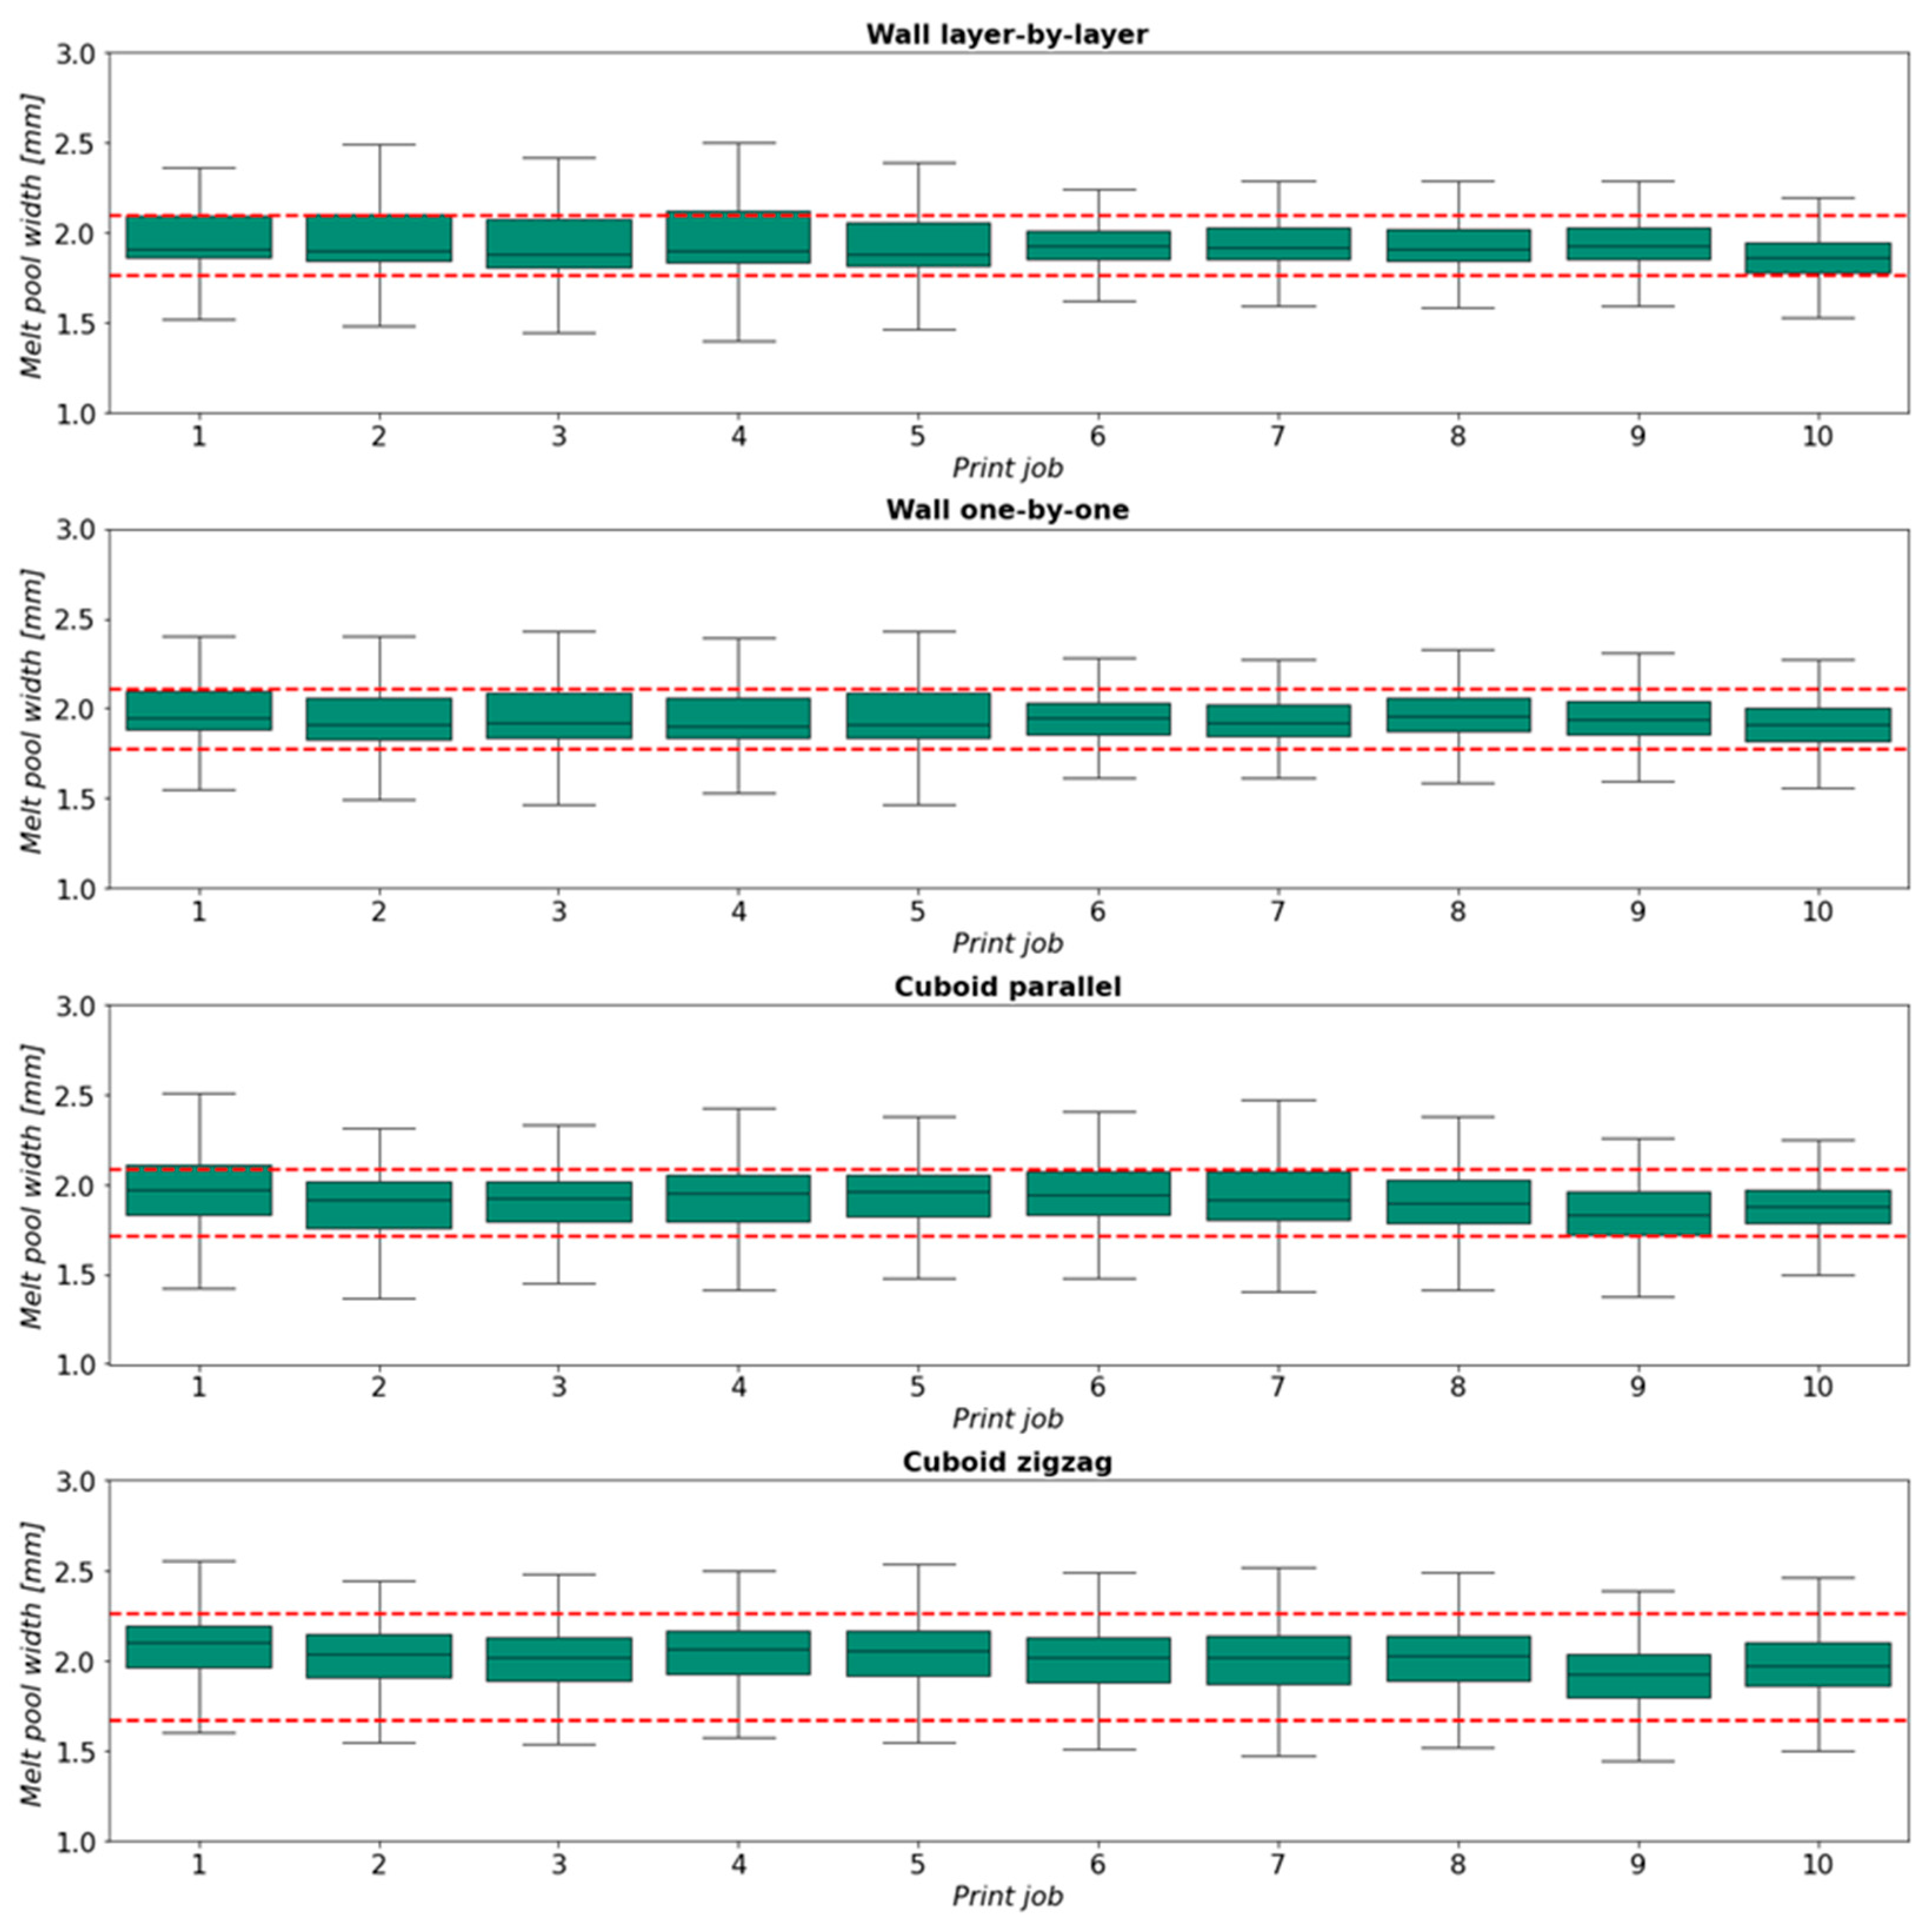
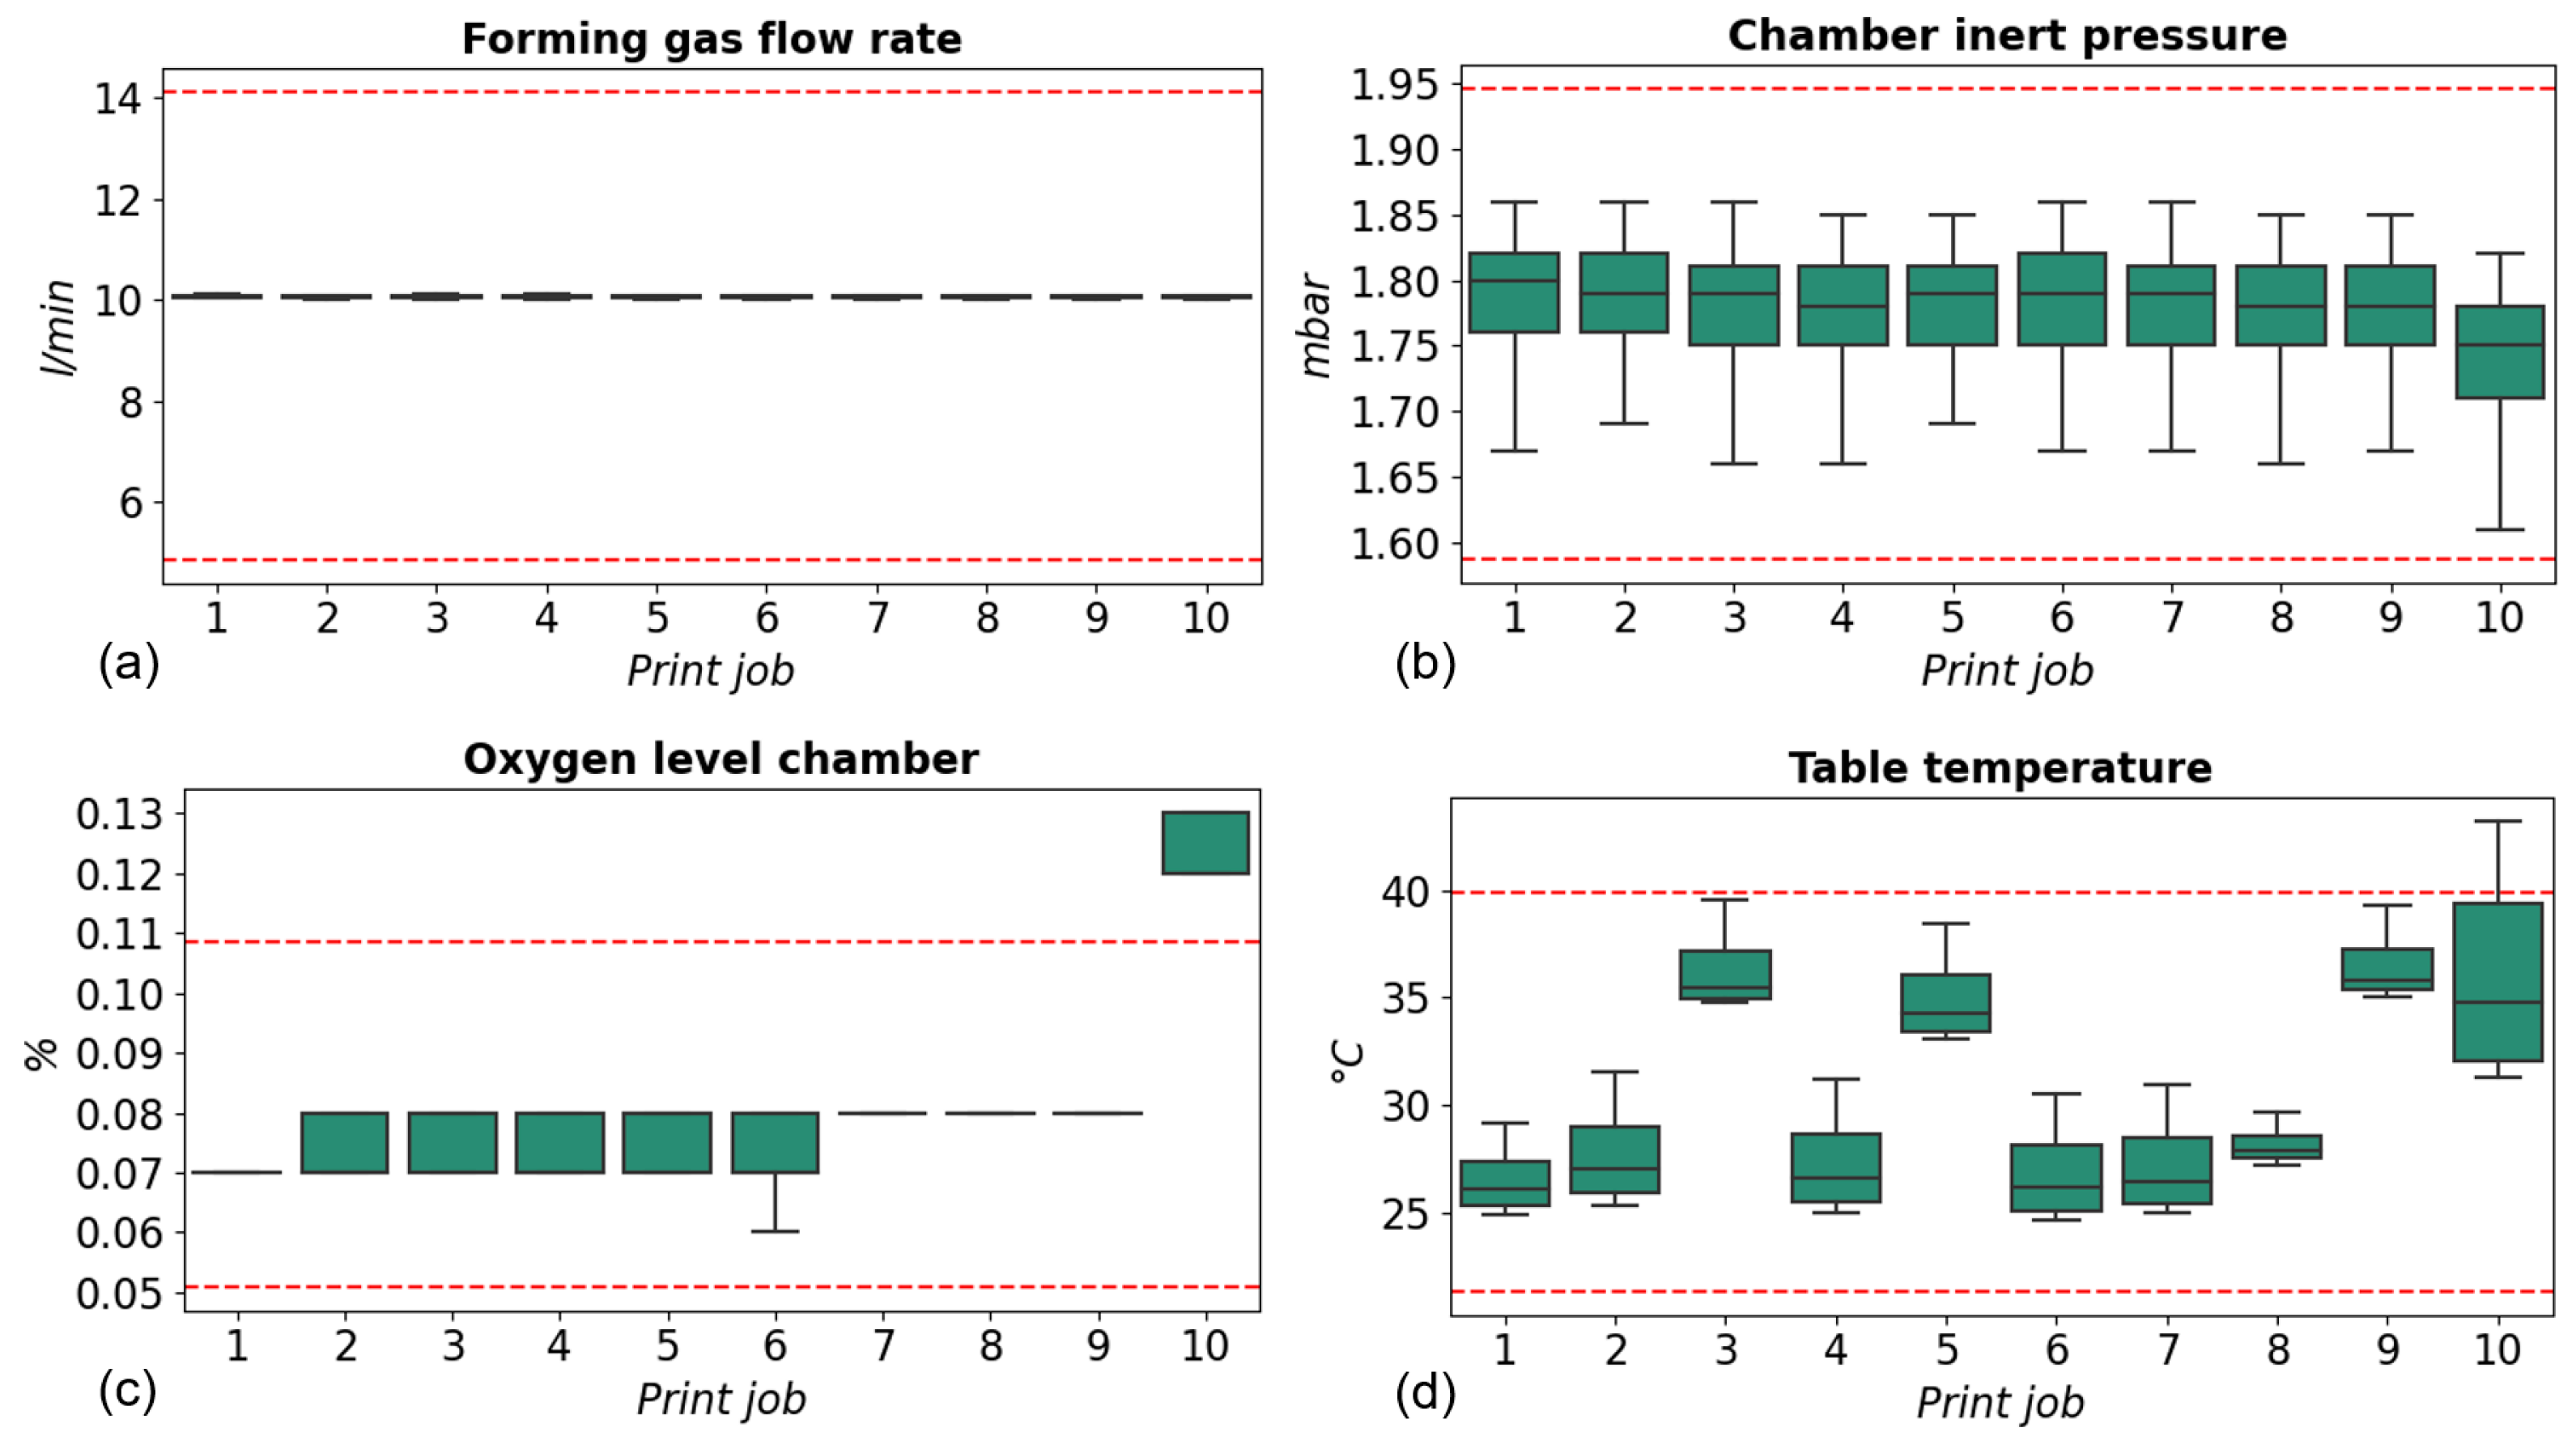
  • Considering the in situ sensor data, the proposed boundaries indicated multiple sub-print jobs as potentially anomalous.
  • The post-process data for the Young’s modulus, tensile, and yield strength exhibited no outliers, while the density tests identified anomalies in a total of 16 sub-print jobs.
  • As these 16 sub-print jobs can only be partially traced back to anomalies in the in situ sensor data, a clear need for a more sophisticated sensor setup and calibration can be derived from this study.
Future research work will subsequently be focused on a further refinement of the utilized as well as the integration of additional sensor systems. As the OCT system is already installed in the machine, this will be the first additional sensor data for consideration in future experiments. Further, the integration of a powder flow measuring system, as well as the temperature monitoring of the melt pool shall be integrated into the machine to gain even more insight into the process. The data captured by these sensors might clarify the origin of the lack of fusion observed in this study and could be used for closed-loop process control in future studies.

Author Contributions

Conceptualization: S.H. and B.V.; methodology: S.H. and B.V.; software: S.H., B.V. and N.M.; validation: S.H., B.V. and N.M.; formal analysis: S.H. and N.M.; investigation: S.H. and B.V.; resources: S.H., B.V. and I.K.; data curation: S.H., B.V. and N.M.; writing—original draft preparation: S.H.and B.V.; writing—review and editing: S.H., B.V., N.M., I.K. and P.M.; visualization: S.H. and N.M.; supervision: I.K. and P.M.; project administration: S.H. and B.V.; funding acquisition: S.H., B.V. and I.K. All authors have read and agreed to the published version of the manuscript.

Funding

This research received no external funding.

Data Availability Statement

The datasets presented in this article are not readily available because of ongoing studies. Requests to access the datasets should be directed to Sebastian Hartmann.

Acknowledgments

The authors would like to acknowledge all consortium participants of the BigDataLMD-project: AddUp; MT Aerospace AG; ArianeGroup, SAS; Safran; New Infrared Technologies, Precitec GmbH & Co. KG.

Conflicts of Interest

Author Sebastian Hartmann was employed by the company Siemens AG. The remaining authors declare that the research was conducted in the absence of any commercial or financial relationships that could be construed as a potential conflict of interest. The Siemens AG had no role in the design of the study; in the collection, analyses, or interpretation of data; in the writing of the manuscript, or in the decision to publish the results.

Appendix A

Table A1. List of machines.
Machine NameProcessUsed forCharacteristics
Pre-process feedstock assessment
Hall flowmeterFlowmeterCharacterization of bulk and tap density, powder flowrate, and Hausner ratioDensity-based on 25 cm3 of volume; powder flow–based on 50 g of powder passing defined funnel
Camsizer X2Dynamic image analysisParticle size distributionMeasures powder
from 0.8 mm to 8 mm in a dispersion
GranudrumOptical based rheometerAvalanche angle of responseRecording of images
with a 2 Hz frequency
DED-L system
Beam Modulo 400DED-LSpecimen near-net-shape
manufacturing
2 kW IPG laser source, inert gas
chamber, vibration powder feeder
Post-process machining
Nabertherm N41/hFurnaceStress release of specimensUp to 1280 °C, no
controlled atmosphere
DMU 50 ecolineMilling machineSpecimen form milling5-axis milling, up to 8000 revolutions per minute
ROBOCUT α-C600iBWire EDMFinal specimen form cuttingMinimum step size of the drives:
0.0001 mm
Post-process quality testing
ZwickRoell Z100Tensile testsMeasuring of E-Module E
the Elongation at Break A t
Tensile Strength R m , Yield Strength R p 0,2
Max. testing force 100 kN. Rapid,
static, oscillating, or alternating force application possible.
Keyence VHX-5000 Digital microscopeDetermining the porosity
and density of specimens
4 K imaging with a zoom up to 6000×
Table A2. List of machine data and sensor systems.
Sensor Name Frequency Process Parameters Source
Machine data500 HzX, Y, Z, B, C, speed, laser powerNumerical control unit
Environmental data
inside of the machine
2 HzGas flow:
Hopper speed,
Forming gas flow rate,
Central gas flow rate,
Inert gas flow rate
Pressure:
Chamber pressure,
Forming gas pressure,
Central gas pressure
Inert chamber gas properties:
Chamber oxygen level,
Chamber oxygen percentage,
Chamber humidity
Temperature:
Chamber temperature,
Table temperature
PLC
Environmental data
outside of the machine
0.3 HzVibration
Temperature
Humidity
Pressure
OPC UA
OCT sensor500 Hz read outStand-off distanceEdge IPC
Clamir camera500 Hz read outMelt pool widthEdge IPC

References

  1. Lemu, H.G. On Opportunities and Limitations of Additive Manufacturing Technology for Industry 4.0 Era. In Advanced Manufacturing and Automation VIII; Wang, K., Wang, Y., Strandhagen, J.O., Yu, T., Eds.; Lecture Notes in Electrical Engineering; Springer: Singapore, 2019; pp. 106–113. [Google Scholar] [CrossRef]
  2. Ahn, D.-G. Directed Energy Deposition (DED) Process: State of the Art. Int. J. Precis. Eng. Manuf. Technol. 2021, 8, 703–742. [Google Scholar] [CrossRef]
  3. Zhong, C.; Kittel, J.; Gasser, A.; Schleifenbaum, J.H. Study of nickel-based super-alloys Inconel 718 and Inconel 625 in high-deposition-rate laser metal deposition. Opt. Laser Technol. 2019, 109, 352–360. [Google Scholar] [CrossRef]
  4. Svetlizky, D.; Das, M.; Zheng, B.; Vyatskikh, A.L.; Bose, S.; Bandyopadhyay, A.; Schoenung, J.M.; Lavernia, E.J.; Eliaz, N. Directed energy deposition (DED) additive manufacturing: Physical characteristics, defects, challenges and applications. Mater. Today 2021, 49, 271–295. [Google Scholar] [CrossRef]
  5. Mukherjee, T.; DebRoy, T. A digital twin for rapid qualification of 3D printed metallic components. Appl. Mater. Today 2019, 14, 59–65. [Google Scholar] [CrossRef]
  6. Ertay, D.S.; Naiel, M.A.; Vlasea, M.; Fieguth, P. Process performance evaluation and classification via in-situ melt pool monitoring in directed energy deposition. CIRP J. Manuf. Sci. Technol. 2021, 35, 298–314. [Google Scholar] [CrossRef]
  7. Jardon, Z.; Ertveldt, J.; Hinderdael, M.; Guillaume, P. Process parameter study for enhancement of directed energy deposition powder efficiency based on single-track geometry evaluation. J. Laser Appl. 2021, 33, 042023. [Google Scholar] [CrossRef]
  8. DebRoy, T.; Wei, H.L.; Zuback, J.S.; Mukherjee, T.; Elmer, J.W.; Milewski, J.O.; Beese, A.M.; Wilson-Heid, A.; De, A.; Zhang, W. Additive manufacturing of metallic components–Process, structure and properties. Prog. Mater. Sci. 2018, 92, 112–224. [Google Scholar] [CrossRef]
  9. Chen, Z.; Han, C.; Gao, M.; Kandukuri, S.Y.; Zhou, K. A review on qualification and certification for metal additive manufacturing. Virtual Phys. Prototyp. 2022, 17, 382–405. [Google Scholar] [CrossRef]
  10. Everton, S.K.; Hirsch, M.; Stravroulakis, P.; Leach, R.K.; Clare, A.T. Review of in-situ process monitoring and in-situ metrology for metal additive manufacturing. Mater. Des. 2016, 95, 431–445. [Google Scholar] [CrossRef]
  11. Tang, Z.-J.; Liu, W.-W.; Wang, Y.-W.; Saleheen, K.M.; Liu, Z.-C.; Peng, S.-T.; Zhang, Z.; Zhang, H.-C. A review on in situ monitoring technology for directed energy deposition of metals. Int. J. Adv. Manuf. Technol. 2020, 108, 3437–3463. [Google Scholar] [CrossRef]
  12. Liu, W.-W.; Tang, Z.-J.; Liu, X.-Y.; Wang, H.-J.; Zhang, H.-C. A Review on In-situ Monitoring and Adaptive Control Technology for Laser Cladding Remanufacturing. Procedia CIRP 2017, 61, 235–240. [Google Scholar] [CrossRef]
  13. He, W.; Shi, W.; Li, J.; Xie, H. In-situ monitoring and deformation characterization by optical techniques; part I: Laser-aided direct metal deposition for additive manufacturing. Opt. Lasers Eng. 2019, 122, 74–88. [Google Scholar] [CrossRef]
  14. Liu, Y.; Wang, L.; Brandt, M. An accurate and real-time melt pool dimension measurement method for laser direct metal deposition. Int. J. Adv. Manuf. Technol. 2021, 114, 2421–2432. [Google Scholar] [CrossRef]
  15. Borovkov, H.; de la Yedra, A.G.; Zurutuza, X.; Angulo, X.; Alvarez, P.; Pereira, J.C.; Cortes, F. In-Line Height Measurement Technique for Directed Energy Deposition Processes. J. Manuf. Mater. Process. 2021, 5, 85. [Google Scholar] [CrossRef]
  16. Bartsch, K.; Pettke, A.; Hübert, A.; Lakämper, J.; Lange, F. On the digital twin application and the role of artificial intelligence in additive manufacturing: A systematic review. J. Physics Mater. 2021, 4, 032005. [Google Scholar] [CrossRef]
  17. Ertveldt, J.; Guillaume, P.; Helsen, J. MiCLAD as a platform for real-time monitoring and machine learning in laser metal deposition. Procedia CIRP 2020, 94, 456–461. [Google Scholar] [CrossRef]
  18. Hartmann, S.; Murua, O.; Arrizubieta, J.I.; Lamikiz, A.; Mayr, P. Digital Twin of the laser-DED process based on a multiscale approach. Simul. Model. Pract. Theory 2024, 132, 102881. [Google Scholar] [CrossRef]
  19. Reisch, R.T.; Hauser, T.; Lutz, B.; Tsakpinis, A.; Winter, D.; Kamps, T.; Knoll, A. Context awareness in process monitoring of additive manufacturing using a digital twin. Int. J. Adv. Manuf. Technol. 2022, 119, 3483–3500. [Google Scholar] [CrossRef]
  20. Chen, L.; Bi, G.; Yao, X.; Tan, C.; Su, J.; Ng, N.P.H.; Chew, Y.; Liu, K.; Moon, S.K. Multisensor fusion-based digital twin for localized quality prediction in robotic laser-directed energy deposition. Robot. Comput. Manuf. 2023, 84, 102581. [Google Scholar] [CrossRef]
  21. Yang, T.; Mazumder, S.; Jin, Y.; Squires, B.; Sofield, M.; Pantawane, M.V.; Dahotre, N.B.; Neogi, A. A Review of Diagnostics Methodologies for Metal Additive Manufacturing Processes and Products. Materials 2021, 14, 4929. [Google Scholar] [CrossRef]
  22. Khorasani, M.; Loy, J.; Ghasemi, A.H.; Sharabian, E.; Leary, M.; Mirafzal, H.; Cochrane, P.; Rolfe, B.; Gibson, I. A review of Industry 4.0 and additive manufacturing synergy. Rapid Prototyp. J. 2022, 28, 1462–1475. [Google Scholar] [CrossRef]
  23. Ashima, R.; Haleem, A.; Bahl, S.; Javaid, M.; Mahla, S.K.; Singh, S. Automation and manufacturing of smart materials in additive manufacturing technologies using Internet of Things towards the adoption of industry 4.0. Mater. Today Proc. 2021, 45, 5081–5088. [Google Scholar] [CrossRef]
  24. Židek, K.; Piteľ, J.; Adámek, M.; Lazorík, P.; Hošovský, A. Digital Twin of Experimental Smart Manufacturing Assembly System for Industry 4.0 Concept. Sustainability 2020, 12, 3658. [Google Scholar] [CrossRef]
  25. Luściński, S. Digital Twinning for Smart Industry. In Proceedings of the 3rd EAI International Conference on Management of Manufacturing Systems, Dubrovnik, Croatia, 6–8 November 2018. [Google Scholar] [CrossRef]
  26. Chen, B.; Wan, J.; Shu, L.; Li, P.; Mukherjee, M.; Yin, B. Smart Factory of Industry 4.0: Key Technologies, Application Case, and Challenges. IEEE Access 2018, 6, 6505–6519. [Google Scholar] [CrossRef]
  27. Nain, G.; Pattanaik, K.; Sharma, G. Towards edge computing in intelligent manufacturing: Past, present and future. J. Manuf. Syst. 2022, 62, 588–611. [Google Scholar] [CrossRef]
  28. Kubiak, K.; Dec, G.; Stadnicka, D. Possible Applications of Edge Computing in the Manufacturing Industry—Systematic Literature Review. Sensors 2022, 22, 2445. [Google Scholar] [CrossRef] [PubMed]
  29. Wang, Y.; Zheng, P.; Peng, T.; Yang, H.; Zou, J. Smart additive manufacturing: Current artificial intelligence-enabled methods and future perspectives. Sci. China Technol. Sci. 2020, 63, 1600–1611. [Google Scholar] [CrossRef]
  30. Guo, L.; Cheng, Y.; Zhang, Y.; Liu, Y.; Wan, C.; Liang, J. Development of Cloud-Edge Collaborative Digital Twin System for FDM Additive Manufacturing. In Proceedings of the 2021 IEEE 19th International Conference on Industrial Informatics (INDIN), Palma de Mallorca, Spain, 21–23 July 2021; pp. 1–6. [Google Scholar] [CrossRef]
  31. Demčák, J.; Lishchenko, N.; Pavlenko, I.; Pitel’, J.; Židek, K. The Experimental SMART Manufacturing System in SmartTechLab. In Advances in Manufacturing II; Trojanowska, J., Kujawińska, A., Machado, J., Pavlenko, I., Eds.; Lecture Notes in Mechanical Engineering; Springer International Publishing: Cham, Switzerland, 2022; pp. 228–238. [Google Scholar] [CrossRef]
  32. Wang, Y.; Lin, Y.; Zhong, R.Y.; Xu, X. IoT-enabled cloud-based additive manufacturing platform to support rapid product development. Int. J. Prod. Res. 2019, 57, 3975–3991. [Google Scholar] [CrossRef]
  33. Majeed, A.; Zhang, Y.; Ren, S.; Lv, J.; Peng, T.; Waqar, S.; Yin, E. A big data-driven framework for sustainable and smart additive manufacturing. Robot. Comput. Manuf. 2021, 67, 102026. [Google Scholar] [CrossRef]
  34. Jia, P.; Wang, X.; Shen, X. Digital-Twin-Enabled Intelligent Distributed Clock Synchronization in Industrial IoT Systems. IEEE Internet Things J. 2021, 8, 4548–4559. [Google Scholar] [CrossRef]
  35. Haghnegahdar, L.; Joshi, S.S.; Dahotre, N.B. From IoT-based cloud manufacturing approach to intelligent additive manufacturing: Industrial Internet of Things—An overview. Int. J. Adv. Manuf. Technol. 2022, 119, 1461–1478. [Google Scholar] [CrossRef]
  36. Liu, C.; Le Roux, L.; Körner, C.; Tabaste, O.; Lacan, F.; Bigot, S. Digital Twin-enabled Collaborative Data Management for Metal Additive Manufacturing Systems. J. Manuf. Syst. 2020, 62, 857–874. [Google Scholar] [CrossRef]
  37. Martikkala, A.; Wiikinkoski, O.; Asadi, R.; Queguineur, A.; Ylä-Autio, A.; Ituarte, I.F. Industrial IoT system for laser-wire direct energy deposition: Data collection and visualization of manufacturing process signals. IOP Conf. Series Mater. Sci. Eng. 2023, 1296, 012006. [Google Scholar] [CrossRef]
  38. DIN 13322-2:2021-12; Particle Size Analysis—Image Analysis Methods—Part 2: Dynamic Image Analysis Method. Beuth Verlag GmbH: Berlin, Germany, 2021.
  39. Saboori, A.; Gallo, D.; Biamino, S.; Fino, P.; Lombardi, M. An Overview of Additive Manufacturing of Titanium Components by Directed Energy Deposition: Microstructure and Mechanical Properties. Appl. Sci. 2017, 7, 883. [Google Scholar] [CrossRef]
  40. Addup Solutions. Modulo 400: Directed Energy Deposition. Available online: https://addupsolutions.com/wp-content/uploads/2023/09/Modulo-400-Tech-Specs-22-EN.pdf (accessed on 3 June 2024).
  41. Nabertherm GmbH. Furnaces for Fiber Optics and Glass. Available online: https://nabertherm.com/sites/default/files/2023-02/fiber_optics_glass_english_0.pdf (accessed on 3 June 2024).
  42. DIN 50125:2022-08; Testing of Metallic Materials—Tensile Test Pieces. Beuth Verlag GmbH: Berlin, Germany, 2022.
  43. ZwickRoell. Produktinformation: Material-Prüfmaschinen AllroundLine Z005 bis Z100. Available online: https://www.zwickroell.com/fileadmin/content/Files/SharePoint/user_upload/PI_DE/02_284_Material_Pruefmaschine_AllroundLine_Z005_bis_Z100_PI_DE.pdf (accessed on 3 June 2024).
  44. Möller, M.L.B. Prozessmanagement für das Laser-Pulver-Auftragschweißen, 1st ed.; Imprint: Springer Vieweg; Springer: Berlin/Heidelberg, Germany, 2021; ISBN 9783662622247. [Google Scholar]
  45. Prakash, V.J.; Möller, M.; Weber, J.; Emmelmann, C. Laser Metal Deposition of Titanium Parts with Increased Productivity. In 3D Printing and Additive Manufacturing Technologies; Kumar, L.J., Pandey, P.M., Wimpenny, D.I., Eds.; Springer: Singapore, 2019; pp. 297–311. [Google Scholar] [CrossRef]
  46. Reutzel, E.W.; Nassar, A.R. A survey of sensing and control systems for machine and process monitoring of directed-energy, metal-based additive manufacturing. Rapid Prototyp. J. 2015, 21, 159–167. [Google Scholar] [CrossRef]
  47. Precitec GmbH & Co. KG. Precitec IDM: Laser Welding—Process Monitoring. Available online: https://www.precitec.com/laser-welding/products/process-monitoring/precitec-idm/ (accessed on 3 June 2024).
  48. New Infrared Technologies, S.L. Clamir. Available online: https://www.niteurope.com/wp-content/uploads/2024/04/24-04-26_CLAMIR.pdf (accessed on 3 June 2024).
  49. Balluff Inc. Condition Monitoring Sensors. Available online: https://www.balluff.com/en-us/focus-topics/condition-monitoring (accessed on 3 June 2024).
  50. Siemens AG. Industrial Edge for Machine Tools. Available online: https://www.siemens.com/global/en/products/automation/topic-areas/industrial-edge/machine-tools.html (accessed on 3 June 2024).
  51. Liu, M.; Fang, S.; Dong, H.; Xu, C. Review of digital twin about concepts, technologies, and industrial applications. J. Manuf. Syst. 2021, 58, 346–361. [Google Scholar] [CrossRef]
  52. Kritzinger, W.; Karner, M.; Traar, G.; Henjes, J.; Sihn, W. Digital Twin in manufacturing: A categorical literature review and classification. IFAC-PapersOnLine 2018, 51, 1016–1022. [Google Scholar] [CrossRef]
  53. Huber, F. A Logical Introduction to Probability and Induction; Oxford University Press: New York, NY, USA, 2019; ISBN 9780190845384. [Google Scholar]
  54. NumFOCUS, Inc. pandas.DataFrame.std. Available online: https://pandas.pydata.org/docs/reference/api/pandas.DataFrame.std.html (accessed on 3 June 2024).
  55. Ruiz, J.E.; I Arrizubieta, J.; Vega, J.M.; Ostolaza, M.; Lamikiz, A. Study of corrosion resistance in Ti 6Al 4V additive manufactured parts. IOP Conf. Series Mater. Sci. Eng. 2021, 1193, 012039. [Google Scholar] [CrossRef]
Figure 1. BeAM Modulo 400 machine (left) with the integrated sensor systems and machine coordinate system (right).
Processes 12 01180 g001
Figure 2. Digital architecture for analyzing the DED-L process.
Processes 12 01180 g002
Figure 3. Data model of the DED-L process.
Processes 12 01180 g003
Figure 4. UI of the web application and analytics platform.
Processes 12 01180 g004
Figure 5. Digital shadow of a print job (left) next to its physical counterpart on the baseplate (right).
Processes 12 01180 g005
Figure 6. Part design with four different sub-print jobs.
Processes 12 01180 g006
Figure 7. Approach for categorizing the print jobs in acceptable (left), borderline (middle), and outlier (right) with the respective upper and lower thresholds (red dashed lines).
Processes 12 01180 g007
Figure 8. Box plots of melt pool width data for all sub-print jobs across all print jobs with the respective upper and lower thresholds (red dashed lines).
Processes 12 01180 g008
Figure 9. Exemplary sensor data for the data groups gas flow (a), pressure (b), inert chamber gas properties (c), and temperature (d) within the build chamber for the sub-print job wall layer-by-layer with the respective upper and lower thresholds (red dashed lines).
Processes 12 01180 g009
Figure 10. Data sets from vibration (a), temperature (b), humidity (c), and pressure (d) sensors outside of the machine for the sub-print job wall layer-by-layer with the respective upper and lower thresholds (red dashed lines).
Processes 12 01180 g010
Figure 11. Overview of the post-process quality results for Young’s modulus (a), tensile strength (b), yield strength (c), and density (d) with the respective upper and lower thresholds (red dashed lines).
Processes 12 01180 g011
Disclaimer/Publisher’s Note: The statements, opinions and data contained in all publications are solely those of the individual author(s) and contributor(s) and not of MDPI and/or the editor(s). MDPI and/or the editor(s) disclaim responsibility for any injury to people or property resulting from any ideas, methods, instructions or products referred to in the content.

