Article

Signal Decomposition for Monitoring Systems of Processes

1
Department of Computational Mechanics, Sumy State University, 116, Kharkivska St., 40007 Sumy, Ukraine
2
Department of Industrial Engineering and Informatics, Faculty of Manufacturing Technologies, Technical University of Košice, 1, Bayerova St., 080 01 Prešov, Slovakia
3
Department of Production Engineering, Poznan University of Technology, 5, M. Sklodowskej-Curie Sq., 60-965 Poznan, Poland
4
Department of Manufacturing Engineering, Machines and Tools, Sumy State University, 2, Rymskogo-Korsakova St., 40007 Sumy, Ukraine
5
Department of Automobile and Manufacturing Technologies, Faculty of Manufacturing Technologies, Technical University of Košice, 1, Bayerova St., 080 01 Prešov, Slovakia
*
Author to whom correspondence should be addressed.
Processes 2024, 12(6), 1188; https://doi.org/10.3390/pr12061188
Submission received: 20 May 2024 / Revised: 6 June 2024 / Accepted: 7 June 2024 / Published: 9 June 2024
(This article belongs to the Section Process Control and Monitoring)

Abstract

:
This article is devoted to the problem of signal decomposition into periodic and aperiodic components. According to the proposed approach, there is no need to evaluate the aperiodic component as a difference between the total signal of its periodic components. This research aims to create a general analytical approach that combines the Fourier and Maclaurin series methodologies into a single comprehensive series. As a result, analytical expressions for determining deposition coefficients were established for an aperiodic signal with a monoharmonic overlay. Recurrence relations were established to determine the coefficients of this series. These relations allow direct integrations of the obtained values of integrals to be avoided. The evaluated numerical values of the coefficients are also presented graphically and tabulated. It was proven that the values of these coefficients are universal numbers since they do not depend on the period/frequency of oscillations. The reliability of the proposed approach was confirmed by the fact that the evaluated coefficients are equal to the Fourier series coefficients in the case of a periodic signal. Also, for an aperiodic signal, these coefficients were reduced to the coefficients of the Maclaurin series. The usability of the proposed generalized analytical approach for signal decomposition is for control and monitoring systems of processes.

1. Introduction

The response of dynamic systems to periodic external impact is complicated in its description, especially for transient modes. In this case, identifying the parameters of signals in non-stationary processes requires periodic and aperiodic decomposition improvements. Solving this problem is more complicated with regard to studying transient processes when an aperiodic component is essential. This fact leads to both periodic and aperiodic components, the separation of which requires particular approaches. Moreover, the aperiodic component causes errors in determining the spectrum of the periodic component. Additionally, signal decomposition into periodic and aperiodic components is highly relevant for analyzing the characteristics of acoustic signals, including voices and noise.
Methods for separating the periodic and aperiodic components were successfully implemented to analyze sound signals [1,2,3], including discrete harmonic signal conversion [4]. The possibility of signal decomposition is also confirmed by the Cramer–Wold theorem [5], which allows methods to be created for vibration diagnosis in machines [6]. These methods are commonly based on statistical data processing.
Since 1988, an iterative algorithm for decomposition signals [7] has been widely used. According to this algorithm, the aperiodic component is obtained by subtracting the periodic signal from the initial one. The consequent studies in this field considered the same approach for the periodic and aperiodic decomposition of signals. However, its accuracy is inappropriate for the transient processes because the periodic component does not allow the asymptotic characteristics of the signal to be accurately determined.
The problem of signal decomposition into periodic and aperiodic components is also associated with controlling external disturbance sources. The solution to this problem also finds its application in speech synthesis, noise reduction, and information coding. Unfortunately, separating periodic and aperiodic components is usually not an easy process, since the waveform’s sinusoidal and noise-like parts are not orthogonal. Additionally, the actual signal is more complicated than the simulated one since it contains a significant noise component that requires demodulation.
However, there is no uniform approach to decompose signals during transient processes. Hence, the topic of this article is relevant. It aims to create a general analytical technique that combines the Fourier and Maclaurin series into one comprehensive series. In this case, the achievement of this goal is associated with the solution of the following objectives. First, it is necessary to establish analytical expressions to determine the aperiodic signal’s decomposition coefficients with a monoharmonic overlay. Secondly, it is essential to extend this approach to the general case of a signal containing both polyharmonic and aperiodic components. Finally, it is necessary to establish recurrence ratios to determine the coefficients of comprehensive Fourier and Maclaurin series.
The general significance of the problem In carrying out analytical and computational studies of vibrational signals in terms of the periodic/aperiodic decomposition of a signal has been substantiated in research papers worldwide. Particularly, D’Alessandro et al. [8] considered the problem of the decomposition of voice signals into periodic and aperiodic components. In this case, to generate acoustic signals with different characteristics of aperiodicity, formant synthesis methods were used. As a result, the efficiency of the periodic and aperiodic decomposition algorithm was shown in analyzing the aperiodicity characteristics for a wide range of voices. Additionally, the limitations of the considered algorithm were also indicated.
Barszcz [5] analyzed the theory of adaptive filters and investigated the possibility of decomposing vibration signals into deterministic and non-deterministic components based on the Cramer–Wold theorem [9]. As a result, non-deterministic components of the vibration signal were detected, indicating bearing support failure in the wind turbine.
Zubrycki and Petrovsky [3] proposed an approach for signal decomposition into periodic and aperiodic components based on the discrete harmonic transform [10]. As a result, the aperiodic component was determined as a difference between the original signal and the calculated periodic component. The applied transformation makes it possible to analyze the signal spectrum exclusively in the harmonic region.
Elie and Chardon [6] proposed separating periodic and aperiodic signal components based on the whitened cumulative periodogram [11] using a simple partial detector to avoid octave errors. However, the proposed approach also determined the aperiodic component by subtracting the periodic one from the analyzed signal.
Vijayan et al. [1] applied the function of time–frequency coherence to analyze the spectral-time signature signals. This approach allowed deterministic and stochastic components of a signal to be recognized. Simultaneously, the authors proposed a two-dimensional demodulation method using the Riesz transform [12]. As a result of the experimental data analysis, the proposed method’s effectiveness for determining the difference between the audio signal’s deterministic and stochastic components was confirmed to depend on the external influence’s characteristics (e.g., shimmer, jitter, and type of excitation).
Aczel and Vajk [2] proposed a way to separate signal components based on the frequency estimation method [13]. This approach was applicable for a wide frequency range. Finally, Hu et al. [14] presented an improved method for decomposing a signal into periodic and aperiodic components using the sinusoidal modeling technique. In this approach, the aperiodic part was also obtained by subtracting the reconstructed periodic component from the original signal.
The practical significance of the proposed methodology for broad areas of mathematics and engineering is proven by the importance of the following problems, which can be solved more precisely. Mainly, the polynomial decomposition of signals can be used for solving differential equations [15]. In mechanical engineering, the study of the dynamic stability of dynamic control systems is carried out using a PID controller to avoid the undesirable effect of shock on the signal level [16] and is quite topical. Additionally, the proposed methodology can supplement artificial neural networks in rotor dynamics [17] and ensure the vibration reliability of rotor systems [18].
In materials science, studying the vibrational impact on irregularities of surfaces [19] and tribologically testing impulse systems [20,21] are urgent problems. In manufacturing engineering, the problem of ensuring the vibration reliability of fixtures [22] is significant. Consequently, spectral analysis of the experimentally obtained signals is mandatory. Additionally, this problem is topical for studying the impact of vibrations in the technology of abrasive water [23,24,25] and determining optimal cutting modes of process systems with variable rigidity [26]. Finally, in chemical engineering, the approach described below can help solve the aeroelasticity problem for separation devices [27] and study the impact of superimposed vibrations on mass transfer processes [28].
The remainder of this article consists of the following sections: Materials and Methods, describing the flowchart of the proposed methodology, the monoharmonic case study, and the polyharmonic case study; Results, describing recurrence relations and examples of numerical calculations for practical application case studies (uniform translational movement with low-frequency overlay, accelerated movement, and damping movement with a higher-frequency overlay); the Discussion; and the Conclusions.

2. Materials and Methods

2.1. The Research Stages

The research methodology is based on a generalization of the Fourier and Maclaurin series into a comprehensive approach allowing for identification of the periodic and aperiodic components of signals.
The flowchart of the research methodology is presented in Figure 1.
It includes case studies of the methodology, the corresponding generalizing recurrence relations with numerical examples and practical interpretation, the verification of the reliability of the proposed approach by comparing the relative errors with the Fourier and Maclaurin series, and the analysis of the impact of the noise factor on the disturbances in the evaluation results.

2.2. The Monoharmonic Case Study

First, the studied function f(t) is considered an approximation by a combination of the Maclaurin power series [29] and the monoharmonic function:
f t = k = 1 n c k t k + a 0 + a 1 sin ω t + b 1 cos ω t .
It contains (n + 3) unknown parameters a0, a1, b1, and ck (k = 1, 2, …, n).
By integrating this series concerning time t within the entire period T = 2π/ω (ω is the frequency), the following integral can be obtained:
I 0 = 0 T f t d t = k = 1 n c k T k + 1 k + 1 + a 0 T .
Similarly, the following two integrals can be found:
I s 1 = 0 T f t s i n ( ω t ) d t = k = 1 n c k T k + 1 i s k + a 1 T 2 ; I c 1 = 0 T f t c o s ( ω t ) d t = k = 1 n c k T k + 1 i c k + b 1 T 2 ,
which contain the following coefficients:
i s k = 1 T k + 1 0 T t k sin ω t d t ;   i c k = 1 T k + 1 0 T t k cos ω t d t .
Notably, the signs “−” and “+” in these formulas are chosen for the convenience of further representation of the recurrence relations presented below. It is also proven that these integrals do not depend on the parameters T and ω.
The system of Equations (2) and (3) allows the values of unknown coefficients of the periodic component of the series (1) to be obtained:
a 0 = 1 T I 0 k = 1 n c k T k + 1 k + 1 ;   a 1 = 2 T I s 1 + k = 1 n c k T k + 1 i s k ; b 1 = 2 T I c 1 k = 1 n c k T k + 1 i c k .
The resulting expression differs from the coefficients of the Fourier transform [30] and the additional components ckTkisk and ckTkick associated with the overlay on the signal of the aperiodic component.
Like expression (2), a more general integral can be obtained:
I m = 0 T t m f t d t = k = 1 n c k T k + m + 1 k + m + 1 + a 0 T m + 1 m + 1 a 1 T m + 1 i s m + b 1 T m + 1 i c m .
Considering expression (5), it takes the following form:
I m = I 0 T m m + 1 2 T m T s 1 i s m I c 1 i c m + k + 1 n c k T k + m + 1 1 k + m + 1 1 k + 1 m + 1 2 i s k i s m i c k i c m .
The last expression can be rewritten in matrix form:
A C = B ,
where [A] is the stiffness matrix, the elements of which are determined by the following formula:
a m , k = j m , k 2 i s k i s m + i c k i c m T k + m + 1 ,
which contains elements jm,k of the auxiliary symmetric matrix [J]:
j m , k = k m k + 1 m + 1 k + m + 1 .
Equation (8) also contains a column-vector of external action {B}, the elements of which are determined as follows:
b m = I m I 0 m + 1 2 I s 1 i s m I c 1 i c m T m .
The column-vector {C} of the unknown coefficients cm is determined from Equation (8) using the inverse matrix:
C = A 1 B .

2.3. The Polyharmonic Case Study

The decomposition method mentioned above can be extended to the general case of the signal as a combination of power and polyharmonic series:
f t = k = 1 n c k t k + a 0 + p = 1 N a p sin p ω t + p = 1 N b p cos p ω t ,
where the following (n + 2p + 1) parameters can be evaluated: a0, ap, bp (p = 1, 2, …, N), and ck (k = 1, 2, …, n).
Like the formulas in (5), the following values of the coefficients can be obtained:
a 0 = 1 T I 0 k = 1 n c k T k + 1 k + 1 ;   a p = 2 T I s p + k = 1 n c k T k + 1 i s k p ; b p = 2 T I c p + k = 1 n c k T k + 1 i c k p .
Integrals in these expressions are determined by formulas like (3):
I s p = 0 T f t s i n ( p ω t ) d t = k = 1 n c k T k + 1 i s k p + a p T 2 ; I c p = 0 T f t c o s ( p ω t ) d t = k = 1 n c k T k + 1 i c k p + b p T 2 .
In these expressions, the following coefficients are introduced:
i s k p = 1 T k + 1 0 T t k sin p ω t d t ;   i c k p = 1 T k + 1 0 T t k cos p ω t d t .
After identical transformations, integral (6) takes the following general form:
I m = k = 1 n c k T k + m + 1 k + m + 1 + a 0 T m + 1 m + 1 p = 1 N a p T m + 1 i s m p + p = 1 N b p T m + 1 i c m p .
Notably, in the case of an aperiodic signal, the coefficients (14) of the decomposition to a comprehensive series (13) are reduced to the coefficients of the Maclaurin power series. In the absence of an aperiodic component, the same coefficients coincide with the Fourier trigonometric series’ coefficients, particularly a0 = I0/T, ap = 2Isp/T, and bp = 2Icp/T.
In the decomposition (13), the column-vector {C} of unknown coefficients cm is also determined from Equation (8) using formula (12). In this case, the elements of the stiffness matrix [A] and column-vector {B} are like expressions (9) and (11), respectively:
a m , k = j m , k 2 p = 1 N i s k p i s m p + i c k p i c m p T k + m + 1 ;
b m = I m I 0 m + 1 2 p = 1 N I s p i s m p I c p i c m p T m .
It can be proven that the values of i s k p and i c k p do not depend on the period T or the frequency ω. In this regard, they are universal numbers, which, in contrast to expressions (4) and (16), can be defined as follows:
i s k p = 1 p k + 1 0 p t k sin 2 π t d t ;   i c k p = 1 p k + 1 0 p t k cos 2 π t d t .
Considering any positive integer p, the general expression of the first coefficient of formula (16) by changing the integration variable is
p t T = θ ; t = T p θ ;   t k = T k p k θ k ; d t = T p d θ ; t = 0 : θ = 0 ; t = 1 : θ = p ; p ω t = p 2 π T T p θ = 2 π θ ,
and the following simplifications can be obtained:
i s k p = 0 p θ p k sin 2 π θ p   d θ = 1 p k + 1 0 p θ k sin 2 π θ   d θ ; i c k p = 0 p θ p k cos 2 π θ p   d θ = 1 p k + 1 0 p θ k cos 2 π θ   d θ .
Thus, the simplified expressions (20) are proven.

3. Results

3.1. Recurrence Relations

The general formulas in the proposed research methodology contain parameters evaluated by expression (20). However, it is possible to obtain recurrence dependencies to avoid integrating procedures in evaluating these coefficients. In this case, using the method of integration by parts,
u = t k ; d v = sin 2 π t d t ; d w = cos 2 π t d t ; d u = k t k 1 ; v = 1 2 π cos 2 π t ; w = 1 2 π sin 2 π t
This makes it possible to obtain the following recurrence formulas, which allow both integrals (20) to be determined sequentially, starting from p = 1, without the use of direct integration:
i s k + 1 p = 1 2 π p 1 k i c k p ;   i c k + 1 p = k 2 π p i s k p .

3.2. Numerical Calculation of Integrals

Given the peculiarities of the integration of even and odd periodic functions, the initial values i(p)sk and i(p)ck (20) of recurrence relations (24) are as follows:
i s 1 p = 1 p 2 0 p t sin 2 π t d t = 1 2 π p ;   i c 1 p = 1 p 2 0 p t cos 2 π t d t = 0 .
Finally, a set of values of integrals can be obtained analytically using (24) and (25):
i s 1 p = 1 2 π p ;   i c 1 p = 0 ; i s 2 p = 1 2 π p 1 2 · 0 = 1 2 π p ;   i c 2 p = 2 2 π p · 1 2 π p = 1 2 π 2 p 2 ; i s 3 p = 1 2 π p 1 3 · 1 2 π 2 p 2 = 2 π 2 p 2 3 4 π 3 p 3 ;   i c 3 p = 3 2 π p · 1 2 π p = 3 4 π 2 p 2 ; i s 4 p = 1 2 π p 1 4 · 3 4 π 2 p 2 = π 2 p 2 3 2 π 3 p 3 ;   i c 4 p = 4 2 π p · 2 π 2 p 2 3 4 π 3 p 3 = 2 π 2 p 2 3 2 π 4 p 4 ;
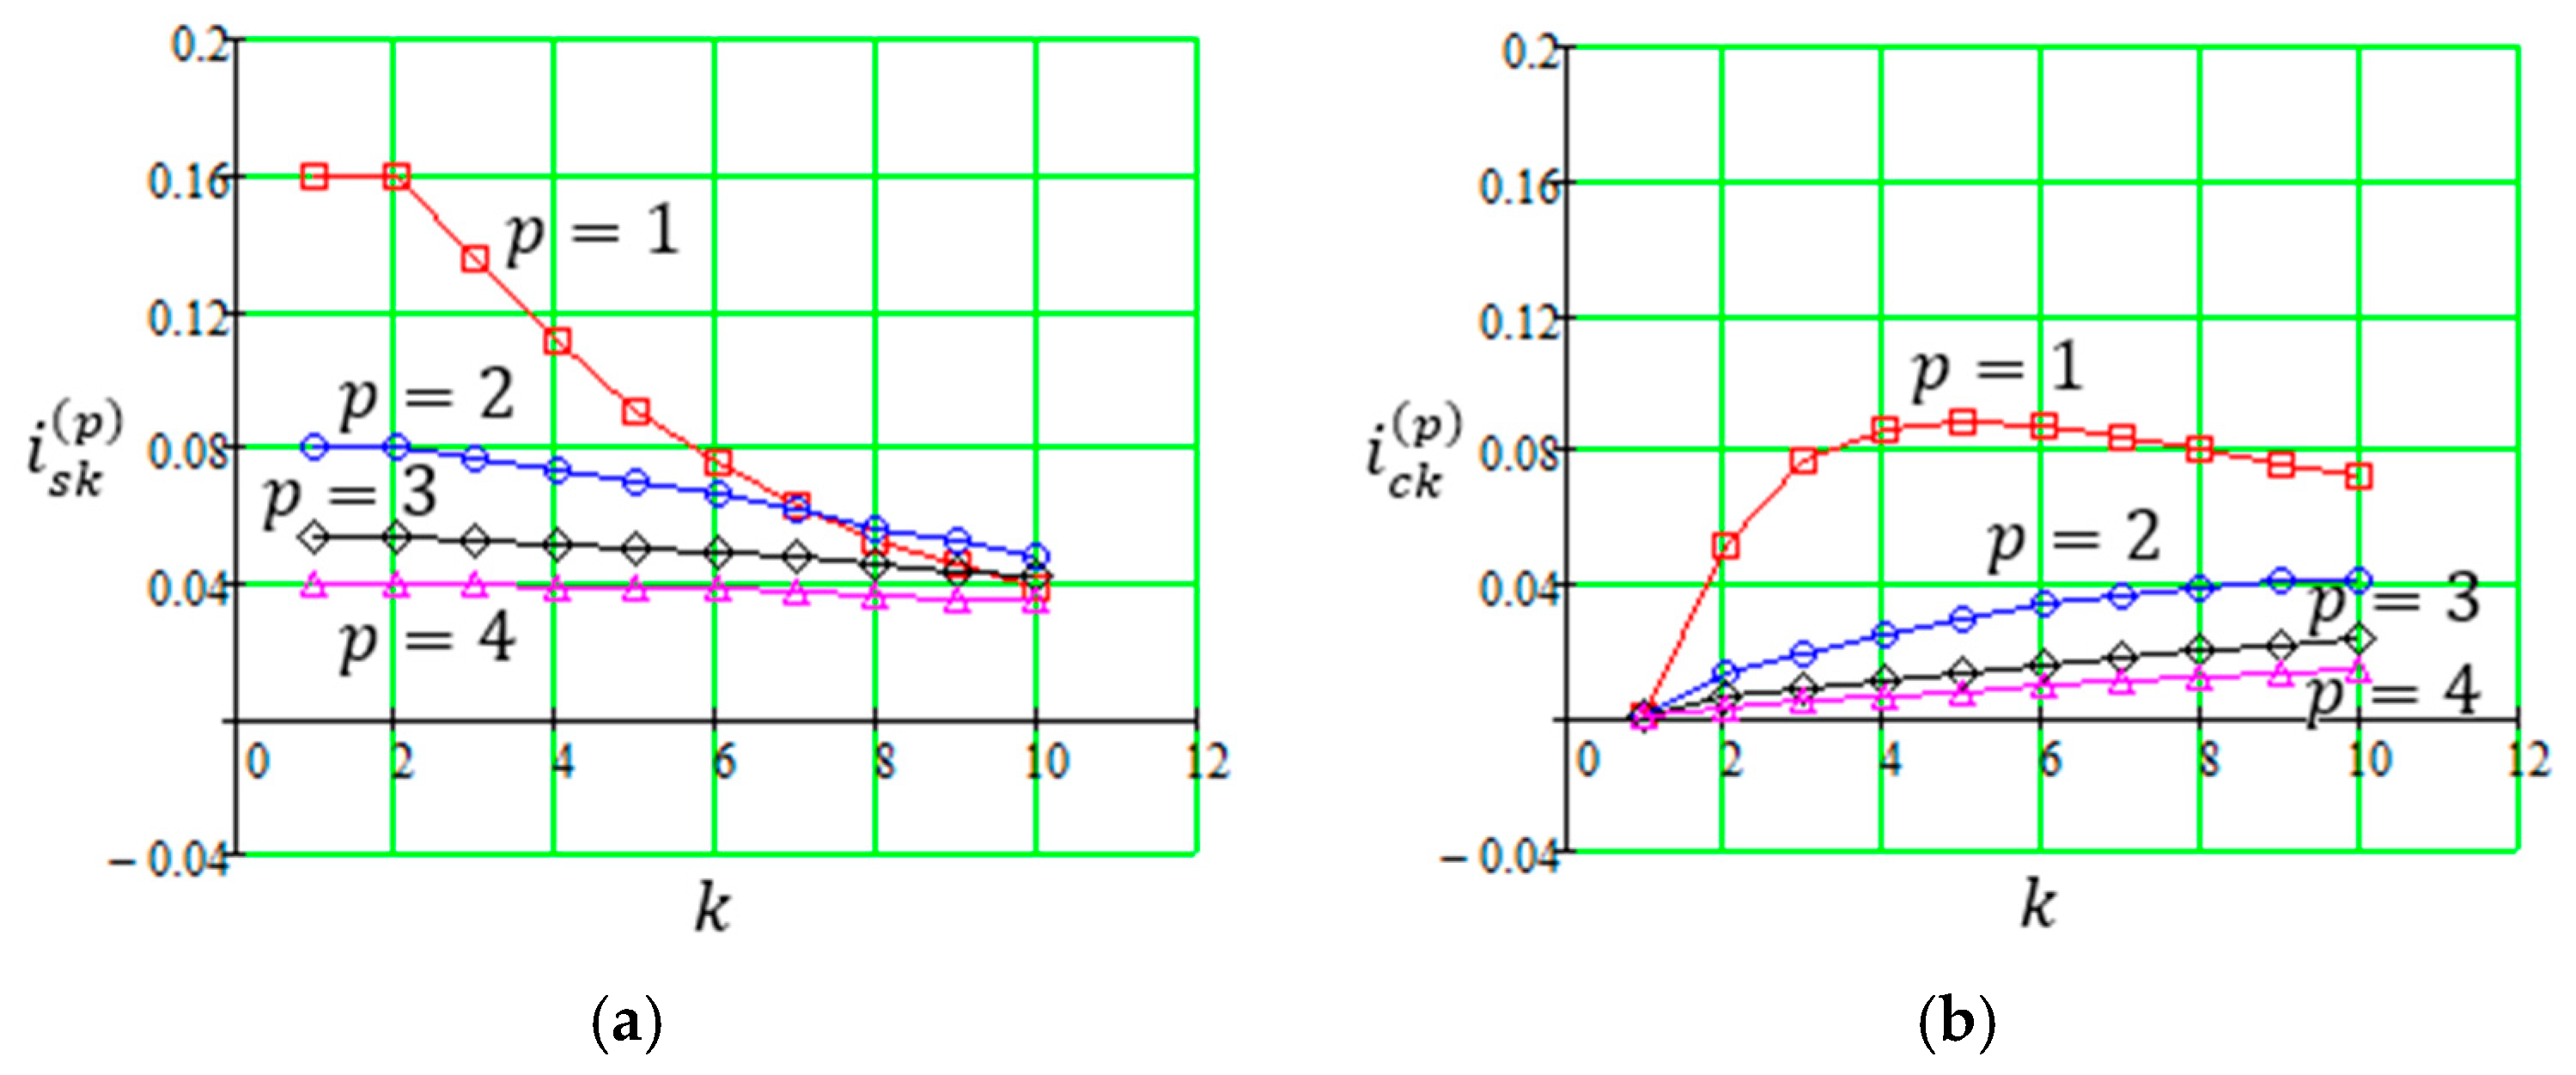
The obtained values are represented graphically in Figure 2. Notably, the graphical representation and numerical values of the auxiliary integrals indicate that while index p is increasing, the impact of parameters i(p)sk and i(p)ck is decreasing in the representation of the total signal by the series (14). This fact allows the number of components in this series to be limited.
The numerical values of integrals (20), determined by the recurrence relations (24), are tabulated by the sequence of values (25) and (26) and reduced to Table 1 and Table 2.
It should be noted that the signal’s periodic and aperiodic components are determined simultaneously based on the decomposition into power and polyharmonic series described by Equation (13).
In the total number of (n + 2p + 1), the coefficients of this equation are determined by formula (14), which contains auxiliary integrals. The last ones are determined by the recurrence relations (24) and acquire the values given in formula (26) and are tabulated in Table 1 and Table 2.

3.3. Examples of Numerical Calculations

For a practical demonstration of the proposed approach, the following three numerical calculation examples are carried out in order of theoretical and approximating curve complexity. These examples allow for evaluating parameters of the actuators at the laboratory “SmartTechLab” of the Department of Industrial Engineering and Informatics of the Faculty of Manufacturing Technologies with a seat in Presov at Technical University of Kosice (Presov, Slovak Republic).
As the first example, the following uniform translational movement of the actuator with a velocity of v0 = 0.08 m/s and a superimposed low-frequency overlay with an amplitude of A = 0.14 m and a period of T0 = 2.3 s is considered:
f t = a 0 + v 0 t + a 1 sin ω t + b 1 cos ω t .
The numerical calculations accurate to the third decimal place are as follows: frequency—ω = 2π/T = 2.732 (rad/s); integral (2)—I0 = 0.097; integral (6)—I1 = 0.091; integrals (3)—Is1 = 0.071, Ic1 = −0.081.
As a result, the coefficients in (14) are as follows: a0 = −0.05, a1 = 0.12, and b1 = −0.07. Coefficient (12) is as follows:
c 1 = I 1 I 0 2 I s π T 1 12 1 2 π 2 T 3 ,
or numerically, c1 = 0.081, which corresponds to the value of the above-mentioned velocity v0 = 0.08 m/s with the maximum relative error not exceeding 1.3%.
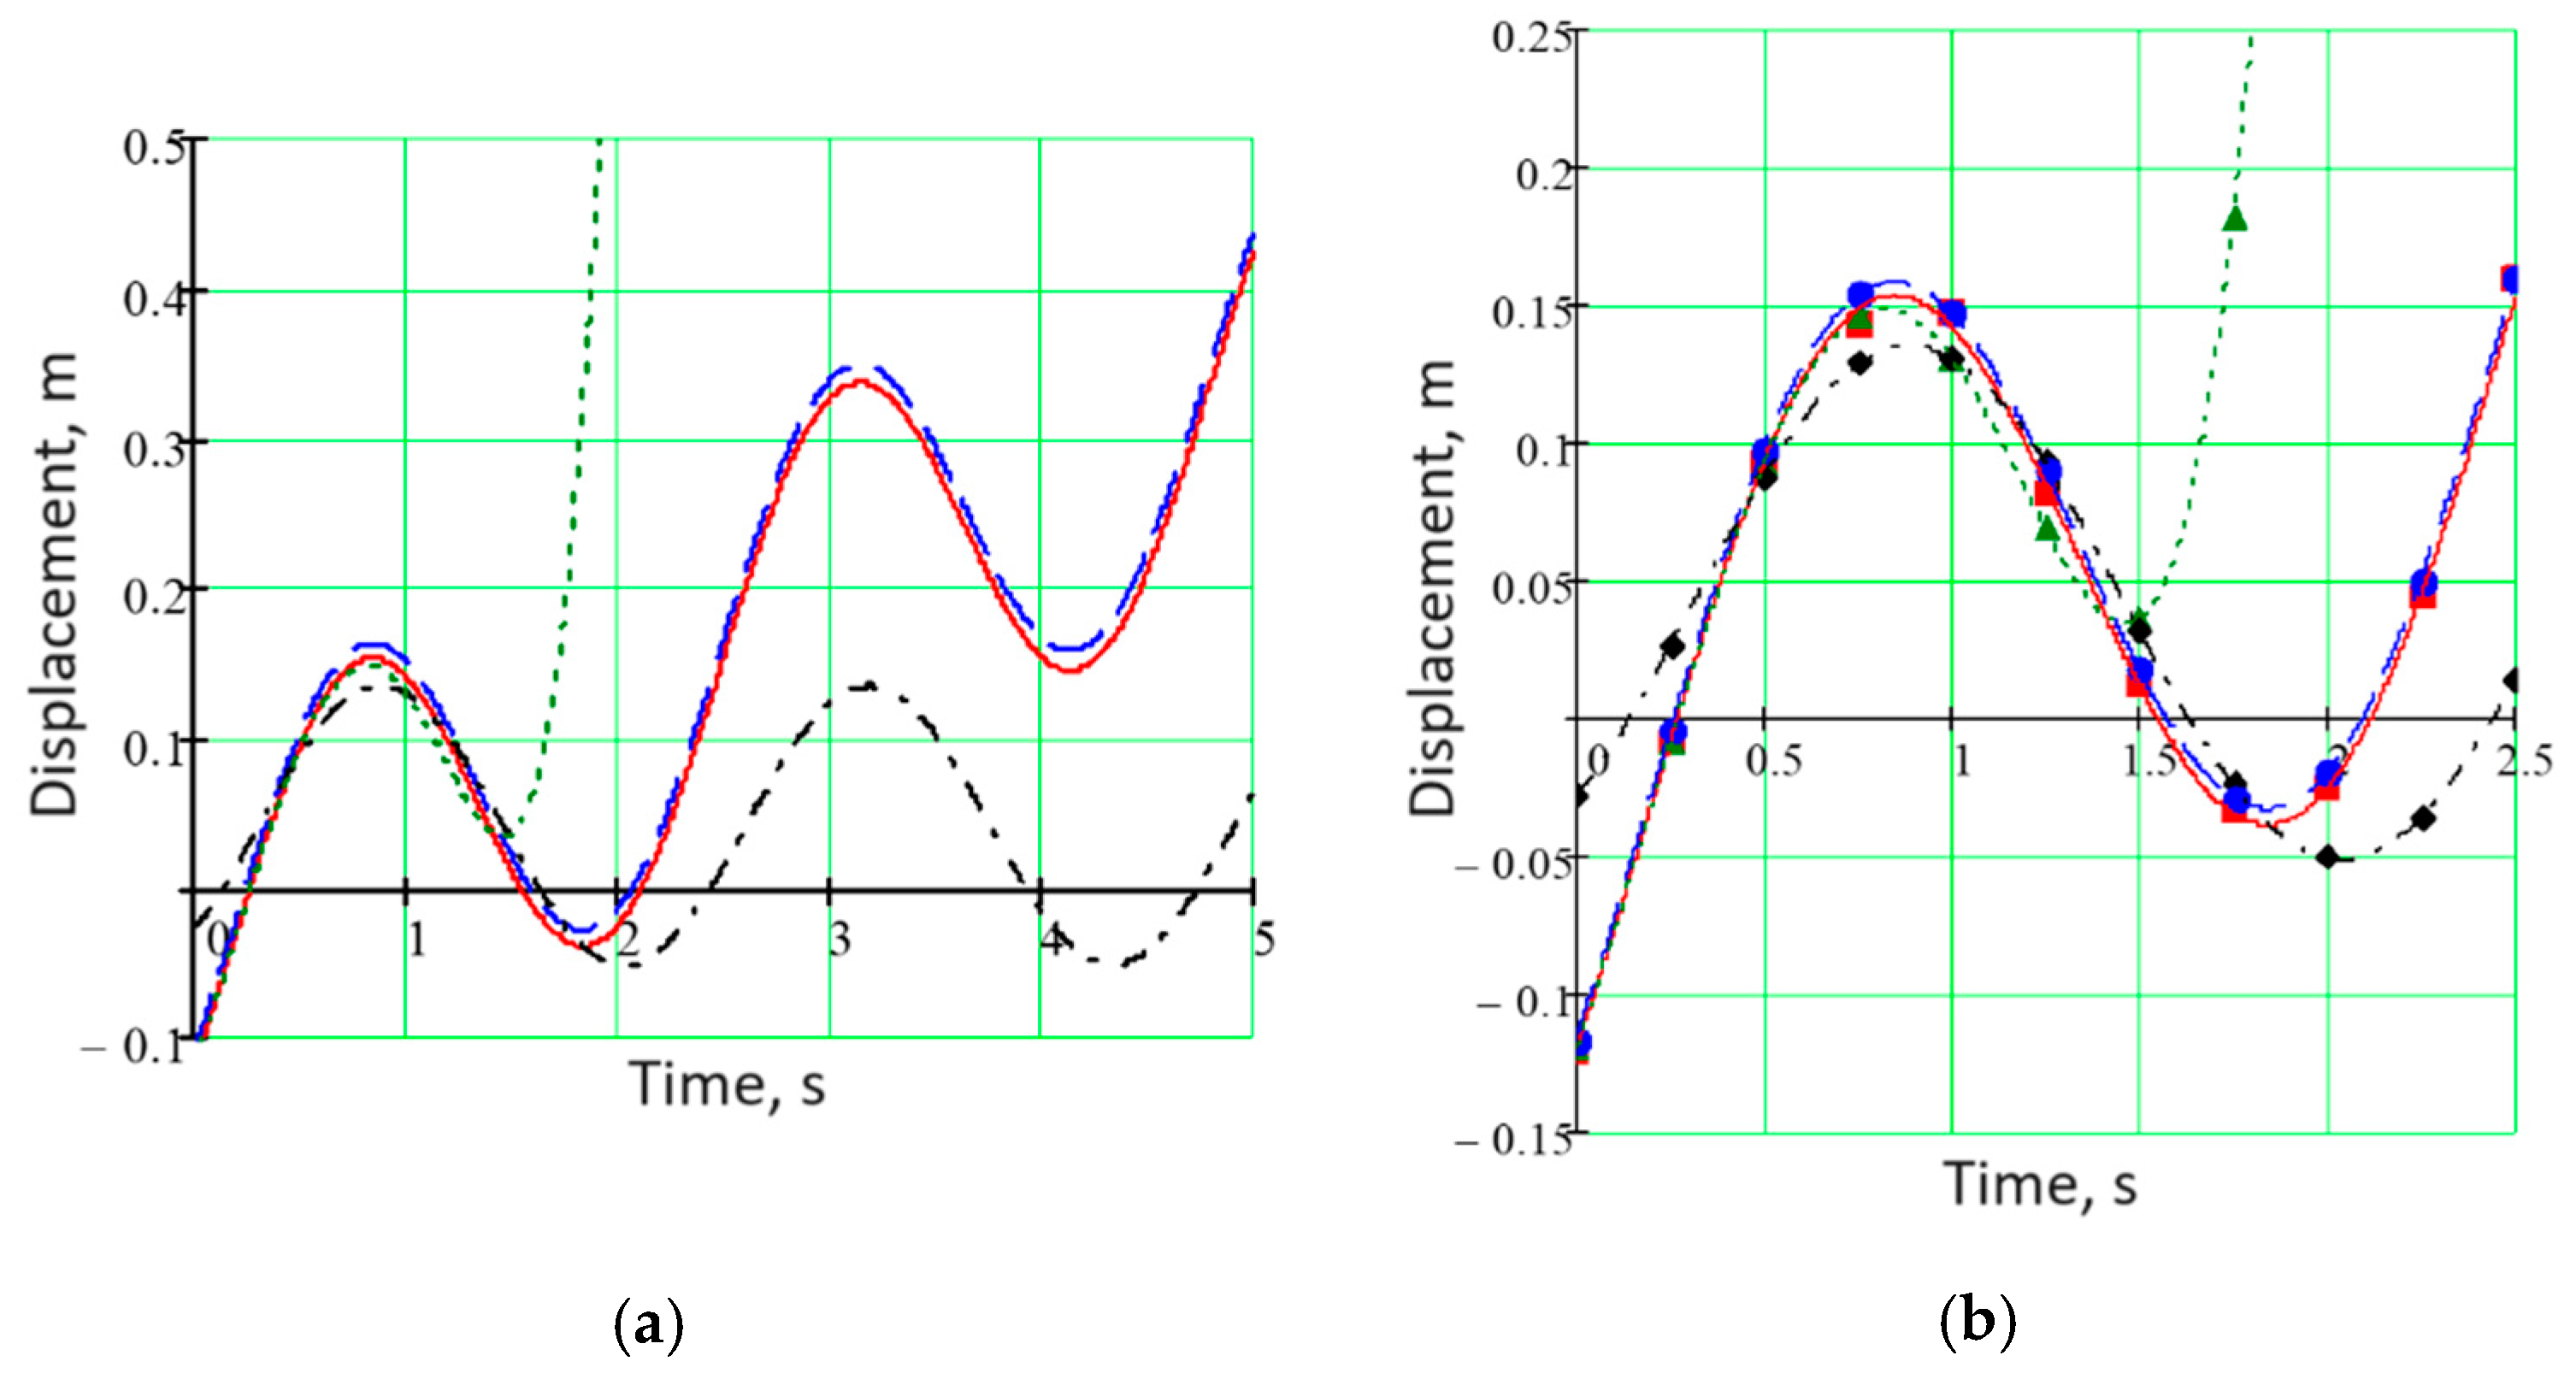
Figure 3 presents the signal with a low-frequency overlay with a frequency of ω = 2π/T0 = 2.732 (rad/s) and its decomposition.
However, according to the traditional Fourier approach, the approximating curve does not allow for reflecting the translational movement component (Figure 3a, black dash-dotted line). Also, the traditional Maclaurin series, even for the fifth-order case study (Figure 3a, green dotted line), allows satisfying results to be obtained for an initial time less than 0.65T = 1.5 (s).
For this case study, the actual and estimated data for an initial time up to 2.5 s with a time step of 0.25 s are summarized in Table 3 and shown in Figure 3b.
Notably, for the full time range, the relative error for the proposed approach does not exceed 3.9%, whereas only initial data (marked in green in Table 3) are acceptable for both the Fourier and the Maclaurin series. For the disturbances/noise of the initial data in a range of ±5%, only a single point at 2.5 s leads to a relatively high error of 13.8% (yellow cell in the last column in Table 3).
As the second example, the non-uniform movement with a zero-value initial velocity v0 = 0, an acceleration of w0 = 0.1 m/s2, and the same overlay is considered:
f t = a 0 + v 0 t + w 0 t 2 2 + a 1 sin ω t + b 1 cos ω t .
The approximating curve (1) was also proposed with the number of aperiodic terms n = 2.
As a result, the following parameters were evaluated: I0 = 0.203, I1 = 0.249, and I2 = 0.368; Is1 = 0.041 and Ic1 = −0.050. Parameter a0 = −3.62 × 10⁻¹⁵ corresponds to a zero-value initial displacement. Parameters a1 = −0.12 and b1 = −0.07. Therefore, the value a 1 2 + b 1 2 = 0.139 (m) corresponds to the above-mentioned magnitude A = 0.14 m with a relative error no more than 0.8 %. Also, c1 = 8.882 × 10⁻¹⁵ corresponds to the zero-value initial velocity v0 = 0, and c2 = 0.05 completely corresponds to half of the acceleration (c2 = w0/2).
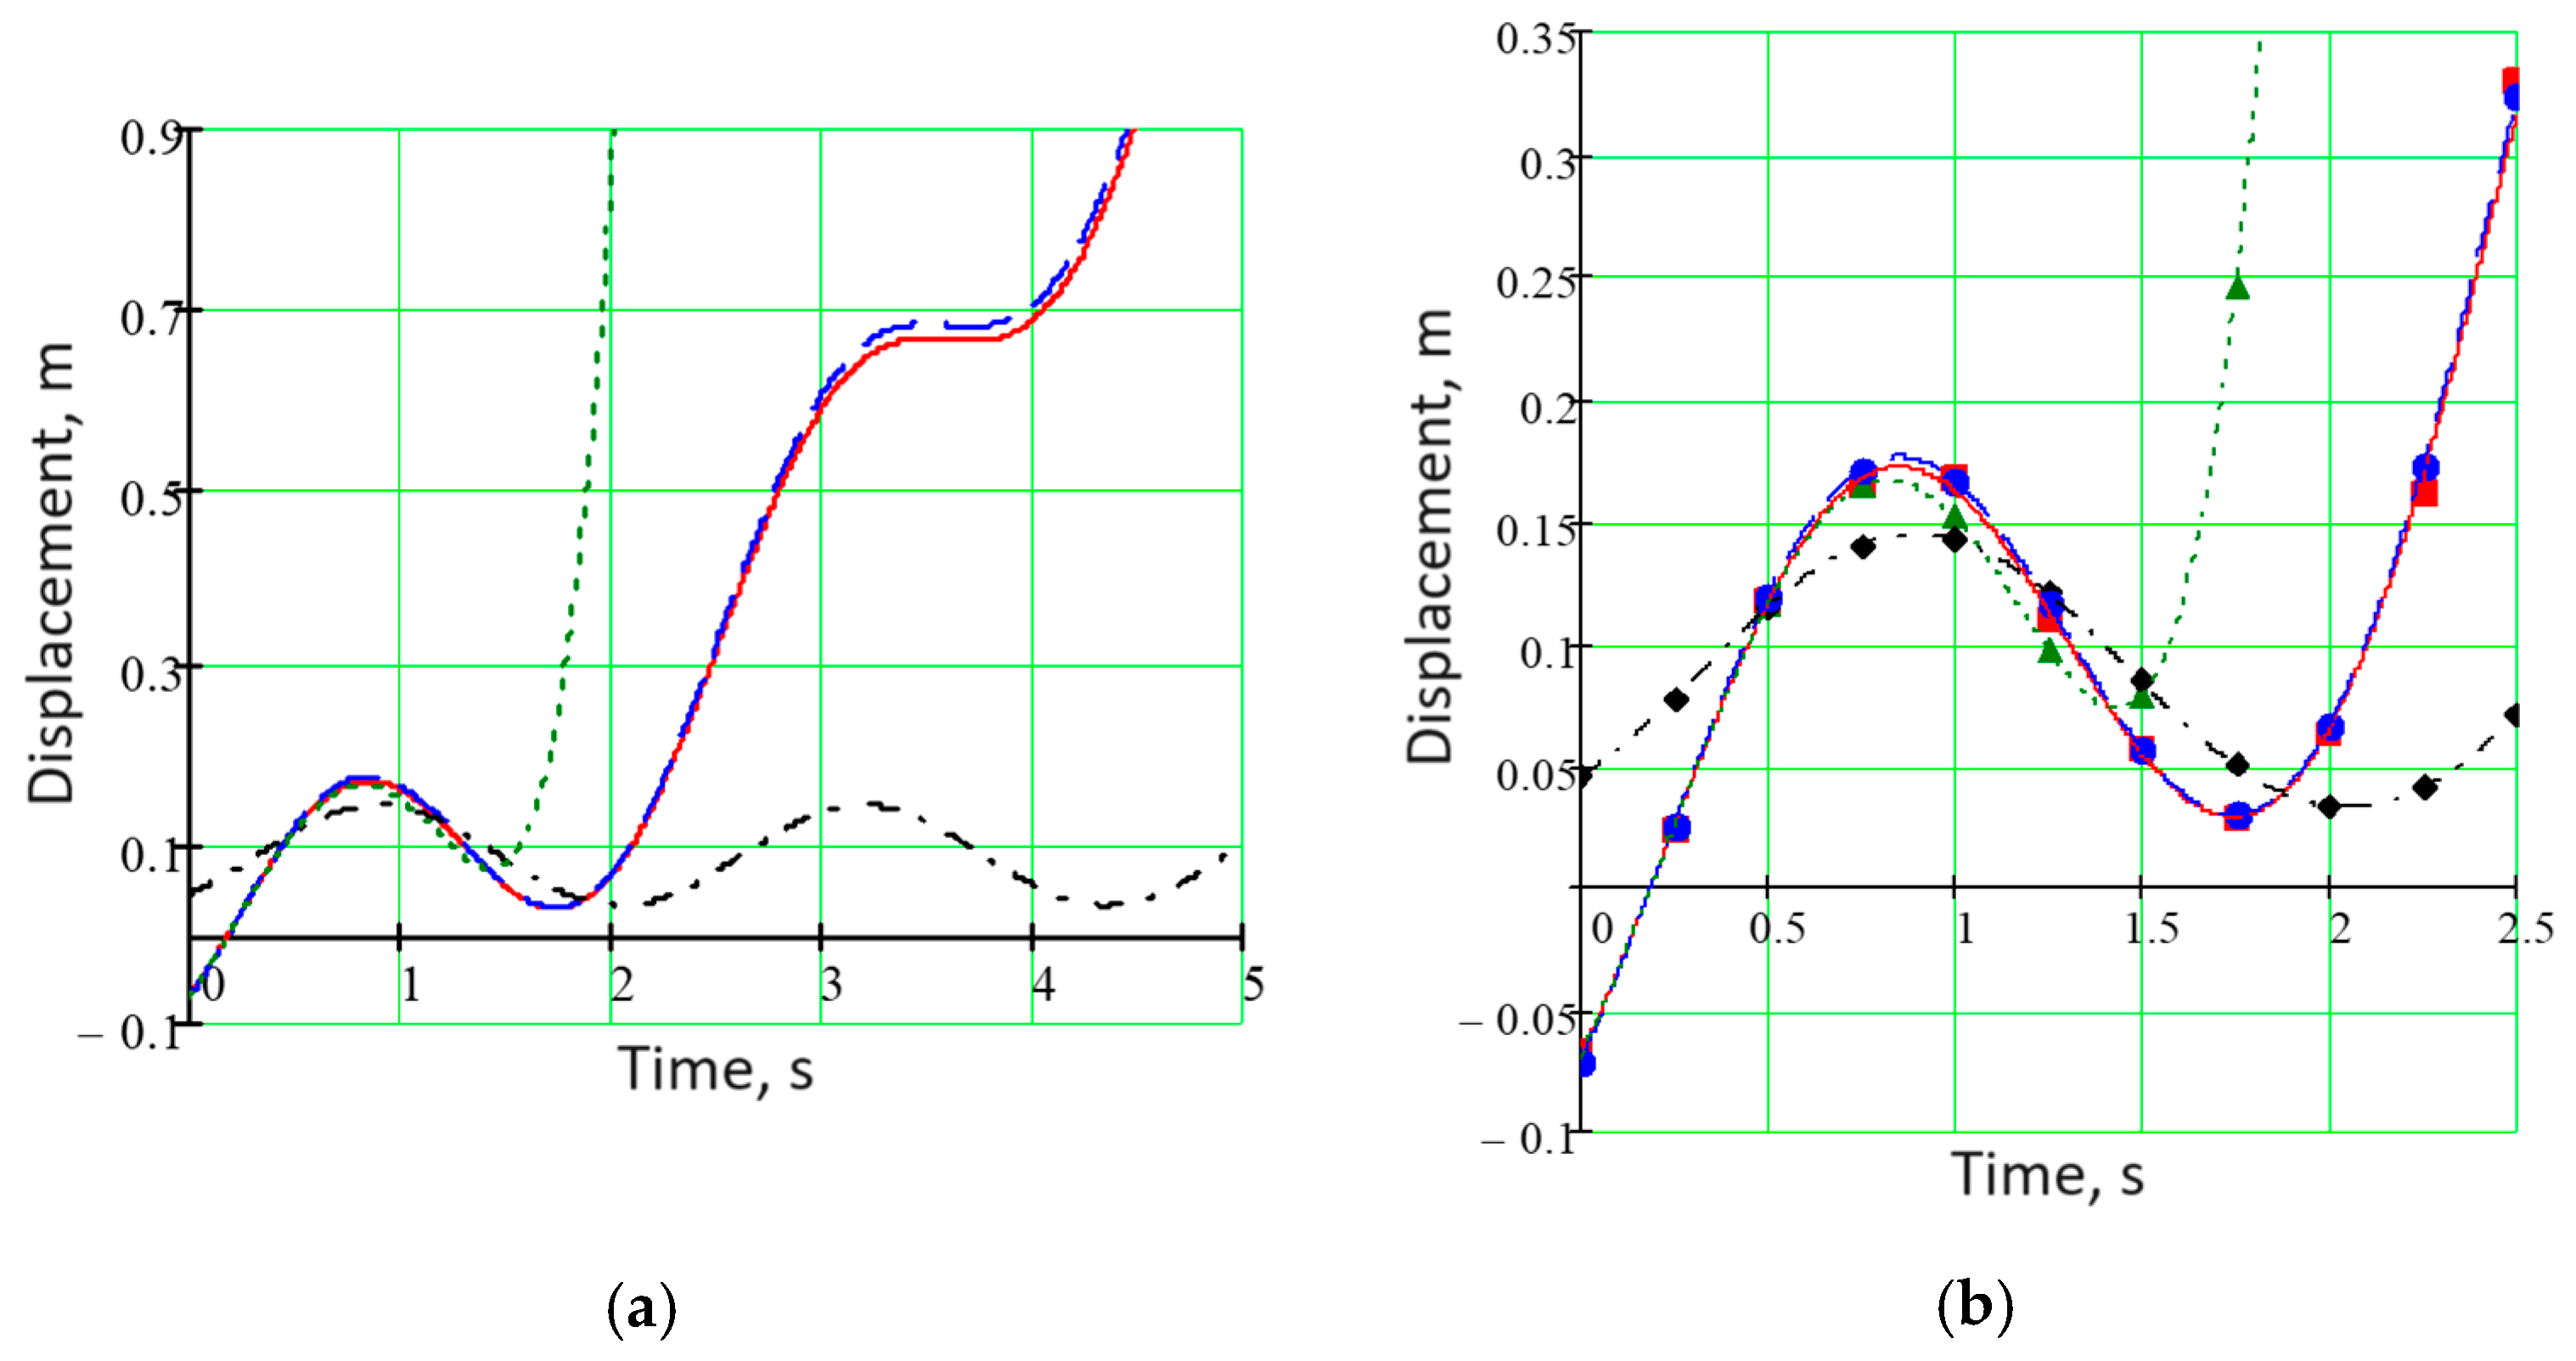
Figure 4 presents the actual signal and its decomposition. The data are also tabulated in Table 4.
For the disturbances/noise of the initial data in a range of ±5%, the maximum relative error for the proposed approach does not exceed 5.3%. However, according to the traditional Fourier approach, the approximating curve does not allow for the accelerating component to be reflected. Also, the traditional Maclaurin series does not allow for satisfying results to be obtained for a time more than 0.45T = 1.0 (s).
As the third example, the damping movement with a time constant τ = 3 s was considered with the above-mentioned overlay and additional 2nd- and 3rd-order superharmonics with amplitudes A2 = 0.08 m and A3 = 0.02 m, respectively:
f t = 0.5 1 e t τ + a 1 sin ω t + b 1 cos ω t + b 2 cos 2 ω t a 3 sin 3 ω t .
As a result, the following parameters were evaluated: I0 = 0.347, I1 = 0.420, I2 = 0.623, I3 = 1.058, I4 = 1.967, and I5 = 3.881; Is1 = 0.041, Is2 = −0.049, Is3 = −0.056, and Is4 = −0.024; Ic1 = −0.092, Ic2 = 0.089, Ic3 = −1.326 × 10⁻³, and Ic4 = −7.467 × 10⁻⁴; c1 = 0.167, c2 = −0.028, c3 = 3.093 × 10⁻³, c4 = −2.523 × 10⁻⁴, and c5 = 1.265 × 10⁻⁵.
The resulting parameters a1 = 0.12, a2 = −7.36 × 10⁻⁹, a3 = −0.02, and a4 = −2.048 × 10⁻⁸ as well as b1 = −0.07, b2 = 0.08, b3 = 7.639 × 10⁻⁹, and b4 = 0.052 × 10⁻⁷ correspond to the initial amplitudes for the 1st, 2nd, and 3rd modes with a relative error that does not exceed 0.8%.
Figure 5 presents the actual signal and its decomposition. The data are also tabulated in Table 5.
For the disturbances/noise of the initial data in a range of ±5%, the maximum relative error for the proposed approach does not exceed 3.7%. However, according to the traditional 7th-order Maclaurin series, it does not allow for satisfying results to be obtained for a time longer than 0.6 s. Also, the Fourier approach does not allow the damping component to be reflected.

4. Discussion

The obtained results have allowed the following disadvantages of the previous research works to be avoided [3,7,11,14]. First, an error in determining the periodic component inevitably leads to an error in determining the aperiodic component since the last one is the difference between the original signal and its periodic component. Secondly, the aperiodic component of the transient process can be erroneously determined as a low-frequency periodic component. Thirdly, transient processes are characterized by overshoot, which can also lead to incorrect identification of the aperiodic component as a frequency one.
Thus, an analytical approach for a periodic and aperiodic decomposition of signals in transient processes devoid of the above disadvantages has been developed. Remarkably, this methodology is based on both modified power and trigonometric series as a comprehensive one.
For the disturbances/noise of the initial data in a range of ±5%, the maximum relative error for the proposed approach does not exceed 3.7%.
The achieved results are practically applicable in mechanical engineering, particularly in the polynomial decomposition of signals, studying dynamic control systems, and ensuring the vibration reliability of rotor systems.
Further research will be directed to implementing the proposed methodology in the frequency analysis of signals by discrete values of available data. The proposed approach will be adopted in the complex mode of infinite series. This approach will also allow the Fourier transform to be extended.

5. Conclusions

Thus, this article proposes a general scientific and methodological approach for the periodic and aperiodic decomposition of signals. This approach is based on the comprehensive series, which combines the Fourier and Maclaurin series.
The proposed methodology allows for identifying the initial aperiodic zones of the transition process. It helps in developing the research methodology of an analytical approach for the periodic and aperiodic decomposition of signals in transient processes.
Unlike existing approaches, the developed methodology allows a signal’s aperiodic and periodic components to be evaluated simultaneously, without defining it as the difference between the total signal and its periodic component. The computational complexity of the method depends on the orders n and N in the approximating dependence (13). It does not exceed the total complexity in applying the Fourier and the Maclaurin series.
Numerical calculations have been carried out for various types of theoretical and approximating curves to check the accuracy of the proposed approach. The proposed method’s error is determined as a difference between the original signal and the sum of periodic and aperiodic components. As a result of three different case studies, the maximum relative error of approximation does not exceed 6% for all types of approximations.
Moreover, the proposed method makes it possible to correctly determine the transient process’s aperiodic component as the aperiodic one, rather than the low-frequency periodic one, and to identify the overshoot effect. This approach is useful for signal processing in automated control and monitoring systems.
The following facts confirm the reliability of the proposed methodology. First, the coefficients (14) of the decomposition to a comprehensive series (13) are reduced to the Maclaurin power series coefficients for the aperiodic signal. Finally, the same coefficients coincide with the Fourier trigonometric series’ coefficients without an aperiodic component.
Further, the proposed methodology can be adapted for the discrete-type signal approximation.

Author Contributions

Conceptualization and methodology—I.P.; software and validation—J.T. and V.I.; formal analysis—V.I., J.M. and J.H.; investigation and resources—I.P. and J.T.; data curation—J.H. and J.M.; writing—original draft preparation—I.P. and S.R.; writing—review and editing—V.I.; visualization—I.P. and V.I.; supervision—J.T.; project administration—I.P. and S.R.; funding acquisition—J.M. All authors have read and agreed to the published version of the manuscript.

Funding

This work was supported by the Slovak Research and Development Agency under contract No. APVV-19-0590, and by projects VEGA 1/0704/22 and KEGA 022TUKE-4/2023 granted by the Ministry of Education, Science, Research and Sport of the Slovak Republic. The research was funded by the EU NextGenerationEU through the Recovery and Resilience Plan for Slovakia under project nos. 09I03-03-V01-00093 and 09I03-03-V01-00094.

Data Availability Statement

The data presented in this study are available on request from the corresponding author.

Acknowledgments

The general approach has been developed within the research project “Fulfillment of tasks of the perspective plan of development of a scientific direction “Technical sciences” Sumy State University” funded by the Ministry of Education and Science of Ukraine (State reg. no. 0121U112684). This research has also been supported by the Research and Educational Center for Industrial Engineering (Sumy State University) and the International Association for Technological Development and Innovations.

Conflicts of Interest

The authors declare no conflicts of interest.

References

  1. Yegnanarayana, B.; D’Alessandro, C.; Darsinos, V. An iterative algorithm for decomposition of speech. IEEE Trans. Speech Audio Process. 1998, 6, 1–11. [Google Scholar] [CrossRef]
  2. D’Alessandro, C.; Darsinos, V.; Yegnanarayana, B. Effectiveness of a periodic and aperiodic decomposition method for analysis of voice sources. IEEE Trans. Speech Audio Process. 1998, 6, 12–23. [Google Scholar] [CrossRef]
  3. Barszcz, T. Decomposition of vibration signals into deterministic and non-deterministic components and its capabilities of fault detection and identification. Int. J. Appl. Math. Comput. Sci. 2009, 19, 327–335. [Google Scholar] [CrossRef]
  4. Lyons, R.; Zumbrun, K. A calculus proof of the Cramer–Wold theorem. Proc. Am. Math. Soc. 2018, 146, 1331–1334. [Google Scholar] [CrossRef]
  5. Zubrycki, P.; Petrovsky, A. Accurate speech decomposition into periodic and aperiodic components based on discrete harmonic transform. In Proceedings of the 15th European Signal Processing Conference (EUSIPCO 2007), Poznan, Poland, 3–7 September 2007; pp. 2336–2340. [Google Scholar]
  6. Prots’ko, I. The generalized technique of computation the discrete harmonic transforms. In Proceedings of the Perspective Technologies and Methods in MEMS Design (MEMSTECH 2008), Polyana, Ukraine, 21–24 May 2008; pp. 101–102. [Google Scholar] [CrossRef]
  7. Elie, B.; Chardon, G. Robust tonal and noise separation in presence of colored noise, and application to voiced fricatives. In Proceedings of the 22nd International Congress on Acoustics, Buenos Aires, Argentina, 5–9 September 2016. ICA2016-722. [Google Scholar]
  8. Pomme, S. Comparing significance criteria for cyclic modulations in time series. Nucl. Instrum. Methods Phys. Res. Sect. A Accel. Spectrometers Detect. Assoc. Equip. 2020, 968, 163933. [Google Scholar] [CrossRef]
  9. Vijayan, K.; Dhiman, J.K.; Seelamantula, C.S. Time-frequency coherence for periodic-aperiodic decomposition of speech signals. In Proceedings of the Interspeech, Stockholm, Sweden, 20–24 August 2017; pp. 329–333. [Google Scholar] [CrossRef]
  10. Betancor, J.J.; Dalmasso, E.; Fariña, J.C.; Scotto, R. Bellman functions and dimension free Lp-estimates for the Riesz transforms in Bessel settings. Nonlinear Anal. Theory Methods Appl. 2020, 197, 111850. [Google Scholar] [CrossRef]
  11. Aczel, K.; Vajk, I. Separation of periodic and aperiodic sound components by employing frequency estimation. In Proceedings of the 16th European Signal Processing Conference (EUSIPCO 2008), Lausanne, Switzerland, 25–29 August 2008; pp. 1–5. [Google Scholar]
  12. Kaur, K.; Jindal, N.; Singh, K. Fractional fourier transform based Riesz fractional derivative approach for edge detection and its application in image enhancement. Signal Process. 2021, 180, 107852. [Google Scholar] [CrossRef]
  13. Hu, Q.; Huang, S.; Liang, M. Decomposition of speech signal into a periodic and an aperiodic part. In Proceedings of the First International Conference on Innovative Computing, Information and Control—Volume I (ICICI’06), Beijing, China, 30 August–1 September 2006; pp. 746–750. [Google Scholar] [CrossRef]
  14. Chaturvedi, G.K.; Thomas, D.W. Adaptive noise cancelling and condition monitoring. J. Sound Vib. 1981, 76, 391–405. [Google Scholar] [CrossRef]
  15. El-Sayed, A.A.; Agarwal, P. Numerical solution of multiterm variable-order fractional differential equations via shifted Legendre polynomials. Math. Methods Appl. Sci. 2019, 42, 3978–3991. [Google Scholar] [CrossRef]
  16. Luscinski, S.; Dobrowolski, D. System dynamics model for continuous review inventory system in demand shock conditions. In Advances in Design, Simulation and Manufacturing. DSMIE 2018. Lecture Notes in Mechanical Engineering; Ivanov, V., Rong, Y., Trojanowska, J., Venus, J., Liaposhchenko, O., Zajac, J., Pavlenko, I., Edl, M., Perakovic, D., Eds.; Springer: Cham, Switzerland, 2019; pp. 306–316. [Google Scholar] [CrossRef]
  17. Pavlenko, I.; Neamtu, C.; Verbovyi, A.; Pitel, J.; Ivanov, V.; Pop, G. Using computer modeling and artificial neural networks for ensuring the vibration reliability of rotors. CEUR Workshop Proc. 2019, 2353, 702–716. [Google Scholar] [CrossRef]
  18. Shao, Y.; Kang, R.; Li, R.; Liu, J. Reliability evaluation method of centrifugal compressor based on rotor vibration signal monitoring. In Proceedings of the 2021 3rd International Conference on System Reliability and Safety Engineering, SRSE 2021, Harbin, China, 26–28 November 2021; pp. 19–25. [Google Scholar] [CrossRef]
  19. Lishchenko, N.V.; Larshin, V.P.; Pitel, J. Vibrational impact on milled surface irregularities. J. Eng. Sci. 2020, 7, A8–A16. [Google Scholar] [CrossRef] [PubMed]
  20. Tarelnyk, V.; Konoplianchenko, I.; Martsynkovskyy, V.; Zhukov, A.; Kurp, P. Comparative tribological tests for face impulse seals sliding surfaces formed by various methods. In Advances in Design, Simulation and Manufacturing. DSMIE 2018. Lecture Notes in Mechanical Engineering; Ivanov, V., Ed.; Springer: Cham, Switzerland, 2019; pp. 382–391. [Google Scholar] [CrossRef]
  21. Vencl, A.; Vucetic, F.; Bobic, B.; Pitel, J.; Bobic, I. Tribological characterisation in dry sliding conditions of compocasted hybrid A356/SiCp/Grp composites with graphite macroparticles. Int. J. Adv. Manuf. Technol. 2019, 100, 2135–2146. [Google Scholar] [CrossRef]
  22. Ivanov, V.; Dehtiarov, I.; Denysenko, Y.; Malovana, N.; Martynova, N. Experimental diagnostic research of fixture. Diagnostyka 2018, 19, 3–9. [Google Scholar] [CrossRef]
  23. Olejárová, Š.; Krenický, T. Water Jet Technology: Experimental verification of the input factors variation influence on the generated vibration levels and frequency spectra. Materials 2021, 14, 4281. [Google Scholar] [CrossRef] [PubMed]
  24. Panda, A.; Prislupcak, M.; Jurko, J.; Pandova, I.; Mrkvica, I.; Luscinski, S. The impact of vibration on the technological head. Manuf. Technol. 2016, 16, 579–585. [Google Scholar] [CrossRef]
  25. Molitoris, M.; Piteľ, J.; Hošovský, A.; Tóthová, M.; Židek, K. A review of research on water jet with slurry injection. Procedia Eng. 2016, 149, 333–339. [Google Scholar] [CrossRef]
  26. Orgiyan, A.; Tkachenko, B.; Oborskyi, G.; Balaniuk, A.; Iorgachov, V. Determining rational cutting modes for horizontal boring operation adjusted for the variable rigidity of the process system. In Advanced Manufacturing Processes. InterPartner 2019. Lecture Notes in Mechanical Engineering; Tonkonogyi, V., Rong, Y., Trojanowska, J., Venus, J., Liaposhchenko, O., Zajac, J., Pavlenko, I., Edl, M., Perakovic, D., Eds.; Springer: Cham, Switzerland, 2020; pp. 246–253. [Google Scholar] [CrossRef]
  27. Pavlenko, I.; Liaposhchenko, A.; Ochowiak, M.; Demyanenko, M. Solving the stationary hydroaeroelasticity problem for dynamic deflection elements of separation devices. Vib. Phys. Syst. 2018, 29, 2018026. [Google Scholar]
  28. Zavialov, V.; Mysiura, T.; Popova, N.; Sukmanov, V.; Chornyi, V. Regularities of solid-phase continuous vibration extraction and prospects for its industrial use. In Advances in Design, Simulation and Manufacturing. DSMIE 2019. Lecture Notes in Mechanical Engineering; Ivanov, V., Rong, Y., Trojanowska, J., Venus, J., Liaposhchenko, O., Zajac, J., Pavlenko, I., Edl, M., Perakovic, D., Eds.; Springer: Cham, Switzerland, 2020; pp. 920–930. [Google Scholar] [CrossRef]
  29. Sprung, D.W.L.; Betti, M.I.; Van Dijk, W. Finite Fourier transforms computed by a modified Filon-Euler-Maclaurin method. Comput. Phys. Commun. 2013, 184, 607–616. [Google Scholar] [CrossRef]
  30. Lian, P. Quaternion and fractional Fourier transform in higher dimension. Appl. Math. Comput. 2021, 389, 125585. [Google Scholar] [CrossRef]
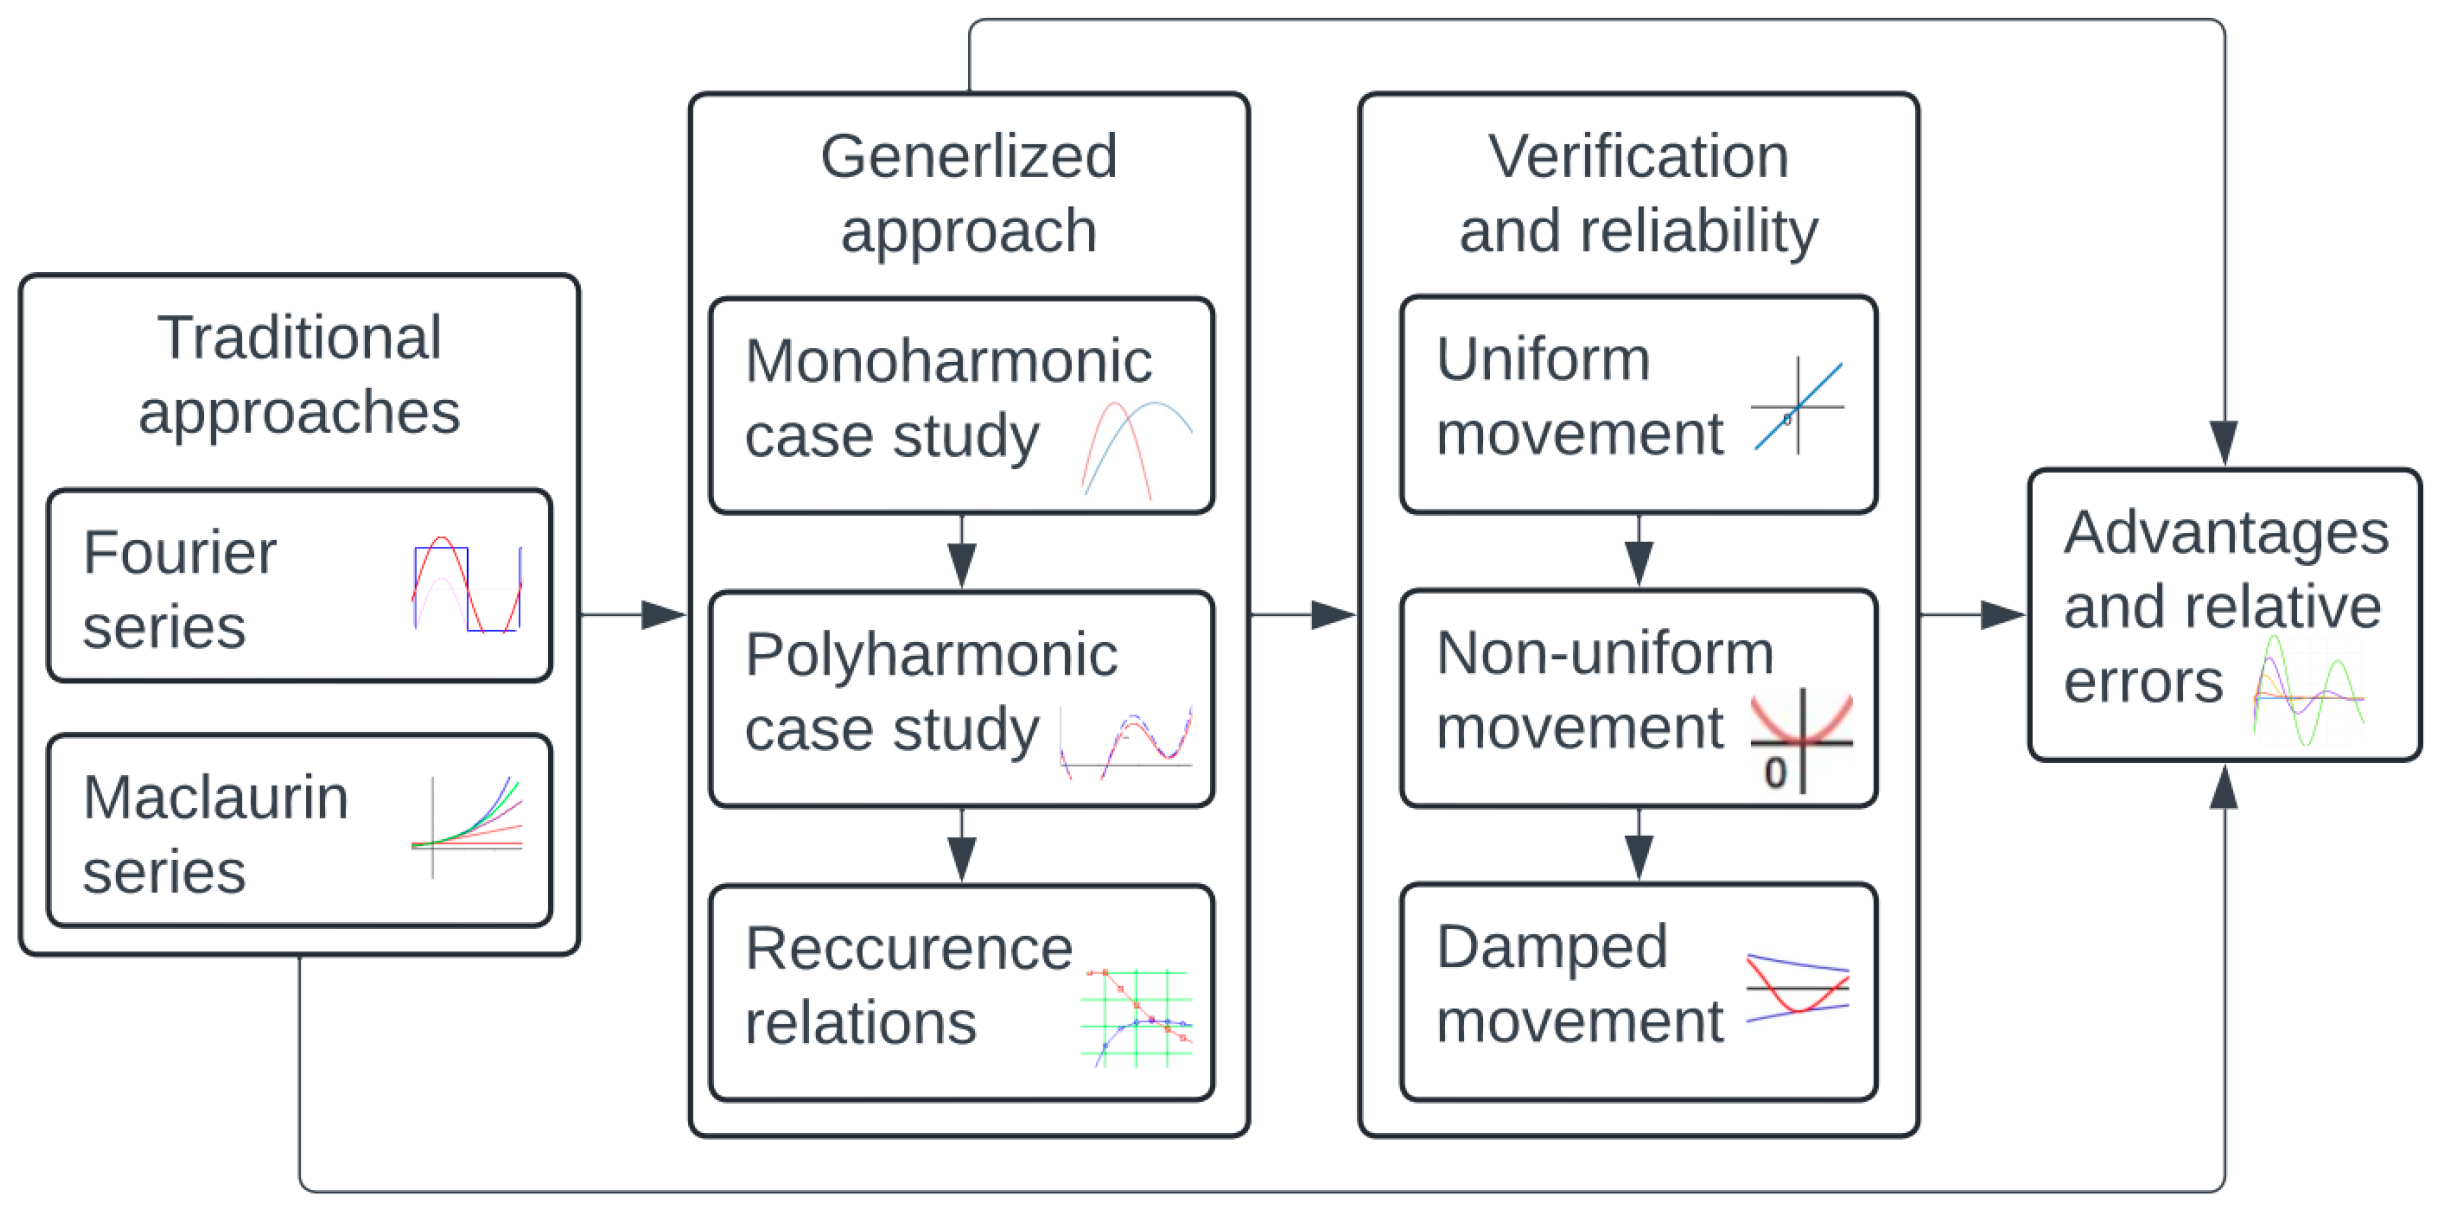
Figure 1. The flowchart of the research methodology.
Processes 12 01188 g001
Figure 2. Auxiliary integrals i(p)sk (a) and i(p)ck (b).
Processes 12 01188 g002
Figure 3. The uniform translational movement: (a) full-scale data; (b) initial-stage data; red solid line and squares—initial data; black dash-dotted line and diamonds—Fourier series; green dotted line and triangles—5th-order Maclaurin series; blue dashed line and circles—evaluated data according to the proposed approach.
Processes 12 01188 g003
Figure 4. The accelerated movement: (a) full-scale data; (b) initial-stage data; red solid line and squares—initial data; black dash-dotted line and diamonds—Fourier series; green dotted line and triangles—5th-order Maclaurin series; blue dashed line and circles—evaluated data according to the proposed approach.
Processes 12 01188 g004
Figure 5. The damping movement with a higher-order overlay: (a) full-scale data; (b) initial-stage data; red solid line and squares—initial data; black dash-dotted line and diamonds—Fourier series; green dotted line and triangles—5th-order Maclaurin series; blue dashed line and circles—evaluated data according to the proposed approach.
Processes 12 01188 g005
Table 1. Numerical values of auxiliary integrals i(p)sk.
pk
12345678910
10.1590.1590.1350.1110.0910.0750.0630.0530.0450.039
20.080.080.0770.0740.070.0660.0610.0560.0520.047
30.0530.0530.0520.0510.050.0490.0470.0450.0440.042
40.0400.040.0390.0390.0390.0380.0370.0360.0360.035
50.0320.0320.0320.0310.0310.0310.0310.030.030.029
60.0270.0270.0260.0260.0260.0260.0260.0260.0250.025
70.0230.0230.0230.0230.0230.0220.0220.0220.0220.022
80.0200.0200.0200.0200.0200.0200.0200.0190.0190.019
90.0180.0180.0180.0180.0180.0180.0170.0170.0170.017
100.0160.0160.0160.0160.0160.0160.0160.0160.0160.016
Table 2. Numerical values of auxiliary integrals i(p)ck.
pk
12345678910
10.0000.0510.0760.0860.0880.0870.0840.080.0760.072
20.0000.0130.0190.0240.0290.0330.0370.0390.040.041
30.0000.0060.0080.0110.0140.0160.0180.020.0220.023
40.0000.0030.0050.0060.0080.0090.0110.0120.0130.014
50.0000.0020.0030.0040.0050.0060.0070.0080.0090.009
60.0000.0010.0020.0030.0030.0040.0050.0050.0060.007
70.0000.0010.0020.0020.0030.0030.0040.0040.0050.005
80.0000.0010.0010.0020.0020.0020.0030.0030.0030.004
90.0000.0010.0010.0010.0020.0020.0020.0020.0030.003
100.0000.0010.0010.0010.0010.0020.0020.0020.0020.002
Table 3. Actual and evaluated data for the uniform movement.
Time,
s
Actual
Value, m
Evaluated Value, m
Fourier SeriesMaclaurin SeriesProposed Approach
0.0−0.121−0.028−0.120−0.121
0.2−0.0080.026−0.009−0.009
0.40.0930.0880.0930.093
0.60.1430.1290.1450.149
0.80.1480.1310.1310.142
1.00.0820.0930.0690.085
1.20.0130.0320.0360.013
1.4−0.033−0.0240.182−0.034
1.6−0.025−0.0510.748−0.024
1.80.044−0.0362.0860.046
2.00.1590.0144.6740.154
green—acceptable values in terms of the relative error; yellow—values with a higher relative error; red—unacceptable values.
Table 4. Actual and evaluated data for accelerated movement.
Time,
s
Actual
Value, m
Evaluated Value, m
Fourier SeriesMaclaurin SeriesProposed Approach
0.0−0.0670.045−0.070−0.070
0.20.0240.0770.0250.025
0.40.1170.1140.1150.116
0.60.1640.1400.1640.167
0.80.1670.1420.1510.162
1.00.1090.1200.0970.113
1.20.0560.0840.0790.055
1.40.0280.0490.2450.029
1.60.0620.0330.8380.065
1.80.1620.0402.2080.167
2.00.3300.0704.8350.315
green—acceptable values in terms of the relative error; yellow—values with a higher relative error; red—unacceptable values.
Table 5. Actual and evaluated data for damping movement.
Time,
s
Actual
Value, m
Evaluated Value, m
Fourier SeriesMaclaurin SeriesProposed Approach
0.00.0100.2850.0100.010
0.20.0600.2950.0600.060
0.40.1270.3210.1330.123
0.60.2060.3700.5760.206
0.80.2970.4234.5200.290
1.00.2870.3930.288
1.20.1210.1960.118
1.4−0.0020.052−0.002
1.60.1180.1470.115
1.80.2650.2740.263
2.00.2920.2970.302
green—acceptable values in terms of the relative error; yellow—values with a higher relative error; red—unacceptable values.
Disclaimer/Publisher’s Note: The statements, opinions and data contained in all publications are solely those of the individual author(s) and contributor(s) and not of MDPI and/or the editor(s). MDPI and/or the editor(s) disclaim responsibility for any injury to people or property resulting from any ideas, methods, instructions or products referred to in the content.