Abstract
Failure Mode and Effect Analysis (FMEA) is an essential risk analysis tool that is widely applicable in various industrial sectors. This structured technique allows us to identify and assign priority levels to potential failures that violate the reliability of a system or process. Failure evaluation occurs in a decision-making environment with uncertainty. This study proposes a probabilistic fuzzy system that integrates linguistic and stochastic uncertainty based on a Mamdani-type model to strengthen the FMEA technique. The system is based on analyzing the frequency of failures and obtaining the parameters to determine the probability of occurrence through the Poisson distribution. In addition, the severity and detection criteria were evaluated by the experts and modeled using the Binomial distribution. The evaluation result is a discrete value analogous to the process of obtaining the success or failure of the expert generating the evaluation of 10 Bernoulli experiments. Three fuzzy inference expert systems were developed to combine multiple experts’ opinions and reduce linguistic subjectivity. The case study was implemented in the knitting area of a textile company in the south of Guanajuato to validate the proposed approach. The potential failure of the knitting machinery, which compromises the top tension subsystem’s performance and the product’s quality, was analyzed. The proposed system, which is based on a robust mathematical model, allows for reliable fault evaluation with a simple scale. The classification performed by the system and the one performed by the experts has similar behavior. The results show that the proposed approach supports decision-making by prioritizing failure modes.
1. Introduction
The increase in quality and competition has motivated companies to offer products and services based on customer expectations. These companies use evaluation techniques to identify potential risks, effects, and causes [1,2]. Risk management and criticality analysis are effective tools for prioritizing component failures in complex systems [3], allowing corrective actions to be taken at the product development and operational levels [4]. FMEA is the most widely used structured and qualitative technique for identifying failure modes within a system, evaluating their impact, and planning corrective actions. It is the number one step in reliability studies [5] to increase system general safety [6] and has been successfully implemented in diverse areas [7].
When implementing this technique, a multidisciplinary group of experts is involved to analyze potential failures that may violate the system’s proper functioning. Subsequently, experts evaluate the failure modes based on their knowledge, considering three criteria: occurrence (O), detection (D), and severity (S). Traditionally, ten categories are used for each criterion. The metric for prioritizing failures is the product of the three criteria; this product is called the risk priority number (RPN). By applying FMEA, experience is transformed into the ability to foresee future problems [8] and thereby mitigate or eliminate unexpected events that reduce the system’s reliability [9].
In actual practice, the evaluation of failure modes is carried out in what Kahneman defines as a decision-making environment under conditions of uncertainty [10]. Experts play an essential role in decision-making; however, when they express their opinion, it is based on their perception and experience of the effects caused by failures. Therefore, they inherently use natural language to evaluate the criteria (input variables), generating imprecise information. In the proposed approach of this research, two types of uncertainty are considered: the first is linguistic, which is addressed by categorizing the criteria based on the experts’ interpretation. The second type of uncertainty is stochastic, which addresses the random nature of a phenomenon. The domain used in the proposed system is established based on probabilistic values for the input variables. Probabilistic fuzzy systems that cover both types of uncertainty in a unifying framework allow us to achieve a more realistic and comprehensive model [11]. Recent studies have proposed models to improve the FMEA technique by considering linguistic uncertainty with fuzzy logic systems. However, few studies have considered the stochastic uncertainty derived from the occurrence of failure modes.
FMEA was formally implemented in 1963 during the Apollo space project, but in 1994, the implementation of this technique reached its peak in the automotive sector [12]. Recent articles have extensively improved the performance of FMEA by integrating fuzzy logic theory with critical sector applications. For example, Testik and Unlu [13] implemented the FMEA technique to identify risks in testing and calibration laboratories. They compared the advantages of using the conventional technique with the one improved with fuzzy logic. Moreover, Ilczuk and Kycko [14] analyzed the risks based on a fuzzy FMEA in investment processes to improve safety in railway traffic control. In their study, Goksu and Arslan [15] proposed a fuzzy FMEA to evaluate risks in the naval industry and thus improve ship operating conditions. Furthermore, Cruz-Rivero et al. [16] combined FMEA with fuzzy logic to evaluate the functionality of a prototype that quantifies methane gas and carbon dioxide in the livestock industry. In each study cited above, the risk assessment is carried out in an environment of linguistic uncertainty, and stochastic uncertainty is not considered, unlike in the present research, which proposes an evaluation system that integrates the two types of uncertainty to generate a robust evaluation framework.
Furthermore, in the work of Ribas et al. [17], the authors propose an important Mamdani-type Fuzzy Inference System (FIS) to evaluate failure modes in a hydroelectric power plant. In addition to the three RPN criteria, the FIS incorporates a criticality index that allows prioritization of the risks in a dam–energy generator. Alizadeh et al. [18] used a fuzzy FMEA with the stages of the Mamdani method to analyze and evaluate the risks associated with the physical processes of a wastewater treatment plant. Additionally, in the work of Łapczyńska and Burduk [19], the authors used the Mamdani method, with which they proposed a FIS to analyze the risks in the machinery of a production process. Pacana and Siwiec [20] developed a valuable proposal incorporating a qualitative environmental indicator to a diffuse FMEA to analyze the risks in the quality of the product and the natural environment. The study of Alshehhi et al. [21] proposes a Mamdani-type FIS in the criticality analysis and FMEA to classify the risks associated with acquiring Artificial Intelligence systems for public sectors. The works cited above are characterized by evaluating the occurrence criterion using a comparative table with established categories, where the table also contains a column of assigned probabilities as a reference base to assign the category. Therefore, in this investigation, the natural frequency of each failure mode is determined based on events that have occurred and not on comparative tables. Thus, in the first stage of the Mamdani method, probabilistic values are used in the input linguistic variables.
Consequently, only some studies have examined the effect of stochastic and linguistic uncertainty during experts’ criteria evaluation. For example, Wu and Wu [22] proposed a model that simultaneously integrates the two types of uncertainty and solves the complex problem using Markov Chains and Monte Carlo simulation methods. They integrate fuzzy theory, Bayesian statistical inference, and the beta–binomial distribution in the evaluation phase. In a differentiated way, our approach integrates both types of uncertainty but respects the stages of a Mamdani-type fuzzy model where probabilistic concepts are introduced based on historical data. Furthermore, Jang [23] developed an essential proposal to overcome the limitations of FMEA by constructing a time-dependent probabilistic model. This study considered that the longer the time that had passed since the failure occurred, the greater the loss it caused in the process or system. However, the authors only deal with the probabilistic aspect without considering the linguistic environment and the participation of experts during the evaluation of failure modes, which, in actual practice, is essential. In this research, both the information from experts and the statistical information of events that occurred are considered in the evaluation stage.
In addition, Gul et al. [24] developed an innovative FMEA system based on Bayesian networks and the best–worst method under the fuzzy concept. De Aguiar et al. [25] successfully combined fuzzy logic and product FMEA to evaluate and prioritize failure modes in a cutting module of an agricultural machine. Ceylan [26] developed a fuzzy rule-based FMEA to analyze and evaluate the risks associated with shipboard compressor systems. In doing so, they made an essential contribution to the maritime sector. Certa et al. [27] propose an FMEA based on the Dempster–Shafer Evidence Theory (DST) as a mathematical framework to deal with information with epistemic uncertainty. They apply the methodology to assess risks in the propulsion system of a fishing vessel. In the research of Ghasemi and Rahimi [28], the authors analyze and evaluate the risks of personal fall arrest systems using an FMEA in a fuzzy, intuitionistic environment. The results provide a framework for predicting user safety. On the other hand, the study by Awodi et al. [29] presents a novel tool to assess the risks of nuclear decommissioning projects using a Technique of Order Preference by Similarity Order to Ideal Solution (TOPSIS). This allows risk management and optimal decision-making. In the cited research [24,25,26,27,28,29], the authors do not address stochastic uncertainty in their models; they also use the conventional RPN scale of 1 to 1000 to prioritize failure modes. In our research, the classification of failure modes is simple and easily interpretable, with a scale of 1 to 10.
Some research has been carried out whose focus is to strengthen the FMEA by reducing the uncertainty associated with the multiple opinions of experts when evaluating failures, for which there is a high level of subjectivity. In this regard, a few studies have addressed this topic. However, some relevant works are presented below. Ghoushchi et al. [30] developed a three-phase method where they develop an FMEA to identify failure modes in a critical automotive spare parts manufacturing process. Furthermore, to determine the factors O, D, and S, they used the fuzzy best–worst (FBWM) method and assigned weights to the factors based on the experts’ experience. Their contribution is relevant when prioritizing failures using Multi-Objective Optimization and Z fuzzy number theory (Z-MOORA), which incorporate the concepts of uncertainty and reliability. The research of Buffa et al. [31] developed an FMEA with criticality analysis to support a risk assessment of a high-activity gas recovery system in failures due to components and human errors. They improved the fuzzy RPN through Evidence Theory. They established normalization stages by calculating a weighted function and constructing discrete distribution functions of the factors. They assigned weights to factors and considered it essential to reduce the uncertainty associated with various expert opinions. It should be noted that experts give greater importance to the O and S factors. Following the same approach, this research proposes three fuzzy inference expert systems to consider the opinion of each of the experts to reduce uncertainty due to the subjectivity present when experts issue their opinions. The opinions are grouped to unify the evaluation of the factors (O, S, and D). Furthermore, works [30,31] operate with different scales, making them difficult to compare with the conventional RPN scale. In contrast, this work uses a simple scale of [1,2,3,4,5,6,7,8,9,10] that is easily comparable.
After reviewing the literature, it is possible to highlight the efforts to improve FMEA performance through hybrid approaches with techniques involving Artificial Intelligence, Multicriteria Decision Making, Event Theory, and Markov Chains. However, it is possible to conclude that additional research is required regarding approaches that simultaneously treat information with linguistic and stochastic uncertainty in an integrative model. Therefore, the present study proposes a probabilistic fuzzy system to evaluate failure modes during FMEA implementation. The system is based on the theory of fuzzy logic, which deals with the environment of linguistic uncertainty. Also, probability theory is used to deal with stochastic uncertainty. Therefore, the proposed system offers a robust and reliable tool for evaluating potential risks, thereby eliminating or mitigating harmful effects on a system/process. The present research was validated in a textile company, specifically in knitting machinery.
The main contributions of this research are as follows:
- Linguistic and stochastic uncertainty is integrated into a robust mathematical model.
- Poisson distribution is used to determine the probabilistic values of the occurrence criterion.
- Binomial distribution determines the probabilistic values of the detection and severity criteria.
- The outputs of the probabilistic fuzzy system are obtained in a simple and easy range of [1, 10], which allows straightforward interpretation when classifying each failure mode.
2. Materials and Methods
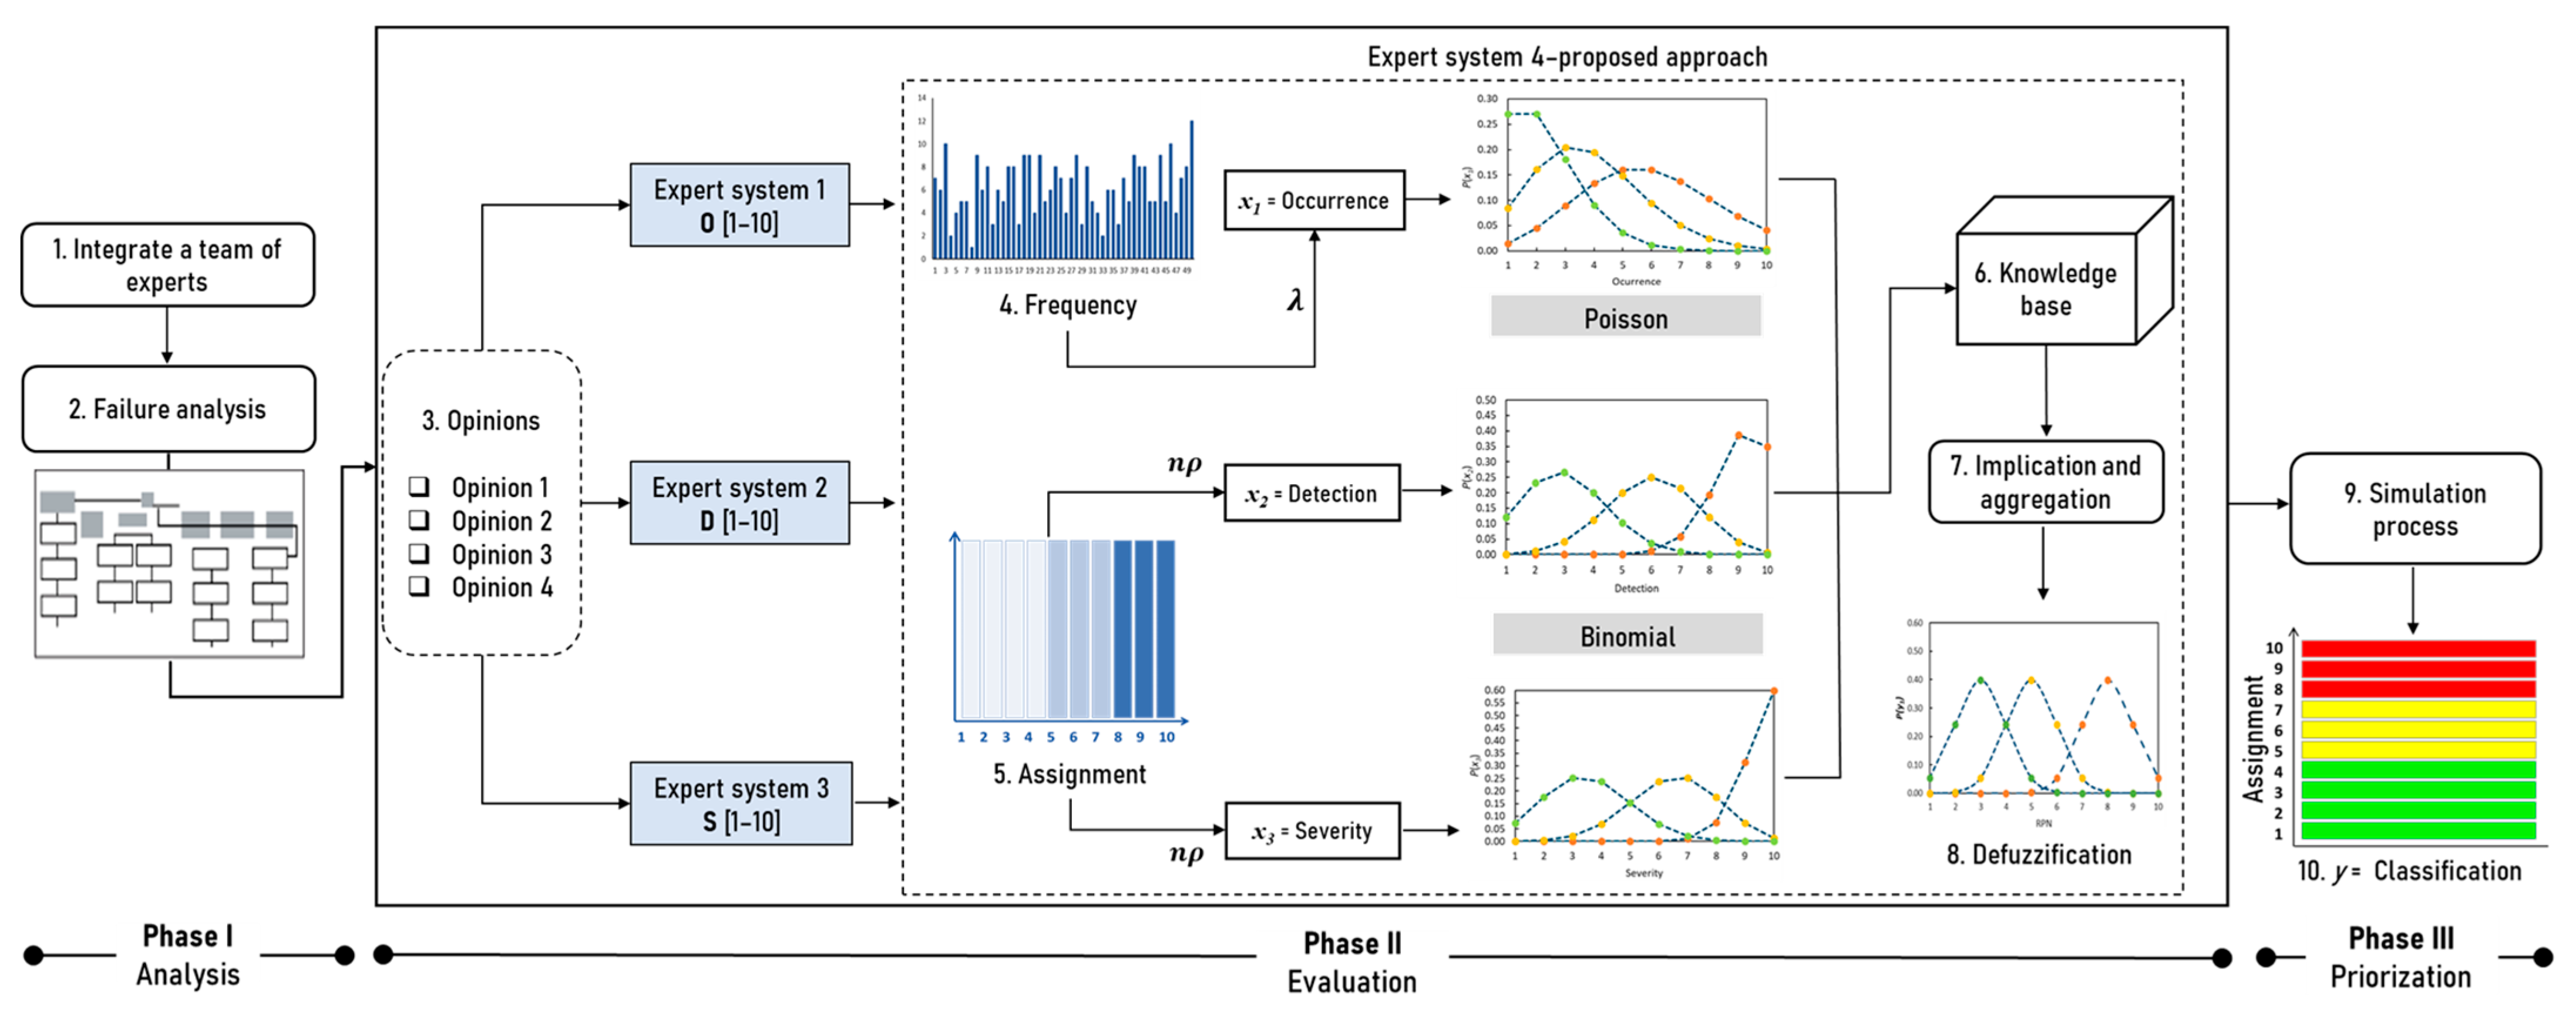
The methodology used in this research consists of three phases, each of which allows the evaluation and classification system of failure modes to be structured by integrating fuzzy logic and probability theory techniques (See Figure 1).
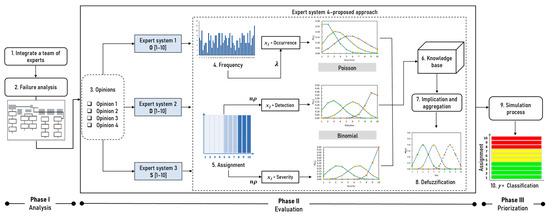
Figure 1.
Methodology.
The basis of the evaluation system begins with the analysis (Phase I) of the failure modes, as well as the effects and their causes. Also, the integration of the work team is crucial, given that their experience in the system or process is essential for evaluating the events (criteria). In this phase, the occurrence event is significant since historical data are analyzed to establish the frequency of failure modes. With this in mind, the proposed approach establishes that it is based on evidence or events that have already occurred. The failure rate is obtained, which is a necessary parameter to determine the Poisson probability distribution function. Also, the parameters of the severity and detection events necessary for the binomial probability distribution are determined. In the evaluation (Phase II), the variables and linguistic labels for each event are established, and, with their corresponding degree of probability, they are entered into the knowledge base so that these distribution functions perform a classification. Three fuzzy inference expert systems are used to combine multiple points of view. Finally, in the prioritization phase (Phase III), a simulation process is carried out to verify the system outputs and classify the failure mode under study.
2.1. FMEA
The FMEA is a structured and simple but potentially effective technique; it also allows us to analyze and evaluate the various ways in which a system fails, as well as establishing the necessary actions to reduce the occurrence of failures. O, D, and S are the three criteria of importance. Higher values of O indicate a greater frequency of failure occurring. Higher values of D mean that it is more difficult to find and prevent a failure before it happens. Criterion S classifies damage to the system [32]. Traditionally, these criteria are evaluated with subjective categories and using a scale between 1 and 10. Based on the expert group’s opinion, the criteria presented in Table 1 were categorized and adapted according to the scale and description proposed by Cardiel-Ortega and Baeza-Serrato [33].

Table 1.
Categorization of criteria.
The RPN metric is used with Equation (1) to evaluate each failure mode’s risk level. Therefore, a larger RPN implies more critical failure modes, and attention should be paid to improving the system performance [34].
FMEA is implemented in a five-step procedure:
- Establish the objective and integrate a multidisciplinary team of experts.
- Identify and analyze failure modes, their effects, causes, and detection controls.
- Establish the level of occurrence, severity, and detection.
- Obtain the risk priority number.
- Formulate a final report with the recommended actions and modifications to reduce or eliminate risks in the system/process.
2.2. Evaluation System
The evaluation system proposed in this research deals with information with linguistic uncertainty. It is classified based on the interpretation and knowledge of experts. Lotfi Zadeh developed a tool to deal with this type of uncertainty in 1965, using fuzzy sets to model imprecise information. Moreover, the Mamdani method is the most frequently used in fuzzy systems because it has a simple, understandable, and intuitive structure, making it more suitable for expert system applications [35]. The proposed system considers the stages of the Mamdani method: initially, the input linguistic variables are determined. In this case, the variables are O (), D () y S (). The universe of discourse for the three variables was established in a range [1,10] suggested in the literature. The input linguistic variables were categorized into three labels: low (L), medium (M), and high (H), whose values are the parameters obtained by the frequency of failures and the experts’ opinions. Afterward, fuzzification was carried out by associating the probability corresponding to each level of the input variables through probability distribution functions. Subsequently, the knowledge base is established through fuzzy probabilistic inference rules of the if–then, type, giving way to implication and aggregation. Finally, the system output is obtained to perform individual failure mode classification. The output variable also has a discourse universe of [1,10], enabling simple and easy classification that helps decision-making.
3. Case Study
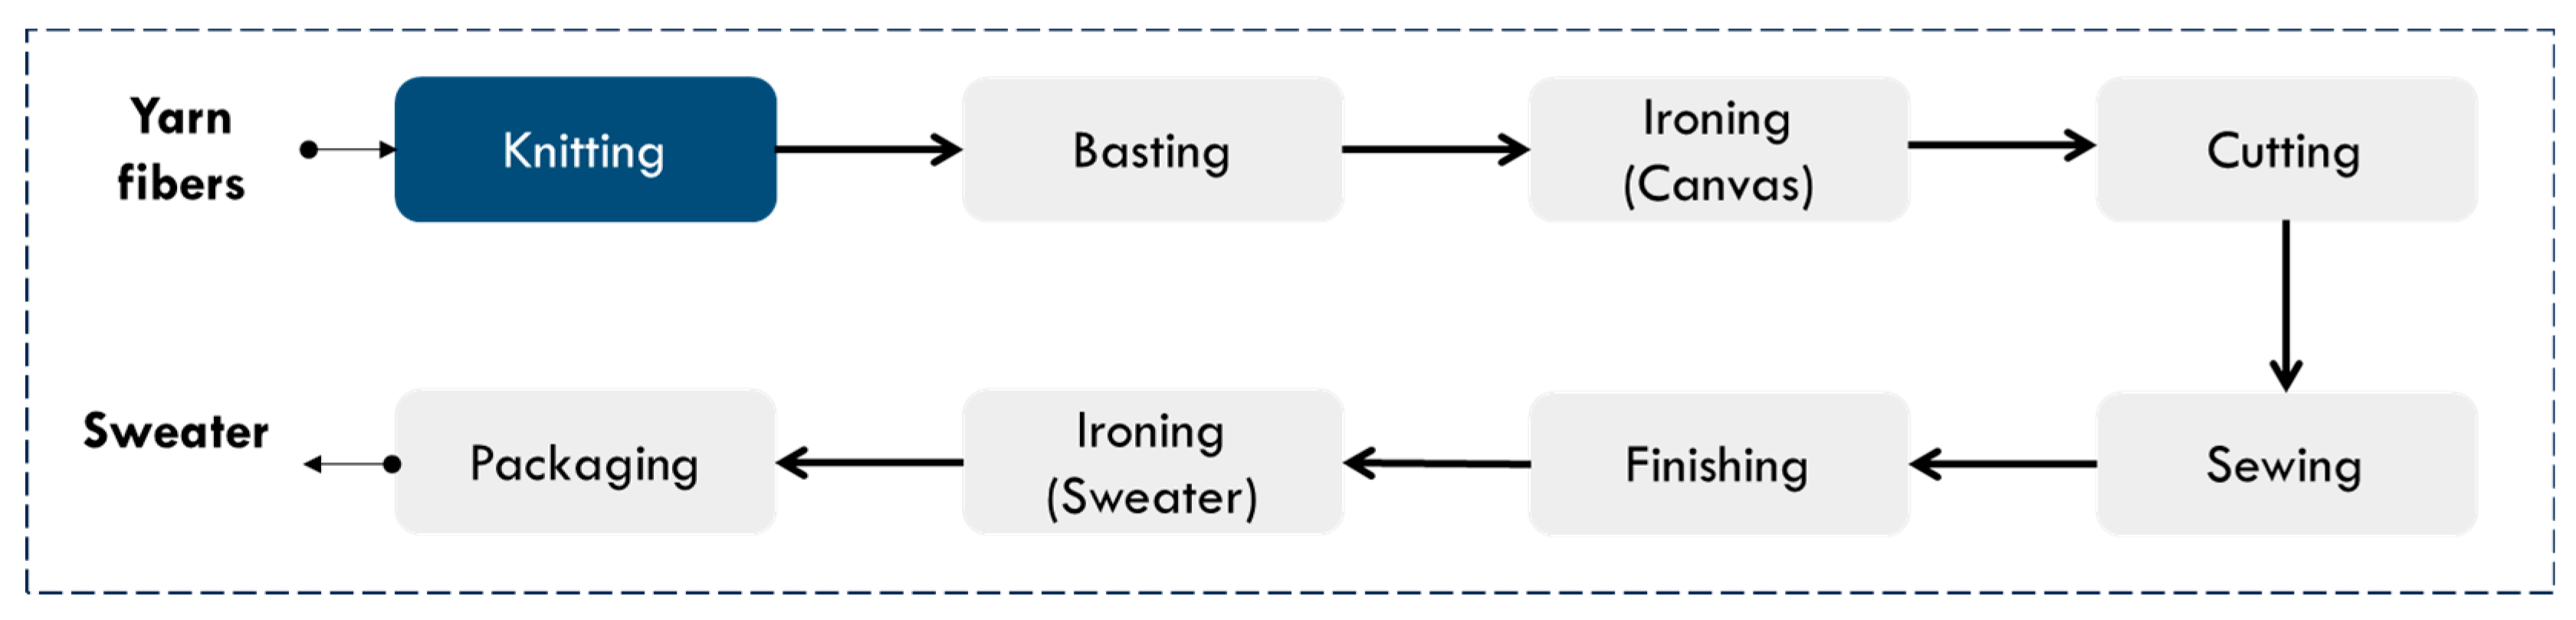
The proposed approach was validated in a company in the clothing textile sector, specifically in the manufacture of knitted clothing. The company is in the south of Guanajuato, Mexico. The manufacturing process consists of eight stages, from processing yarn fibers in the weaving area to obtaining a children’s clothing item. The stages are presented in Figure 2.

Figure 2.
Knitted garment manufacturing process.
The study focuses on knitting, where yarn fibers are transformed into knitting canvases with rectilinear machines. The correct functioning of this area is essential for the process because, in each operation, value is added to the canvases obtained from this area. Therefore, it is relevant to offer experts a reliable and robust tool to evaluate and classify the failure modes in rectilinear machines based on fuzzy logic techniques and probability theory. Below are the steps of Phase I corresponding to the analysis.
3.1. Expert Team Integration
The team consists of four experts who have a direct relationship with knitting and extensive knowledge of machinery. Table 2 presents the main characteristics of the equipment.
Table 2.
Expert team.
A multidisciplinary team is essential due to the experience and knowledge they provide with regard to analyzing failure modes, effects, and causes. A team’s participation in the evaluation process and decision-making enriches the analysis phase, given that different points of view can offer a more satisfactory solution to the problem.
3.2. Failure Analysis
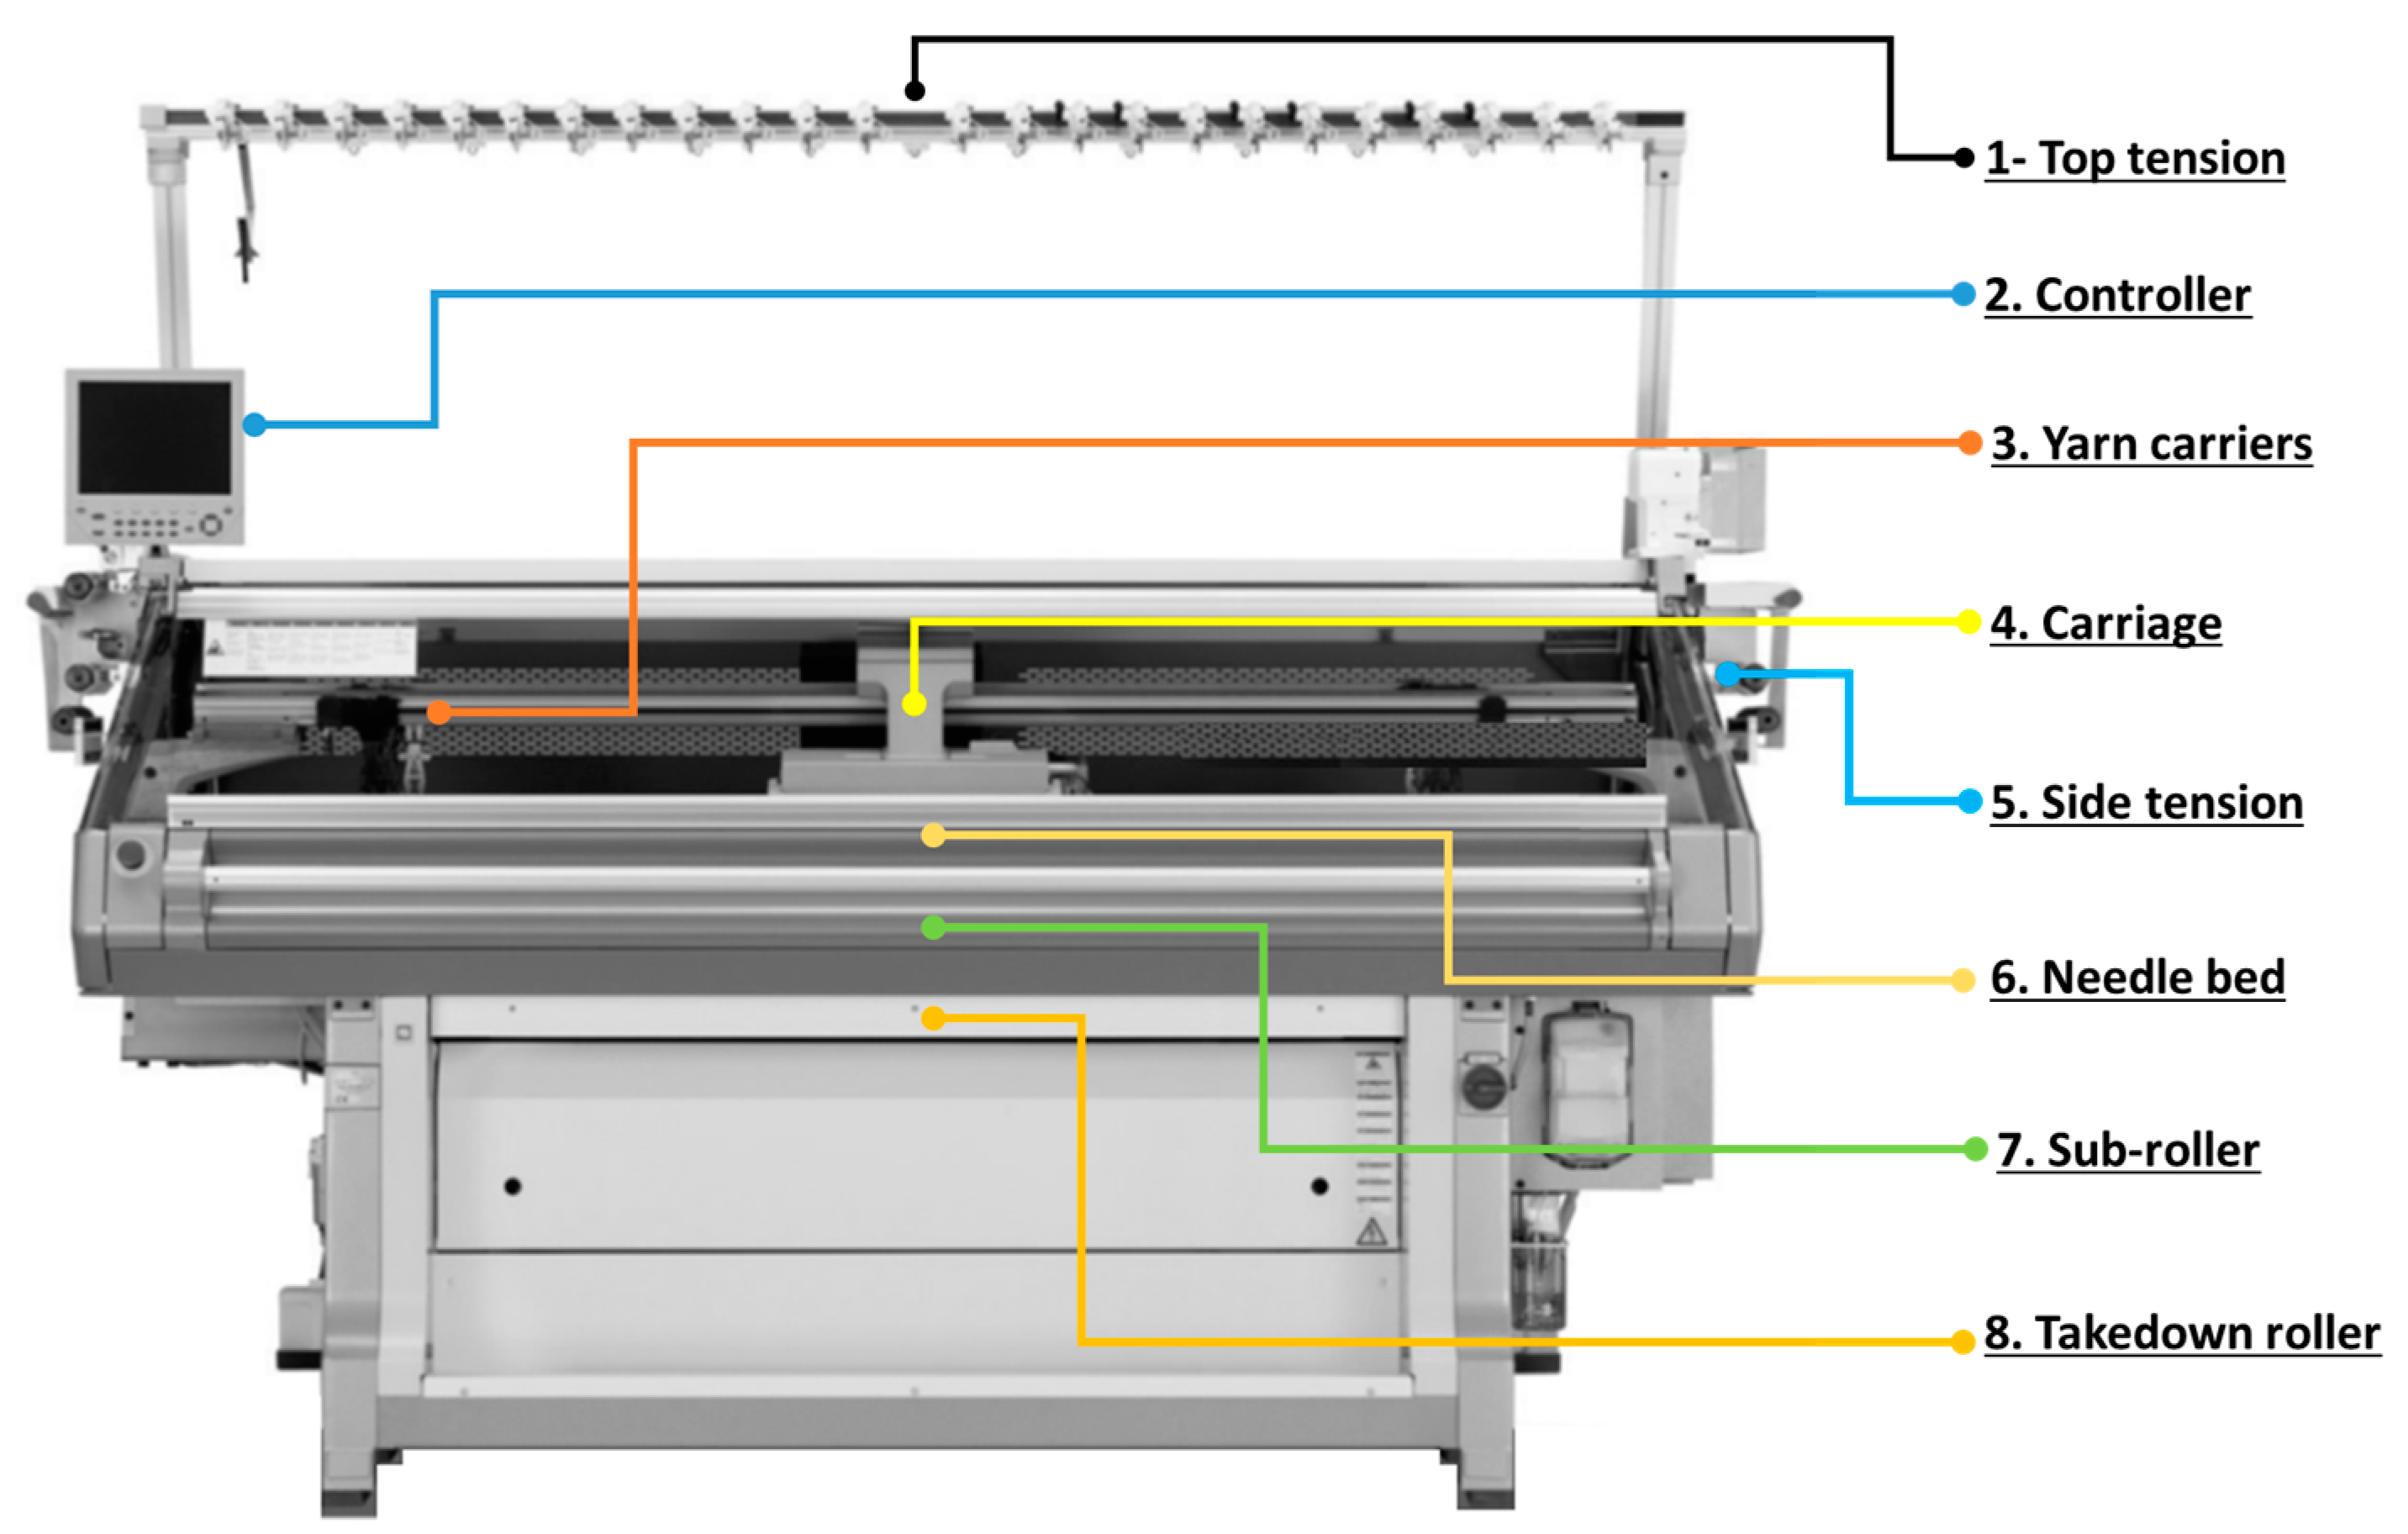
Through sessions to study potential risks, the expert team categorized the machinery into subsystems to facilitate the identification of failure modes. Figure 3 shows the location of these subsystems.
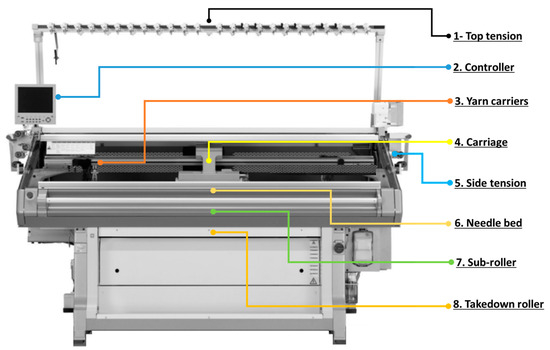
Figure 3.
Subsystems of rectilinear machines.
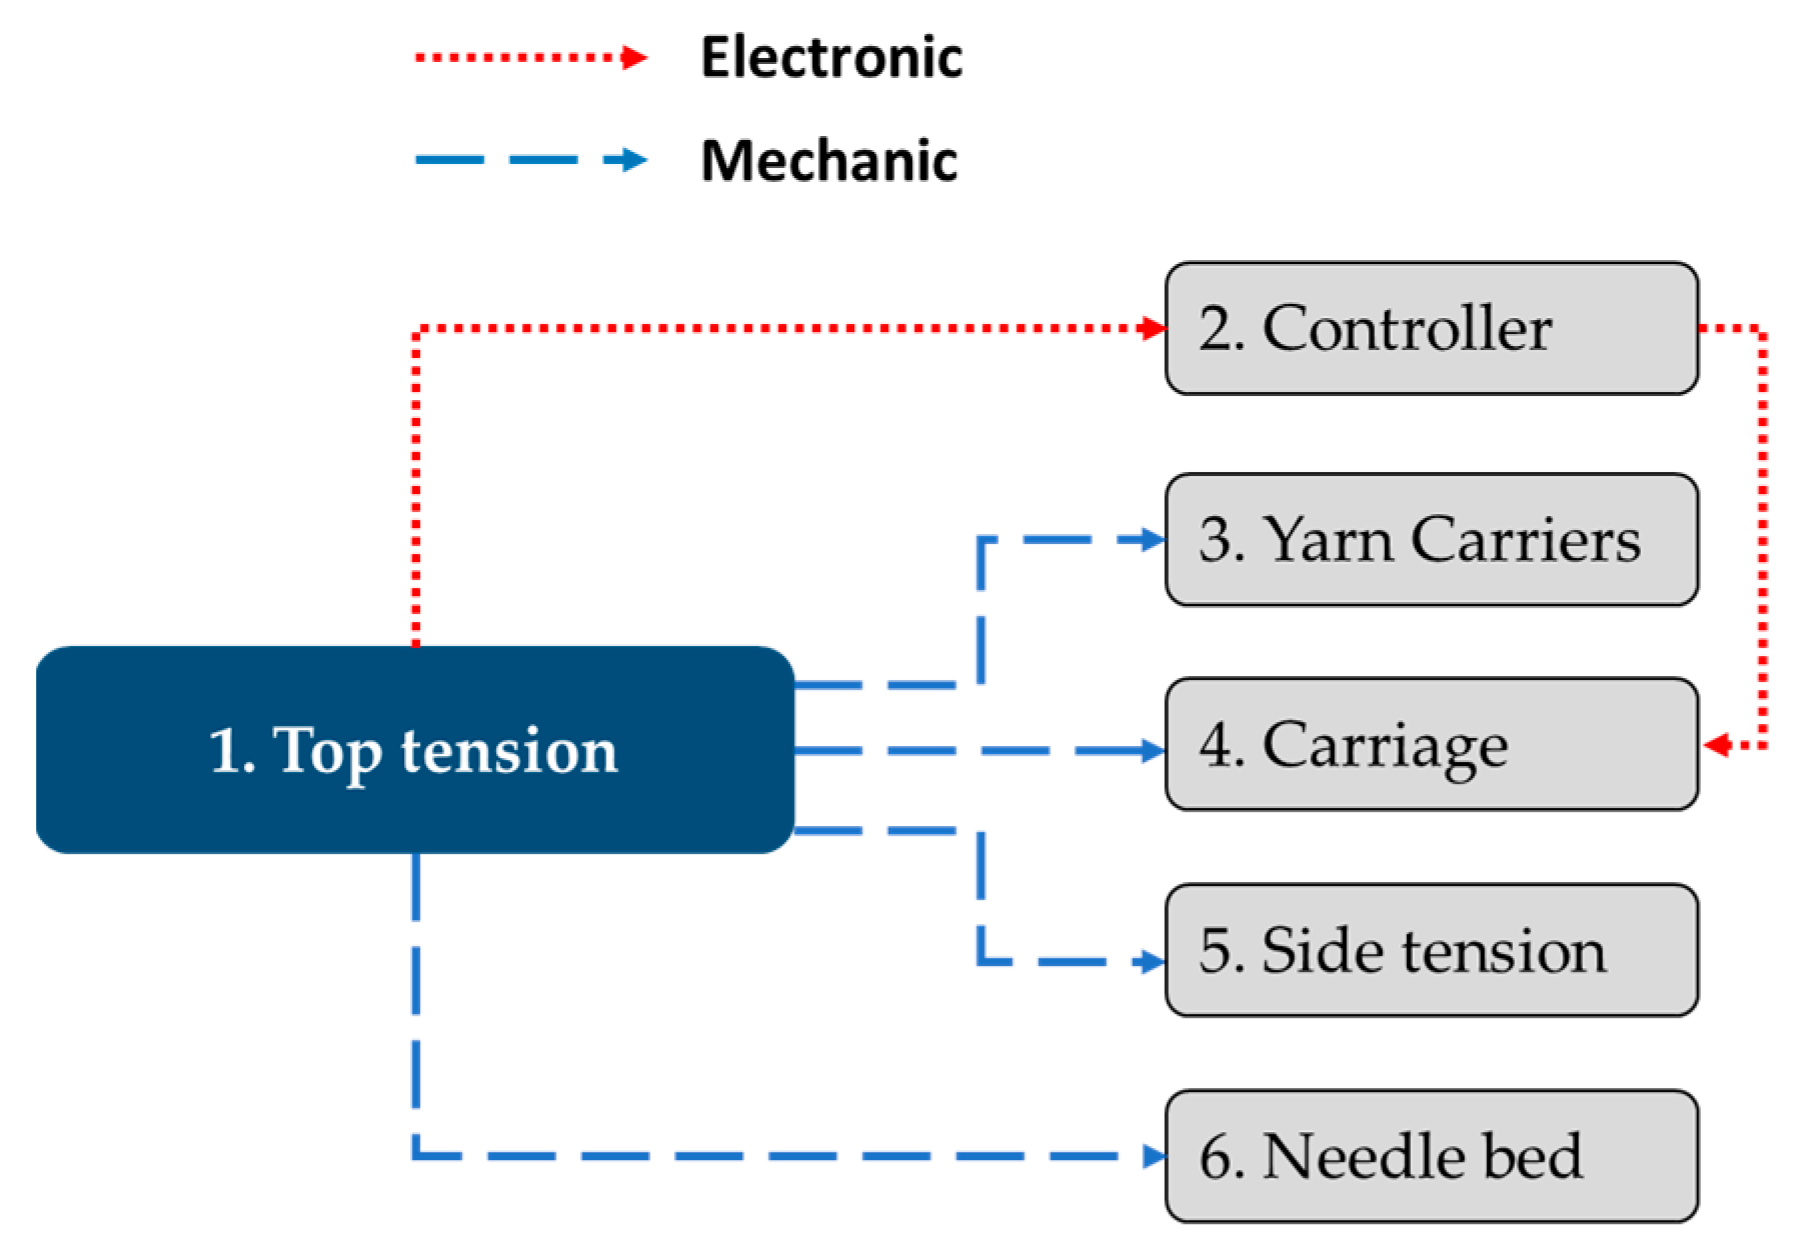
During the analysis phase, it was necessary to consider the relationship between the different subsystems of the machine. The top tension subsystem has an electronic relationship with the controller subsystem. When detecting a fiber knot, the sensors send a signal to the controller subsystem to stop the machine and activate the alert light, with which the operator identifies what happened. Subsystems 3, 4, 5, and 6 also have a mechanical relationship. When one of the failure modes occurs in the top tension, it affects the other subsystems, resulting in a knitted fabric with errors or low quality. Figure 4 shows the schematic of this subsystem.

Figure 4.
Direct relationship with the top tension subsystem.
Continuing to analyze the potential risks, the expert team determined that the scope is the development of a process FMEA. For each subsystem, the potential failure modes that can significantly affect the operation of the machinery were established. We only expose subsystem 1 (top tension) in the present study. Through this subsystem, the different yarn fibers are fed to the machine to allow it to weave the knitted fabric canvases.
Each component must work correctly, given that a certain tension is generated during the fiber’s path that, if not controlled correctly, can alter the main parameter of knitted fabrics, which is called the loop length. Table 3 shows the analysis result of this subsystem, its corresponding failure modes, the classification of the components according to where these failures occur, and the effects that failures can produce in the machinery, process, or product.
Table 3.
Failure modes of the top tension subsystem.
Next, Figure 5 shows the components of the top tension subsystem and presents the five potential failure modes considered by the expert team.
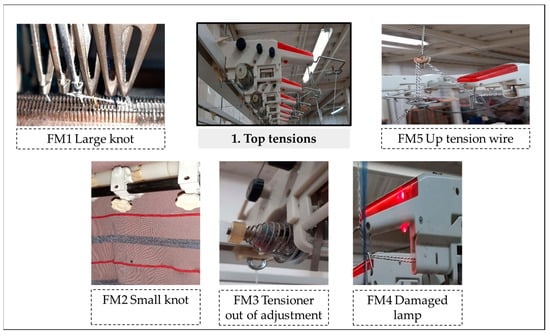
Figure 5.
Components—top tension.
Phase II, or evaluation, of the probabilistic fuzzy system, comprises six main steps described below. With the system proposed in this research, the failure modes are evaluated individually based on historical data (frequency) and the experts’ experience. Each criterion is related to a probability distribution function for discrete variables.
3.3. Opinions
During the evaluation of the factors (O, D, and S), the expert expresses his opinion or point of view, which generates linguistic uncertainty. Therefore, three fuzzy inference expert systems were developed to consider the multiple opinions of the expert team members. Each expert system allows multiple opinions to be combined and thus reduces subjectivity in the evaluation. Table 4 presents the main characteristics of the inference systems.
Table 4.
General configuration of fuzzy inference expert systems.
The output generated by each system is an overall evaluation of the team for each factor. These outputs are established as the values of the input variables to the probabilistic fuzzy system. The systems were structured with a Mamdani-type model and if–then-type inference rules were established. Considering three linguistic labels and the participation of four experts, () inference rules were determined. The centroid defuzzification method proposed by [33] was used.
3.4. Frequency
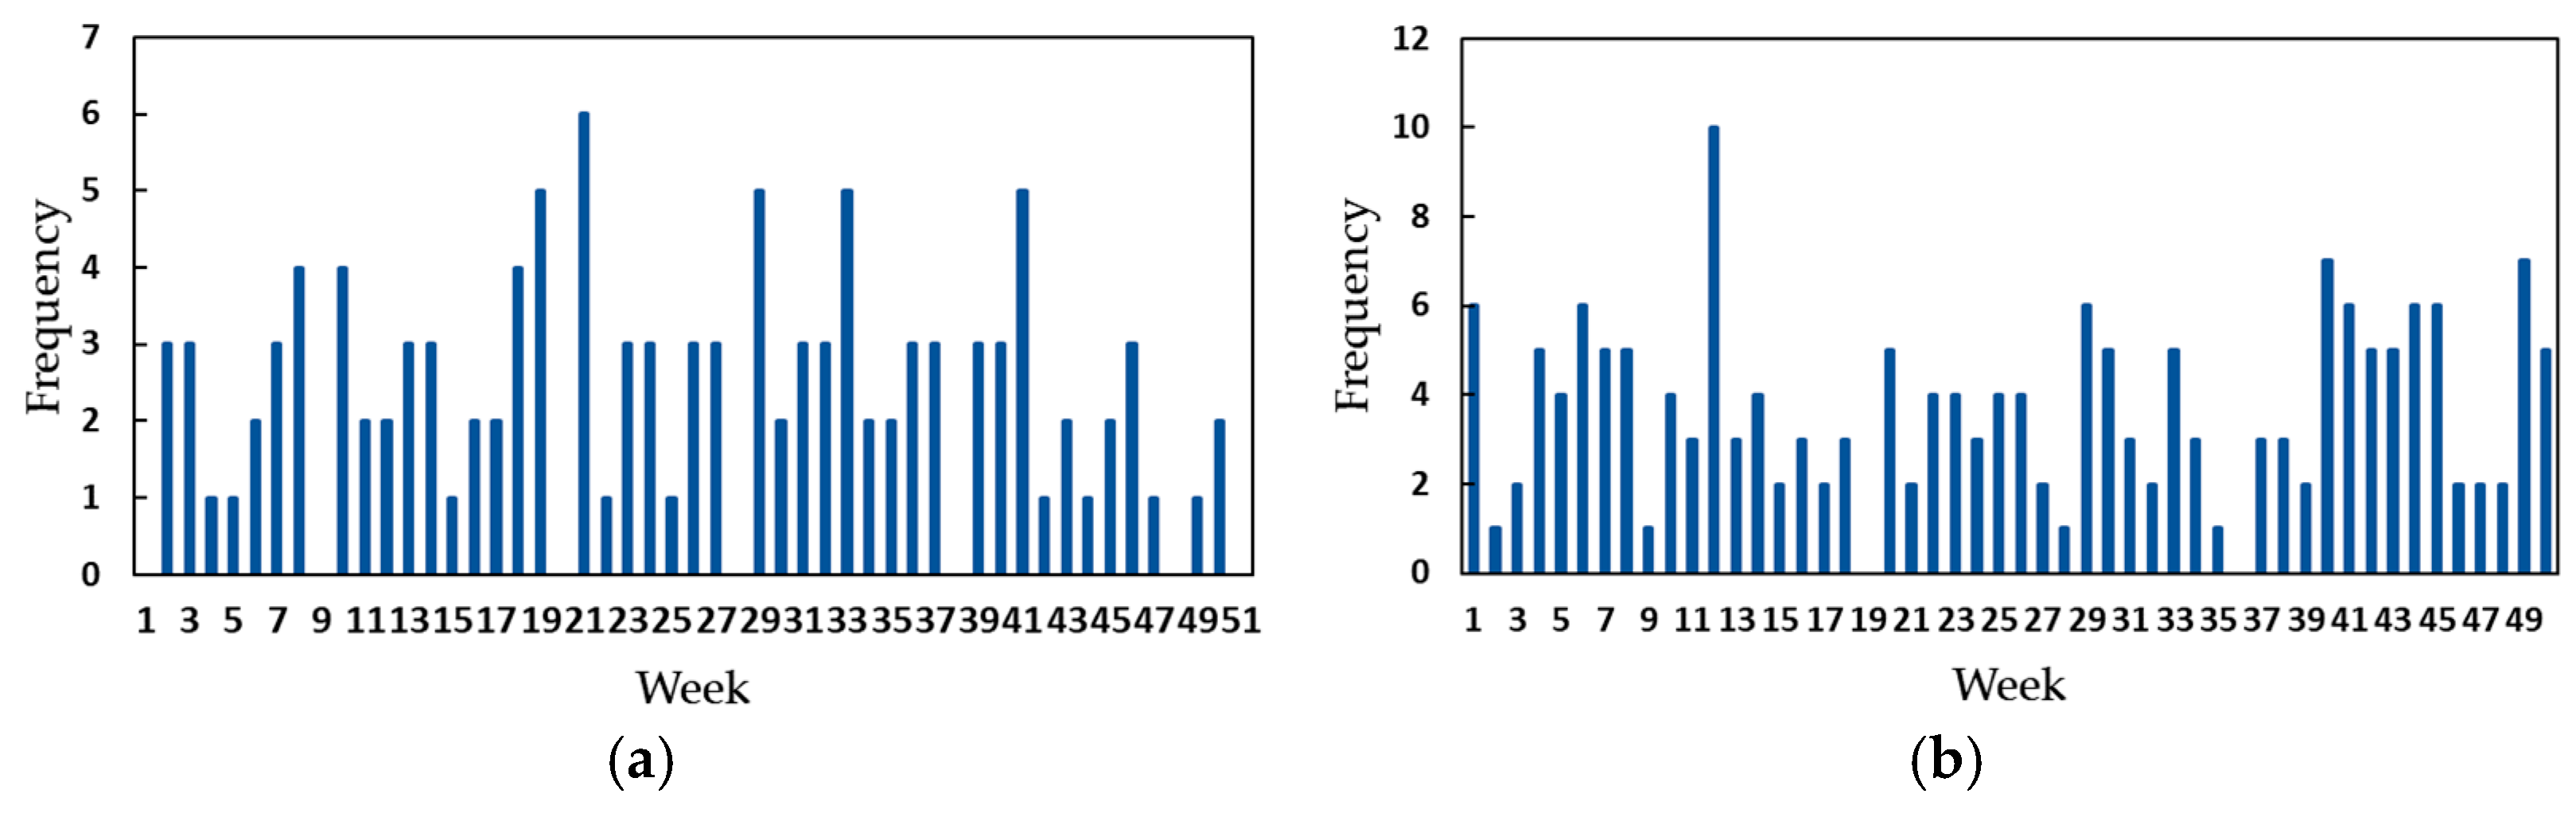
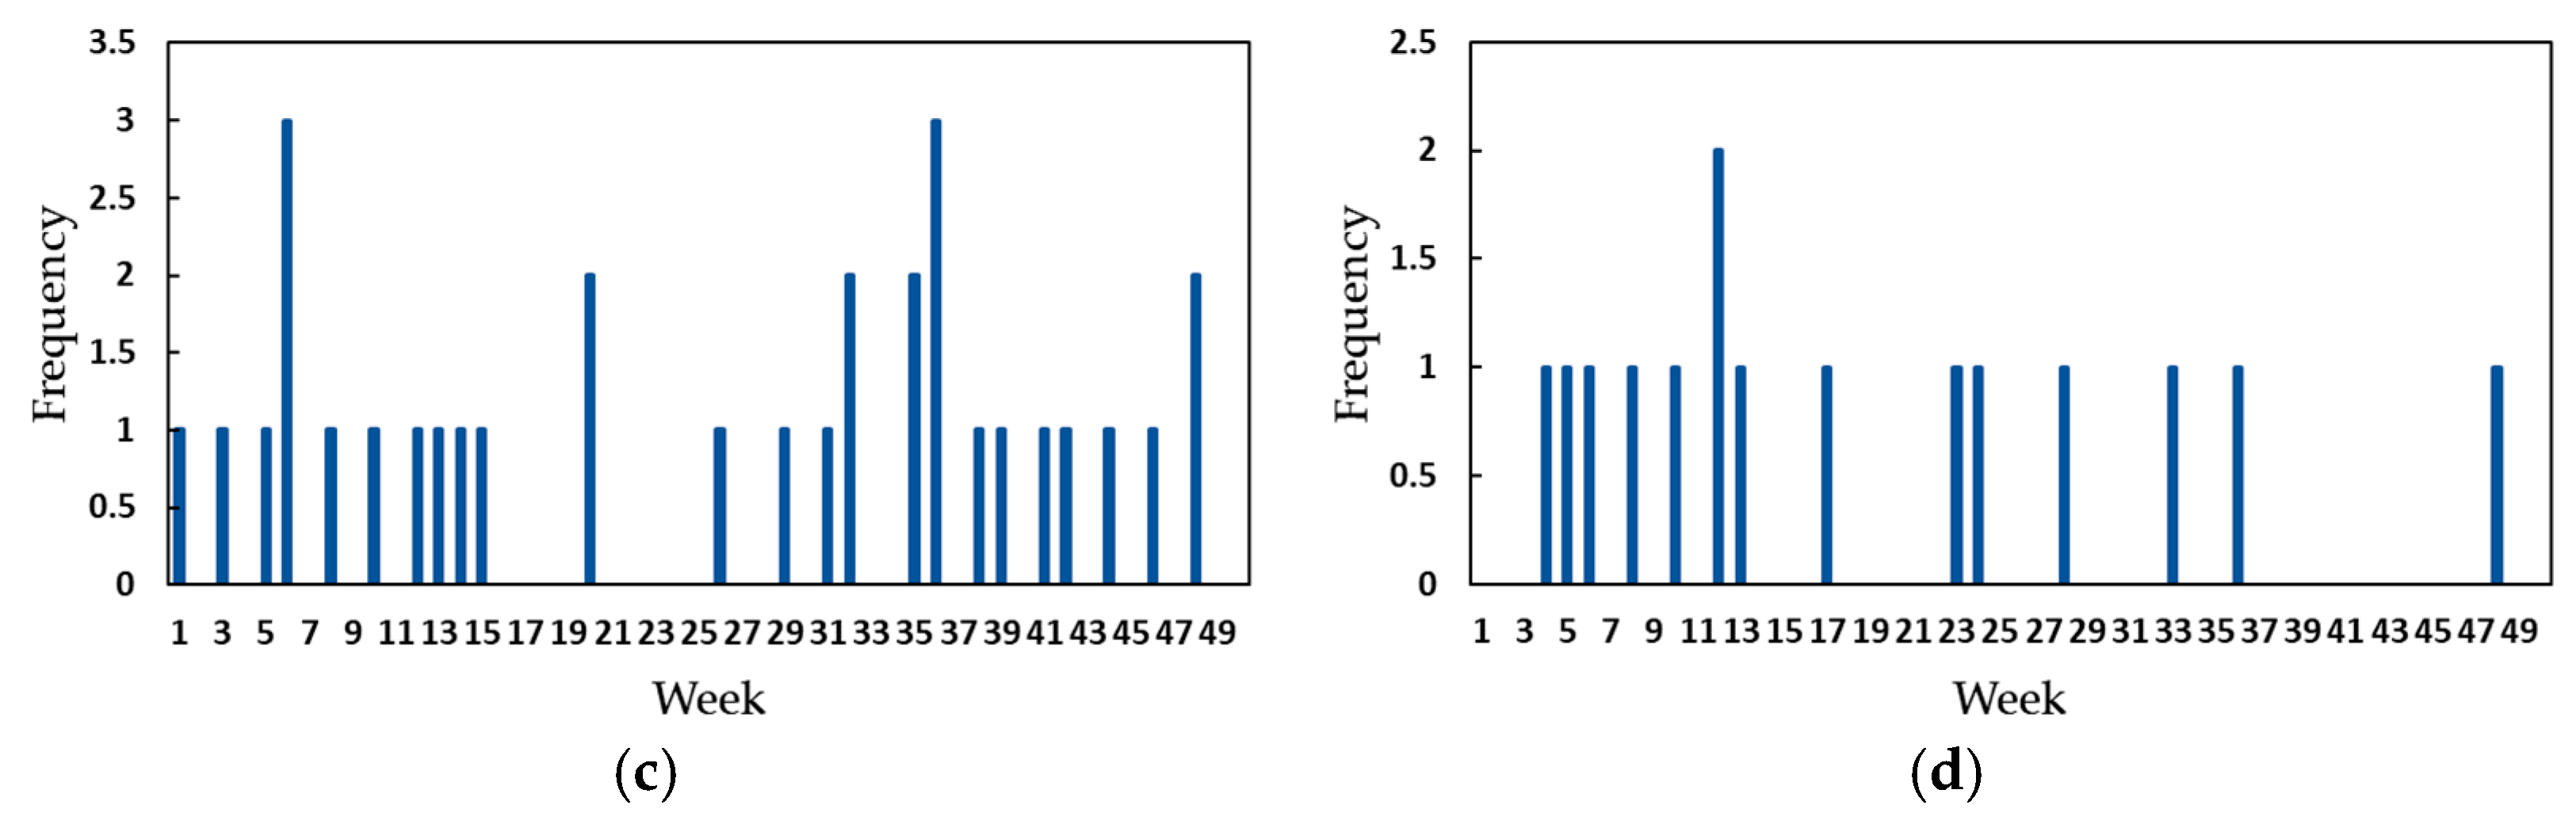
Today, it is common in manufacturing environments to collect historical data on the frequency of failures or to have a plan to track the data. Therefore, a probability distribution function must be used based on historical frequency data to statistically estimate the level of failure occurrence. The frequency data of the top tension subsystem’s failure modes were collected for 50 weeks between 2022 and 2023 (See Figure 6). It should be noted that failure mode FM4 did not occur during the observed period.

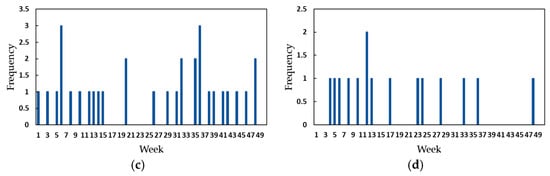
Figure 6.
Failure mode frequencies: (a) large knot, (b) small knot, (c) tensioner out of adjustment and (d) up tension wire.
The frequency of each failure mode determines the average rate of occurrence. The Pareto chart in Figure 7 shows the average failure rates and their corresponding percentages. To simplify the steps of the proposed approach and given that it is the most frequent event in this subsystem, only the FM2 small knot failure mode is used.
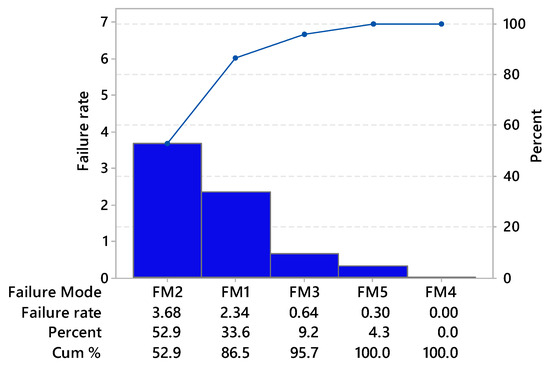
Figure 7.
Pareto diagram.
Occurrence
The Poisson distribution allows us to model the number of times a failure mode occurs in a specific time interval. This type of distribution only considers the parameter . Therefore, it is possible to model the average failure rate in terms of the positive parameter . We state that the random variable has a Poisson distribution with parameter , whose probability function is presented in Equation (2).
Considering the occurrence criterion, we define the parameters as follows:
- Average rate or average number of times a failure mode occurs.
- 2.71828
- the number of occurrences of the failure mode
- = probability of x occurrences in the interval
Table 5 shows the probability values and Poisson parameters for each label (H, M, and L) corresponding to the occurrence event of failure mode FM2.
Table 5.
Probability values—occurrence of FM2.
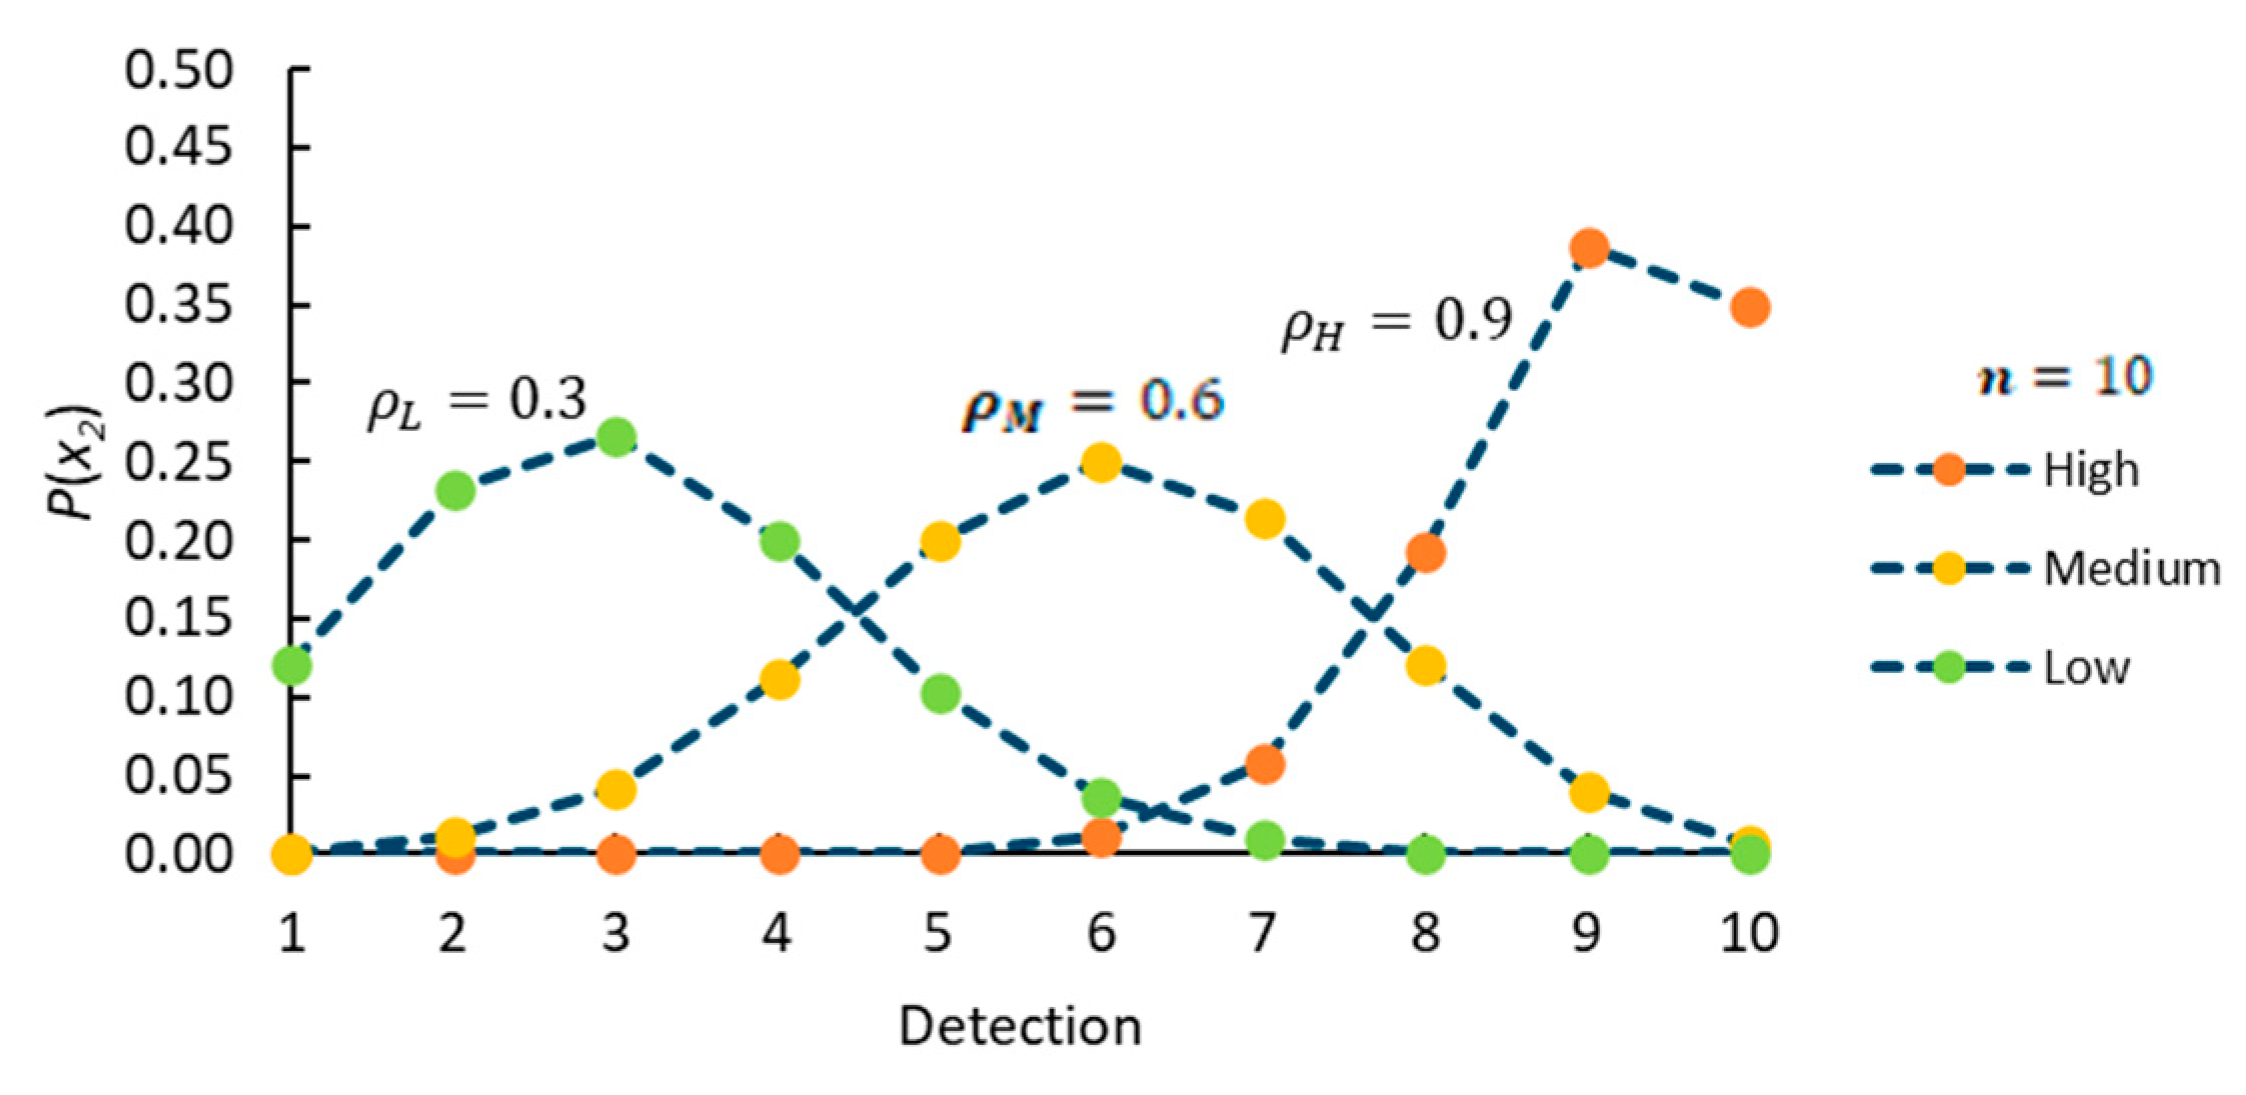
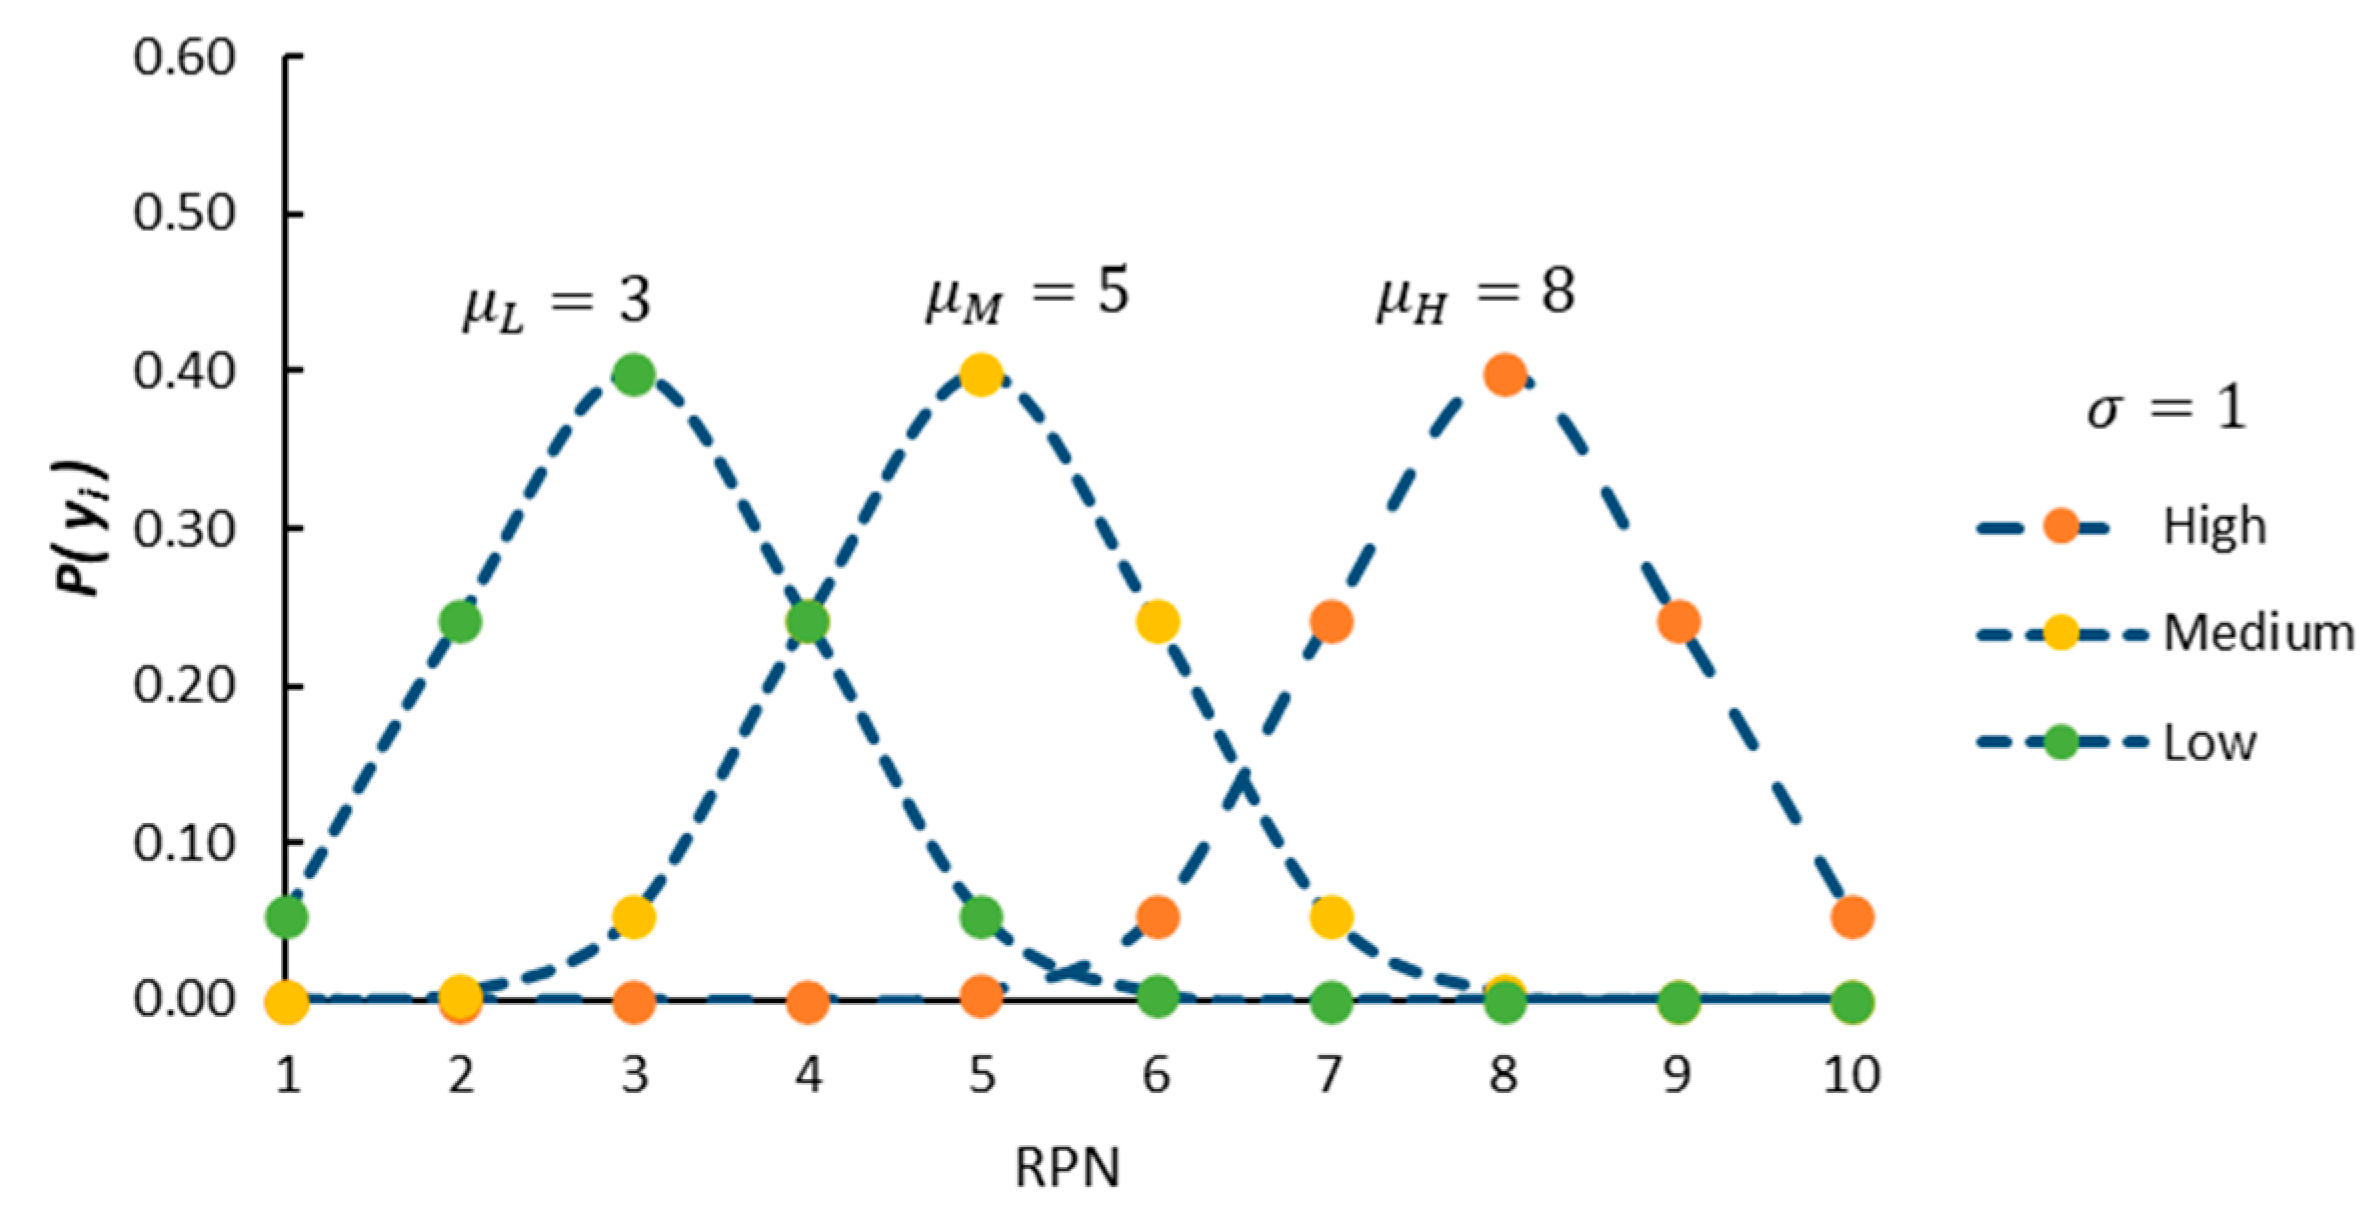
The graphs in Figure 8 present the Poisson Probability Density Function (PDF) corresponding to the occurrence criterion. They also show how the probabilities associated with each label’s occurrence level are distributed. The lines connecting the points are a visual guide and do not indicate continuity. Each value of the discourse universe is associated with the probability of occurrence of the failure mode corresponding to the classified label.
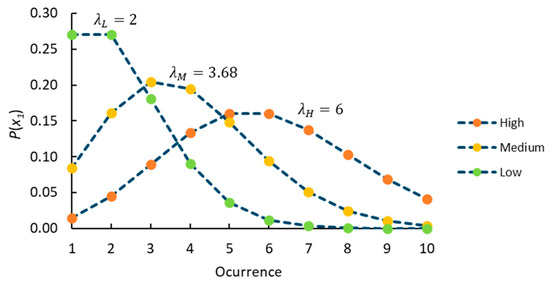
Figure 8.
Poisson PDF—occurrence criterion.
3.5. Assignment
Based on their knowledge, experts evaluate the severity of the effects when a failure mode occurs and the degree to which the existing control detects the failure. These two criteria are modeled through the Binominal probability distribution. In the research by Wu and Wu [22], the authors point out that the severity and detection criteria are evaluated through expert qualification; each evaluation result is a discrete value distributed in the interval [0, 10]. This evaluation result is analogous to the Binomial beta distribution where n = 10. For example, evaluation result 3 is analogous to the success of 3 out of 10 Bernoulli experiments.
Severity and Detection
Considering a discrete random variable, we can use the mathematical formula (See Equation (3)) to calculate the probability of any value for this probability function:
where
- the number of trials
- the probability of success in a trial
- number of successes in n trials
- probability of x successes in n trials
Table 6 presents the probabilities and parameters on each label of the Binomial distribution for the detection event.
Table 6.
Probability values—detection of FM2.
The probabilistic behavior of each label for the detection criterion is shown in the graph in Figure 9.
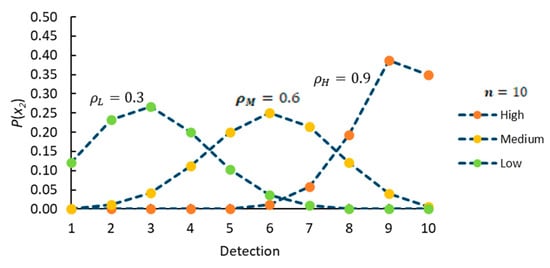
Figure 9.
Binomial FDP—detection criterion.
Finally, Table 7 presents the probabilities for the severity criterion of the FM2 failure mode. The first column shows the range (universe), and the following columns show the parameters used, with the probabilities corresponding to each one listed.
Table 7.
Probability values—severity of FM2.
In Figure 10, we can see the distribution of the probabilities associated with the values at the severity criterion levels. The lines connecting the dots are only visual guides.
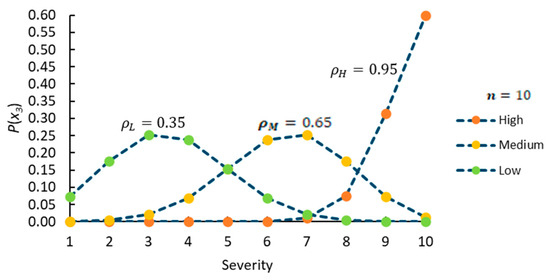
Figure 10.
Binomial FDP—severity criterion.
3.6. Knowledge Base
The knowledge base represents the inference rules with the conventional structure of the if–then type formed by the antecedent part (criterion) and the consequent part (classification). Furthermore, these parts are associated with the degrees of probability corresponding to the different levels of the input variables. The number of rules results from the possible combinations between the number of input variables and the linguistic labels, defining a total of rules. Table 8 shows the rules operated according to Equation (4).
where denotes the probability of the linguistic variables’ occurrence, detection, and severity (, , ), the three levels of linguistic labels are classified as low, medium, and high (, , ).
Table 8.
Fuzzy probabilistic rules.
3.7. Implication and Aggregation
In this step, fuzzy probabilistic inference is carried out through the rules that represent the knowledge of the experts when evaluating the failure mode criteria. The qualitative evaluation carried out by experts is valuable for the knowledge they contribute to decision-making based on their experience. However, it results in subjective and imprecise information. Therefore, the evaluation system proposed in this research treats information with linguistic uncertainty and with stochastic support by incorporating historical evidence of the behavior of the frequency of failure modes through probability distribution functions.
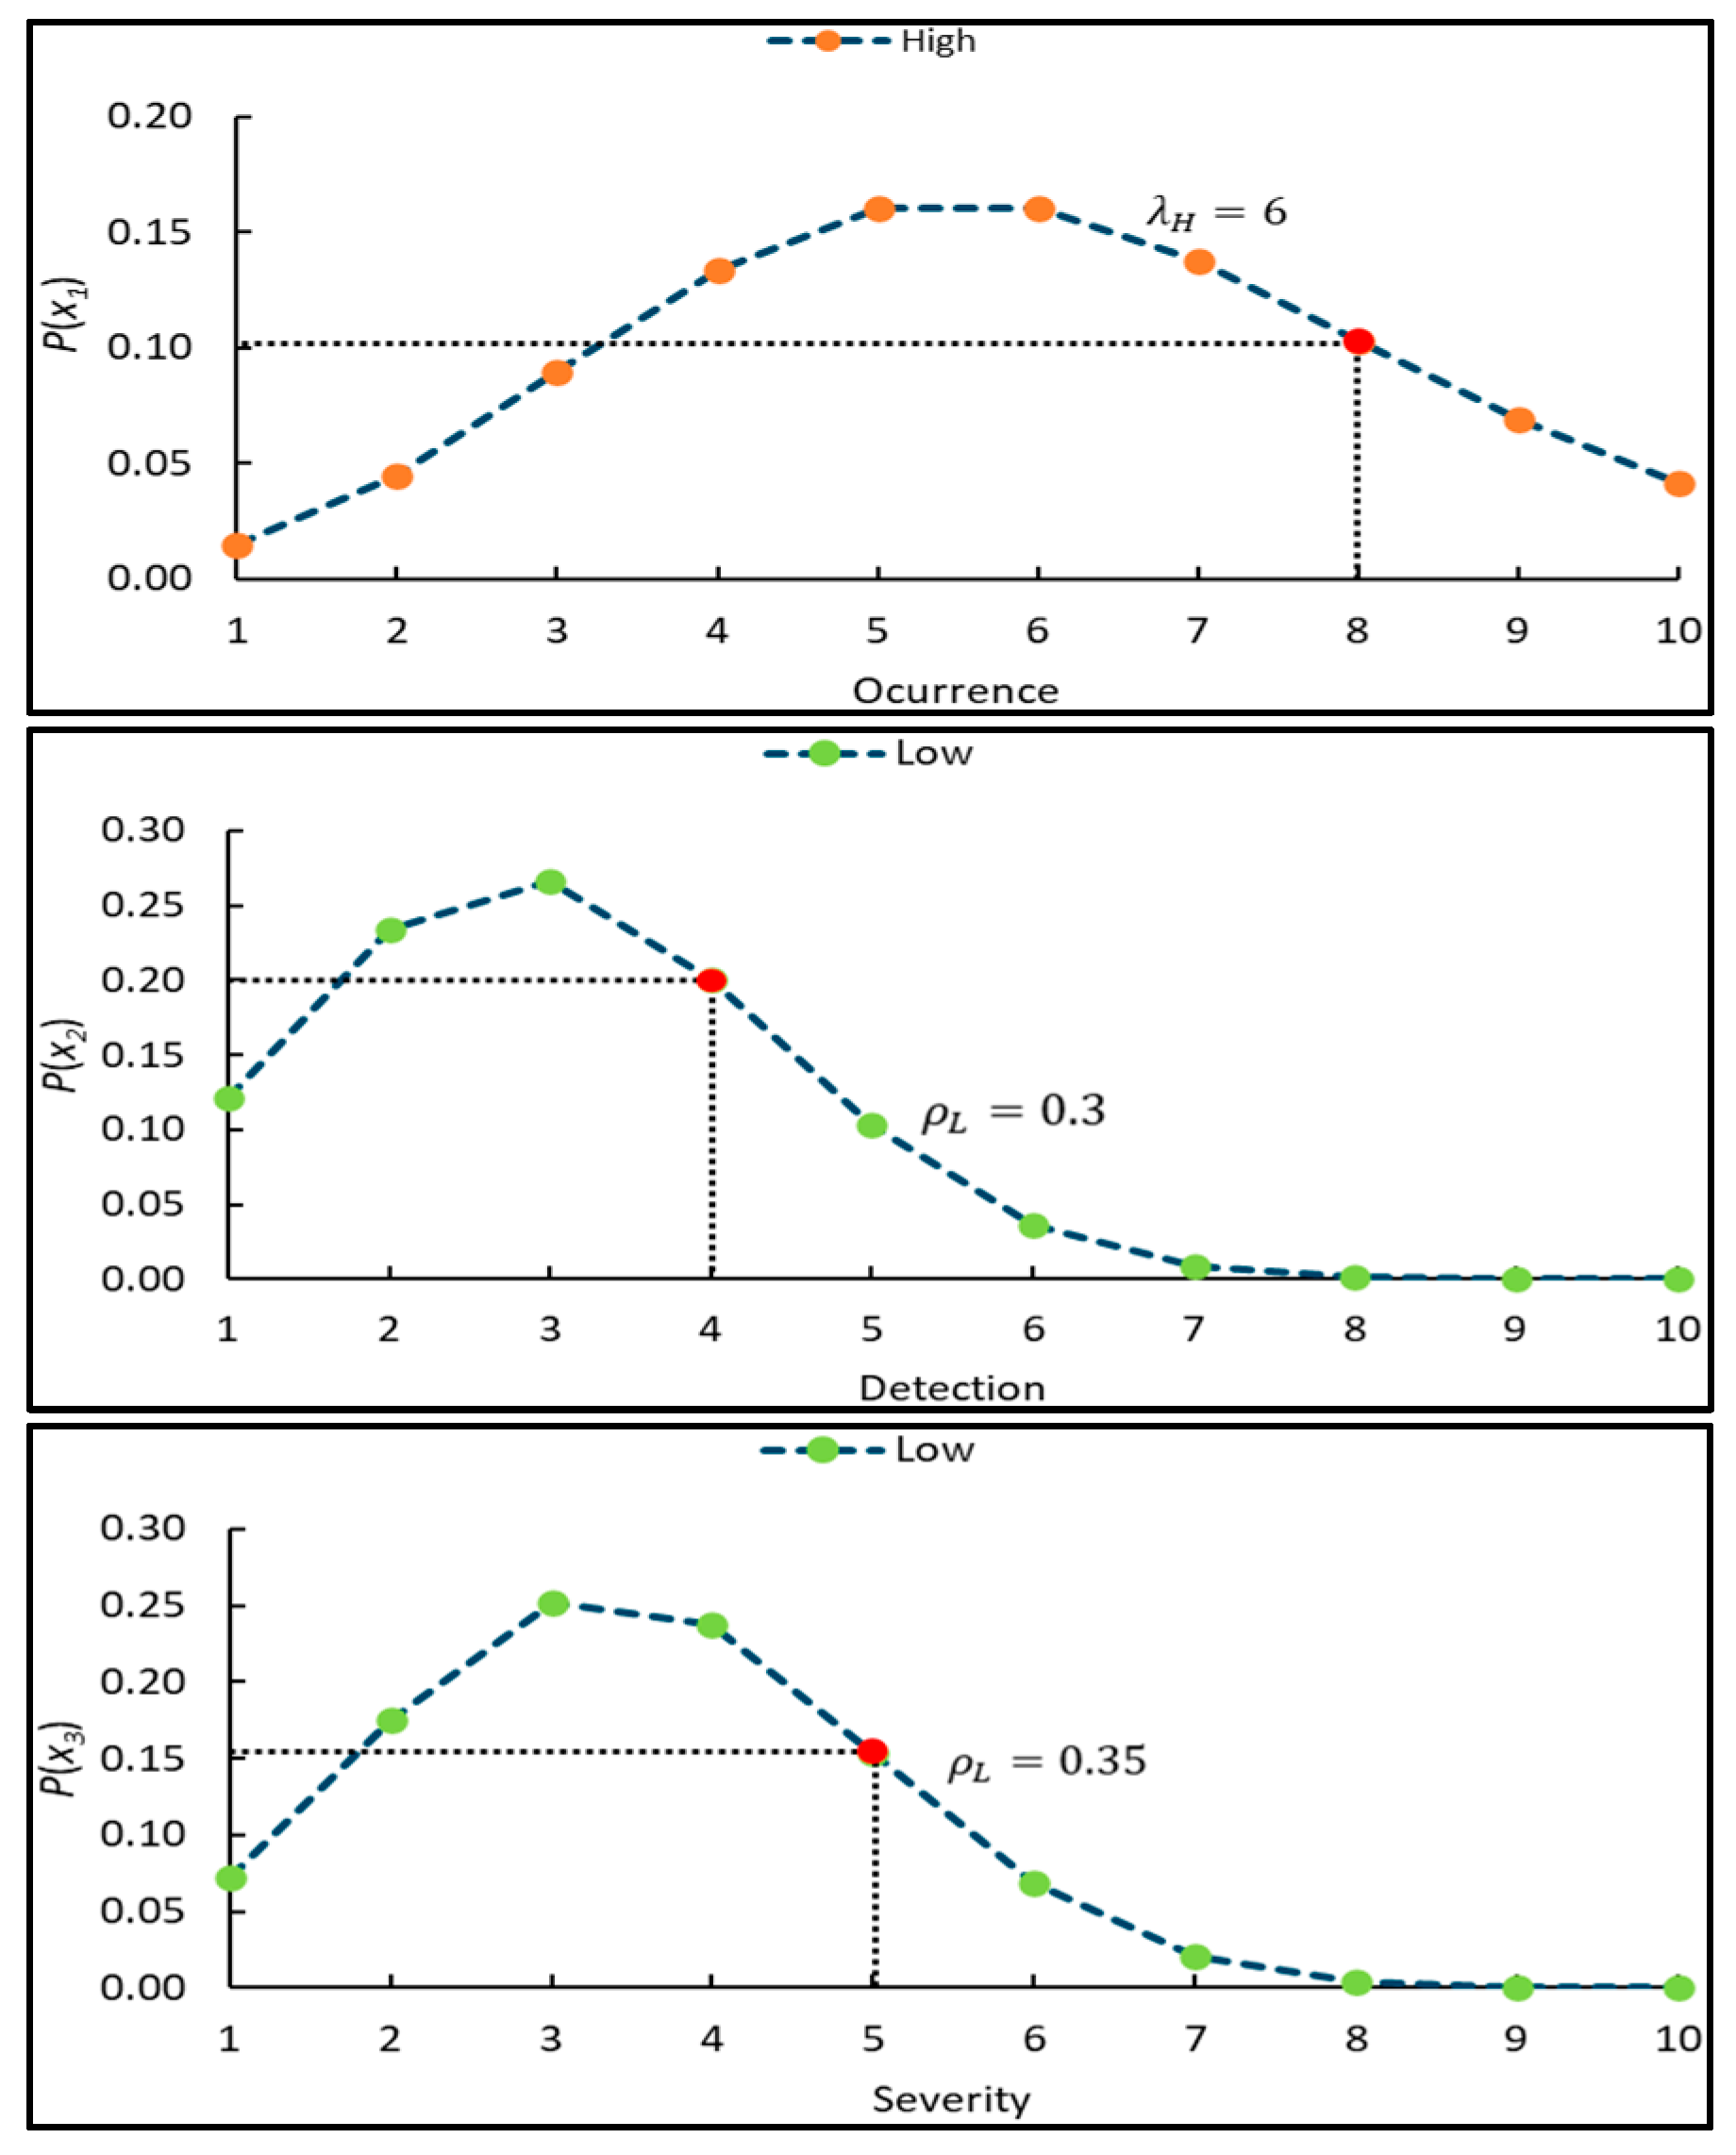
For example, expert E4, when evaluating failure mode FM2, expressed the following in qualitative terms: “Failure mode FM2 has a very high Occurrence, a lower Severity, and a moderate Detection.” Quantitatively, and according to the traditional evaluation criteria (See Table 3), the input linguistic variables have the following values: , , and . The graphs in Figure 11 show the behavior of the probabilities of the three input variables regarding the linguistic labels of the fuzzy probabilistic rule . The red circles indicate the input value location and the associated probability.
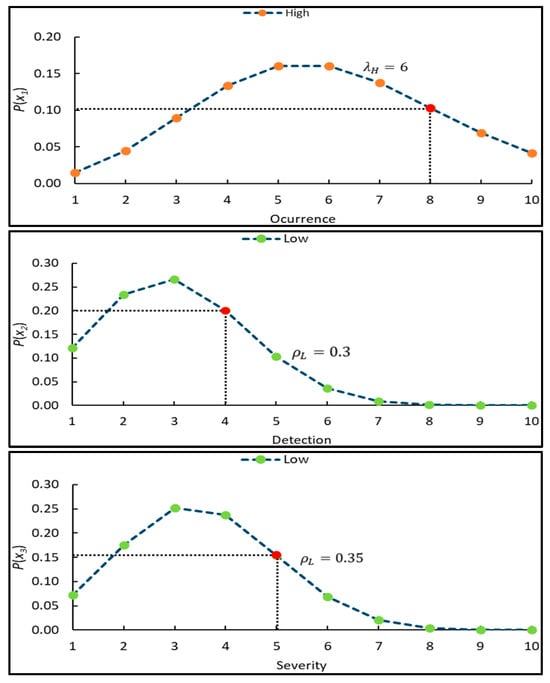
Figure 11.
Rule R9 behavior.
Therefore, the conventional metric for risk classification is . According to these values, for example, the formulation of rule has the following result, as shown in Equation (5).
In the implication process, each rule was operated with the product of the probabilities of the input variables. Therefore, Equation (6) shows the value of the implication for .
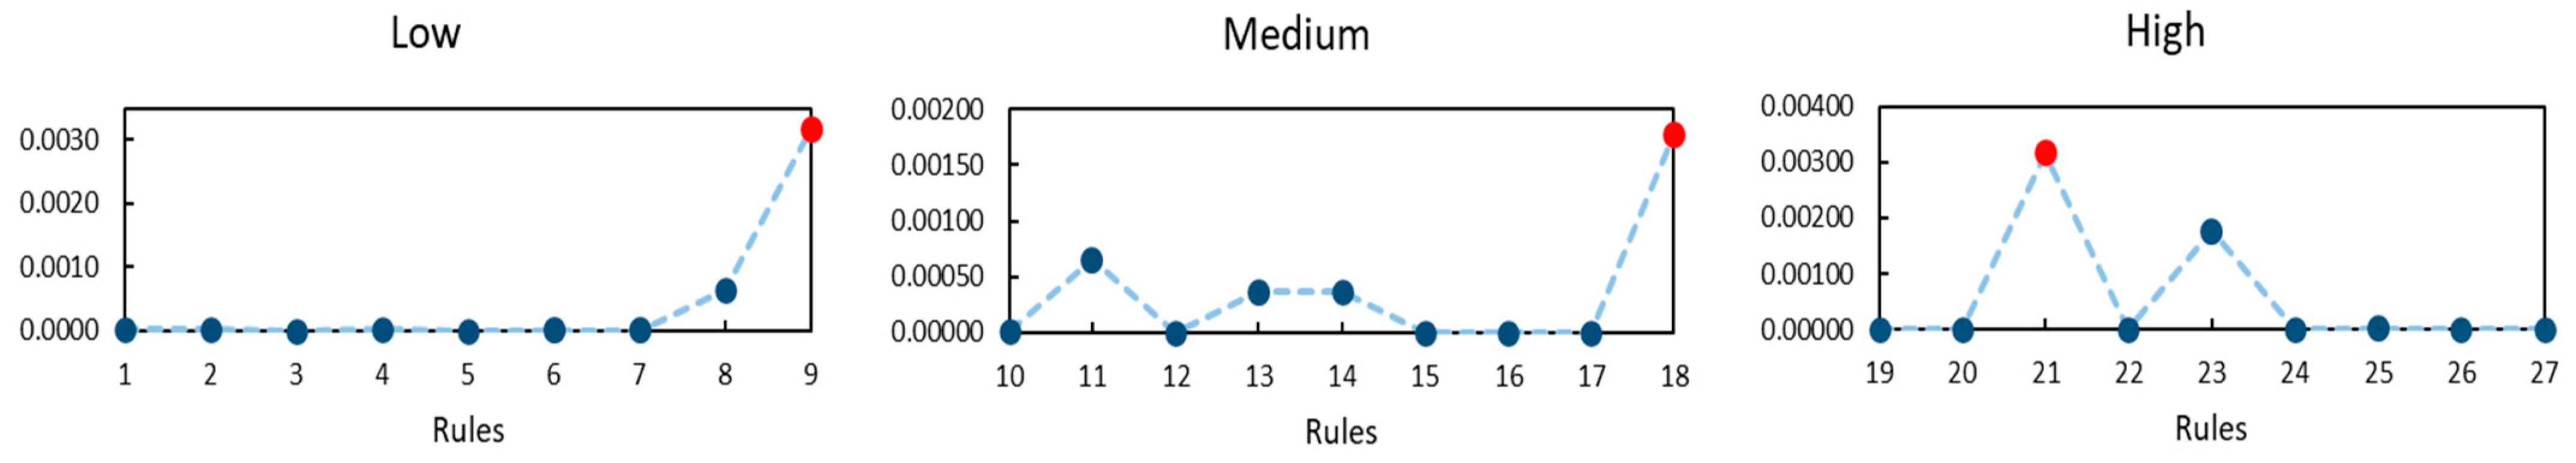
Table 9 contains the implication values for each fuzzy probabilistic inference rule. Likewise, the values of the aggregation process are presented. Based on each rule’s consequence, they were grouped according to the linguistic labels. The maximum operator was used to obtain the value of each group of rules.
Table 9.
Implication and aggregation values.
Figure 12 depicts the values resulting from the implication stage for each rule. Likewise, the maximum value of each group of rules corresponding to the aggregate stage is indicated in red. As shown, for the evaluation of FM2, the maximum values correspond to rules , , and .
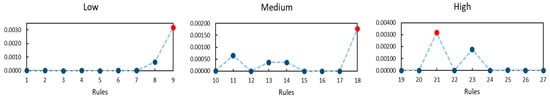
Figure 12.
Aggregation process.
3.8. Defuzzification
This step of the probabilistic fuzzy system allows us to determine the system’s real output, which in this case is the RPN value on a simple scale of 1 to 10 to evaluate the failure mode. For the output variable RPN, the mathematical function that generates the normal probability density function’s “bell curve” shape was used (See Equation (7)).
where
- mean of the random variable
- variance of the random variable
- standard deviation of the random variable
- probability of the random variable
Table 10 presents the probability values for the RPN output variable in its three labels. It also presents the mean and standard deviation parameters for each label.
Table 10.
Probability values—RPN.
Similarly, the graphical representation of the normal probability function is shown in Figure 13.
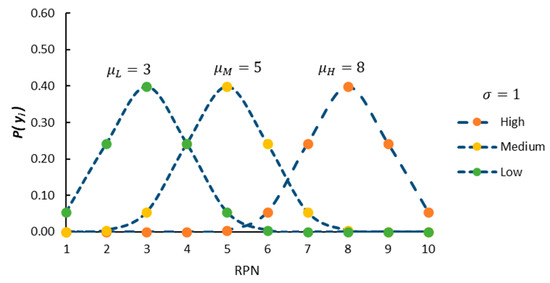
Figure 13.
PDF—normal distribution.
The defuzzification method used was the centroid method (See Equation (8)).
In this method, k is the number of probabilistic fuzzy sets, represents the center of each probabilistic fuzzy set, and is the output of the aggregation stage of each set. Continuing with the example developed, Equation (9) presents the value of the system’s output.
3.9. Simulation Process
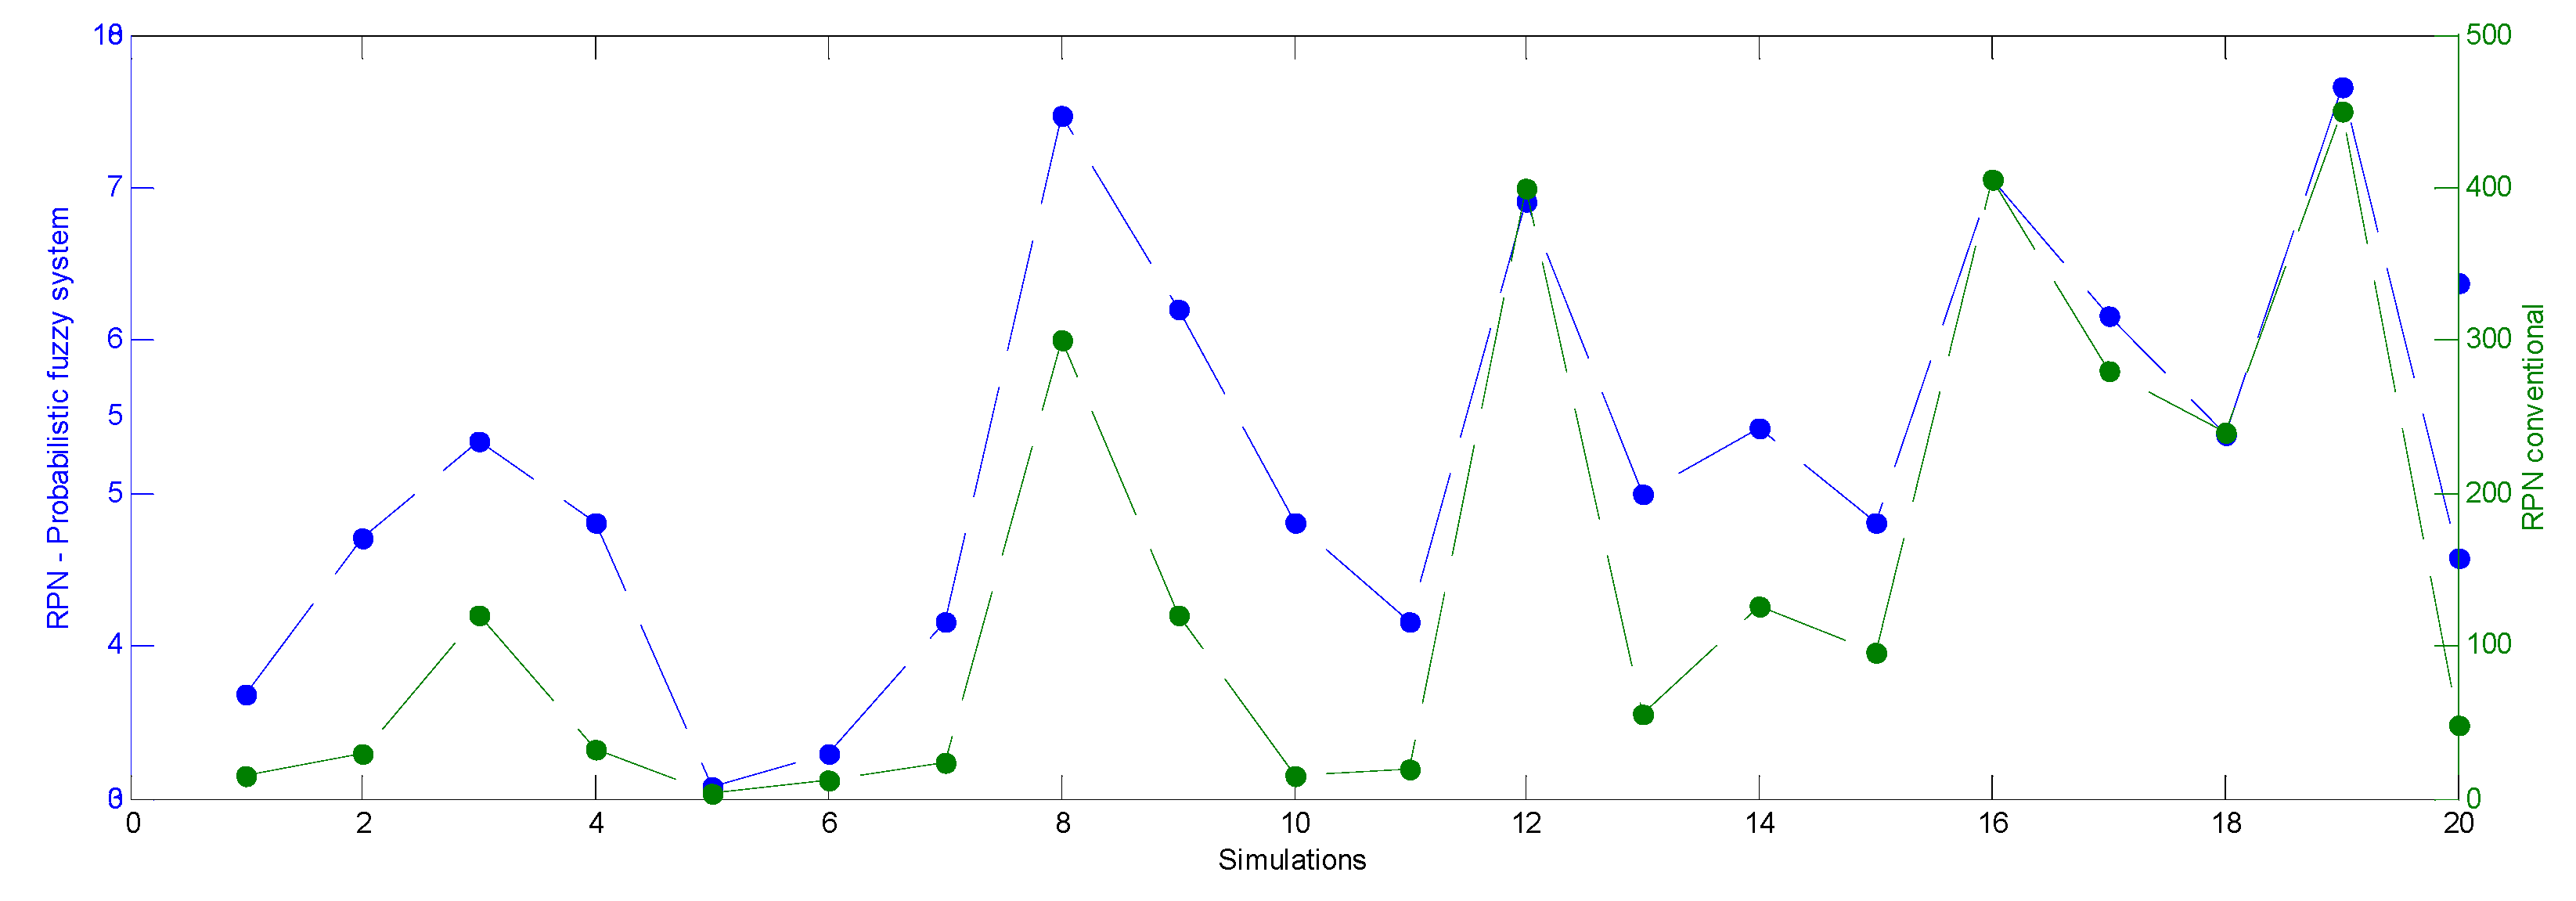
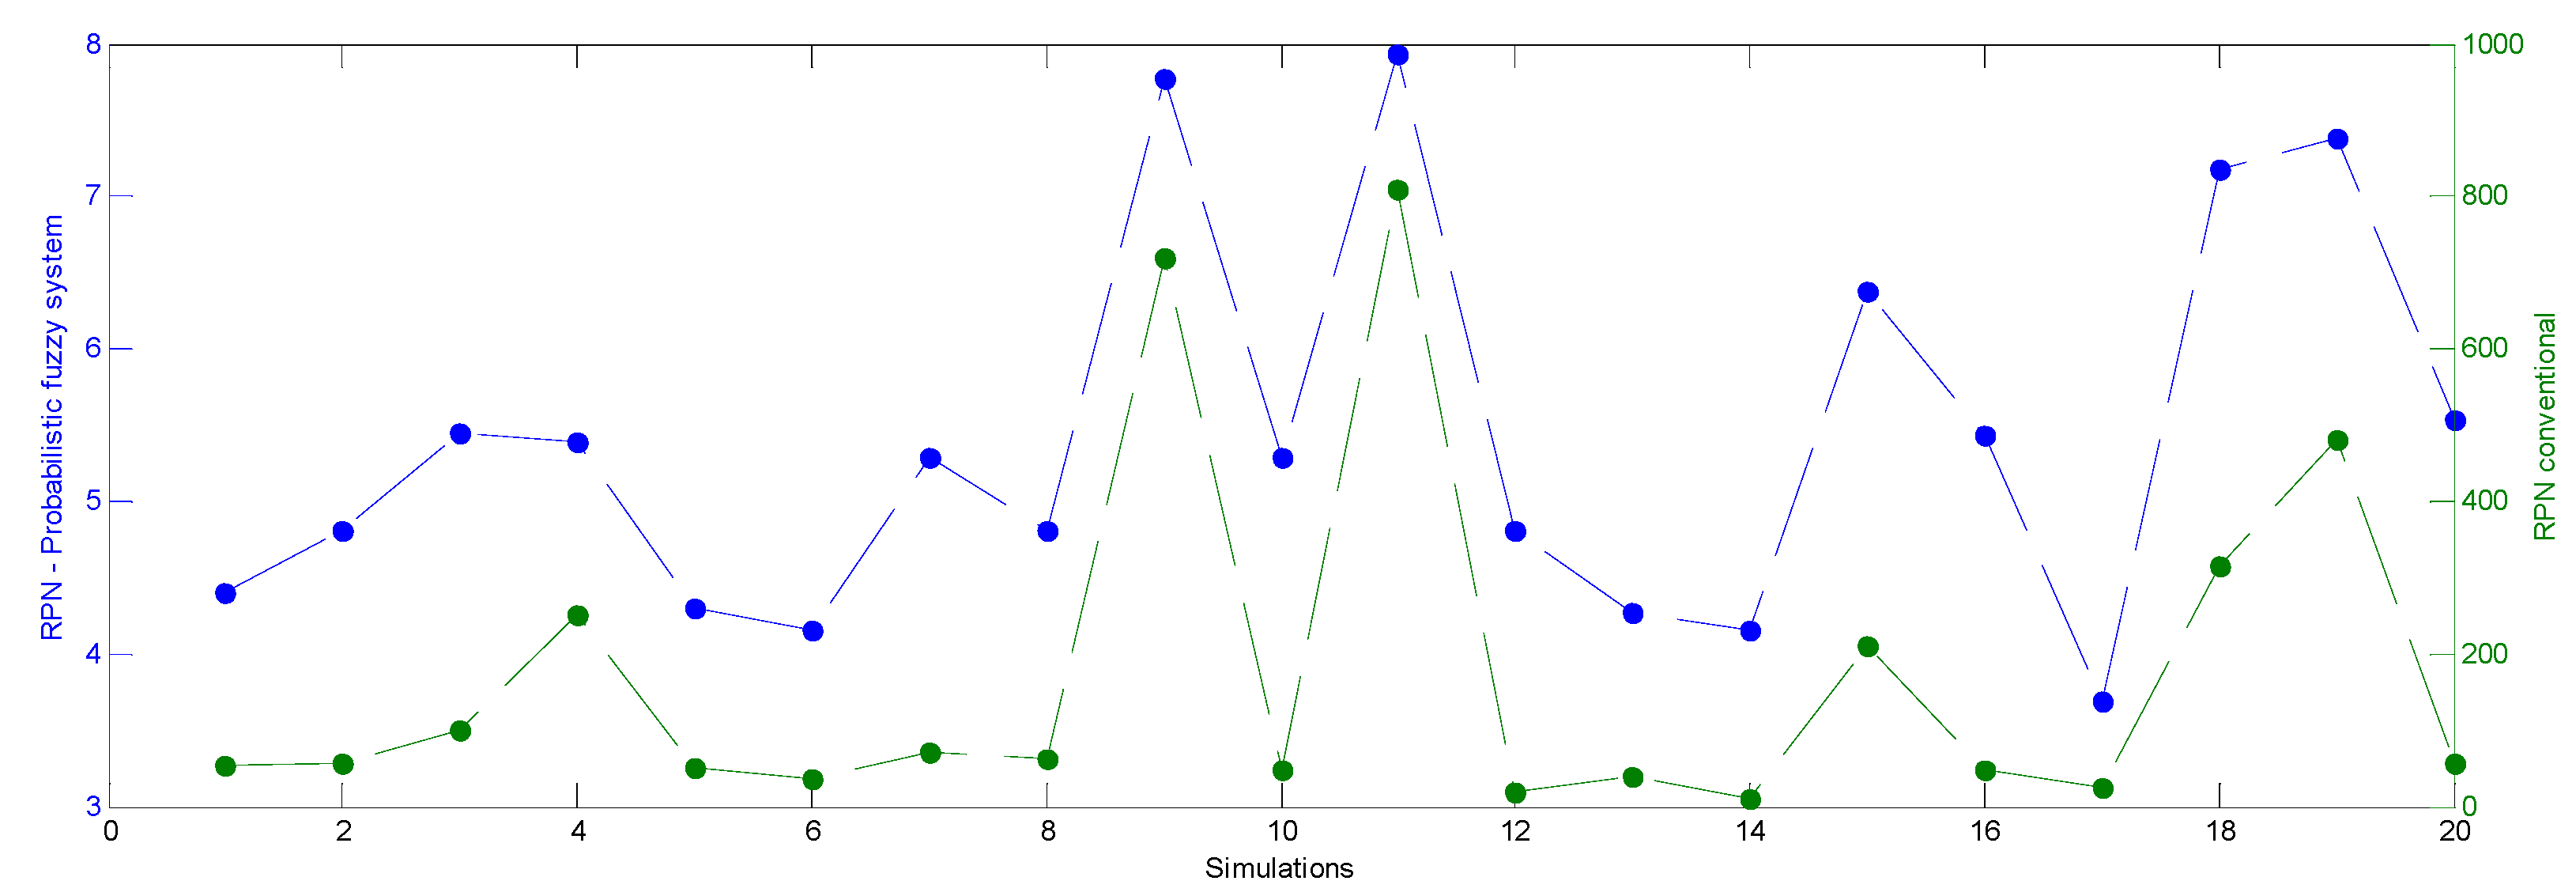
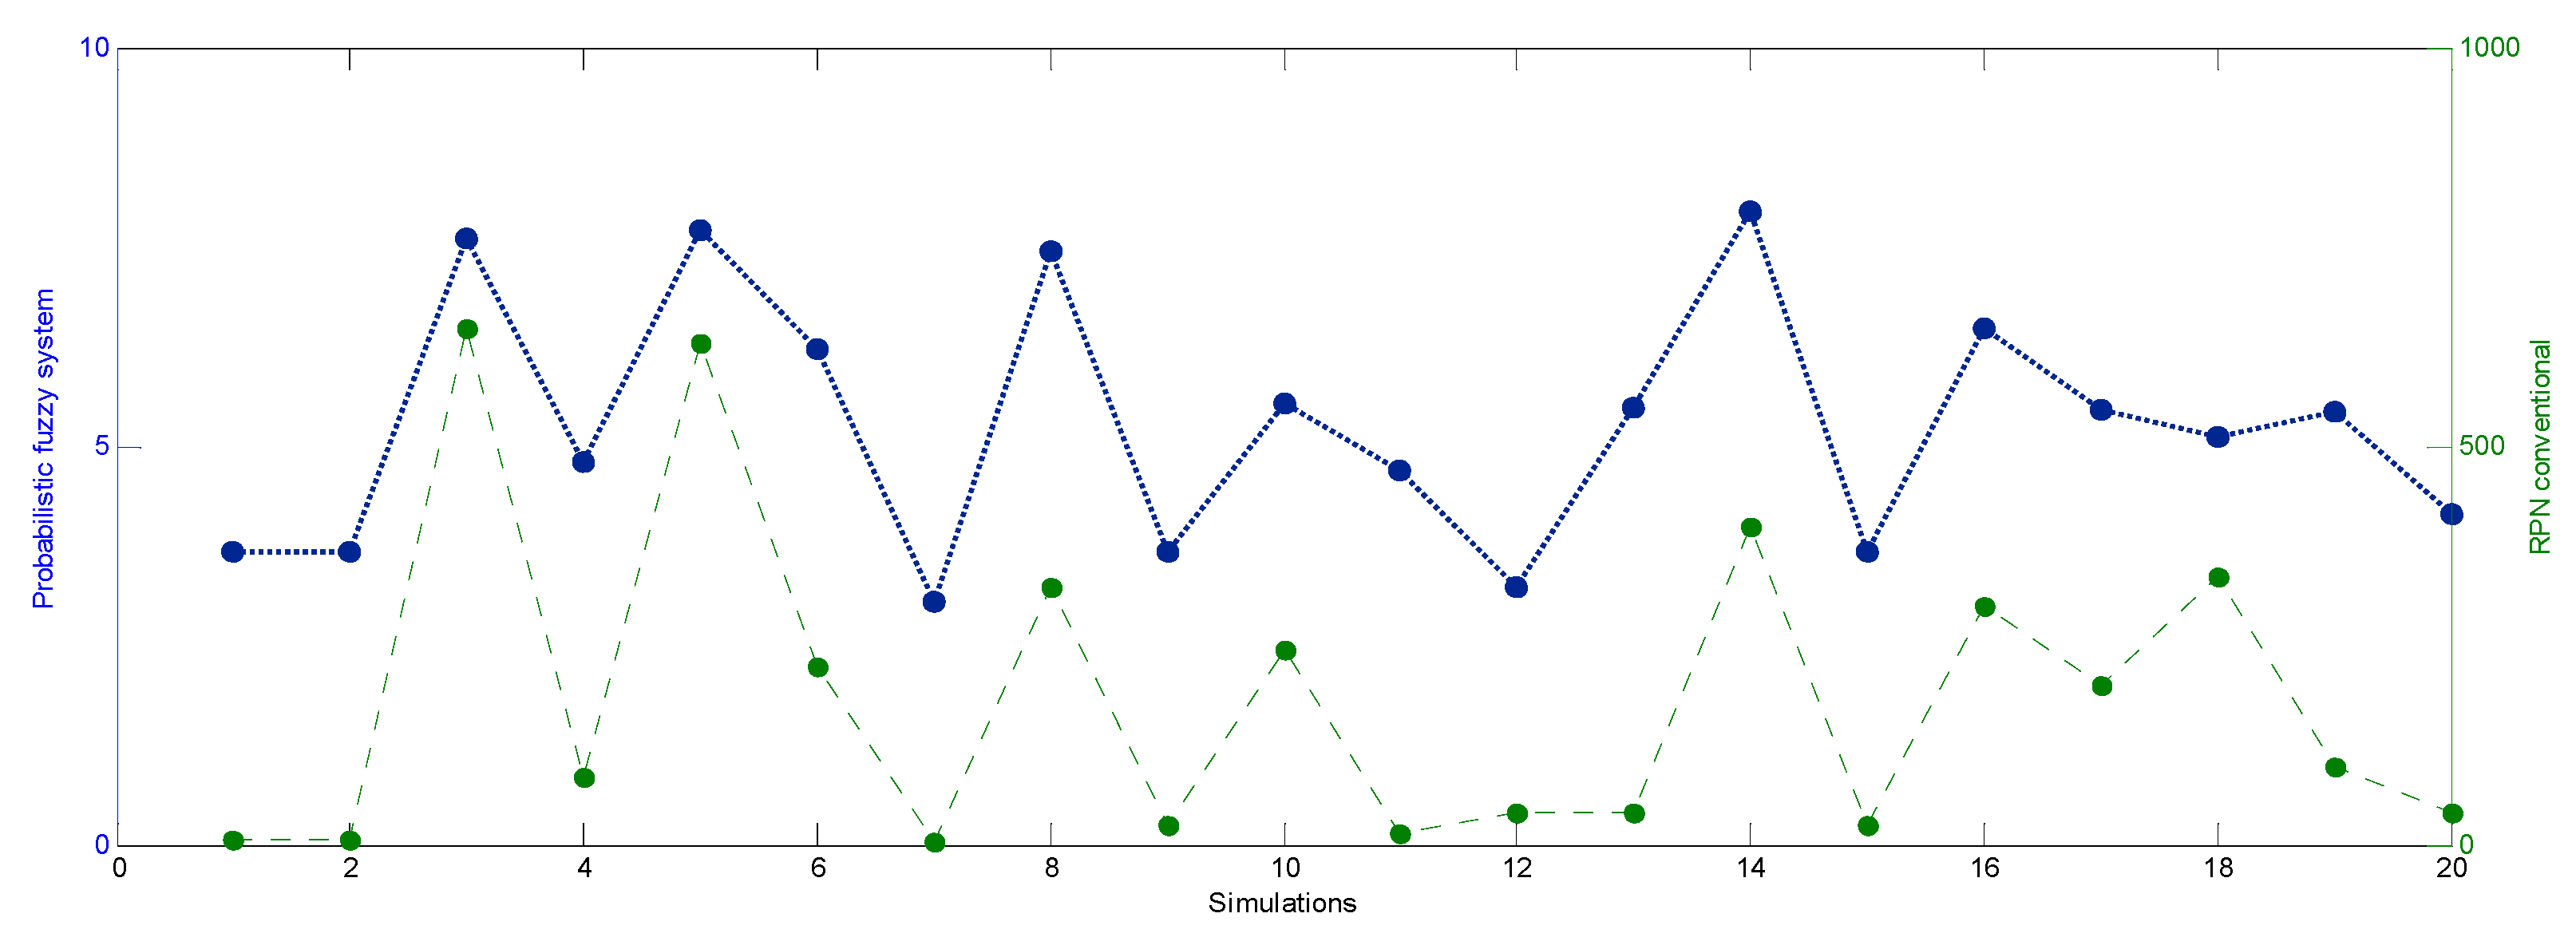
The system’s performance was tested by generating random values in the range [1,10] for each input variable (S, O, and D). Matlab R2014a software was used to create and execute the simulation algorithm of the proposed system. The graphs in Figure 14, Figure 15 and Figure 16 show a comparison of the evaluation behavior of three groups of simulations with 20 evaluations each. The scale of the output value of the probabilistic fuzzy system is from 1 to 10; in the case of the conventional RPN values, they are in the commonly used range of 1 to 1000.
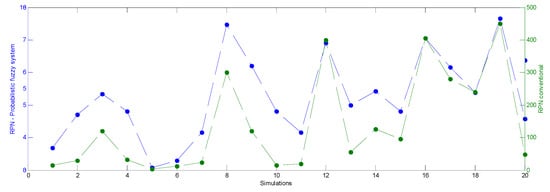
Figure 14.
Simulation—first group with 20 evaluations.
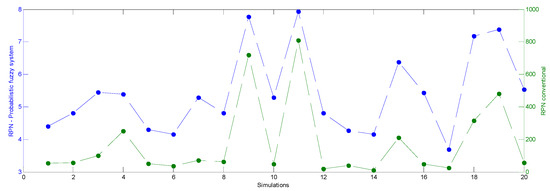
Figure 15.
Simulation—second group with 20 evaluations.
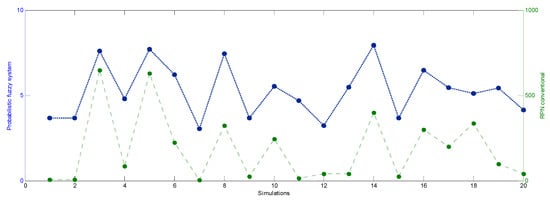
Figure 16.
Simulation—third group with 20 evaluations.
As we can see in the three groups of simulations, the behavior between the conventional evaluation with the RPN and the system’s evaluation is similar in most cases. Therefore, the proposed system with fuzzy probabilistic support reliably and robustly classifies a failure mode. Furthermore, its classification is more straightforward and easily interpretable.
3.10. Classification
Each expert team member expressed their opinion regarding the occurrence, severity, and detection factors to evaluate the risk represented by failure mode FM2 in the top tension subsystem (See Table 11). The opinions in numerical form were established as input values for each of the three expert systems.
Table 11.
Evaluation of FM2 failure mode.
Additionally, to reconcile the multiple opinions, a group assignment was generated to reduce the uncertainty associated with the estimates of the expert team members. This assignment is determined as the overall ranking. Therefore, the FM2 failure mode (small knot) rating is 5.3908. The evaluation system proposed in this research supports decision-making through consensus and integrates the environments of linguistic and stochastic uncertainty.
The graph in Figure 17 compares the behavior of the assignments using the conventional RPN and the classification generated by the probabilistic fuzzy system. Ranking among experts is compared to group assignment. The scale of the proposed system is in an easily interpretable range [1,2,3,4,5,6,7,8,9,10]. Additionally, for contrast, the results of the proposed approach are compared with the method reported in the literature by [33], which uses a fuzzy approach. This shows that the proposed system generates a reliable group classification with behavior similar to that of the conventional RPN and that reported in the literature.
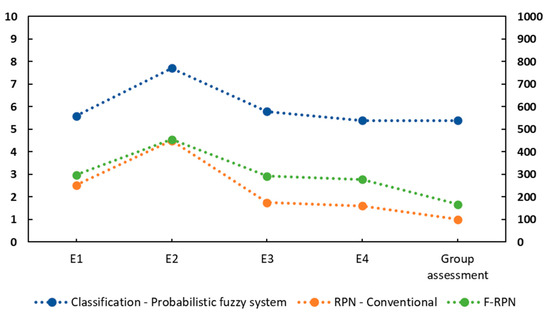
Figure 17.
Behavior—FM2 failure classification.
4. Discussion
Mitigating and reducing potential failures in a manufacturing system are among the topics under constant study and continuous improvement through various methods, mainly because the final objective is to ensure the system’s reliability and reduce maintenance costs, work risks, and waiting times. By achieving this objective, companies can obtain a higher level of competitiveness. During the implementation of the FMEA technique, the evaluation stage stands out for its importance in prioritizing failure modes; this stage determines how decisions are made to ensure the system’s reliability.
Unlike other studies, which propose novel methods to treat information with linguistic uncertainty during the evaluation stage, the present study proposes an evaluation system that integrates information with linguistic and stochastic uncertainty. The proposed system allows individual evaluation of the failure modes detected in the analysis phase. The conventional and qualitative evaluation is transformed into an evaluation with probabilistic support, considering historical evidence. The above strengthens the system design, since unique distribution functions are developed for each failure mode based on its real frequency. Therefore, the occurrence criterion does not depend exclusively on the expert’s experience but is complemented by historical data to offer a robust tool for decision-making.
The RPN metric is easily obtained by calculating the product of the three criteria; however, one of its shortcomings is that different combinations of criteria O, D, and S produce the same value. This can lead to entirely different failure modes being classified similarly. Therefore, it is highlighted that by individually analyzing the frequency of each failure mode, the evaluation system proposed in this research allows us to overcome the characteristic deficiency of conventional RPN by realistically classifying different failures on a stochastic basis.
We highlight some limitations. The same Binomial distribution function is used for the severity and detection factors. However, in future work, it will be possible to use the Weibull distribution function for the detection factor to associate the reliability of the machine components. Likewise, the Beta distribution can be used for the severity factor. This will allow us to obtain better results. The use of a total of 27 rules in the knowledge base is also considered to be a limitation. However, subsequent research integrating a rule-reduction technique is currently under consideration.
5. Conclusions
It is essential that the implementation of the FMEA technique includes a risk evaluation system that realistically classifies the potential failure modes that violate the reliability of the systems. In the present research, both linguistic and stochastic uncertainty conditions were integrated. The frequency rates of failure modes were analyzed during a period of operation of the textile machinery. In this way, the occurrence criterion is associated with the Poisson probability distribution function, and the Binomial distribution function is used for the detection and severity criteria. The evaluation system was developed using a Mamdani-type model. The system was tested and validated using the simulation process with the participation of the expert team. The failure modes of knitting machines’ first top tension subsystem were analyzed. This analysis made it possible to offer decision-makers a robust and reliable tool to generate risk mitigation and elimination actions in each of the eight subsystems of textile machinery. Considering possible areas for improvement in the present study, the probabilistic fuzzy system’s performance will be improved to increase convergence. Additionally, the system will be developed with a Bayesian approach and integrate different probability distribution functions for the factors in future work.
Author Contributions
Conceptualization, R.B.-S.; methodology, J.J.C.-O. and R.B.-S.; validation, J.J.C.-O. and R.B.-S.; formal analysis, R.B.-S.; investigation, J.J.C.-O.; resources, J.J.C.-O.; data curation, J.J.C.-O. and R.B.-S.; writing—original draft preparation, J.J.C.-O. and R.B.-S.; writing—review and editing, J.J.C.-O. and R.B.-S. All authors have read and agreed to the published version of the manuscript.
Funding
This research received no external funding.
Data Availability Statement
The data presented in this study are available on request from the corresponding author.
Conflicts of Interest
The authors declare no conflicts of interest.
References
- Jahangoshai, M.; Yousefi, S.; Valipour, M.; Dehdar, M.M. Risk Analysis of Sequential Processes in Food Industry Integrating Multi-Stage Fuzzy Cognitive Map and Process Failure Mode and Effects Analysis. Comput. Ind. Eng. 2018, 123, 325–337. [Google Scholar] [CrossRef]
- Jin, C.; Ran, Y.; Zhang, G. Interval-Valued q-Rung Orthopair Fuzzy FMEA Application to Improve Risk Evaluation Process of Tool Changing Manipulator. Appl. Soft Comput. 2021, 104, 107192. [Google Scholar] [CrossRef]
- Kalathil, M.J.; Renjith, V.R.; Augustine, N.R. Failure Mode Effect and Criticality Analysis Using Dempster Shafer Theory and Its Comparison with Fuzzy Failure Mode Effect and Criticality Analysis: A Case Study Applied to LNG Storage Facility. Process Saf. Environ. Prot. 2020, 138, 337–348. [Google Scholar] [CrossRef]
- Godina, R.; Silva, B.G.R.; Espadinha-Cruz, P. A DMAIC Integrated Fuzzy FMEA Model: A Case Study in the Automotive Industry. Appl. Sci. 2021, 11, 3726. [Google Scholar] [CrossRef]
- Liu, H.-C.; Chen, X.-Q.; Duan, C.-Y.; Wang, Y.-M. Failure Mode and Effect Analysis Using Multi-Criteria Decision Making Methods: A Systematic Literature Review. Comput. Ind. Eng. 2019, 135, 881–897. [Google Scholar] [CrossRef]
- Huang, J.; You, J.-X.; Liu, H.-C.; Song, M.-S. Failure Mode and Effect Analysis Improvement: A Systematic Literature Review and Future Research Agenda. Reliab. Eng. Syst. Saf. 2020, 199, 106885. [Google Scholar] [CrossRef]
- Wan, C.; Yan, X.; Zhang, D.; Qu, Z.; Yang, Z. An Advanced Fuzzy Bayesian-Based FMEA Approach for Assessing Maritime Supply Chain Risks. Transp. Res. Part E Logist. Transp. Rev. 2019, 125, 222–240. [Google Scholar] [CrossRef]
- Zhang, H.; Dong, Y.; Palomares-Carrascosa, I.; Zhou, H. Failure Mode and Effect Analysis in a Linguistic Context: A Consensus-Based Multiattribute Group Decision-Making Approach. IEEE Trans. Rel. 2019, 68, 566–582. [Google Scholar] [CrossRef]
- Di Nardo, M.; Murino, T.; Osteria, G.; Santillo, L.C. A New Hybrid Dynamic FMECA with Decision-Making Methodology: A Case Study in an Agri-Food Company. ASI 2022, 5, 45. [Google Scholar] [CrossRef]
- Kahneman, D. Thinking, Fast and Slow, 1st ed.; Farrar, Straus and Giroux: New York, NY, USA, 2013. [Google Scholar]
- Akbarzadeh-T, M.-R.; Bemani-N, A. Probabilistic Fuzzy Systems, Expressions and Approaches. In Proceedings of the 2015 4th Iranian Joint Congress on Fuzzy and Intelligent Systems (CFIS), Zahedan, Iran, 9–11 September 2015; IEEE: Zahedan, Iran, 2015; pp. 1–6. [Google Scholar] [CrossRef]
- Yigin, B.; Celik, M. A Prescriptive Model for Failure Analysis in Ship Machinery Monitoring Using Generative Adversarial Networks. J. Mar. Sci. Eng. 2024, 12, 493. [Google Scholar] [CrossRef]
- Testik, O.M.; Unlu, E.T. Fuzzy FMEA in Risk Assessment for Test and Calibration Laboratories. Qual. Reliab. Eng. 2023, 39, 575–589. [Google Scholar] [CrossRef]
- Ilczuk, P.; Kycko, M. Risk Assessment in the Design of Railroad Control Command and Signaling Devices Using Fuzzy Sets. Appl. Sci. 2023, 13, 12460. [Google Scholar] [CrossRef]
- Goksu, S.; Arslan, O. A Quantitative Dynamic Risk Assessment for Ship Operation Using the Fuzzy FMEA: The Case of Ship Berthing/Unberthing Operation. Ocean. Eng. 2023, 287, 115548. [Google Scholar] [CrossRef]
- Cruz-Rivero, L.; Méndez-Hernández, M.L.; Mar-Orozco, C.E.; Aguilar-Lasserre, A.A.; Barbosa-Moreno, A.; Sánchez-Escobar, J. Functional Evaluation Using Fuzzy FMEA for a Non-Invasive Measurer for Methane and Carbone Dioxide. Symmetry 2022, 14, 421. [Google Scholar] [CrossRef]
- Ribas, J.R.; Severo, J.C.R.; Guimarães, L.F.; Perpetuo, K.P.C. A Fuzzy FMEA Assessment of Hydroelectric Earth Dam Failure Modes: A Case Study in Central Brazil. Energy Rep. 2021, 7, 4412–4424. [Google Scholar] [CrossRef]
- Alizadeh, S.S.; Solimanzadeh, Y.; Mousavi, S.; Safari, G.H. Risk Assessment of Physical Unit Operations of Wastewater Treatment Plant Using Fuzzy FMEA Method: A Case Study in the Northwest of Iran. Environ. Monit. Assess. 2022, 194, 609. [Google Scholar] [CrossRef]
- Łapczyńska, D.; Burduk, A. Application of Fuzzy Logic to the Risk Assessment of Production Machines Failures. In Proceedings of the 18th International Conference on Soft Computing Models in Industrial and Environmental Applications (SOCO 2023), Salamanca, Spain, 5–7 September 2023; Springer Nature: Cham, Switzerland, 2023; Volume 749, pp. 34–45. [Google Scholar] [CrossRef]
- Pacana, A.; Siwiec, D. Method of Fuzzy Analysis of Qualitative-Environmental Threat in Improving Products and Processes (Fuzzy QE-FMEA). Materials 2023, 16, 1651. [Google Scholar] [CrossRef]
- Alshehhi, K.; Cheaitou, A.; Rashid, H. Fuzzy Failure Modes Effect and Criticality Analysis of the Procurement Process of Artificial Intelligent Systems/Services. IJACSA 2023, 14, 10. [Google Scholar] [CrossRef]
- Wu, X.; Wu, J. The Risk Priority Number Evaluation of FMEA Analysis Based on Random Uncertainty and Fuzzy Uncertainty. Complexity 2021, 2021, 8817667. [Google Scholar] [CrossRef]
- Jang, H.-a.; Min, S. Time-Dependent Probabilistic Approach of Failure Mode and Effect Analysis. Appl. Sci. 2019, 9, 4939. [Google Scholar] [CrossRef]
- Gul, M.; Yucesan, M.; Celik, E. A Manufacturing Failure Mode and Effect Analysis Based on Fuzzy and Probabilistic Risk Analysis. Appl. Soft Comput. 2020, 96, 106689. [Google Scholar] [CrossRef]
- De Aguiar, J.; Scalice, R.K.; Bond, D. Using Fuzzy Logic to Reduce Risk Uncertainty in Failure Modes and Effects Analysis. J. Braz. Soc. Mech. Sci. Eng. 2018, 40, 516. [Google Scholar] [CrossRef]
- Ceylan, B.O. Shipboard Compressor System Risk Analysis by Using Rule-Based Fuzzy FMEA for Preventing Major Marine Accidents. Ocean. Eng. 2023, 272, 113888. [Google Scholar] [CrossRef]
- Certa, A.; Hopps, F.; Inghilleri, R.; La Fata, C.M. A Dempster-Shafer Theory-Based Approach to the Failure Mode, Effects and Criticality Analysis (FMECA) under Epistemic Uncertainty: Application to the Propulsion System of a Fishing Vessel. Reliab. Eng. Syst. Saf. 2017, 159, 69–79. [Google Scholar] [CrossRef]
- Ghasemi, F.; Rahimi, J. Failure Mode and Effect Analysis of Personal Fall Arrest System under the Intuitionistic Fuzzy Environment. Heliyon 2023, 9, e16606. [Google Scholar] [CrossRef]
- Awodi, N.J.; Liu, Y.; Ayo-Imoru, R.M.; Ayodeji, A. Fuzzy TOPSIS-Based Risk Assessment Model for Effective Nuclear Decommissioning Risk Management. Prog. Nucl. Energy 2023, 155, 104524. [Google Scholar] [CrossRef]
- Ghoushchi, S.J.; Yousefi, S.; Khazaeili, M. An Extended FMEA Approach Based on the Z-MOORA and Fuzzy BWM for Prioritization of Failures. Appl. Soft Comput. 2019, 81, 105505. [Google Scholar] [CrossRef]
- Buffa, P.; Giardina, M.; Prete, G.; De Ruvo, L. Fuzzy FMECA Analysis of Radioactive Gas Recovery System in the SPES Experimental Facility. Nucl. Eng. Technol. 2021, 53, 1464–1478. [Google Scholar] [CrossRef]
- Qiu, Y.; Zhang, H. A Modified FMEA Approach to Predict Job Shop Disturbance. Processes 2022, 10, 2223. [Google Scholar] [CrossRef]
- Cardiel-Ortega, J.J.; Baeza-Serrato, R. Failure Mode and Effect Analysis with a Fuzzy Logic Approach. Systems 2023, 11, 348. [Google Scholar] [CrossRef]
- Boral, S.; Howard, I.; Chaturvedi, S.K.; McKee, K.; Naikan, V.N.A. An Integrated Approach for Fuzzy Failure Modes and Effects Analysis Using Fuzzy AHP and Fuzzy MAIRCA. Eng. Fail. Anal. 2020, 108, 104195. [Google Scholar] [CrossRef]
- Ivančan, J.; Lisjak, D. New FMEA Risks Ranking Approach Utilizing Four Fuzzy Logic Systems. Machines 2021, 9, 292. [Google Scholar] [CrossRef]


Disclaimer/Publisher’s Note: The statements, opinions and data contained in all publications are solely those of the individual author(s) and contributor(s) and not of MDPI and/or the editor(s). MDPI and/or the editor(s) disclaim responsibility for any injury to people or property resulting from any ideas, methods, instructions or products referred to in the content. |
© 2024 by the authors. Licensee MDPI, Basel, Switzerland. This article is an open access article distributed under the terms and conditions of the Creative Commons Attribution (CC BY) license (https://creativecommons.org/licenses/by/4.0/).