Non-Isothermal Degradation Mechanism of Micro/Nano Titanium Dioxide-Enhanced Polycaprolactone Biocomposite


Abstract
:1. Introduction
2. Materials and Methods
Kinetic Analysis
3. Results
Kinetic Analysis
4. Conclusions
Author Contributions
Funding
Data Availability Statement
Conflicts of Interest
References
- Guan, S.; Liu, X.; Zhang, Y.; Liu, Y.; Wang, L.; Liu, Y. Synthesis and Characterization of Polycaprolactone Modified Trimellitate Nano-Lubricant. Materials 2019, 12, 2273. [Google Scholar] [CrossRef] [PubMed]
- Bajsić, E.G.; Bulatović, V.O.; Slouf, M.; Šitum, A. Characterization of Biodegradable Polycaprolactone Containing Titanium Dioxide Micro and Nanoparticles. Int. J. Creat. Multimed. 2014, 8, 611. [Google Scholar] [CrossRef]
- Bui, H.T.; Chung, O.H.; Cruz, J.D.; Park, J.S. Fabrication and characterization of electrospun curcumin-loaded polycaprolactone-polyethylene glycol nanofibers for enhanced wound healing. Macromol. Res. 2014, 22, 1288. [Google Scholar] [CrossRef]
- Alshumrani, R.A.; Hadjichristidis, N. Well-defined triblock copolymers of polyethylene with polycaprolactone or polystyrene using a novel difunctional polyhomologation initiator. Polym. Chem. 2017, 8, 5427. [Google Scholar] [CrossRef]
- Blanco, I. Design, Synthesis and Characterization of Hybrid Composite Materials. Appl. Sci. 2023, 13, 3443. [Google Scholar] [CrossRef]
- Blanco, I. Synthesis, Characterization and Application of Hybrid Composites. Appl. Sci. 2020, 10, 5456. [Google Scholar] [CrossRef]
- Cazan, C.; Enesca, A.; Andronic, L. Synergic Effect of TiO2 Filler on the Mechanical Properties of Polymer Nanocomposites. Polymers 2021, 13, 2017. [Google Scholar] [CrossRef]
- Anuradha, K.; Bangal, P.; Madhavendra, S.S. Macromolecular arabinogalactan polysaccharide mediated synthesis of silver nanoparticles, characterization and evaluation. Macromol. Res. 2016, 24, 152. [Google Scholar] [CrossRef]
- Kaseem, M.; Hamad, K.; Ur Rehman, Z. Review of Recent Advances in Polylactic Acid/TiO2 Composites. Materials 2019, 12, 3659. [Google Scholar] [CrossRef]
- Hanemann, T.; Szabo, D.V. Polymer-Nanoparticle Composites: From Synthesis to Modern Applications. Materials 2010, 3, 3468. [Google Scholar] [CrossRef]
- Basu, A.; Nazarkovsky, M.; Ghadi, R.; Khan, W.; Domb, A.J. Poly(lactic acid)-based nanocomposites. Polym. Adv. Technol. 2017, 28, 919. [Google Scholar] [CrossRef]
- Xu, N.; Shi, Z.; Fan, Y.; Dong, J.; Sji, J.; Hu MZ, C. Effects of Particle Size of TiO2 on Photocatalytic Degradation of Methylene Blue in Aqueous Suspensions. Ind. Eng. Chem. Res. 1999, 38, 373. [Google Scholar] [CrossRef]
- Mofokeng, J.P.; Luyt, A.S. Morphology and thermal degradation studies of melt-mixed poly(lactic acid) (PLA)/poly(ε-caprolactone) (PCL) biodegradable polymer blend nanocomposites with TiO2 as filler. Polym. Test. 2015, 45, 93. [Google Scholar] [CrossRef]
- Bajsić, E.G.; Filipan, V.; Holjevac, G.T.; Grozdanić, V. Effect of Micro and Nano TiO2 on UV Degradation behavior of TiO2 Reinforced Polycaprolactone Composite. Croat. Chem. Acta 2017, 90, 297. [Google Scholar] [CrossRef]
- Vacková, T.; Kratochvíl, J.; Ostafinska, A.; Krejčíková, S.; Nevoralová, M.; Slouf, M. Impact of particle morphology on structure, crystallization kinetics, and properties of PCL composites with TiO2-based particles. Polym. Bull. 2017, 74, 445. [Google Scholar] [CrossRef]
- Monteiro, S.B.; de Tavares, M.I.B. The Development and Characterization of Polycaprolactone and Titanium Dioxide Hybrids. ANP 2018, 7, 11. [Google Scholar] [CrossRef]
- NETZSCH Thermokinetics, version 3.1. Software Manual. Netzsch-Geraeteban GbmH: Selb, Germany, 2022.
- Bondarchuk, I.; Bondarchuk, S.; Vorozhtsov, A.; Zhukov, A. Advanced Fitting Method for the Kinetic Analysis of Thermogravimetric Data. Molecules 2023, 28, 424. [Google Scholar] [CrossRef] [PubMed]
- Dubaj, T.; Vecchio Ciprioti, S.; Tirillò, J.; Sarasini, F. Thermal stability of binary and ternary biodegradable polymer blends assessed by isoconversional kinetic analysis. Thermochim. Acta 2024, 736, 179761. [Google Scholar] [CrossRef]
- Patnaik, S.; Panda, A.K.; Kumar, S. Thermal degradation of corn starch based biodegradable plastic plates and determination of kinetic parameters by isoconversional methods using thermogravimetric analyzer. J. Energy Inst. 2020, 93, 1449. [Google Scholar] [CrossRef]
- Vyazovkin, S.; Burnham, A.K.; Criado, J.M.; Pérez-Maqueda, L.A.; Popescu, C.; Sbirrazzuoli, N. ICTAC Kinetics Committee recommendations for performing kinetic computations on thermal analysis data. Thermochim. Acta 2011, 520, 1. [Google Scholar] [CrossRef]
- Vyazovkin, S.; Chrissas, K.; Di Lorenzo, M.L.; Koga, N.; Pijolat, M.; Roduit, B.; Sbirrazzuoli, N.; Sunol, J.J. ICTAC Kinetics Committee recommendations for collecting experimental thermal analysis data for kinetic computations. Thermochim. Acta 2014, 590, 1. [Google Scholar] [CrossRef]
- Vyazovkin, S.; Burnham, A.K.; Favergeon, L.; Koga, N.; Moukhina, E.; Perez-Maqueda, L.A.; Sbirrazzuoli, N. ICTAC Kinetics Committee recommendations for analysis of multi-step kinetics. Thermochim. Acta 2020, 689, 178597. [Google Scholar] [CrossRef]
- Jakić, M.; Vrandečić, N.S.; Erceg, M. The influence of poly(ethylene glycol) on thermal properties of poly(vinyl chloride)/poly(ethylene oxide) blends. Therm. Anal. Calorim. 2017, 127, 663. [Google Scholar] [CrossRef]
- Jakić, M.; Vrandečić, N.S.; Erceg, M. Thermal degradation of poly(3-hydroxybutyrate)/poly(ethylene oxide) blends: Thermogravimetric and kinetic analysis. European Polym. J. 2016, 81, 376. [Google Scholar] [CrossRef]
- Bulatović, V.O.; Jakić, M.; Grgić, D.K. Kinetic Analysis of Poly(ε-caprolactone)/poly(lactic acid) Blends with Low-cost Natural Thermoplastic Starch. Acta Chim. Slov. 2020, 67, 65. [Google Scholar] [CrossRef]
- Byczynski, L. Thermal degradation studies of poly(urethane–siloxane) thermosets based on co-poly(dimethyl)(methyl, 3-glycidoxypropyl)siloxane and epoxy-terminated urethane oligomer. Thermochim. Acta 2014, 592, 58. [Google Scholar] [CrossRef]
- Persenaire, O.; Alexandre, M.; Degée, P.; Dubois, P. Mechanisms and Kinetics of Thermal Degradation of Poly(ε-caprolactone). Biomacromolecules 2001, 2, 288. [Google Scholar] [CrossRef]


| Stage of Reaction | PCL/mTiO2 | |||||
|---|---|---|---|---|---|---|
| 100/0 | 99.5/0.5 | 99/1 | 98/2 | 95/5 | 90/10 | |
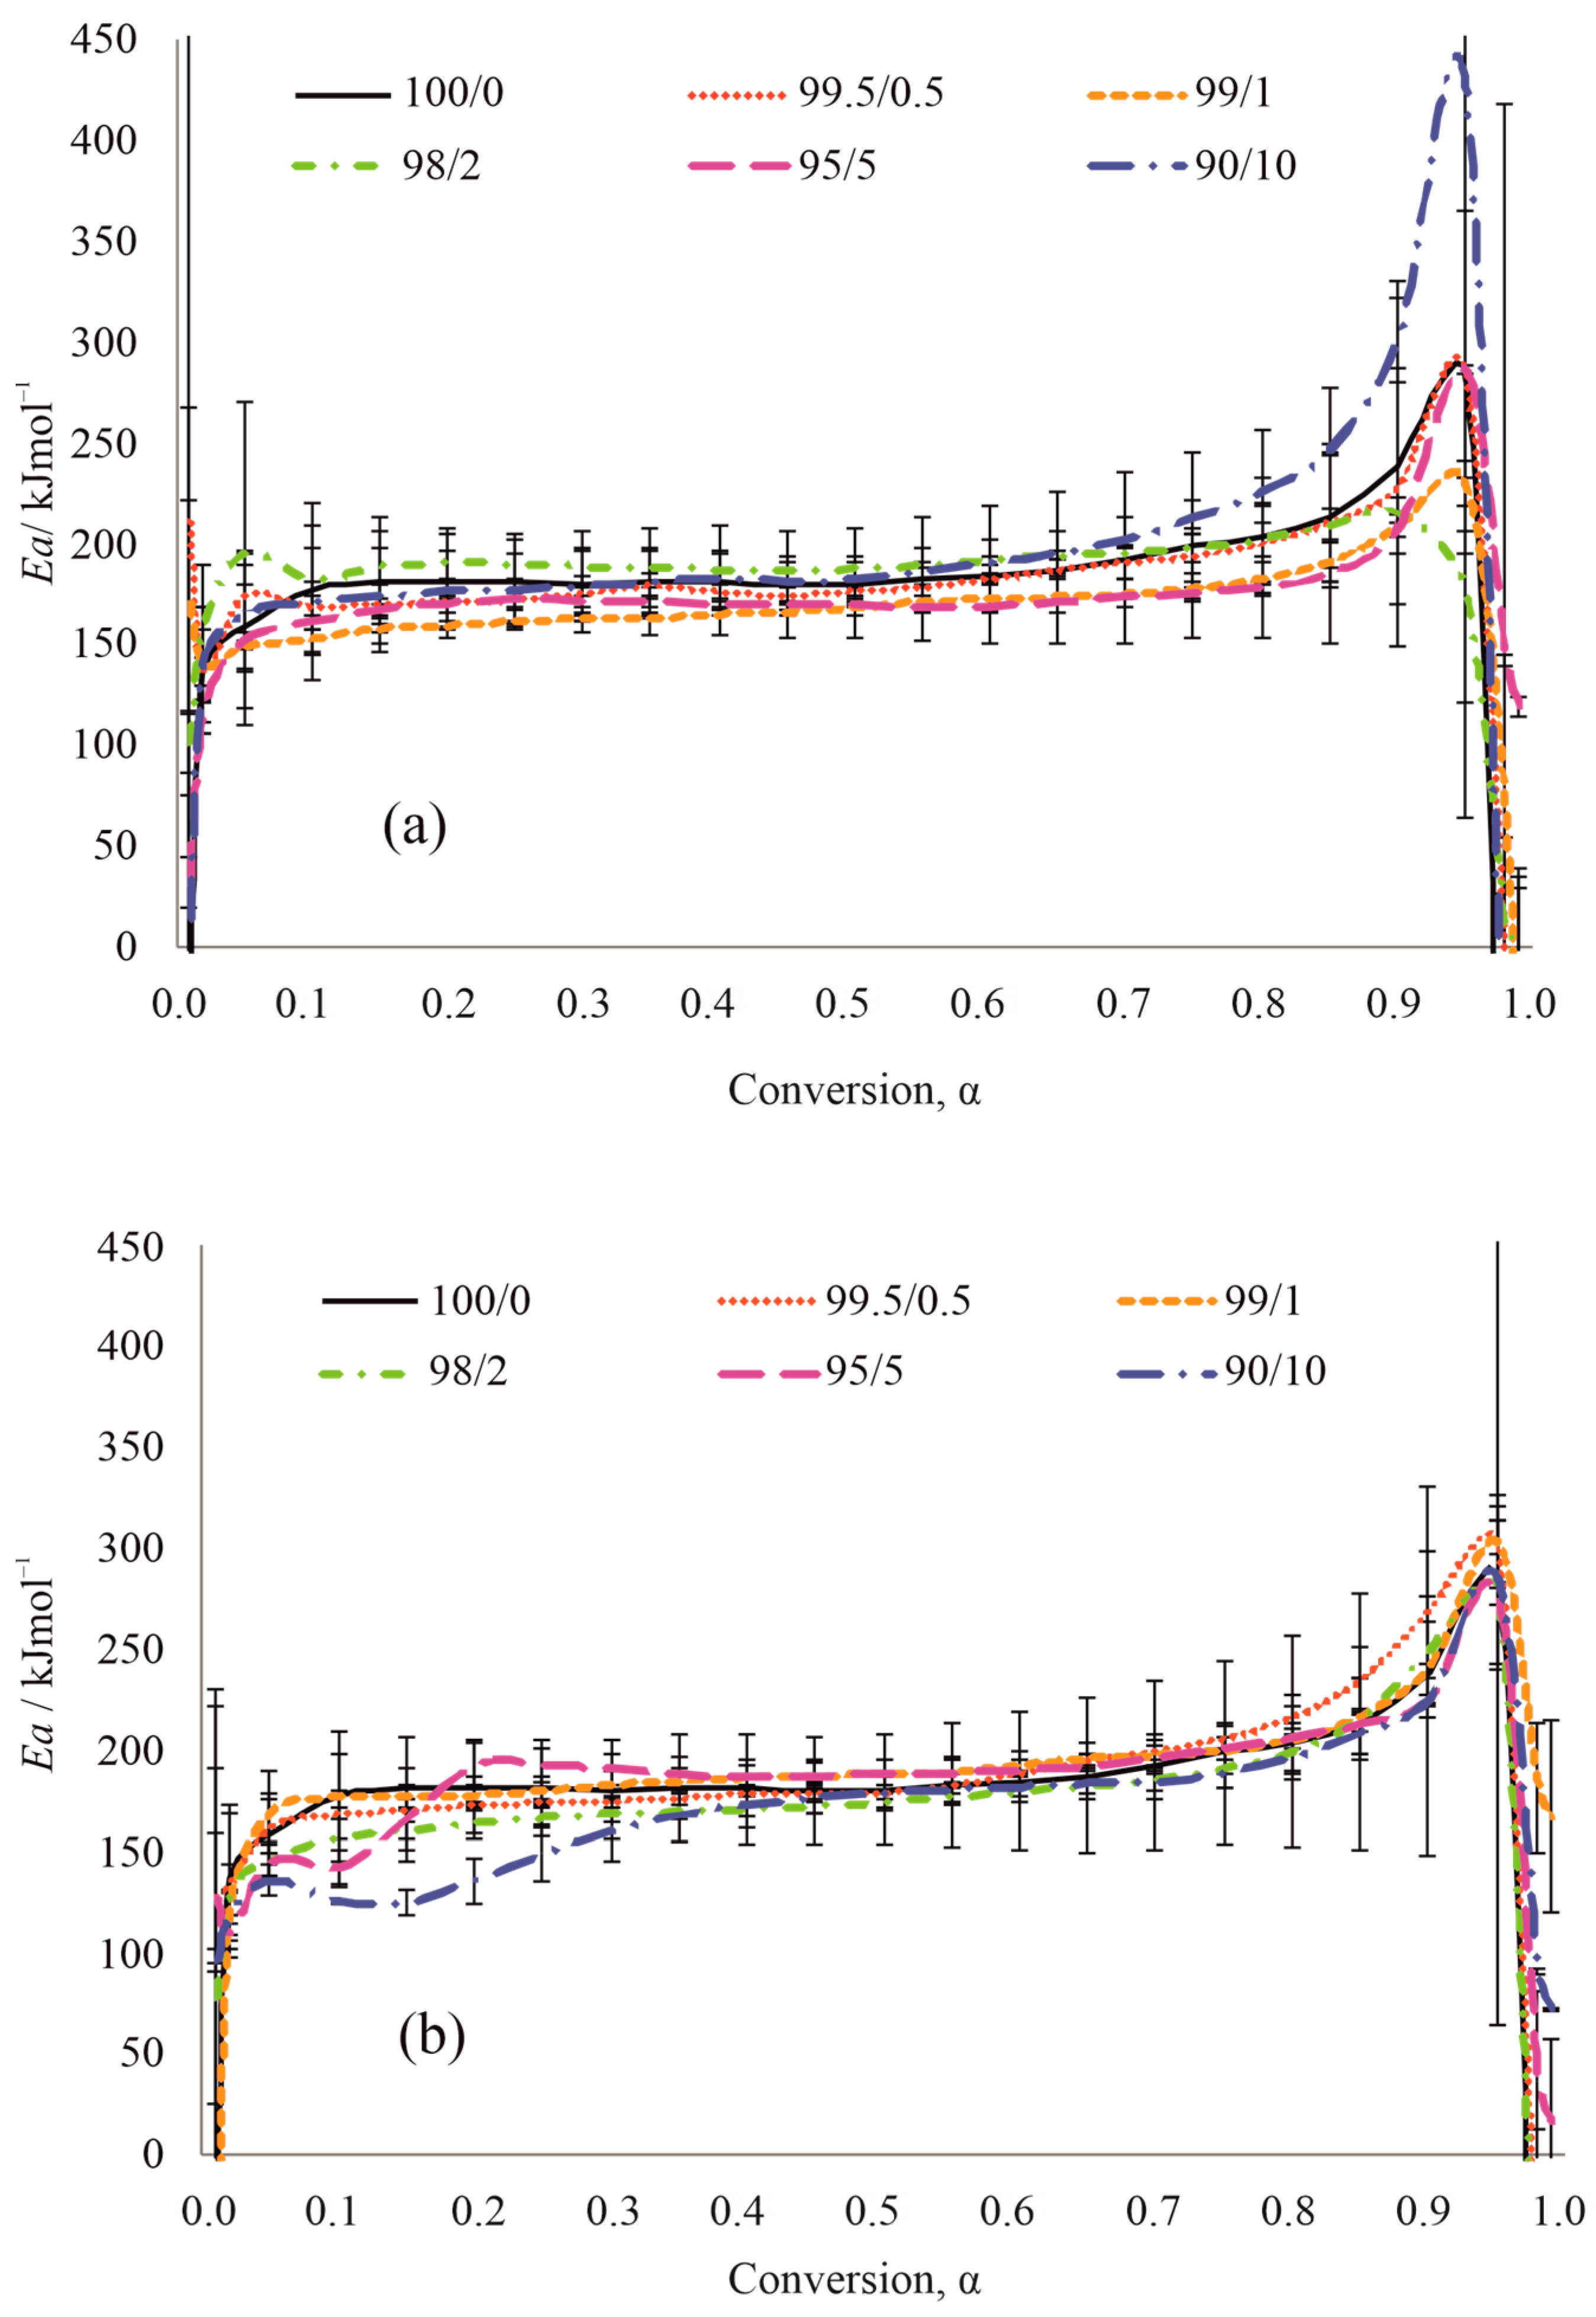
| Stage I | 0.0–158.8 | 137.3–210.1 | 140.1–158.6 | 101.3–159.4 | 32.0–160.7 | 13.4–171.3 |
| Conversion range | 0.00–0.05 | 0.01–0.05 | 0.01–0.20 | 0.01–0.05 | 0.01–0.10 | 0.01–0.10 |
| Stage II | 177.5–192.8 | 170.3–190.9 | 160.0–183.2 | 182.2–190.1 | 167.2–177.7 | 176.6–186.1 |
| Conversion range | 0.05–0.70 | 0.05–0.70 | 0.20–0.80 | 0.05–0.70 | 0.10–0.80 | 0.10–0.60 |
| Stage III | 0.0–283.2 | 0.0–285.2 | 0.0–230.5 | 4.8–215.0 | 118.8–286.3 | 0.0–426.9 |
| Conversion range | 0.70–1.00 | 0.70–1.00 | 0.80–1.00 | 0.70–1.00 | 0.80–1.00 | 0.60–1.00 |
| Stage of Reaction | PCL/nTiO2 | |||||
| 100/0 | 99.5/0.5 | 99/1 | 98/2 | 95/5 | 90/10 | |
| Stage I | 0.0–158.8 | 127.9–163.2 | 0.0–170.1 | 77.5–156.5 | 110.6–145.9 | 96.2–135.7 |
| Conversion range | 0.00–0.05 | 0.00–0.05 | 0.00–0.05 | 0.00–0.10 | 0.00–0.05 | 0.00–0.20 |
| Stage II | 177.5–192.8 | 168.8–182.9 | 177.5–189.8 | 160.1–190.8 | 166.9–190.8 | 149.1–172.9 |
| Conversion range | 0.05–0.70 | 0.05–0.55 | 0.05–0.55 | 0.10–0.75 | 0.05–0.20 | 0.20–0.40 |
| Stage III | 0.0–283.2 | 0.0–302.1 | 167.7–303.7 | 0.0–278.2 | 187.6–192.5 | 178.8–188.3 |
| Conversion range | 0.70–1.00 | 0.55–1.00 | 0.55–1.00 | 0.75–1.00 | 0.20–0.70 | 0.40–0.75 |
| Stage IV | - | - | - | - | 16.8–276.5 | 71.7–284.9 |
| Conversion range | - | - | - | - | 0.70–1.00 | 0.75–1.00 |
| Stage of Reaction | Parameter | PCL/mTiO2 | |||||
|---|---|---|---|---|---|---|---|
| 100/0 | 99.5/0.5 | 99/1 | 98/2 | 95/5 | 90/10 | ||
| Stage I | Ea1/ kJ mol−1 | 32.4 ± 0.1 | 141.8 ± 3.5 | 153.3 ± 1.4 | 152.5 ± 5.4 | 56.7 ± 0.0 | 42.1 ± 0.3 |
| log A1 | −0.7 ± 0.0 | 13.5 ± 0.5 | 9.3 ± 0.1 | 14.3 ± 0.5 | 1.6 ± 0.0 | 0.4 ± 0.0 | |
| n | - | 1.9 ± 0.4 | 0.7 ± 0.1 | 2.7 ± 0.9 | - | - | |
| Model | D4 | Cn | Cn | Fn | D4 | D4 | |
| Stage II | Ea2/kJ mol−1 | 177.2 ± 0.8 | 170.2 ± 0.5 | 160.5 ± 4.1 | 189.8 ± 2.0 | 176.9 ± 1.1 | 176.4 ± 1.1 |
| log A2 | 11.2 ± 0.1 | 10.9 ± 0.0 | 10.4 ± 0.3 | 12.5 ± 0.1 | 11.8 ± 0.1 | 11.1 ± 0.0 | |
| n | 1.4 ± 0.0 | 1.4 ± 0.0 | 1.1 ± 0.2 | 1.0 ± 0.1 | 1.6 ± 0.0 | 1.4 ± 0.0 | |
| Model | Cn | An | An | Cn | Cn | Cn | |
| Stage III | Ea3/kJ mol−1 | 2.0 ± 0.4 | 264.0 ± 7.1 | 217.9 ± 13.1 | 212.0 ± 9.5 | 165.6 ± 0.7 | 10.1 ± 6.0 |
| log A3 | −3.2 ± 0.0 | 17.8 ± 0.5 | 14.9 ± 1.1 | 14.3 ± 0.8 | 10.7 ± 0.0 | −2.6 ± 0.4 | |
| n | 0.1 ± 0.0 | 2.0 ± 0.0 | 1.9 ± 0.1 | 1.6 ± 0.1 | 0.8 ± 0.0 | 0.4 ± 0.1 | |
| Model | Fn | Fn | Fn | Fn | Fn | Fn | |
| Correlation coefficient, r2 | 0.99993 | 0.99991 | 0.99988 | 0.99986 | 0.99999 | 0.99992 | |
| Stage of Reaction | Parameter | PCL/nTiO2 | |||||
|---|---|---|---|---|---|---|---|
| 100/0 | 99.5/0.5 | 99/1 | 98/2 | 95/5 | 90/10 | ||
| Stage I | Ea1/kJ mol−1 | 32.4 ± 0.1 | 143.6 ± 0.6 | 130.4 ± 0.7 | 128.5 ± 0.6 | 104.7 ± 0.0 | 98.4 ± 0.3 |
| log A1 | −0.7 ± 0.0 | 8.0 ± 0.0 | 7.0 ± 0.1 | 6.9 ± 0.0 | 7.0 ± 0.0 | 6.8 ± 0.0 | |
| n | - | - | - | - | - | - | |
| Model | D4 | D4 | D4 | D4 | D4 | D4 | |
| Stage II | Ea2/kJ mol−1 | 177.2 ± 0.8 | 168.2 ± 0.9 | 178.2 ± 1.4 | 160.4 ± 1.1 | 207.2 ± 0.3 | 210.0 ± 0.3 |
| log A2 | 11.2 ± 0.1 | 10.9 ± 0.1 | 11.7 ± 0.1 | 10.2 ± 0.1 | 13.9 ± 0.0 | 13.9 ± 0.0 | |
| n | 1.4 ± 0.0 | 1.0 ± 0.0 | 1.2 ± 0.0 | 1.0 ± 0.0 | - | - | |
| Model | Cn | Cn | Cn | Cn | D4 | D4 | |
| Stage III | Ea3/kJ mol−1 | 2.0 ± 0.4 | 294.1 ± 4.0 | 295.4 ± 3.7 | 252.5 ± 5.9 | 211.9 ± 1.9 | 198.5 ± 4.0 |
| log A3 | −3.2 ± 0.0 | 20.6 ± 0.3 | 20.7 ± 0.3 | 17.4 ± 0.5 | 14.2 ± 0.1 | 12.5 ± 0.2 | |
| n | 0.1 ± 0.0 | 2.1 ± 0.0 | 1.8 ± 0.0 | 1.8 ± 0.0 | 1.4 ± 0.0 | 2.6 ± 2.5 | |
| Model | Fn | Fn | Fn | Fn | Cn | Cn | |
| Stage IV | Ea4/kJ mol−1 | - | - | - | - | 211.9 ± 1.9 | 198.5 ± 4.0 |
| log A4 | - | - | - | - | 14.2 ± 0.1 | 12.5 ± 0.2 | |
| n | - | - | - | - | 1.4 ± 0.0 | 2.6 ± 2.5 | |
| Model | - | - | - | - | Fn | Fn | |
| Correlation coefficient, r2 | 0.99993 | 0.99996 | 0.99994 | 0.99995 | 0.99998 | 0.99993 | |
Disclaimer/Publisher’s Note: The statements, opinions and data contained in all publications are solely those of the individual author(s) and contributor(s) and not of MDPI and/or the editor(s). MDPI and/or the editor(s) disclaim responsibility for any injury to people or property resulting from any ideas, methods, instructions or products referred to in the content. |
© 2024 by the authors. Licensee MDPI, Basel, Switzerland. This article is an open access article distributed under the terms and conditions of the Creative Commons Attribution (CC BY) license (https://creativecommons.org/licenses/by/4.0/).
Share and Cite
Ocelić Bulatović, V.; Jakić, M.; Kučić Grgić, D.; Jakić, J. Non-Isothermal Degradation Mechanism of Micro/Nano Titanium Dioxide-Enhanced Polycaprolactone Biocomposite. Processes 2024, 12, 1214. https://doi.org/10.3390/pr12061214
Ocelić Bulatović V, Jakić M, Kučić Grgić D, Jakić J. Non-Isothermal Degradation Mechanism of Micro/Nano Titanium Dioxide-Enhanced Polycaprolactone Biocomposite. Processes. 2024; 12(6):1214. https://doi.org/10.3390/pr12061214
Chicago/Turabian StyleOcelić Bulatović, Vesna, Miće Jakić, Dajana Kučić Grgić, and Jelena Jakić. 2024. "Non-Isothermal Degradation Mechanism of Micro/Nano Titanium Dioxide-Enhanced Polycaprolactone Biocomposite" Processes 12, no. 6: 1214. https://doi.org/10.3390/pr12061214