Article

Ibuprofen Formulations: Permeability and Biodegradability Comparison Depending on the Type of Formulation

by
Edyta Kucharska
1,
Berin Ok
1,2,
Anna Nowak
3,
Łukasz Kucharski
3,
Anna Muzykiewicz-Szymańska
3 and
Paula Ossowicz-Rupniewska
1,*
1
Department of Chemical Organic Technology and Polymeric Materials, Faculty of Chemical Technology and Engineering, West Pomeranian University of Technology in Szczecin, Piastów Ave. 42, 71-065 Szczecin, Poland
2
Department of Materials Science and Engineering, Faculty of Engineering, Eskisehir Technical University, Iki Eylul Campus, 26555 Eskisehir, Turkey
3
Department of Cosmetic and Pharmaceutical Chemistry, Pomeranian Medical University in Szczecin, Powstańców Wielkopolskich Ave. 72, 70-111 Szczecin, Poland
*
Author to whom correspondence should be addressed.
Processes 2024, 12(6), 1236; https://doi.org/10.3390/pr12061236
Submission received: 9 April 2024 / Revised: 13 June 2024 / Accepted: 14 June 2024 / Published: 16 June 2024
(This article belongs to the Special Issue Advanced Biodegradation Technologies for Environmental Pollutants)

Abstract

:
This study assesses ibuprofen’s permeability to different formulations and their biodegradation. Hydrogel, organogel, Eucerin ointment, silicone ointment, and zinc ointment were investigated. The objective was to comprehensively evaluate the therapeutic efficacy and environmental implications of these formulations. Diverse formulations were examined through the utilisation of Franz diffusion chambers to evaluate the in vitro permeability of both ibuprofen and ibuprofenate sodium. Moreover, biodegradation studies of the obtained formulations were carried out with activated sludge. The activity of the inoculum was confirmed by using SDS as a reference compound. The experimental settings used (carbon content and inoculum volume) were selected based on the criteria set by the OECD guidelines. Relevant parameters pertaining to the biodegradation process were estimated, including biodegradation values (%B) at specific time points, half-lives of initial compounds and API-containing formulations, and degradation phases (lag phase I; degradation phase II, and plate phase III). For comparison purposes, biodegradation studies were also carried out for the initial IBU and IBUNa compounds under the same conditions. The environmental implications of these findings underscore the need for a balanced consideration of therapeutic efficacy and environmental sustainability in pharmaceutical formulation design. This study provides valuable insights for pharmaceutical researchers, environmental scientists, and regulatory bodies involved in the development and assessment of drug formulations. The proposed method of removing NSAIDs from aquatic ecosystems is a cheaper alternative to techniques such as reverse osmosis, oxidation, UV degradation, or photolysis, which have not found practical use owing to the generation of toxic sludge or high capital and operating costs.

1. Introduction

Ibuprofen (IBU) and its derivative, sodium ibuprofenate, are widely recognised topical medications used to treat subcutaneous tissue and skin inflammation. With over 50 years of clinical use, ibuprofen has emerged as a premier globally used nonsteroidal anti-inflammatory drug (NSAID). In 2000, Germany consumed 300 tons of ibuprofen, followed by England with 162 tons, Poland with 58 tons, and Switzerland with 25 tons, showcasing its rising popularity [1,2]. Although the scientific community has developed techniques to remove unsafe metabolites of topical drugs from the environment, due to the excessive use of NSAIDs, metabolites of these drugs are continually being released into a contemporary ecosystem that is now in critical condition [3]. A number of methods have so far been used to remove nonsteroidal anti-inflammatory drugs from water systems, including reverse osmosis, oxidation, UV degradation, photolysis, and nanofiltration [4,5,6].
The worldwide ibuprofen market attained a valuation of USD 294.4 million in 2020 and is anticipated to achieve USD 447.6 million by the conclusion of 2026. Nevertheless, as ibuprofen continues to gain prominence, questions about its environmental impact emerge. Its bioactive nature and hazardous metabolites make it a potential threat to aquatic ecosystems. Biological methods using natural microbial populations to rapidly and efficiently eliminate toxic metabolites of NSAIDs from aquatic ecosystems can reduce the amount of such pollution in the environment. Biotechnology methods are a cheaper alternative that is easy to apply in underdeveloped nations with limited access to modern technologies, skilled personnel, and available capital that can be easily integrated into wastewater treatment plants [7,8,9].
The limited water solubility of ibuprofen (at 25 °C, it weighs 0.076 g·dm−3) and its constrained skin permeation, coupled with its classification as a high lipophilic compound belonging to carboxylic acid (log P ranges from 2.41 to 4.00), present challenges in maintaining therapeutic concentrations in deeper tissues [6,7]. Overcoming these challenges is crucial, particularly as topical applications, including gels, lotions, and sprays, gain preference for their effectiveness. The outermost layer of the skin, called the stratum corneum, is a significant barrier influencing permeability [8,9].
Despite its therapeutic effectiveness, the poor solubility of ibuprofen in aqueous solutions hampers its bioavailability and absorption rates, especially when exploring novel applications. Few studies have addressed the biodegradation of nonsteroidal anti-inflammatory drugs, including ibuprofen, in activated sludge [10,11].
Numerous toxicological tests revealed that the parent substances were less harmful than the intermediates created by removing them from the aquatic environment in a traditional way [12,13]. Hence, the suggested approach for aerobic biodegradation of ibuprofen and its derivatives, which is both cost-effective and environmentally friendly, is considered a promising alternative for removing pharmaceuticals from water bodies in the future. Aquatic bacteria utilise ibuprofen and its derivatives as a source of both carbon and energy. A crucial technique for removing pollutants is biological treatment. While numerous microorganisms possess the ability to utilise pharmaceuticals as energy and carbon sources, these microorganisms are typically susceptible to variations in temperature and pH. Additionally, certain pharmaceuticals exhibit reduced susceptibility rates during the biodegradation process, and the intermediates generated in the course of biodegradation can have a more harmful impact on the system compared to their parent molecules. The pure bacterial cultures recovered using activated sludge and wastewater capable of destroying ibuprofen have not been the subject of many studies. There are just a few pure isolates known to be able to break down ibuprofen, including Sphingomonas Ibu-2, Nocardia sp. NRRL 5646, Bacillus thuringiensis B1(2015b), and Patulibacter sp. strain I11. Ibuprofen may be broken down by certain microorganisms in the presence of glucose, yeast extract, or tryptone. Since the capacity of microorganisms to create an ibuprofen-degrading specific enzyme is required for ibuprofen biodegradation by isolated strains, enzyme induction is crucial [14,15,16,17,18,19,20].
Microorganism activity was employed in this investigation to examine hydrogel containing ibuprofen’s capacity to degrade (under aerobic circumstances) and establish if it is persistent in the environment. The obtained biodegradation results are also compared to other used formulations, including organogel, Eucerin, silicone, and zinc ointment. The OECD approach for assessing the biodegradability of these substances, wherein the aerobic biodegradability of formulations is evaluated by measuring the CO2 emitted, was used in this research. The formulations were categorised as easily and weakly biodegradable [6].
This research investigates the permeability and biodegradability of ibuprofen formulations. This study also evaluates the environmental impact of these formulations, particularly focusing on their biodegradation processes and potential persistence. Microorganism activity, specifically the capacity of formulations to degrade under aerobic circumstances, is examined, following OECD guidelines for biodegradability testing.
This study scrutinises the permeability and biodegradability of ibuprofen formulations, aiming to identify the most suitable vehicle(s) for ibuprofen and its derivative, sodium ibuprofenate, considering its poor skin permeability and low solubility. This research’s novelty lies in its in-depth analysis of biodegradation processes, environmental effects, and the evaluation of pure bacterial cultures recovered from activated sludge and effluent. The findings will contribute to selecting bioavailable vehicles that enhance solubility and skin permeability for ibuprofen and sodium ibuprofenate.

2. Materials and Methods

2.1. Materials

All compounds utilised were readily accessible in the marketplace and did not need to be purified beforehand.
Ibuprofen (98%), poly(dimethylsiloxane), PDMS, dimethicone (Dimeticonum), and E900 were supplied by AmBeed (Arlington Heights, IL, USA). Sigma-Aldrich (Darmstadt, Germany) supplied ibuprofen sodium salt (98%). Chempur (Piekary Śląskie, Poland) supplied methanol, ethanol (96%), acetic acid, phosphate-buffered saline (PBS, pH 7.4), dipotassium hydrogen phosphate, sodium phosphate dibasic dihydrate, barium hydroxide, magnesium (II) sulphate heptahydrate, orthophosphoric acid, potassium hydroxide, sodium hydroxide, iron (III) chloride hexahydrate, ammonium chloride, calcium chloride dihydrate, and potassium dihydrogen phosphate.
Supelco (Bellefonte, PA, USA) acquired formic acid (98–100% for HPLC LiChropurTM). Nanga of Karagen Kappa (Blękwit, Poland) was the supplier of the soy lecithin, whereas Pluronic F-127 and isopropyl myristate were purchased from Sigma-Aldrich (St. Louis, MO, USA). J.T. Baker of Radnor (Radnor, PA, USA) provided the acetonitrile for the HPLC, pharmacy Eucerin was supplied by Fagron (Kraków, Poland), Vaseline and cholesterol were provided by Coel (Kraków, Poland), and hydroxyethylcellulose and beeswax were supplied by the distributor Zrób Sobie Krem (Prochowice, Poland). Aflofarm provided the zinc paste (Pabianice, Poland). The chemicals used were of an analytical quality.
An often-used chemical in biodegradation investigations, sodium dodecyl sulphate (99.0%, SDS, Sigma-Aldrich) serves as a positive control and benchmark [3].

2.2. Hydrogel, Organogel, Eucerin Ointment, Silicone Ointment, and Zinc Ointment Preparation

The hydrogels (F1-IBU and F1-IBUNa) were prepared following a modified method by Nowak et al. [21,22]. The glycerine (1.00 g) and hydroxyethyl cellulose (0.30 g) were put into water (8.20 g) and then combined with a magnetic stirrer (ChemLand, Stargard, Poland) at 250 rpm. Next, an active substance (0.50 g IBU or 0.55 g IBUNa) was introduced. Continuous stirring was used as the polymer solution was heated to 60 °C, and then it was cooled to room temperature.
The organogels (F2-IBU and F2-IBUNa) were prepared in the following ways: the oil phase, containing lecithin (3.26 g), was developed in a sufficient quantity of isopropyl myristate by dissolving its ingredients (16.31 g) using a temperature of 50 °C and a magnetic stirrer ChemLand, Stargard, Poland (which also has a heating function, with the ability to determine the exact temperature of the water bath). Without prior dissolution, active substances (IBU 5.00 g or IBUNa 5.50 g) were introduced into the prepared oil phase. In order to prepare the liquid phase, calculated amounts of Pluronic F-127 (10.19 g) were dissolved in distilled water (65.24 g) at 50 °C. The phase was slowly added to the oil phase while swirling constantly for a few minutes. In this manner, organogels were formed. The formulations were obtained by mixing both phases using a homogeniser at 22,000 rpm (IKA®T18 digital ULTRA TURRAX, Wilmington, NC, USA).
The Eucerin ointment (F3-IBU and F3-IBUNa) was made using a modified process by Makuch et al. [23]. For this purpose, beeswax (0.19 g), Vaseline (5.55 g), and cholesterol (0.30 g) were put into glass beaker 1. Into the second beaker, distilled water (3.50 g) was added, whereas, in order to dissolve the active substance, ibuprofen (0.50 g) was introduced into the organic phase (i.e., into beaker 1). In comparison, IBUNa was introduced into the aqueous phase (0.55 g). The beakers were placed in the water bath to dissolve the contents. The ingredients were heated to 70 °C using a magnetic stirrer (ChemLand, Stargard, Poland) at a stirring speed of 250 rpm. The contents of beaker 2 were introduced into beaker 1, and chilled till room temperature with constant stirring thereafter. The emulsion obtained was a water in oil type.
The silicone ointment (F4-IBU and F4-IBUNa) was prepared as follows: into beaker 1 white petroleum jelly (0.57 g), anhydrous lanolin (4.75 g), and silol f-350 (0.95 g) was introduced, while into beaker 2, olive oil (3.23 g) and the appropriate active compound (0.50 g IBU or 0.55 g IBUNa) was introduced. The ingredients were heated to 60 °C (using a magnetic stirrer, ChemLand, Stargard, Poland, and a stirring speed of 250 rpm). The contents of beaker 1 were introduced into beaker 2, and chilled till room temperature with constant stirring thereafter.
The zinc ointment (F5-IBU and F5-IBUNa) was prepared as follows: 47.50 g of zinc paste and 47.50 g of Eucerin were placed in an Eprus® container and mixed using a formulation mixer (1375 rpm, Eprus® U500U, Bielsko-Biała, Poland) until a homogeneous mass was obtained. IBU or IBUNa were added in quantities of 5.00 and 5.50 g, respectively, to obtain a concentration of these compounds at 5% of the w/w.

2.3. Stability of Formulations

The stability of all formulations was assessed using the same methodology as in prior investigations [22]. Namely, the separation of all formulations underwent assessment using centrifuge testing. The vehicle samples (3 g) were subjected to centrifugation using the MPW-223e centrifuge from Mechanika Precyzyjna in Warsaw, Poland. The centrifugation was carried out for 10 min at a temperature of 25 °C and a speed of 4000 rpm to determine the possibility of preparation breaking. Furthermore, the stability of all vehicles was assessed using the heating–cooling test, which involved incubating them at a temperature of 45 °C for 48 h in a drying oven (model DHG-9075A), followed by incubation at a temperature of 4 °C for another 48 h in a refrigerator. The experiment was conducted throughout six cycles. The visual appearance of formulations exposed to heating and cooling conditions and centrifugation demonstrated their stability.
To determine the stability of the developed formulations, their viscosity and flow index were examined. Formulations characterised by appropriate viscosity (before and after stability tests) and a flow index value of 1 were selected for further study. In the case of all formulations, the flow index values (n) were 1 using a viscometer, IKA ROTAVISC (in the angular velocity range 5–25 rpm). Meanwhile, formulations retained their initial viscosity at the end of the test. This unequivocally demonstrates the superior thixotropic characteristics, which are more desirable for application on the skin [24].

2.4. The Skin Permeability for Formulations

The skin permeability of ibuprofen and sodium ibuprofenate formulations was evaluated in a Franz diffusion chamber (Phoenix DB-6, ABL&E-JASCO, Vienna, Austria) composed of an acceptor chamber measuring 10 mL and a donor chamber measuring 1 mL. There was 1 cm2 of permeable surface area. The acceptor fluid was a PBS solution mixed using a magnetic stirrer (ChemLand, Stargard, Poland) to preserve the physiological pH. The acceptor chamber’s temperature was kept constant at 37.0 ± 0.5 °C using a VEB MLW Prüfgeräte-Werk type 3280 thermostat. Before commencing the test, the Franz diffusion cells were given time to reach a state of equilibrium at a temperature of 37 °C for 15 min. Porcine skin was used in the studies because of its permeability features, which are similar to human skin. The skin came from a neighbouring slaughterhouse. Skin from the abdomen was washed multiple times with phosphate-buffered saline.
A 0.5 mm thick layer of skin was incised using a dermatome, thereafter enveloped in aluminium foil, and then subjected to freezing at −20 °C for a period not exceeding three months. The act of freezing time guaranteed the durability of the skin’s barrier characteristics [23,25]. Before the investigation, we defrosted the skin at room temperature for about 30 min and then immersed it in a PBS solution for 15 min to rehydrate it. The skin was then incorporated into Franz diffusion cells. The skin’s integrity was assessed one hour after it was placed in the Franz diffusion chamber (SES GmbH Analyse System, Bechenheim, Germany). The skin impedance was assessed at 120 Hz in parallel mode with a kΩ error of less than 0.5% using an LCR 4080 m from Conrad Electronic in Germany. To measure, the tips of the probes were immersed in the donor and acceptor chambers filled with the PBS solution. This study utilised membranes with an electrical resistance above 3 kΩ, which is equivalent to the resistance typically observed in normal human skin [26].
All formulations were placed in the donor chamber. A plastic stopper was used to close each donor chamber in order to avoid the vehicle’s excessive evaporation. For a whole day, the aforementioned experiments were executed. At certain intervals (30 min, 1, 2, 3, 4, 5, 8, and 24 h), 0.5 mL of the solution in the acceptor chamber was removed and replaced with a fresh volume of buffer with the same pH [27]. The samples were analysed using the HPLC method.
Permeation parameters, including the diffusion coefficient (KP), the fluxes through the skin (JSS), and the time needed to reach steady-state permeation (lag time–LT), were calculated using Equation (1) applied to profiles typically exhibiting a J-shaped pattern.
A = J s s ( t L T )
where A represents the cumulative quantity of the active pharmaceutical ingredient (API) of IBU and IBUNa permeating into the receptor compartment [µg IBU·cm−2], Jss signifies the steady-state flux [µg·cm−2·h−1], t denotes time [h], and LT stands for lag time [h].
The steady-state flux was determined by evaluating the slope of the linear segment of the cumulative mass plot in the acceptor phase over time. Lag time (LT) was ascertained from the x-intercept of the linear portion of the plot depicting cumulative permeation mass in the acceptor phase over time. The permeability coefficient (KP) was determined using Equation (2) and the following lag time:
K P = J s s C
where C represents the concentration in the donor phase.
In order to calculate the diffusion coefficient (D), we used Equation (3):
D = l 2 6 L T
where l denotes the diffusional pathway length as skin thickness [mm].
Equation (4) was used to get the skin partition coefficient (Km):
K m = K P I D

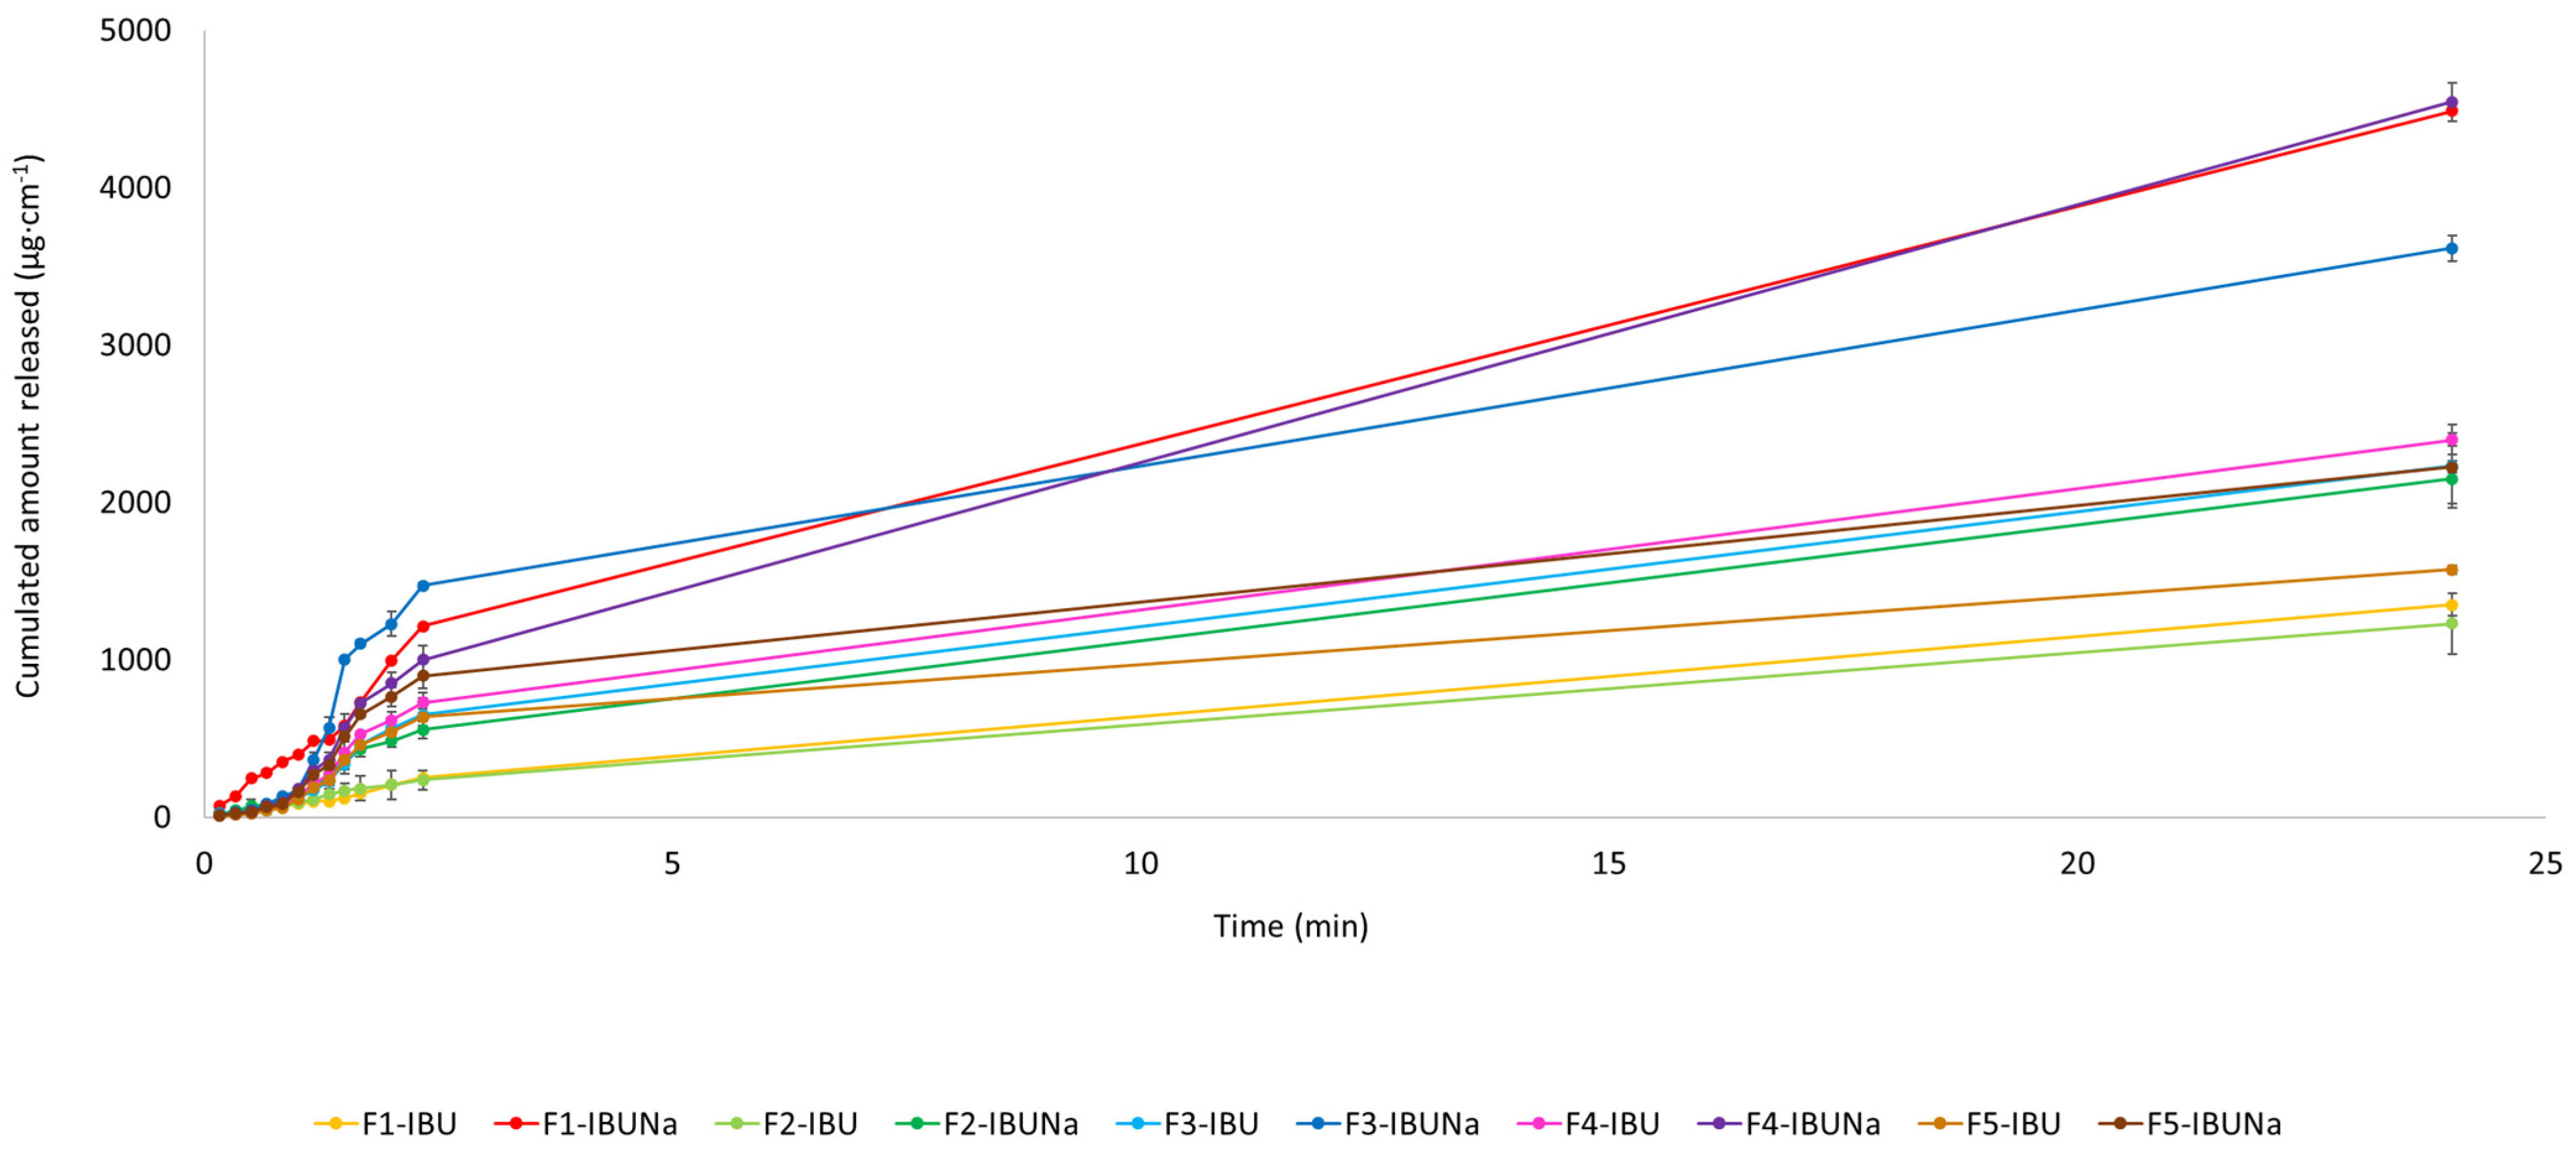
2.5. The Release Test

Release tests were conducted similarly to permeation tests, but a membrane was used to cover the diffusion areas. Specifically, a dialysis tubing cellulose membrane (D 9777-100FT, Sigma Aldrich, Steinheim am Albuch, Germany) was applied over the diffusion areas, and the prepared patch was placed on top of it. The release was carried out at the following time intervals: 10, 20, 30, 40, 50, 60, 70, 80, 90, 100, 120, 140, and 1440 min. The release data obtained from the Franz diffusion cell experiments were fitted to the Korsmeyer–Peppas model (Equation (5)) [28]:
f(t) = k·tn
where
  • f(t)—fraction of drug released in t time;
  • k—the release constant incorporated structural and geometric dosage form;
  • n—the release exponent indicating the drug release mechanism.
The model describes drug release from polymeric matrices and provides insights into the release mechanism. The release exponent (n) and the release rate constant (k) were determined from the fitted model, allowing for characterization of the release kinetics and mechanism for each formulation.

2.6. Skin Accumulation Studies

The Franz diffusion cell had skin samples removed after permeation experiments. Subsequently, they underwent a careful rinse in a pH 7.4 PBS solution and were left to air-dry at ambient temperature. The skin specimens were weighed, cut into 1 cm2 sections through diffusion, and finely minced using scissors. Following this, the samples were immersed in 2 cm3 of methanol and underwent a 24 h incubation at 4 °C. Following incubation, using a computerised ULTRA TURRAX homogenizer from Staufen on Breisgau (Germany), the skin samples were homogenised for five minutes, and then the supernatant was collected for the HPLC analysis. A measure for the build-up of IBU in the skin was the ratio of the mass of ibuprofen to the mass of the skin, expressed as μg·g−1, which was then divided by the remaining quantity of medication in the skin. This procedure was performed after a 24 h incubation period. Following the steps outlined before, the skin samples were once again removed from the Franz diffusion cell, washed, dried, weighed, and processed.

2.7. High-Performance Liquid Chromatography (HPLC)

The active ingredient content was evaluated using a liquid chromatography system (Knauer, Berlin, Germany). The HPLC system comprises a model 2600 UV detector, a Smartline model 1050 pump, and a Smartline model 3950 autosampler equipped with ClarityChrom V2.6.2009 software. The detector was utilised at a wavelength of 280 nm, and a chromatographic column with dimensions of 125 × 4 mm, packed with Hyperisil ODS (C18) particles of 5 µm in size, was utilised. The mobile phase was 0.02 M potassium dihydrogen phosphate and acetonitrile (40/60/v/v) at a flow rate of 1 mL/min. The injection volume was 20 μL, and the column temperature was adjusted at 25 °C.

2.8. Elemental Analysis

The elemental analysis of CHNS/O was carried out using a Thermo ScientificTM FLASH 2000 CHNS/O (Waltham, MA, USA). The formulations were measured with a precision of 0.000001 g using tin crucibles weighing between 2.4 and 2.8 mg for CHNS mode analysis and silver crucibles weighing between 1.2 and 1.6 mg for oxygen mode analysis. In CHNS mode, standards were used to calibrate the instruments of sulphanilamide, L-methionine, 2,5-(Bis(5-tert-butyl-2-benzoxazol-2-yl) thiophene (BBOT), and L-cysteine. Benzoic acid and acetanilide were employed in the oxygen mode.

2.9. Formulation Biodegradation

2.9.1. The Testing Medium

To prepare the test medium, the following solutions were injected (per litre): 10 mL of solution A (adjusted to pH 7.4): 8.50 g of KH2PO4, 21.75 g of K2HPO4, 0.50 g of NH4Cl, and 33.40 g of Na2HPO4·2H2O; 1 mL of solution B: 22.50 g of MgSO4·7H2O; 1 mL of solution C: 36.40 g of CaCl2·2H2O; 1 mL of solution D: 0.25 g of FeCl3·6H2O.

2.9.2. Origin of Samples of Active Sludge

Aeration chamber samples of active sludge were collected first at the Pomorzany sewage treatment facility in Szczecin. Schulke Mikrocount Duo, a microbiological method, was used to ascertain the concentration of active sludge suspensions. This test was used to determine the total number of microorganisms expressed as colony-forming units (CFUs) per 1 mL of active sludge. A microbiological test, consisting of a medium and TTC agar containing Tergitol-7 (triphenyl tetrazolium chloride, according to ISO 9308-1:2014 [29]), was carried out by submergence in a sludge for ten seconds. The quantification of bacteria was conducted by comparing the visual characteristics of the test sample with those of a reference sample, both incubated for 96 h at ambient temperature [6].
Following the guidelines laid forth in the article [30], the Microbial Challenge Test was carried out. The microbiological challenge test was conducted using Schulke+ mikrocount® dual-dip slides, which consist of two agar surfaces. The pink surface stimulates the development of fungi and yeast, whereas the yellow surface supports the growth of bacteria. The activated sludge test sample was immersed in a beaker containing 100 mL of activated sludge and placed on the surface of the agar. To optimise bacterial development, the slide was hermetically sealed and undisturbed for 72 h. The measurements were taken at 25 ± 1 °C (relative humidity of 33%). Using Schulke’s colony density charts, we measure the density of colonies on the nutrition plate. After 72 h, every one of the 10 activated sludge samples tested showed signs of microbial growth. The activated sludge samples that were tested showed a colony density of 106 CFU·mL−1.
Furthermore, the experimental procedure using agar medium was utilised to determine the total number of microorganisms contained in one millilitre of activated sludge, which was found to be 0.95·105 CFU·mL−1. The bacteria were cultured on a medium from Merck Millipore called Lactose Tergitol, which contains 7 TTC agar. Twenty millilitres of media were poured into Petri plates with a diameter of ninety millimetres. A diluted solution of activated sludge, consisting of one millilitre diluted in PBS at a ratio of 1:1000, was introduced into the medium. The inoculum was spread out uniformly throughout the medium’s surface. In order to optimise bacterial proliferation, the slide was subsequently hermetically sealed and kept undisturbed for a duration of 72 h (37 ± 1 °C). The density of the bacterial cultures ranged between 0.95 and 0.99·106 CFU·mL−1.

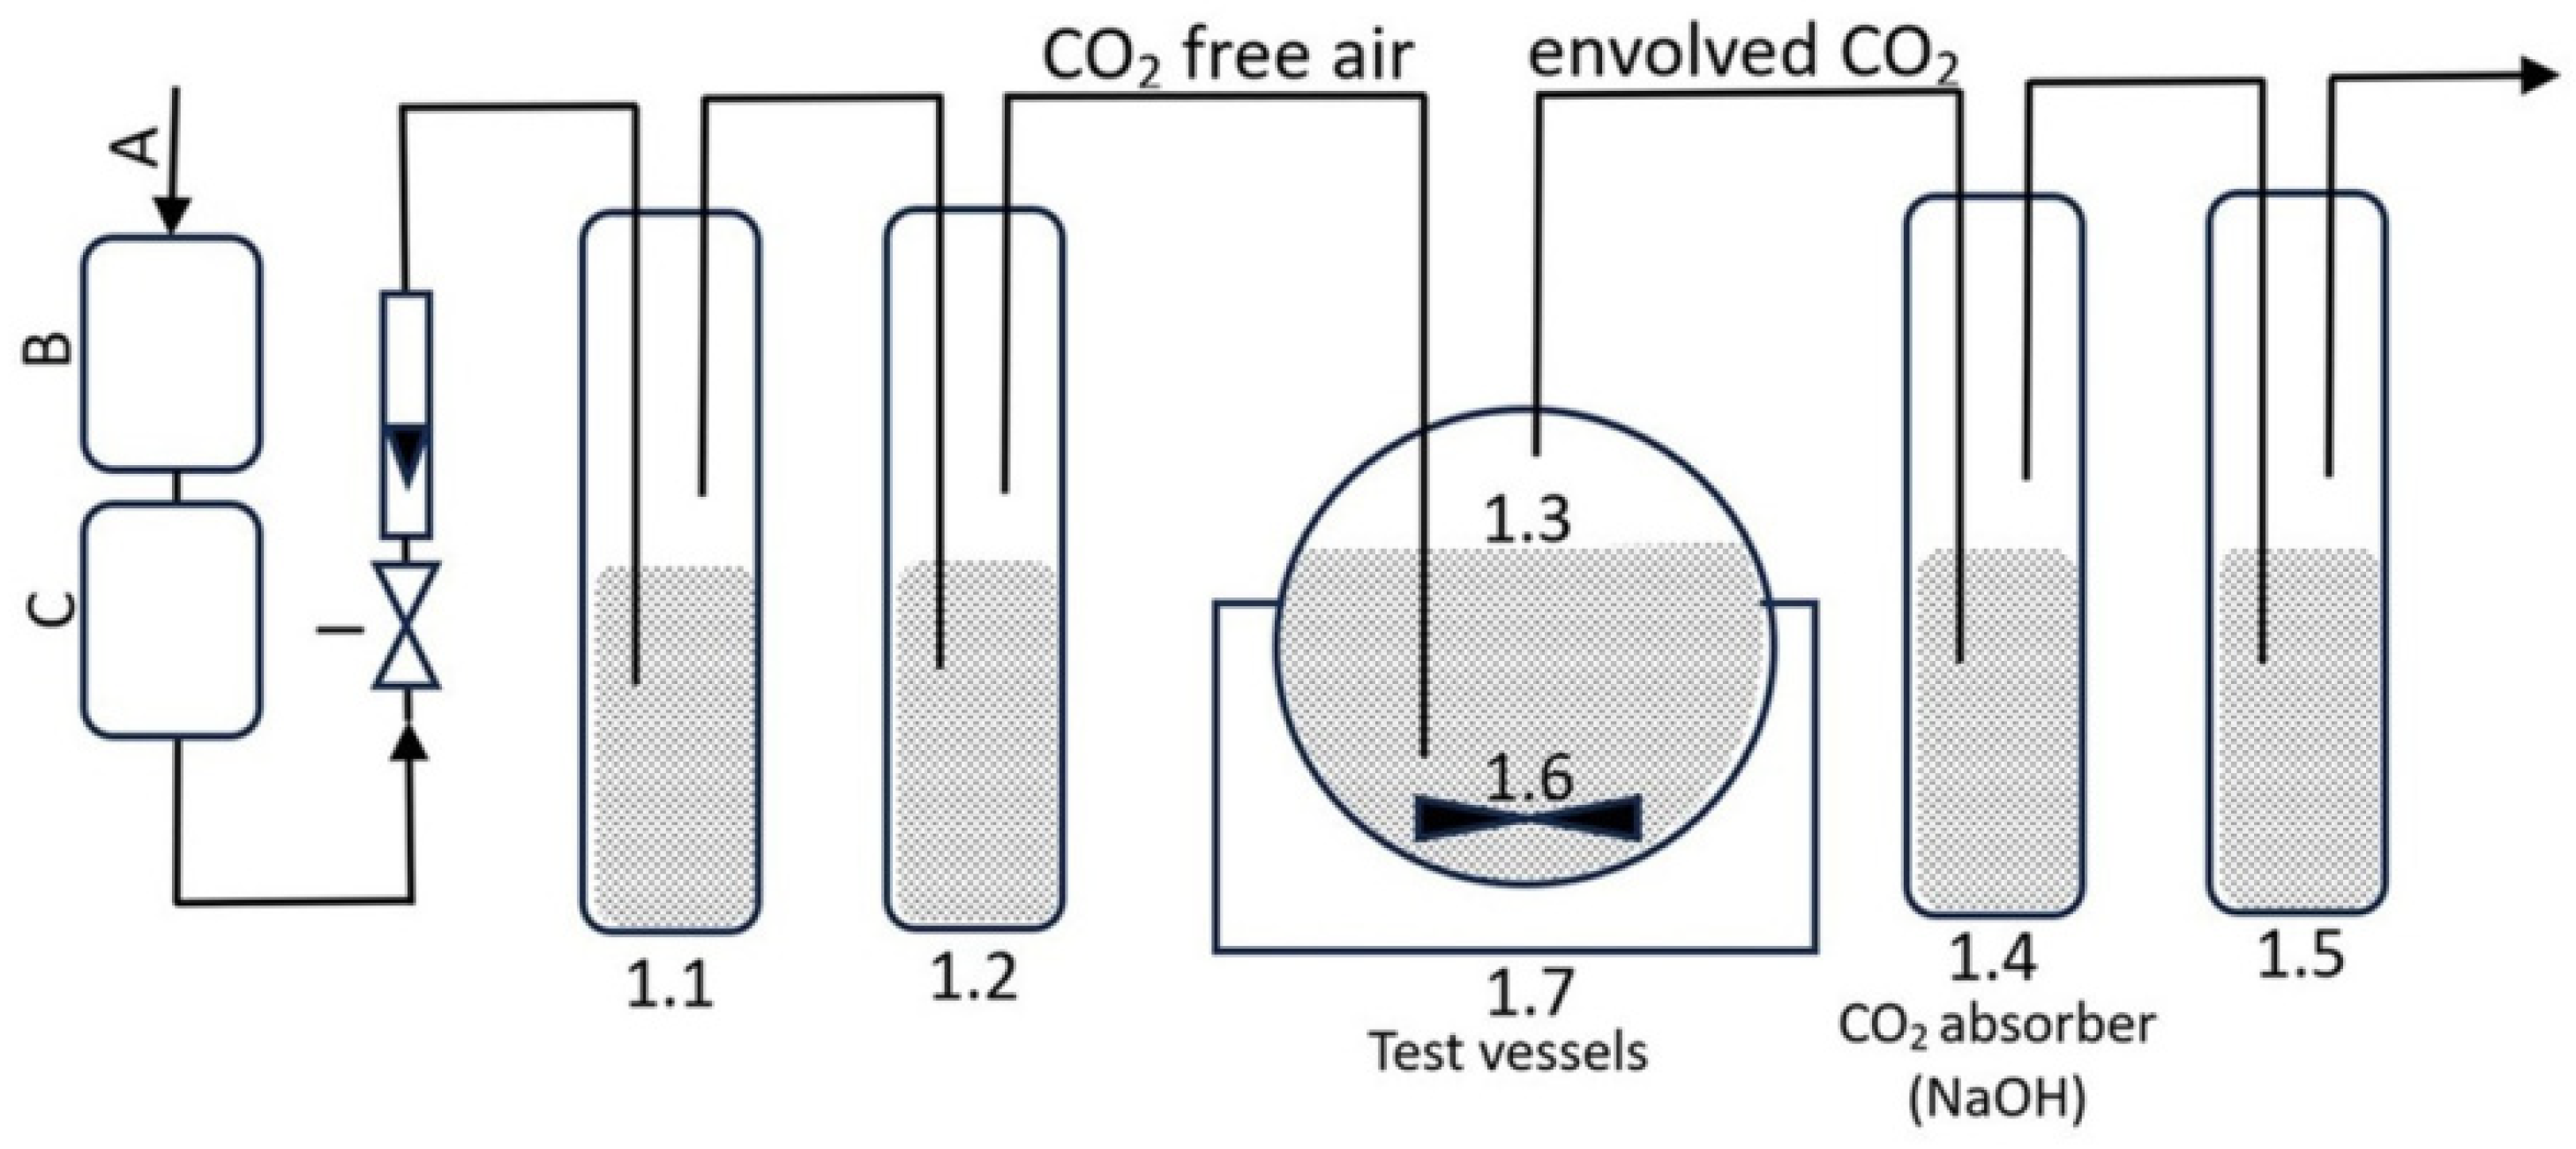
2.9.3. Aerobic Biodegradation Potential Assessment Method for Formulations

Formulations (F1-IBU/IBUNa, F2-IBU/IBUNa, F3-IBU/IBUNa, F4-IBU/IBUNa, and F5-IBU/IBUNa), along with SDS as a reference compound, were tested in duplicate with an organic carbon concentration of 40 mg·L−1. The results were reported as the mean value ± SD. In two separate measuring vessels, two experiments were carried out independently.
Figure 1 shows the layout of the test containers (1.1, 1.2, 1.3, 1.4, and 1.5) and the location of a magnetic stirrer (1.6) linked via tubes. Air was aerated through CO2 absorbers to prepare the test apparatus. Air, regulated by a valve, was directed to a carbon dioxide absorber (1.1) and then to a carbon dioxide indicator (1.2) to detect the presence of CO2 in the air through turbidity. In test vessel 1.3, 250 mL of the test medium, 100 mg of active sludge, and formulations containing 40 mg·L−1 of organic carbon were placed. The initial formulation concentrations were 52.89 mg·L−1 for IBU, 58.53 mg·L−1 for IBUNa, 335.01 mg·L−1 for F1-IBU, 361.99 mg·L−1 for F1-IBUNa, 137.27 mg·L−1 for F2-IBU, 153.85 mg·L−1 for F2-IBUNa, 54.00 mg·L−1 for F3-IBU, 54.14 mg·L−1 for F3-IBUNa, 52.69 mg·L−1 for F4-IBU, 53.00 mg·L−1 for F4-IBUNa, 52.93 mg·L−1 for F5-IBU, 53.30 mg·L−1 for F5-IBUNa, and 84.11 mg·L−1 for sodium dodecyl sulphate.
Carbon dioxide was formed in vessel 1.3:
2 NaOH + CO2 = Na2CO3 + H2O,
To determine the carbon dioxide content in vessel 1.3, 10 mL of the solution from vessel 1.4 was transferred to a 25 mL volumetric flask. The flask was filled with deionised water up to the designated maximum level. Next, TOC-LCSH/CSN SHIMADZU CORPORATION analysed the sample (twice) using a total organic carbon analyser:
3 Na2CO3 + 2 H3PO4 = CO2 + 2 Na3PO4 + 3 H2O,
3 NaHCO3 + H3PO4 = CO2 + Na3PO4 + 3 H2O,
Sodium carbonate and sodium bicarbonate, when treated with phosphoric acid, undergo a chemical reaction that produces carbon dioxide. Initially, calibration curves for NaHCO3 and Na2CO3 were established. In order to do this, a 1000 mL flask was filled with 4.415 g of Na2CO3 that had been dehydrated in a muffle furnace and 3.500 g of NaHCO3 that had been dehydrated using silica gel. The dilutions of sodium carbonate and sodium dicarbonate were made within the concentration range of 0–100 mg·L−1 inorganic carbon (IC). The next step was to create a calibration curve. The volume of the dispensed sample was 50 µL. The inorganic carbon (IC) content in the test specimens was calculated using the calibration curve equation, which is y = 4.1187x + 7.1718 (R2 = 0.999).
The carbon dioxide measurement device is depicted in Figure 1 and comprises the following components:
  • I: air with an aeration rate of 50–100 mL·min−1, employed to oxygenate the entire testing system;
  • B and C: CO2 absorber (KOH);
  • 1.1: The CO2 absorber consists of potassium hydroxide with a concentration of 5 mol·L−1;
  • 1.2: The CO2 indication is performed using barium hydroxide with a concentration of 0.01 mol·L−1;
  • 1.3: The test containers have a capacity of 500 mL and are stirred using a magnetic stirrer 1.6;
  • 1.4: Sodium hydroxide is used as the CO2 absorber (the concentration of sodium hydroxide used as a CO2 absorber is 0.05 mol·L−1);
  • 1.5: Distilled water is used as the O2 absorber;
  • 1.6: A container filled with distilled water, in which test vessels with a capacity of 500 mL were placed;
  • 1.7: A cryostat that accurately controls the temperature of the distilled water in the container. The incubation process was conducted at 23 ± 0.5 °C for 28 days.
The degree of biodegradation was measured using Formula (9):
% B = [ C I C i · V 0 + i = 1 n ( C I C i + 1 + C I C i ) · ( V 0 i · V p ) ] · R m · U · 100 %
where
  • %B—degree of biodegradation;
  • CIC—concentration of inorganic carbon in the test vessel 1.4, obtained by TOC analysis of the test sample corrected by blank (mg·L−1);
  • R—dilution of the sample collected from the test vessel 1.4 (2.5);
  • V0—the initial volume of NaOH solution in the test vessel 1.4 (0.25 L);
  • i—sample number;
  • Vp—the volume of the sample taken from the test vessel 1.4 (0.01 L);
  • m—mass of test compound injected into the test vessel 1.3 (mg);
  • U—the proportion of carbon in the test compound introduced into the test vessel 1.3 (-).

2.10. Swelling Assessment of Hydrogel Formulations

The swelling (S) of hydrogel formulations (F1-IBU and F1-IBUNa) containing IBU and IBUNa (as active substances) was assessed using a modified methodology [31]. Hydrogel swelling was carried out as follows: 10.000 g of the respective hydrogels (F1-IBU and F1-IBUNa) were introduced into 50 mL plastic tubes, followed by the addition of 25 mL of a 0.9% NaCl solution (simulated body fluid) [31,32]. The tubes were sealed with a stopper and incubated in a water bath (for 24 h) at 37.0 ± 0.5 °C. After this time, the samples were centrifugated for 30 min at 25 °C and 4000 rpm to separate the NaCl solution from the test formulation. The NaCl solution was thoroughly decanted, and the contents of the swollen hydrogels were weighed. Three independent experiments were performed for each test formulation.
The swelling capacity S (g/g) was calculated according to Equation [31]:
S = ( W 1 W 0 ) / W 0
where
  • W1 (g)—weight of the swollen hydrogels F1-IBU and F1-IBUNa;
  • W0 (g)—weight of the obtained hydrogels F1-IBU and F1-IBUNa.

2.11. Statistical Analysis

The outcomes are shown as the average value plus or minus the standard deviation (SD). The results of an ANOVA were analysed in a unidirectional manner. To determine whether there were significant differences between the groups, the Tuckey test was used, with α < 0.05, to calculate the total mass after 24 h of permeation and the total mass in the skin. Cluster analysis was utilised to determine the similarities between all tested chemicals and vehicles, taking into account all time points. Based on this premise, sets of molecules with comparable permeability were introduced. StatSoft’s Statistica 13.3 PL software (Kraków, Poland) was used to do the statistical computations.

3. Results and Discussion

The permeability data, together with the biodegradation results, offer a comprehensive insight into both the environmental consequences and medicinal effectiveness of ibuprofen formulations. The kind of vehicle and the structural modifications of active compounds (in acid or sodium form) directly influence the biodegradability of the formulations using bacterial cultures. Generally, hydrogel carriers improve biodegradability, facilitating easier degradation by microorganisms, whereas others diminish biodegradability, causing them to persist longer in the environment. A suitable pharmaceutical vehicle type, the distinctive chemical structures of active compounds, and their inherent properties are likely key factors in determining their rates of biodegradation.
Both our study and studies by other authors have shown that gel formulations containing ibuprofen as an active ingredient are potential candidates for IBU drug delivery [33]. An in vitro cytotoxicity experiment conducted on peripheral blood mononuclear cells (PBMCs) demonstrated that the gel treated with IBU is non-toxic and compatible with living organisms. A biodegradation investigation has shown that the hydrogel is highly biodegradable [34]. Drug release is controlled by the diffusion process, which is influenced, among others, by chemical modifications of the active substance contained in various types of formulations. Studies by other authors have shown that bacterial cellulose (BC)-based nanogels may be effective for the intrusive, customised delivery of protein and non-protein medications, provided that such nanogels biodegrade in vivo [35]. It has been shown that nanogels may also be employed as delivery systems that respond to biomolecules, such as glucose-sensitive hydrogels for insulin administration. Additionally, these hydrogels can be utilised for precise administration of medication [36,37,38].
During the preparation of hydrogel, organogel, Eucerin ointment, and silicone ointment, heating was required to 60, 50, 70, and 60 °C, respectively. Both ibuprofen and sodium ibuprofenate remain stable at these temperatures, and their decomposition onset temperatures are 193.2 and 265.4 °C, respectively [39]. Therefore, there is no risk that these compounds decompose during the formulation process.

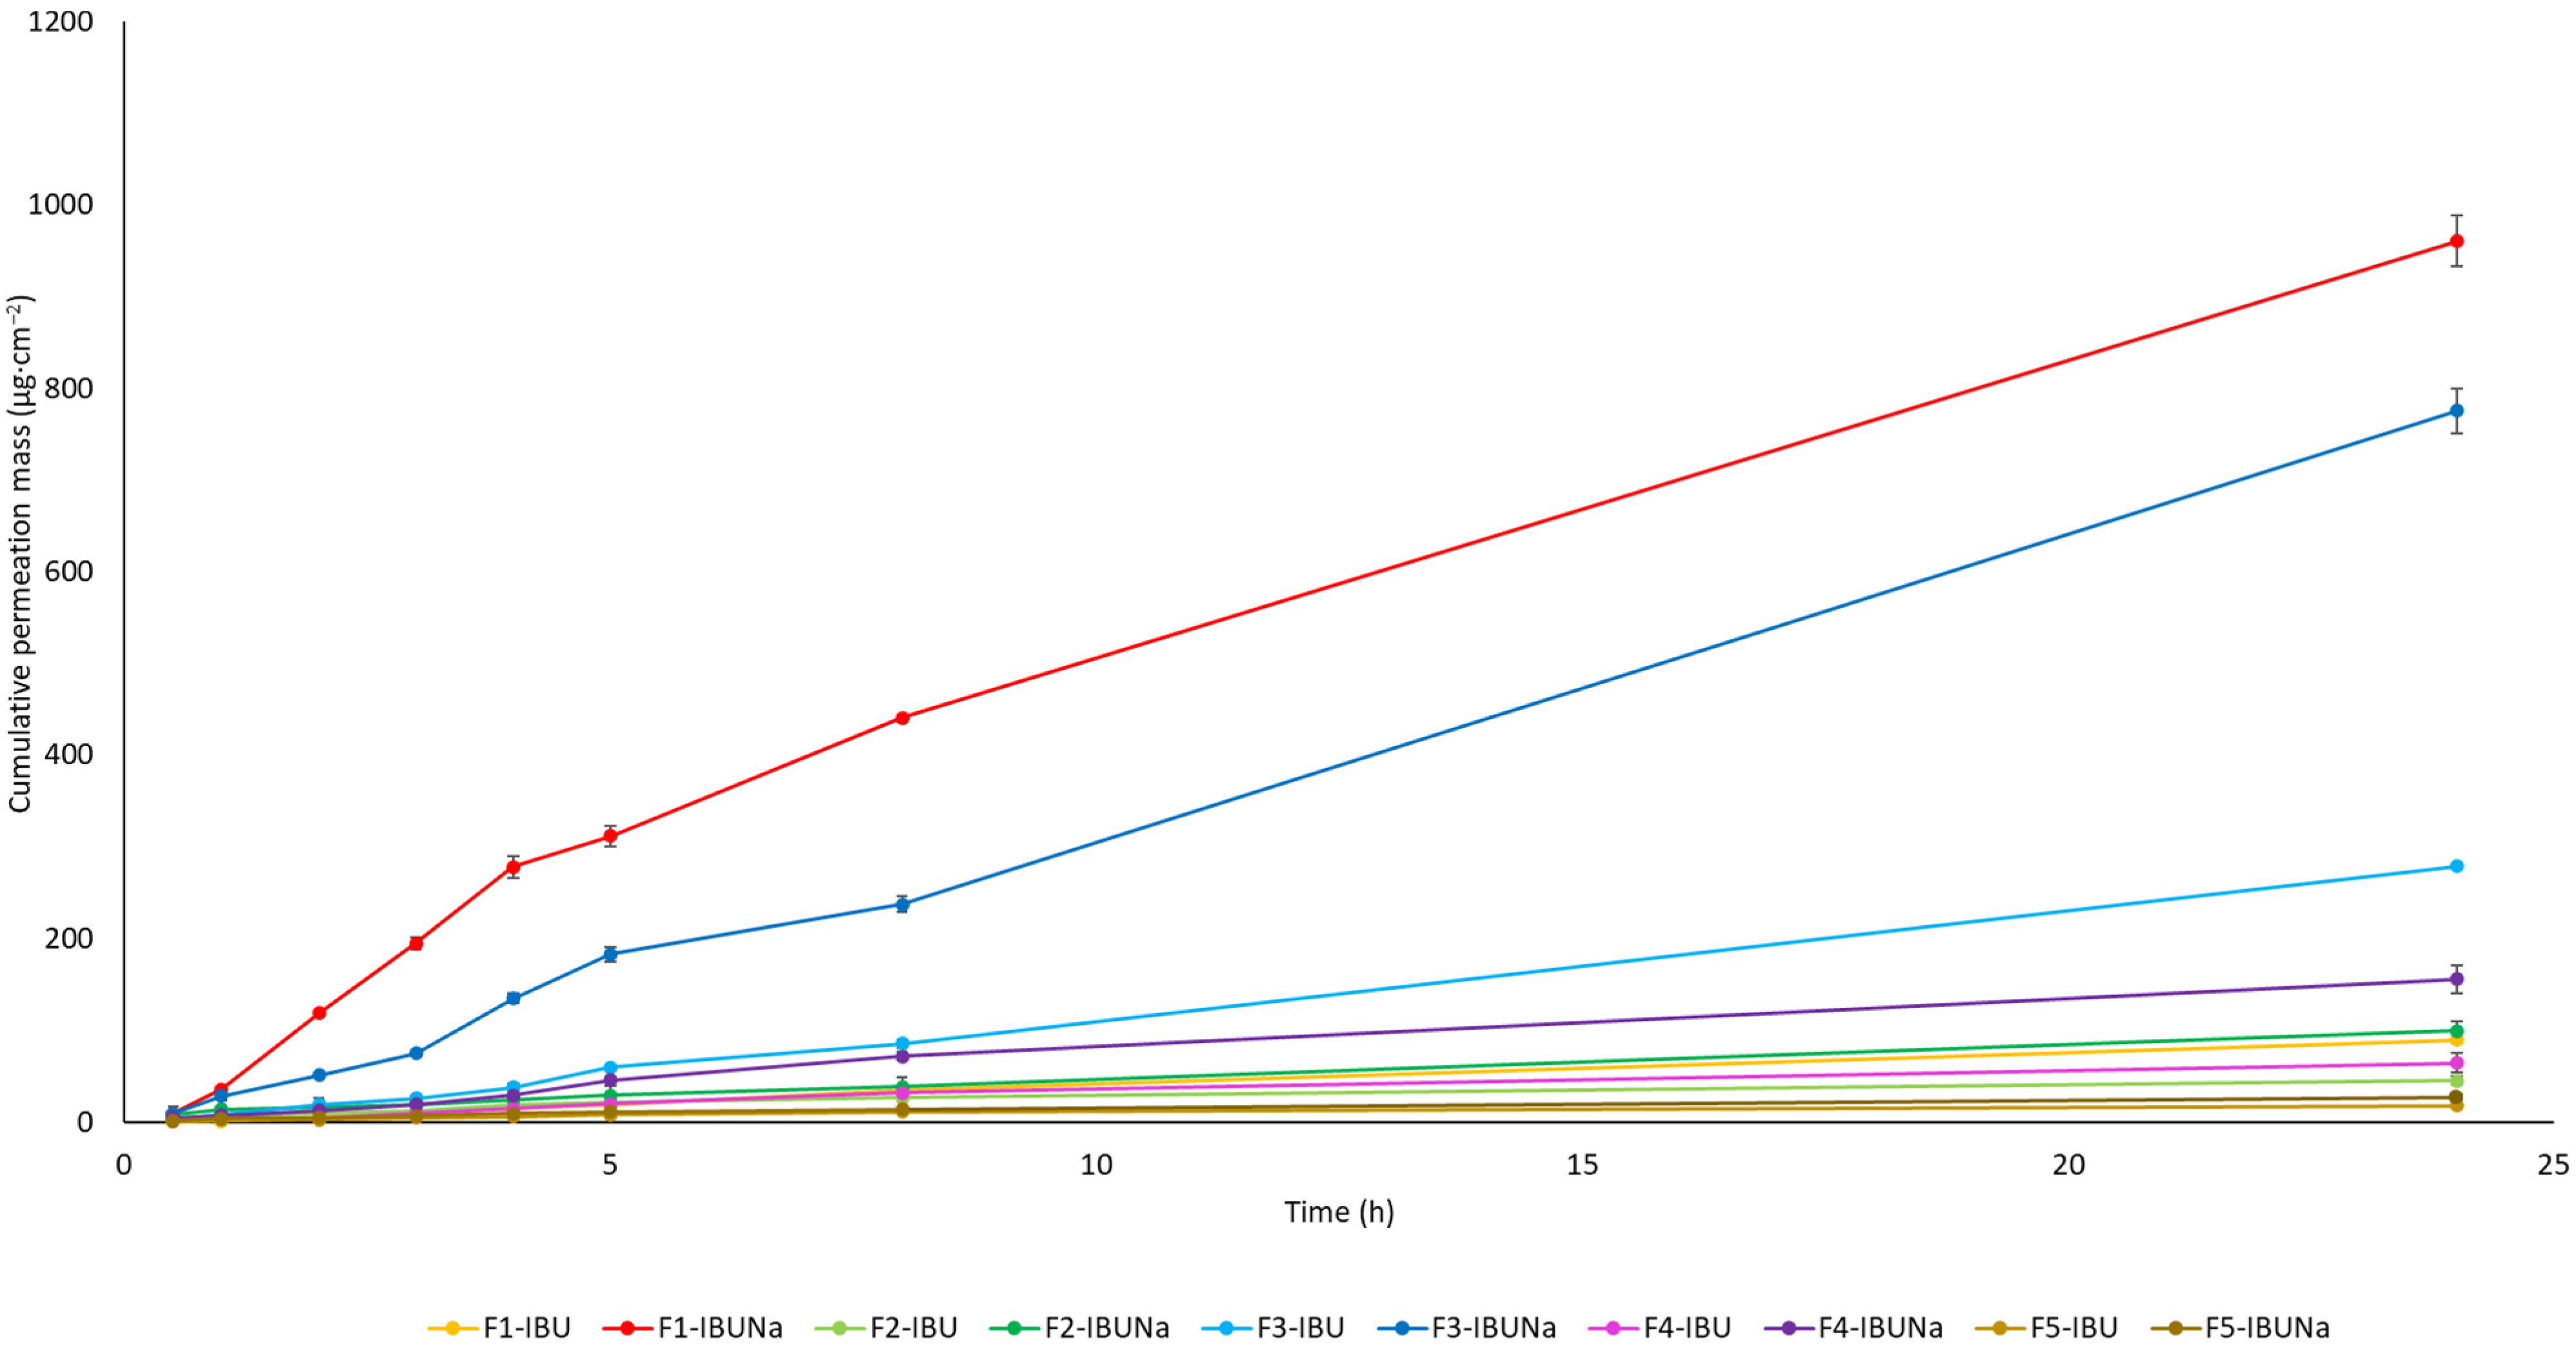
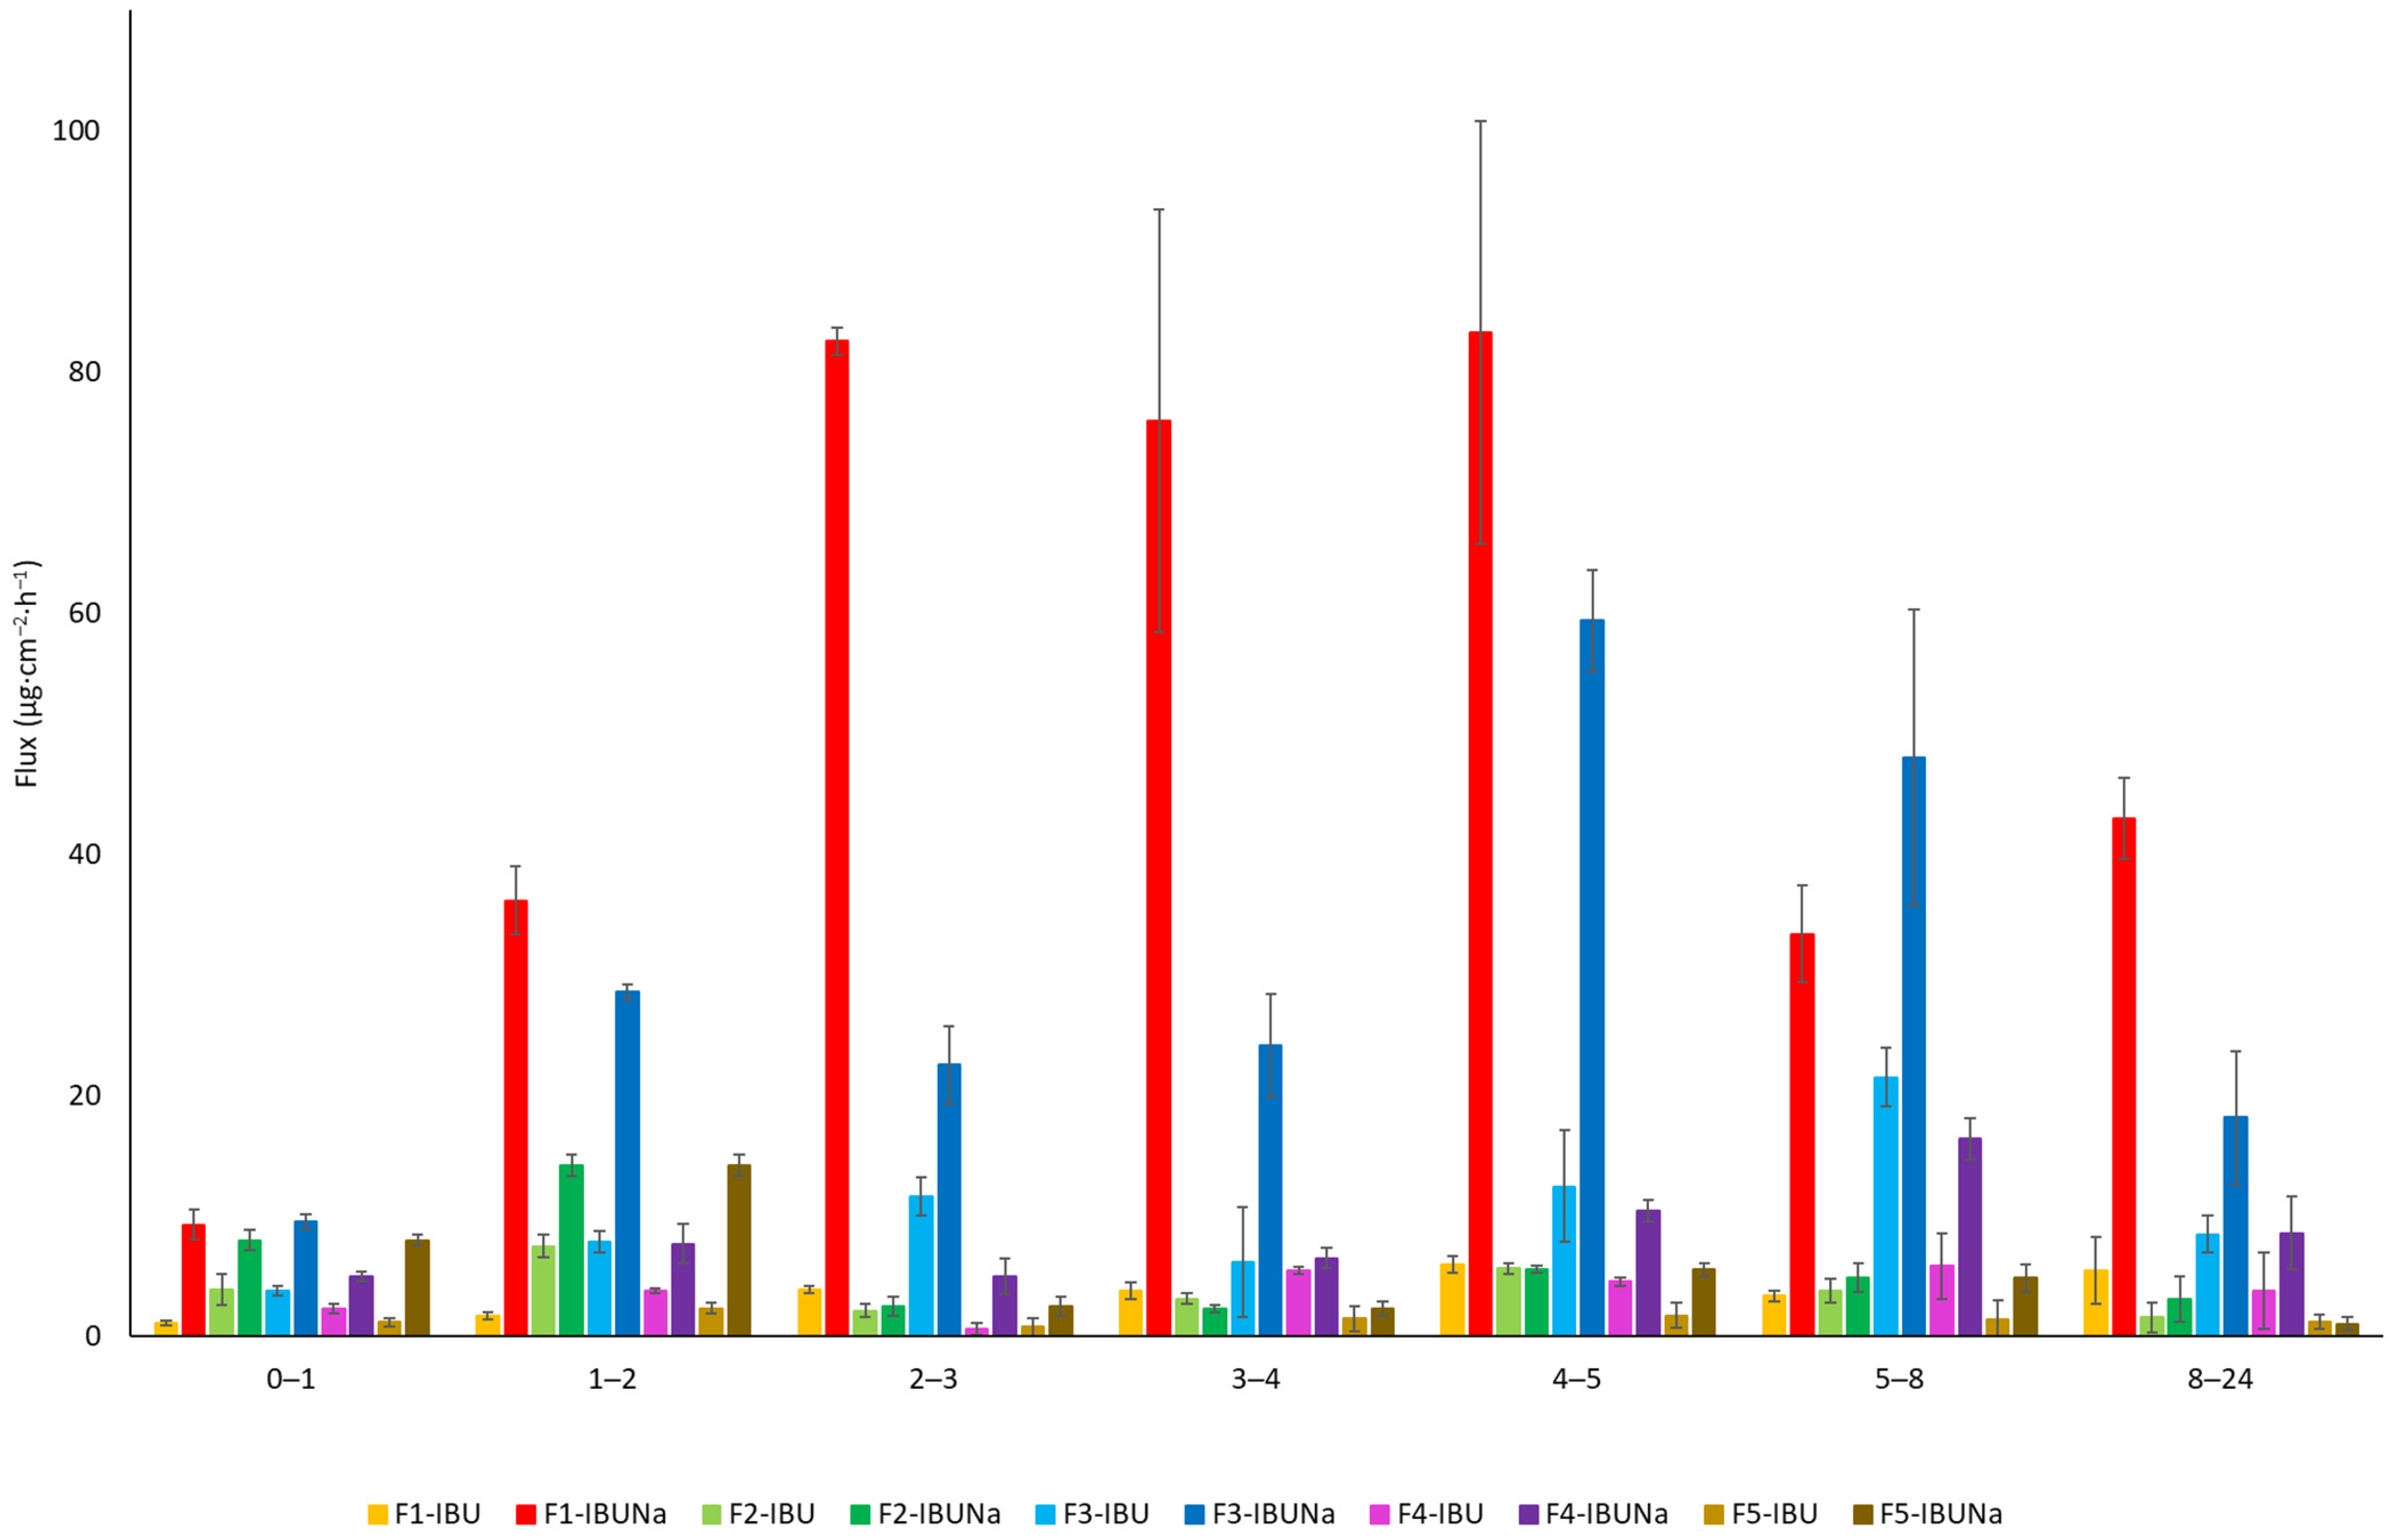
3.1. Permeations of Active Compound Studies

The formulations, designated as F1 through F5, encompass various vehicles, including hydrogel (F1), organogel (F2), Eucerin ointment (F3), silicone ointment (F4), and zinc ointment (F5). Each formulation offers unique characteristics (especially hydrogel preparations) that influence drug permeation, retention, and therapeutic efficacy. The detailed investigation into the permeation behaviour of ibuprofen (IBU) and its sodium salt derivative (IBUNa) across various formulations provides a nuanced understanding of the transdermal delivery potential of each vehicle.
The cumulative mass of the IBU and IBUNa (from hydrogels F1-IBU and F1-IBUNa and other formulations including organogel (F2-IBU and F2-IBUNa), Eucerin (F3-IBU and F3-IBUNa), silicone (F4-IBU and F4-IBUNa), and zinc ointments (F5-IBU and F5-IBUNa)) acceptor fluid, taking all time points, is shown graphically in Figure 2. Table 1 shows the total IBU and IBUNa concentrations in the acceptor fluid after 24 h of permeation. The highest accumulated mass was observed in the hydrogel (F1) containing IBUNa (960.092 ± 27.776 µg·cm−2) and slightly lower in Eucerin ointment (F3) containing IBUNa (775.016 ± 24.641 µg·cm−2). Notably, both IBU and IBUNa permeated from all analysed vehicles, with variations observed depending on the substrate and the compound used.
Figure 2 shows the temporal progression of the total mass of IBU and IBUNa after 24 h of penetration. In most vehicles, significantly higher permeation of ibuprofen salts was also observed compared to pure ibuprofen. The exception was zinc ointment, from which IBUNa also penetrated in greater amounts but without statistically significant differences, whereas upon analysing the cumulative mass from all time points, significant differences between IBU and IBUNa were observed in the case of Eucerin and silicone ointment and were calculated using the Mann–Whitney test (Table 2).
The penetration rate is seen in Figure 3, obtained at each time period. The samples from a hydrogel containing IBUNa showed the maximum penetration rate into the acceptor fluid, particularly between 2 and 5 h.
Hydrogels, recognised for their high water content and ability to mimic the extracellular matrix, showed remarkable potential in promoting drug permeation. F1-IBUNa displayed the highest cumulative mass and permeation rate among all formulations, underlining the efficacy of hydrogels in facilitating the transdermal delivery of sodium ibuprofenate. The silicone ointments demonstrated distinct permeation characteristics. F4-IBUNa exhibited significantly higher cumulative mass and permeation rate compared to F4-IBU. The steady-state flux (JSS) values also favoured F4-IBUNa, indicating the potential of silicone ointment to enhance the permeation of sodium ibuprofenate. Eucerin ointments, formulated with a focus on skin health, exhibited notable differences in permeation behaviour (Table 1, Figure 3). F3-IBUNa showcased a higher cumulative mass and permeation rate than F3-IBU, suggesting that the specific composition of Eucerin ointment influences the transdermal absorption of sodium ibuprofenate. Organogels, characterised by their unique structure, showed varied permeation profiles. F2-IBUNa demonstrated a higher cumulative mass and permeation rate than F2-IBU, emphasising the potential of organogels in enhancing the transdermal delivery of sodium ibuprofenate. Zinc ointments, which often serve as skin protectants, exhibited interesting results. While F5-IBUNa displayed a higher cumulative mass and permeation rate compared to F5-IBU, the differences were not statistically significant. This suggests that hydrogel vehicles may affect API penetration to a greater extent than other formulations.
The release profiles of ibuprofen and ibuprofenate sodium, expressed per IBU amount, are presented in Figure 4. In this study, we evaluated the release kinetics of ibuprofen (IBU) and ibuprofen sodium (IBUNa) from various formulations using the Korsmeyer–Peppas model. For F1-IBU, F1-IBUNa, F2-IBU, F2-IBUNa, F3-IBU, F3-IBUNa, F4-IBU, F4-IBUNa, F5-IBU, and F5-IBUNa formulations, the correlation coefficients (R) were found to be 0.9811, 0.9811, 0.9275, 0.9567, 0.9017, 0.9344, 0.9510, 0.9510, 0.9510, and 0.9510, respectively. The results for F1-IBU and F1-IBUNa show a release exponent n of 0.96 for both, with release rate constants k of 0.0131 and 0.0029, respectively. Given that n is close to 1, this indicates a case-II transport mechanism, which suggests anomalous transport involving both diffusion and polymer relaxation. For F2-IBU, the release exponent n is 0.83, and the release rate constant k is 0.0237, whereas F2-IBUNa has an n of 0.75 and a k of 0.0206. These n values, being between 0.5 and 1, indicate anomalous (non-Fickian) transport, suggesting that drug release is governed by a combination of diffusion and polymer relaxation processes. In the case of the Eucerin ointment (F3-IBU and F3-IBUNa), the n values are 0.60 and 0.47, with k values of 0.0487 and 0.0692, respectively. The n value for F3-IBU suggests an anomalous transport mechanism, while the n value for F3-IBUNa, being close to 0.5, indicates a more Fickian diffusion-dominated release. For the silicone ointment (F4-IBU and F4-IBUNa), both formulations have the same n value of 0.51, with k values of 0.0769 and 0.0653. The n value suggests an anomalous transport mechanism, where both diffusion and relaxation of the polymer network contribute to the release of the drug. Finally, the zinc ointment formulations (F5-IBU and F5-IBUNa) also share the same n value of 0.51, with k values of 0.0823 and 0.0689, respectively. Similar to the silicone ointment, the n value indicates an anomalous transport mechanism, combining diffusion and polymer relaxation. These findings suggest that the release kinetics are influenced by both the type of drug and the base formulation, with notable variations in the release rate constants and release exponents across different formulations. Whereas, analysing the cumulative mass from all time points, significant differences were observed in the case of F1-IBU and F1-IBUNa, which was shown using the Mann–Whitney test (Table 3).
Furthermore, the compounds utilised collected in the skin, with the highest accumulation values obtained for IBUNa release from hydrogels and silicon ointment 793.0131 ± 94.3635 and 742.2836 ± 117.3303 µg IBU·g−1, respectively (Figure 5).
The outcomes of the in vitro permeation of hydrogel and other vehicle experiments involving ibuprofen and its salts were consolidated and are presented in Table 4. Permeation parameters were computed, encompassing flux, apparent permeability coefficient, the value of the skin’s diffusion coefficient, lag time, percentage of API, and skin partition coefficient, permeated after 24 h. A noticeable disparity operating at steady-state flux was observed, dependent on both the vehicle employed and the form of ibuprofen. In all cases, the steady state flux is higher when using sodium salt than when using acid form. The highest value (80.127 ± 3.269 µg·cm−2·h−1) was acquired for the hydrogel vehicle. The permeability coefficient (KP), which provides a quantitative estimate of the pace at which a chemical may permeate the skin, was also calculated. KP takes into account factors associated with both the drug and the barrier, along with their interactions, thereby eliminating the impact of compound concentration. As the testing was being prepared, KP values varied from 0.032∙103 cm·h−1 for F5-IBU to 1.603∙103 cm·h−1 for F1-IBUNa. The designated delay time ranged from below 0, indicating immediate release of the substance from the preparation with immediate noticeable skin penetration to 1.647 h. Furthermore, the percentage of the applied dose was assessed. These values ranged from 0.04% for F5-IBU to 1.92 for F1-IBUNa. This confirms that the greatest increase in ibuprofen permeation was achieved when its sodium salt was used in a hydrogel formulation.
The major distinctions observed in cumulative mass and permeation rate between IBU and IBUNa across various formulations highlight the influence that the chemical form of ibuprofen has on transdermal behaviour. Sodium ibuprofenate consistently showed higher permeation, emphasising its potential as a more efficacious transdermal therapeutic agent. Analysing permeation parameters (Table 4) across formulations provides additional depth to the discussion. The steady-state flux (JSS) values reveal that, in general, sodium ibuprofenate consistently exhibits higher flux compared to its acid form. Hydrogels, in particular, stand out as effective vehicles for promoting steady-state flux. Permeability coefficient (KP) values further emphasise the role of formulation in determining the rate of skin penetration. Hydrogels, once again, demonstrate high KP values, indicating their efficiency in facilitating drug penetration through the skin. Lag time (LT) values provide insights into the delay before substance release becomes noticeable. The LT values below 0 for certain preparations suggest immediate release, emphasising the rapid action potential of specific formulations. A proportion of the applied dose values underscores the practical implications of transdermal medication administration. The higher percentages for formulations containing IBUNa highlight its enhanced permeation compared to IBU, especially in hydrogel formulations.

3.2. Elemental Analysis of Formulations Studies

Before beginning the biodegradation experiments on hydrogels (and other formulations containing APIs), elemental analysis was used to verify the organic carbon content. The following are the results for the carbon content formulations that were tested: the organic carbon analysis (% C) for IBU: 75.63; for IBUNa: 68.34; F1-IBU: 75.91; for F1-IBUNa: 75.47; for F2-IBU: 11.94; for F2-IBUNa: 11.05; for F3-IBU: 74.073; for F3-IBUNa: 73.88; for F4-IBU: 29.14; for F4-IBUNa: 26.00; for F5-IBU: 75.57; for F5-IBUNa: 75.04; and for SDS: 46.14.

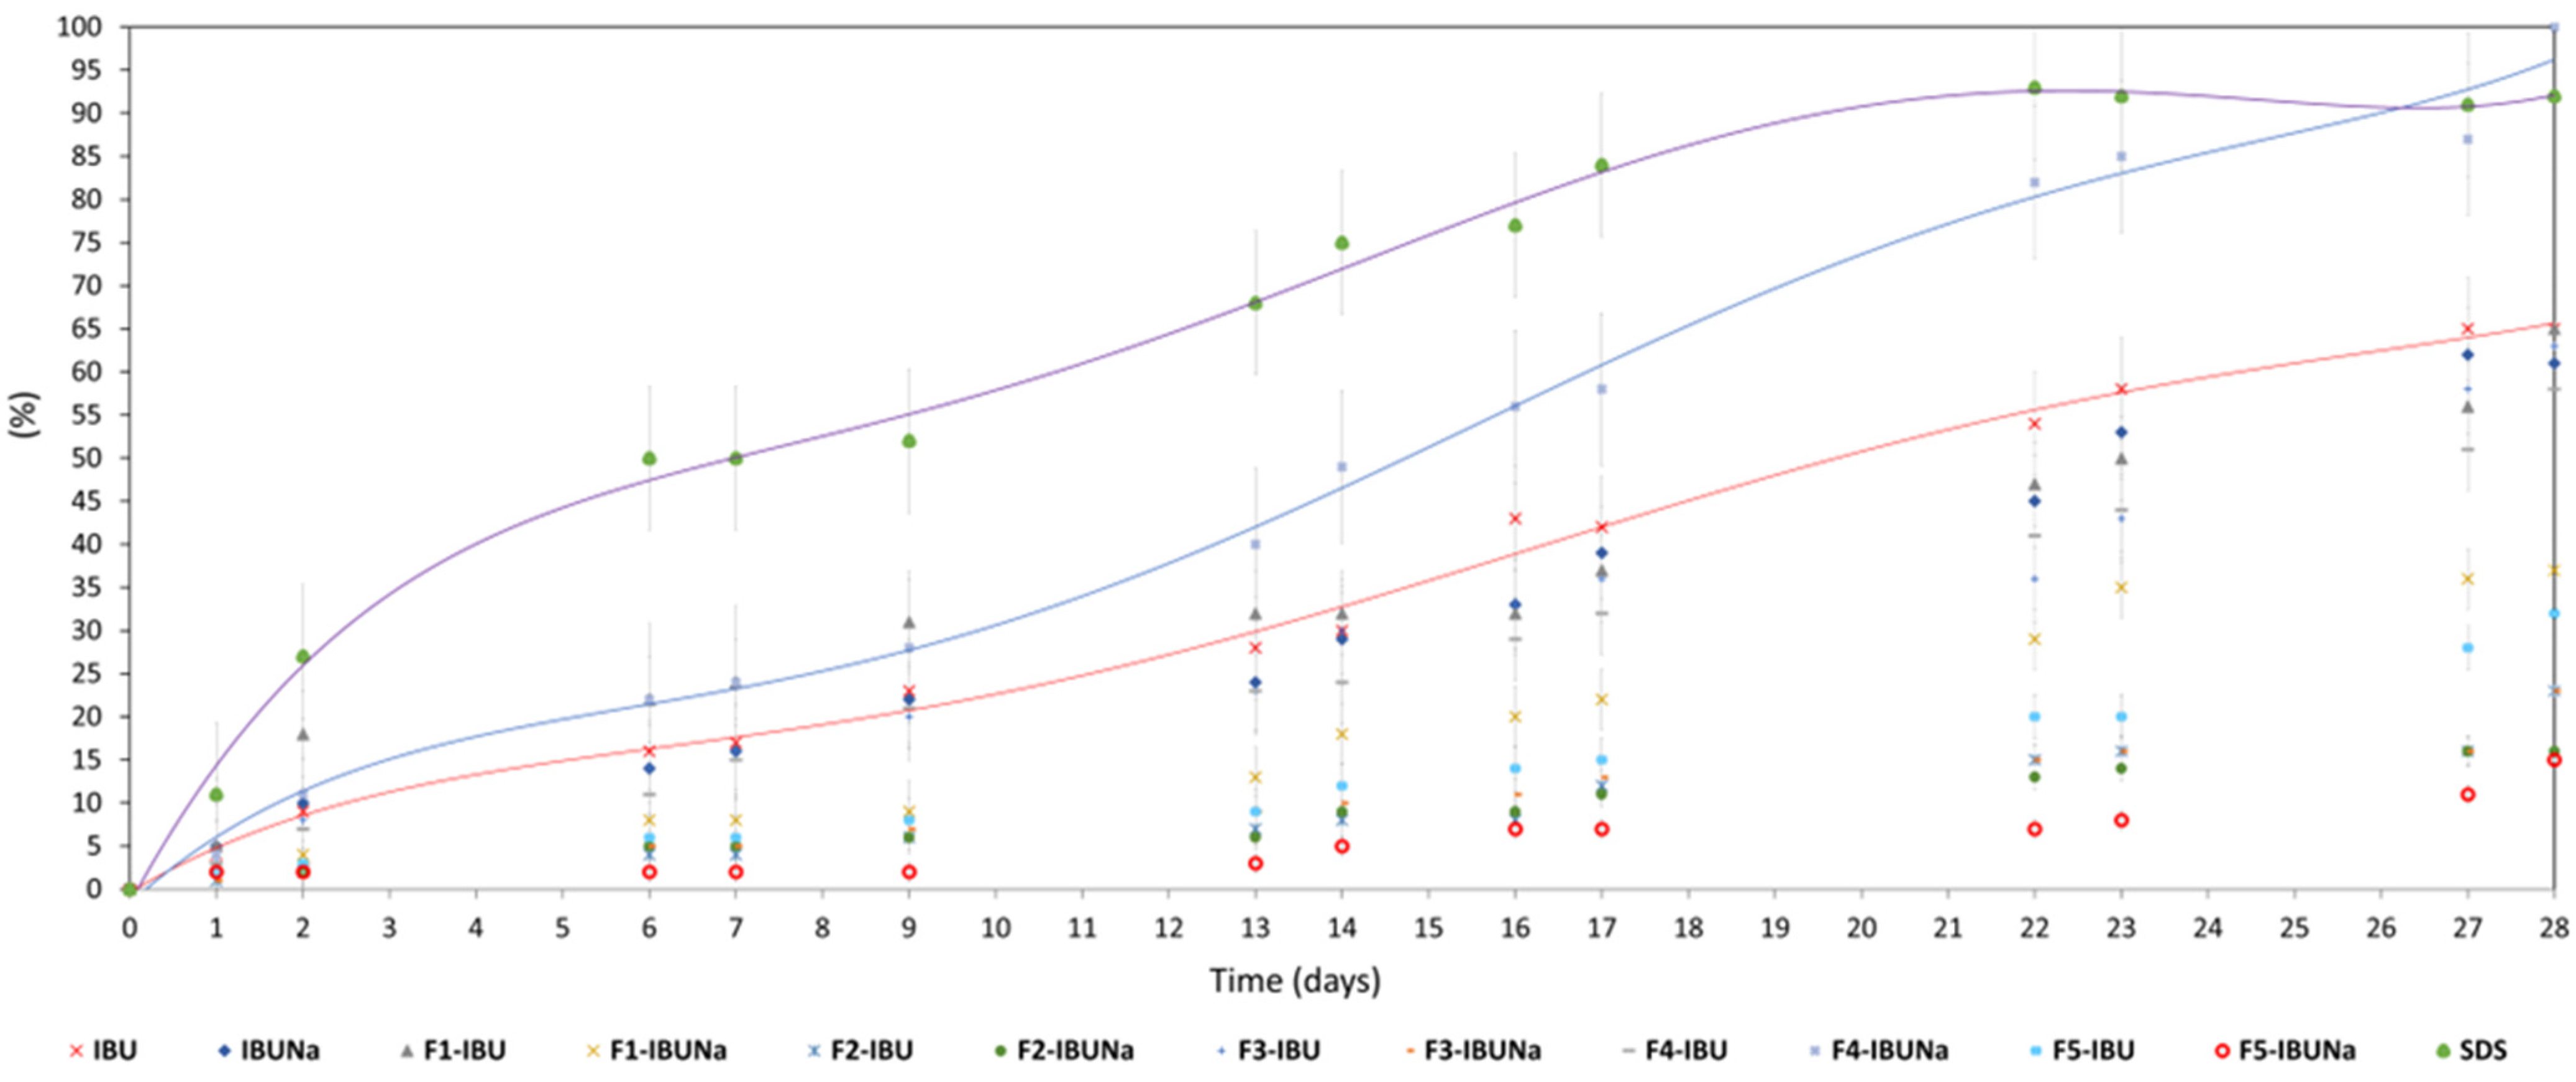
3.3. Biodegradation Studies

Biodegradation of hydrogels (F1-IBU and F1-IBUNa), initial API (IBU and IBUNa), as well as other formulations (F2-IBU, F2-IBUNa, F3-IBU, F3-IBUNa, F4-IBU, F4-IBUNa, F5-IBU, and F5-IBUNa) by bacterial cultures is seen in Figure 6 and Table S1.
The highest percentage of biodegradation (65% ± 6) was observed for the hydrogel formulation (F1-IBU), which classifies this formulation as easily degradable. Moreover, the highest degree after 28 days of biodegradation, 65% ± 3 of ibuprofen and 61 ± 3 of IBUNa, and slightly higher degrees of biodegradation (92% ± 5) were characterised by the standard compound (SDS—sodium dodecyl sulphate). In the case of F4-IBUNa, the percentage of biodegradation was 100% ± 9; for F1-IBU, the percentage of biodegradation was 65% ± 6; and for F3-IBU, the percentage of biodegradation was 63% ± 6. After 28 days, seven formulations were shown to have a low sensitivity to biodegradation: F1-IBUNa (37% ± 6), F2-IBU (23% ± 2), F2-IBUNa (16% ± 2), F3-IBUNa (23% ± 6), F4-IBU (58% ± 2), F5-IBU (32% ± 6), and F5-IBUNa (15% ± 1)—Figure 6 and Table S1.
There are no reports in the literature on the degradation of sodium ibuprofenate. The literature data show that the sodium form of nonsteroidal anti-inflammatory drugs (NSAIDs), for example, sodium diclofenac, is quite difficult to degrade [40,41,42,43]. There are no significant differences between the biodegradation of ibuprofen and its sodium salt. The latest investigation confirms that the activated sludge was highly effective in the biodegradation of both IBU as well as IBUNa drugs. Thus, it was observed that microorganisms present in activated sludge can degrade NSAIDs of different natures and could be used to degrade drug contaminants in wastewater.
Evidence demonstrates that this particular pharmaceutical carrier greatly influences the formulation’s biodegradation. Here is how the kind of vehicle influences biodegradation: I—Easily biodegradable formulations, F1-IBU, F3-IBU, and F4-IBUNa, all exhibited substantial degrees of biodegradation (ranging from 63% ± 6 to 100% ± 9) following a 28-day period. This suggests that hydrogel base and Eucerin ointment containing the acid form (ibuprofen) and silicone ointment containing the sodium form (sodium ibuprofenate) are readily biodegradable. Certain constituents included in these preparations are likely to increase their vulnerability to microbial breakdown. The nature of vehicles and the structural modifications of active compounds (whether in acid or sodium form) may render them more attractive to biodegrading microorganisms, resulting in elevated degradation rates. II—Formulations with poor biodegradability, F1-IBUNa, F2-IBU, F2-IBUNa, F3-IBUNa, F4-IBU, F5-IBU, and F5-IBUNa, exhibited lower levels of biodegradation (ranging from 15% ± 1 to 58% ± 2) after 28 days. Despite the structural modification of active compounds and the type of vehicles, these formulations showed reduced susceptibility to biodegradation. The particular constituents of vehicles in certain formulations might decrease their accessibility or make them less suitable for microbes that break them down (Figure 6 and Table S1).
The half-life of hydrogels (F1-IBU and F1-IBUNa), initial API (IBU and IBUNa), as well as other formulations (F2-IBU, F2-IBUNa, F3-IBU, F3-IBUNa, F4-IBU, F4-IBUNa, F5-IBU, and F5-IBUNa) by active sludge are presented in Table 5.
Hydrogels containing IBU and IBUNa half-life were 23 (F1-IBU) and 39 (F1-IBUNa) days, respectively. The sodium dodecyl sulphate was characterised by a shortened 7-day half-life, in contrast to ibuprofen’s 21-day half-life, and that of IBUNa was 23 days. The shortest half-life of formulation F4-IBUNa was 14 days. Furthermore, seven formulations (F2-IBU, F2-IBUNa, F3-IBUNa, F3-IBU, F4-IBU, F5-IBU, and F5-IBUNa) exhibited a longer half-life than F4-IBUNa (Table 5). The racemic mixture of ibuprofen has been identified in water–sediment systems. Additionally, it has been shown that the decay rate of ibuprofen rose from 5.8 to 10.1 days [13,44].
The phase of degradation of hydrogels (F1-IBU and F1-IBUNa), initial API (IBU and IBUNa), as well as other formulations (F2-IBU, F2-IBUNa, F3-IBU, F3-IBUNa, F4-IBU, F4-IBUNa, F5-IBU, and F5-IBUNa) is shown in Table 6. The degradation phase includes 10–90% of the obtained degradation value of the tested formulation.
After 25 h of conducting experiments with IBUNa, the test substance degraded by 10%. In comparison, after 33 h of testing with IBU, the test compound degraded by 10%, along with SDS degrading in less than 33 h. The F2-IBUNa and F5-IBUNa reached 10% degradation after 24 h, while F1-IBU (30 h); F3-IBU and F3-IBUNa (40 h); F4-IBU and F4-IBUNa (47 h); and F1-IBUNa, F2-IBU, and F5-IBU (48 h) took longer than 24 h; this might perhaps be linked to the microbes’ adaption process during the lag period [6].
The IBU deterioration phase is 523 h. In contrast, the IBUNa degradation time is 551 h. The degradation phase of F2-IBUNa and F5-IBUNa is 312 and 288 h, respectively. In contrast, for eight formulations—F1-IBUNa (degradation time (DT) 502 h), F3-IBU (DT 592 h), F5-IBU (DT 600 h), F4-IBU (DT 642 h), F4-IBUNa (DT 605 h), F1-IBU (DT 622 h), F2-IBU (DT 615 h), and F3-IBUNa (DT 625 h)—the phase of degradation is longer. It ranges from 502 h to 642 h—Table 6.
Hydrogels, especially F1-IBU (as well as F4-IBUNa and F3-IBU), are readily biodegradable preparations and exhibit high rates of biodegradation, suggesting their susceptibility to microbial breakdown. The permeability findings can enhance comprehension of possible therapeutic efficacy. For example, F1-IBU, a hydrogel with ibuprofen, showed great biodegradability and substantial penetration. This implies that the hydrogel formulation, combined with the acid form of ibuprofen, may offer effective drug delivery with environmentally favourable characteristics.
Poorly biodegradable formulations (F1-IBUNa, F2-IBU, F2-IBUNa, F3-IBUNa, F4-IBU, F5-IBU, and F5-IBUNa) demonstrated decreased biodegradation rates, suggesting reduced vulnerability to microbial breakdown. The permeability results for these formulations can be linked to their potential environmental persistence. For example, F2-IBU, an organogel with ibuprofen, exhibited lower biodegradation and permeation, suggesting a slower release of the drug, potentially leading to prolonged environmental exposure.
The formulations that exhibited both high permeability and biodegradation (hydrogel F1-IBU) may be considered environmentally friendly and therapeutically effective. On the other hand, formulations with lower biodegradation rates (e.g., F2-IBU) might raise concerns regarding potential environmental persistence. The permeability data for formulations containing both the acid (IBU) and sodium (IBUNa) forms of ibuprofen can be compared. For instance, F4-IBU (silicone ointment with ibuprofen) and F4-IBUNa (silicone ointment with sodium ibuprofenate) can be compared in terms of permeation and biodegradation. Understanding how the salt form influences both drug release and environmental fate is crucial for comprehensive risk assessment.
In the NaCl solution tested, the formulations showed a slight swelling due to the formation of intramolecular hydrogen bonds between polymer chains [31]. Based on the swelling results obtained, it can be concluded that the tested F1-IBU hydrogels containing IBU (as an active ingredient) may be interesting formulations for biomedical applications (SF1-IBU = 0.29 g/g ± 0.05). However, the introduction of IBUNa (as an active ingredient) into the hydrogel substrates significantly reduced the swelling capacity of the formulation (SF1-IBUNa = 0.05 g/g ± 0.01). The F1-IBUNa hydrogels showed less sensitivity to the amount of NaCl solution absorbed.

4. Conclusions

To summarise, further analysis uncovers a nuanced understanding of how different formulations influence the transdermal behaviour of ibuprofen and its sodium salt derivative. These discoveries have significant ramifications for fostering the growth of optimised medicine delivery systems customised to individual patient requirements, considering each formulation’s unique characteristics. This study not only contributes to the field of pharmaceutical sciences but also offers valuable insights for clinicians and researchers aiming to enhance the efficacy of transdermal drug delivery for ibuprofen and similar compounds.
The integration of permeability and biodegradation results allows for a comprehensive assessment of the environmental and pharmacological elements of formulations. To make educated judgements in medication formulation design, these data are crucial, considering both therapeutic efficacy and ecological sustainability. It is important to note that the ibuprofen hydrogel-based formulations investigated in this study are intended for topical use.
This publication delves into the permeation behaviour of ibuprofen and its sodium salt derivative across various vehicles. The formulations (F1–F5) encompass hydrogel, organogel, Eucerin ointment, silicone ointment, and zinc ointment, each offering unique characteristics influencing drug permeation, retention, and therapeutic efficacy. Notably, hydrogel (F1) containing IBUNa exhibited the highest accumulated mass. Differences in permeation were observed among various formulations, emphasising the effect of the formulation type on drug delivery.
The permeation rate highlights the efficacy of hydrogels, particularly F1-IBUNa, in promoting drug permeation. Silicone ointments, Eucerin ointments, and organogels also showed distinct permeation characteristics. This study underscores the importance of the pharmaceutical vehicle in influencing drug permeation rates.
Furthermore, biodegradation studies confirmed the high degradability of hydrogels. This study demonstrates that hydrogels, particularly F1-IBU, are easily degradable formulations, while other formulations exhibit varying levels of susceptibility to biodegradation. This study also provides insights into the half-life of different formulations, shedding light on their potential environmental persistence. Additionally, the results suggest that hydrogel-based formulations are potential candidates for IBU drug delivery.

Supplementary Materials

The following supporting information can be downloaded at: https://www.mdpi.com/article/10.3390/pr12061236/s1, Table S1. Biodegradation of IBU, IBUNa, and formulations by bacterial cultures.

Author Contributions

Conceptualisation, E.K. and P.O.-R.; methodology, E.K. and A.N.; formal analysis, E.K., B.O., A.N., Ł.K. and A.M.-S.; investigation, E.K. and B.O.; data curation, E.K. and P.O.-R.; writing—original draft preparation, E.K., B.O., A.N. and P.O.-R.; writing—review and editing, P.O.-R.; visualisation, E.K. and A.N.; supervision, P.O.-R.; project administration, P.O.-R.; funding acquisition, P.O.-R. All authors have read and agreed to the published version of the manuscript.

Funding

This research received funding from the National Centre for Research and Development under project number LIDER/53/0225/L-11/19/NCBR/2020.

Data Availability Statement

Most of the data are provided in this work. Other data that support the findings of this study are available from the corresponding author upon reasonable request.

Acknowledgments

We extend our heartfelt appreciation to the “Pomorzany” Wastewater Treatment Plant in Szczecin for their invaluable collaboration and support in supplying wastewater sludge for our research endeavours.

Conflicts of Interest

The authors declare no conflicts of interest.

References

  1. Ngo, V.T.H.; Bajaj, T. Ibuprofen. In StatPearls; StatPearls Publishing: Treasure Island, FL, USA, 2023. [Google Scholar]
  2. Show, S.; Chakraborty, P.; Karmakar, B.; Halder, G. Sorptive and Microbial Riddance of Micro-Pollutant Ibuprofen from Contaminated Water: A State of the Art Review. Sci. Total Environ. 2021, 786, 147327. [Google Scholar] [CrossRef] [PubMed]
  3. Khetan, S.K.; Collins, T.J. Human Pharmaceuticals in the Aquatic Environment: A Challenge to Green Chemistry. Chem. Rev. 2007, 107, 2319–2364. [Google Scholar] [CrossRef] [PubMed]
  4. Patel, M.; Kumar, R.; Kishor, K.; Mlsna, T.; Pittman, C.U., Jr.; Mohan, D. Pharmaceuticals of Emerging Concern in Aquatic Systems: Chemistry, Occurrence, Effects, and Removal Methods. Chem. Rev. 2019, 119, 3510–3673. [Google Scholar] [CrossRef] [PubMed]
  5. Adenle, A.A.; Sowe, S.K.; Parayil, G.; Aginam, O. Analysis of Open Source Biotechnology in Developing Countries: An Emerging Framework for Sustainable Agriculture. Technol. Soc. 2012, 34, 256–269. [Google Scholar] [CrossRef]
  6. Makuch, E.; Ossowicz-Rupniewska, P.; Klebeko, J.; Janus, E. Biodegradation of L-Valine Alkyl Ester Ibuprofenates by Bacterial Cultures. Materials 2021, 14, 3180. [Google Scholar] [CrossRef] [PubMed]
  7. Adamczuk, M. Environmentally Realistic Concentrations of Ibuprofen Influence Life Histories but Not Population Dynamics of Daphnia Magna. Sci. Total Environ. 2022, 848, 157783. [Google Scholar] [CrossRef] [PubMed]
  8. Manoukian, M.A.C.; Migdal, C.W.; Tembhekar, A.R.; Harris, J.A.; DeMesa, C. Topical Administration of Ibuprofen for Injured Athletes: Considerations, Formulations, and Comparison to Oral Delivery. Sports Med. Open 2017, 3, 36. [Google Scholar] [CrossRef] [PubMed]
  9. Ramadon, D.; McCrudden, M.T.C.; Courtenay, A.J.; Donnelly, R.F. Enhancement Strategies for Transdermal Drug Delivery Systems: Current Trends and Applications. Drug Deliv. Transl. Res. 2022, 12, 758–791. [Google Scholar] [CrossRef] [PubMed]
  10. Ouranidis, A.; Gkampelis, N.; Vardaka, E.; Karagianni, A.; Tsiptsios, D.; Nikolakakis, I.; Kachrimanis, K. Overcoming the Solubility Barrier of Ibuprofen by the Rational Process Design of a Nanocrystal Formulation. Pharmaceutics 2020, 12, 969. [Google Scholar] [CrossRef]
  11. Rastogi, A.; Tiwari, M.K.; Ghangrekar, M.M. A Review on Environmental Occurrence, Toxicity and Microbial Degradation of Non-Steroidal Anti-Inflammatory Drugs (NSAIDs). J. Environ. Manag. 2021, 300, 113694. [Google Scholar] [CrossRef]
  12. Salgado, R.; Brito, D.; Noronha, J.P.; Almeida, B.; Bronze, M.R.; Oehmen, A.; Carvalho, G.; Barreto Crespo, M.T. Metabolite Identification of Ibuprofen Biodegradation by Patulibacter Medicamentivorans under Aerobic Conditions. Environ. Technol. 2020, 41, 450–465. [Google Scholar] [CrossRef] [PubMed]
  13. Jan-Roblero, J.; Cruz-Maya, J.A. Ibuprofen: Toxicology and Biodegradation of an Emerging Contaminant. Molecules 2023, 28, 2097. [Google Scholar] [CrossRef] [PubMed]
  14. Mussa, Z.H.; Al-Qaim, F.F.; Jawad, A.H.; Scholz, M.; Yaseen, Z.M. A Comprehensive Review for Removal of Non-Steroidal Anti-Inflammatory Drugs Attained from Wastewater Observations Using Carbon-Based Anodic Oxidation Process. Toxics 2022, 10, 598. [Google Scholar] [CrossRef] [PubMed]
  15. Abbot, V.; Paliwal, D.; Sharma, A.; Sharma, P. A Review on the Physicochemical and Biological Applications of Biosurfactants in Biotechnology and Pharmaceuticals. Heliyon 2022, 8, e10149. [Google Scholar] [CrossRef] [PubMed]
  16. El-Gammal, M.A.; Elsaeidy, A.S.; Ashry, H.; Jobran, A.W.M. Biodegradation Method of Pharmaceuticals and Personal Care Products. In Handbook of Biodegradable Materials; Ali, G.A.M., Makhlouf, A.S.H., Eds.; Springer International Publishing: Cham, Switzerland, 2023; pp. 1093–1131. ISBN 978-3-031-09710-2. [Google Scholar]
  17. Abdelfattah, A.; Ali, S.S.; Ramadan, H.; El-Aswar, E.I.; Eltawab, R.; Ho, S.-H.; Elsamahy, T.; Li, S.; El-Sheekh, M.M.; Schagerl, M.; et al. Microalgae-Based Wastewater Treatment: Mechanisms, Challenges, Recent Advances, and Future Prospects. Environ. Sci. Ecotechnol. 2023, 13, 100205. [Google Scholar] [CrossRef] [PubMed]
  18. Chopra, S.; Kumar, D. Ibuprofen as an Emerging Organic Contaminant in Environment, Distribution and Remediation. Heliyon 2020, 6, e04087. [Google Scholar] [CrossRef] [PubMed]
  19. Rashid, M.; Malik, M.Y.; Singh, S.K.; Chaturvedi, S.; Gayen, J.R.; Wahajuddin, M. Bioavailability Enhancement of Poorly Soluble Drugs: The Holy Grail in Pharma Industry. Curr. Pharm. Des. 2019, 25, 987–1020. [Google Scholar] [CrossRef] [PubMed]
  20. Ding, J.; Li, D.; Chen, J.; Zhao, C.; Pour Shahid Saeed Abadi, P. Synthesis and Biomedical Applications of Functional Polymers. Int. J. Polym. Sci. 2021, 2021, e9763105. [Google Scholar] [CrossRef]
  21. Zagórska-Dziok, M.; Bujak, T.; Ziemlewska, A.; Nizioł-Łukaszewska, Z. Positive Effect of Cannabis sativa L. Herb Extracts on Skin Cells and Assessment of Cannabinoid-Based Hydrogels Properties. Molecules 2021, 26, 802. [Google Scholar] [CrossRef]
  22. Nowak, A.; Zagórska-Dziok, M.; Ossowicz-Rupniewska, P.; Makuch, E.; Duchnik, W.; Kucharski, Ł.; Adamiak-Giera, U.; Prowans, P.; Czapla, N.; Bargiel, P.; et al. Epilobium angustifolium L. Extracts as Valuable Ingredients in Cosmetic and Dermatological Products. Molecules 2021, 26, 3456. [Google Scholar] [CrossRef]
  23. Makuch, E.; Nowak, A.; Günther, A.; Pełech, R.; Kucharski, Ł.; Duchnik, W.; Klimowicz, A. The Effect of Cream and Gel Vehicles on the Percutaneous Absorption and Skin Retention of a New Eugenol Derivative with Antioxidant Activity. Front. Pharmacol. 2021, 12, 658381. [Google Scholar] [CrossRef] [PubMed]
  24. Mady, F.M.; Essa, H.; El-Ammawi, T.; Abdelkader, H.; Hussein, A.K. Formulation and Clinical Evaluation of Silymarin Pluronic-Lecithin Organogels for Treatment of Atopic Dermatitis. Drug Des. Dev. Ther. 2016, 10, 1101–1110. [Google Scholar] [CrossRef] [PubMed]
  25. Zhang, P.; Zhang, E.; Xiao, M.; Chen, C.; Xu, W. Enhanced Chemical and Biological Activities of a Newly Biosynthesized Eugenol Glycoconjugate, Eugenol α-d-Glucopyranoside. Appl. Microbiol. Biotechnol. 2013, 97, 1043–1050. [Google Scholar] [CrossRef] [PubMed]
  26. Makuch, E.; Nowak, A.; Günther, A.; Pełech, R.; Kucharski, Ł.; Duchnik, W.; Klimowicz, A. Enhancement of the Antioxidant and Skin Permeation Properties of Eugenol by the Esterification of Eugenol to New Derivatives. AMB Expr. 2020, 10, 187. [Google Scholar] [CrossRef] [PubMed]
  27. Kucharski, Ł.; Cybulska, K.; Kucharska, E.; Nowak, A.; Pełech, R.; Klimowicz, A. Biologically Active Preparations from the Leaves of Wild Plant Species of the Genus Rubus. Molecules 2022, 27, 5486. [Google Scholar] [CrossRef] [PubMed]
  28. Korsmeyer, R.W.; Gurny, R.; Doelker, E.; Buri, P.; Peppas, N.A. Mechanisms of Solute Release from Porous Hydrophilic Polymers. Int. J. Pharm. 1983, 15, 25–35. [Google Scholar] [CrossRef]
  29. ISO 9308-1:2014; Water Quality—Enumeration of Escherichia coli and Coliform bacteria. International Organization for Standardization: Geneva, Switzerland, 2014.
  30. Adejokun, D.A.; Dodou, K. A Novel Method for the Evaluation of the Long-Term Stability of Cream Formulations Containing Natural Oils. Cosmetics 2020, 7, 86. [Google Scholar] [CrossRef]
  31. Zhang, K.; Feng, W.; Jin, C. Protocol Efficiently Measuring the Swelling Rate of Hydrogels. MethodsX 2020, 7, 100779. [Google Scholar] [CrossRef] [PubMed]
  32. Peppas, N. Hydrogels in Pharmaceutical Formulations. Eur. J. Pharm. Biopharm. 2000, 50, 27–46. [Google Scholar] [CrossRef]
  33. Date, P.; Tanwar, A.; Ladage, P.; Kodam, K.M.; Ottoor, D. Biodegradable and Biocompatible Agarose–Poly (Vinyl Alcohol) Hydrogel for the in Vitro Investigation of Ibuprofen Release. Chem. Pap. 2020, 74, 1965–1978. [Google Scholar] [CrossRef]
  34. Bukhari, S.M.H.; Khan, S.; Rehanullah, M.; Ranjha, N.M. Synthesis and Characterization of Chemically Cross-Linked Acrylic Acid/Gelatin Hydrogels: Effect of pH and Composition on Swelling and Drug Release. Int. J. Polym. Sci. 2015, 2015, e187961. [Google Scholar] [CrossRef]
  35. Ossowicz-Rupniewska, P.; Bednarczyk, P.; Nowak, M.; Nowak, A.; Duchnik, W.; Kucharski, Ł.; Klebeko, J.; Świątek, E.; Bilska, K.; Rokicka, J.; et al. Evaluation of the Structural Modification of Ibuprofen on the Penetration Release of Ibuprofen from a Drug-in-Adhesive Matrix Type Transdermal Patch. Int. J. Mol. Sci. 2022, 23, 7752. [Google Scholar] [CrossRef] [PubMed]
  36. Jipa, I.M.; Stoica-Guzun, A.; Stroescu, M. Controlled Release of Sorbic Acid from Bacterial Cellulose Based Mono and Multilayer Antimicrobial Films. LWT 2012, 47, 400–406. [Google Scholar] [CrossRef]
  37. Ayilara, M.S.; Babalola, O.O. Bioremediation of Environmental Wastes: The Role of Microorganisms. Front. Agron. 2023, 5, 1183691. [Google Scholar] [CrossRef]
  38. Albers, E.; Muller, B.W. Cyclodextrin Derivatives in Pharmaceutics. CRT 1995, 12, 311–337. [Google Scholar] [CrossRef]
  39. Agboola, A.A.; Nowak, A.; Duchnik, W.; Kucharski, Ł.; Story, A.; Story, G.; Struk, Ł.; Antosik, A.K.; Ossowicz-Rupniewska, P. Emulsion-Based Gel Loaded with Ibuprofen and Its Derivatives. Gels 2023, 9, 391. [Google Scholar] [CrossRef] [PubMed]
  40. Tauxe-Wuersch, A.; De Alencastro, L.F.; Grandjean, D.; Tarradellas, J. Occurrence of Several Acidic Drugs in Sewage Treatment Plants in Switzerland and Risk Assessment. Water Res. 2005, 39, 1761–1772. [Google Scholar] [CrossRef]
  41. González, S.; Müller, J.; Petrovic, M.; Barceló, D.; Knepper, T.P. Biodegradation Studies of Selected Priority Acidic Pesticides and Diclofenac in Different Bioreactors. Environ. Pollut. 2006, 144, 926–932. [Google Scholar] [CrossRef] [PubMed]
  42. Quintana, J.B.; Weiss, S.; Reemtsma, T. Pathways and Metabolites of Microbial Degradation of Selected Acidic Pharmaceutical and Their Occurrence in Municipal Wastewater Treated by a Membrane Bioreactor. Water Res. 2005, 39, 2654–2664. [Google Scholar] [CrossRef]
  43. Gu, J.-D. Biodegradation Testing: So Many Tests but Very Little New Innovation. Appl. Environ. Biotechnol. 2016, 1, 92–95. [Google Scholar] [CrossRef]
  44. Qu, H.; Barrett, H.; Wang, B.; Han, J.; Wang, F.; Gong, W.; Wu, J.; Wang, W.; Yu, G. Co-Occurrence of Antiseptic Triclocarban and Chiral Anti-Inflammatory Ibuprofen in Environment: Association between Biological Effect in Sediment and Risk to Human Health. J. Hazard. Mater. 2021, 407, 124871. [Google Scholar] [CrossRef] [PubMed]
Figure 1. The CO2 measuring system.
Processes 12 01236 g001
Figure 2. Temporal profile of the accumulated mass of IBU and IBUNa following 24 h of permeation. Each donor chamber was filled with 1 cm3 of phosphate-buffered saline, containing different vehicles; mean ± SD (n = 3).
Processes 12 01236 g002
Figure 3. The rate of penetration of IBU and IBUNa, the permeation phase at 24 h; α = 0.05, mean ± SD (n = 3).
Processes 12 01236 g003
Figure 4. IBU and IBUNa release profile over the 24 h period; mean ± SD (n = 3).
Processes 12 01236 g004
Figure 5. IBU and IBUNa accumulation in the skin over the 24 h penetration period; significant differences between vehicles are shown by separate letters, with α = 0.05, Mean ± SD (n = 3). A statistically significant difference was verified using ANOVA and Tukey’s test.
Processes 12 01236 g005
Figure 6. Biodegradation of IBU (red line), IBUNa (blue line), formulations (F1-IBU, F1-IBUNa, F2-IBU, F2-IBUNa, F3-IBU, F3-IBUNa, F4-IBU, F4-IBUNa, F5-IBU, and F5-IBUNa), and sodium dodecyl sulphate (purple line).
Processes 12 01236 g006
Table 1. The cumulative mass for IBU and IBUNa; letters indicate significant differences among studied vehicles; α = 0.05, mean ± SD (n = 3). An analysis of variance (ANOVA) with Tukey’s test was used to confirm the statistical significance of the difference.
VehicleThe Cumulative Permeation Mass (µg·cm−2)
F1-IBU89.208 ± 3.334 c
F1-IBUNa960.092 ± 27.776 g
F2-IBU44.976 ± 4.851 ab
F2-IBUNa99.431 ± 11.165 c
F3-IBU278.691 ± 1.6612 e
F3-IBUNa775.016 ± 24.641 f
F4-IBU64.531 ± 10.584 bc
F4-IBUNa155.243 ± 14.898 d
F5-IBU18.325 ± 2.848 a
F5-IBUNa27.387 ± 1.156 ab
Table 2. The Mann–Whitney test measured significant variations in cumulative mass with relation to the same vehicle containing pure (IBU) and its derivative (IBUNa), considering the time within the 24 h period of penetration.
Vehicle
F1-IBU/F1-IBUNaZ = −2.4881
p = 0.0128 *
F2-IBU/F2-IBUNaZ = 0.7522
p = 0.4519
F3-IBU/F3-IBUNaZ = −1.0994
p = 0.2715
F4-IBU/F4-IBUNaZ = −2.0252
p = 0.0401 *
F5-IBU/F5-IBUNaZ = −0.5207
p = 0.6025
* Values are considered significantly different (p < 0.05).
Table 3. The Mann–Whitney test measured significant variations in cumulative mass with relation to the same vehicle containing pure (IBU) and its derivative (IBUNa), considering within the 24 h period of release.
Vehicle
F1-IBU/F1-IBUNaZ = −3.1282
p = 0.0017 *
F2-IBU/F2-IBUNaZ = 1.3846
p = 0.1661
F3-IBU/F3-IBUNaZ = 0.6230
p = 0.3559
F4-IBU/F4-IBUNaZ = 0.5641
p = 0.5726
F5-IBU/F5-IBUNaZ = −0.6153
p = 0.5383
* Values are considered significantly different (p < 0.05).
Table 4. The skin permeation properties of ibuprofen and sodium ibuprofenate from different formulations.
Vehicle/
Formulation
JSS,
µg·cm−2·h−1
KP∙103, cm·h−1LT, hD∙104, cm2·h−1KmQ%24 h
F1-IBU4.653 ± 0.47790.093 ± 0.0090.884 ± 0.3204.715 ± 1.8590.009 ± 0.0010.18 ± 0.01
F1-IBUNa80.127 ± 3.2691.603 ± 0.0650.543 ± 0.0827.678 ± 1.2480.104 ± 0.0191.92 ± 0.06
F2-IBU4.707 ± 0.2760.094 ± 0.0060.213 ± 0.11719.538 ± 1.1450.002 ± 0.0010.09 ± 0.01
F2-IBUNa5.218 ± 0.4540.104 ± 0.009***0.20 ± 0.02
F3-IBU16.973 ± 1.4170.339 ± 0.0281.573 ± 0.1862.689 ± 0.3260.064 ± 0.0120.56 ± 0.01
F3-IBUNa53.687 ± 4.8881.074 ± 0.0981.566 ± 0.2012.711 ± 0.3340.202 ± 0.0451.55 ± 0.05
F4-IBU5.201 ± 0.9610.104 ± 0.0191.132 ± 0.2813.679 ± 0.4130.014 ± 0.0010.13 ± 0.01
F4-IBUNa13.425 ± 1.2780.269 ± 0.0261.647 ± 0.1542.530 ± 0.2420.053 ± 0.0010.31 ± 0.03
F5-IBU1.599 ± 0.2540.032 ± 0.0050.078 ± 0.01253.339 ± 10.4270.003 ± 0.0010.04 ± 0.01
F5-IBUNa2.301 ± 0.4190.046 ± 0.008***0.05 ± 0.01
JSS—steady-state flux; KP—permeability coefficient; LT—lag time; D—diffusion coefficient; Km—skin partition coefficient; Q—the percentage of the applied dose; * LT < 0.
Table 5. The half-life values of IBU, IBUNa, and various formulations.
IBUIBUNaF1-IBUF1-IBUNaF2-IBUF2-IBUNaF3-IBU
(h/days)(h/days)(h/days)(h/days)(h/days)(h/days)(h/days)
492/21552/23552/23931/391136/602175/91622/26
F3-IBUNaF4-IBUF4-IBUNaF5-IBUF5-IBUNaSDS
(h/days)(h/days)(h/days)(h/days)(h/days)(h/days)
1440/60619/26336/141067/442262/94162/7
Table 6. Degradation process for IBU, IBUNa, and formulations.
Compound NamePhase of Degradation
(%/h)
Lag PhaseDegradation PhasePlateau Phase
IBU0–7/0–337–59/33–55659–65/556–672
IBUNa0–6/0–256–55/25–57655–61/576–672
F1-IBU0–6/0–306–58/30–65258–65/652–672
F1-IBUNa0–4/0–484–33/48–55033–37/550–672
F2-IBU0–2/0–482–21/48–66221–23/662–672
F2-IBUNa0–2/0–242–14/24–33614–15/336–672
F3-IBU0–6/0–406–56/40–63256–62/632–672
F3-IBUNa0–2/0–402–21/40–66521–23/665–672
F4-IBU0–6/0–476–53/47–64953–58/649–672
F4-IBUNa0–10/0–4710–90/47–65290–100/652–672
F5-IBU0–3/0–483–28/48–64828–32/648–672
F5-IBUNa0–1/0–241–13/24–31213–15/312–672
SDS0–9/0–159–78/15–53778–87/537–672
Disclaimer/Publisher’s Note: The statements, opinions and data contained in all publications are solely those of the individual author(s) and contributor(s) and not of MDPI and/or the editor(s). MDPI and/or the editor(s) disclaim responsibility for any injury to people or property resulting from any ideas, methods, instructions or products referred to in the content.

