
Application of Multi-Dimensional Hill Chart in the Condition Monitoring and Cost Estimation of the Francis Turbine Unit


Abstract
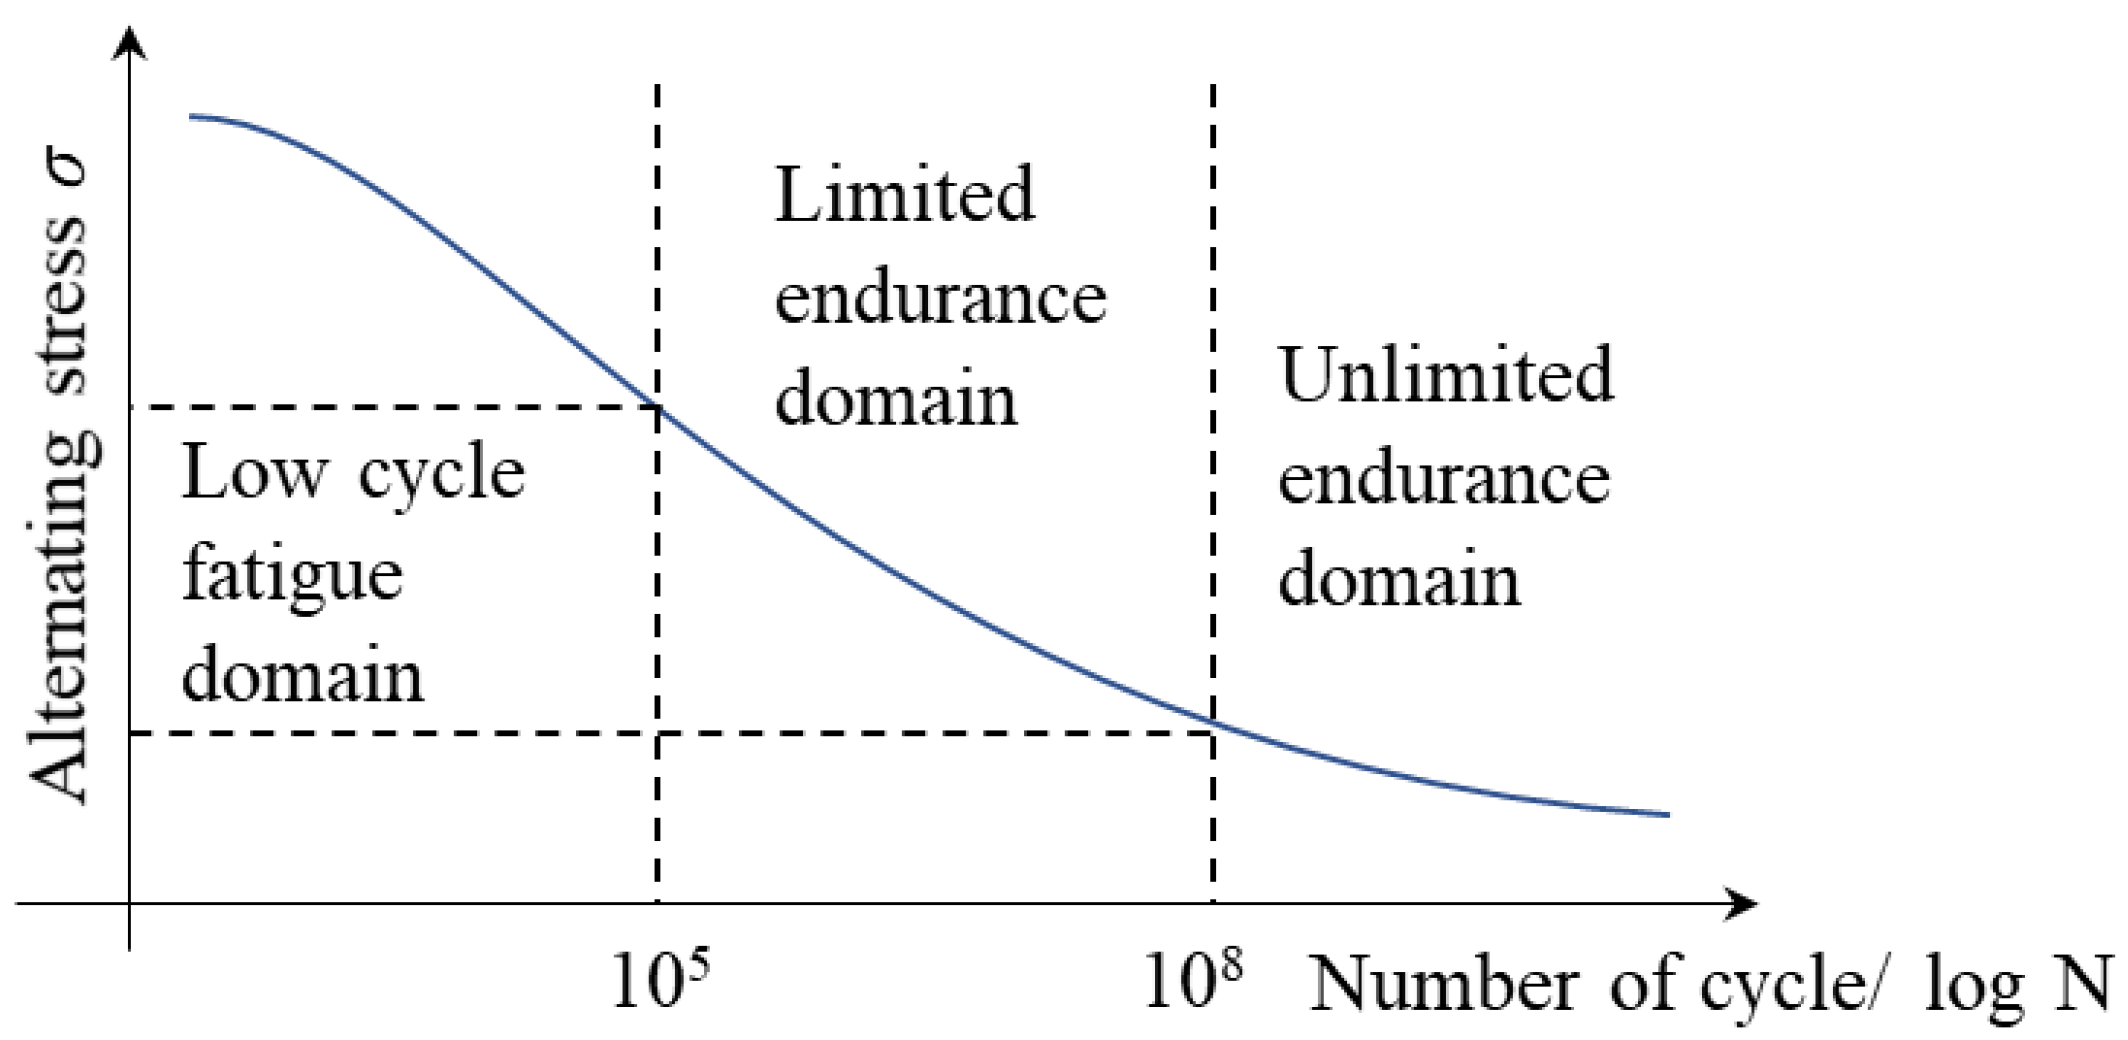
1. Introduction
2. Field Test
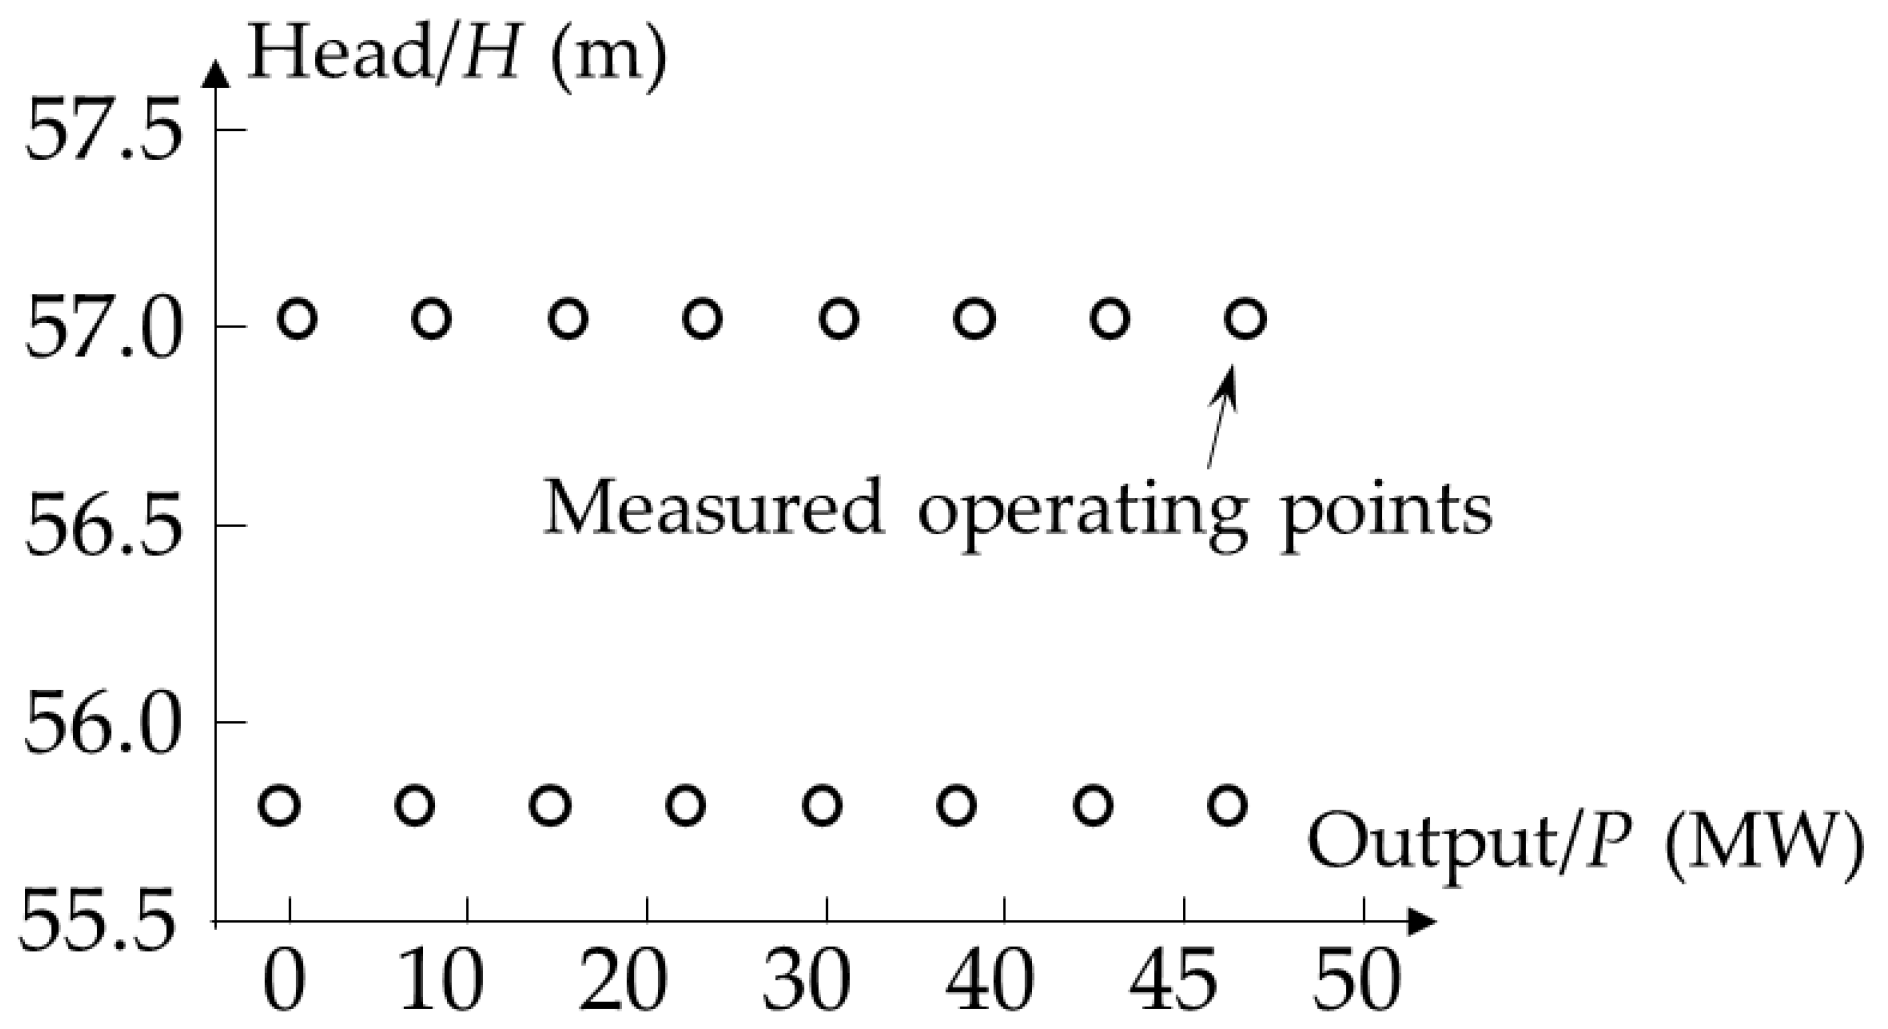
2.1. Operating Condition Setup for Measurement
2.2. Field Test Set Up
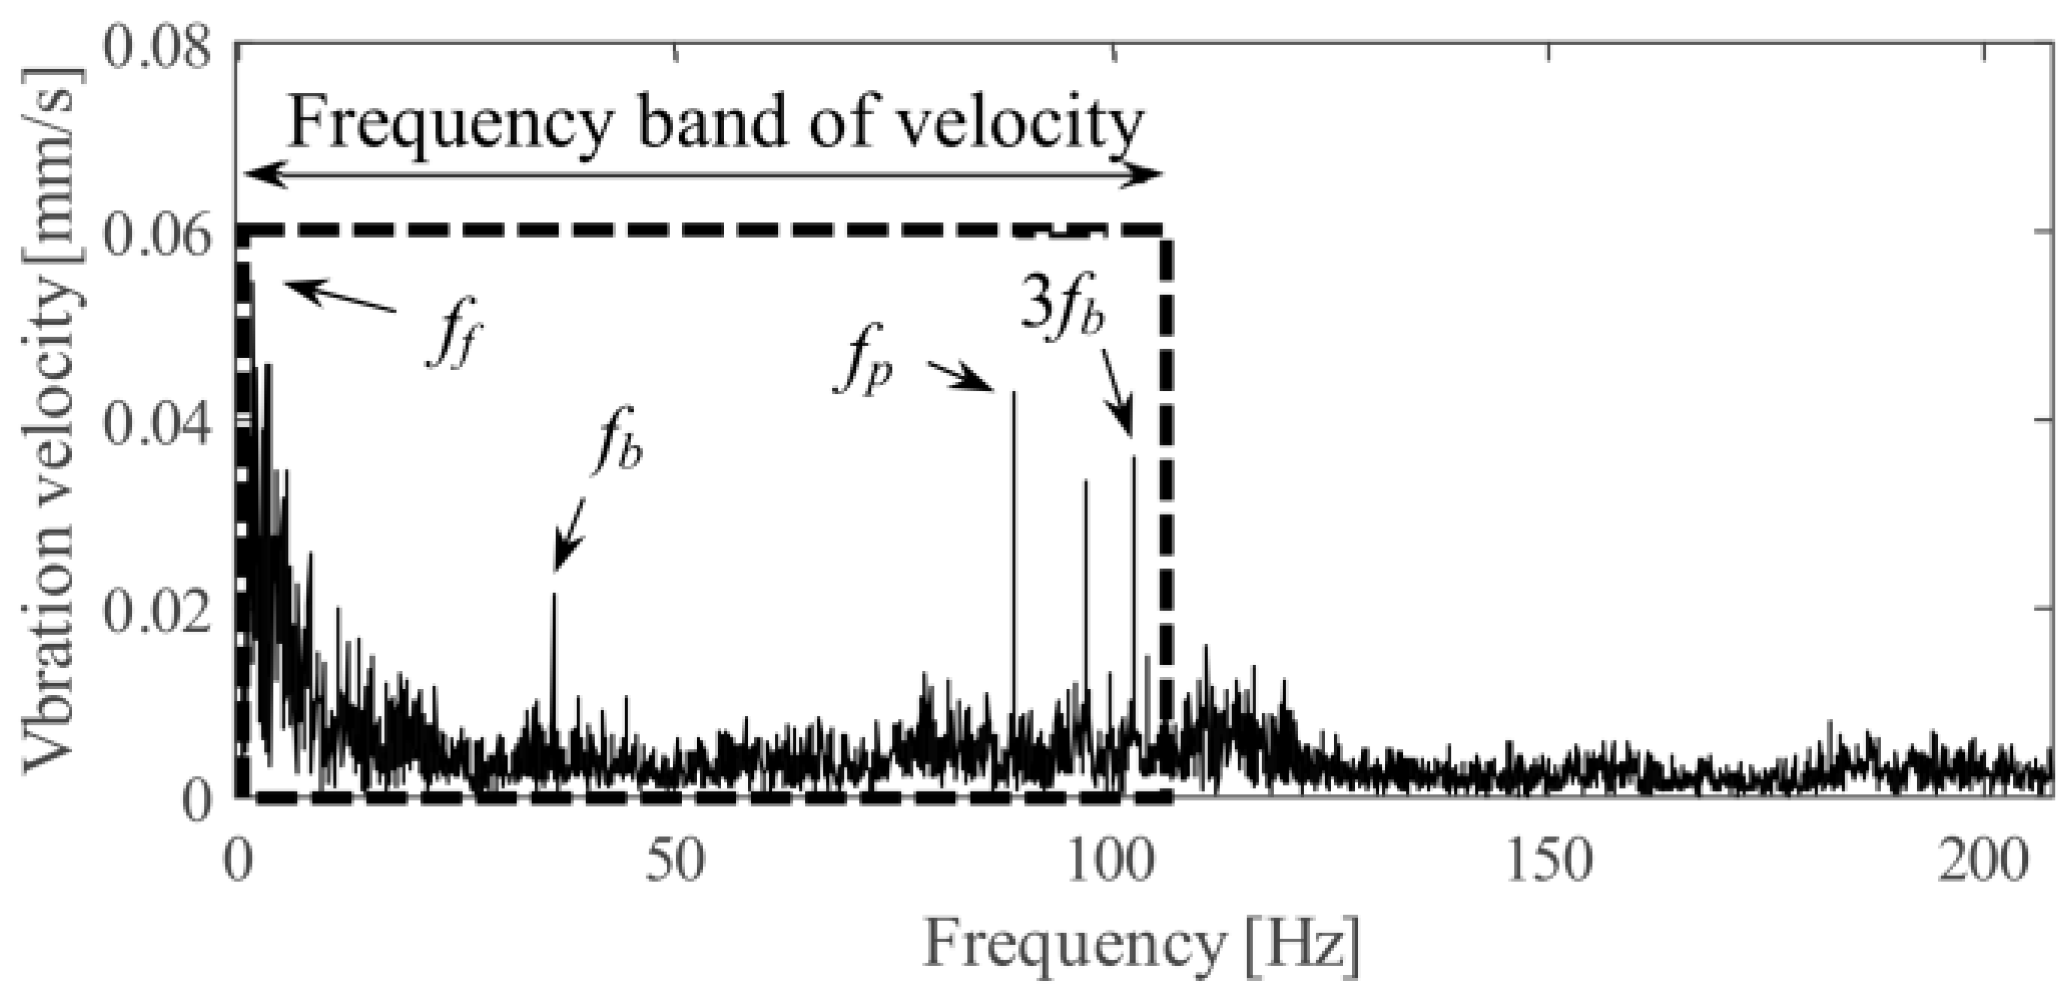
3. Signal Process Methodology
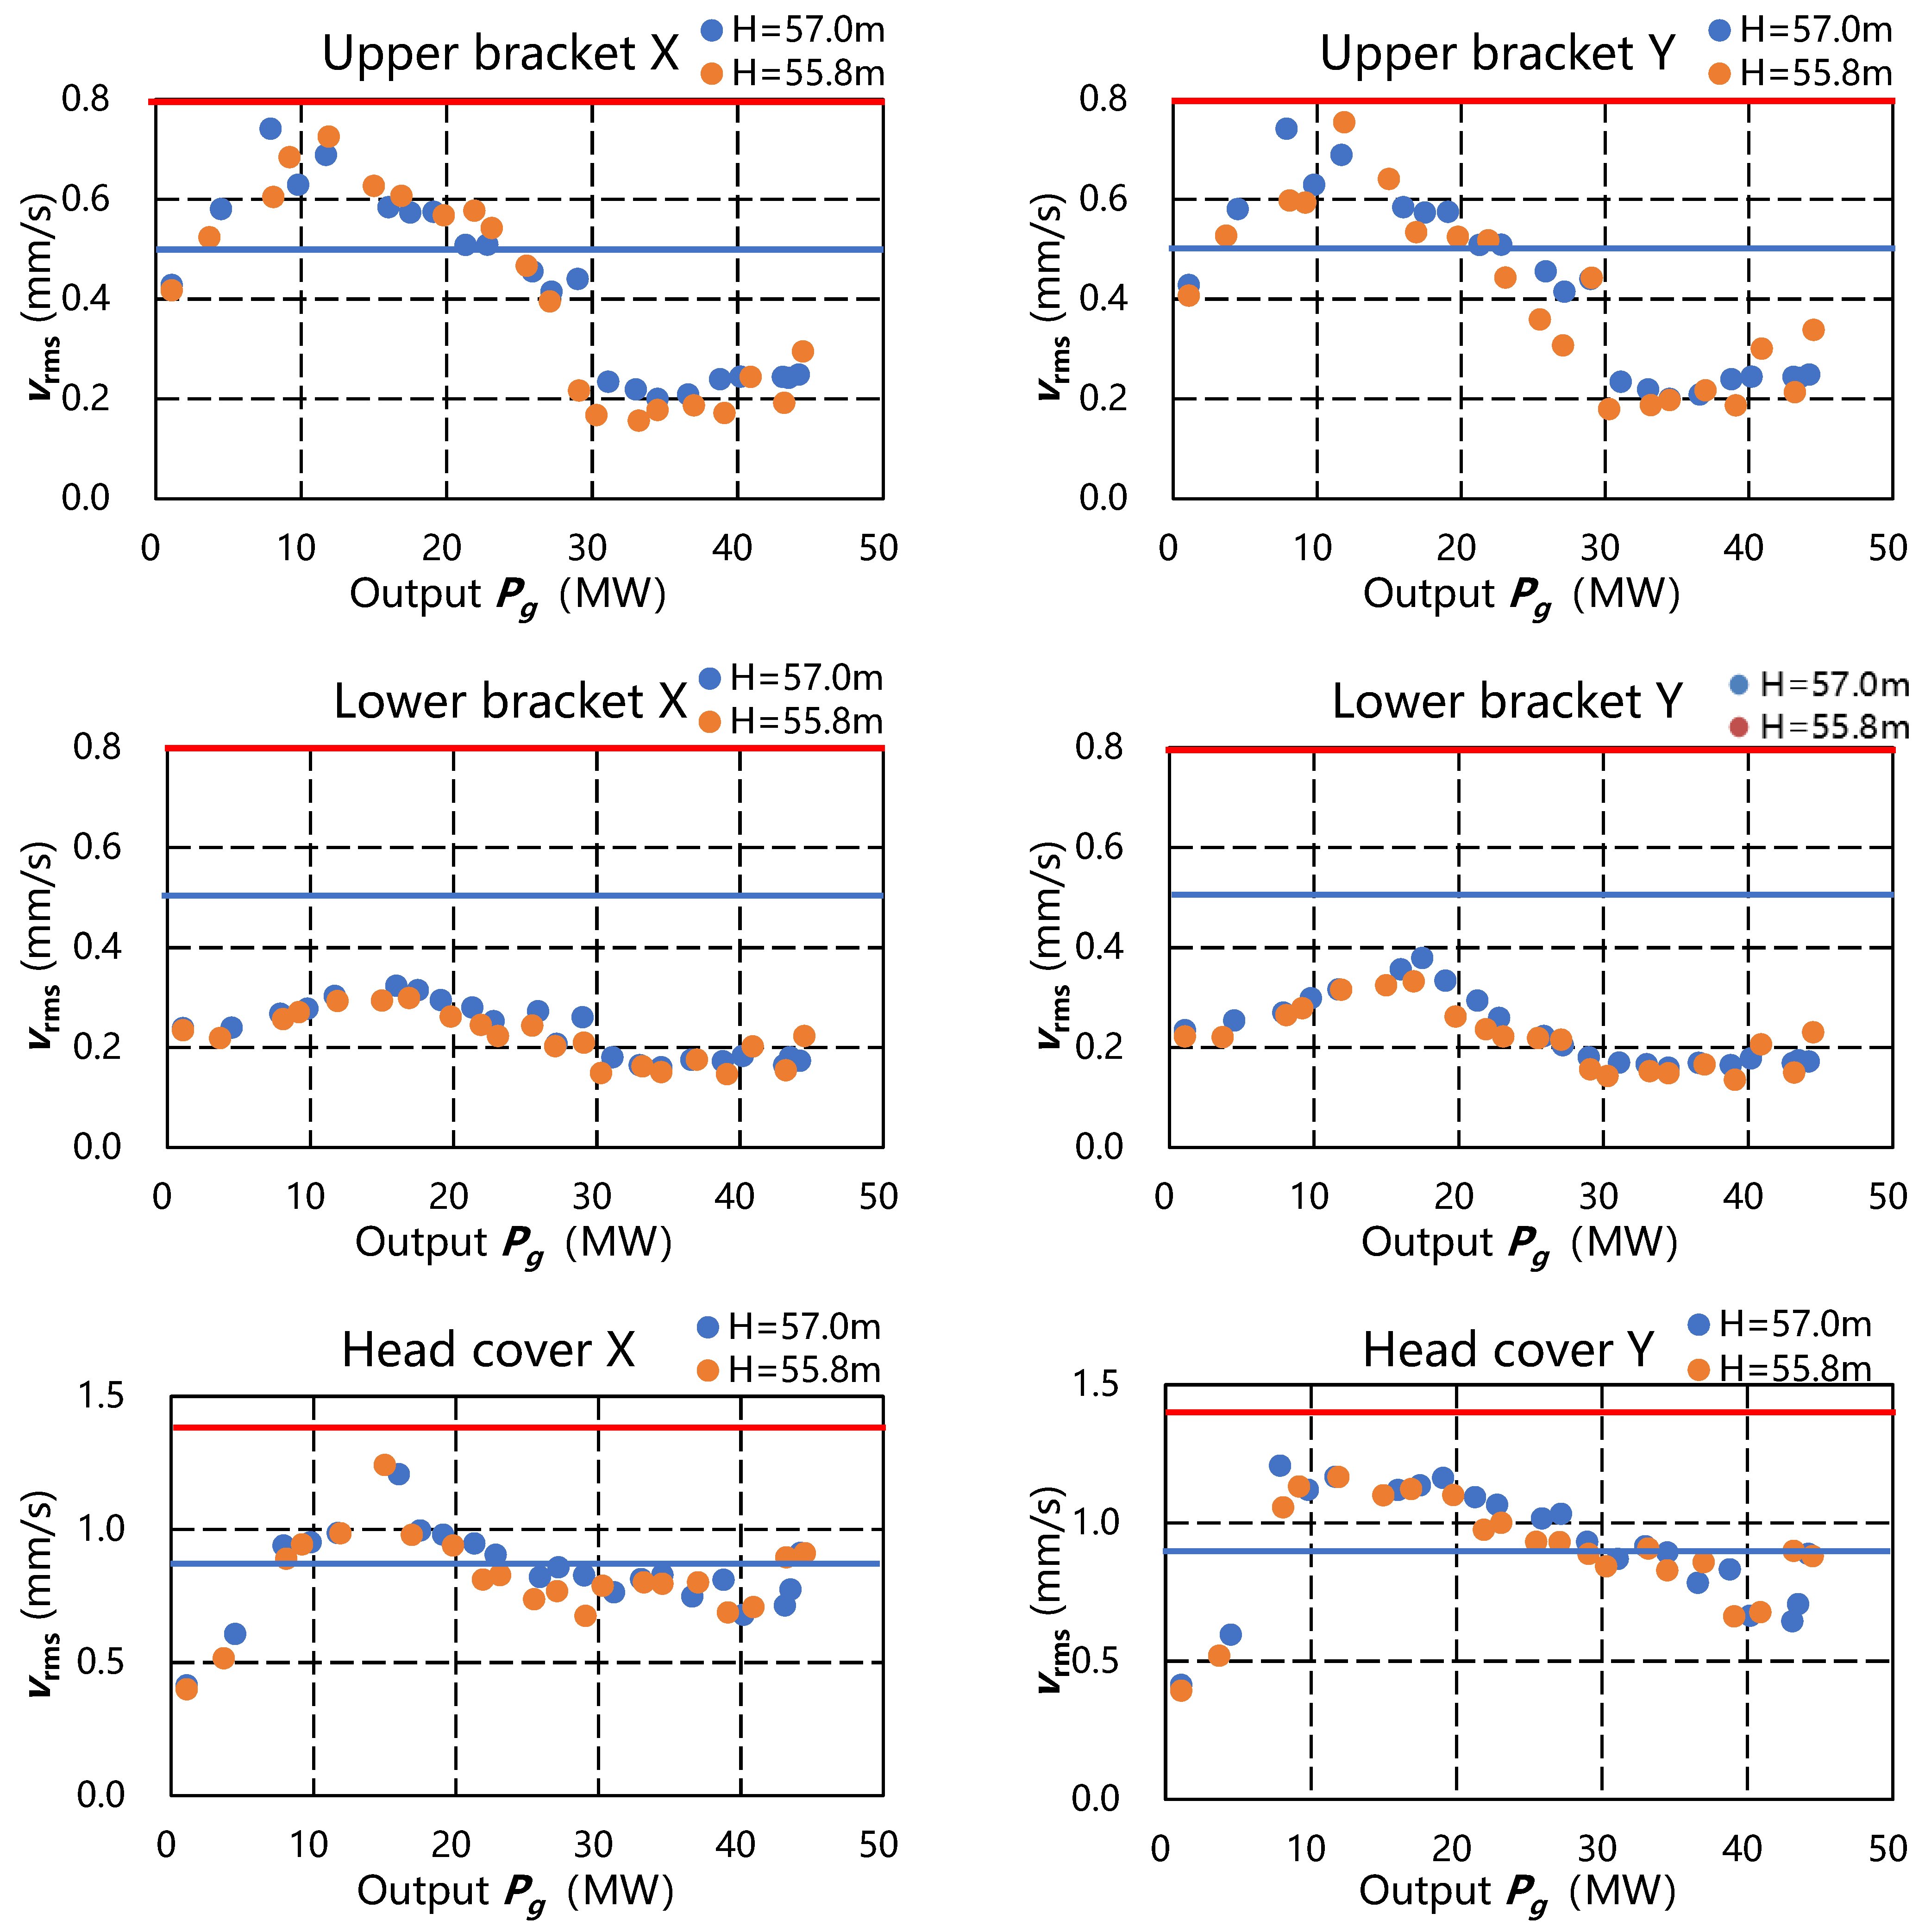
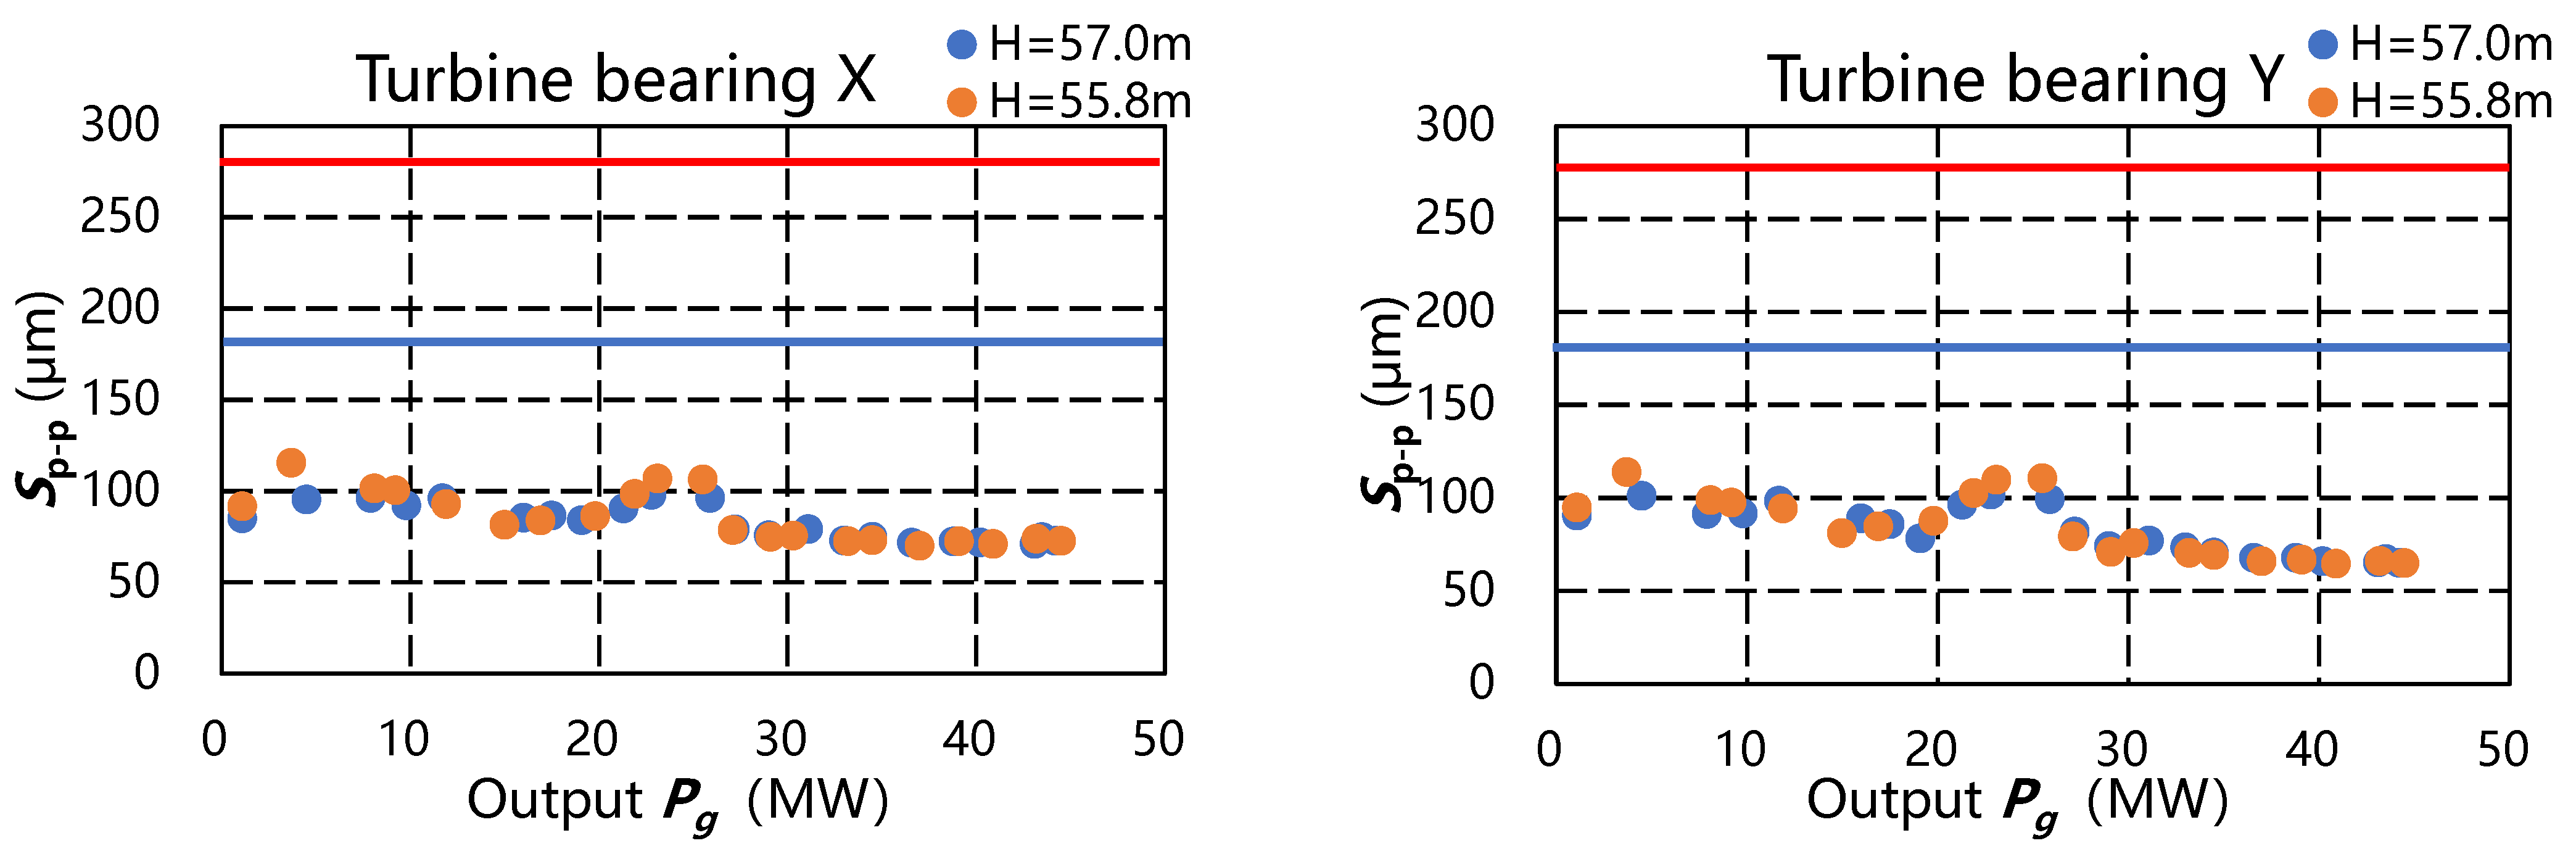
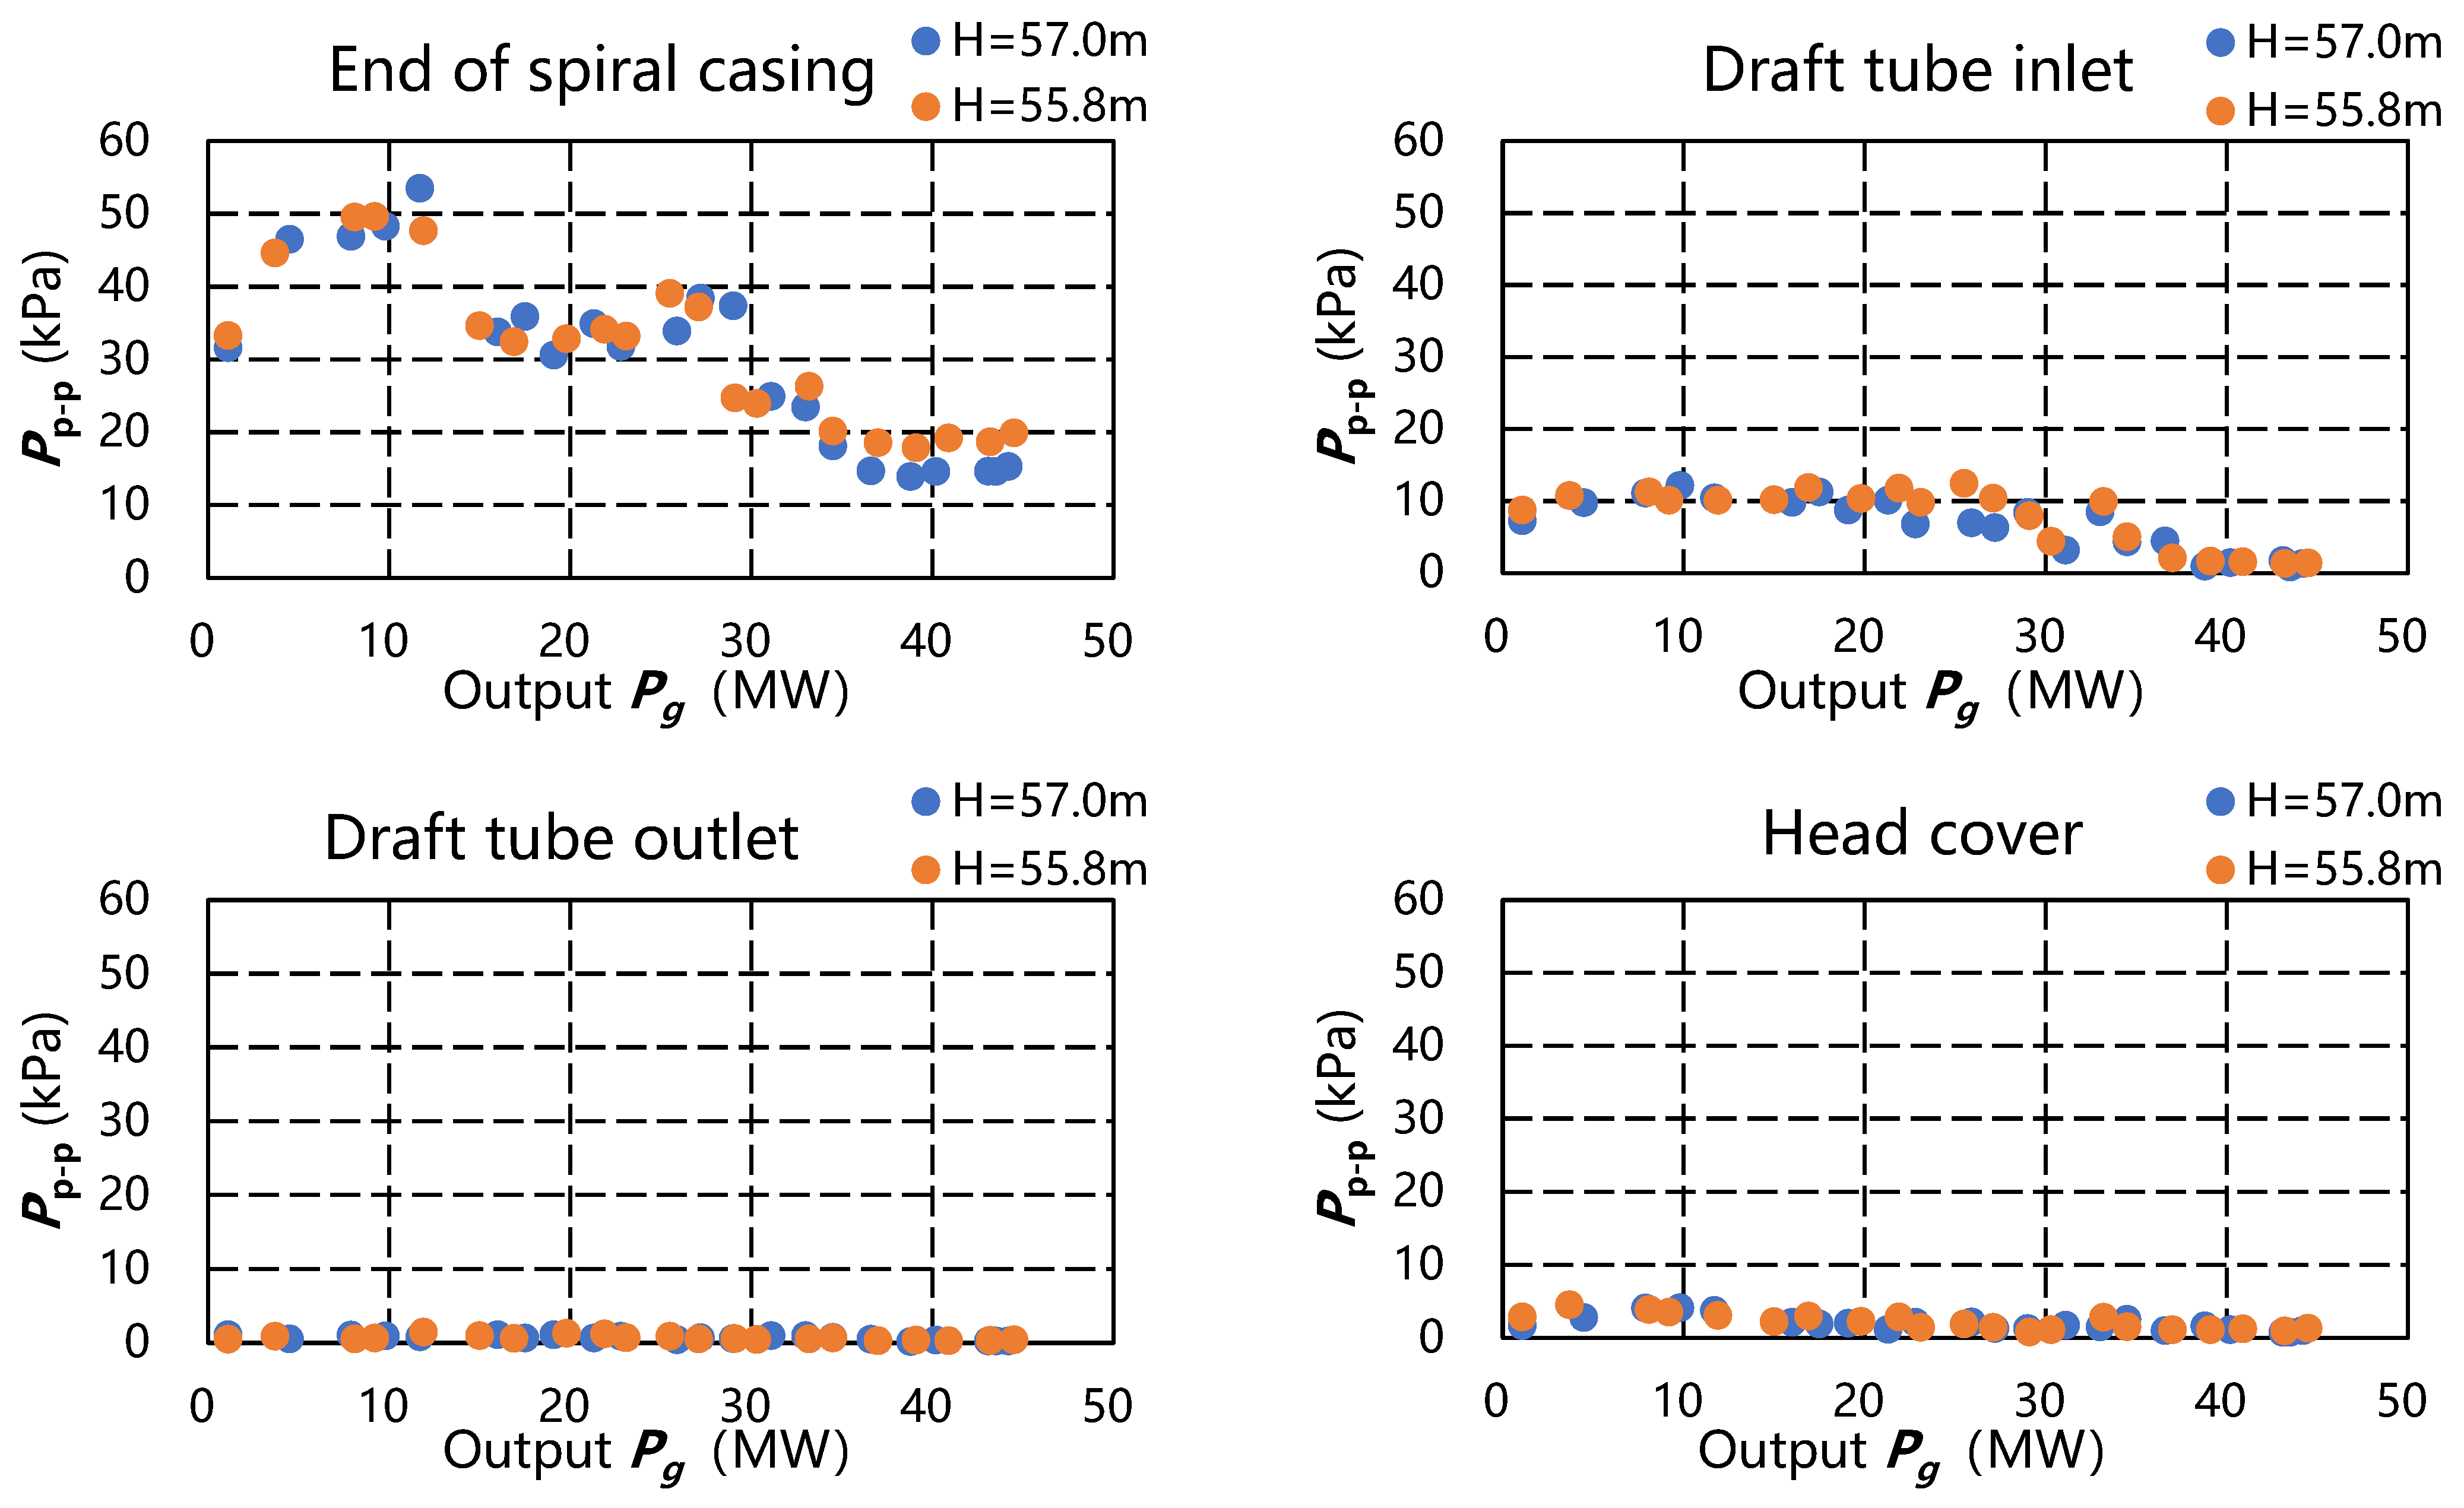
4. Test Result Analysis
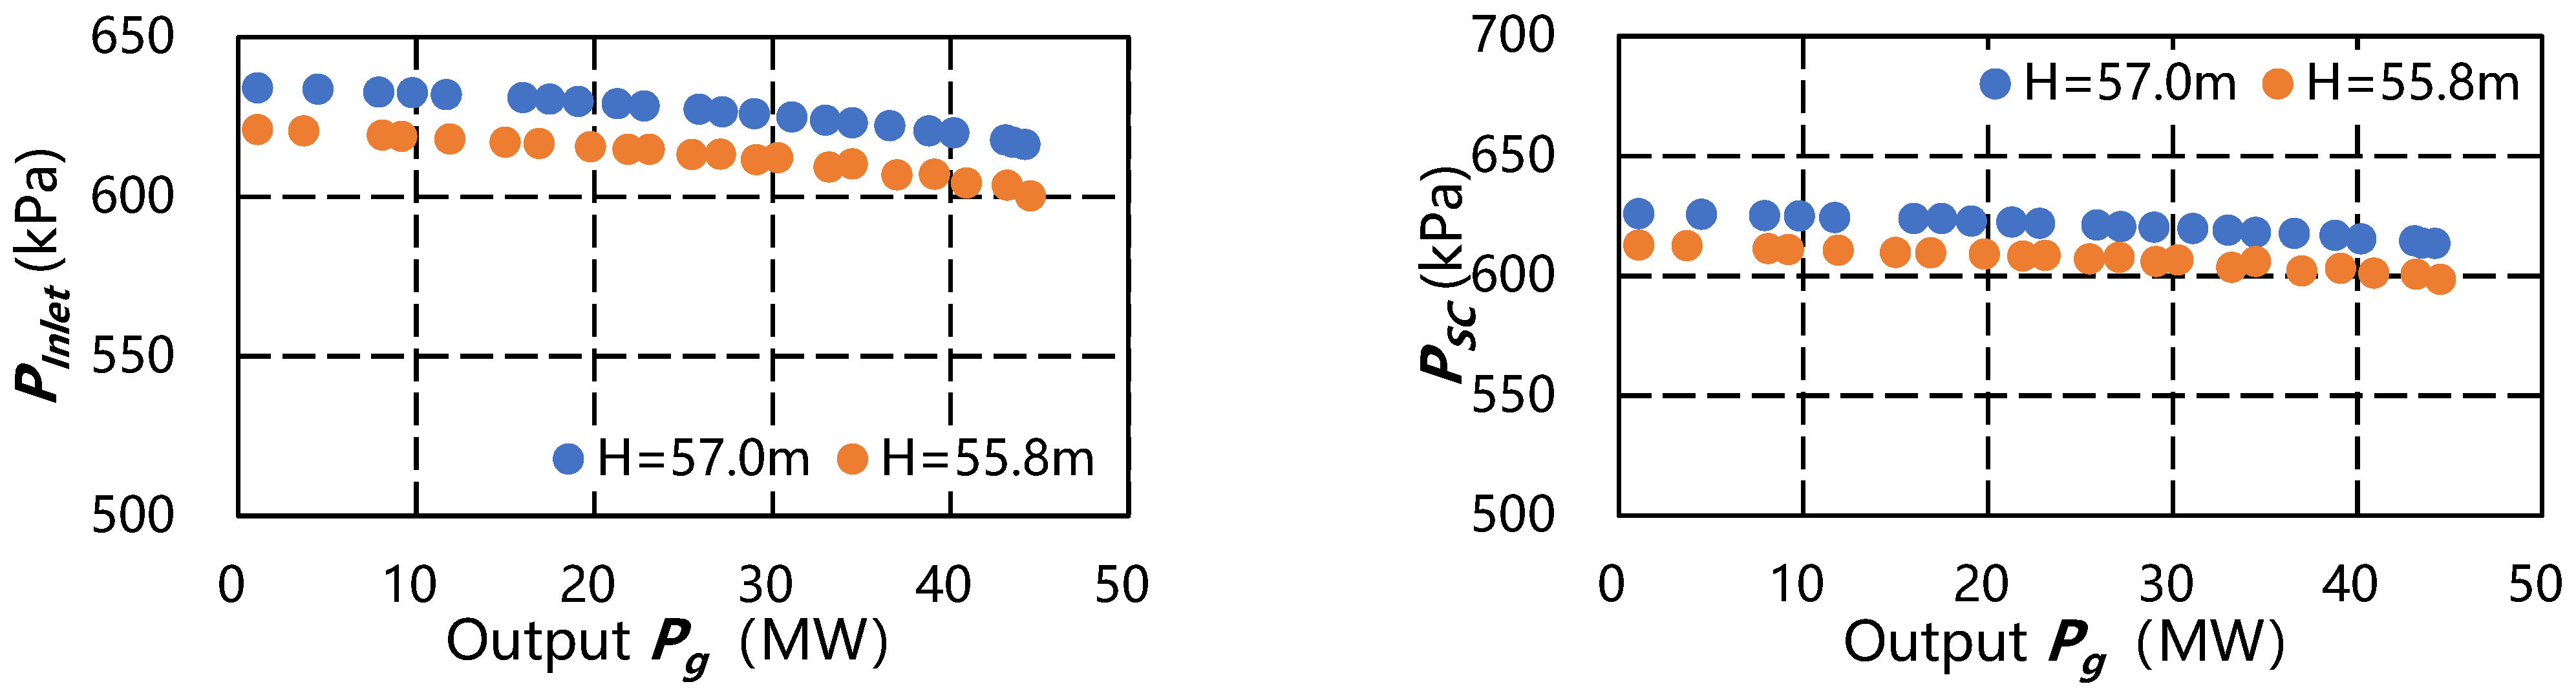
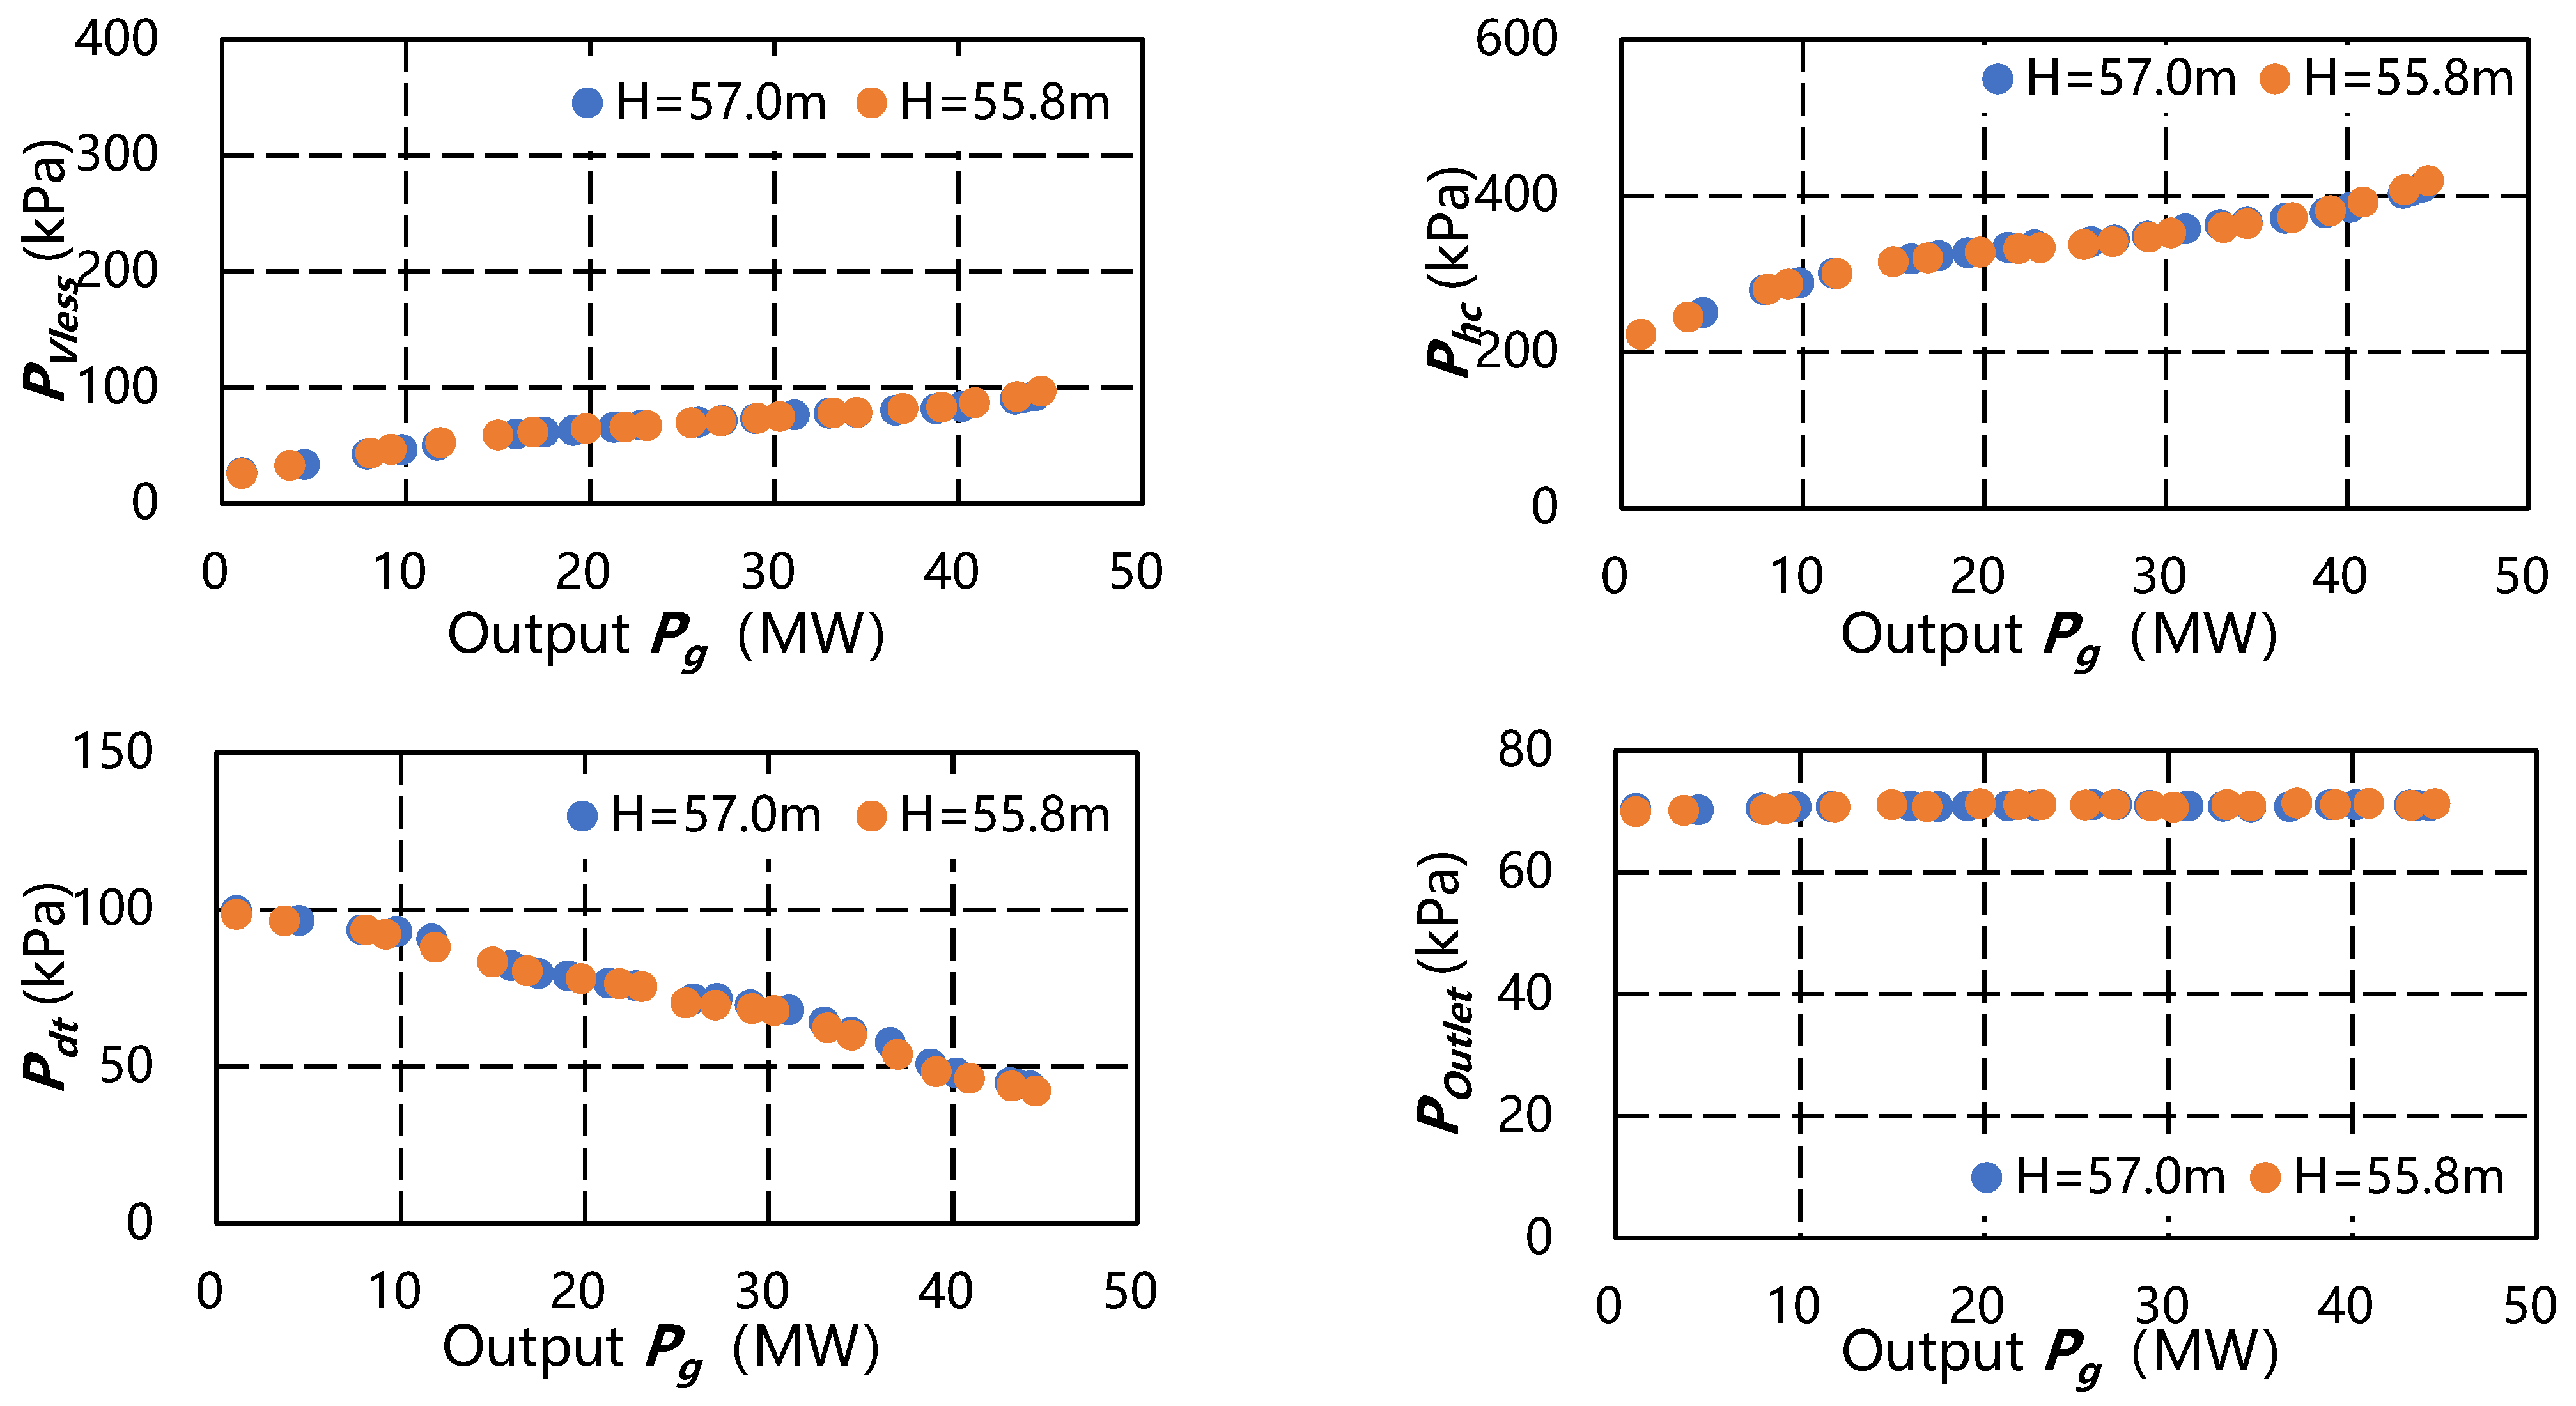
4.1. Pressure Variation with Head and Output
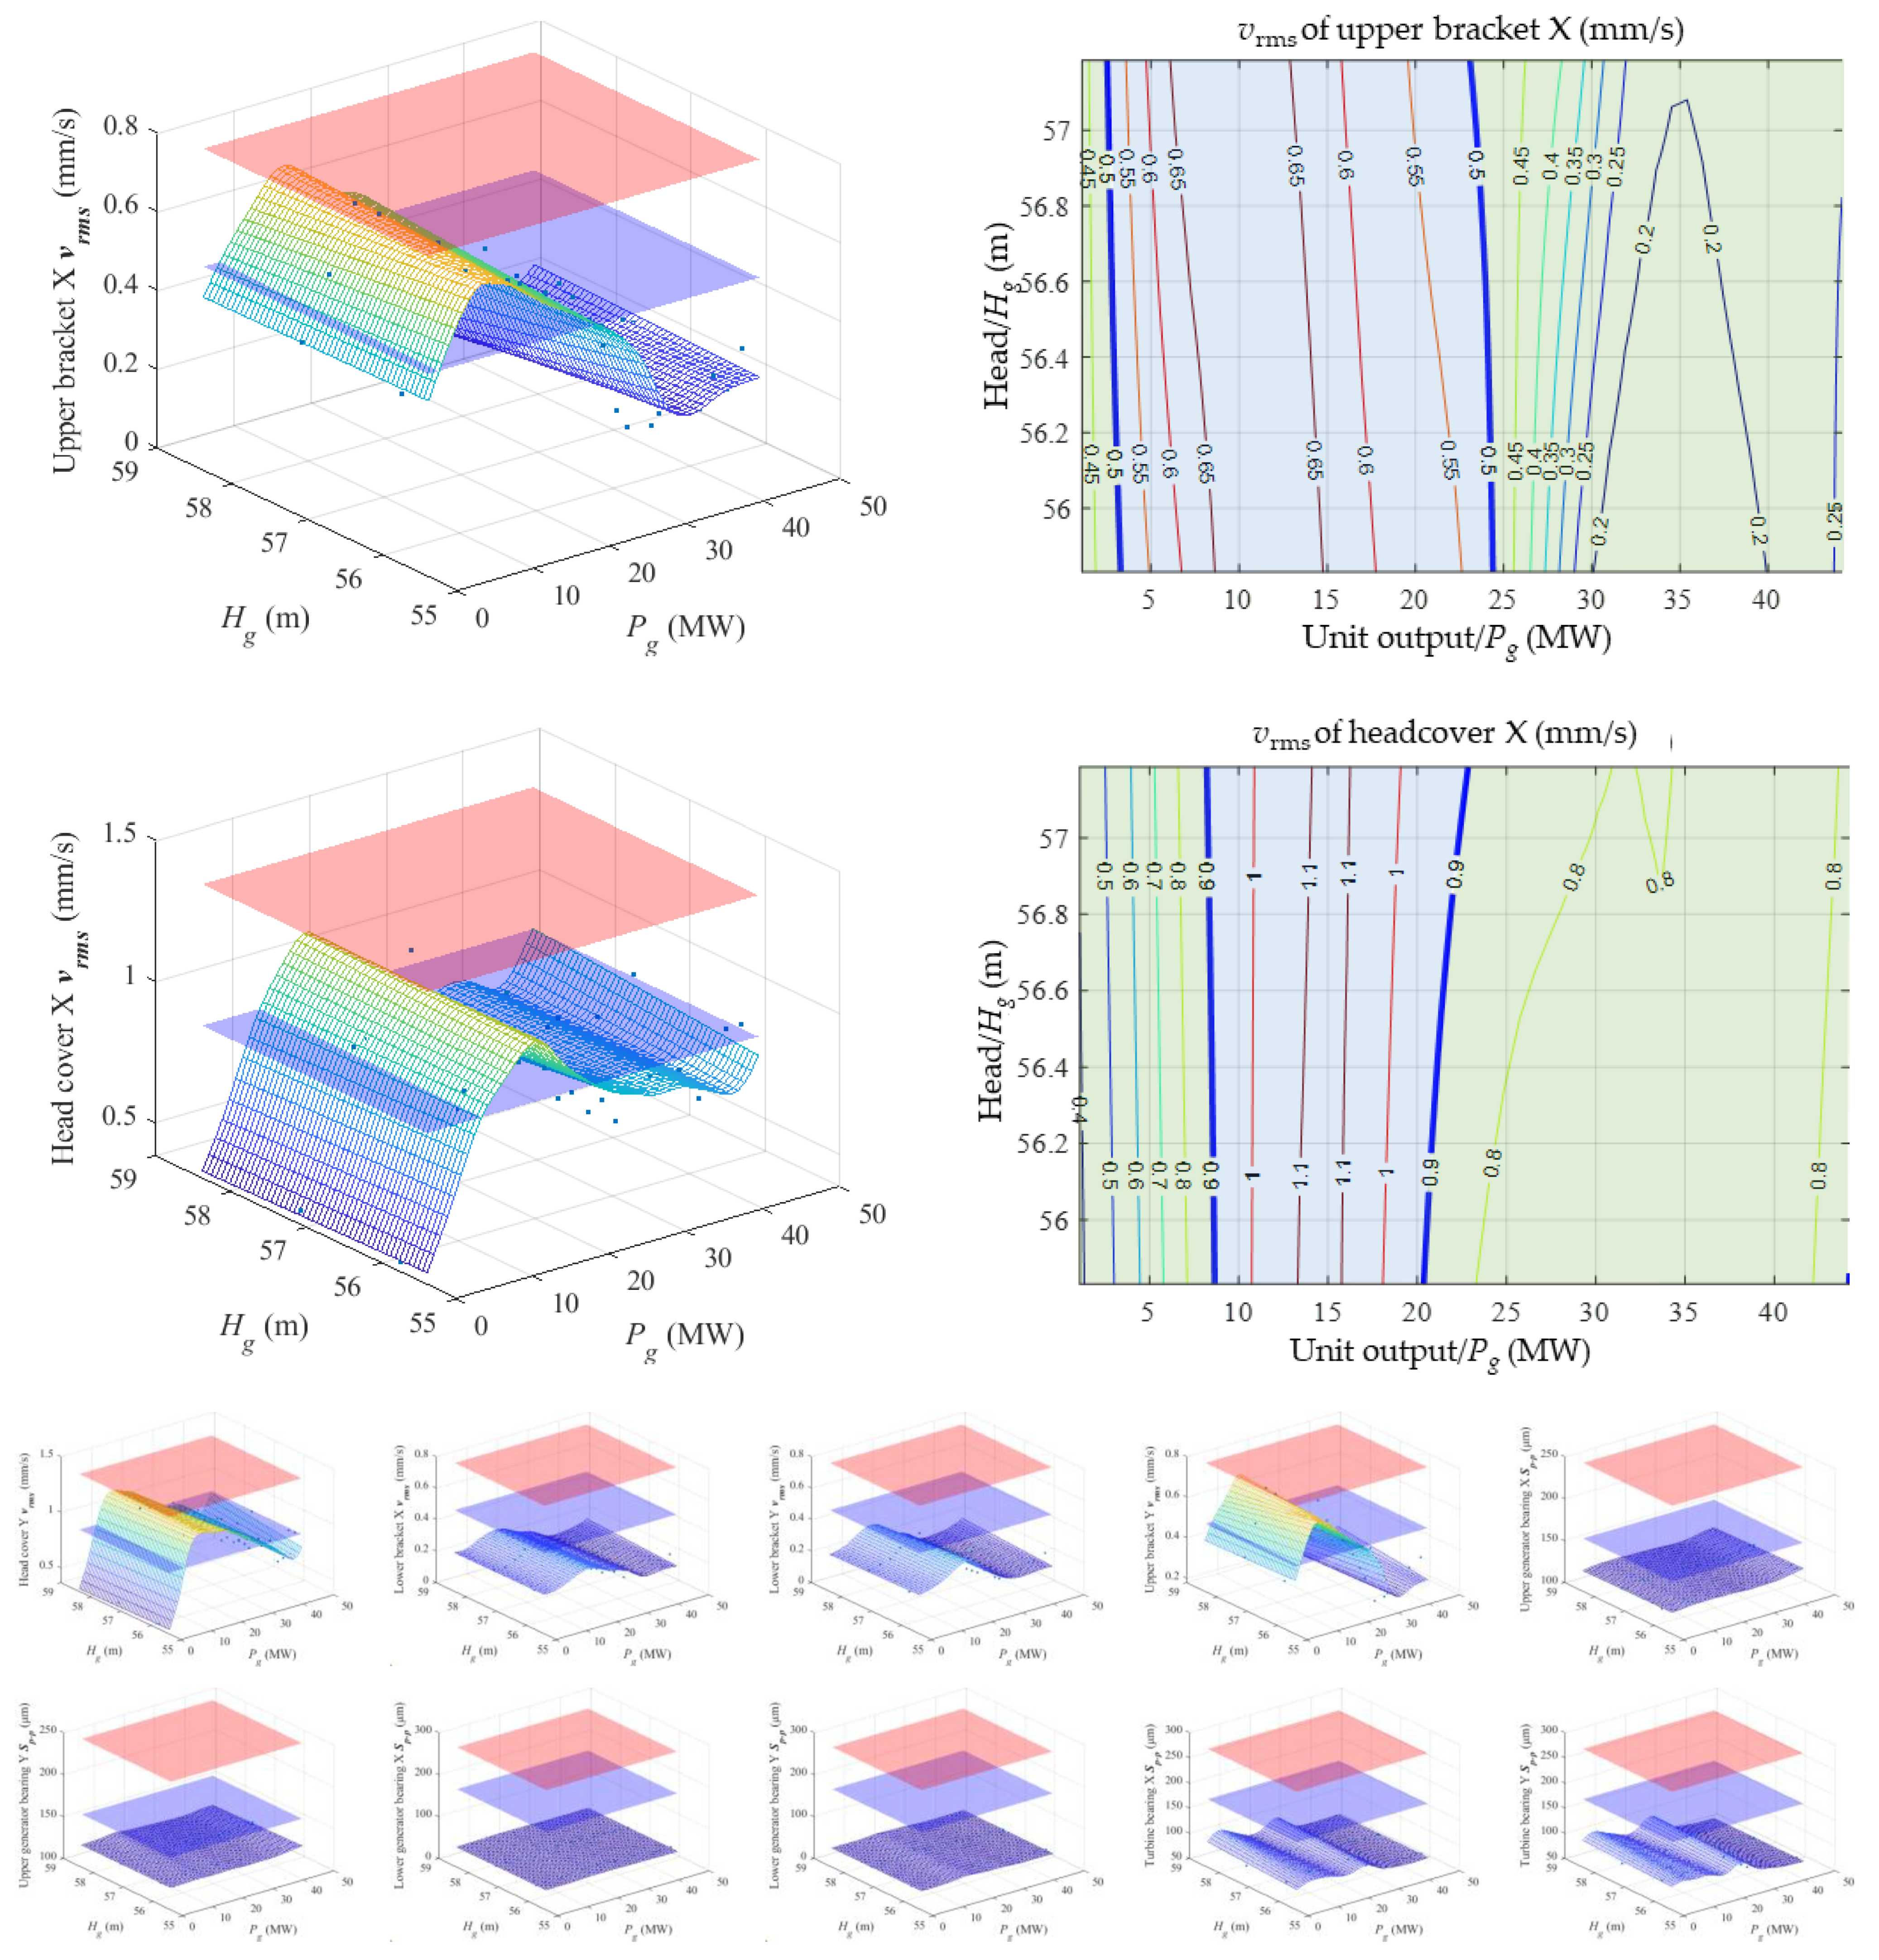
4.2. Multi-Dimensional Hill Chart
4.3. Application of Multi-Dimensional Hill Chart
5. Conclusions
Author Contributions
Funding
Data Availability Statement
Conflicts of Interest
References
- Trivedi, C.; Cervantes, M.J.; Gandhi, B.K.; Dahlhaug, O.G. Experimental and Numerical Studies for a High Head Francis Turbine at Several Operating Points. J. Fluids Eng. 2013, 135, 111102. [Google Scholar] [CrossRef]
- Pokharel, N.; Thapa, B.S.; Solemslie, B.W.; Thapa, B. Design and Numerical Study of a Pump-Turbine for Retrofitting of an Existing Francis Turbine. In Proceedings of the Journal of Physics: Conference Series; IOP Publishing: Bristol, UK, 2023; Volume 2629, p. 12011. [Google Scholar]
- Valero, C.; Egusquiza, M.; Valentín, D.; Presas, A.; Egusquiza, E. Behavior of Francis Turbines at Part Load. Field Assessment in Prototype: Effects on the Hydraulic System. In Proceedings of the 29th IAHR Symposium on Hydraulic Machinery and Systems, Kyoto, Japan, 17–21 September 2018; IOP Publishing: Kyoto, Japan, 2019; Volume 240, p. 052029. [Google Scholar]
- Lei, Y. Intelligent Fault Diagnosis and Remaining Useful Life Prediction of Rotating Machinery; Butterworth-Heinemann: Oxford, UK, 2016; ISBN 0128115351. [Google Scholar]
- Valentín, D.; Presas, A.; Valero, C.; Egusquiza, M.; Jou, E.; Egusquiza, E. Influence of the Hydrodynamic Damping on the Dynamic Response of Francis Turbine Runners. J. Fluids Struct. 2019, 90, 71–89. [Google Scholar] [CrossRef]
- Goyal, R.; Gandhi, B.K. Review of Hydrodynamics Instabilities in Francis Turbine during Off-Design and Transient Operations. Renew. Energy 2018, 116, 697–709. [Google Scholar] [CrossRef]
- Valero, C.; Egusquiza, M.; Egusquiza, E.; Presas, A.; Valentin, D.; Bossio, M. Extension of Operating Range in Pump-Turbines. Influence of Head and Load. Energies 2017, 10, 2178. [Google Scholar] [CrossRef]
- Egusquiza Estévez, E. Comportament Dinàmic de Màquines Hidràuliques; Edicions UPC: Barcelona, Spain, 2003; ISBN 8483016826. [Google Scholar]
- Kang, W.; Liang, Q.; Zhou, L.; Wang, Z. Numerical Investigation on Torsional Mode Self-Excited Vibration of Guide Vane in a Reversible Pump-Turbine during Pump Mode’s Starting Up. J. Appl. Fluid Mech. 2022, 15, 1789–1799. [Google Scholar]
- Alligné, S.; Maruzewski, P.; Dinh, T.; Wang, B.; Fedorov, A.; Iosfin, J.; Avellan, F. Prediction of a Francis Turbine Prototype Full Load Instability from Investigations on the Reduced Scale Model. IOP Conf. Ser. Earth Environ. Sci. 2010, 12, 012025. [Google Scholar] [CrossRef]
- Favrel, A.; Müller, A.; Landry, C.; Yamamoto, K.; Avellan, F. Study of the Vortex-Induced Pressure Excitation Source in a Francis Turbine Draft Tube by Particle Image Velocimetry. Exp. Fluids 2015, 56, 215. [Google Scholar] [CrossRef]
- Favrel, A.; Müller, A.; Landry, C.; Gomes, J.; Yamamoto, K.; Avellan, F. Dynamics of the Precessing Vortex Rope and Its Interaction with the System at Francis Turbines Part Load Operating Conditions. In Proceedings of the Journal of Physics: Conference Series; IOP Publishing: Bristol, UK, 2017; Volume 813, p. 12023. [Google Scholar]
- Müller, A.; Dreyer, M.; Andreini, N.; Avellan, F. Draft Tube Discharge Fluctuation during Self-Sustained Pressure Surge: Fluorescent Particle Image Velocimetry in Two-Phase Flow. Exp. Fluids 2013, 54, 1514. [Google Scholar] [CrossRef]
- Trivedi, C.; Cervantes, M.J. Fluid-Structure Interactions in Francis Turbines: A Perspective Review. Renew. Sustain. Energy Rev. 2017, 68, 87–101. [Google Scholar] [CrossRef]
- Huang, X.; Chamberland-Lauzon, J.; Oram, C.; Klopfer, A.; Ruchonnet, N. Fatigue Analyses of the Prototype Francis Runners Based on Site Measurements and Simulations. IOP Conf. Ser. Earth Environ. Sci. 2014, 22, 12014. [Google Scholar] [CrossRef]
- Müller, A.; Bullani, A.; Dreyer, M.; Roth, S.; Favrel, A.; Landry, C.; Avellan, F. Interaction of a Pulsating Vortex Rope with the Local Velocity Field in a Francis Turbine Draft Tube. In Proceedings of the IOP Conference Series: Earth and Environmental Science; IOP Publishing: Bristol, UK, 2012; Volume 15, p. 32040. [Google Scholar]
- Zhao, W.; Huang, X.; Yang, M.; Yang, H.; Bi, H.; He, Q.; Wang, Z. Flow-Induced Dynamic Behavior of Head-Cover Bolts in a Prototype Pump-Turbine during Load Rejection. Machines 2022, 10, 1130. [Google Scholar] [CrossRef]
- Egusquiza, M.; Egusquiza, E.; Valentin, D.; Valero, C.; Presas, A. Failure Investigation of a Pelton Turbine Runner. Eng. Fail. Anal. 2017, 81, 234–244. [Google Scholar] [CrossRef]
- Egusquiza, E.; Valero, C.; Estévez, A.; Guardo, A.; Coussirat, M. Failures Due to Ingested Bodies in Hydraulic Turbines. Eng. Fail. Anal. 2011, 18, 464–473. [Google Scholar] [CrossRef]
- Zhang, M.; Valentín, D.; Valero, C.; Egusquiza, M.; Egusquiza, E. Failure Investigation of a Kaplan Turbine Blade. Eng. Fail. Anal. 2019, 97, 690–700. [Google Scholar] [CrossRef]
- ISO 20816-5:2018; Mechanical Vibration—Measurement and Evaluation of Machine Vibration—Part 5: Machine Sets in Hydraulic Power Generating and Pump-Storage Plants. ISO: Geneva, Switzerland, 2018; p. 60.
- Zhao, W.; Presas, A.; Egusquiza, M.; Valentín, D.; Egusquiza, E.; Valero, C. On the Use of Vibrational Hill Charts for Improved Condition Monitoring and Diagnosis of Hydraulic Turbines. Struct. Health Monit. 2022, 21, 147592172110724. [Google Scholar] [CrossRef]
- Zhao, W.; Egusquiza, M.; Estevez, A.; Presas, A.; Valero, C.; Valentín, D.; Egusquiza, E. Improved Damage Detection in Pelton Turbines Using Optimized Condition Indicators and Data-Driven Techniques. Struct. Health Monit. 2021, 20, 3239–3251. [Google Scholar] [CrossRef]
- Rafiq, M.Y.; Bugmann, G.; Easterbrook, D.J. Neural Network Design for Engineering Applications. Comput. Struct. 2001, 79, 1541–1552. [Google Scholar] [CrossRef]
- Xu, B.; Zhao, W.; Lin, W.; Mao, Z.; Tao, R.; Wang, Z. The Influence of Different Operating Conditions on the Support Bracket Stress in Pumped Storage Units. Energies 2022, 15, 2195. [Google Scholar] [CrossRef]


| Parameter | Value |
|---|---|
| Runner diameter, D1 | 3.5 m |
| Number of blades, Zb | 13 |
| Number of guide vanes, Zg | 24 |
| Rated speed | 166.7 rpm |
| Blade passing frequency, fb | 36.11 Hz |
| Best efficiency | 94.14% |
| Sensor | Position |
|---|---|
| Seismic sensor | Upper bracket (A31, A34) |
| Lower bracket (A21, A24) | |
| Head cover (A11, A14) | |
| Proximity probe | Upper generator bearing (D31, D34) |
| Lower generator bearing (D21, D24) Turbine bearing (A11, A14) | |
| Pressure sensor | Spiral casing inlet (Pinlet), end of spiral casing (Psc), vaneless zone (Pvless), head cover (Phc), draft tube inlet (Pdt), and draft tube outlet (Poutlet) |
| Action Limit | Relative Shaft Vibration Sp-p/μm | Bearing House Vibration vrms/(mm/s) | ||||
|---|---|---|---|---|---|---|
| Position | Turbine bearing | Lower generator bearing | Upper generator bearing | Headcover | Lower bracket | Upper bracket |
| Action limit 1: A–B/C | 180 | 180 | 160 | 0.9 | 0.5 | 0.5 |
| Action limit 2: C/D | 280 | 280 | 250 | 1.4 | 0.8 | 0.8 |
Disclaimer/Publisher’s Note: The statements, opinions and data contained in all publications are solely those of the individual author(s) and contributor(s) and not of MDPI and/or the editor(s). MDPI and/or the editor(s) disclaim responsibility for any injury to people or property resulting from any ideas, methods, instructions or products referred to in the content. |
© 2024 by the authors. Licensee MDPI, Basel, Switzerland. This article is an open access article distributed under the terms and conditions of the Creative Commons Attribution (CC BY) license (https://creativecommons.org/licenses/by/4.0/).
Share and Cite
Jian, B.; Zhao, W.; Guo, R.; Chen, S.; Xia, M.; Wang, Z. Application of Multi-Dimensional Hill Chart in the Condition Monitoring and Cost Estimation of the Francis Turbine Unit. Processes 2024, 12, 1243. https://doi.org/10.3390/pr12061243
Jian B, Zhao W, Guo R, Chen S, Xia M, Wang Z. Application of Multi-Dimensional Hill Chart in the Condition Monitoring and Cost Estimation of the Francis Turbine Unit. Processes. 2024; 12(6):1243. https://doi.org/10.3390/pr12061243
Chicago/Turabian StyleJian, Bin, Weiqiang Zhao, Rongfu Guo, Shuping Chen, Ming Xia, and Zhengwei Wang. 2024. "Application of Multi-Dimensional Hill Chart in the Condition Monitoring and Cost Estimation of the Francis Turbine Unit" Processes 12, no. 6: 1243. https://doi.org/10.3390/pr12061243
APA StyleJian, B., Zhao, W., Guo, R., Chen, S., Xia, M., & Wang, Z. (2024). Application of Multi-Dimensional Hill Chart in the Condition Monitoring and Cost Estimation of the Francis Turbine Unit. Processes, 12(6), 1243. https://doi.org/10.3390/pr12061243