Abstract
In the present work, four different wastewaters from the food industry were used in parallel, in four identical dual-chamber MFCs, with graphite granules as anodic electrodes. Specifically, a mixture of hydrogenogenic reactor effluents (effluents from a dark fermentation reactor fed with cheese whey (CW), for hydrogen production), CW, and a mixture of expired fruit juices and wastewater from the confectionery industry were simultaneously used in MFCs to evaluate the effect of the type of effluent/wastewater on their efficiency. An electrochemical characterization was performed using electrochemical impedance spectroscopy measurements under open- (OCP) and closed-circuit conditions, at the beginning and end of the operating cycle, and the internal resistances were determined and compared. The results showed that the highest OCP value, as well as the highest power density (Pmax) and Coulombic efficiency (εcb) at the beginning of the operating cycle, was exhibited by the MFC, using a sugar-rich wastewater from the confectionery industry as substrate (sugar accounts for almost 92% of the organic content). This can be correlated with the low internal resistance extracted from the Nyquist plot at OCP. In contrast, the use of CW resulted in a lower performance in terms of OCP, εcb and Pmax, which could be correlated to the high internal resistance and the composition of CW, a substrate rich in lactose (disaccharide), and which also contains other substances (sugars account for almost 72% of its organic content, while the remaining 28% is made up of other soluble compounds).
1. Introduction
The enormous increase in energy demand due to global population growth (over 8 billion since 2019) and modern lifestyles are leading to a sharp increase in industrial activities and waste production [1]. In this context, two main issues have recently attracted the interest of researchers worldwide: the implementation of renewable energy resources to meet the enormous energy demand and the development of sustainable and environmentally friendly processes for the management of the waste produced. Therefore, technologies that combine both energy production and waste treatment could be considered very promising for practical application in the near future. In this context, microbial fuel cells (MFCs), which generate power through the decomposition of organic compounds contained in the various wastewaters/effluents, have gained considerable scientific interest in the last 10 years [2,3]. Electricity production in MFCs is due to the electrocatalytic activity of specific microbial consortia (exo-electrogens), which typically colonize in the anodic electrode and consume the organics, generating electrons [3,4,5].
Various factors, such as the adhesion of bacteria, the electron transfer mechanism and the pH value, influence the performance of the MFC [4,6]. However, the MFC design [4,5,7] and its characteristics, such as the electrocatalytic anode or/and cathode material [1], also influence its efficiency. The dual-chamber MFC, which consists of two compartments separated by a proton exchange membrane (PEM), has the advantage of a simple configuration, which usually operates in batch mode to determine the optimal operating conditions [8,9]. However, the main disadvantage of dual-chamber MFCs is the increased internal resistance, due to the larger distance between the two electrodes or to the membrane, which has a negative effect on its efficiency [10,11,12].
The anode materials typically used and the ratio of electrode surface area to electrolyte volume also play an important role in process efficiency. It has been reported that by increasing this ratio, higher power densities can be achieved [13,14,15] due to improved electrode reaction kinetics and lower mass transport losses. In practice, a high ratio can be achieved by using innovative conductive materials with a large surface area and specific structural, electrical and chemical properties such as carbon nanotubes or graphene oxide [13,14,16]. However, due to their high cost, the extensive use of these materials could limit their practical implementation. In contrast, the low-cost graphite granules (GGs) commonly used as 3D electrodes in MFCs [5,7,17] could be a promising alternative, owing to their high specific surface area, biocompatibility with exo-electrogens, high electrical conductivity and low toxicity [18].
All the above parameters are also closely related to the type of wastewater used, the diversity and composition of which require thorough investigation [19]. A variety of industrial or domestic wastewater/waste from the food industry [20,21], the beverage industry [22,23], the confectionery industry [24], the dairy industry [8,17,25], agricultural processing [26], olive processing [5], mining [27,28], pharmaceuticals [29], textiles [30] and domestic waste and municipal wastewater [7,31] are some of the side streams that originate from various human/industrial activities and are suitable for use in MFCs.
In order to assess the effect of different wastewaters on biochemical and electrochemical properties of MFCs, four different wastewaters from the food industry were used in parallel in MFCs, using GGs as anodic electrodes. In particular, a volatile fatty acids (VFAs)-rich mixture of hydrogenogenic reactor effluents (effluents from a dark fermentative hydrogen production reactor fed with cheese whey (CW)), CW wastewater, and a mixture of expired fruit juices and confectionery industry wastewater were used as substrates in four identical dual-chamber MFCs. CW is the lactose-rich watery by-product of cheese production, which accounts for around 85–95% of the milk volume and contains nutrients. In many cases, this stream has been improperly disposed of into the environment without prior treatment [32]. In addition, large quantities of fruit juices are discarded annually worldwide due to their short shelf-life, the need for being maintained at low temperatures, and their vulnerability to microbial degradation [33]. The confectionery industry is one of the most important industries worldwide, with a wide variety of products and processes that generate numerous liquid waste streams with different characteristics and organic loads [34]. In this respect, the treatment in MFCs of all the above-mentioned wastewaters containing large amounts of fermentable substrates (sugars and carbohydrates) is a promising approach. On the other hand, VFAs, which are abundant in the effluents of hydrogenogenic reactors, cannot be further degraded by the fermentative hydrogen-producing bacteria, but they can be considered an energy source for the exo-electrogens working on the anodes of bioelectrochemical systems, such as MFCs [17,35].
While there are studies dealing with the use of CW [8,17,25], or effluents from a dark fermentative hydrogen production reactor fed with cheese whey [17,36] in MFCs, there is a lack of comparative studies working in parallel with different food waste streams, such as the confectionery industry wastewater to correlate their individual characteristics with MFC efficiencies. In the present study, a thorough electrochemical characterization of the MFC systems was performed using electrochemical impedance spectroscopy (EIS) measurements at the beginning and the end of the first operating cycle, at open-circuit potential (OCP) and closed-circuit potential, and the electrochemical characteristics (ohmic and polarization resistance, Rohm and Rp, respectively) were determined and correlated, with the specific properties of the individual wastewater type.
2. Materials and Methods
2.1. MFCs and Experimental Procedure
Four identical H-type MFC devices [37] were used, working with four different substrates. A PEM (Nafion 117, Sigma-Aldrich, St. Louis, MO, USA) was placed in the connection point between the two chambers to allow for the proton transfer from the anode to the cathode. Each of the Nafion membranes (3.8 cm2) was activated by stepwise soaking at 80 °C for 1 h in 0.1 M H2O2, deionized H2O, 0.1 M H2SO4 and, finally, deionized water, where it was stored prior to use [8]. Each chamber had a lid with three ports, two for gas and liquid samples and the other for inserting the electrode into the cathode or the graphite rod into the anode. The graphite rod (diameter = 6 mm) was used as an electron collector in the anode, using GGs (Type 00514, Le Carbone, Wemmel, Belgium) after pretreatment with HCl, as proposed in the work of Antonopoulou et al. [7]. Specifically, the GGs were sterilized at 120 °C for 30 min and then rinsed for 4 repeated times in HCl solution (32%) for 24 h, to remove the metals from the deepest parts of the pores. Both electrodes were connected to a resistance decade box (Cropico RS:211-159, RS Components Ltd., Birchington Road, Corby, Northants, UK), which closed the circuit and was connected in parallel to a recording system (ADAM 4017, Advantech Co, Ltd., Taipei, Taiwan).
The nominal volume of each chamber was 310 mL, while the working volume after the addition of the GGs in the anodic chamber was almost 100 mL. A Pt-coated (ETEK, 0.5 mg cm−2) carbon cloth (CC) (3 cm × 3 cm) with a surface area of 2 × 9 = 18 cm2 was used as the cathodic electrode, which was held in the catholyte by a Ti wire (diameter = 0.81 mm, purity 99.7%, Sigma-Aldrich). The cathodes were continuously aerated using an air-pump and the voltage produced was recorded. The MFCs were operated in two phases: (a) acclimation of the microbial consortium and establishment of a biofilm over the GGs using a synthetic medium; and (b) operation with the wastewaters.
During both phases, the cathode compartments were filled with a nutrient medium consisting of a buffer solution (3.45 g L−1 Na2HPO4∙2H2O, 3.67 g L−1 NaH2PO4∙2H2O) and KCl (0.16 g L−1). During the acclimation phase, the anode compartments were filled with the above nutrient medium, acetate (chemical oxygen demand (COD): 0.8 g L−1) alkalinity (5 g L−1 NaHCO3) and a solution of trace elements [37]. Inoculation was performed with the addition of methanogenic sludge (10% v/v) obtained from an anaerobic digester with the following characteristics: pH: 7.2 ± 0.1, total COD (tCOD): 24.72 ± 1.12 g L−1, dissolved COD (dCOD): 0.51 ± 0.21 g L−1, total suspended solids (TSS): 30.44 ± 1.71 g L−1, volatile suspended solids (VSS): 15.25 ± 1.53 g L−1. The acclimation phase was conducted under closed-circuit conditions (external resistance R = 1000 Ω), for three operation cycles, over a period of 33 d.
After the acclimation phase, the acetate was replaced by the wastewaters, at the same concentration (0.8 g COD L−1), without microorganisms’ addition. The main characteristics of the implemented wastewaters used as organic substrates in the MFCs’ anodes, before dilution, are shown in Table 1. The additional characteristics, for the mixture of the hydrogenogenic reactor effluents used in MFC1, were as follows: acetic acid: 3.56 ± 0.09 g L−1, propionic acid: 0.38 ± 0.01 g L−1, butyric acid: 9.52 ± 1.88 g L−1, caproic acid: 1.85 ± 0.45 g L−1, TSS: 5.32 ± 0.70 g L−1, VSS: 4.32 ± 0.42 g L−1; for the CW used in MFC2: TSS: 4.32 ± 0.70 g L−1, VSS: 4.12 ± 0.42 g L−1; for the mixture (1:1, v/v) of two different types (natural orange juice and 9 fruits juice) of expired juices [38] used in MFC3: TSS: 3.15 ± 1.14 g L−1; and, finally, for the confectionery industry wastewater [39] used in MFC4: TSS: 3.92 ± 0.16 g L−1.

Table 1.
The main characteristics of the wastewaters used in MFCs.
2.2. Methods and Calculations
Standard methods [40] were used to calculate pH, COD, TSS and VSS, while carbohydrates and VFAs (acetic acid, propionic acid, butyric acid, caproic acid) were determined as described in the work of Antonopoulou et al. [41]. The potential was recorded every 10 min and the Coulombic efficiency, εcb (%), was evaluated as described in the work of Antonopoulou et al. [8]:
where M = 32 is the molecular weight of oxygen, F is Faraday’s constant (96,485 C mol-e−1), b = 4 is the number of electrons exchanged per mol of oxygen, V is the volume of liquid in the anode compartment, and Δ(COD) is the change in d.COD.
The EIS measurements were carried out under both OCP and load conditions using an Autolab PGSTAT204, Metrohm, Herisau, Switzerland (0.4 A/20 V) potentiostat-galvanostat. EIS spectra in the form of Nyquist and Bode plots were recorded between 100 kHz and 1 mHz in potentiostatic mode (10 mV amplitude).
To obtain the polarization curves at the beginning and at the end of the first operating cycle, the external resistance of the circuit was changed (0 Ω–10 MΩ), recording the potential and current values, and the power density was calculated and expressed per unit of working volume of the anode (0.1 L).
3. Results
3.1. Physicochemical Characteristics of the MFCs
For MFC1, the maximum Ucell value was 245, 286, and 289 mV during the first, second and third cycle of the acclimation phase, respectively, while the pH of the solution was practically neutral. For MFC2, the maximum value of Ucell was 292 mV, 306 mV, and 327 mV, respectively. The maximum values of the potential were 309 mV, 331 mV, and 346 mV in the three cycles of the acclimation phase of MFC3, while the results for MFC4 were similar: the potential was maximized to 266 mV, 292 mV, and 345 mV, respectively.
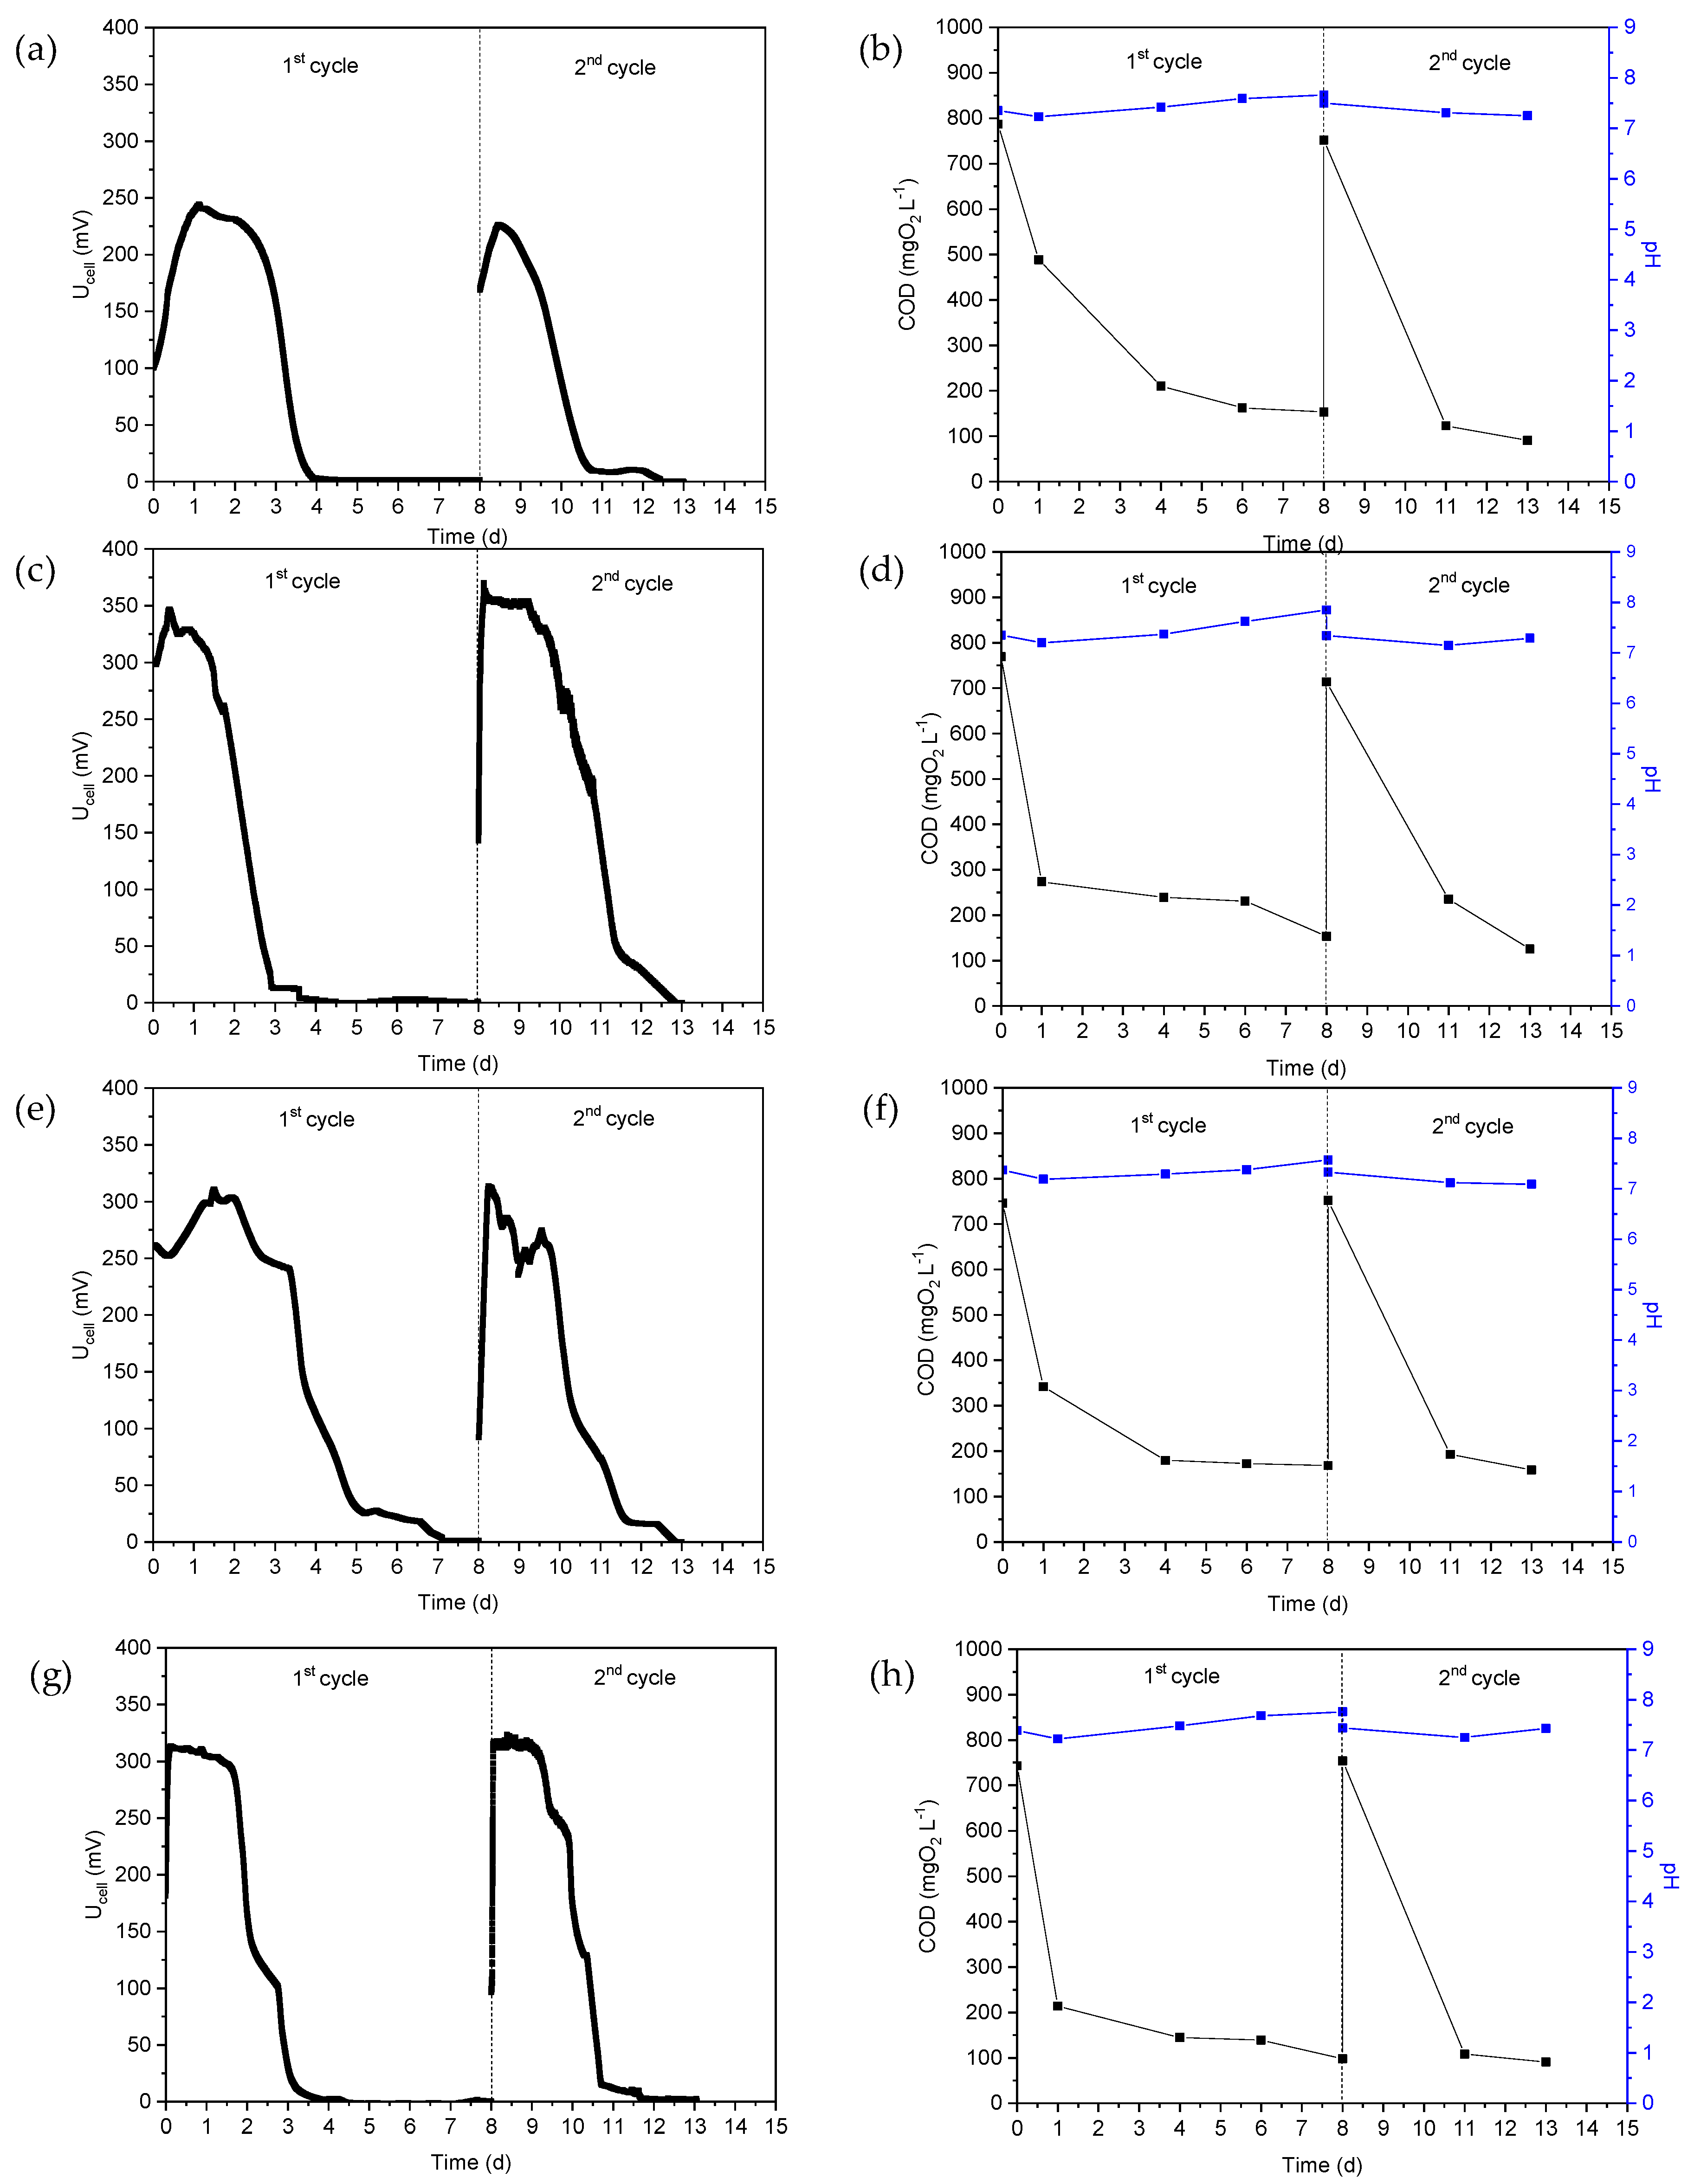
After the acclimation phase, MFCs were fed with real wastewater. Thus, the VFA-rich hydrogenogenic reactor effluent was used as substrate in MFC1 and the Ucell, COD and pH versus time during the two operating cycles are shown in Figure 1a,b. As can be seen in Figure 1a, the maximum Ucell during the first and second cycles was 244 mV and 226 mV, respectively, while the pH of the anodic solution varied slightly during the two operating cycles, from 7.23 ± 0.04 to 7.66 ± 0.03, as can be seen in Figure 1b. The COD value decreased from 787 mg L−1 to 154 mg L−1 during the first cycle, which corresponded to a reduction of approximately 80.5%, while the reduction in COD was of approximately 88% in the second cycle. The aforementioned fluctuations in COD are reflected in the εcb (%) values, which amounted to 9.7% and 7.5% for the first and second cycles, respectively. Similarly, after biofilm formation on the surface of the GGs, CW was fed into the anodic chamber of the MFC2 without adding additional microorganisms, and the performance was examined for two cycles of operation (Figure 1c,d). The maximum MFC2 potential during the first cycle was 345 mV, while a slight increased potential value was also reached in the second cycle (approximately 383 mV). The decrease in COD during the first cycle (Figure 1d) corresponded to an εcb of 7.3%, while the εcb of the second cycle was higher, namely 10.7%.
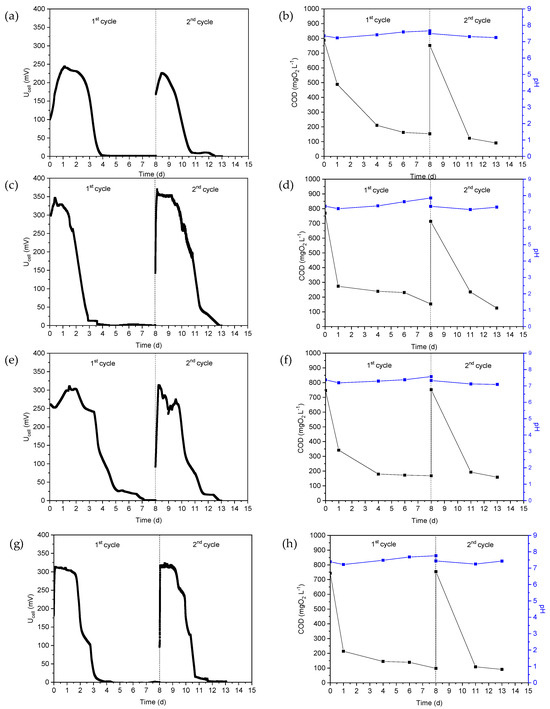
Figure 1.
(a,c,e,g) MFC voltage, (b,d,f,h) chemical oxygen demand (COD) and pH of the anolyte as a function of time when using hydrogenogenic reactor effluents as energy source in MFC1 (a,b), cheese whey in MFC2 (c,d), the mixture of expired juices in MFC3 (e,f) and confectionery industry wastewater in MFC4 (g,h).
The mixture of expired juices was used as substrate in the MFC3. The changes in Ucell, COD and pH as a function of time are shown in Figure 1e,f. The maximum of Ucell was 310 mV and 313 mV, while the reduction in COD was 77.5% and 79.0% during the first and second cycles, respectively. The εcb was determined to be 9.8% and 8.1%, respectively.
For the MFC4, the wastewater from the confectionery industry was used as a substrate and the results are shown in Figure 1g,h. The Ucell was highest in the first and second cycles at 313 mV and 323 mV, while the pH values ranged from 7.22 to 7.82 during both MFC4 operating cycles, as shown in Figure 1h. COD reduction was of 86.8% and 87.9% and εcb was calculated to be 14.1 and 10.1%.
3.2. Characteristics of the MFCs Based on Electrochemical Polarization Measurements
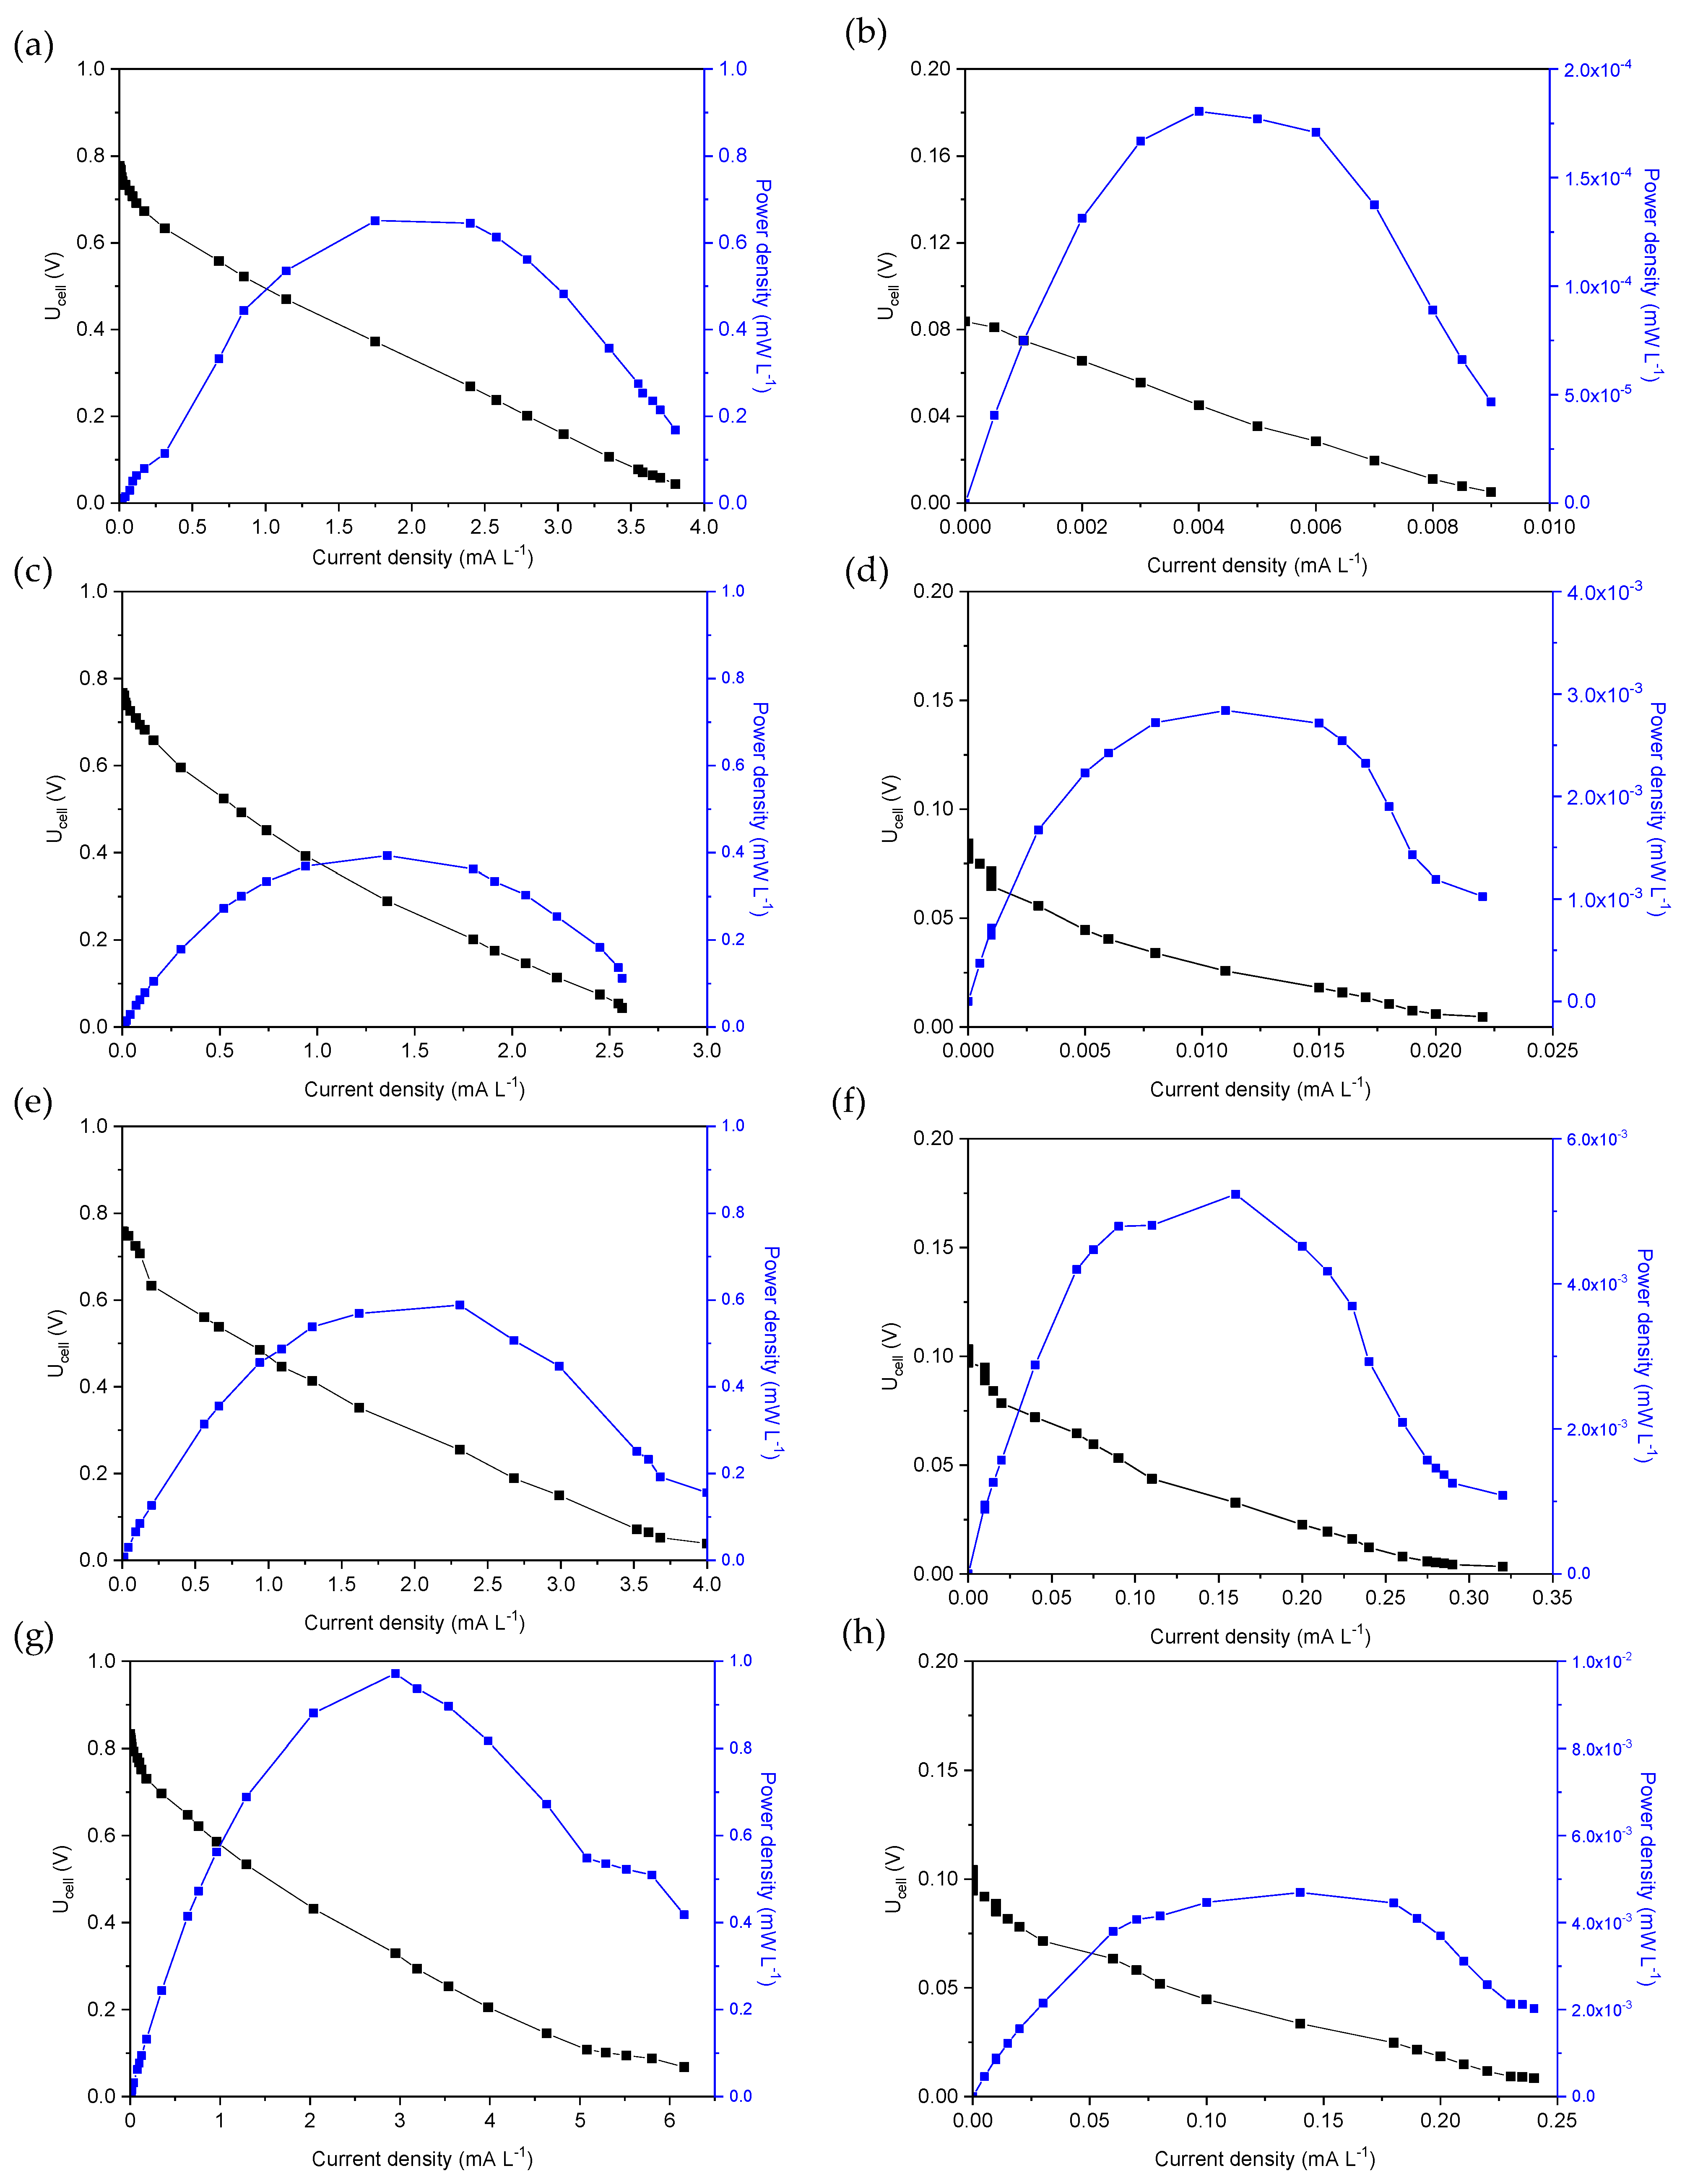
The electrochemical polarization measurements were performed by changing the external resistance value from 0 Ω to 10 MΩ at the beginning and the end of the first operating cycle of each MFC. The polarization measurements of MFC1 are shown in Figure 2a,b in the form of plots showing Uell (V) and power density (mW L−1) versus current (mA L−1), normalized to the volume of the anodic solution. The OCP at the beginning of the first cycle (Figure 2a) was approximately 0.78 V at an external resistance value of 10 MΩ, while the OCP at the end of the first operating cycle was approximately 0.09 V (Figure 2b). At the beginning of the first cycle, the maximum power density (Pmax) was approximately 0.65 mW L−1, corresponding to a current density of 1.75 mA L−1 and an applied potential of 0.37 V, while at the end of the first cycle, the highest power density was only 0.0002 mW L−1, corresponding to a potential of 0.045 V and a current density of 0.004 mA L−1. Thus, based on the polarization curves, the internal resistance was estimated to be five times (10 kΩ) the value of 2 kΩ estimated at the beginning of the first operating cycle.
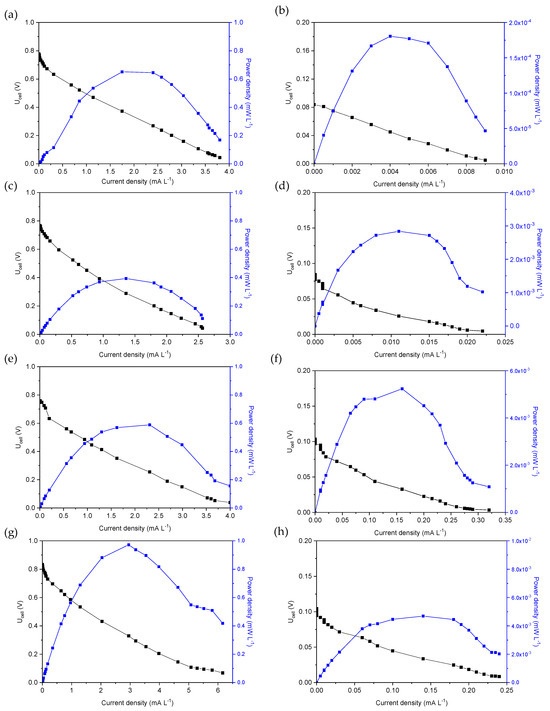
Figure 2.
MFC voltage and power density versus current density for (a,b) MFC1, (c,d) MFC2, (e,f) MFC3 and (g,h) MFC4, at the beginning (a,c,e,g) and the end (b,d,f,h) of the first operating cycle.
Figure 2c,d shows the polarization curves at the beginning and end of the first operating cycle of MFC2. The OCP at the beginning of the cycle was 0.73 V (external R = 10 MΩ), while at the end of the cycle, the measured OCP value was only 0.08 V (external R = 4 ΜΩ). These values were similar to those measured for MFC1, as shown in Figure 2a,b. The maximum power density was found to be 0.39 mW L−1 at a current density of 1.36 mA L−1 and Ucell 0.29 V at the beginning of the first operating cycle of MFC2 with an internal resistance of approximately 2 kΩ. At the end of the cycle, a significant reduction in Pmax was observed, reaching a value of 0.003 mW L−1 and a current density of 0.11 mA L−1, corresponding to a potential of 0.03 V and a resistance of 2 kΩ, respectively.
The dependence of the Ucell and the power density on the current density at the beginning and end of the first operating cycle of the MFC3 are shown in Figure 2e,f. The OCP was determined to be 0.75 V at the beginning of the cycle with an external resistance of 10 MΩ, while it dropped to 0.1 V (4 MΩ external resistance) at the end of the cycle. The maximum power density was 0.41 mW L−1 at a current density of 1.9 mA L−1 (potential 0.21 V) and an estimated internal resistance of 1 kΩ at the beginning of the cycle, while at the end of the cycle, a Pmax of 0.005 mW L−1 was achieved, corresponding to 0.16 mA L−1, 0.03 V and 2 kΩ, respectively.
As for the polarization curves of the MFC4 (Figure 2g,h), an OCP of 0.83 V (application of 10 MΩ) and 0.1 V (4 ΜΩ) was measured at the beginning and end of the cycle, respectively. The power density was maximized (0.97 mW L−1) at a current density of 2.9 mA L−1 and 0.33 V (internal resistance 1 kΩ) and reduced at the end of the cycle to 0.005 mW L−1 at a current density of 0.14 mA L−1 and a potential of 0.03 V (internal resistance 2 kΩ).
3.3. Characteristics of the MFCs Based on Electrochemical Impedance Spectroscopy
3.3.1. Electrochemical Impedance Spectroscopy Measurements of MFC1
The EIS measurements were carried out by placing the working electrode at the anode and the counter electrode shorted to the reference electrode at the cathode of the MFC. The experimental measurements were conducted at the beginning and the end of the first operating cycle under OCP conditions and at different applied potentials.
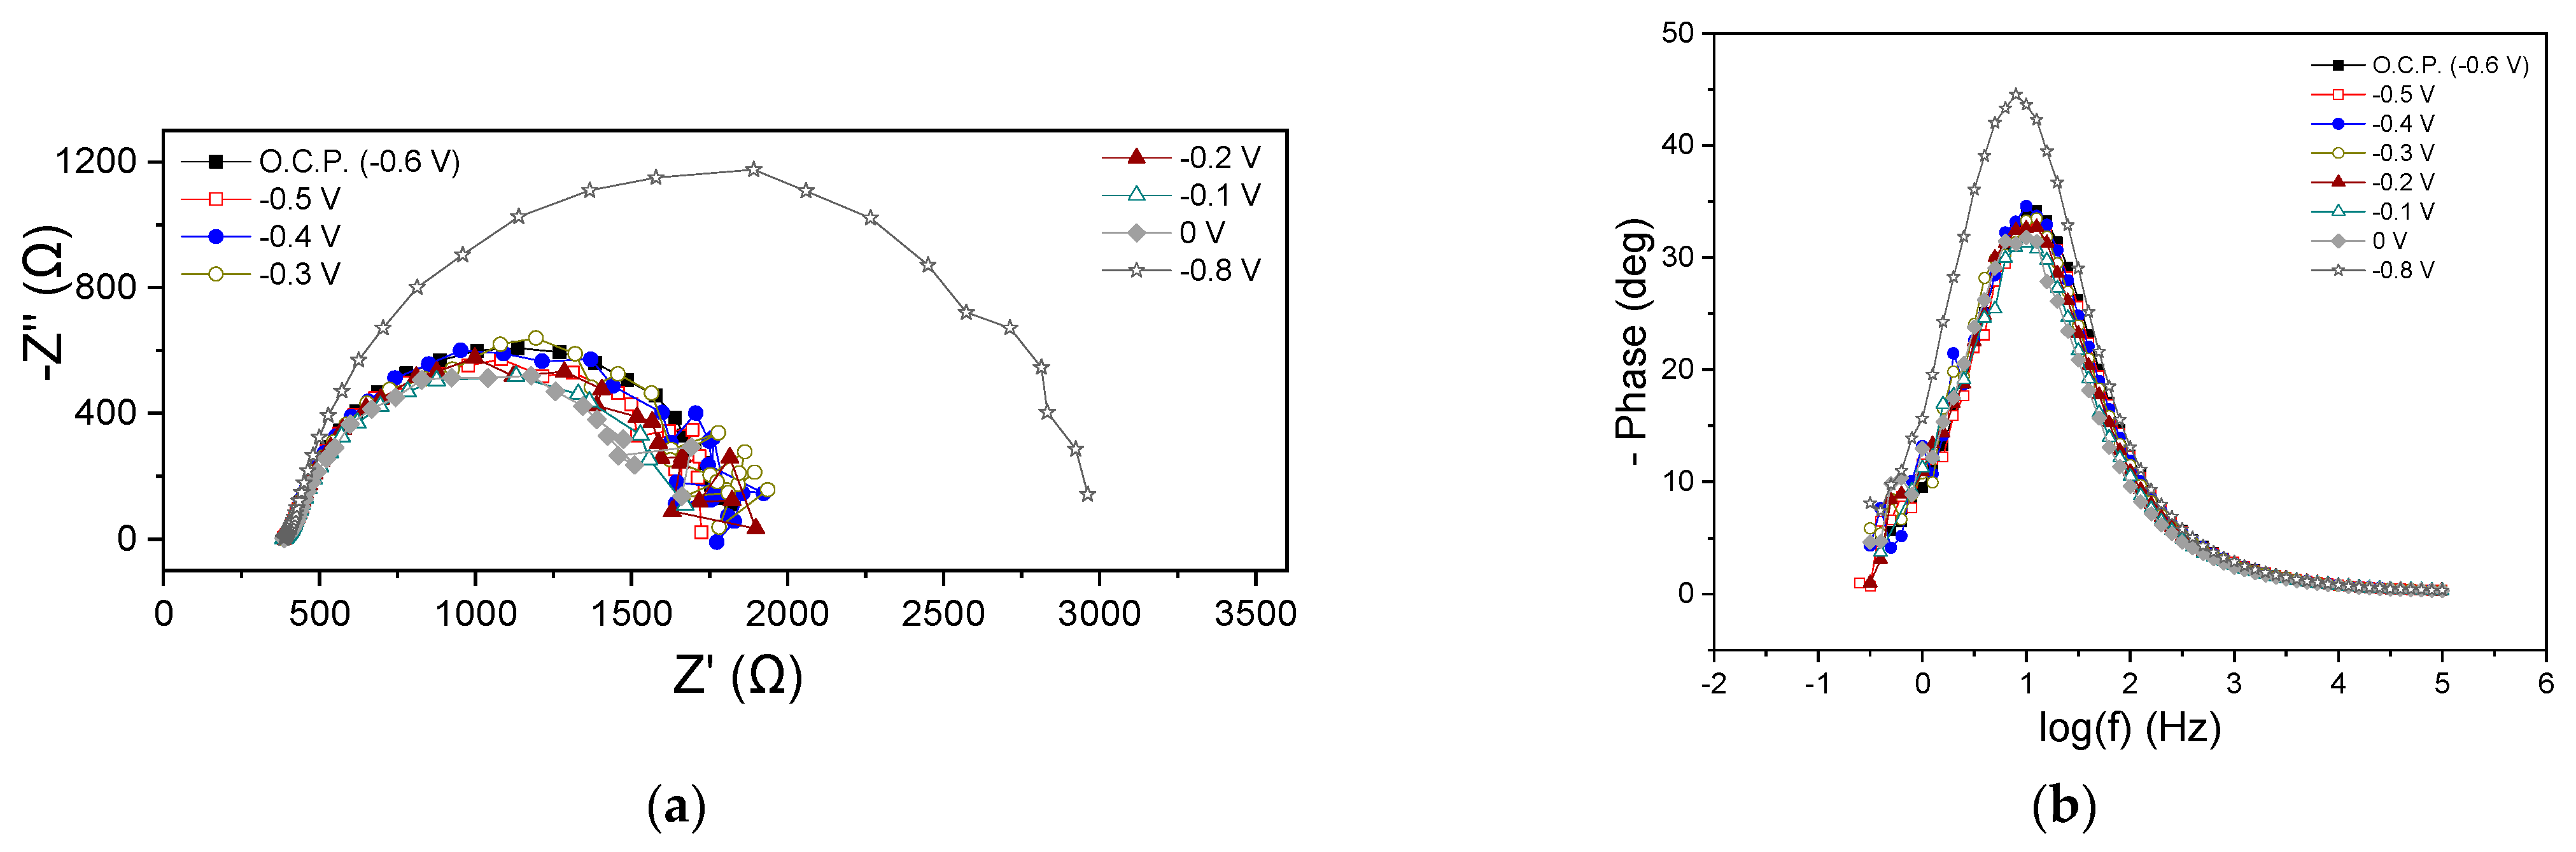
Figure 3a,b shows the EIS characteristics at the beginning of the MFC1 cycle in the form of Nyquist and Bode plots, respectively. The ohmic resistance (Rohm) was 386 Ω in all cases, while variations were observed in the polarization resistance (Rp), as can be seen from the Nyquist plot data at the beginning of the cycle (Figure 3a). Under OCP and at an applied potential of −0.5, −0.4, −0.3, −0.2, −0.1 and 0 V, the Rp ranged between 1334 and 1664 Ω. At −0.8 V, the Rp was significantly higher and amounted to 2614 Ω. Thus, it was found that the charge transfer resistance did not change appreciably when the Ucell obtained more positive values than the OCP (−0.6 V), while a significant increase in its value was observed at a more negative potential (−0.8 V). The appearance of a single semicircle in the Nyquist plots is reflected in the qualitative features of the Bode plots, where a dominant peak occurred at all potentials (Figure 3b). This implied either the occurrence of a main process probably related to the charge transfer or an entangled form of different individual occurring processes, overlapping each other due to short relaxation times. At −0.8 V, the Bode peak appeared with enhanced intensity, indicating a deceleration of the electrochemical processes rate, while in all cases, the maximum of the peak appeared at the same frequency value.
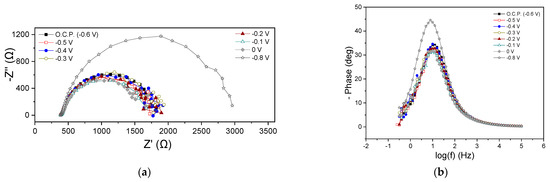
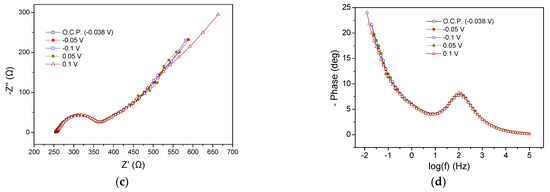
Figure 3.
Nyquist (a,c) and Bode plots (b,d) for MFC1, using hydrogenogenic reactor effluents as energy source, at the beginning (a,b) and end (c,d) of the first operating cycle.
Figure 3c,d presents the results from EIS measurements obtained at the end of the first MFC1 operating cycle. Rohm was estimated around 225 Ω under all applied potentials and OCP, while the same was observed for the Rp (140 Ω). As can be clearly observed from all Nyquist plots, a Warburg-type resistance appeared (Figure 3c). As at the beginning of the cycle (Figure 3a,b), the appearance of a dominant process regarding the Nyquist plots was accompanied by a single main peak in the Bode plots (Figure 3d). The main process (which, as discussed above, could be several occurring processes expressed as a single process) could be attributed to charge transfer phenomena.
The comparison of the EIS characteristics at the beginning and end of the MFC1 operating cycle under OCP conditions showed a slight decrease in the Rohm (from 386 Ω to 220 Ω) and a more important fluctuation in the Rp value from 1420 Ω to 140 Ω. A reduction in the intensity of the peaks of the Bode plots (Figure 3b,d) was observed when comparing the beginning and the end of the cycle, which was accompanied by a shift in the maximum of the peak towards higher frequencies, indicating a decrease in the characteristic relaxation time of the examined electrochemical system and an acceleration of the occurring processes. The same qualitative results were obtained regarding the EIS characteristics of the MFC1 when applying −0.1 V, which is a common potential value for both conditions.
3.3.2. Electrochemical Impedance Spectroscopy Measurements of MFC2
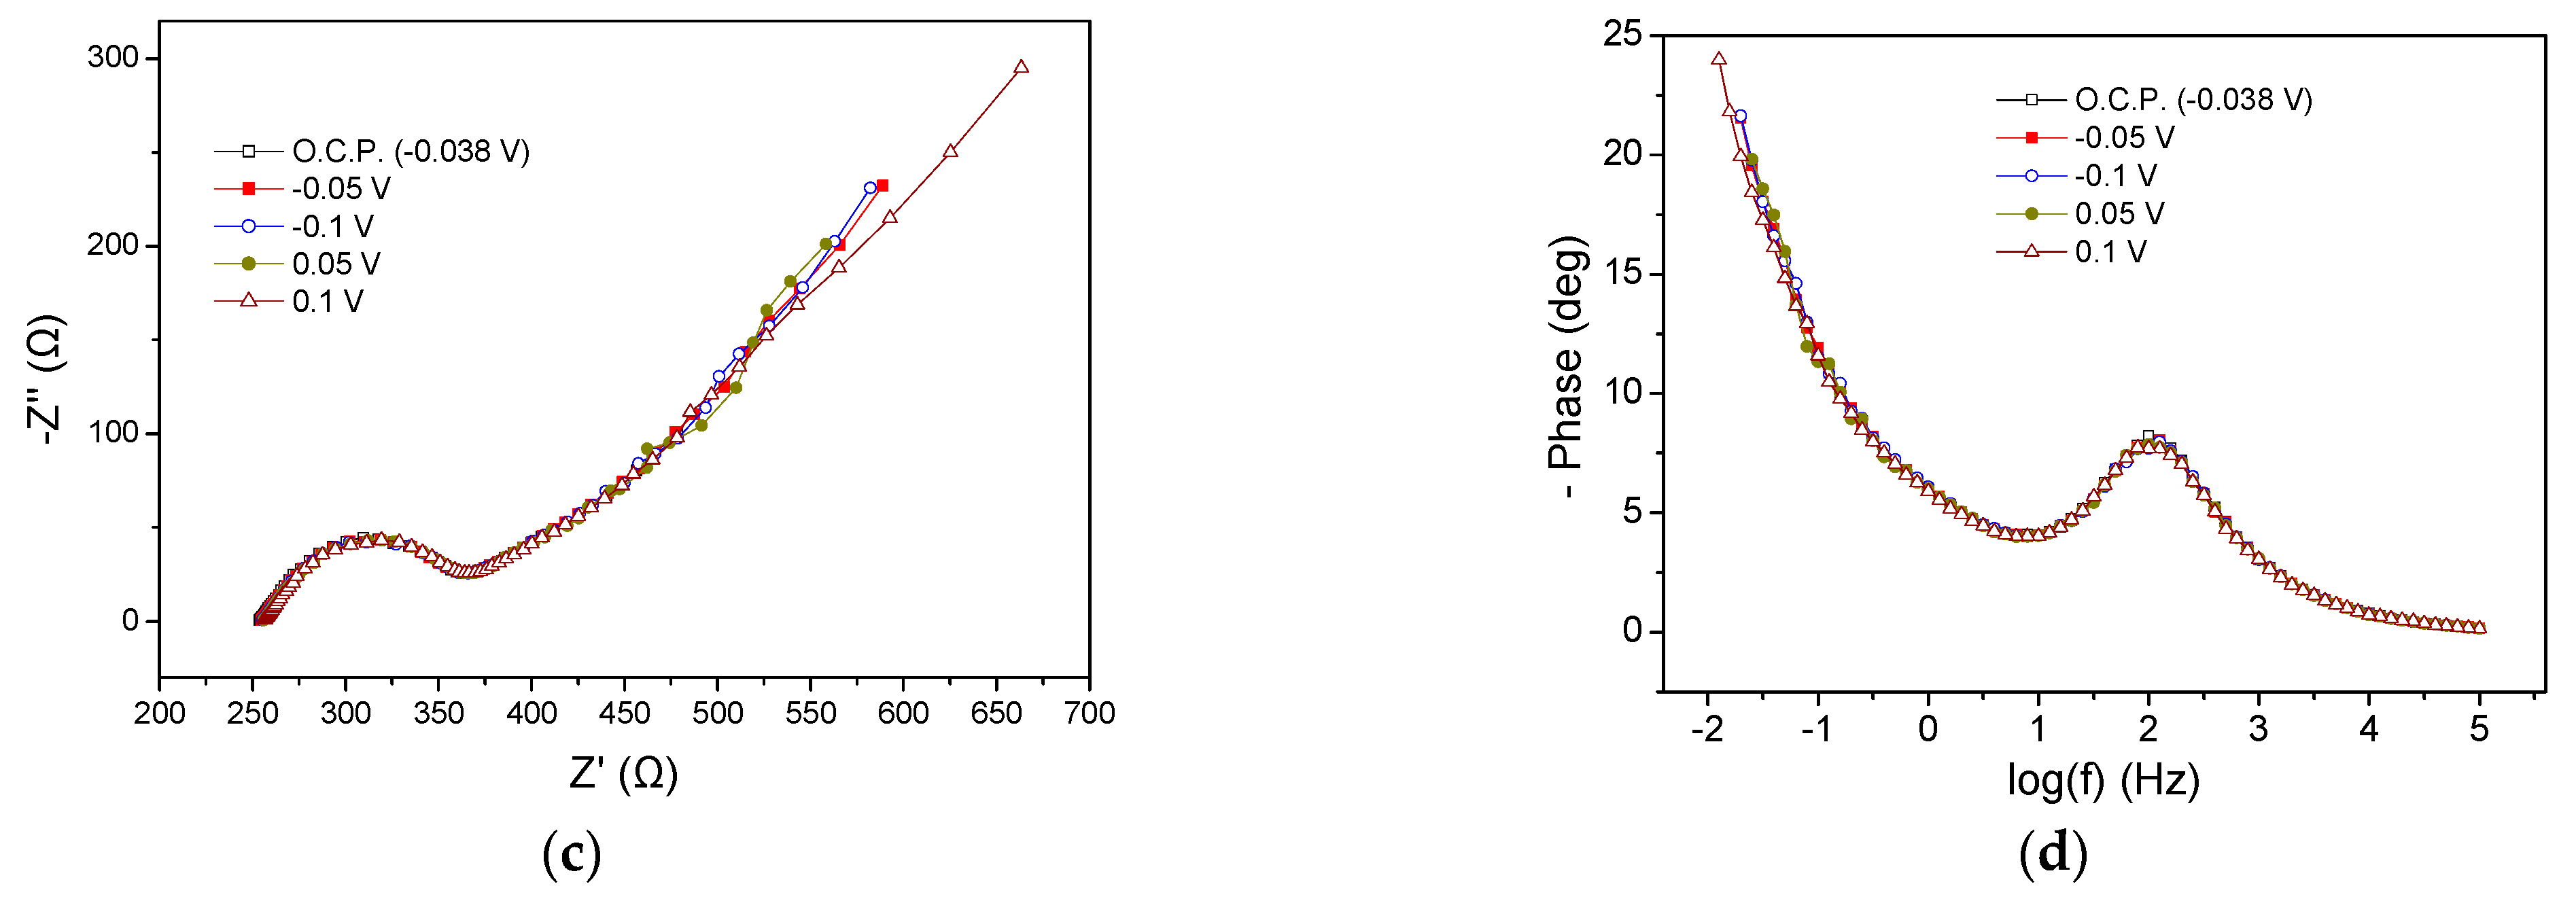
MFC2 electrochemical characteristics at the beginning and end of the first cycle are presented in Figure 4. The Rohm remained stable under OCP and different applied potentials, while the Rp was significantly affected when applying potentials compared to the OCP (Figure 4a). The Rp value was very high (13,000 Ω) under OCP conditions and ranged between 3000 and 4000 Ω when applying potentials from −0.1 to −0.4 V, indicating an important acceleration of the occurring anodic processes. In the Nyquist plots, a single semicircle was reflected from the single peak in the Bode plots (Figure 4b), implying the occurrence of a dominant process, as in the case of MFC1. The dominant process (or various occurring processes expressed as a single due to short relaxation times) could correspond to charge transfer phenomena. The application of Ucell had a positive effect on MFC2 EIS characteristics, resulting in a decrease in the Rp values and reducing the intensity of the Bode plots. This was accompanied by a slight shift in the peaks towards higher frequencies compared to the peak of the Bode plot corresponding to OCP conditions. The relatively broad shape of both Nyquist and Bode curves may enclose peaks of lower intensity related to processes running in parallel, associated with charge transfer electrochemical reactions, originating from the change in the CW wastewater oxidation rate.
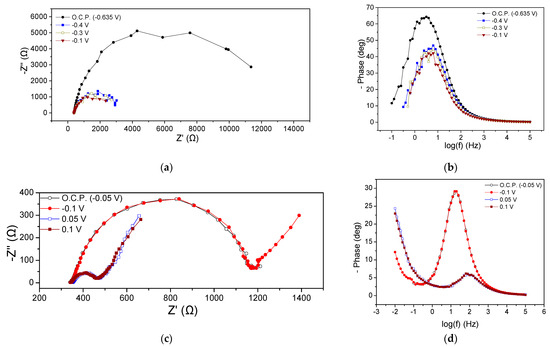
Figure 4.
Nyquist (a,c) and Bode plots (b,d) for MFC2, using CW as energy source, at the beginning (a,b) and the end (c,d) of the first cycle.
The EIS characteristics of the MFC2 at the end of the operating cycle are presented in Figure 4c,d. The Rohm was 340 Ω, slightly reduced compared to the Rohm measured at the beginning of the cycle (375 Ω). The Rp under OCP (−0.05 V) conditions was found to be 840 Ω, whereas the application of more positive potential values resulted in a reduction in its value to 130 Ω (Figure 4c), implying more rapid kinetics concerning anodic oxidation processes. In all cases, in the Nyquist plot after the semicircle, a Warburg-type element appeared. The enhanced MFC performance of positive potentials in terms of EIS characteristics was also reflected in Bode plots, as shown in Figure 4d, with the intensity of the peaks under OCP and −0.1 V appearing enhanced compared to the peaks of the Bode plots at 0.05 and 0.1 V. Moreover, the maximum of the peaks was shifted toward lower frequencies in the case of the former potentials, implying slower anodic oxidation processes.
Comparing the MFC behavior under similar conditions, i.e., under OCP and −0.1 V, the Rp reduced during the operating cycle, implying faster kinetics of the electrochemical processes, which shows a beneficial effect of the operational time (better acclimatization) on the EIS characteristics. The observed variations in the impedance characteristics were also evidenced in Bode plots (Figure 4b,d). The intensity of the peaks is, clearly, greater and the maximum shifted towards lower frequencies in the curves obtained at the beginning of the cycle compared to the respective obtained at the end, indicating a reduced efficiency in the first case.
3.3.3. Electrochemical Impedance Spectroscopy Measurements of MFC3
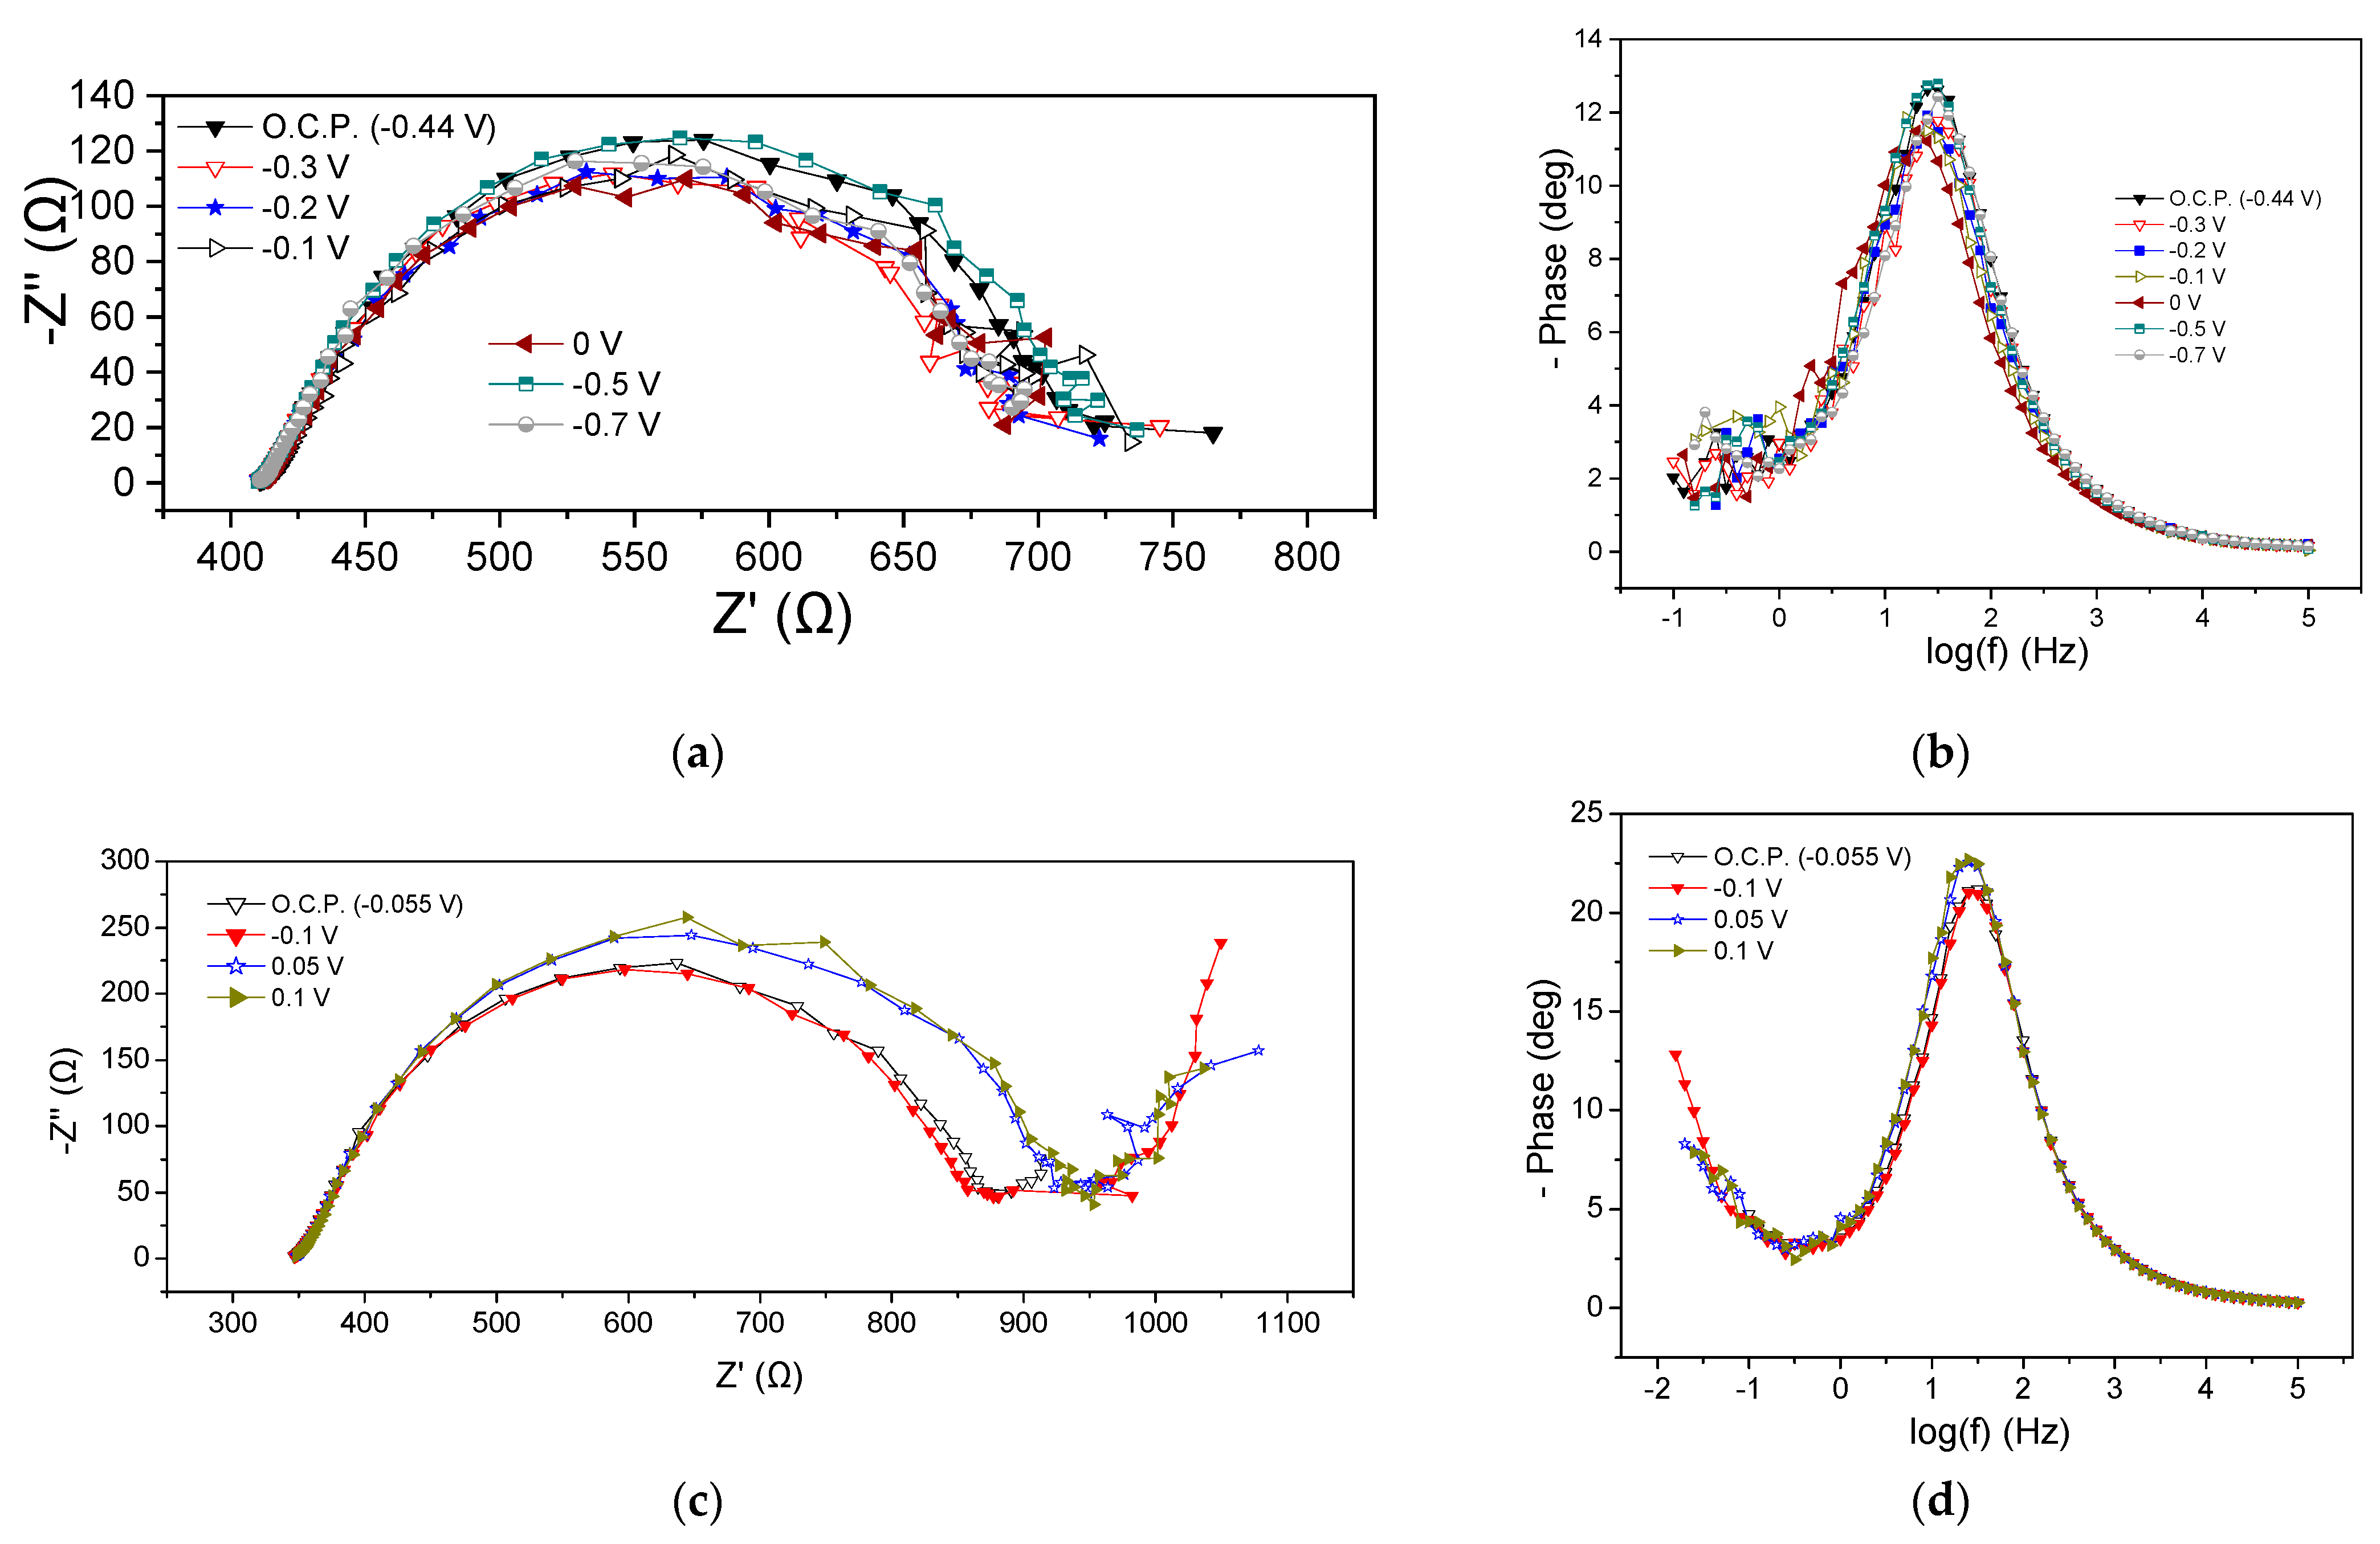
EIS characteristics of the MFC3 at the beginning and the end of the cycle are presented in Figure 5. Regarding the beginning of the cycle, Rohm was the same at all potential values (415 Ω) whereas the Rp ranged between 285 and 335 Ω, as can be obtained from the Nyquist plots (Figure 5a). It is noted that by applying more positive potentials than the OCP (−0.44 V), i.e., −0.3, −0.2, −0.1, and 0 V, a small reduction in the Rp value accompanied by a slight decrease in the semicircle curve was observed, while the application of −0.7 V increased the aforementioned values. These deviations were also obvious in the corresponding Bode plots (Figure 5b). As in the case of the previous MFCs, the appearance of a flattened semicircle in the Nyquist plots and a main peak in the Bode plots imply the realization of a dominant process that could be mainly related to the charge transfer resistance, or the realization of various sub-processes that might take place simultaneously on the anode chamber. In any case, the appearance of a flattened semicircle means that the processes that occurred were intertwined, while a dominant process is the one that controlled the reaction rate and subsequently the MFC3 performance. Nevertheless, the charge transfer resistance, also influenced by mass transport phenomena, significantly affected the rate of oxidation reactions at the anode.
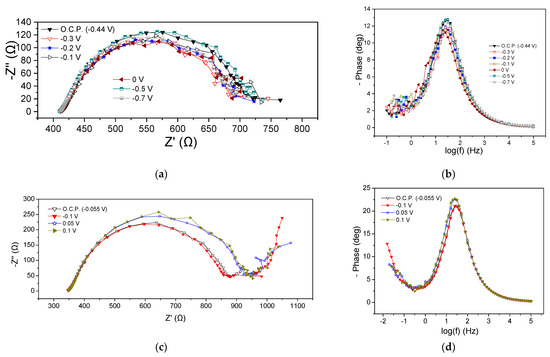
Figure 5.
Nyquist (a,c) and Bode plots (b,d) for MFC3, using a mixture of expired juices as energy source, at the beginning (a,b) and end (c,d) of the first operating cycle.
The EIS characteristics at the end of the cycle are displayed in Figure 5c,d. Rohm was 350 Ω, slightly smaller than that obtained at the beginning of the cycle (415 Ω). The Rp under OCP conditions and when applying −0.1 V was 520 Ω, whereas the application of 0.05 V and 0.2 V led to a value of 580 Ω (Figure 5c). This behavior was like the behavior observed in the case of MFC2. Bode peaks for more positive applied potentials than OCP were characterized by lower intensity and a shift towards higher frequencies, implying better MFC performance (Figure 5d).
Comparing the impedance characteristics at the beginning and the end of the cycle under OCP, it can be observed that the OCP decreased from −0.44 V to −0.055 V and the Rohm was reduced.
3.3.4. Electrochemical Impedance Spectroscopy Measurements of MFC4
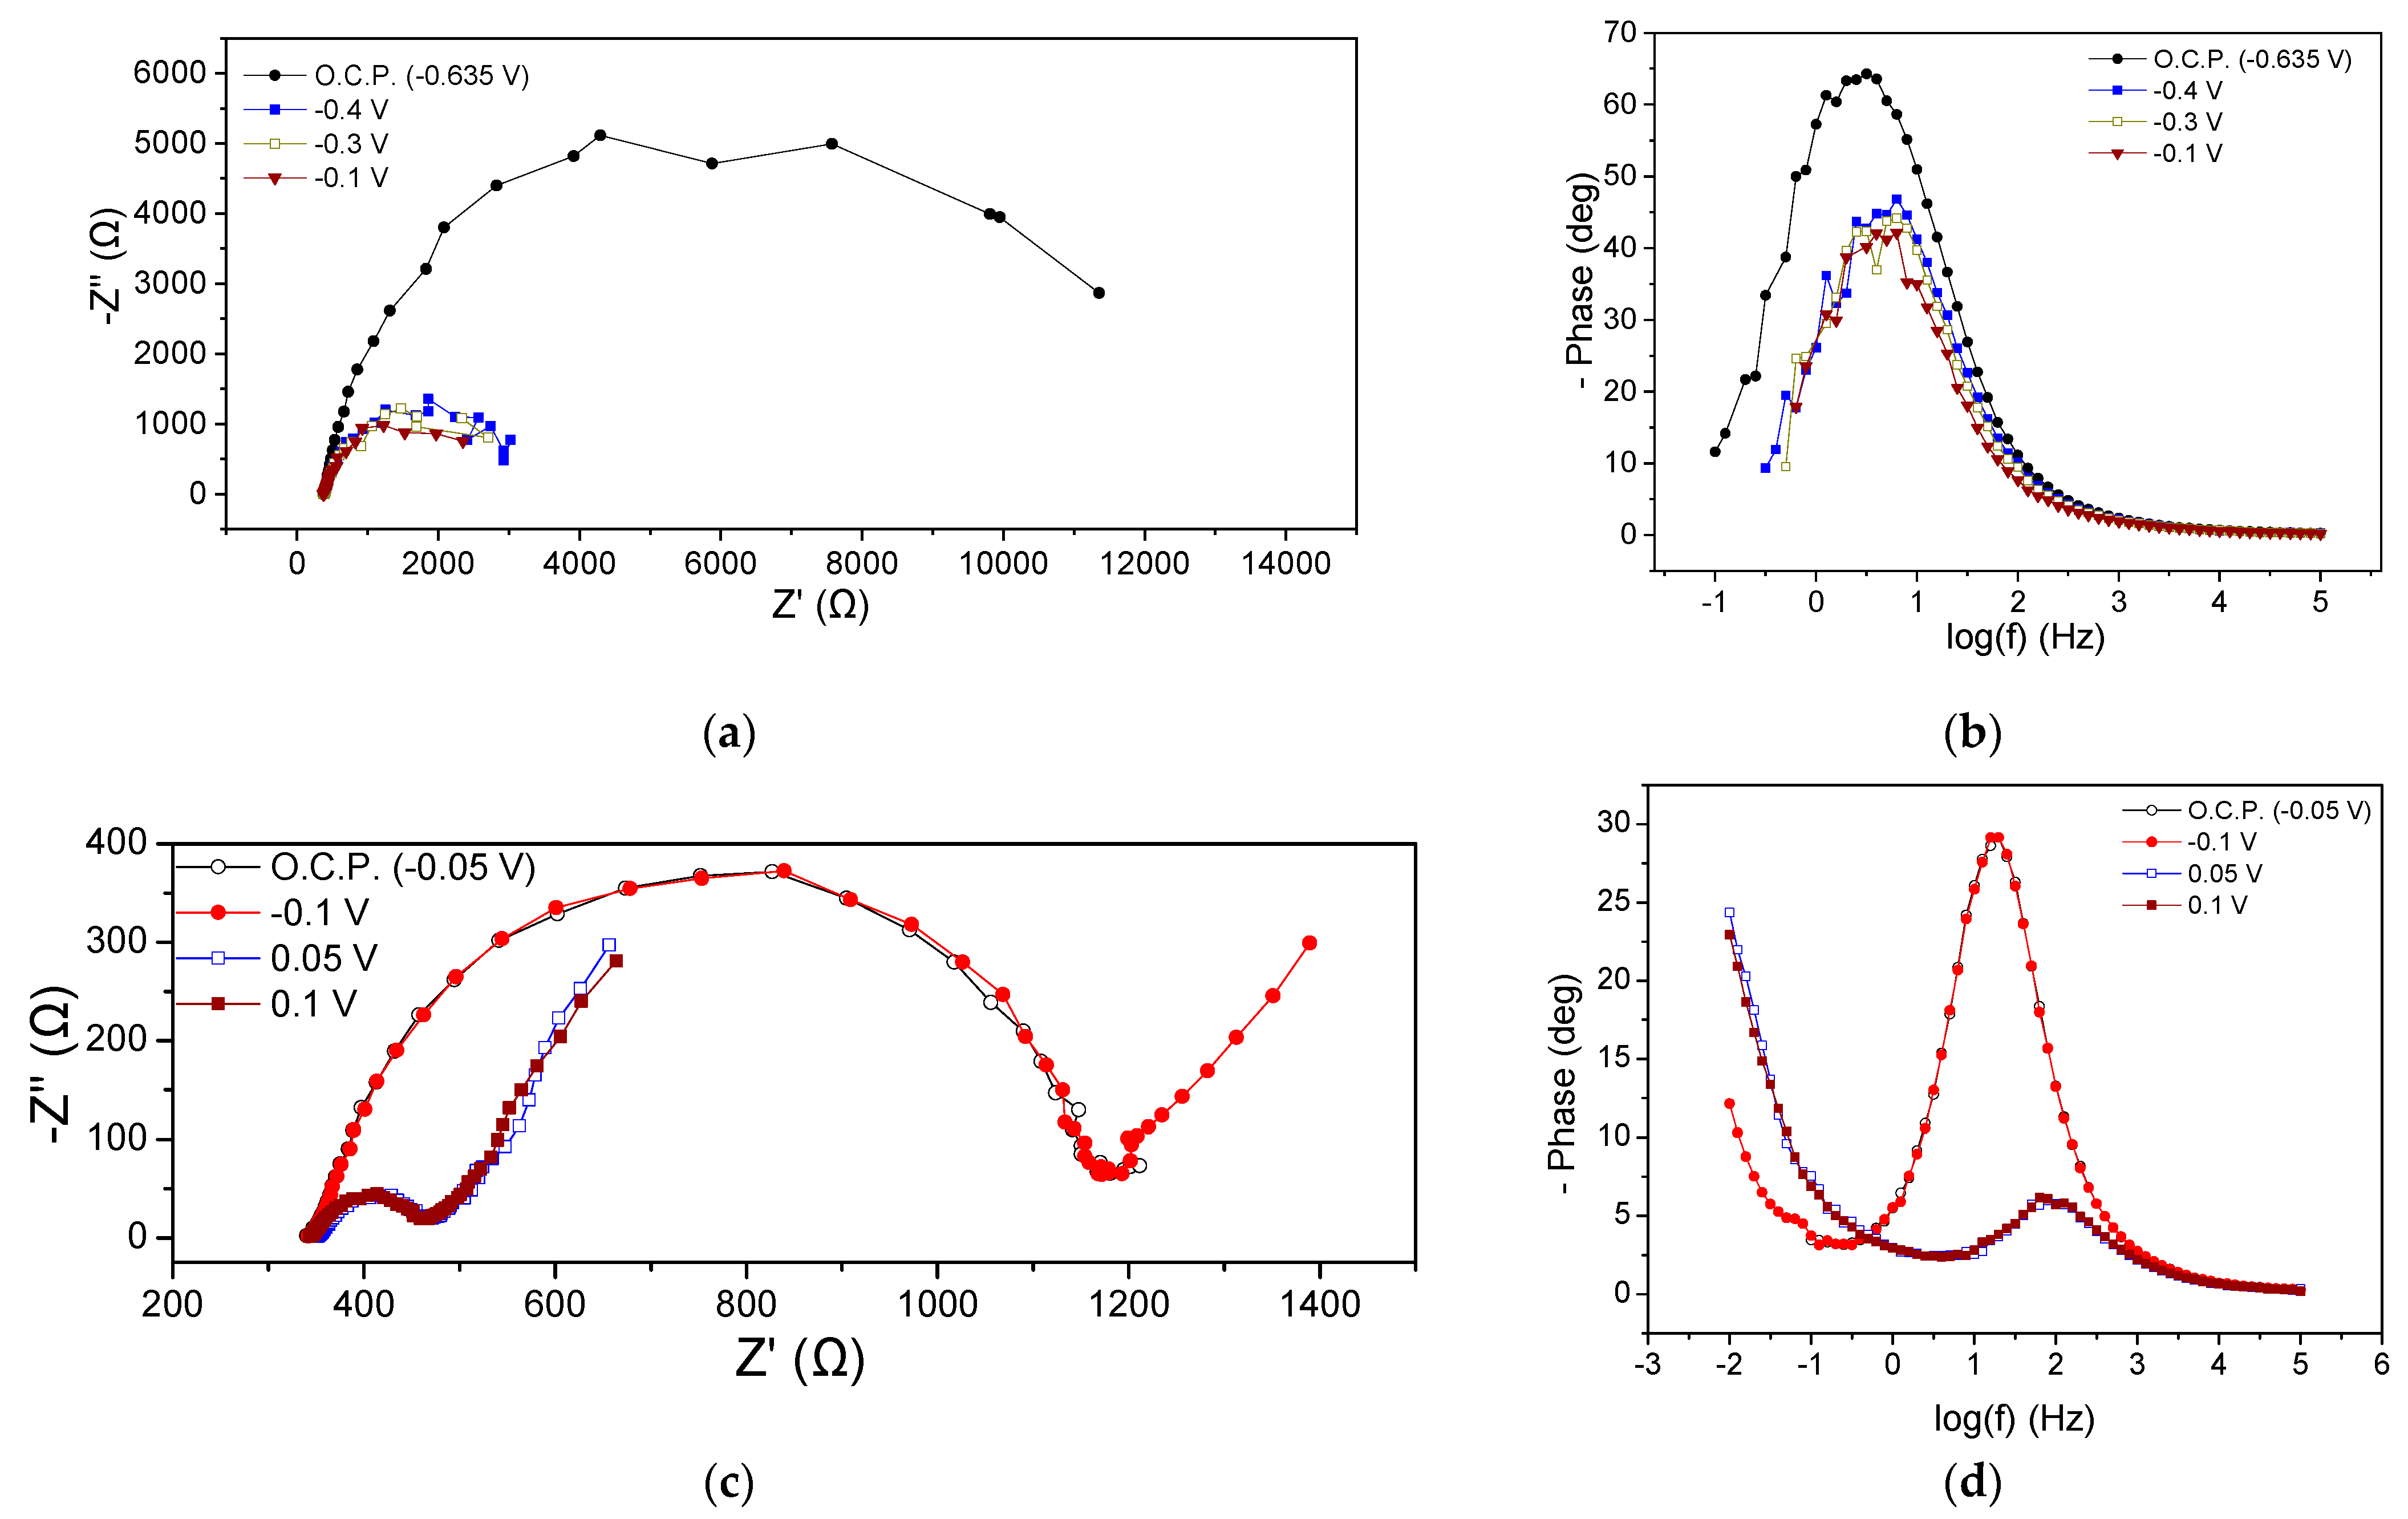
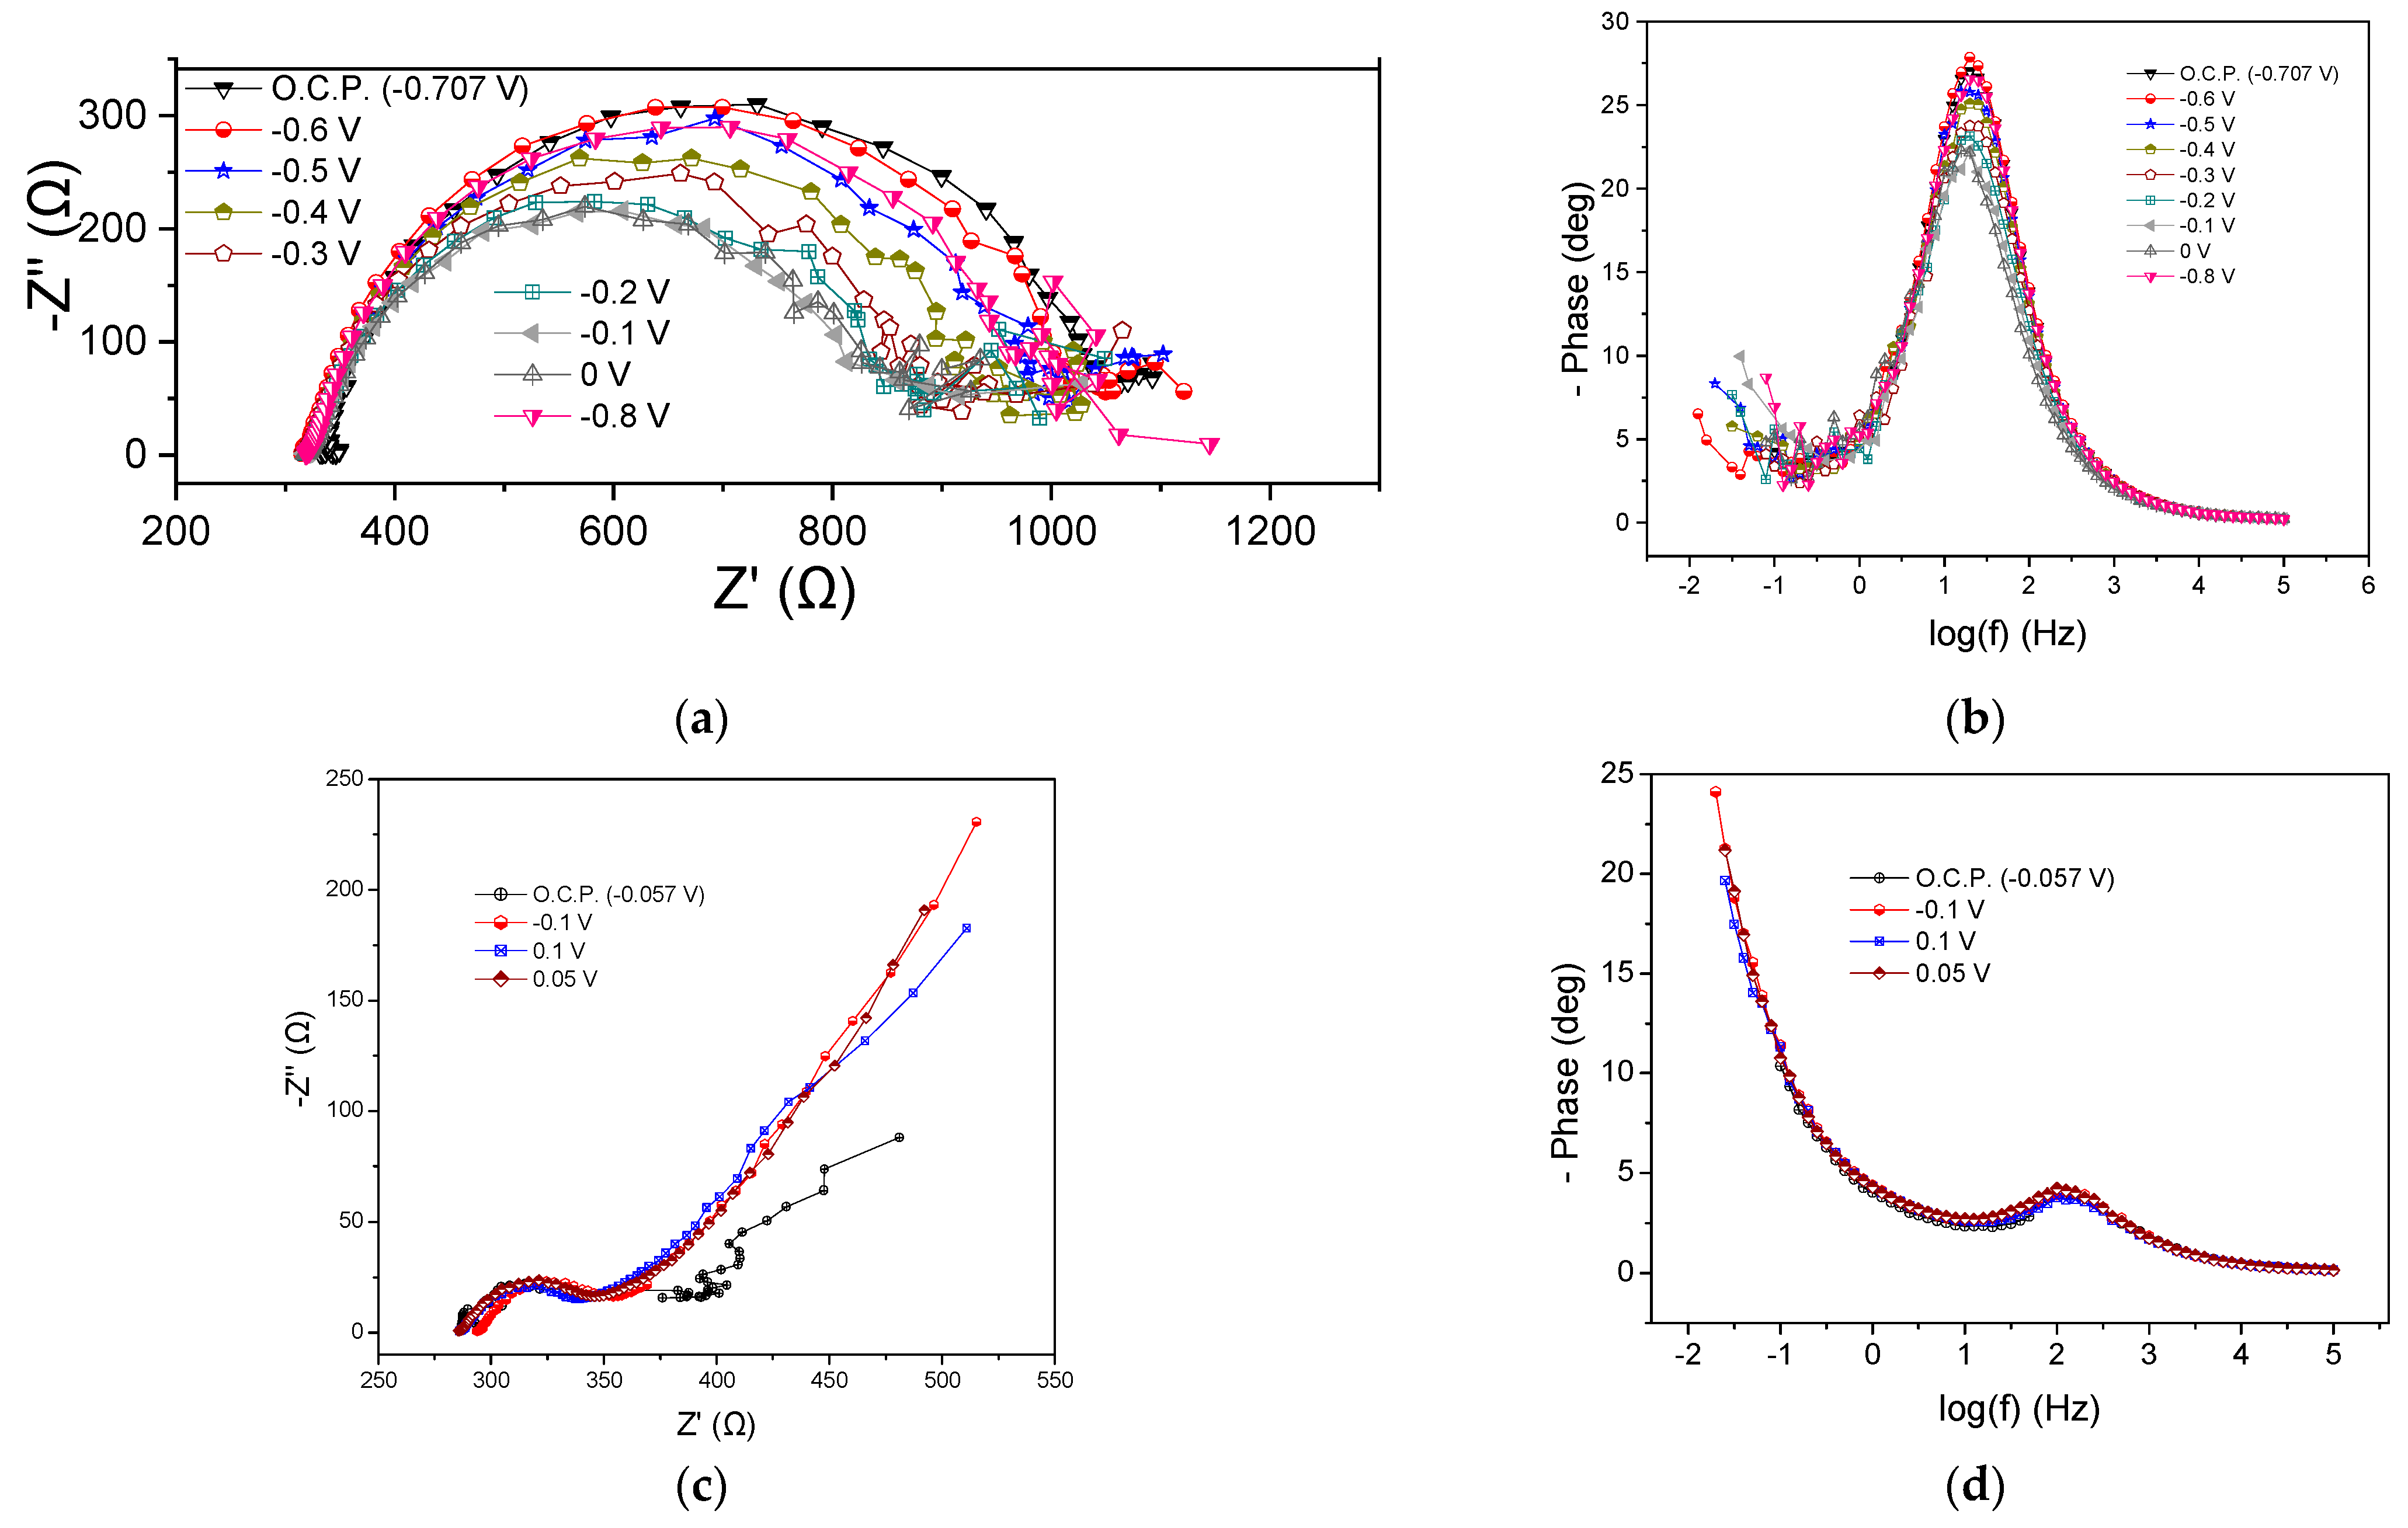
The implementation of confectionery industry wastewater as an energy source resulted in a Rohm value ranging from 325 to 350 Ω, as well as in significant variations in the Rp when varying the potential cell, as shown in Figure 6a, where the Nyquist plots at the beginning of the cycle are presented. The Rp received values from 530 to 720 Ω. It was observed that by applying more positive potentials than the OCP (−0.7 V), the Rp was gradually decreased, and this was also observed in the case of more negative potentials (i.e., −0.8 V). A corresponding decrease in peak intensity was noted by changing the potential value to more positive values than the OCP in the Bode plots (Figure 6b). Regarding the processes of the MFC4 anode, the conclusions drawn were similar to those of the previous MFCs with the dominant occurring process.
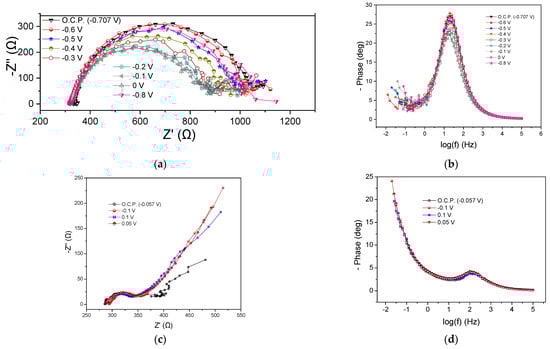
Figure 6.
Nyquist (a,c) and Bode plots (b,d) for MFC4, using confectionery industry wastewater as energy source, at the beginning (a,b) and the end (c,d) of the first operating cycle.
At the end of the cycle, Rohm was found to be 285 Ω under OCP conditions, 0.1 V and 0.05 V, respectively, while it appeared slightly increased (294 Ω) when applying −0.1 V (Figure 6c). The calculated value of Rp was 35, 53, 60, and 62 Ω for OCP, 0.1, 0.5, and −0.1 V, respectively. Warburg-type element behavior was observed as in the previous cases, while there were no significant differences in the Bode plots (Figure 6d).
The OCP value changed significantly from −0.7 to −0.05 V at the beginning and at the end of the cycle, respectively, while the Rohm and Rp were reduced under OCP conditions over time. A similar trend was observed at −0.1 V. Correspondingly, the peaks of the Bode curves showed higher intensity and appeared to shift towards lower frequencies both under OCP conditions and −0.1 V, confirming the improvement in the impedance characteristics during the MFC operation.
4. Discussion
The main electrochemical characteristics of all MFCs are depicted in Table 2. Based on the results, it can be seen that the highest OCP value, as well as the highest power density at the beginning of the operation cycle, was exhibited by MFC4, in which confectionery industry wastewater was used as substrate. The lowest OCP and Pmax values were exhibited by MFC2 fed with CW.
Table 2.
The main electrochemical characteristics of MFCs.
In addition, the εcb, which shows the ratio of electrons that were converted to electricity, was also higher in MFC4. However, the εcb values obtained in the present study were low in all cases, which could be attributed to the loss of electrons due to the diffusion of oxygen through the membrane [8]. Specifically, in such types of MFCs, oxygen is diffused from the cathode to the anode chamber, causing substrate oxidation by facultative or other aerobic bacteria present in anaerobic sludge. These reactions are competitive to the electrogenic reactions since a part of the organic substrate is probably oxidized by non-electrogenic bacteria, forming carbon dioxide and reducing the efficiency of the MFC. The high COD removal efficiency with the low εcb values corroborates these arguments. Another aspect that should be taken into account for low εcb values is the use of GGs as 3D electrodes. It is reported that due to their structure and shape, they form significant dead volumes in the reactor volume, decreasing the available surface of the electrodes for the contact between microorganisms and substrate [17]. For this reason, recirculation of the reactor liquid might probably enhance its performance, achieving higher εcb values and higher power densities.
Regarding the Pmax, MFC4 exhibited the highest value, and this performance can be correlated to the low internal resistance (Rohm and Rp values), which was extracted from the Nyquist plots at OCP and shown in Table 2. On the other hand, comparing the performance of the MFCs under −0.1 V, variations in the values of Rohm and Rp under OCP can be observed, underlining the complexity of the anodic oxidation processes as well as the different effects on the MFC operation (open- or closed-circuit conditions) of the various substrates.
As concerns the impedance characteristics of the four MFCs at the end of the first operating cycle under −0.1 V, the decreasing order of the Rohm was as follows: MFC2 > MFC3 > MFC4 > MFC1. That of Rp was as follows: MFC2 > MFC3 > MFC1 > MFC4. The intensity of the Bode peaks follows the same decreasing order as that of the Rp, which was also accompanied by a shift to higher frequencies, indicating improved performance. Based on the EIS characteristics at the end of the first operating cycle, it can be concluded that MFC4 exhibited better performance compared to the other MFCs since the Rp was lower and the capacitive characteristics appeared reduced, as derived from the qualitative analysis of the Bode plots (Figure 6c). Similarly, MFC1 or MFC3 exhibited enhanced performance compared to MFC2 (Table 2). The latter could be attributed to the improved qualitative characteristics of the EIS compared to the respective characteristics of MFC2, in which CW was used as an energy source. It is important to note that MFC1 was fed with a rich-in-VFAs mixture of hydrogenogenic reactor effluents, which was achieved after CW hydrolysis and fermentation, whereas MFC3 and MFC4 were fed with sugary-based substrates. On the other hand, MFC2 was fed with CW, which is rich in lactose (disaccharide) substrate, and also contains other substances (sugars account for almost 72% of its organic content, while the remaining 28% is made up of other soluble compounds).
On the other hand, the high COD removal efficiency of all the substrates assessed indicates that CW consisted of biodegradable compounds, which were consumed by the microbial consortium established in the MFC, and that the hydrolysis of lactose, which is the main component, was not the limiting rate step. Similar COD removal efficiencies have also been reported in previous studies using filtered CW as an electron donor in a typical dual-chamber MFC [25,42]. However, the presence of other compounds (28% of the COD), i.e., proteins, in the CW, might play a key role in the lower performance of MFC2 compared with the sugary-based substrates. These compounds, even that biodegradable, as confirmed by the high COD removal efficiency of the MFC2, were possibly hydrolyzed to compounds degraded by the facultative or other aerobic bacteria rather than exo-electrogens, which produce electricity. The lowest εcb values in the case of MFC2 corroborate this argument. In addition, part of the organic substrate could be converted to biomass, especially in the solid biofilm phase, which also did not account for the effluent’s COD concentration. It is worth mentioning that the formation of biofilm on the GGs was evident, even visually.
Comparing the Pmax of MFC2 (0.39 mW L−1) with the study of Antonopoulou et al. [17], where filter-sterilized CW diluted to an initial concentration of 0.8 g COD L−1 was used, it can be mentioned that different performances have been obtained. However, the efficiencies could not be directly compared since there are different geometries and different operational conditions. Specifically, in that study, a single-chamber air cathode MFC was used, with improved characteristics, which operated under continuous conditions [17]. On the other hand, in the study of Antonopoulou et al. [8] and Tremouli et al. [42] in which CW was used in a similar dual-chamber MFC, the Pmax was calculated as 18.4 mW m−2 and 46 mW m−2, respectively, and the power value was normalized to the two-dimensional (2D) working electrode surface. On the contrary, the normalization of the obtained power, in the current study was based on the working volume of the anode, taking into account that the applied electrode (GG) was three-dimensional. However, comparing the EIS characteristics of the MFCs of the previous studies with those of the present study, it can be seen that, in those studies, the Rohm and Rp estimated under OCP were much higher (20 kΩ cm−2 and 35 kΩ cm−2, respectively with a surface area of 13.8 cm2) [42], indicating lower performance due to the use of 2D electrodes instead of 3D ones.
Regarding the comparison of MFC performance with other sugary-based substrates, Priya and Setty investigated cashew apple juice as substrate in a dual-chamber MFC using a 2D carbon cloth anodic electrode and found a Pmax of 31.58 mW m−2 [43]. As in the case of CW, a direct comparison with the results of MFC3 and MFC4 is difficult due to the different geometry of the anode electrodes. Moreover, Cercado-Quezada et al. [44] used fermented apple juice in a dual-chamber MFC equipped with a 2D graphite felt anodic electrode and found a Pmax of 44 mW m−2, while in the study of Zonfa et al. [36], a Pmax of 1.2 W m−3 was obtained when a single-chamber four-air-cathode MFC, was used to produce electricity from the effluent of an hydrogenogenic electro-fermentative reactor using CW. However, both systems are different regarding geometry and thus a direct comparison is difficult to perform.
5. Conclusions
Chemical oxygen demand (COD) removal efficiency was high for all applied substrates, indicating the high biodegradability of all wastewaters used. The Coulombic efficiency, εcb, denoting the fraction of electrons which transformed to current, was found to be 9.7% for the hydrogenogenic reactor effluents (MFC1), 7.3% for cheese whey (CW) (MFC2), 9.8% for the mixture of expired juices (MFC3), and 14.1% for the confectionery industry wastewater (MFC4). The high rates of organic-loading removal efficiencies, along with the relatively low values of εcb, in all cases could be attributed to the utilization of the substrates in alternative metabolic pathways, owing to the possible diffusion of oxygen through the membrane. Comparing all substrates, the highest power output was exhibited by MFC4 (0.97 mW L−1), followed by the MFC1 (0.65 mW L−1), MFC3 (0.41 mW L−1) and MFC2 (0.39 mW L−1). These results were reflected on the EIS characteristics of the MFCs since MFC4, MFC2 and MFC1 demonstrated improved qualitative EIS characteristics compared to MFC2. The ohmic losses and charge transfer losses were correlated with undesirable processes running in parallel at the anode, as well as the MFC design.
Author Contributions
Conceptualization, Z.G., G.B. and G.A.; methodology, G.A.; software, Z.G., I.A., G.B. and G.A.; validation, G.A.; investigation, Z.G., G.B. and G.A.; resources, G.B. and G.A.; writing—original draft preparation, G.B., I.A. and G.A.; writing—review and editing, G.B. and G.A.; supervision, G.A.; project administration, G.B.; funding acquisition, G.B. and G.A. All authors have read and agreed to the published version of the manuscript.
Funding
This research was funded in the frame of the project “Perovskitic electrocatalysts for integrated systems of microbial electrolysis cells and anion exchange membrane fuel cells (Acronym: PERFORMANCE, project code: 82242)”, which was supported by the 3rd Call of Hellenic Foundation of Research and Innovation (H.F.R.I.) Research Projects for the support of Post-doctoral Researchers (fellowship of Dr. G. Bampos). Dr. Georgia Antonopoulou thanks the funding programme “MEDICUS” of the University of Patras.
Data Availability Statement
Data will be made available on request.
Conflicts of Interest
The authors declare no conflicts of interest.
References
- Wang, J.; Ren, K.; Zhu, Y.; Huang, J.; Liu, S. A review of recent advances in microbial fuel cells: Preparation, operation and application. BioTech 2022, 11, 44. [Google Scholar] [CrossRef] [PubMed]
- Bose, D.; Gopinath, M.; Vijay, P.; Sridharan, S.; Rawat, R.; Bahuguna, R. Bioelectricity generation and biofilm analysis from sewage sources using microbial fuel cell. Fuel 2019, 255, 115815. [Google Scholar] [CrossRef]
- Bose, D.; Sridharan, S.; Dhawan, H.; Vijay, P.; Gopinath, M. Biomass derived activated carbon cathode performance for sustainable power generation from microbial fuel cells. Fuel 2019, 236, 325–337. [Google Scholar] [CrossRef]
- Mohyudin, S.; Farooq, R.; Jubeen, F.; Rasheed, T.; Fatima, M.; Sher, F. Microbial fuel cells a state-of-the-art technology for wastewater treatment and bioelectricity generation. Environ. Res. 2022, 204, 112387. [Google Scholar] [CrossRef] [PubMed]
- Antonopoulou, G.; Bampos, G.; Ntaikou, I.; Alexandropoulou, M.; Dailianis, S.; Bebelis, S.; Lyberatos, G. The biochemical and electrochemical characteristics of a microbial fuel cell used to produce electricity from olive mill wastewater. Energy 2023, 282, 128804. [Google Scholar] [CrossRef]
- Aghababaie, M.; Farhadian, M.; Jeihanipour, A.; Biria, D. Effective factors on the performance of microbial fuel cells in wastewater treatment—A review. Environ. Technol. Rev. 2015, 4, 71–89. [Google Scholar] [CrossRef]
- Antonopoulou, G.; Ntaikou, I.; Pastore, C.; di Bitonto, L.; Bebelis, S.; Lyberatos, G. An overall perspective for the energetic valorization of household food waste using microbial fuel cell technology of its extract, coupled with anaerobic digestion of the solid residue. Appl. Energy 2019, 238, 239–248. [Google Scholar] [CrossRef]
- Antonopoulou, G.; Stamatelatou, K.; Bebelis, S.; Lyberatos, G. Electricity generation from synthetic substrates and cheese whey using a two chamber microbial fuel cell. Biochem. Eng. J. 2010, 50, 10–15. [Google Scholar] [CrossRef]
- Logan, B.E.; Hamelers, B.; Rozendal, R.; Schroeder, U.; Keller, J.; Freguia, S.; Aelterman, P.; Verstraete, W.; Rabaey, K. Microbial fuel cells: Methodology and technology. Environ. Sci. Technol. 2006, 40, 5181–5192. [Google Scholar] [CrossRef]
- ElMekawy, A.; Hegab, H.M.; Dominguez-Benetton, X.; Pant, D. Internal resistance of microfluidic microbial fuel cell: Challenges and potential opportunities. Bioresour. Technol. 2013, 142, 672–682. [Google Scholar] [CrossRef]
- Rossi, R.; Logan, B.E. Unraveling the contributions of internal resistance components in two-chamber microbial fuel cells using the electrode potential slope analysis. Electrochim. Acta 2020, 348, 136291. [Google Scholar] [CrossRef]
- Ieropoulos, I.; Winfield, J.; Greenman, J. Effects of flow-rate, inoculum and time on the internal resistance of microbial fuel cells. Bioresour. Technol. 2010, 101, 3520–3525. [Google Scholar] [CrossRef] [PubMed]
- Ren, H.; Pyo, S.; Lee, J.I.; Park, T.J.; Gittleson, F.S.; Leung, F.C.C.; Kim, J.; Taylor, A.D.; Lee, H.-S.; Chae, J. A high power density miniaturized microbial fuel cell having carbon nanotube anodes. J. Power Sources 2015, 273, 823–830. [Google Scholar] [CrossRef]
- Ren, H.; Tian, H.; Gardner, C.L.; Ren, T.L.; Chae, J. A miniaturized microbial fuel cell with three-dimensional graphene macroporous scaffold anode demonstrating a record power density of over 10,000 W m−3. Nanoscale 2016, 8, 3539–3547. [Google Scholar] [CrossRef] [PubMed]
- Di Lorenzo, M.; Scott, K.; Curtis, T.P.; Head, I.M. Effect of increasing anode surface area on the performance of a single chamber microbial fuel cell. Chem. Eng. J. 2010, 156, 40–48. [Google Scholar] [CrossRef]
- Sharma, T.; Reddy, A.L.M.; Chandra, T.S.; Ramaprabhu, S. Development of carbon nanotubes and nanofluids based microbial fuel cell. Int. J. Hydrogen Energy 2008, 33, 6749–6754. [Google Scholar] [CrossRef]
- Antonopoulou, G.; Ntaikou, I.; Bebelis, S.; Lyberatos, G. On the evaluation of filtered and pretreated cheese whey as an electron donor in a single chamber microbial fuel cell. Biomass Convers. Biorefinery 2021, 11, 633–643. [Google Scholar] [CrossRef]
- Rabaey, K.; Ossieur, W.; Verhaege, M.; Verstraete, W. Continuous microbial fuel cells convert carbohydrates to electricity. Water Sci. Technol. 2005, 52, 515–523. [Google Scholar] [CrossRef] [PubMed]
- Pandey, P.; Shinde, V.N.; Deopurkar, R.L.; Kale, S.P.; Patil, S.A.; Pant, D. Recent advances in the use of different substrates in microbial fuel cells toward wastewater treatment and simultaneous energy recovery. Appl. Energy 2016, 168, 706–723. [Google Scholar] [CrossRef]
- Venkata Mohan, S.; Mohanakrishna, G.; Sarma, P.N. Composite vegetable waste as renewable resource for bioelectricity generation through non-catalyzed open-air cathode microbial fuel cell. Bioresour. Technol. 2010, 101, 970–976. [Google Scholar] [CrossRef]
- Sangeetha, T.; Muthukumar, M. Catholyte performance as an influencing factor on electricity production in a dual-chambered microbial fuel cell employing food processing wastewater. Energy Sources Part A Recover. Util. Environ. Eff. 2011, 33, 1514–1522. [Google Scholar] [CrossRef]
- Feng, Y.; Wang, X.; Logan, B.E.; Lee, H. Brewery wastewater treatment using air-cathode microbial fuel cells. Appl. Microbiol. Biotechnol. 2008, 78, 873–880. [Google Scholar] [CrossRef] [PubMed]
- Cusick, R.D.; Kiely, P.D.; Logan, B.E. A monetary comparison of energy recovered from microbial fuel cells and microbial electrolysis cells fed winery or domestic wastewaters. Int. J. Hydrogen Energy 2010, 35, 8855–8861. [Google Scholar] [CrossRef]
- Patil, S.A.; Surakasi, V.P.; Koul, S.; Ijmulwar, S.; Vivek, A.; Shouche, Y.S.; Kapadnis, B.P. Electricity generation using chocolate industry wastewater and its treatment in activated sludge based microbial fuel cell and analysis of developed microbial community in the anode chamber. Bioresour. Technol. 2009, 100, 5132–5139. [Google Scholar] [CrossRef] [PubMed]
- Stamatelatou, K.; Antonopoulou, G.; Tremouli, A.; Lyberatos, G. Production of gaseous biofuels and electricity from cheese whey. Ind. Eng. Chem. Res. 2011, 50, 239–644. [Google Scholar] [CrossRef]
- Behera, M.; Jana, P.S.; More, T.T.; Ghangrekar, M.M. Rice mill wastewater treatment in microbial fuel cells fabricated using proton exchange membrane and earthen pot at different pH. Bioelectrochemistry 2010, 79, 228–233. [Google Scholar] [CrossRef] [PubMed]
- Park, H.I.; Wu, C.; Lin, L.-S. Coal tar wastewater treatment and electricity production using a membrane-less tubular microbial fuel cell. Biotechnol. Bioprocess Eng. 2012, 17, 654–660. [Google Scholar] [CrossRef]
- Huang, L.; Yang, X.; Quan, X.; Chen, J.; Yang, F. A microbial fuel cell–electro-oxidation system for coking wastewater treatment and bioelectricity generation. J. Chem. Technol. Biotechnol. 2010, 85, 621–627. [Google Scholar] [CrossRef]
- Wen, Q.; Kong, F.; Zheng, H.; Cao, D.; Ren, Y.; Yin, J. Electricity generation from synthetic penicillin wastewater in an air-cathode single chamber microbial fuel cell. Chem. Eng. J. 2011, 168, 572–576. [Google Scholar] [CrossRef]
- Kalathil, S.; Lee, J.; Cho, M.H. Efficient decolorization of real dye wastewater and bioelectricity generation using a novel single chamber biocathode-microbial fuel cell. Bioresour. Technol. 2012, 119, 22–27. [Google Scholar] [CrossRef]
- Liu, H.; Ramnarayanan, R.; Logan, B.E. Production of electricity during wastewater treatment using a single chamber microbial fuel cell. Environ. Sci. Technol. 2004, 38, 2281–2285. [Google Scholar] [CrossRef] [PubMed]
- Valta, K.; Damala, P.; Angeli, E.; Antonopoulou, G.; Malamis, D.; Haralambous, K.J. Current treatment technologies of cheese whey and wastewater by Greek cheese manufacturing units and potential valorisation opportunities. Waste Biomass Valorization 2017, 8, 1649–1663. [Google Scholar] [CrossRef]
- Sourri, P.; Tassou, C.C.; Nychas, G.-J.E.; Panagou, E.Z. Fruit juice spoilage by alicyclobacillus: Detection and control methods—A comprehensive review. Foods 2022, 11, 747. [Google Scholar] [CrossRef] [PubMed]
- Miah, J.H.; Griffiths, A.; McNeill, R.; Halvorson, S.; Schenker, U.; Espinoza-Orias, N.D.; Morse, S.; Yang, A.; Sadhukhan, J. Environmental management of confectionery products: Life cycle impacts and improvement strategies. J. Clean. Prod. 2018, 177, 732–751. [Google Scholar] [CrossRef]
- Koók, L.; Nemestóthy, N.; Bélafi-Bakó, K.; Bakonyi, P. Treatment of dark fermentative H2 production effluents by microbial fuel cells: A tutorial review on promising operational strategies and practices. Int. J. Hydrogen Energy 2021, 46, 5556–5569. [Google Scholar] [CrossRef]
- Zonfa, T.; Kamperidis, T.; Falzarano, M.; Lyberatos, G.; Polettini, A.; Pomi, R.; Rossi, A.; Tremouli, A. Two-stage process for energy valorization of cheese whey through bio-electrochemical hydrogen production coupled with microbial fuel cell. Fermentation 2023, 9, 306. [Google Scholar] [CrossRef]
- Apostolopoulos, I.; Bampos, G.; Soto Beobide, A.; Dailianis, S.; Voyiatzis, G.; Bebelis, S.; Lyberatos, G.; Antonopoulou, G. The effect of anode material on the performance of a hydrogen producing microbial electrolysis cell, operating with synthetic and real wastewaters. Energies 2021, 14, 8375. [Google Scholar] [CrossRef]
- Kora, E.; Patrinou, V.; Antonopoulou, G.; Ntaikou, I.; Tekerlekopoulou, G.A.; Lyberatos, G. Dark fermentation of expired fruit juices for biohydrogen production followed by treatment and biotechnological exploitation of effluents towards bioplastics and microbial lipids. Biochem. Eng. J. 2023, 195, 108901. [Google Scholar] [CrossRef]
- Kora, E.; Antonopoulou, G.; Zhang, Y.; Yan, Q.; Lyberatos, G.; Ntaikou, I. Investigating the efficiency of a two-stage anaerobic-aerobic process for the treatment of confectionery industry wastewaters with simultaneous production of biohydrogen and polyhydroxyalkanoates. Environ. Res. 2024, 248, 118526. [Google Scholar] [CrossRef]
- APHA; AWWA; WPCF. Standard Methods for the Examination of Water and Wastewater; Franson, M.A., Ed.; American Public Health Association: Washington, DC, USA, 1995. [Google Scholar]
- Antonopoulou, G.; Vayenas, D.; Lyberatos, G. Ethanol and hydrogen production from sunflower straw: The effect of pre-treatment on the whole slurry fermentation. Biochem. Eng. J. 2016, 116, 65–74. [Google Scholar] [CrossRef]
- Tremouli, A.; Antonopoulou, G.; Bebelis, S.; Lyberatos, G. Operation and characterization of a microbial fuel cell fed withpretreated cheese whey at different organic loads. Bioresour. Technol 2013, 131, 380–389. [Google Scholar] [CrossRef] [PubMed]
- Divya Priya, A.; Pydi Setty, Y. Cashew apple juice as substrate for microbial fuel cell. Fuel 2019, 246, 75–78. [Google Scholar] [CrossRef]
- Cercado-Quezada, B.; Delia, M.-L.; Bergel, A. Testing various food-industry wastes for electricity production in microbial fuel cell. Bioresour. Technol. 2010, 101, 2748–2754. [Google Scholar] [CrossRef] [PubMed]
Disclaimer/Publisher’s Note: The statements, opinions and data contained in all publications are solely those of the individual author(s) and contributor(s) and not of MDPI and/or the editor(s). MDPI and/or the editor(s) disclaim responsibility for any injury to people or property resulting from any ideas, methods, instructions or products referred to in the content. |
© 2024 by the authors. Licensee MDPI, Basel, Switzerland. This article is an open access article distributed under the terms and conditions of the Creative Commons Attribution (CC BY) license (https://creativecommons.org/licenses/by/4.0/).