Article

Operation Strategy for an Integrated Energy System Considering the Slow Dynamic Response Characteristics of Power-to-Gas Conversion

1
College of Electrical Engineering and New Energy, China Three Gorges University, Yichang 443002, China
2
Hubei Key Laboratory of Operation and Control of Cascade Hydropower Station, Yichang 443002, China
*
Author to whom correspondence should be addressed.
Processes 2024, 12(6), 1277; https://doi.org/10.3390/pr12061277
Submission received: 17 May 2024 / Revised: 13 June 2024 / Accepted: 15 June 2024 / Published: 20 June 2024
(This article belongs to the Section Energy Systems)

Abstract

:
Power-to-gas technology provides an emerging pathway for promoting green and low-carbon transformation of energy systems. Through the processes of electrolyzing water and the methanation reaction, it converts surplus renewable energy into hydrogen and natural gas, offering an effective approach for large-scale integration of renewable energy sources. However, the optimization of existing integrated energy systems has yet to finely model the operational characteristics of power-to-gas technology, severely limiting the energy conversion efficiency of systems. To address this issue, this paper proposes an integrated energy system operation strategy considering the slow dynamic response characteristics of power-to-gas. Firstly, based on the technical features of power-to-gas, an operational model for electrolyzing water to produce hydrogen is constructed, considering the transition relationships among cold start-up, hot start-up, and production states of a methanation reaction, thereby building a power-to-gas operation model considering slow dynamic response characteristics. This model finely reflects the impact of power-to-gas operational states on methanation, facilitating accurate representation of the operational states of methanation. Then, considering the energy conversion constraints and power balance of various coupled devices within integrated energy systems, an optimization model for the operation of the integrated energy system is constructed with the total daily operation cost of the system as the optimization objective. Finally, simulation comparisons are conducted to demonstrate the necessity of considering the slow dynamic response characteristics of power-to-gas technology for integrated energy system operation. The case study results indicate that the proposed power-to-gas operation model can accurately simulate the methanation process, facilitating the rational conversion of surplus renewable energy into natural gas energy and avoiding misjudgments in system operation costs and energy utilization efficiency.

1. Introduction

Under the global challenges of sustainable socio-economic development and frequent extreme weather, reducing carbon emissions in energy systems has become an urgent issue, attracting widespread attention from countries around the world [1,2]. Although renewable energy sources such as wind, solar, and bioenergy have made significant progress in recent years, their intermittency remains a major challenge [3]. For example, the actual output of wind and solar power is difficult to accurately predict, and its randomness and volatility lead to the inevitable abandonment of wind and solar power. Compared to reducing redundant new energy, it is better to use new energy and convert carbon emissions from traditional power plants into methane, thereby improving energy efficiency and enhancing the low-carbon nature of system operation [4].
Electricity-to-gas conversion is becoming one of the most promising storage and conversion solutions for renewable energy, representing an effective way to achieve a high proportion of renewable energy consumption in some way. Electric-to-gas technology includes two processes: hydrogen production through electrolysis of water and methane reaction. The hydrogen produced by the electrolysis cell is provided by the remaining new energy and transmitted to the methanation equipment [5]. Methanation devices synthesize methane by processing hydrogen, carbon dioxide, and oxygen [6], and the resulting methane can be introduced into existing infrastructure’s natural gas pipelines [7]. Electric-to-gas technology plays an important role in reducing greenhouse gas emissions [8,9], promoting sustainable economic and social development [10,11], and reducing system cost investment [12,13].
A large number of studies have emphasized the importance of developing and implementing electricity-to-gas technology, which can effectively convert carbon dioxide into methane, thereby reducing greenhouse gas emissions and carbon footprint, and providing a core path for the transition of energy systems to renewable energy [14,15]. In addition, more and more countries and companies are conducting roadmap and pilot projects to demonstrate the feasibility of electric-to-gas conversion technology [16,17]. Reference [18] studied the dynamic simulation and thermal economic analysis of power gas systems and found that methane production increased by 42% compared to existing factories. Reference [19] studied an energy system model that considers the dynamic operation of electric-to-gas coupling in the gas-based sector of a de-energy center and introduced a new concept of methanation called three-phase methanation. Reference [20] studied the dynamic operation and cost-effectiveness of gas-fired power plants, showing a potential cost reduction of up to 17% in the production of synthetic natural gas. Reference [21] focuses on the importance of the kinetics of methanation reactors for the annual efficiency of electro-gas conversion systems. Reference [22] evaluated the dynamic model of the methanation reactor, which achieved the quality target of synthetic natural gas approximately 130 seconds after startup.
In integrated energy systems, electricity-to-gas technology often provides an effective method for the consumption of renewable energy and load peak shaving and valley filling [22]. Reference [23] proposed a two-layer optimization scheduling method and explored the role of electricity-to-gas technology in improving photovoltaic consumption in integrated energy systems. Reference [24] established a park-level comprehensive energy system model that integrates electricity-to-gas and carbon capture and analyzed the trade-off between renewable energy abandonment rate and carbon emissions when planning electricity-to-gas capacity. Reference [25] considers the conversion of electricity to gas as a renewable energy storage system and explores different optimization schemes to improve the efficiency of integrated energy systems. In order to maximize operational efficiency, reference [26] studied the impact of integrated energy systems under four energy storage methods on waste rate and environmental pollution control costs. The research results indicate that the economic benefits of the comprehensive energy system using electric-to-gas technology are significantly improved.
The above research can make significant contributions to promoting the green and low-carbon transformation of integrated energy systems through the use of electricity-to-gas technology [27]. However, the above studies only used constant conversion efficiency to characterize the energy loss of the entire electric-to-gas conversion process, without considering the coupling operation constraints of different links in different processes. Under the actual operating conditions of the electric-to-gas conversion device, the electrolysis of water and the methanation process are carried out separately, and hydrogen storage tanks are configured. Some important technical issues must also be considered. For example, the slow dynamic response characteristics and multi-mode operating states of methane reactors. However, to our knowledge, there is currently no literature that has established an accurate electric-to-gas model to adapt to the optimized operation of the electric hydrogen gas thermal integrated energy system.
Based on the above analysis, in this article, we focus on the slow dynamic response characteristics and multi-mode operation status of electric-to-gas conversion and conduct research on the optimization operation of comprehensive energy systems. We build an operational model for a comprehensive energy system with the optimization objective of minimizing the total operating cost of the system during the day ahead operation period. We consider the slow dynamic response characteristics and multi-mode operation states of electric-to-gas conversion and construct an electric-to-gas operation model that considers dynamic characteristics. On this basis, we further construct an optimization operation model for the integrated energy system and determine the operation strategy of the integrated energy system.

2. Electric-to-Gas Operation Model Considering Dynamic Characteristics

The operational requirements of the electrolysis water and methanation subsystems depend on the limitations of equipment operation. Generally speaking, the operating modes of these two systems can be divided into three states: cold start, hot start, and production state. The correlation between different working states is shown in Figure 1.
In the cold start state, there is no natural gas production and no gas circulation. Methanation cannot yet treat carbon dioxide. Under cold start, electrolytic water can switch to operating mode within seconds to minutes, while methanation requires several hours of heating.
In the hot start state, no gas is produced, but all devices and media are at operating temperature and pressure, and a mixture of hydrogen and carbon dioxide can exist in the methane unit. The heat generated by maintaining the equipment during the hot start can be provided through external heat sources or electricity.
During production, hydrogen gas generated by electrolysis and carbon dioxide emitted from carbon sources are synthesized into natural gas through the methanation process. This process requires sufficient waste heat to compensate for losses, and if necessary, it can also dissipate heat. In addition, all media and compressors are also activated.
The changes between the states of electrolyzed water depend on the current distribution of the electrical load. The minimum load and possible rate of load change for methanation do not result in significant quality loss during the conversion process, which is usually different from electrolyzed water. Methanation may not follow the law of electrolytic hydrogen production. Therefore, if the electrical load fluctuates greatly, the two subsystems must be decoupled and operated separately from methane. In addition, the maximum hydrogen treatment rate of the methane reactor may be lower than the maximum production rate of electrolytic water. Hydrogen storage systems can help maintain load intervals and load change rates to maintain gas quality. The independent operation of each subsystem can lead to continuous production of methane. The size of the intermediate hydrogen storage tank needs to be optimized according to the specific situation for the selected electric-to-gas conversion technology and operation strategy.
Formulas (1)–(3) represent the operational constraints of the AEM electrolytic cell. Among them, constraint (1) specifies the working range of the electrolytic cell, and constraint (2) limits the maximum power fluctuation of the electrolytic cell. Constraint (3) describes the power loss of the electrolytic cell during the compression process.
ε t e l z W e l z min P t e l z ε t e l z W e l z max
P e l z f l u c P t e l z P t 1 e l z P e l z f l u c
F t e l z = γ e l z P t e l z
In the formula, ε t e l z is the start–stop state of the electrolytic cell; ε t e l z = 1 indicates startup, otherwise it is 0; W e l z m i n and W e l z m a x are the power consumption limits of the electrolytic cell; P t e l z is the power consumption of the electrolytic cell; P e l z f l u c represents the power fluctuation of the electrolytic cell; γelz and P t c p are the conversion coefficients and power consumption during hydrogen production, respectively.
Formulas (4)–(9) represent the operational constraints of electric-to-gas conversion. Constraint (4) indicates that the methanation reaction can only be in one state at any time. Constraint (5) specifies the minimum duration of each state k, that is, the methanation reaction can only enter each state l at most once within any time period [u, u + N m r k , m i n − 1], and cannot leave that state within this time period [u, u + N m r k , m i n − 1]. Constraint (6) represents the state transition relationship between adjacent time periods. Constraint (7) ensures that methane cannot enter and leave the same state simultaneously. Constraint (8) establishes the relationship between the cold start/hot start/production states and the entry/exit methanation state. Constraint (9) indicates that methane can only be output in state 3. Constraint (10) indicates the energy conversion relationship of methane.
l = 1 3 μ l t m r = 1 , t , l 1 , 2 , 3
t = u u + N m r k , min 1 I k t i n 1 t = u u + N m r k , min 1 I k t i n + I k t o u t 1 1 u T + 1 N m r k , min , l 1 , 2 , 3
I 1 t o u t + I 3 t o u t = I 2 t i n , I 1 t i n + I 3 t i n = I 2 t o u t , t
I k t i n + I k t o u t 1 , t , l 1 , 2 , 3
I k t i n I k t o u t = μ k t m r μ k t 1 m r , t , l 1 , 2 , 3
μ 3 t m r Π m r min F t m r μ 3 t m r Π m r max , t
F t m r = 0.25 η m r F t m r . H 2
In the formula, μ k t m r represents the various states of methanation during time t; T represents the total operating time period; μ k t m r = 1 indicates that it is in state l, otherwise, it is 0; N m r k , m i n is the minimum duration of methane formation in state l; I in / out   k t is equal to 1 if methanation enters/leaves state l during time t; Π max / min   m r is the maximum/minimum airflow output for methane conversion; F t m r and F t m r . H 2 is the output and consumption of hydrogen gas from the methane gas flow; ηmr is the efficiency of methane conversion.
Formulas (11)–(15) represent the operational constraints of the hydrogen storage tank. Formula (11) represents the relationship between the amount of hydrogen stored and the storage/release rate. The storage and release rate of hydrogen is constrained by Formulas (12)–(13). Constraint (14) limits the amount of hydrogen stored in the storage tank. The hydrogen stored in the final stage needs to be restored to the predetermined initial level, as shown in (15).
Q w t H y = Q w t 1 H y + F w t i n F w t o u t
0 F w t i n F w . max i n
0 F w t o u t F w . max o u t
β min Q w H y Q w t H y Q w H y
Q w .0 H y = Q w . T H y
In the formula, Q w t H y is the mass of hydrogen stored in the hydrogen storage tank; F w t i n and F w t o u t represent the hydrogen charging and discharging capacity of the hydrogen storage tank; Q w H y is the upper limit of hydrogen storage capacity; βmin is the minimum capacity coefficient of the hydrogen storage tank; F w . m a x i n and F w . m a x o u t are the upper and lower limits for hydrogen storage tank charging and discharging; Q w . 0 H y and Q w . T H y are the hydrogen storage capacities at the beginning and end of the hydrogen storage tank.

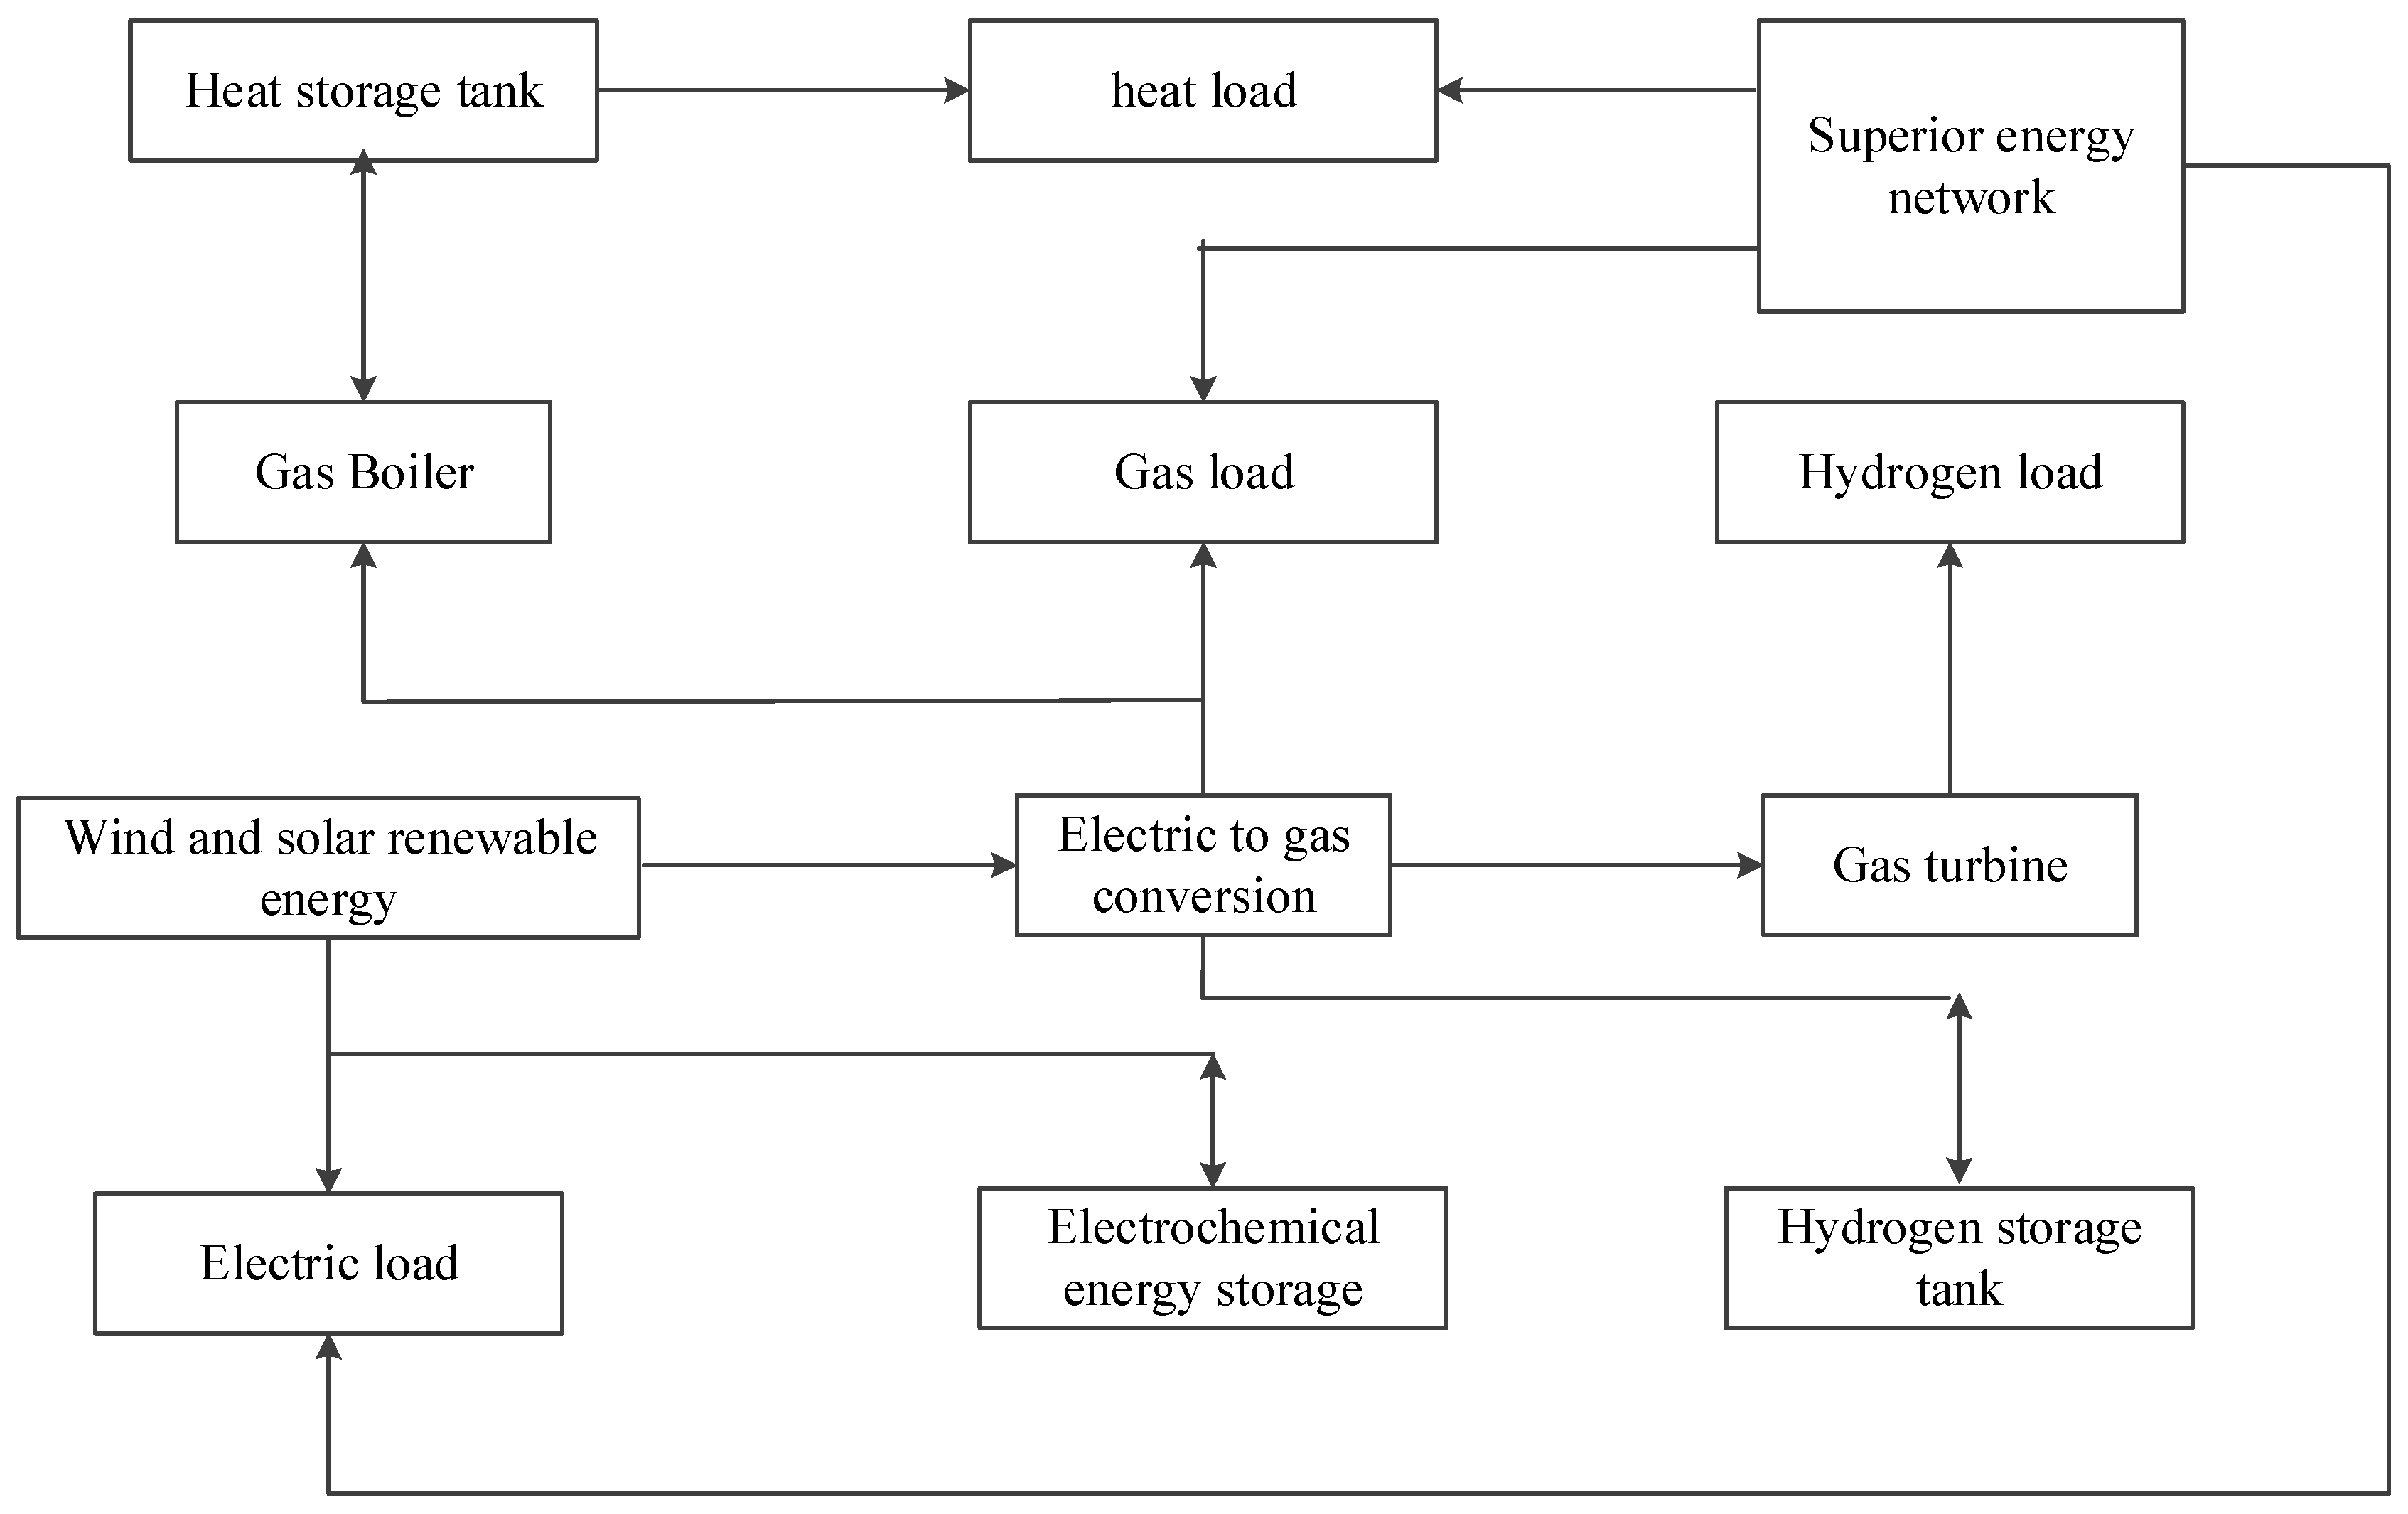
3. Optimization Operation Model of the Integrated Energy System

The basic structure of the integrated energy system described in this article is shown in Figure 2. The integrated energy system interacts heterogeneous energy with the higher-level power grid, gas network, and heating network through connecting lines, and heterogeneous energy is converted to meet various load demands through coupling devices within the system. The coupling equipment mainly includes gas turbines, gas boilers, and electric-to-gas conversion. Energy storage equipment include electrochemical energy storage, hydrogen storage tanks, and heat storage tanks. In addition, considering a high proportion of new energy integration on the source side further enhances the low-carbon operation of the system.

3.1. Objective Function

With the goal of minimizing the daily operating costs of the integrated energy system, and taking into account the new energy grid connection cost Crene, wind and solar curtailment penalty cost Ccurt, superior energy grid supply cost Cenergy, and carbon emission cost Ccarbon, the objective function is constructed. The details are as follows:
min C r e n e + C c u r t + C e n e r g y + C c a r b o n
C r e n e = t T c r e n e P r e n e . t
C c u r t = t T c c u r t P c u r t . t
C e n e r g y = t T c p o w e r P g r i d . t + c g a s F g r i d . t + c h e a t H g r i d . t
C c a r b o n = t T c C O 2 e p o w e r P g r i d . t + e g a s F g r i d . t + e h e a t H g r i d . t
In the formula, crene and ccurt, respectively, represent the new energy grid price and the penalty price for abandoning wind and solar power; cpower, cgas, and cheat, respectively, represent the purchase price of electricity from the superior power grid, the purchase price of gas from the superior gas network, and the purchase price of heat from the superior heating network; cco2 is the carbon trading price; Prene.t and Pcurt.t, respectively, represent the consumption of new energy and the amount of abandoned electricity; Pgrid.t, Fgrid.t, and Hgrid.t, respectively, represent the purchase of electricity, gas, and heat from the higher-level energy network; epower, egas, and eheat represent the unit carbon emissions of electricity, gas, and heat consumed by the higher-level energy grid.

3.2. Constraint Condition

In the optimization operation model of the integrated energy system, the dynamic operation constraint Formulas (1)–(15) for converting electricity to gas are considered. In addition, power balance constraints, penalties for abandoning wind and solar power, constraints on purchasing energy from higher-level energy networks, and constraints on coupling equipment operation are also considered.
(1)
Power balance constraint
Equation (21) represents electric power balance, Equation (22) represents thermal power balance constraint, and Equations (23)–(24) represent natural gas and hydrogen energy balance constraints, respectively.
P r e n e . t + P dis . t + P c h p . t + P g f g . t + P g r i d . t = P t e l z + P grid . t + P ch . t + P t l o a d
H c h p . t + H g r i d . t = H t l o a d
F t m r + F g i r d . t = F t l o a d + F c h p . t + F g f g . t
F t e l z + F t o u t = F t i n + F t m r . H 2 + F t l o a d . H 2
In the formula, Pchp.t and Pgfg.t, respectively, represent the power generated by the gas boiler and gas turbine; Fchp.t and Fgfg.t represent the gas consumption of gas boilers and gas turbines, respectively; Pdis.t and Pch.t are the energy storage charging and discharging powers, respectively; P t l o a d is the electrical load power; Hchp.t and H t l o a d , respectively, represent the heat power and heat load demand generated by the gas boiler; F t l o a . d . H 2 and F t l o a d represent the hydrogen load demand and heat load demand, respectively.
(2)
Operational constraints of gas boilers
Equation (25) represents the power of the gas boiler, Equation (26) represents the minimum output limit of the gas boiler, and Equation (27) represents the climbing constraint of the gas boiler.
H c h p . t = η c h p F c h p . t
F c h p . min F c h p . t F c h p . max
Δ H c h p . min H c h p . t + 1 H c h p . t Δ H c h p . max
In the formula, ηchp is the heat generation efficiency of the unit; Fchp.max and Fchp.min are the upper and lower limits of natural gas consumption; ΔHchp.min and Hchp.max are the ramp-up limits for heat generation of the unit.
(3)
Operational constraints of heat storage tanks
Equation (28) represents the thermal energy balance process of the heat storage tank, Equation (29) represents the capacity constraint of the heat storage tank, the charging and discharging heat constraint of the heat storage tank, and Equations (30)–(32) indicate that the hydrogen storage tank has certain capacity constraints and uphill/downhill climbing constraints.
H t + 1 s t o r = H t s t o r + H c h . t s t o r H d i s . t s t o r
H min s t o r H t s t o r H max s t o r
0 H c h . t s t o r H c h . max s t o r
0 H d i s . t s t o r H d i s . max s t o r
Δ H min s t o r H t s t o r H t 1 s t o r Δ H max s t o r
In the formula, H t s t o r is the mass of hydrogen stored in the hydrogen storage tank; H c h . s t o r and H d i s . t s t o r are the hydrogen charging and discharging capacities of the hydrogen storage tank; H s t a r   min and H s t o r   max are the upper and lower limits of hydrogen storage capacity; Δ H s t o r   max and Δ H s t o r   min are the ramp-up limits of hydrogen storage; H c h . m a x s t o r and H d i s . m a x s t o r are the upper and lower limits of hydrogen storage tank charging and discharging.
(4)
Operational constraints of electrochemical energy storage
Equation (33) represents the power balance of electrochemical energy storage, Equations (34) and (35) represent the state of charge constraint of electrochemical energy storage, and Equations (36) and (37) represent the charge–discharge power constraint of electrochemical energy storage.
P t + 1 s t o r = P t s t o r + P c h . t P d i s . t
P min s t o r P t s t o r P max s t o r
P t = 1 s t o r = P t = T s t o r
P c h . min P c h . t Z c h P c h . max
P d i s . min P dis . t ( 1 Z bat ) P d i s . max
In the formula, P t s t o r , P ch.t and Pdis.t, respectively, represent the electrical energy stored in electrochemical energy storage and the charging and discharging power; P s t a r   max and P s t a r   min are the upper and lower limits of the energy storage capacity; Pch,min, Pch,max, Pdis.min and Pdis.max are the upper and lower limits of the electrochemical energy storage charge and discharge power; Zbat is the charge and discharge state of electrochemical energy storage.
(5)
Gas turbine operation constraints
Equation (38) represents the power of the gas turbine, Equation (39) represents the minimum output limit of the gas turbine, and Equation (40) represents the climbing constraint of the gas turbine.
P g f g . t = η g f g F g f g . t
F g f g . min F g f g . t F g f g . max
Δ P g f g . min P g f g . t + 1 P g f g . t Δ P g f g . max
In the formula, ηgfg is the power generation efficiency of the unit; Pgfg.max and Pgfg.min are the upper and lower limits of natural gas power; ΔPgfg.min and ΔPgfg.max are the ramp-up limits of the power generation of the unit.
(6)
New energy reduction constraints
0 P c u r t . t P r e n e . t
(7)
Constraints on online energy purchasing by superiors
0 P g r i d . t P g r i d . max
0 F g r i d . t F g r i d . max
0 H g r i d . t H g r i d . max
In the formula, Pgrid.max, Fgird.max, and Hgrid.max represent the energy limits of electricity, gas, and heat supplied by the higher-level energy grid, respectively.

4. Simulation Analysis
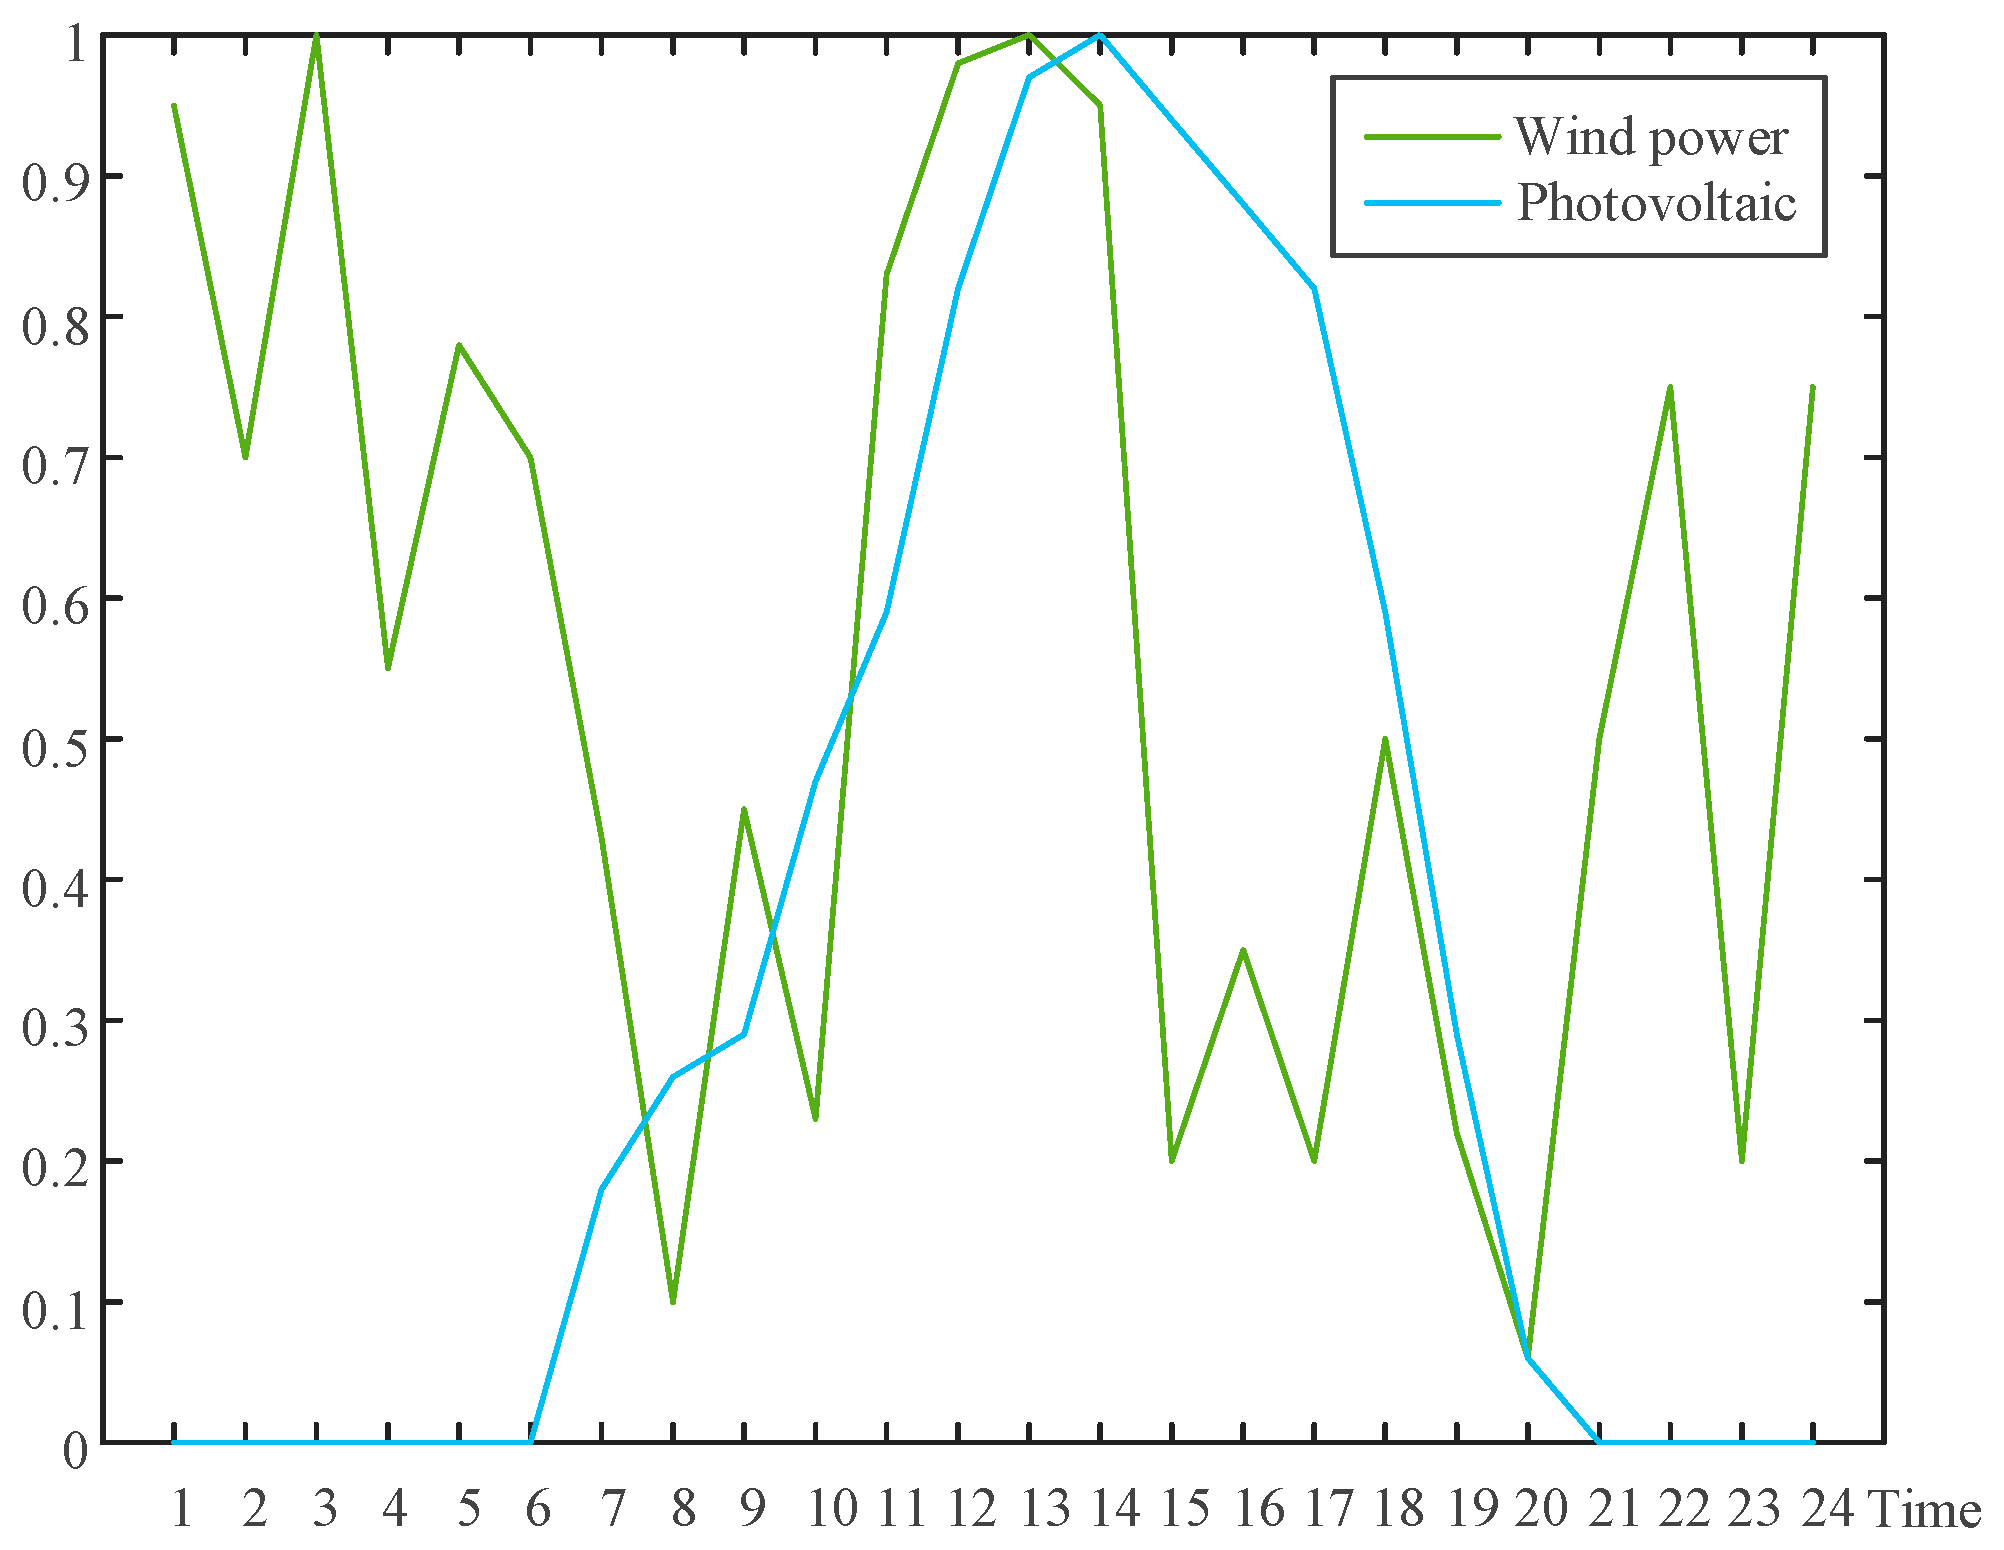
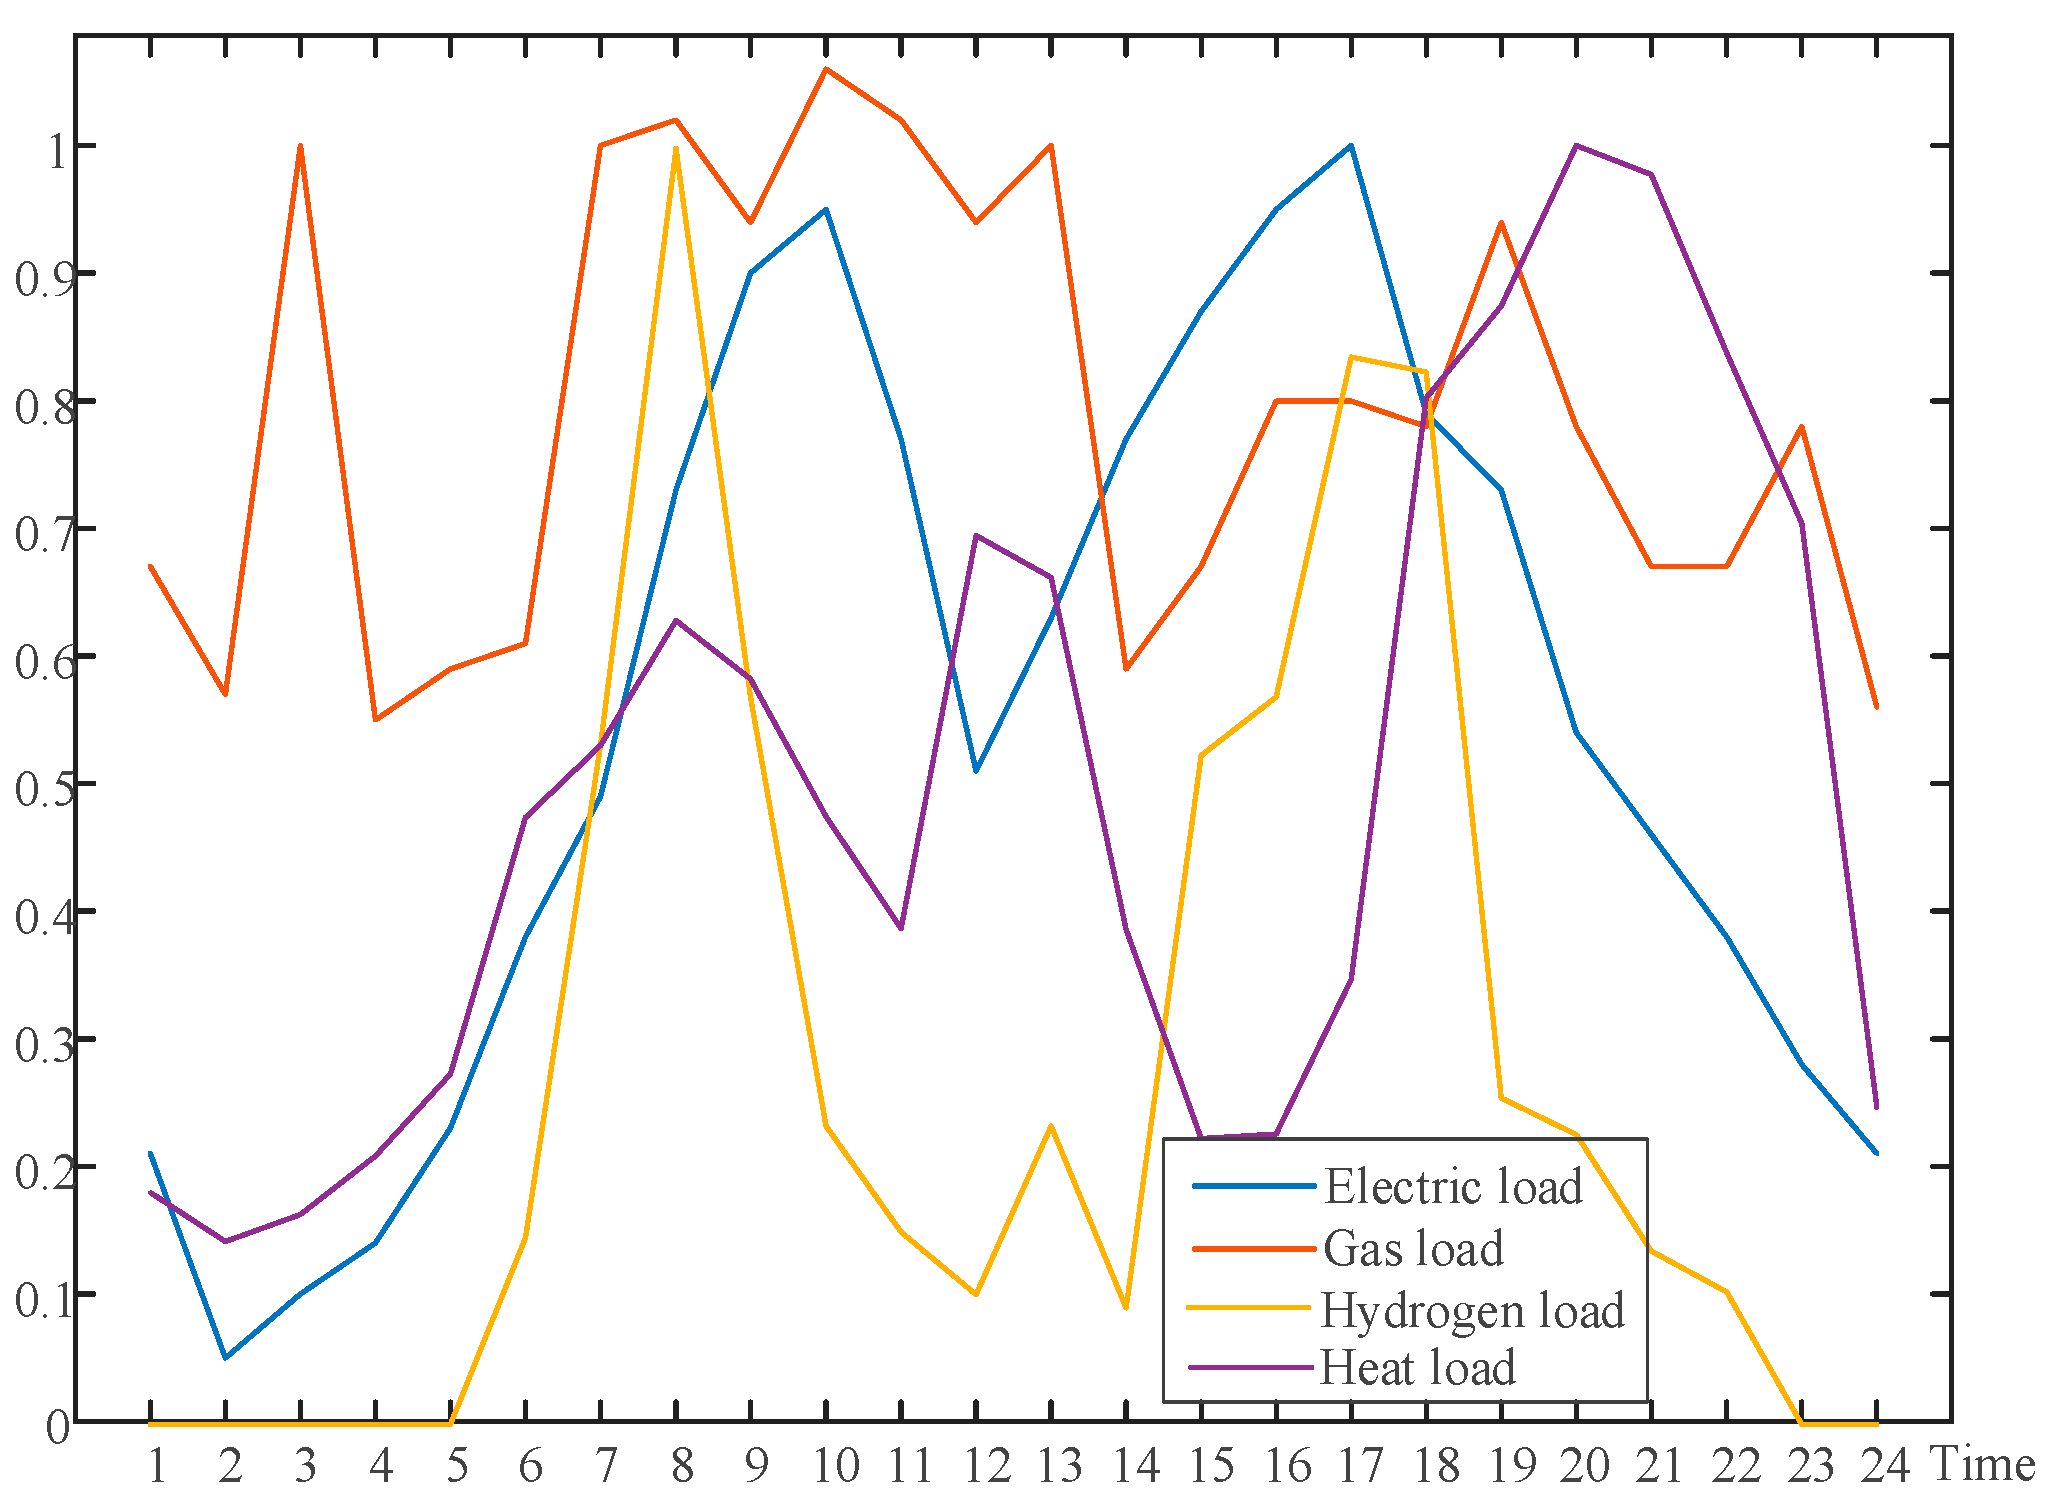
4.1. Basic Data

This article uses the comprehensive energy system shown in Figure 2 as an example analysis of the integrated energy system. The installed capacity of this system is 2.5 MW for wind and solar new energy, 1.5 MW for gas boilers, 2.0 MW for gas turbines, and 3.0 MW for electric-to-gas conversion. The peak load demands for electricity, gas, hydrogen, and heat in the system are 1.2 MW, 1.5 km3, 6 kg, and 1 MW, respectively. The equipment capacities of electrochemical energy storage, hydrogen storage tank, and heat storage tank are 0.8 MW, 1 kg, and 0.5 MW, respectively. epower, egas, and eheat are 0.5 tons/MW, 0.65 tons/km3, and 0.6 tons/MW, respectively. The current operating period T is 24 h; The time interval is 1 h. The minimum duration of cold start, hot start, and production states for the methane synthesis reaction is 4 h, 3 h, and 1 h, respectively. The airflow limitation for methane synthesis is 0.3 km3 and 1.5 km3. The operating parameters of each coupling equipment in the integrated energy system are given in Table 1. The source load output curves of the system are shown in Figure 3 and Figure 4.

4.2. Analysis of Operating Results

To verify the effectiveness of the model and method proposed in this article, the system operation results under the following three scenarios were compared and analyzed.
Scenario 1: Comprehensive energy system operation strategy without considering the slow dynamic response characteristics of electric-to-gas conversion.
Scenario 2: Comprehensive energy system operation strategy without considering the conversion of electricity to gas energy.
Scenario 3: Comprehensive energy system operation strategy that takes into account the slow dynamic response characteristics of electricity-to-gas conversion.
Table 2 shows the operational economic results of the different scenarios mentioned above. From Table 2, it can be seen that Scenario 1 has the highest cost of new energy grid connection, with the lowest penalty fees for wind and solar power abandonment, energy supply fees for higher-level energy grids, and carbon emission fees, resulting in the lowest daily operating cost for Scenario 1. However, for Scenario 2, which ignores the technology of converting electricity to gas, there are high costs for abandoning wind and solar power, providing energy to the superior energy grid, and carbon emissions, resulting in the highest operating cost of the system in Scenario 2. This indicates that neglecting the technology of converting electricity to gas will lead to a large-scale abandonment of wind and solar power in the system. Purchasing a large amount of energy from the superior energy grid will increase carbon emissions and significantly increase the operating costs of the system. The necessity and effectiveness of considering electricity-to-gas technology in integrated energy systems were verified through comparative analysis of scenarios 1 and 2; that is, using electricity to gas can help the system absorb redundant new energy, generate hydrogen and methane, supply hydrogen and gas loads, reduce the energy consumption of the system from the superior energy grid, and also reduce the carbon emissions of the system, promoting the green and low-carbon economic transformation of the comprehensive energy system.
Compared to Scenario 1, the new energy grid connection cost in Scenario 3 has decreased, while the penalty cost for abandoning wind and solar power, the energy supply cost of the superior energy grid, and the carbon emission cost have all increased, resulting in an increase in the operating economic cost of Scenario 3. This indicates that the slow dynamic response characteristics of electric-to-gas conversion will have a significant impact on the heterogeneous energy conversion of the system. Ignoring the slow dynamic response characteristics will misjudge the new energy consumption, energy procurement, and carbon emissions of the system, thereby affecting the economic efficiency of system operation.
Figure 5 compares the conversion of electricity to gas energy between Scenario 1 and Scenario 3. From Figure 5, it can be seen that in Scenario 1, the electric-to-gas technology can start and stop the synthesis of methane at all times. This is because Scenario 1 ignores the slow dynamic response characteristics, and the cold and hot start states of the methane reaction are not taken into account, failing to consider the duration of state transition from shutdown to production. This will overestimate the start and stop rate of the methane reaction, and thus overestimate the energy conversion amount of the methane reaction. Compared to Scenario 1, Scenario 3 takes into account the slow dynamic response characteristics, takes into account the specific duration required for methane reaction, and simulates the transformation relationship between different states. Therefore, Scenario 3 can more accurately simulate the operational status of the methane reaction, reasonably evaluate the production of hydrogen and natural gas in the system, avoid misjudgment of new energy consumption and carbon emissions, and thus overestimate the economic operation status of the system.

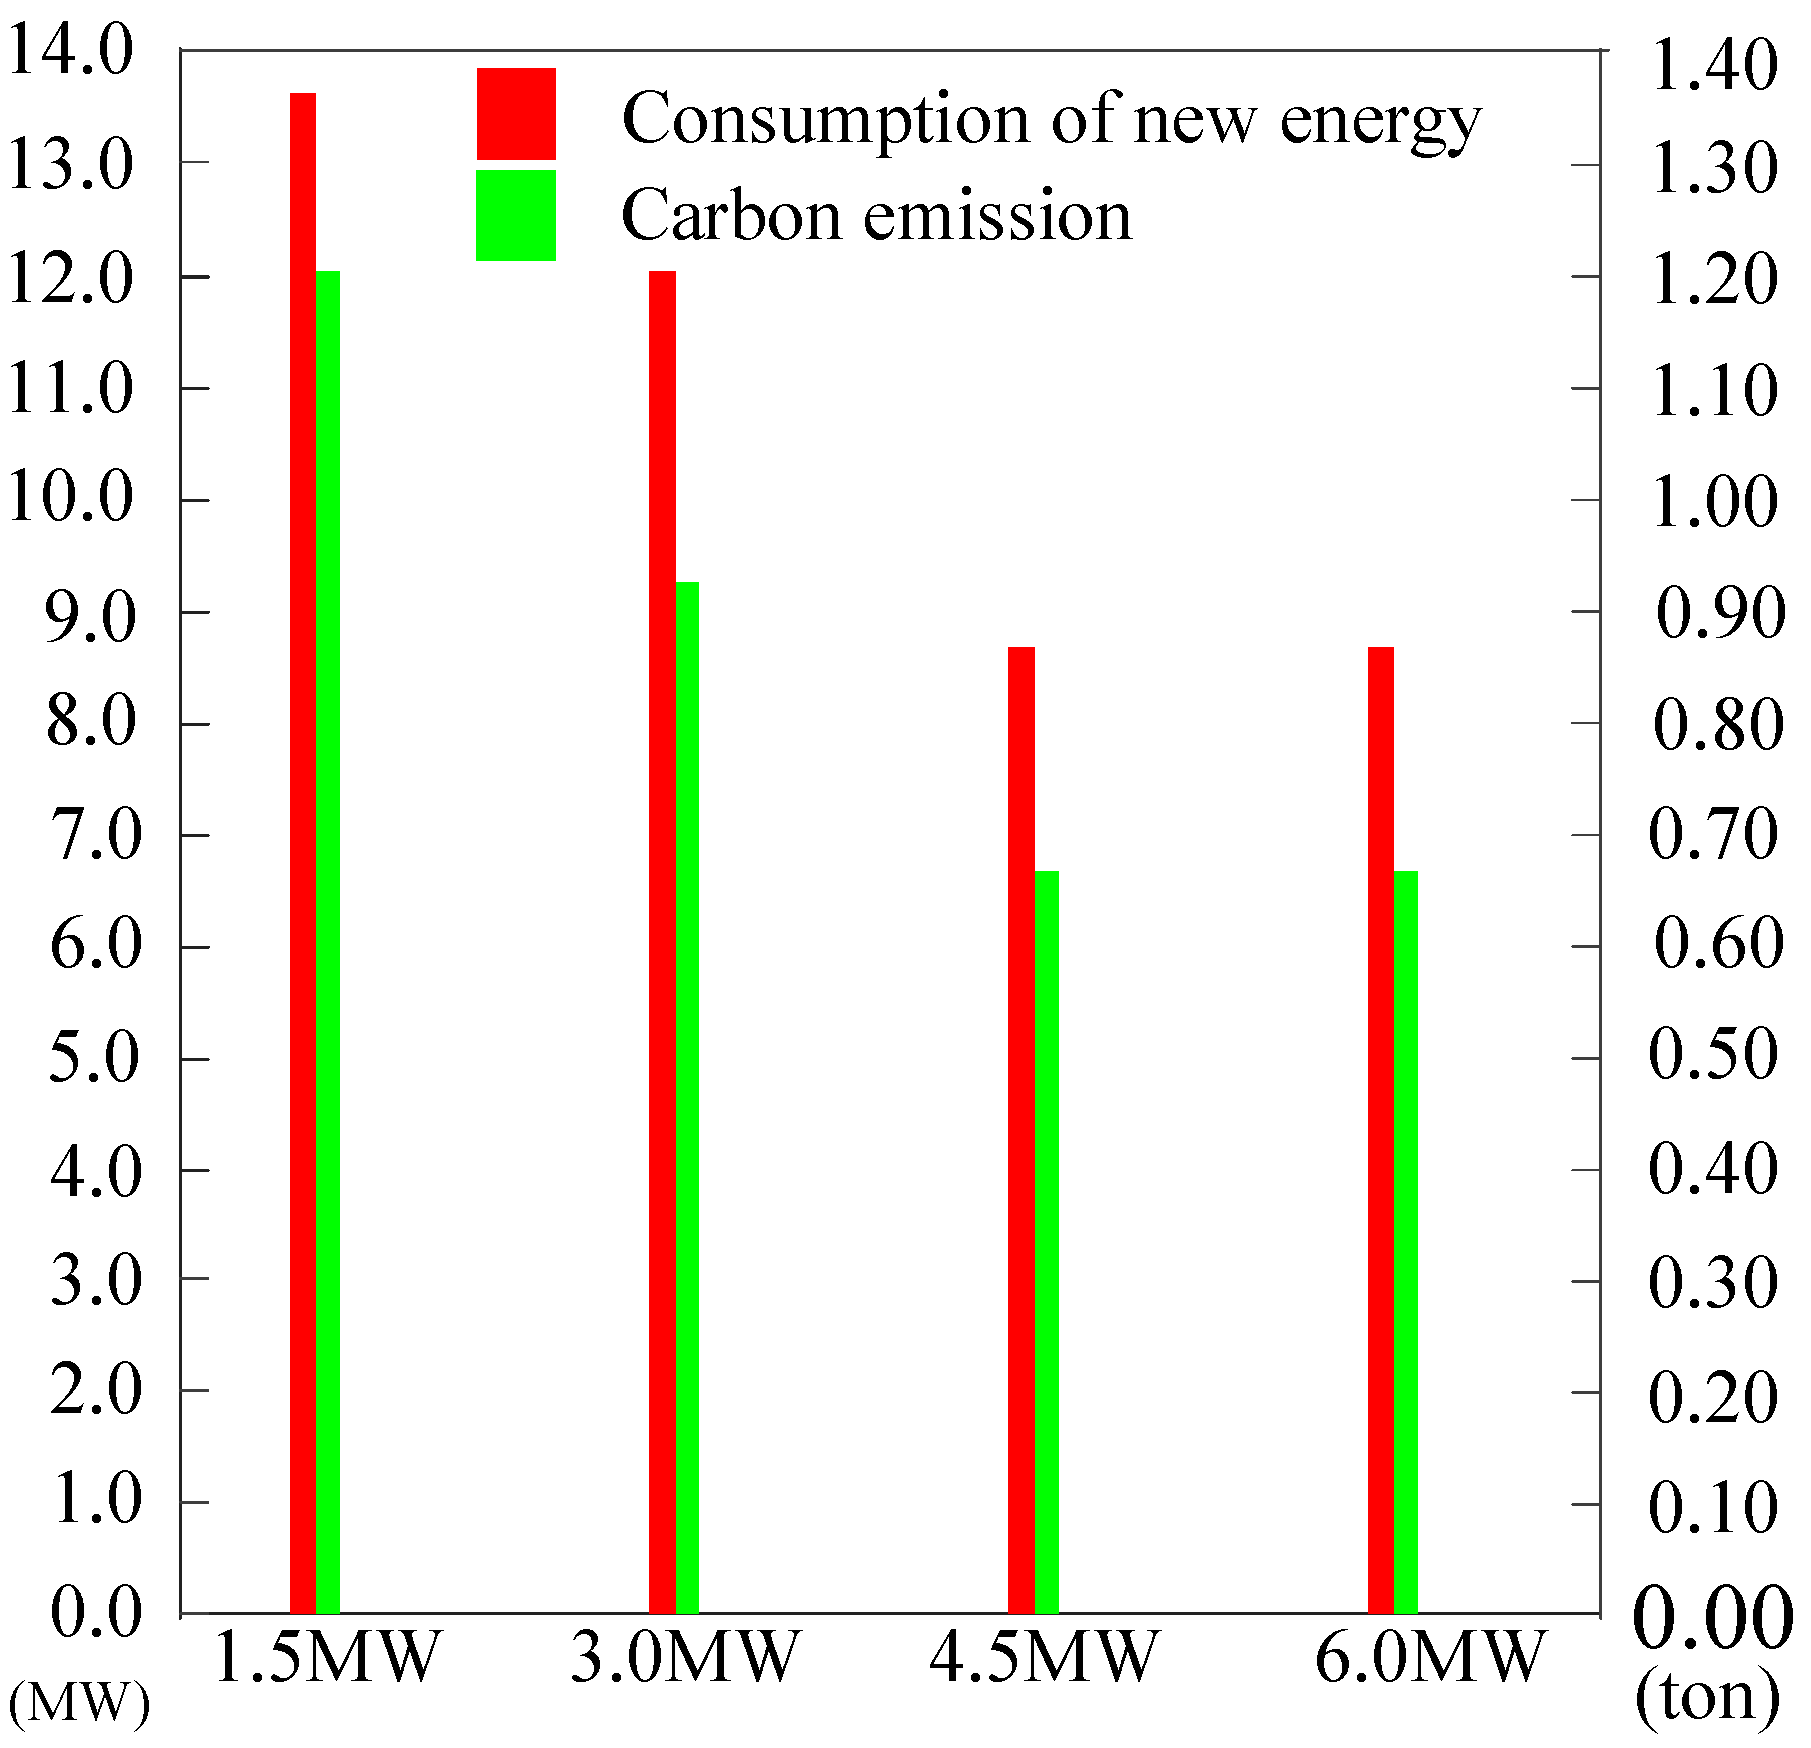
4.3. The Impact of Different Electric-to-Gas Conversion Capacities on Operating Results

Significant differences in the consumption of redundant new energy in systems with different electric-to-gas conversion capacities will have an impact on the operational strategy of the system. Therefore, this section sets four different electric-to-gas conversion capacities, namely 1.5 MW, 3.0 MW, 4.5 MW, and 6.0 MW, to develop a comprehensive energy system operation strategy that considers the slow dynamic response characteristics of electric-to-gas conversion. The results are shown in Table 3 and Figure 6. The detailed analysis is as follows:
From Table 3, it can be seen that as the capacity of electric-to-gas conversion increases, the total operating cost of the system shows a trend of first decreasing and then remaining unchanged. This indicates that increasing the capacity of electric-to-gas conversion can reduce the operating cost of the system to a certain extent. However, if the capacity of electric-to-gas conversion is too high, it will cause redundancy and cannot effectively improve the operating condition of the system. The specific reason can be seen in Figure 6, as the capacity of electric-to-gas conversion increases, the amount of redundant new energy consumed during electric-to-gas conversion significantly increases, and the carbon emissions of the system significantly decrease. However, when the electric-to-gas conversion capacity increases to 4.5 MW, the new energy consumption and carbon emissions of the system will no longer increase, indicating that the electric-to-gas conversion capacity has entered a saturation period. From the above results, it can be seen that selecting the saturation period capacity of electric-to-gas conversion will effectively improve the operating cost of the system and avoid resource waste.

5. Conclusions

This article considers the slow dynamic response characteristics of electric-to-gas conversion and constructs a multi-mode operating state model for electric-to-gas conversion. On this basis, considering various operational constraints of the integrated energy system, the operational strategy of the system is formulated with the goal of minimizing the total operating cost in the past. The simulation results of the case study verified the effectiveness of the proposed model and method and analyzed the important role of considering the slow dynamic response characteristics of electric-to-gas conversion in reducing system operating costs, effectively absorbing new energy and improving energy utilization efficiency. The operation of the comprehensive energy source system under different electric-to-gas operation models was compared, and considering the slow dynamic response characteristics of electric-to-gas conversion is beneficial for promoting the green and low-carbon transformation of the energy system.

Author Contributions

Conceptualization, S.T., F.L. and H.Z.; methodology, S.T., F.L. and H.Z.; experiment, S.T., F.L. and H.Z.; writing—original draft preparation, S.T., F.L. and H.Z. All authors have read and agreed to the published version of the manuscript.

Funding

This study was supported by the National Natural Science Foundation of China (No. 62303266).

Data Availability Statement

Data are contained within the article.

Conflicts of Interest

The authors declare no conflicts of interest.

References

  1. Liu, S.; Peng, Y.; She, Y.; Liu, Y. Grasp the nettle or retreat: Dynamic effects decomposition of carbon trading policies from a spatial perspective. J. Clean. Prod. 2023, 414, 137788. [Google Scholar] [CrossRef]
  2. Hou, R.; Li, S.; Wu, M.; Ren, G.; Gao, W.; Khayatnezhad, M.; Gholinia, F. Assessing of impact climate parameters on the gap between hydropower supply and electricity demand by RCPs scenarios and optimized ANN by the improved Pathfinder (IPF) algorithm. Energy 2021, 237, 121621. [Google Scholar] [CrossRef]
  3. Li, X.; Wang, F.; Al-Razgan, M.; Awwad, E.M.; Abduvaxitovna, S.Z.; Li, Z.; Li, J. Race to environmental sustainability: Can structural change, economic expansion and natural resource consumption effect environmental sustainability? A novel dynamic ARDL simulations approach. Resour. Policy 2023, 86, 104044. [Google Scholar] [CrossRef]
  4. Liu, L.; Wu, Y.; Wang, Y.; Wu, J.; Fu, S. Exploration of environmentally friendly marine power technology -ammonia/diesel stratified injection. J. Clean. Prod. 2022, 380, 135014. [Google Scholar] [CrossRef]
  5. Tian, H.; Li, R.; Salah, B.; Thinh, P. Bi-objective optimization and environmental assessment of SOFC-based cogeneration system: Performance evaluation with various organic fluids. Process Saf. Environ. Prot. 2023, 178, 311–330. [Google Scholar] [CrossRef]
  6. Hu, J.; Zou, Y.; Zhao, Y. Robust operation of hydrogen-fueled power-to-gas system within feasible operating zone considering carbon-dioxide recycling process. Int. J. Hydrog. Energy 2024, 58, 1429–1442. [Google Scholar] [CrossRef]
  7. Quarton, C.J.; Samsatli, S. Power-to-gas for injection into the gas grid: What can we learn from real-life projects, economic assessments and systems modelling? Renew. Sustain. Energy Rev. 2018, 98, 302–316. [Google Scholar] [CrossRef]
  8. Walker, S.B.; van Lanen, D.; Mukherjee, U.; Fowler, M. Greenhouse gas emissions reductions from applications of Power-to-Gas in power generation. Sustain. Energy Technol. Assess. 2017, 20, 25–32. [Google Scholar] [CrossRef]
  9. Bassano, C.; Deiana, P.; Vilardi, G.; Verdone, N. Modeling and economic evaluation of carbon capture and storage technologies integrated into synthetic natural gas and power-to-gas plants. Appl. Energy 2020, 263, 114590. [Google Scholar] [CrossRef]
  10. Zhong, L.; Yao, E.; Zou, H.; Xi, G. Thermodynamic and economic analysis of a directly solar-driven power-to-methane system by detailed distributed parameter method. Appl. Energy 2022, 312, 118670. [Google Scholar] [CrossRef]
  11. Choe, C.; Kim, H.; Lim, H. Feasibility study of power-to-gas as simultaneous renewable energy storage and CO2 utilization: Direction toward economic viability of synthetic methane production. Sustain. Energy Technol. Assess. 2023, 57, 103261. [Google Scholar] [CrossRef]
  12. Buchholz, O.S.; van der Ham, A.G.J.; Veneman, R.; Brilman, D.W.F.; Kersten, S.R.A. Power-to-Gas: Storing Surplus Electrical Energy. A Design Study. Energy Procedia 2014, 63, 7993–8009. [Google Scholar] [CrossRef]
  13. Fambri, G.; Diaz-Londono, C.; Mazza, A.; Badami, M.; Sihvonen, T.; Weiss, R. Techno-economic analysis of Power-to-Gas plants in a gas and electricity distribution network system with high renewable energy penetration. Appl. Energy 2022, 312, 118743. [Google Scholar] [CrossRef]
  14. Blanco, H.; Nijs, W.; Ruf, J.; Faaij, A. Potential of Power-to-Methane in the EU energy transition to a low carbon system using cost optimization. Appl. Energy 2018, 232, 323–340. [Google Scholar] [CrossRef]
  15. McKenna, R.C.; Bchini, Q.; Weinand, J.M.; Michaelis, J.; König, S.; Köppel, W.; Fichtner, W. The future role of Power-to-Gas in the energy transition: Regional and local techno-economic analyses in Baden-Württemberg. Appl. Energy 2018, 212, 386–400. [Google Scholar] [CrossRef]
  16. Blanco, H.; Faaij, A. A review at the role of storage in energy systems with a focus on Power to Gas and long-term storage. Renew. Sustain. Energy Rev. 2018, 81, 1049–1086. [Google Scholar] [CrossRef]
  17. Bailera, M.; Lisbona, P.; Romeo, L.M.; Espatolero, S. Power to Gas projects review: Lab, pilot and demo plants for storing renewable energy and CO2. Renew. Sustain. Energy Rev. 2017, 69, 292–312. [Google Scholar] [CrossRef]
  18. Prabhakaran, P.; Graf, F.; Koeppel, W.; Kolb, T. Modelling and validation of energy systems with dynamically operated Power to Gas plants for gas-based sector coupling in de-central energy hubs. Energy Convers. Manag. 2023, 276, 116534. [Google Scholar] [CrossRef]
  19. Gorre, J.; Ruoss, F.; Karjunen, H.; Schaffert, J.; Tynjälä, T. Cost benefits of optimizing hydrogen storage and methanation capacities for Power-to-Gas plants in dynamic operation. Appl. Energy 2020, 257, 113967. [Google Scholar] [CrossRef]
  20. Inkeri, E.; Tynjälä, T.; Karjunen, H. Significance of methanation reactor dynamics on the annual efficiency of power-to-gas -system. Renew. Energy 2021, 163, 1113–1126. [Google Scholar] [CrossRef]
  21. Giglio, E.; Pirone, R.; Bensaid, S. Dynamic modelling of methanation reactors during start-up and regulation in intermittent power-to-gas applications. Renew. Energy 2021, 170, 1040–1051. [Google Scholar] [CrossRef]
  22. Zhou, S.; Sun, K.; Wu, Z.; Gu, W.; Wu, G.; Li, Z.; Li, J. Optimized operation method of small and medium-sized integrated energy system for P2G equipment under strong uncertainty. Energy 2020, 199, 117269. [Google Scholar] [CrossRef]
  23. Zhang, R.; Jiang, T.; Li, G.; Chen, H.; Li, X.; Ning, R. Double layer optimization scheduling of electricity gas integrated energy system considering electricity to gas consumption and wind power. Chin. J. Electr. Eng. 2018, 38, 5668–5678+5924. [Google Scholar]
  24. Zhang, X.; Zhang, Y. Environment-friendly and economical scheduling optimization for integrated energy system considering power-to-gas technology and carbon capture power plant. J. Clean. Prod. 2020, 276, 123348. [Google Scholar] [CrossRef]
  25. Ancona, M.A.; Antonioni, G.; Branchini, L.; De Pascale, A.; Melino, F.; Orlandini, V.; Antonucci, V.; Ferraro, M. Renewable Energy Storage System Based on a Power-to-Gas Conversion Process. Energy Procedia 2016, 101, 854–861. [Google Scholar] [CrossRef]
  26. Luo, F.; Shao, J.; Jiao, Z.; Zhang, T. Research on optimal allocation strategy of multiple energy storage in regional integrated energy system based on operation benefit increment. Int. J. Electr. Power Energy Syst. 2021, 125, 106376. [Google Scholar] [CrossRef]
  27. Yang, L.; Li, H.; Zhang, H.; Wu, Q.; Cao, X. Stochastic-Distributionally Robust Frequency-Constrained Optimal Planning for an Isolated Microgrid. IEEE Trans. Sustain. Energy 2024. early access. [Google Scholar] [CrossRef]
Figure 1. Main operation states of power to gas.
Processes 12 01277 g001
Figure 2. Basic structure of an integrated energy system.
Processes 12 01277 g002
Figure 3. Wind and solar power output curve.
Processes 12 01277 g003
Figure 4. Multi-load demand curve.
Processes 12 01277 g004
Figure 5. Operation comparisons of power-to-gas conversion under different cases.
Processes 12 01277 g005
Figure 6. Operation conditions of integrated energy systems under different capacities of power-to-gas conversion.
Processes 12 01277 g006
Table 1. Operating parameters for integrated energy system equipment [22,23,24].
SymbolNumerical Value
ηgfg0.7
ηchp0.6
ηmr0.65
γelz0.77
βmin0.2
Pgrid.max1 MW
Fgird.max1.3 km3
Hgrid.max1.5 MW
ΔPgfg.min0.5 Pgfg.min
ΔPgfg.max0.8 Pgfg.max
Pch,min, Pdis.min0.4 MW
Pch,max, Pdis.max0.4 MW
ΔHstor min0.2 ΔHstor max
H c h . m a x s t o r , H d i s . m a x s t o r 0.5 ΔHstor max
Fchp.min0.2Fchp.max
F W . M A X I N , F W . M A X O U T 0.5 QHy w
Q W . 0 H Y , Q W . T H Y 0.5 QHy w
crene,, ccurt0.3 yuan/kW, 0.35 yuan/kW
cpower, cgas0.4 yuan/kW, 0.68 yuan/km3
cheat0.6 yuan/MW
cco2100 yuan/ton
Table 2. Comparisons of operation costs of different cases (ten thousand yuan).
Scenario123
New energy grid connection costs0.350.880.42
Punishment fees for abandoning scenery1.251.781.32
Energy supply cost of superior energy network0.782.561.21
Carbon emission costs0.050.090.07
Current operating costs2.435.313.02
Table 3. Operation costs of different power-to-gas conversion capacities.
Capacity1.5 MW3.0 MW4.5 MW6.0 MW
Current operating costs3.433.022.522.52
Disclaimer/Publisher’s Note: The statements, opinions and data contained in all publications are solely those of the individual author(s) and contributor(s) and not of MDPI and/or the editor(s). MDPI and/or the editor(s) disclaim responsibility for any injury to people or property resulting from any ideas, methods, instructions or products referred to in the content.

