
Simulation Research on Cylinder Liner Shape and Position Tolerance under Thermo-Mechanical Load

Abstract
1. Introduction
2. Definition and Algorithm of Geometric Tolerance
2.1. Definition of Geometric Tolerance
- (1)
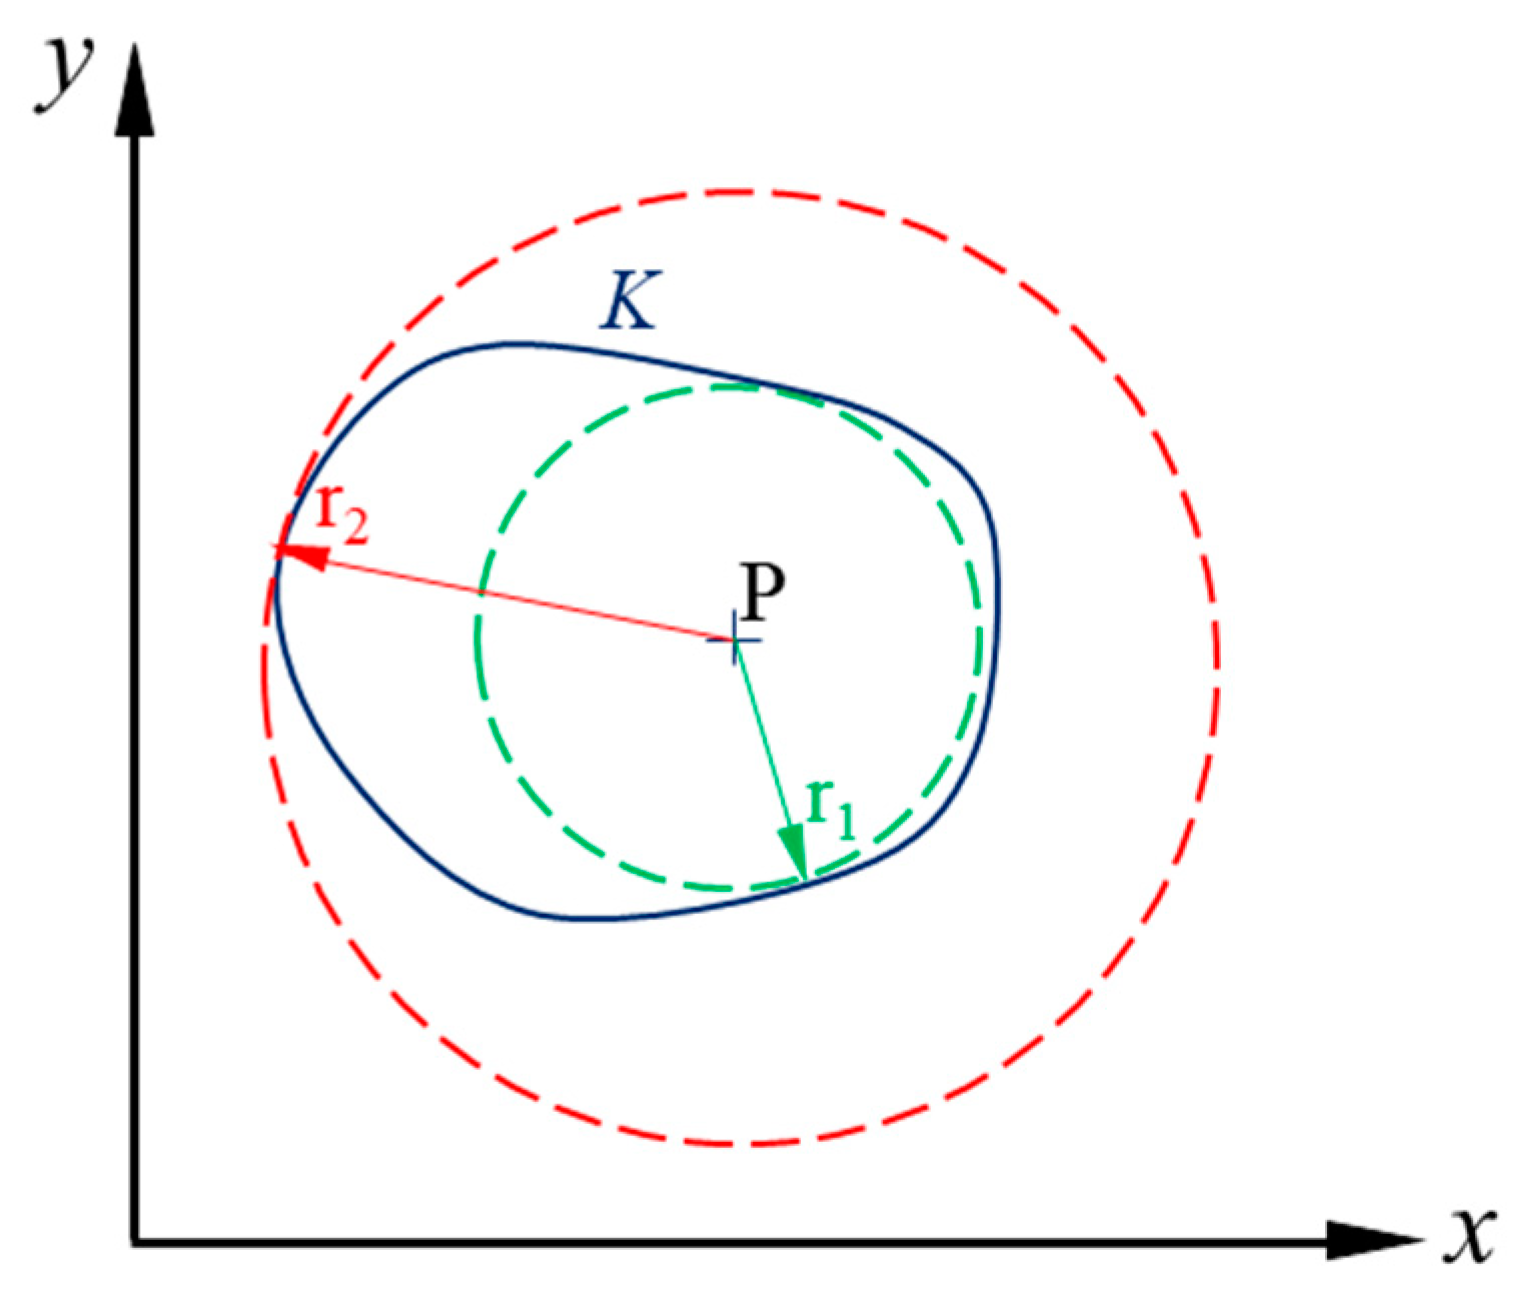
- Out-of-roundness
- (2)
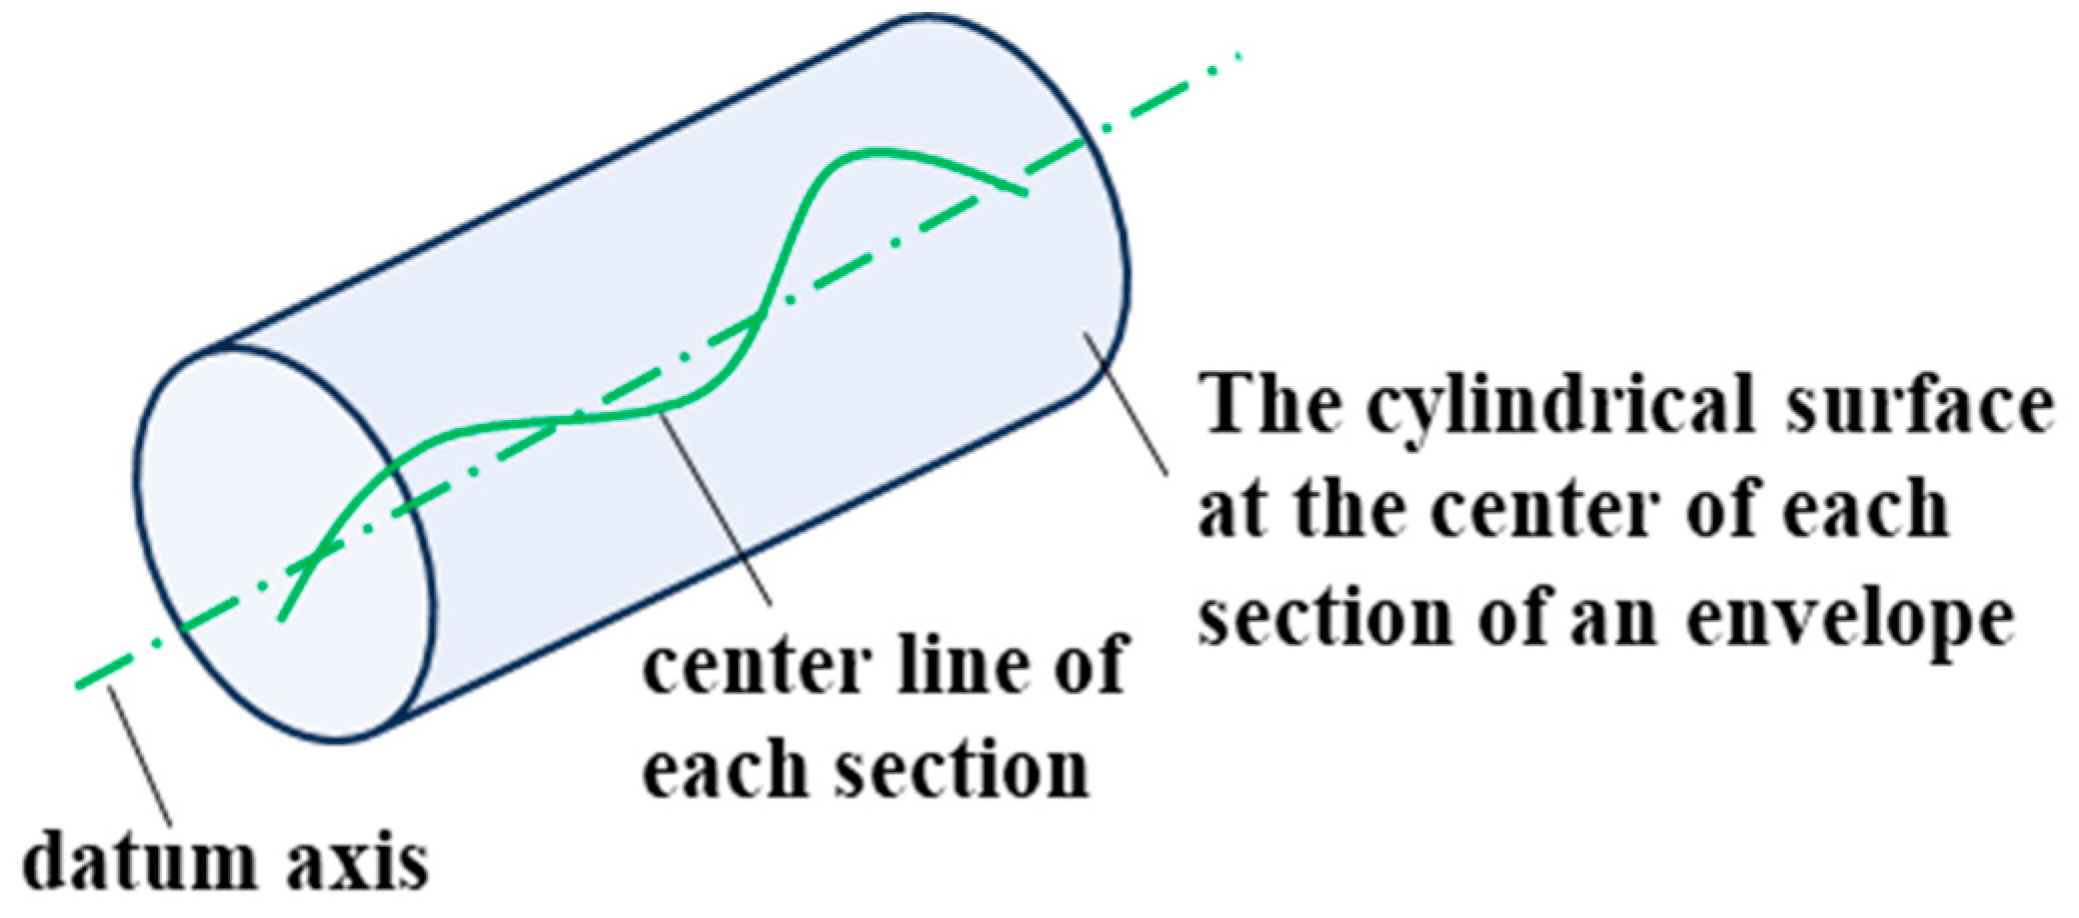
- Concentricity
2.2. Algorithm Debugging of Cylinder Liner and Position Tolerance
- Reflection: Generally speaking, the probability that the optimal solution of the objective function was located at the symmetric side of the worst point was maximized. The reflection point was calculated as:
- 2.
- Extension: If f(xR) < f(xL), it indicates that the search direction was correct, and the search point can be extended to xE along the original search path. The extension coefficient α was generally set as 1.5, and the extension point could be written as:
- 3.
- Compression: If f(xR) > f(xG), the function value at the reflection point was greater than that at the original sub-dead point, meaning that the reflection point was taken too far, and it should be compressed to point (xS) along the directions (xR) and (xF). The compression factor β was set as 0.5
- 4.
- Shorten the side length: When all the points along the search path (xF) and (xH) were larger than the original worst point function value, it means that the search along the reflection direction failed. The original simplex should be reduced and the best point was the base point. The initial simplex was reduced by half, and the reduced simplex was used as the starting search area. A new-round search was started according to the above method.
3. Transient Deformation of Cylinder Liner under Thermo-Mechanical Load
3.1. Model Description
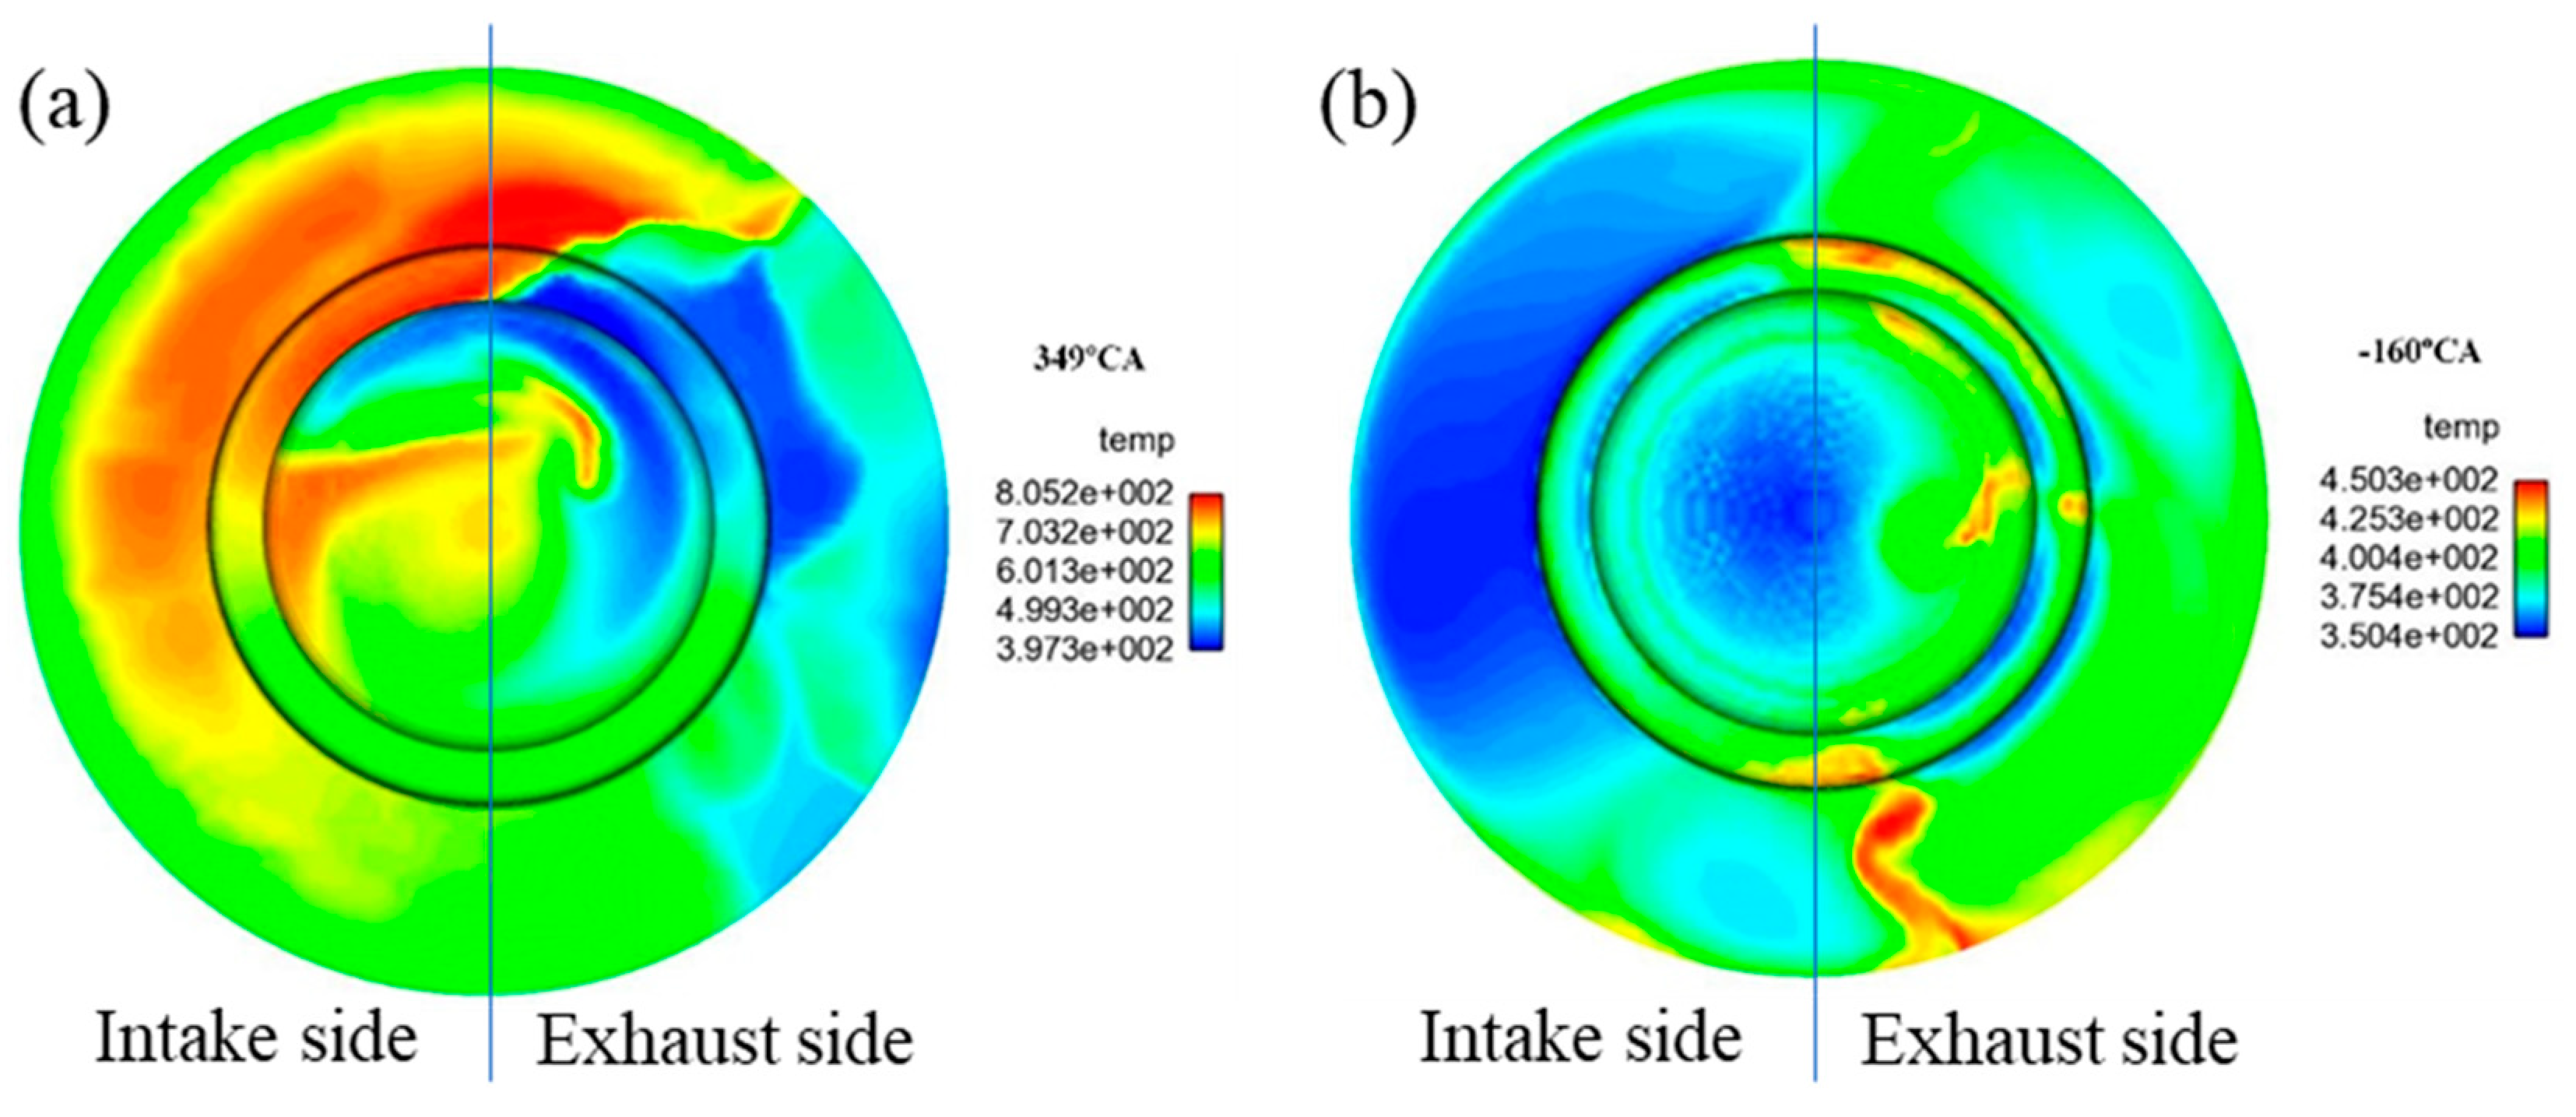
3.2. Thermal Boundary Conditions on the Piston Top Surface
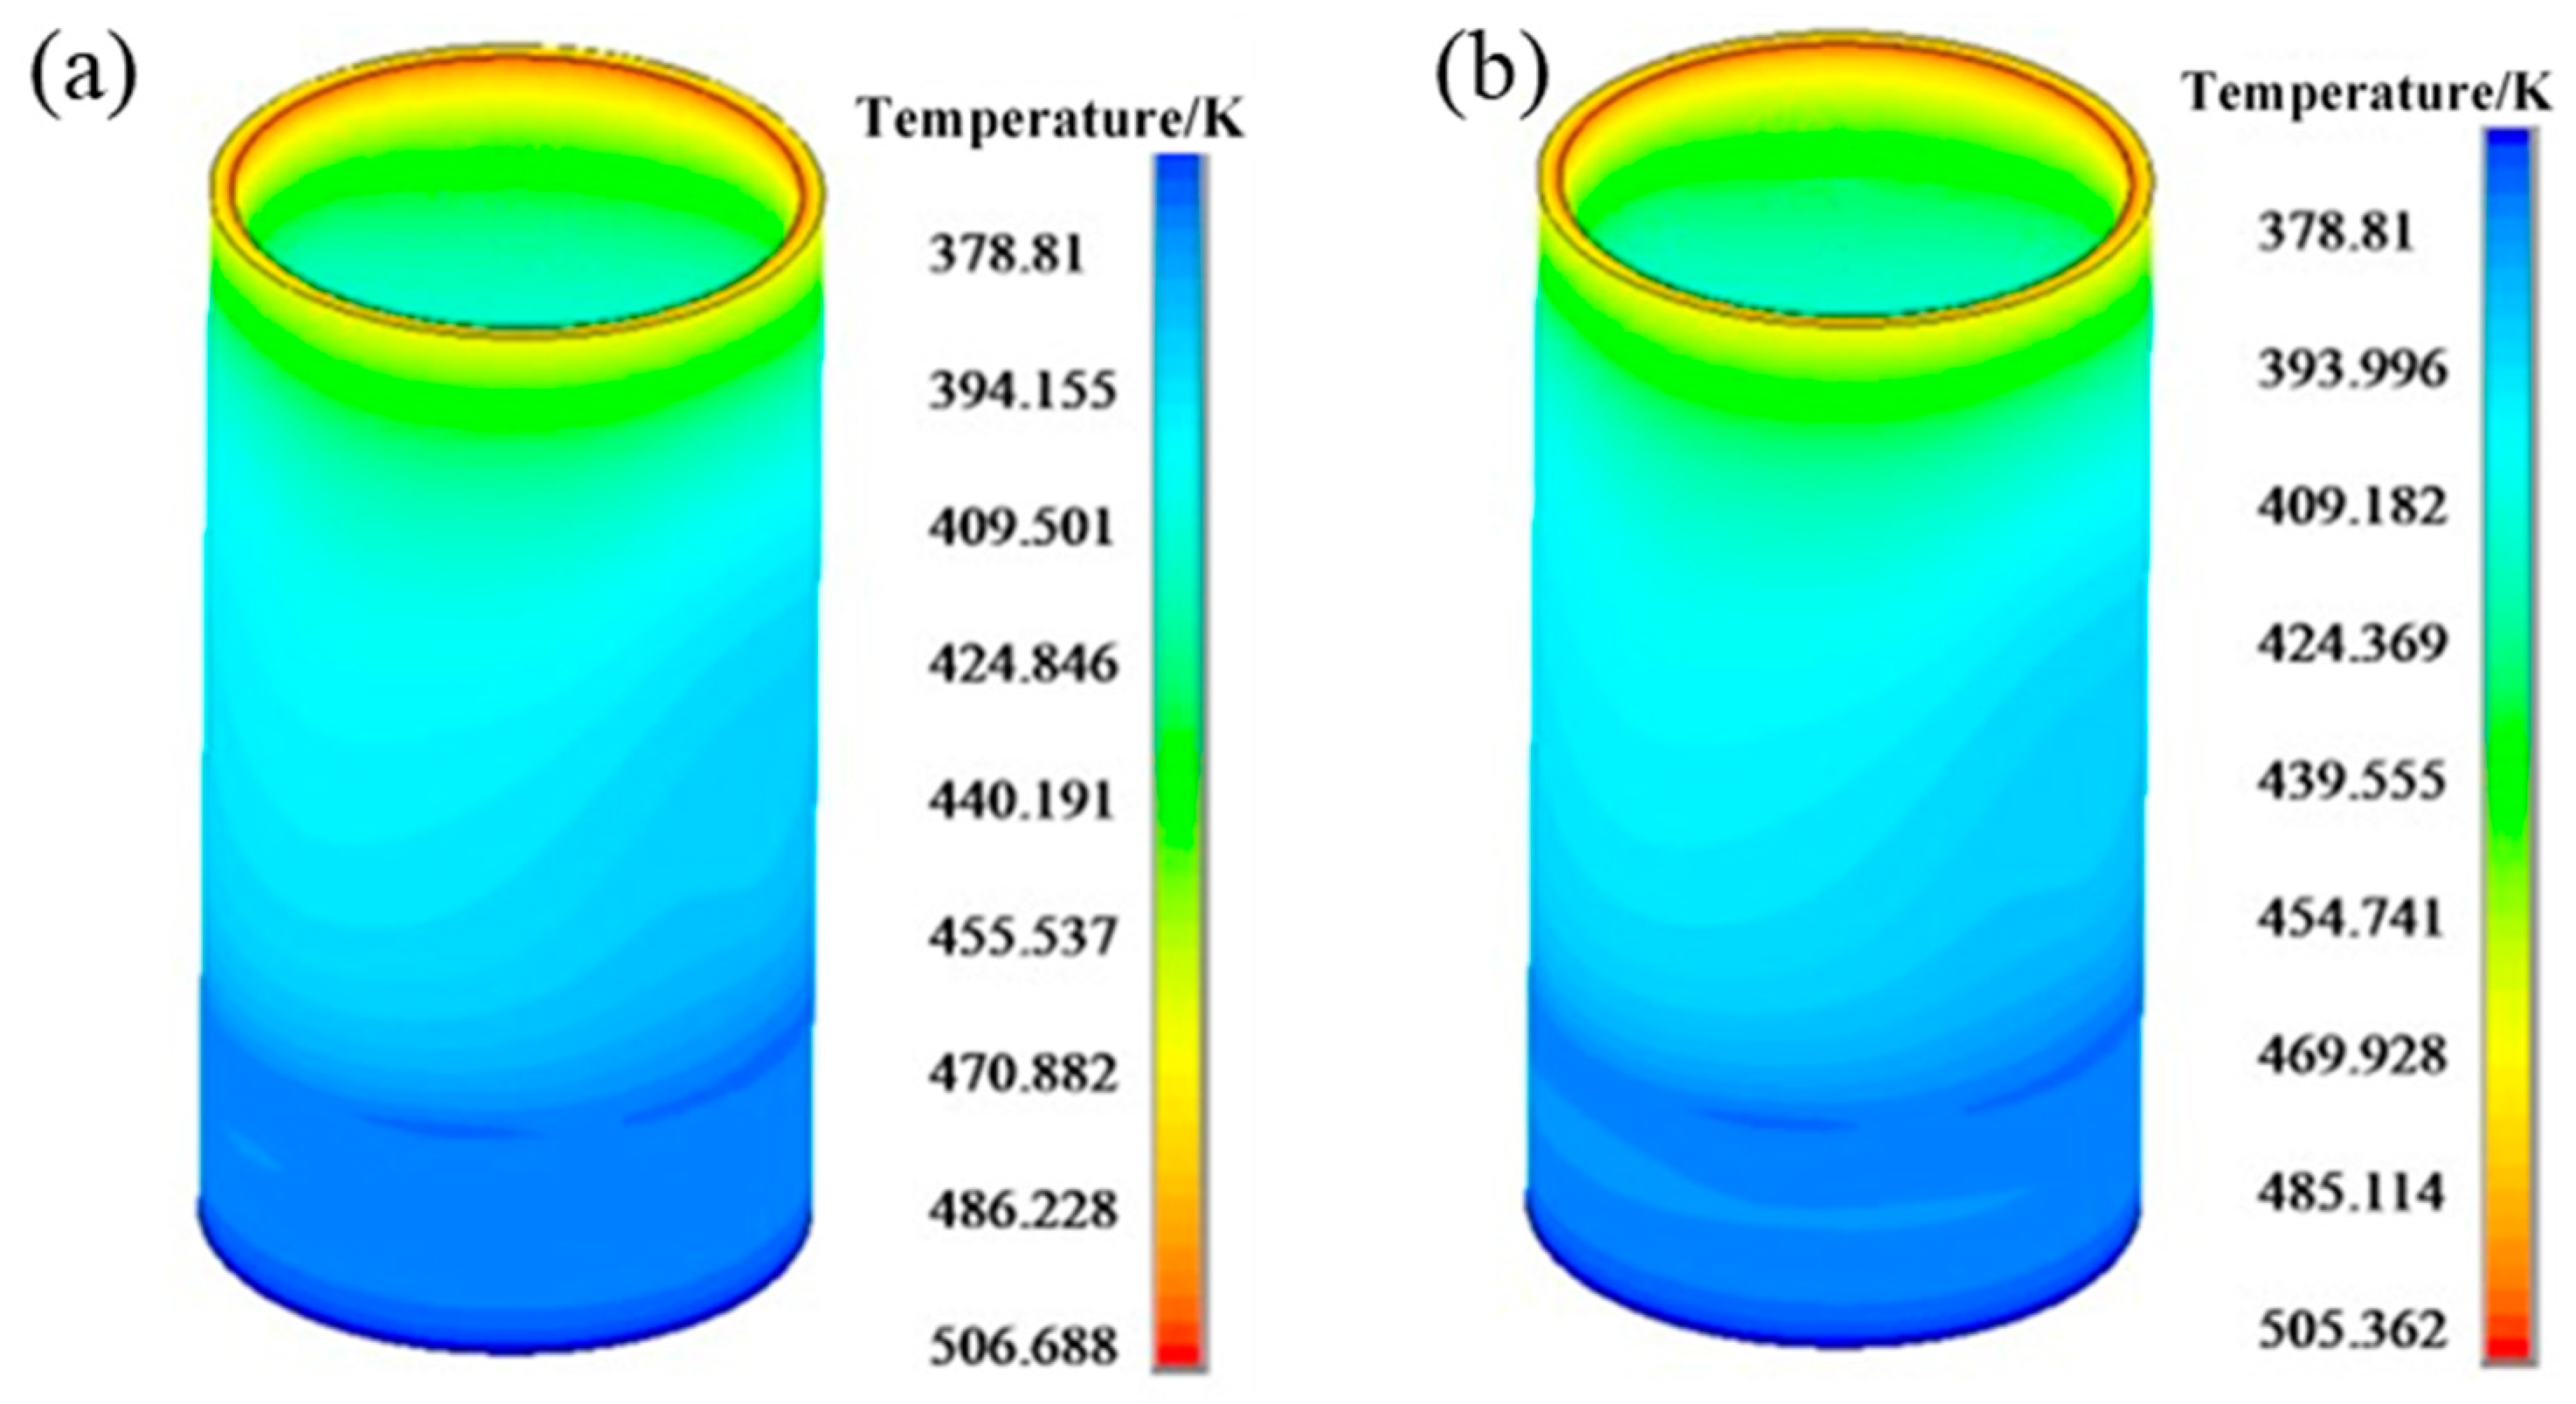
3.3. Boundary Conditions for Cylinder Liner
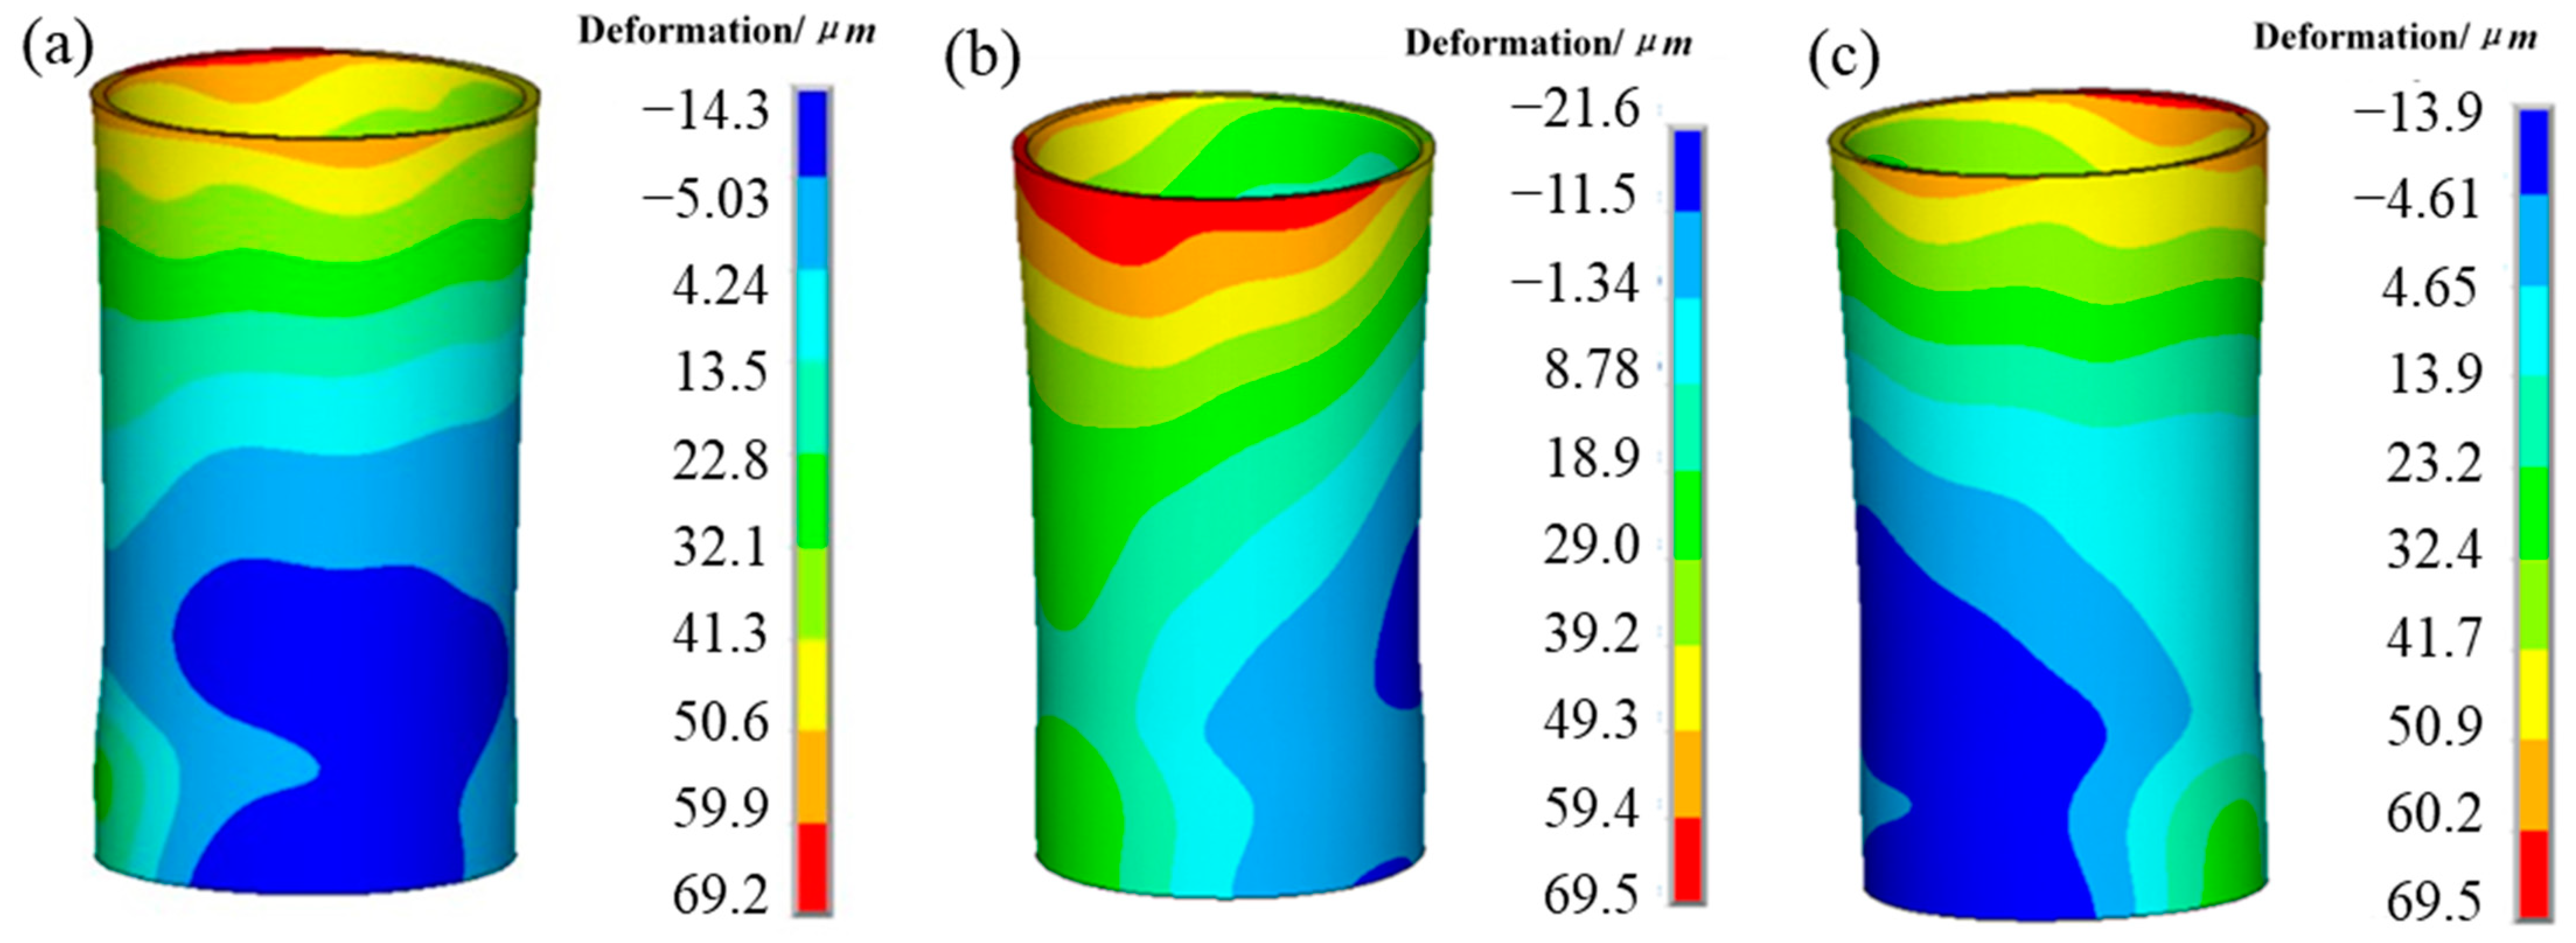
3.4. Analysis of Cylinder Liner Deformation
4. Cylinder Liner Shape and Position Tolerance
4.1. Data Extraction and Processing
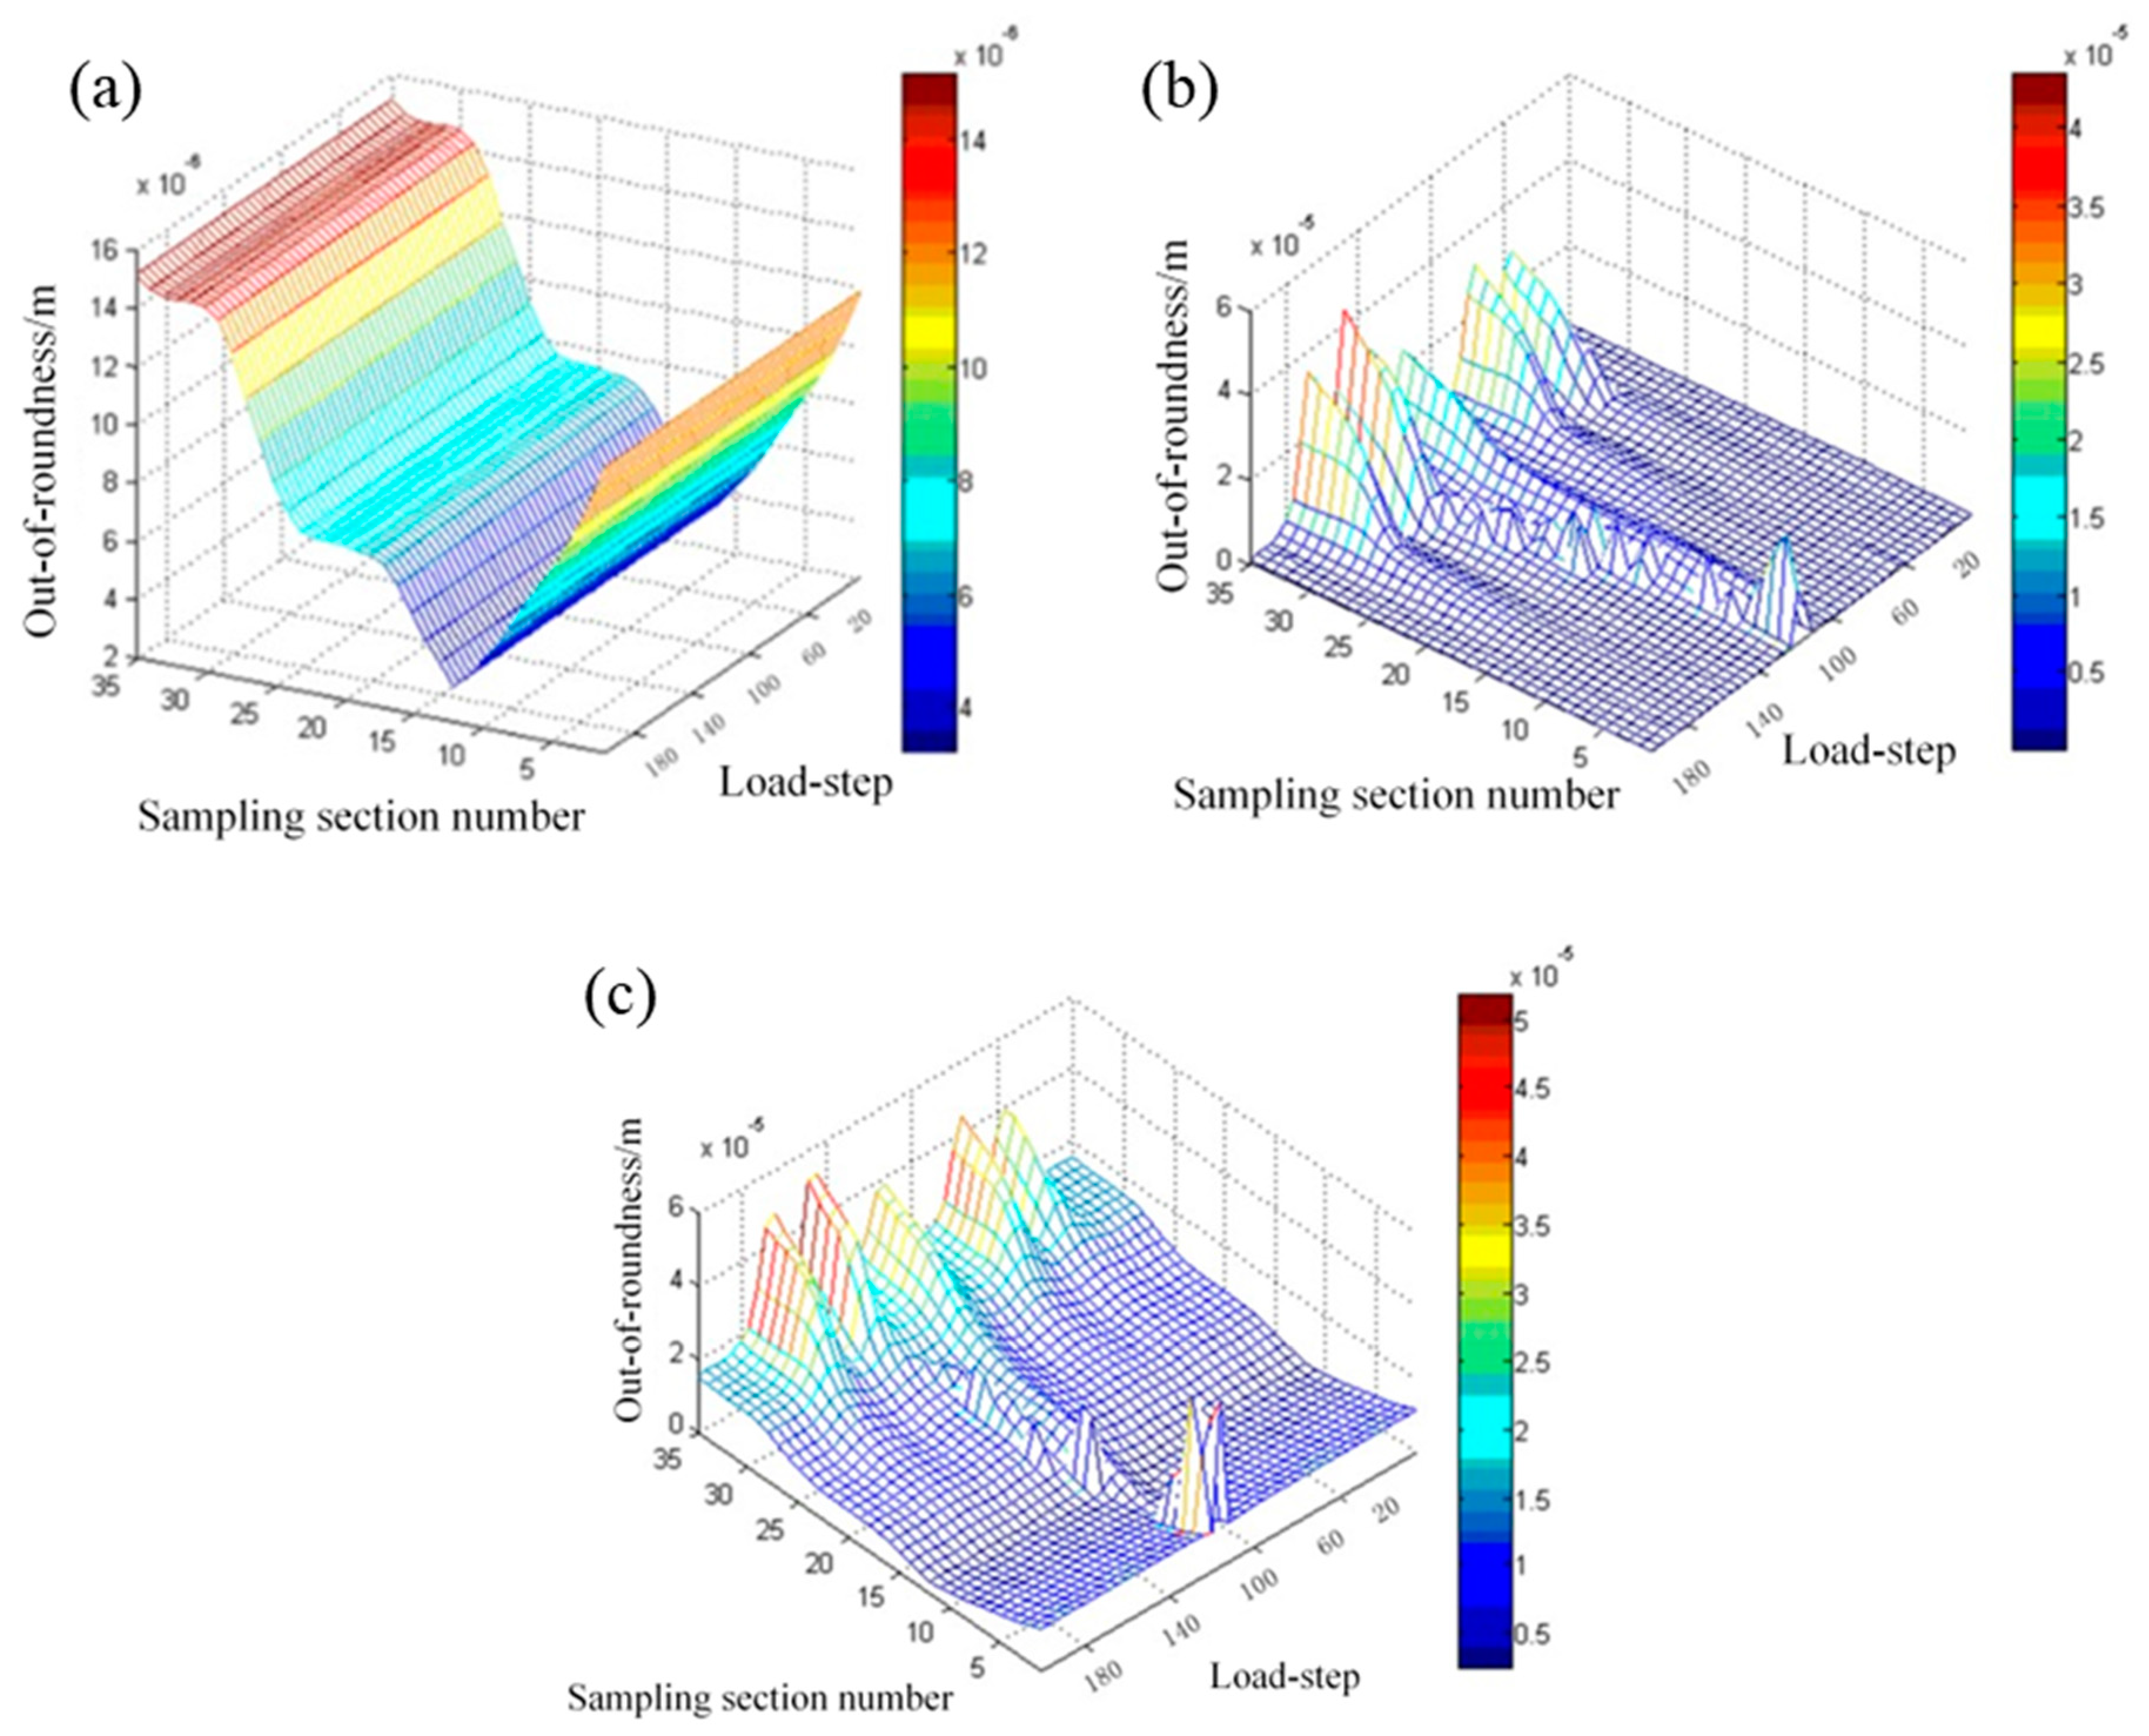
4.2. Out-of-Roundness of Cylinder Liner
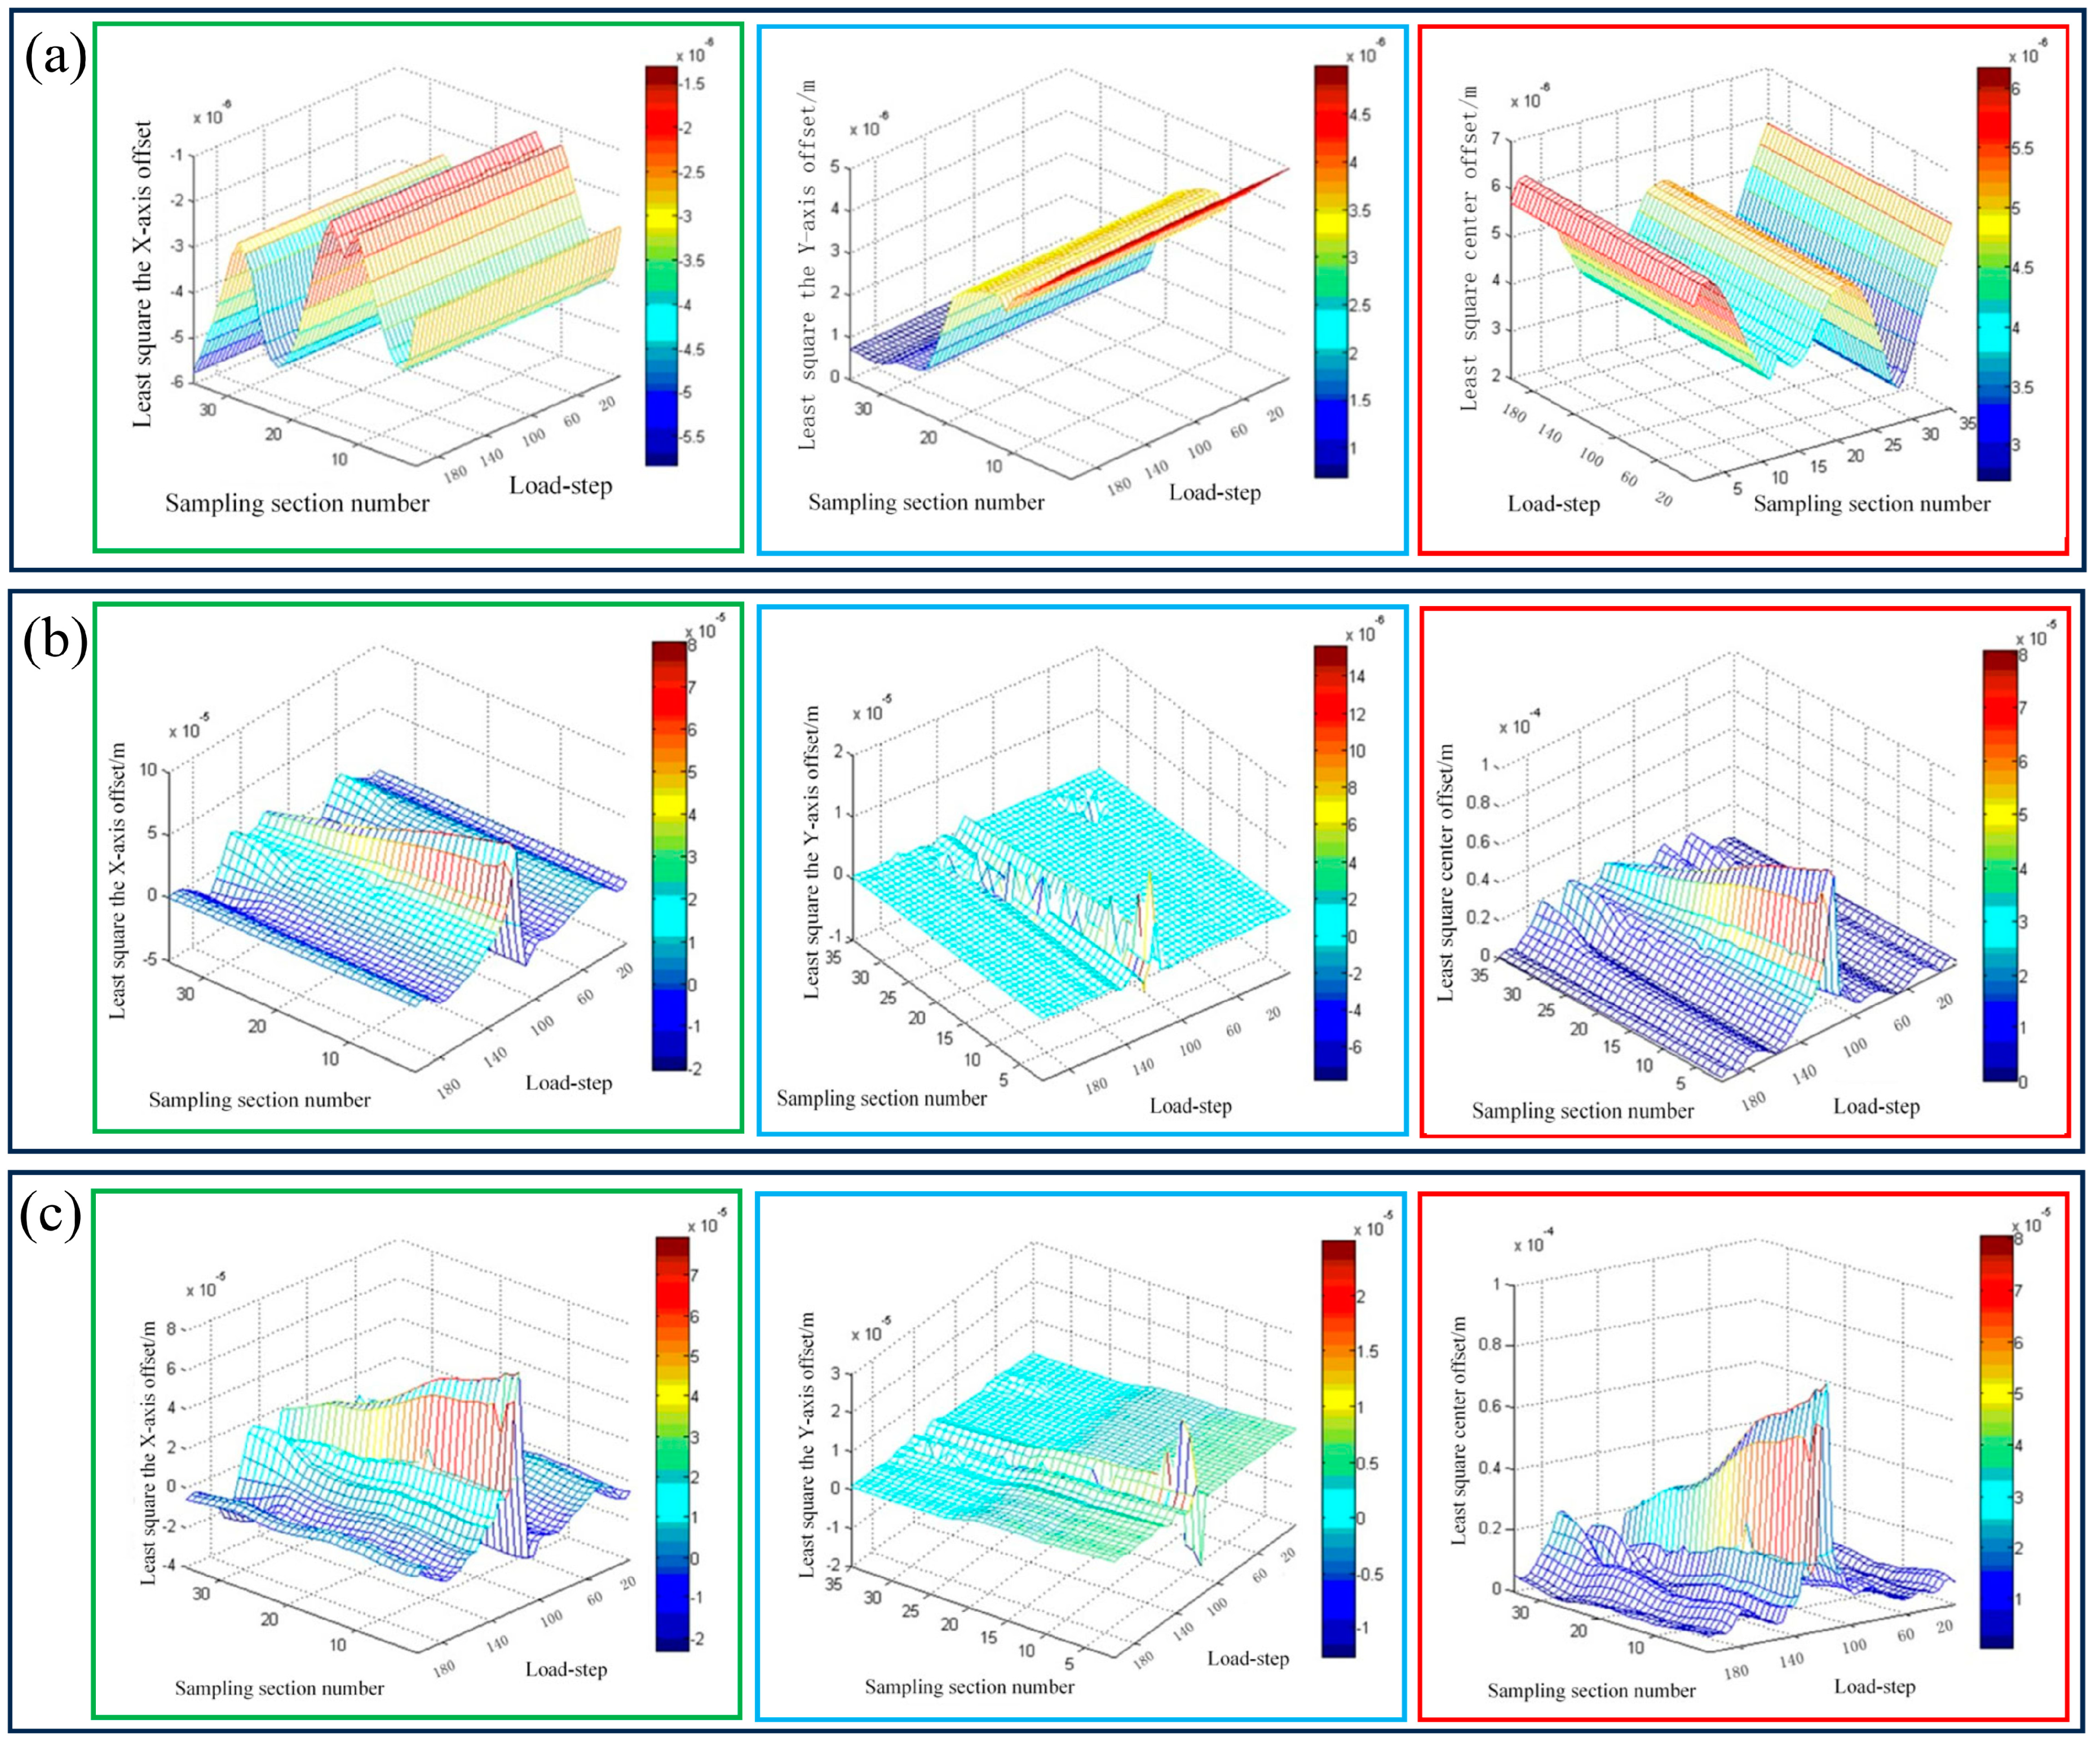
4.3. Cylinder Liner Coaxiality
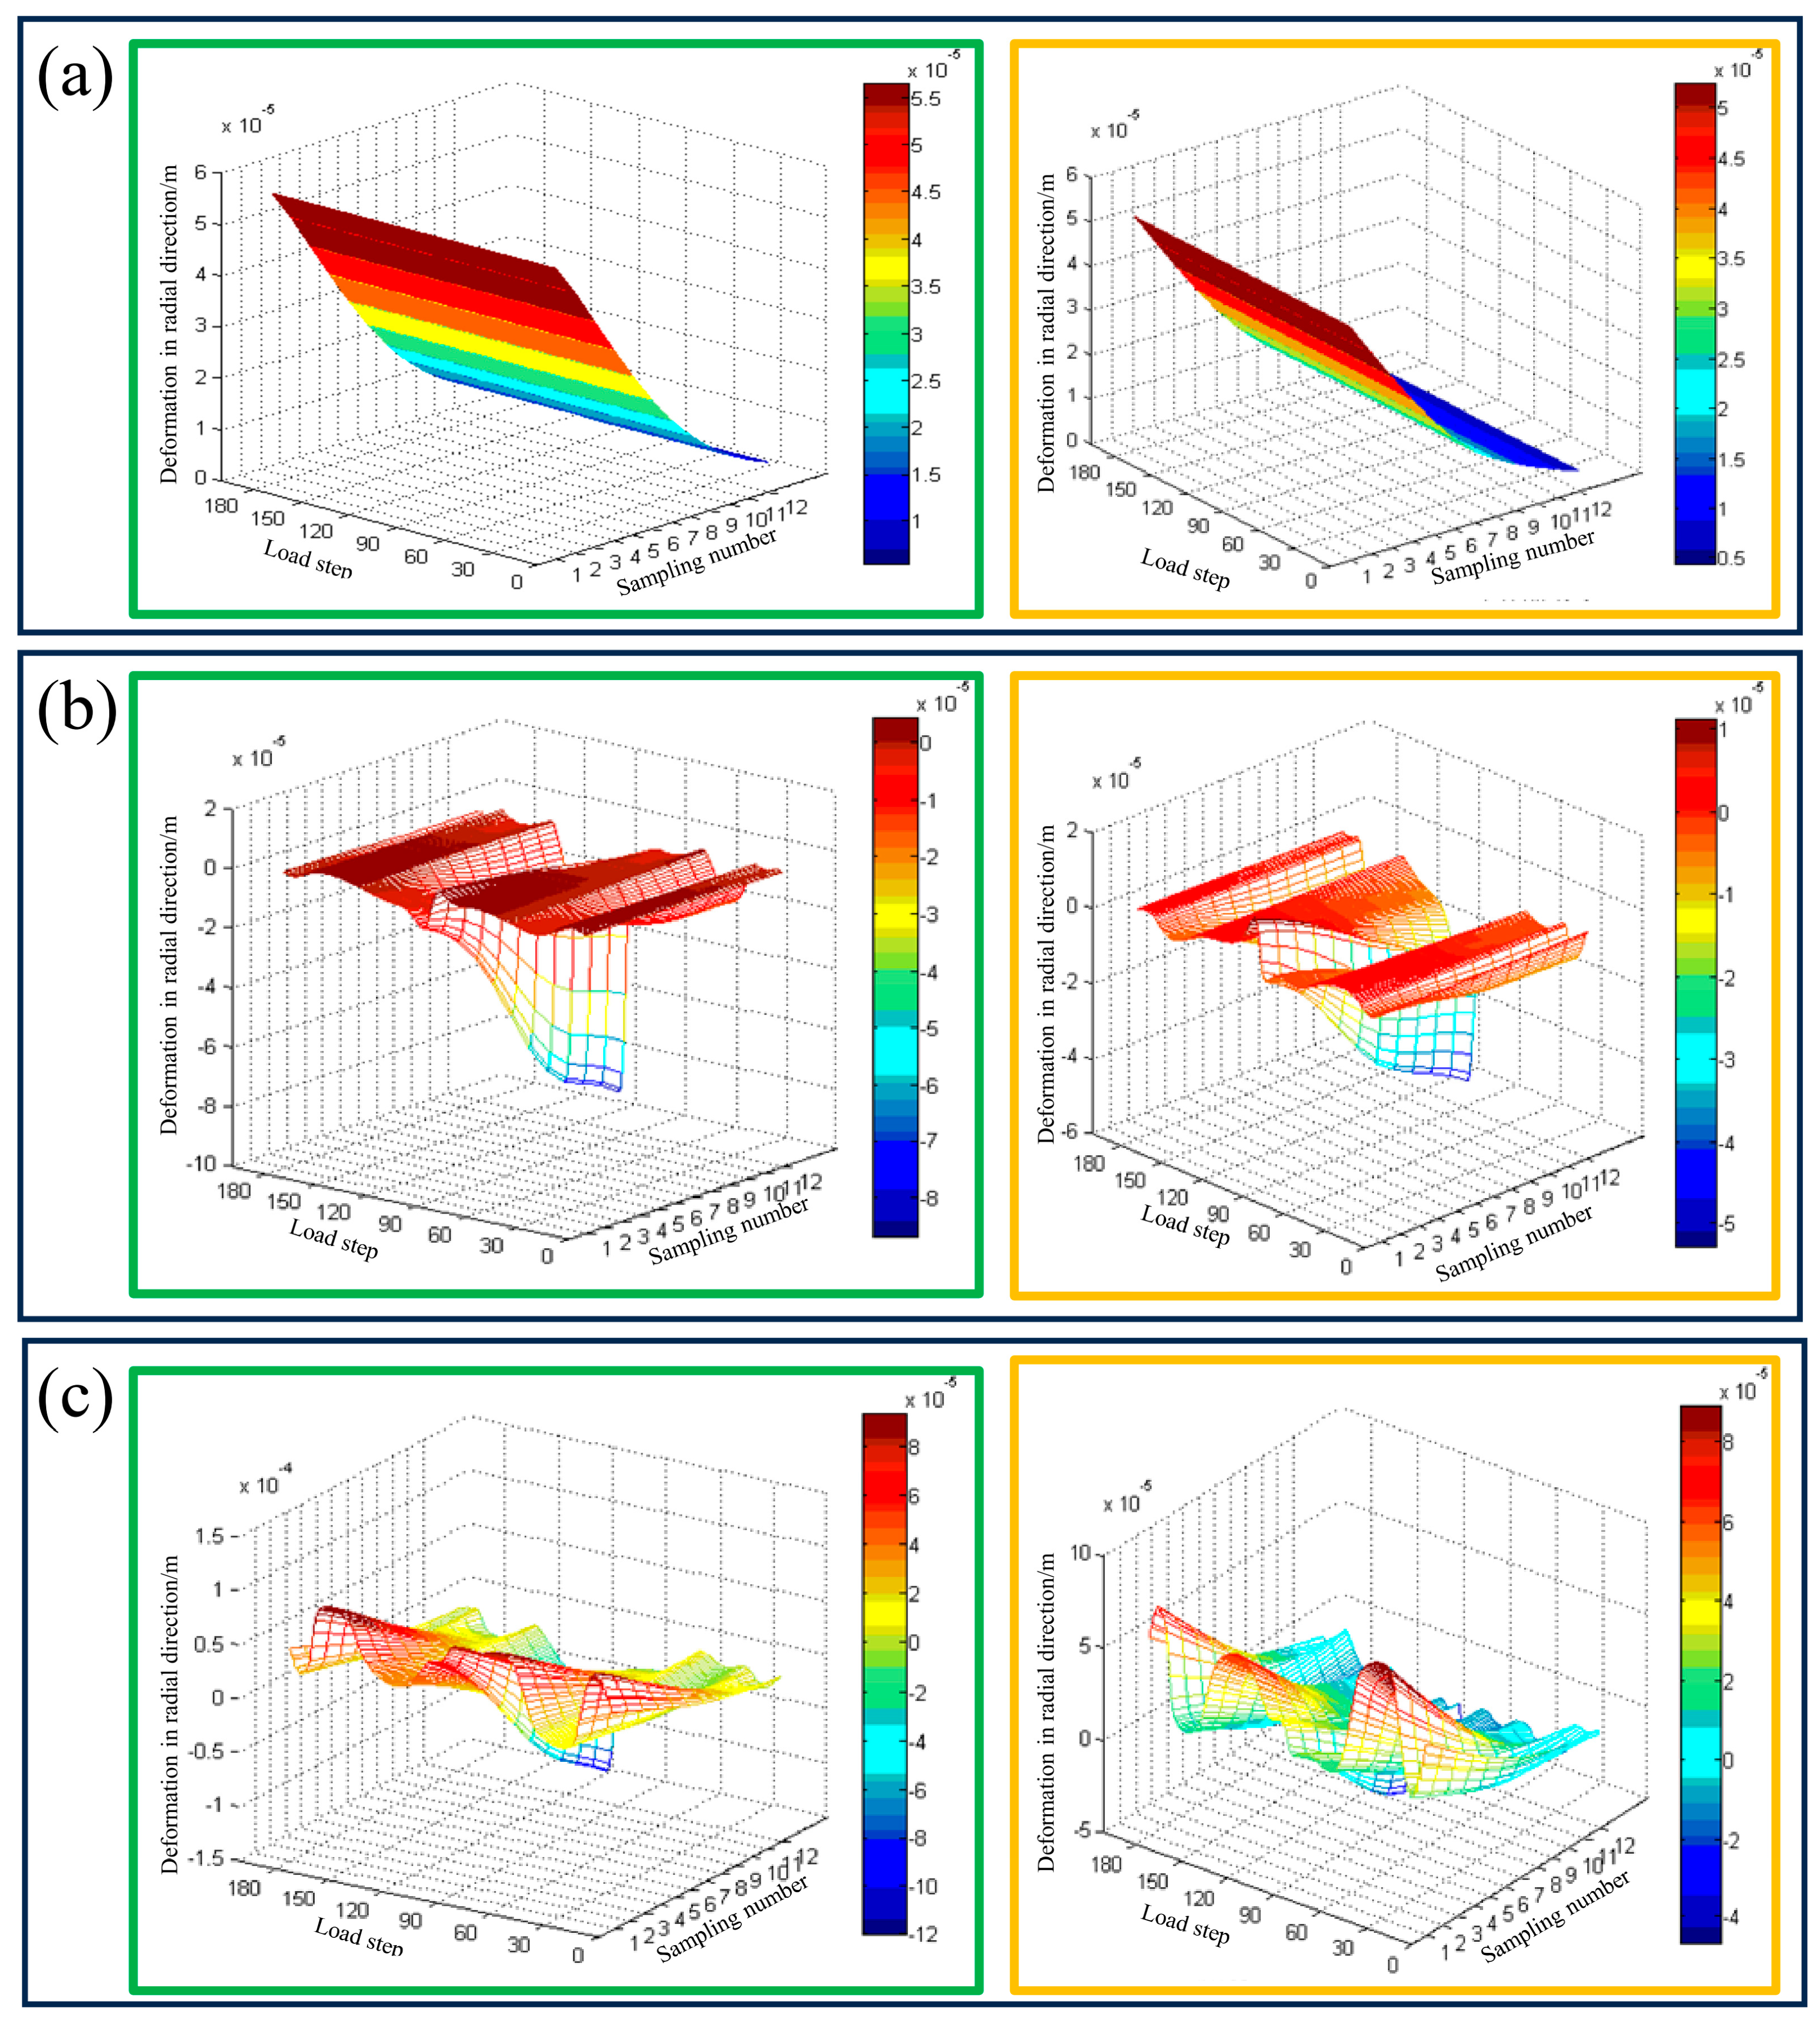
4.4. Piston Deformation Behavior
5. Conclusions
- (1)
- Under the action of thermal load, the out-of-roundness of each sampling section did not change significantly in the time domain, and the bottom of the cylinder liner was in a free state with a slightly higher out-of-roundness value of 15.12 μm. Under the action of mechanical load, the peak out-of-roundness appeared on the anti-thrust surface near the lower half of the cylinder liner with an out-of-roundness value of 43.40 μm, and the lateral thrust force was more likely to cause uneven deformation of the cylinder liner cross section.
- (2)
- The maximum out-of-roundness of the cylinder liner under thermo-mechanical load was 51.76 μm, which appeared at 496 °CA in the 35th sampling section; the out-of-roundness of the cylinder liner under thermo-mechanical load was greater than that under pure single load, and the deformation of each sampling section was more uneven. The distribution form of out-of-roundness under thermo-mechanical load was basically consistent with that under pure mechanical load.
- (3)
- Under the action of thermal load, each sampling section deviated toward the thrust side. The high-temperature gas acts evenly on each sampling section of the cylinder liner. The difference in offset of each sampling section was limited, and the coaxiality value is low with a maximum coaxiality of 6.17 μm. Under the action of mechanical load, the peak value of coaxiality was mainly affected by the cylinder explosion pressure. The stiffness of the anti-thrust side was lower than the thrust side, and the cylinder liner was deviated to the anti-thrust side as a whole with a maximum coaxiality of 80.49 μm.
- (4)
- The maximum coaxiality of the cylinder liner under thermo-mechanical load was 80.22 μm, which appears at 380 °CA. The coaxiality was similar to that under a pure single mechanical load. The distribution of the least squares center surface and the coaxiality curve was basically the same as that under pure mechanical load. The mechanical load accounts for the dominant influence on the cylinder liner coaxiality status.
- (5)
- Under pure thermal load, the radial deformation on both sides showed a decreasing trend from the top to the bottom of the piston skirt. There was little difference in radial deformation on both sides. Under pure mechanical load, the deformation near the bottom of the skirt was the highest due to its low stiffness. Under the action of thermal load, the piston was expanded outward, while under the action of lateral thrust force, the influence of thermal and mechanical loads on the variation in piston deformation was partially offset by each other
- (6)
- In future work, the design of the shaped cylinder liner’s profile based on the deformation results in this work could be carried out to reduce the friction on the piston–cylinder liner, and the work on the effect of the cylinder liner profile on friction could also be carried out.
Author Contributions
Funding
Data Availability Statement
Conflicts of Interest
Nomenclature
| Nomenclature | Greek letters | ||
| r1 | radius of the inscribed circle | ε | convergence judgment coefficient |
| r2 | radius of the circumscribed circle | λoil | thermal conductivity of the lubricant |
| hr | heat transfer coefficient for the aimed position | δoil | the thickness of the lubricant |
| hm | the mean heat transfer coefficient in a working cycle | Abbreviations | |
| R | piston radius | FEA | Finite element analysis |
| r | distance between the aimed position and piston center | MZC | minimum zone circle method |
| qp-l | heat flux between piston group and cylinder liner | LSC | least square circle method |
| TP | piston temperature | MCC | minimum circumscribed circle method |
| Tl | the cylinder liner temperature | MIC | maximum inscribed circle method |
References
- Kaiser, M.; Morin, T. Centers, out-of-roundness measures, and mathematical programming. Comput. Ind. Eng. 1994, 26, 35–54. [Google Scholar] [CrossRef]
- Lazar, V.; Erokhin, M.; Vergazova, Y.G.; Kataev, Y.V.; Gradov, E.A. Improvement of the method of micrometry of cylinder liners. J. Phys. Conf. Ser. 2021, 1889, 042041. [Google Scholar] [CrossRef]
- Ali, S.H.R.; Mohamed, H.H.; Bedewy, M.K. Identifying cylinder liner wear using precise coordinate measurements. Int. J. Precis. Eng. Manuf. 2009, 10, 19–25. [Google Scholar] [CrossRef]
- Bulsara, M.A.; Bhatt, D.V.; Mistry, K.N. Measurement of oil film thickness between piston ring and liner using strain gauge. Ind. Lubr. Tribol. 2013, 65, 297–304. [Google Scholar] [CrossRef]
- Spencer, A.; Avan, E.Y.; Almqvist, A.; Dwyer-Joyce, R.S.; Larsson, R. An experimental and numerical investigation of frictional losses and film thickness for four cylinder liner variants for a heavy duty diesel engine. Proc. Inst. Mech. Eng. Part J J. Eng. Tribol. 2013, 227, 1319–1333. [Google Scholar] [CrossRef]
- Mishra, P.C.; Roychoudhury, A.; Banerjee, A.; Saha, N.; Das, S.R.; Das, A. Coated Piston Ring Pack and Cylinder Liner Elastodynamics in Correlation to Piston Subsystem Elastohydrodynamic: Through FEA Modelling. Lubricants 2023, 11, 192. [Google Scholar] [CrossRef]
- Menacer, B.; Narayan, S.; Mahroogi, F.O. Studying hydrodynamic friction in the oil ring/cylinder liner contact of an internal combustion engine. Cogent Eng. 2023, 10, 2289261. [Google Scholar] [CrossRef]
- Li, T.; Wu, J.; Ge, C.; Wang, L.; Yu, Y.; Ma, X.; Qiao, Z.; Tang, H. Molecular dynamics investigation on micro-friction behavior of cylinder liner-piston ring assembly. Tribol. Lett. 2023, 71, 78. [Google Scholar] [CrossRef]
- Hei, D.; Zheng, M.; Liu, C.; Jiang, L.; Zhang, Y.; Zhao, X. Study on the frictional properties of the top ring-liner conjunction for different-viscosity lubricant. Adv. Mech. Eng. 2023, 15, 1–13. [Google Scholar] [CrossRef]
- Gao, T.; Chen, H.; Tang, D.; Wang, Y. Inspired by Earthworms and Leeches: The Effects of Cylindrical Pit Arrays on the Performance of Piston-Cylinder Liner Friction Pairs. Appl. Sci. 2023, 13, 11580. [Google Scholar] [CrossRef]
- Liu, N.; Wang, C.; Xia, Q.; Gao, Y.; Liu, P. Simulation on the effect of cylinder liner and piston ring surface roughness on friction performance. Mech. Ind. 2022, 23, 8. [Google Scholar] [CrossRef]
- Chen, T.; Wang, L.; Xu, J.; Gao, T.; Qin, X.; Yang, X.; Cong, Q.; Jin, J.; Liu, C. Effect of Groove Texture on Deformation and Sealing Performance of Engine Piston Ring. Machines 2022, 10, 1020. [Google Scholar] [CrossRef]
- Alshwawra, A.; Abo Swerih, A.; Sakhrieh, A.; Dinkelacker, F. Structural Performance of Additively Manufactured Cylinder Liner—A Numerical Study. Energies 2022, 15, 8926. [Google Scholar] [CrossRef]
- Zhu, X.; Cheng, Y.; Wang, L. Study on Deformation Characteristics of Diesel Engine Cylinder Liner under Different Influencing Factors. J. Phys. Conf. Ser. 2021, 1885, 032019. [Google Scholar] [CrossRef]
- Bi, Y.; Wang, P.; Xiang, R.; Wen, J.; Lei, J.; Shen, L.; Xin, Q. Numerical investigation on the operating characteristics of the cylinder liners of a turbocharged diesel engine. Sadhana 2021, 46, 150. [Google Scholar] [CrossRef]
- Bi, Y.; Wang, P.; Luo, L.; Wang, H.; Xin, Q.; Lei, J.; Shen, L. Analysis of out-of-round deformation of a dry cylinder liner of a non-road high-pressure common-rail diesel engine based on multi-field coupling. J. Braz. Soc. Mech. Sci. Eng. 2021, 43, 50. [Google Scholar] [CrossRef]
- Al-Baghdadi, M.A.R.S.; Ahmed, S.S.; Ghyadh, N.A. Three-dimensional CFD-solid mechanics analysis of the hydrogen internal combustion engine piston subjected to thermomechanical loads. Int. J. Renew. Energy Dev. 2023, 12, 560–568. [Google Scholar] [CrossRef]
- Rao, X.; Sheng, C.; Guo, Z.; Yuan, C. A review of online condition monitoring and maintenance strategy for cylinder liner-piston rings of diesel engines. Mech. Syst. Signal Process. 2022, 165, 108385. [Google Scholar] [CrossRef]
- Bi, Y.; Xu, Y.; Liu, S.; Chen, S.; Shen, L.; Xu, Y. Cylinder liner deformation characteristics based on fourier transform and impact on ring pack sealing and friction power. J. Braz. Soc. Mech. Sci. Eng. 2023, 45, 242. [Google Scholar] [CrossRef]
- Alshwawra, A.; Pasligh, H.; Hansen, H.; Dinkelacker, F. Increasing the roundness of deformed cylinder liner in internal combustion engines by using a non-circular liner profile. Int. J. Engine Res. 2019, 22, 1214–1221. [Google Scholar] [CrossRef]
- ISO 12181–2011; Technical Requirements for the Parameters of Products. Roundness. Part 1. Dictionary and Roundness Parameters. ISO: Geneva, Switzerland, 2011.
- Nabli, H. An overview on the simplex algorithm. Appl. Math. Comput. 2009, 210, 479–489. [Google Scholar] [CrossRef]
- Liu, B.; Aggarwal, S.K.; Zhang, S.; Tchakam, H.U.; Luo, H. Thermo-mechanical coupling strength analysis of a diesel engine piston based on finite element method. Int. J. Green Energy 2024, 21, 732–744. [Google Scholar] [CrossRef]
- Cavalli, M.; Lavacchielli, G.; Tonelli, R.; Nicoletto, G.; Riva, E. Comparison of analytical and multibody dynamic approaches in the study of a V6 engine piston. Proc. Inst. Mech. Eng. Part K J. Multi-Body Dyn. 2017, 231, 420–438. [Google Scholar] [CrossRef]
- Flores, G.K. Graded Freeform Machining of Cylinder Bores Using form Honing; SAE Technical Paper, 2015-01-1725; SAE: Warrendale, PE, USA, 2015. [Google Scholar] [CrossRef]


| Parameters | Value |
|---|---|
| Maximum power | 220 kW |
| Maximum moment | 1250 N·m |
| Number of cylinders | 6 |
| Diameter of a cylinder | 108 mm |
| Stroke | 136 mm |
| Compression ratio | 18 |
| Elastic Modulus/GPa | Poisson’s Ratio | Thermal Conductivity/W·m−1·K−1 | Density/kg·m−3 | Specific Heat Capacity/J·kg−1·K−1 | Linear Expansion Coefficient/K−1 |
|---|---|---|---|---|---|
| 125 | 0.3 | 38.7 | 7300 | 460 | 1.22 × 10⁻⁵ |
Disclaimer/Publisher’s Note: The statements, opinions and data contained in all publications are solely those of the individual author(s) and contributor(s) and not of MDPI and/or the editor(s). MDPI and/or the editor(s) disclaim responsibility for any injury to people or property resulting from any ideas, methods, instructions or products referred to in the content. |
© 2024 by the authors. Licensee MDPI, Basel, Switzerland. This article is an open access article distributed under the terms and conditions of the Creative Commons Attribution (CC BY) license (https://creativecommons.org/licenses/by/4.0/).
Share and Cite
Han, F.; Wang, H.; Wang, J.; Wang, J.; Lin, J.; Dai, H.; Zhang, J. Simulation Research on Cylinder Liner Shape and Position Tolerance under Thermo-Mechanical Load. Processes 2024, 12, 1290. https://doi.org/10.3390/pr12071290
Han F, Wang H, Wang J, Wang J, Lin J, Dai H, Zhang J. Simulation Research on Cylinder Liner Shape and Position Tolerance under Thermo-Mechanical Load. Processes. 2024; 12(7):1290. https://doi.org/10.3390/pr12071290
Chicago/Turabian StyleHan, Feng, Hui Wang, Jian Wang, Jingchao Wang, Jiewei Lin, Huwei Dai, and Junhong Zhang. 2024. "Simulation Research on Cylinder Liner Shape and Position Tolerance under Thermo-Mechanical Load" Processes 12, no. 7: 1290. https://doi.org/10.3390/pr12071290
APA StyleHan, F., Wang, H., Wang, J., Wang, J., Lin, J., Dai, H., & Zhang, J. (2024). Simulation Research on Cylinder Liner Shape and Position Tolerance under Thermo-Mechanical Load. Processes, 12(7), 1290. https://doi.org/10.3390/pr12071290