Article

Behavior of a Mixture of Metals for Competiting Adsorption Sites of Untreated and Alkali-Treated Rice Husk

by
Ana Karen Ivanna Flores-Trujillo
1,
Asunción Guadalupe Morales-Mendoza
2 and
Refugio Rodríguez-Vázquez
1,2,*
1
Department of Biotechnology and Bioengineering, Center for Research and Advanced Studies of the National Polytechnic Institute (CINVESTAV-IPN), Instituto Politécnico Nacional Avenue, No. 2508, Zacatenco, Mexico City 07360, Mexico
2
Doctoral Program in Nanosciences and Nanotechnology, Center for Research and Advanced Studies of the National Polytechnic Institute (CINVESTAV-IPN), Instituto Politécnico Nacional Avenue, No. 2508, Zacatenco, Mexico City 07360, Mexico
*
Author to whom correspondence should be addressed.
Processes 2024, 12(7), 1299; https://doi.org/10.3390/pr12071299
Submission received: 20 May 2024 / Revised: 6 June 2024 / Accepted: 11 June 2024 / Published: 22 June 2024
(This article belongs to the Special Issue Sustainable Adsorbent Materials for Wastewater Treatment)

Abstract

:
Elements are released into water bodies, affecting the environment and human health. To address this problem, the adsorption-desorption capacity of untreated rice husk (URH) and rice husk treated with alkali (RHTA) for Cu(II), Pb(II), Fe(II), Cd(II), and Zn(II) was investigated. Analyses during the process were performed by X-ray diffraction (XRD), scanning electron microscopy, and elemental analysis by energy dispersive X-ray spectroscopy (SEM-EDS), as well as Fourier transform infrared spectroscopy (FTIR). Adsorption-desorption kinetics and isotherms were carried out. The FTIR analysis of RHTA revealed a lowering of intensity of the bonding signals (OH, C-O, CH2, CH3, SiO2, Si-OH) and loss of some signals due to the adsorbent-elements interaction. The adsorption on RHTA presented higher adsorption of Fe, followed by Pb, Zn, Cu, and Cd. Meanwhile, in URH, the adsorption was Fe > Pb > Cu > Zn and Cd. On the other hand, the desorption values for RHTA were Zn > Cd > Pb > Cu > and Fe and Zn > Cd > Cu > Pb and Fe for URH. The adsorption kinetics showed that data fit (R2 ≥ 0.89) to pseudo-second-order kinetics and Freundlich isotherms (R2 ≥ 0.84) for both ATRH and URH, indicating that the process occurs in the multilayer form and is controlled by chemisorption, where the adsorption depends on the active sites of the adsorbent surface.

1. Introduction

The deterioration of water resources can result from various processes, including climatic and geological factors, as well as anthropogenic activities, such as agricultural practices, industrial and metallurgical activities, and waste generation [1]. Consequently, industrial wastewater often contains pathogenic microorganisms, organic materials, and traces of heavy metals [2]. These contaminants can enter water bodies directly or indirectly through daily human activities, contributing to surface water pollution [3]. Among the heavy metal contaminants, zinc, nickel, iron, and copper are known to be essential for organisms proper development, although they can become harmful at concentrations exceeding those required by plants and animals [4]. In contrast, metals like lead, mercury, and cadmium are not considered essential elements for individual development and pose risks to both the environment and human health due to their tendency to bioaccumulate in the body [1,5]. Therefore, various methods have been employed to remove toxic elements from water, including adsorption-separation processes, membrane separation, flocculation-based separation using electrical and chemical agents, and separation based on oxidation state changes in sequential photocatalysis-adsorption systems. The choice of method depends on the nature of the specific contaminant of interest, and the success of contaminant removal is influenced by factors such as pH and temperature [6,7].
Most of the treatments used for the removal of these contaminants are characterized by problems in terms of installation, operation, and generation of secondary sludge, which represents another environmental problem that requires an appropriate solution for its disposal [8]. However, the adsorption process aims for a technology that manages to reduce and remove some toxic compounds because of its high effectiveness, simple operation and control, low energy requirements, and environmental friendliness [9,10].
Therefore, organic adsorbents that intervene in the removal of different contaminants have been evaluated, including shells, stems, bark, and seeds, which reduce the concentration of potentially toxic elements in aqueous media [11,12]. Some of the most widely used biosorbents for the removal of heavy metals include bacteria, fungi, algae, industrial wastes, and agricultural wastes [13]. Agricultural residues are obtained from plants and crops that contain minerals, such as silica [14] and rice husk. These residues are mainly composed of cellulose, lignin, hemicellulose, oils, starch, and waxes, which is why they have a wide variety of functional groups [15], are considered low-cost, eco-friendly adsorbents [16], and have a high percentage of organic matter.
Likewise, it has been sought to potentiate the adsorbent capacity of the materials through the implementation of alkaline treatments using sodium hydroxide (NaOH), because they are effective, common, and easy to process for agro-industrial fibers, as they allow the reorganization and exposure of materials and functional groups in the adsorbent, thereby improving the adsorption process [17,18,19]. Cellulose is a component that can be chemically modified for the removal of different contaminants, such as organic dyes and metal ions [16]. This chemical modification contributes to a greater adsorption capacity because cellulosic adsorbents have a high sorption capacity owing to the availability of active hydroxyl groups, which is why, when chemically or physically modified, their efficiency improves [20].
Some examples of heavy metal adsorption using biomass functionalized, is one study where the authors treated flamboyant pods with citric acid for the adsorption of metals such as Cd2+, Ni2+, Zn2+, and Cu2+, showing that the carboxylic and phenolic functionalities of the adsorbent were relevant to make the removal of heavy metals more effective, in addition to indicating variations in the adsorption capacity of up to 0.20 mmol/g when removing the elements [21]. Another example of this type of study is a work where they used two solutions to dope the surface of the oil tea camellia shells to improve functional groups that contained O, where more C=C groups were introduced, improving its adsorption properties since the doped materials showed O functional groups in which Pb2+ and Cd2+ joined in a higher percentage, although the latter did so in a lower percentage [22]. On the other hand, a study was carried out using graphene oxide shows how this material has a promising advantage over others by having a large number of oxygen functional groups on its surface; in the study, NaOH and H2SO4 were used as pretreatments for the adsorption of methylene blue, congo red, and Cd2+, where the material presented a more porous surface because a higher percentage of oxygen was present on its monolayer structure, where in turn, functional groups such as hydroxyl, alkoxy, and carboxyl allowed the adsorption of these contaminants [23]. A final study is that in which coffee husks were used to remove Cd2+ and Pb2+ from wastewater. In this case, the shell was modified with NaOH and used in the form of biochar, where the results showed an increase that is comparable to conventional biosorbents, observing an elimination of 89.6% of Pb2+ and 81.5% of Cd2+, which is attributed to the creation or display of function,al groups and an increase in specific surface area [24].
There are sites that have a large amount of contamination by these potentially toxic elements (PTE) in water and sediments. Proof of this are some research works listed in Table 1.
For this reason, in this study, the adsorption capacity of rice husk was evaluated with and without alkali-treatment to remove metals such as Cu(II), Pb(II), Fe(II), Cd(II), and Zn(II) from water. This biosorbent was selected because it is an agro-industrial residue that is produced in large quantities and discarded without any other use; however, it could be implemented as an efficient and low-cost solution to remove the afore mentioned contaminants in water containing high concentrations of these PTEs.

2. Materials and Methods

2.1. Biosorbent

Rice husk was used, considered an agro-industrial residue. Rice is the second-most consumed food in the world, and its global production has oscillated between 471 million tons, with an average per capita consumption of 57 kg/year [31]. This residue has a high silica content, which varies between 5 and 30% depending on the rice species and the geographical area where it is located [14,32]. This percentage is between 80 and 95 of the total composition of the ashes [33]. In addition, it is composed of cellulose, hemicellulose, lignin, and crude protein, components that have been reported to contain organic and inorganic substances that make this residue chemically stable and have high mechanical resistance [34,35,36].
Because of its composition, rice husk can be used in three ways: for the production of chemicals, the production of compounds with a high silica content, and the production of energy and other products such as adsorbents through pyrolysis [35]. These are the reasons why this biosorbent is used for the removal of various metals and dyes [37].

2.2. Reactives

Solutions of Cu(II), Pb(II), Cd(II), Zn(II), and Fe(II) were prepared using analytical grade reagents, for which copper chloride dihydrate (CuCl2·2H2O) (Baker Analyzed, 99%) (Baker Analyzed, Mexico), ferrous sulfate heptahydrate (FeSO4·7H2O) (Reasol, 98%) (Reasol, Mexico), lead chloride (PbCl2) (Baker Analyzed, 99%) (Baker Analyzed, Mexico), cadmium nitrate tetrahydrate (Cd(NO3)2·4H2O) (Baker Analyzed, 99%) (Baker Analyzed, Mexico), zinc sulfate heptahydrate (ZnSO4·7H2O) (Analit, 99%) (Analit, Mexico), in distilled water with a pH of 5.

2.3. Biosorbent Treatment

The rice husk was treated with sodium hydroxide (NaOH). The material was left in contact with a 4% NaOH solution for 8 h. Subsequently, the excess solution was removed and stored at room temperature until use.

2.4. Rice Husk (Biosorbent) Characterization

The rice husk was characterized, including the composition of lignin, cellulose, and hemicellulose. These compounds have great relevance because they contain functional groups that can interact with metals.

2.5. Material Composition

In the characterization of the rice husk, the percentage of lignin, cellulose, holocellulose, hemicellulose, and ash was determined because these components have a large number of functional groups that intervene in the interaction between the biosorbent (rice husk rice) and heavy metals; therefore, agro-industrial residues containing a high lignin content present better heavy metal sorption properties [38]. Some of the groups that are exposed to these compounds are the hydroxyl and carboxyl groups present in hemicellulose and lignin, phenol and carbonyl groups, aliphatic structures, and methoxyl and methylene groups of lignin [39,40].

2.5.1. Lignin

The Klason Lignin was performed by the Standard of Technical Association of the Pulp & Paper Industry (TAPPI T 222), which is the residue that remains after acid hydrolysis of the treated sample. First, 1 g of the biosorbent was weighed, mixed with 15 mL of 72% H2SO4, and allowed to settle for 12 h. Subsequently, the content was transferred to a 1000 mL flask, and 560 mL of deionized water was added. The flask was connected to a refrigerant, boiled for 4 h, filtered through a filter plate, and allowed to dry at 105 °C for 24 h before being weighed. The percentage of lignin is calculated based on Equation (1).
Lignin   ( % ) = r e s i d u e   m a s s i n i t i a l   m a s s × 100

2.5.2. Holocellulose

To determine the percentage of holocellulose, 2 g of biosorbent was weighed, which was placed in a 250 mL Erlemeyer flask, and 63 mL of deionized water were added, in addition to placing 0.2 mL of CH3COOH and 0.6 g of NaClO2. The flask was heated to 80 °C in a water bath, shaken every 15 min, and the process was repeated every hour until three additions were completed. The contents were filtered, washed with deionized water, and dried at 60 °C for 24 h, after which they were weighed. The percentage of holocellulose was calculated based on Equation (2).
Holocellulose   ( % ) = r e s i d u e   m a s s   l i g n i n i n i t i a l   m a s s   l i g n i n × 100

2.5.3. Cellulose

Cellulose was determined by weighing 1 g of holocellulose in a 100 mL Erlenmeyer flask, then adding 5 mL of NaOH (17.5%), which was mixed with a glass rod. Subsequently, 2.5 mL of NaOH (17.5%) was added every 5 min until 12.5 mL was used and then kept at room temperature for 30 min. Then, 16.5 mL of deionized water was added at 20 °C to convert the NaOH from 17.5% to 8.3%, mixing well, and maintaining the mixture for one hour. Once this time had elapsed, it was filtered and washed with 50 mL of 8.3% NaOH twice, and at the end, 7.5 mL of 10% CH₃COOH was added, leaving in contact for 3 min. Subsequently, it was connected to a vacuum, washed with deionized water, dried at 105 °C for 12 h, and weighed. The percentage of cellulose was determined with Equation (3).
Cellulose   ( % ) = r e s i d u e   m a s s   h o l o c e l u l l o s e i n i t i a l   m a s s   h o l o c e l u l l o s e × 100

2.5.4. Hemicellulose

The hemicellulose content was calculated as the difference between the holocellulose and cellulose contents. This percentage is obtained by Equation (4).
Hemicellulose (%) = Holocellulose (%) − Cellulose (%)

2.6. XR Diffraction

The X-ray diffraction (XRD) spectra of the rice husk samples with and without alkali-treated were obtained with Rigaku-Smart lab equipment (Rigaku Corporation, Japan) with a copper objective at 40 kV and 100 mA. The scan was performed from 10 to 100° in increments of 0.02°.

2.7. Fourier Transform Infrared Spectroscopy (FTIR)

The functional groups present in the rice husk samples, with and without treatment, were analyzed using Fourier transform infrared spectroscopy. The spectral scan was carried out in the range of 4000–400 cm−1 with a resolution of 2 cm−1 with a Nicolet 6700 spectrometer. The data were analyzed based on the obtained signals.

2.8. Scanning Electron Microscopy and Elemental Analysis by Energy Dispersive X-ray Spectroscopy

Morphological and elemental characterization of the scales was carried out with and without alkali-treated in the absence and presence of heavy metals. The analyses were performed using scanning electron microscopy (SEM) with a JEOL JSM 7401F (JEOL, Japan). The samples were analyzed under a high vacuum at 0.5 kV. The amplification used was ×1000.

2.9. Adsorption and Desorption Experiments

To know the ability to remove metals from water using rice husk, adsorption experiments were carried out on a multi-elemental solution that contained metals such as Cu(II), Fe(II), Pb(II), Cd(II), and Zn(II). Various works have reported the great capacity of this agro-industrial residue for the removal of metals and metalloids; for this reason, different treatments were used, such as untreated rice husk (URH) and rice husk treated with alkali (RHTA). In addition to using two amounts of residue (0.5 and 1 g); therefore, the treatments used are the following: 0.5 g untreated rice husk (URH0.5); 1 g untreated rice husk (URH1); 0.5 g rice husk treated with alkali (RHTA0.5); and 1 g rice husk treated with alkali (RHTA1).
The multielement solution was prepared at pH 5, with a metal concentration of 20 mg/L, pouring 125 mL into 250 mL Erlenmeyer flasks. Subsequently, one of the afore mentioned biosorbent treatments (URP0.5, URP1, RHTA0.5, and RHTA) was placed in each flask, which was carried out in triplicate. These flasks were shaken at 120 rpm at 28 °C for 10 h.
For the desorption experiment, the biosorbent previously used in the adsorption experiment was used, which was dried and later placed in 125 mL Erlenmeyer flasks, to which a CaCl2 solution (0.5 M) was poured, to later be placed in stirring at 120 rpm for 24 h.

2.10. Adsorption Kinetics

The effect of contact time on metal adsorption was evaluated using the two treatments URH1 and RHTA1 to perform adsorption kinetics. Therefore, 180 mL of a mixture of Cu, Fe, Pb, Cd, and Zn were placed in Erlenmeyer flasks with different concentrations of 5, 10, 15, 20, 25, and 30 mg/L of each of the metals and the biosorbents of the two treatments, separately. Subsequently, it was stirred at 120 rpm, and samples were taken at 15-min intervals during the first hour, every 30 min in the second hour, and subsequently every hour for 8 h.
For this, the pseudo-first-order and pseudo-second-order models were used [41]. The linearized model equations used are shown in Equations (5) and (6).
Pseudo-first-order model
ln (qe − qt) = lnqe − K1t
Pseudo-second-order model
t q t = 1 k 1 q e 2 + 1 q e
where:
qt (mg/g) = Amount of sorbate adsorbed over time
K1 (1/h) = Equilibrium rate constant of the Pseudo-first-order model
K2 (g/mgh) = Pseudo-second-order adsorption equilibrium rate constant

2.11. Adsorption Isotherms

The adsorption isotherms allow the evaluation of the characteristics of the biosorbent, in addition to providing information on the relationship between the adsorbent and the adsorbate to maximize the use of the biosorbents, providing information about the distribution of the adsorbate molecules between the solid and liquid phases [42,43,44].
To carry out the isotherms, the URH1 and RHTA1 treatments were used, as well as 6 different concentrations of the metals Cu, Fe, Pb, Cd, and Zn (5, 10, 15, 20, 25, 30 mg/L), where they were added 180 mL of the mixed metal solution in 250 mL flasks to shake at 120 rpm at 28 °C and then take samples for 8 h; this was determined through adsorption kinetics.
Subsequently, the Langmuir and Freundlich adsorption isotherm models were used, which allowed the analysis of the adsorption data, since with them information is obtained about the favorability of the adsorption process as well as the affinity of the adsorbate for the adsorbent [43].
Langmuir and Freundlich’s isotherms are represented in Equations (7) and (8), respectively.
Langmuir isotherm
c e q e = 1 q m a x b + 1 q m a x . c e
where:
b (L/mg) = Langmuir’s constant, related to binding sites and sorption energy
q e (mg/g) = Metal adsorbed on the fibers in equilibrium
c e (mg/L) = Metal concentration in the equilibrium solution
q m a x (mg/g) = Maximum biosorption capacity
Freundlich isotherm
log q e = log k f + 1 n log C e
where:
k f (L/g) and n (dimensional) = Freundlich’s constants
Where both constants indicate the extent of biosorption, the degree of non-linearity between the concentration of the solution and biosorption [45].

2.12. Metal Analysis

The metals were analyzed with a GBC Avanta, model 2.01 atomic absorption spectrometer (EAA), (GBC, Australia). Each of the values corresponds to the average of the three replicates carried out in the experiment. The standards used for the calibration of the EAA equipment were obtained from PERKIN ELMER PURE (Perkin Elmer, U.S.A.).

2.13. Statistical Analysis

The multiple comparison of means was performed by least square differences (LSD) 223 with a significance level (α) of 0.05, using the Statgraphics Centurion XVI (16.1.03 version) (Statgraphics Technologies, Virginia, U.S.A.) statistical software, for metal analysis during adsorption and desorption experiments.

3. Results and Discussion

3.1. Biosorbent Composition

Table 2 shows the results obtained from the characterization of the rice husk, which show that this biosorbent has 28.4% lignin and a holocellulose percentage of 52.45%, of which 16.05% corresponds to hemicellulose and 36.40% to cellulose. Likewise, it was obtained that the percentage of ashes is 15.46% and that of humidity is 3.69%.
The composition of this biosorbent has been previously reported, where the reported lignin percentage ranges between 19 and 12%, which is lower than what is indicated in this work and the percentage of cellulose is between 58 and 52%, which shows an increase according to what was obtained in this investigation [46,47]; however, in other investigation, the results are comparable to what was reported in this work, since the percentage of lignin, cellulose and hemice-llulose reported for the rice husk is 25%, 32%, and 13%, respectively [48]. These differences between the components could be due to the different types of husk that come from various species of rice. However, it is important to note that the high amount of these components can improve the adsorption capacity of the biosorbent used since lignin contains aromatic groups as well as hydroxyl, methoxyl, and phenolic groups that are potential sites for interaction with cations such as heavy metals, among other contaminants [49]. It is important to note that 17.06% corresponds to ash; this is comparable to that reported by other authors [23], where they indicate that 20% of the rice husk corresponds to ash, which has been reported to contain mainly silica (>90%) and metallic impurities [36].

3.2. X-ray Diffraction (XRD)

By X-ray diffraction analysis, peaks were observed at 5, 16, 22, and 35°. The highest intensity peak was at 22°, which was observed in all samples. In Figure 1a,b, the peaks at 5 and 16° present little definition compared to the signal for these values in Figure 1c,d. The signal of the diffractograms is observed with greater noise after having carried out the interaction of the biosorbent with the multi-elemental solution. However, no substantial changes were observed, such as the appearance of new peaks or the absence of these, which could be attributed to the concentrations used. The identification of the phases in the sample allowed assigning the signals of cellulose (16°, 22°, and 35°) [50] and silica (22°) [51]; it could even be attributed to a 22° overlap, this being a reported peak for both compounds.

3.3. Fourier Transform Infrared Spectroscopy (FTIR) (XRD)

Figure 2a,b show the FTIR analysis for the shell without treatment; the signal was observed at 3400 cm−1, which has been reported for the stretching of the hydroxyl groups on the surface [52]. Likewise, the signal found at 2900 cm−1 is attributed to CH3 and CH2 coming from aliphatic compounds, and in the range of 1600–1400 cm−1, they have been reported as C-H signals coming from aromatic rings [42]. Another of the signals with the highest intensity was recorded at 1050 cm−1, which can be assigned together with the signal at 805 cm−1 to stretching vibrations for symmetrical and asymmetrical Si-O groups [53]; furthermore, these vibrations confirm the presence of silanol (Si-OH) and siloxanes groups (Si–O–Si–OH) [54,55,56]. It was also possible to observe the elongation of the signal in the range of 1500 and 1250 cm−1 in Figure 2a, concerning the control (Figure 2b). The signal at 1000 cm−1 has been attributed to the presence of C-O (stretch) groups present in ester groups [52]. However, due to the observed intensity of the peak at ~1000 cm−1, it could be due to an overlap of signals for Si-O and C-O [57].
On the other hand, in Figure 2c,d, broad bands were observed in the ranges mentioned above. Particularly in Figure 2c, signals with less definition are seen in comparison with the control (Figure 2d). It is important to point out that even though peaks were found in similar ranges in the peel with and without treatment, the addition of NaOH caused the broadening of the signals at 3500 cm−1 and in the range of 1750–1000 cm−1. The amplification or broadening of the signals or bands can be attributed to the interaction of the functional groups (-OH) with the metals in question [53]. Likewise, it has been reported that treatment with NaOH can modify the functional groups on the surface and in turn increase the ionic ligands of the carboxyl, phosphate, and amino groups that have a high electro-attractive force with ions [18]. Therefore, the FTIR analysis allowed us to observe that the rice husk with and without treatment has active sites for the adsorption of the evaluated metals.

3.4. Scanning Electron Microscopy and Elemental Analysis by Energy Dispersive X-ray Spectroscopy

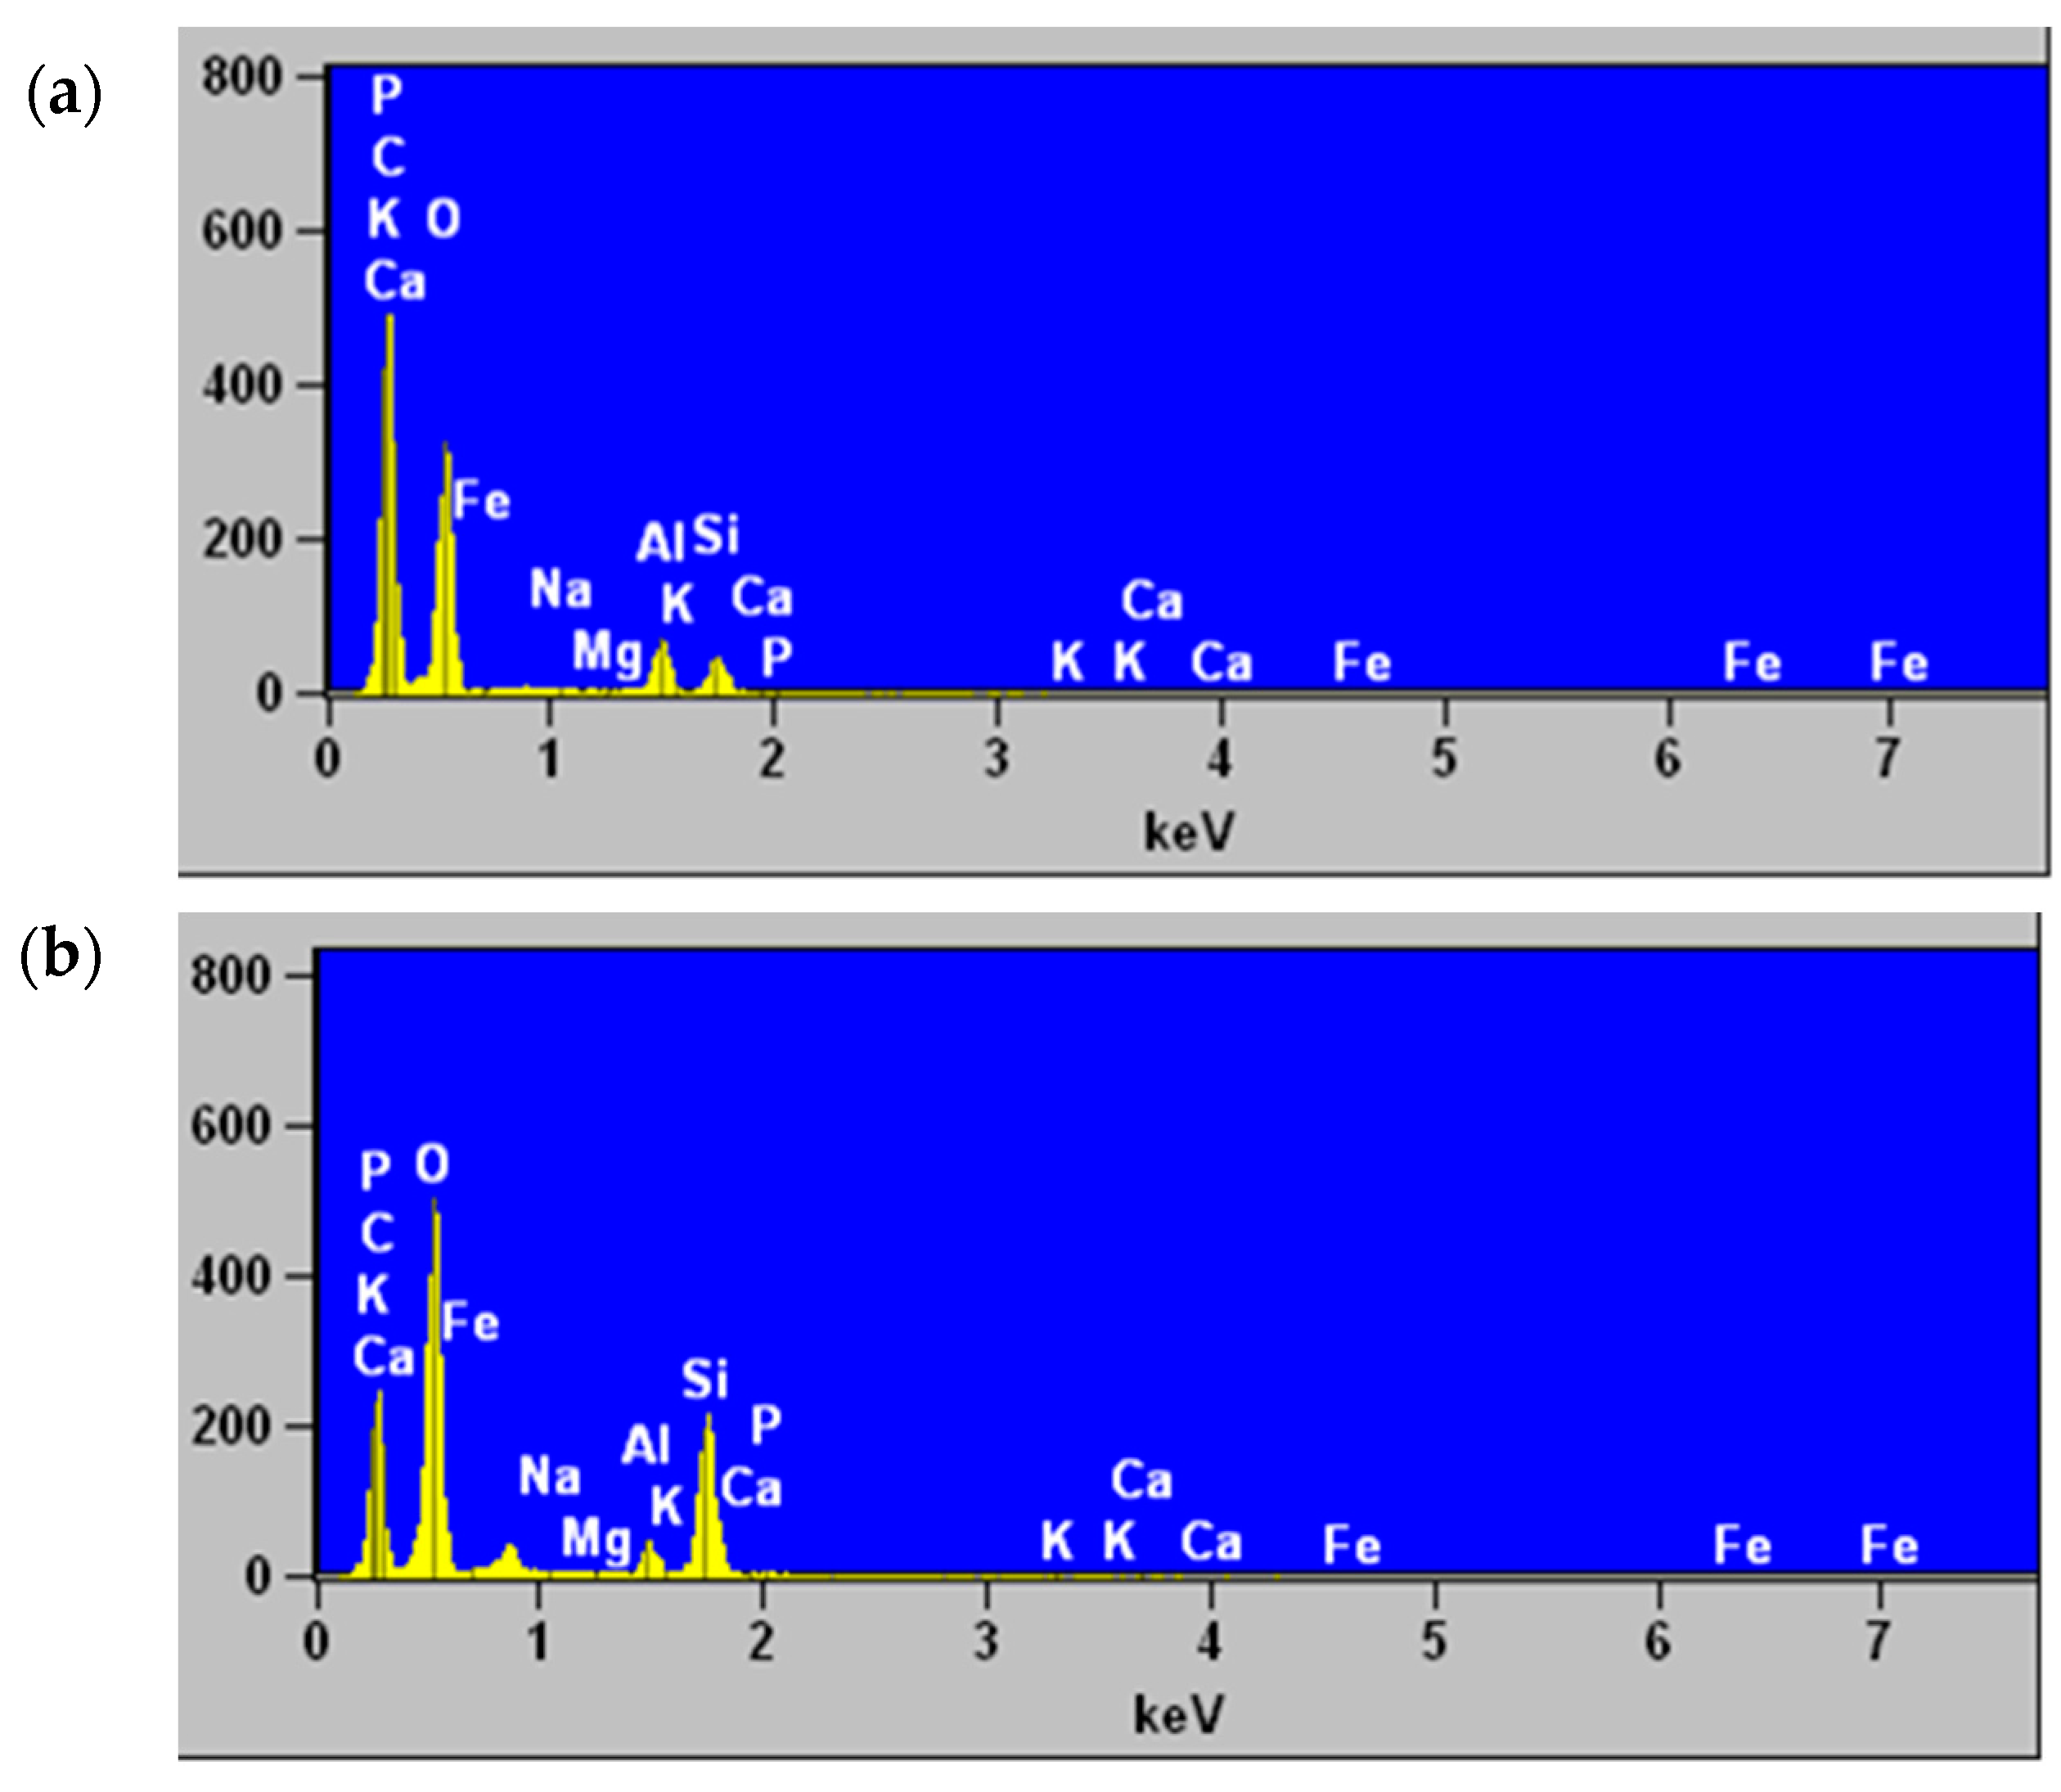
The SEM analyses allowed us to observe the morphology of the surface of the adsorbent without treatment with NaOH, before and after the adsorption process with metals. In Figure 3a, an irregular surface was observed, with apparent roughness resulting from the grooves and cracks in the material, which may favor the exposure of binding sites for metal adsorption [18]. Likewise, in Figure 3b, folds were observed, causing roughness in the area analyzed. In the elemental analysis of the adsorbents (Figure 4), the decrease in the signal of elements such as P, C, K, and Ca was observed after the adsorption process, while in elements such as Fe and O, the signal increased. Even in the shell analyzed after adsorption, the signal corresponding to Cu (Lα 0.930) was observed. The increase in Fe and Cu signals can be attributed to their affinity for the active sites present in the adsorbent.
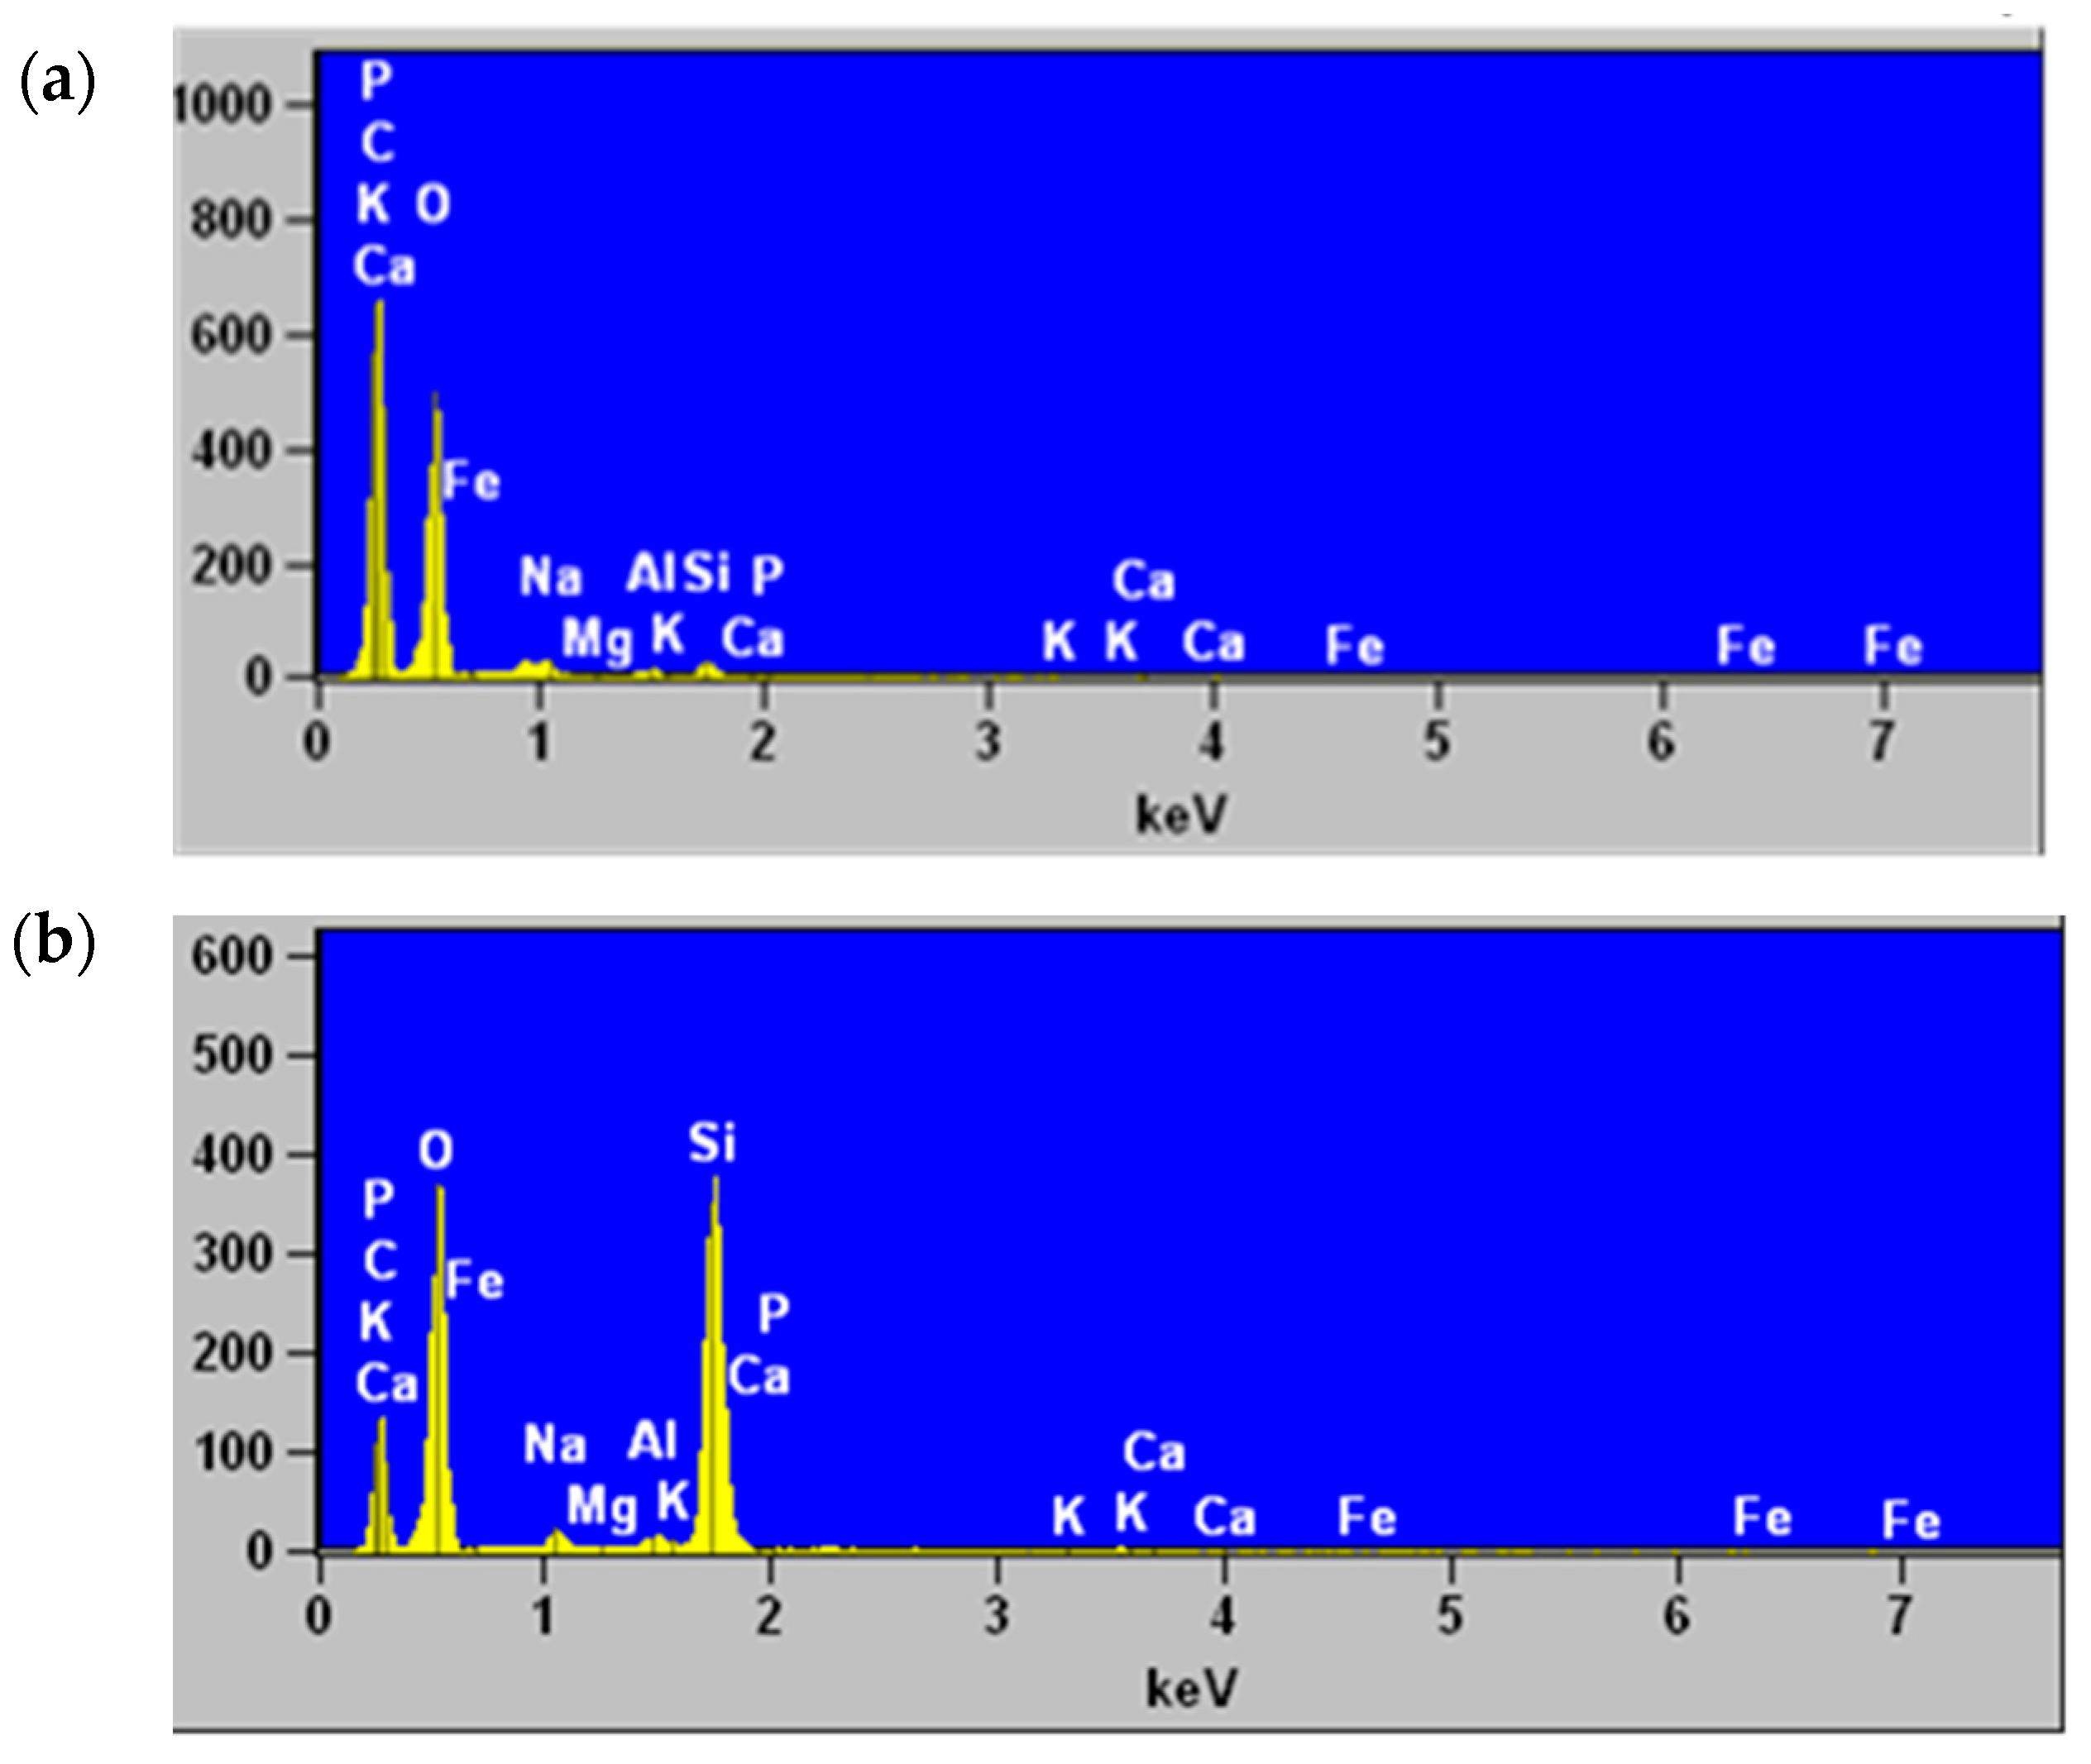
Figure 5a,b shows the morphology of the husks treated with NaOH with and without metals. These husks presented a cracked surface with apparent reliefs; even scattered lumps were observed. Likewise, in the spectra generated by the elemental analysis, the signals with the highest intensity correspond to Ca, K, C, and P (Figure 6) compared to the signals presented by the elements in the husk before contact with the metals. It can even be observed (Figure 6a) that the Si signal (Kα 1.739) is extremely intense in comparison to rice husk treated with metals (Figure 6b), which can be attributed to the treatment with NaOH, causing the overexposure of the element in the adsorbent, and bonding with elements, that caused a lowering in the intensity in the presence of the heavy metals (Figure 6b), as it happened in the FTIR analysis (Figure 2c). Likewise, signals corresponding to elements such as Cu and Fe, which were present in the multi-elemental solution, were located at lower intensity.

3.5. Adsorption and Desorption of Metals

The pretreatments that are carried out in a biosorbent are of great importance since they allow improving the adsorption capacity of the material, exposing a greater number of functional groups that may be present on the surface, and to which metal ions can bind [58]. Due to the above, in this investigation, it was decided to use a husk pretreatment with 10% NaOH to evaluate the percentage of metal removal.
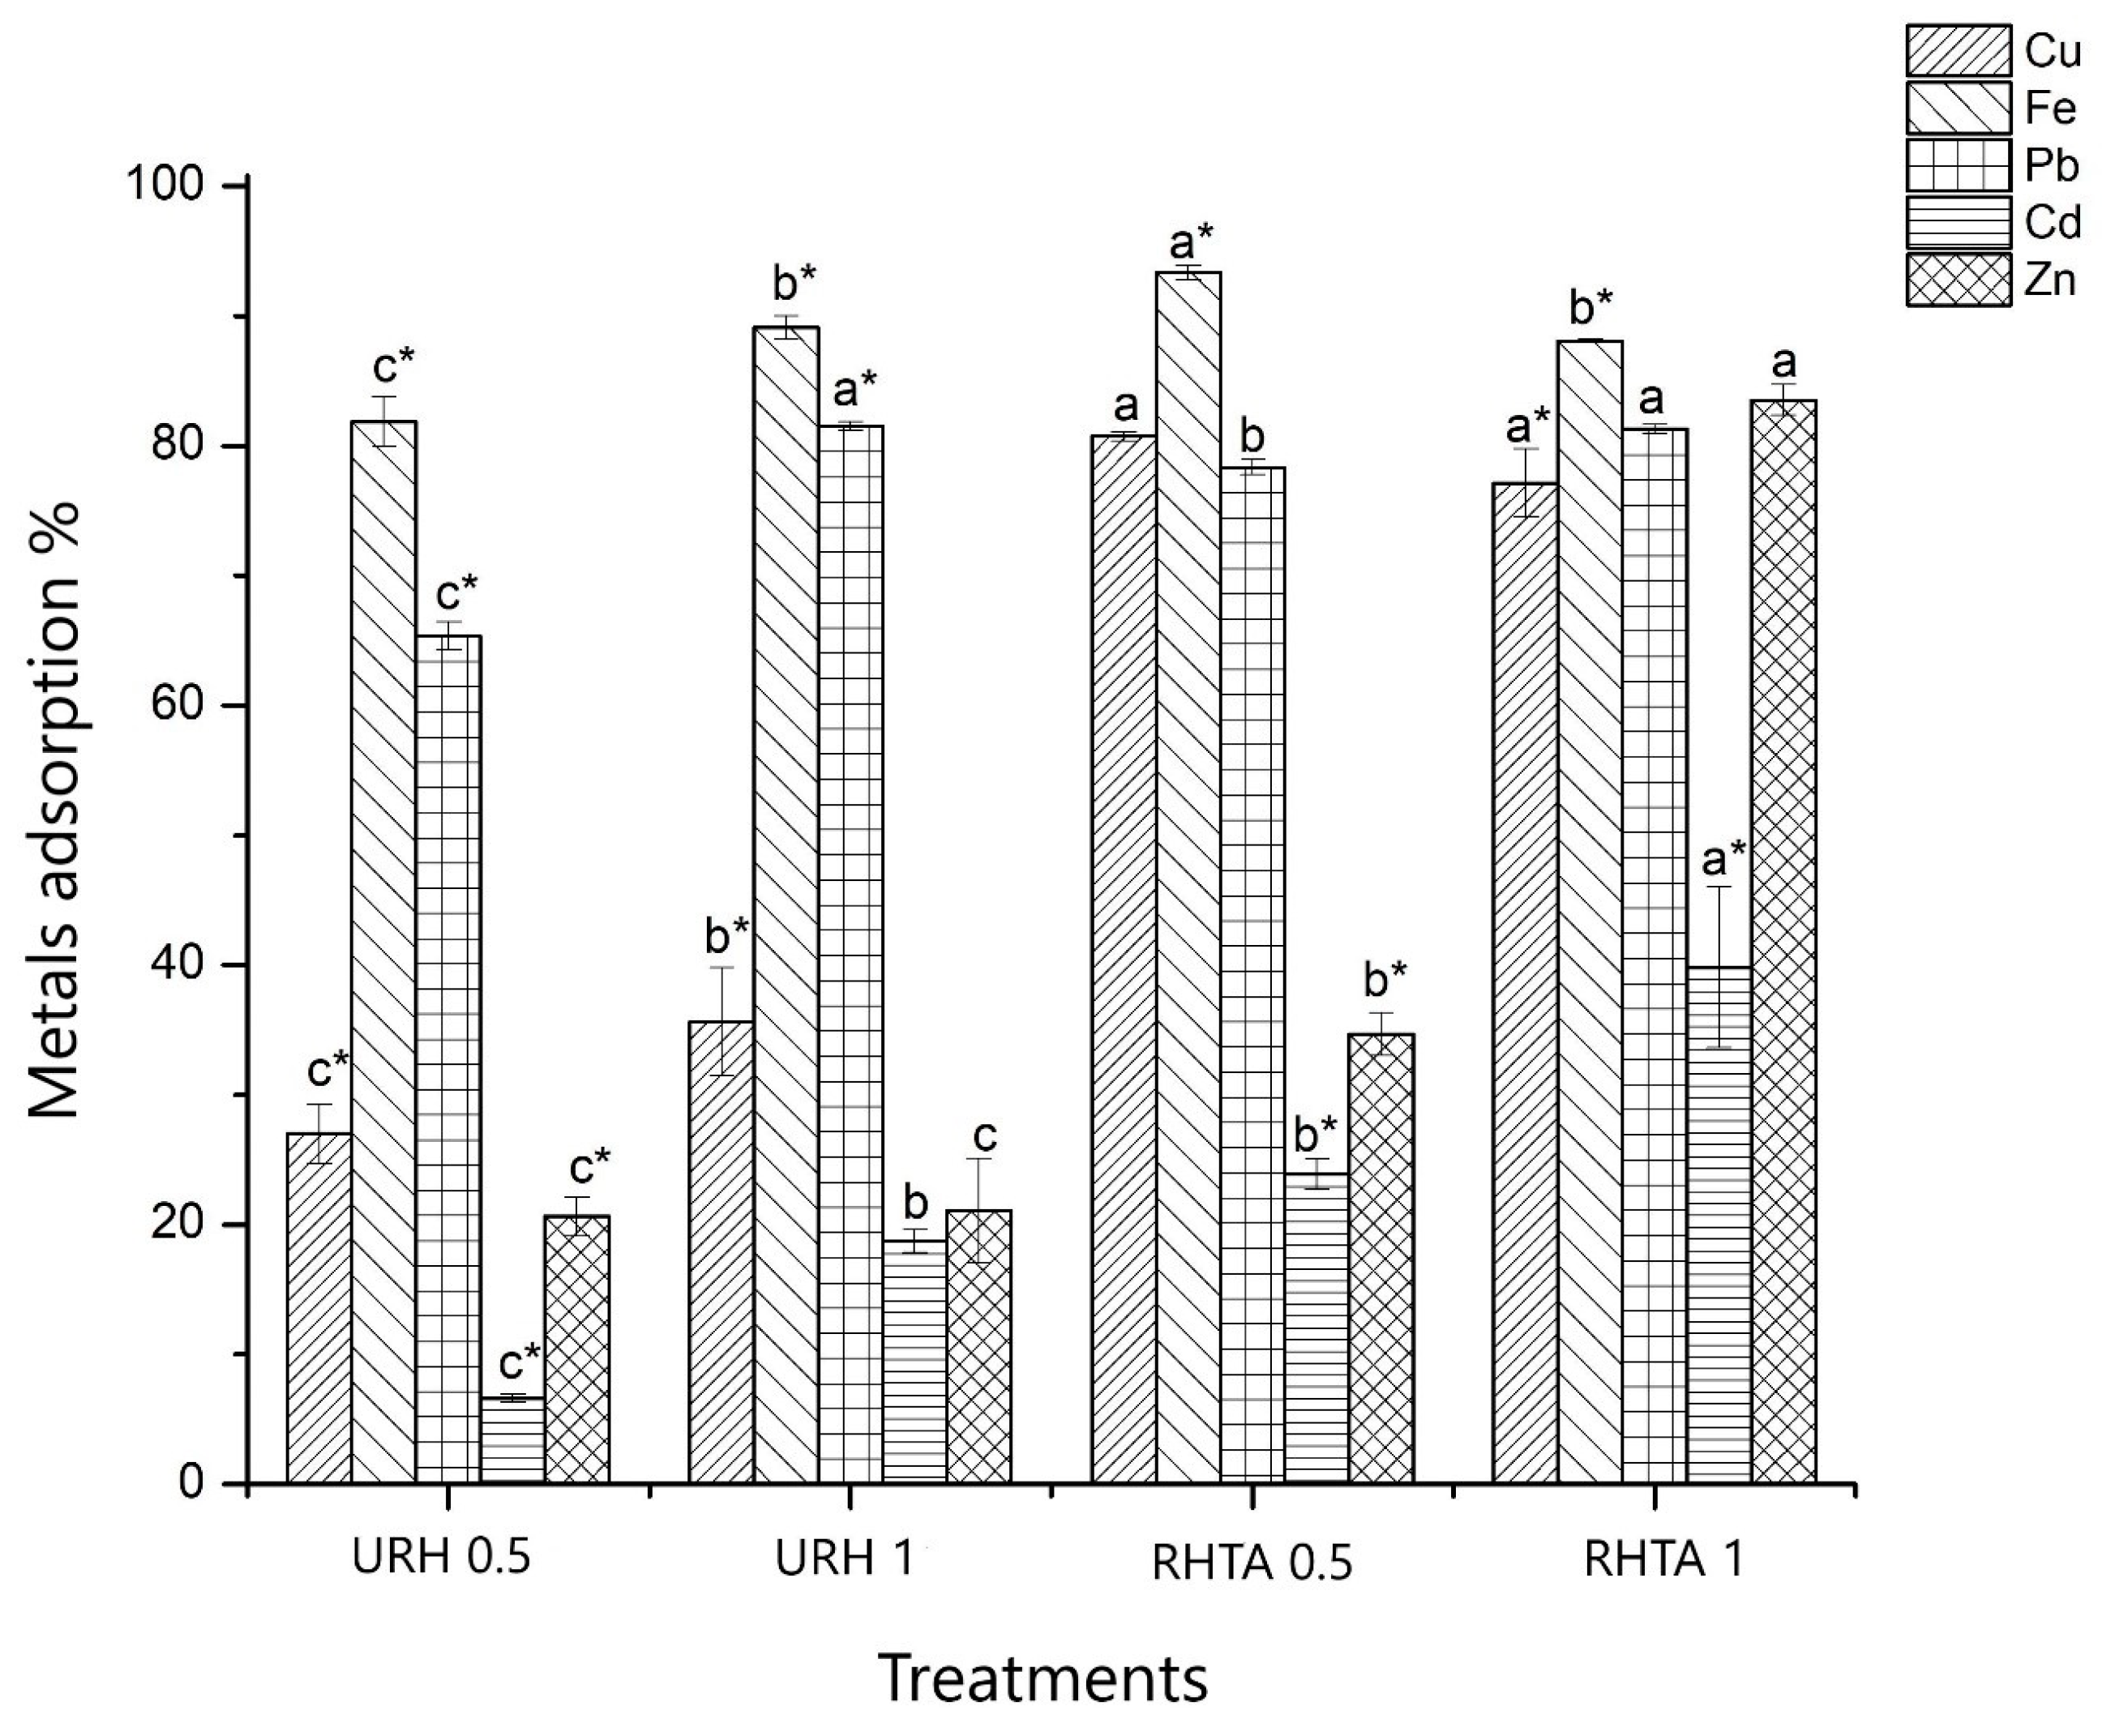
Figure 7 shows the treatments used to remove the metals: Cu(II), Fe(II), Pb(II), Cd(II), and Zn(II). The adsorbent presented higher adsorption of Fe, followed by Pb, Zn, Cu, and Cd, respectively. On the other hand, it is important to point out that the metals, when found in a mixture, are not absorbed in the same proportion since there is competition between the available sites of the rice husk, which when joining the functional groups of the biosorbent and some sites are more related to certain metal ions [59].
In addition, it can be seen that for Fe the adsorption percentages are greater than 80% in any of the treatments, a significant difference (p < 0.05) was observed, which increases to 96% adsorption in the RHTA0.5 treatment compared to the other treatments. In the case of Pb, the biosorbent obtained removal percentages greater than 60%, with the URH1, RHTA0.5, and RHTA1 treatments showing the highest efficiency in the removal of this metal (82%, 80%, and 83%, respectively). On the other hand, zinc was removed by 83% when using RHTA1, contrary to the URH0.5, URH1, and RHTA0.5 treatments, where removal percentages between 21 and 37% were obtained. The removal percentages of Pb and Zn are lower than those reported by others author, in which removals of 92.28% and 95.62% are indicated, respectively, using rice husk ash [42]; however, this was not carried out in a mixture of metals, so there was no competition in the adsorption process.
In the case of Cu, this metal was adsorbed in a higher proportion when using the fibers with the treatment with alcali (RHTA0.5, RHTA1), obtaining 80% and 78% removal; however, the URH0.5 and URH1 treatments presented 24% and 36% effectiveness regarding the elimination of this metal. In the case of Cd, minimum adsorption percentages can be seen when using the biosorbent URH, obtaining up to 20% adsorption when using URH1. However, when using RHTA1, it is observed that this percentage increased to 40%, probably as a consequence of the greater number of functional groups exposed and with which this metal can interact, since it is known that the functional groups that contain nitrogen have a strong affinity for the formation of complexes with metals, such as Cd, Cu, and Zn [60].
In addition, it is important to point out that the pH plays an important factor; therefore, in this study, the pH was 5, which favors the adsorption of these metal ions, because if the pH is increased, the surface of the biosorbent becomes in a higher positive charge that promotes a slow removal of metal ions [12].
From the above mentioned, the formation of metal complexes or chelates with functional groups of carboxyl, hydroxyl, amino, phosphate, carbonyl, and amide, among others, can be inferred [61], which, on the surface of the biosorbent, these groups can act with redox activities [56]. However, it is important to note that on the surface of the rice husk are silanol and siloxane groups [62], which present an interaction with heavy metals during their adsorption [55].
In this work, a competitive adsorption process was given since multi-element solutions contain elements with different electronegativity, ionic radius, and atomic weight. These characteristics make the ions compete for adsorption sites [54], even though they can change the adsorption behavior due to physical interactions on the surface, as it happened with the changes in the Cd adsorption behavior in the presence of Pb [63]. Likewise, it has been reported that the evaluation of adsorption in single-element solutions presents a higher adsorption percentage compared to the processes with multi-element solutions [64]. However, the evaluation of co-managed ions allows the adsorbents to be subjected to conditions, like those found in situ [65]. Since it has been reported in natural water bodies, such as rivers, lakes, and groundwater, where different ions can coexist due to the leaching process of natural deposits or in consequence of industrial and mining wastewaters, where they may also contain different ions in their composition [66].
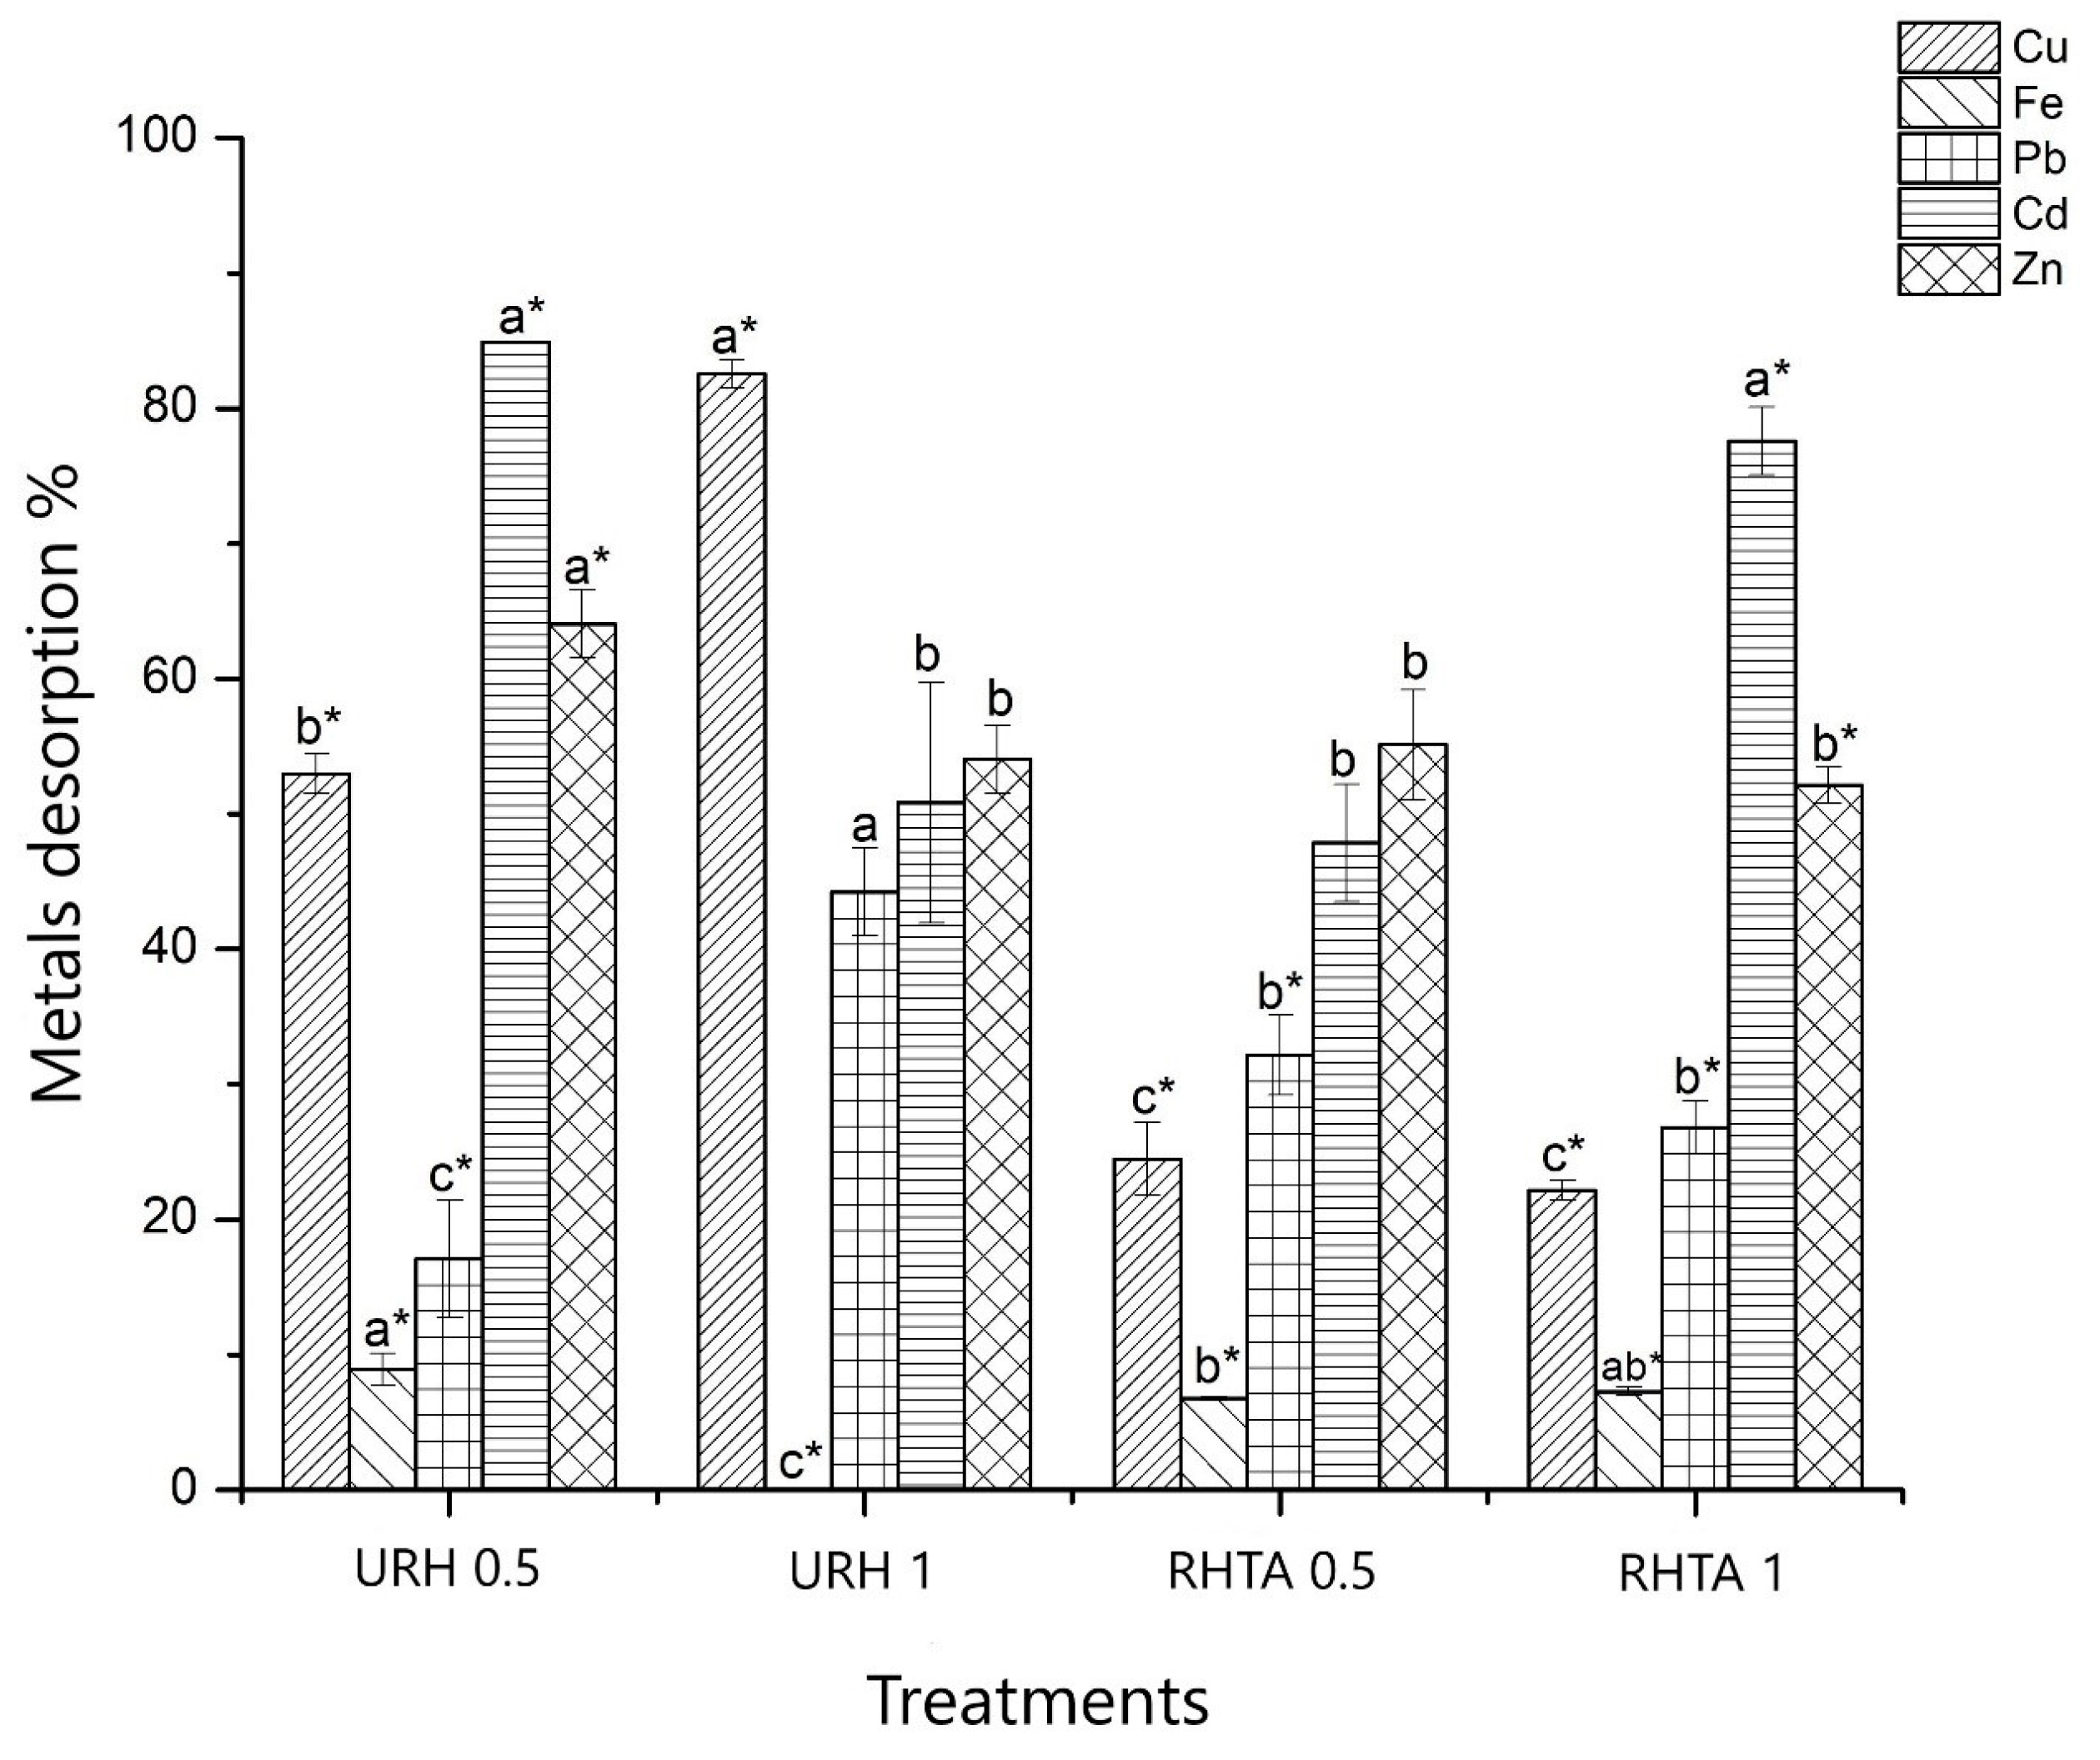
On the other hand, the desorption experiment was carried out using CaCl2 [67,68], since an excess of this element can cause the release of metal ions from the biosorbent. The desorption percentage in this experiment was calculated based on the metal adsorbed during the previous experiment. Figure 8 shows the percentages of metal desorption in the different treatments used. It can be seen that the metal that is desorbed in the highest proportion is Cd, followed by Zn, Cu, Pb, and Fe.
In the case of Fe, it is shown that the desorption percentages are less than 10%, whereas the URH1 treatment was the one that presented a lower desorption percentage (0.5%) concerning the other treatments. The opposite was observed with Pb, where the URH1 treatment was the one that desorbed in a higher proportion (42%); however, the URH0.5, RHTA0.5, and RHTA1 treatments show desorption of 18%, 32%, and 28%, respectively.
Copper, for its part, presented greater desorption in the URH0.5 (52%) and URH1 (83%) treatments, while in the biosorbents with the pretreatment the desorption decreased, since in RHTA0.5 the desorbed percentage was 28% and RHTA1 was 24%. The percentage desorbed in zinc ranged between 53 and 63%, being URH1, RHTA0.5, and RHTA1 being those that presented a lower release of the metal. However, Cd showed significant desorption concerning the other metals in all the treatments used, achieving desorption percentages of 50–83%.

3.6. Adsorption Isotherms and Kinetics Adsorption

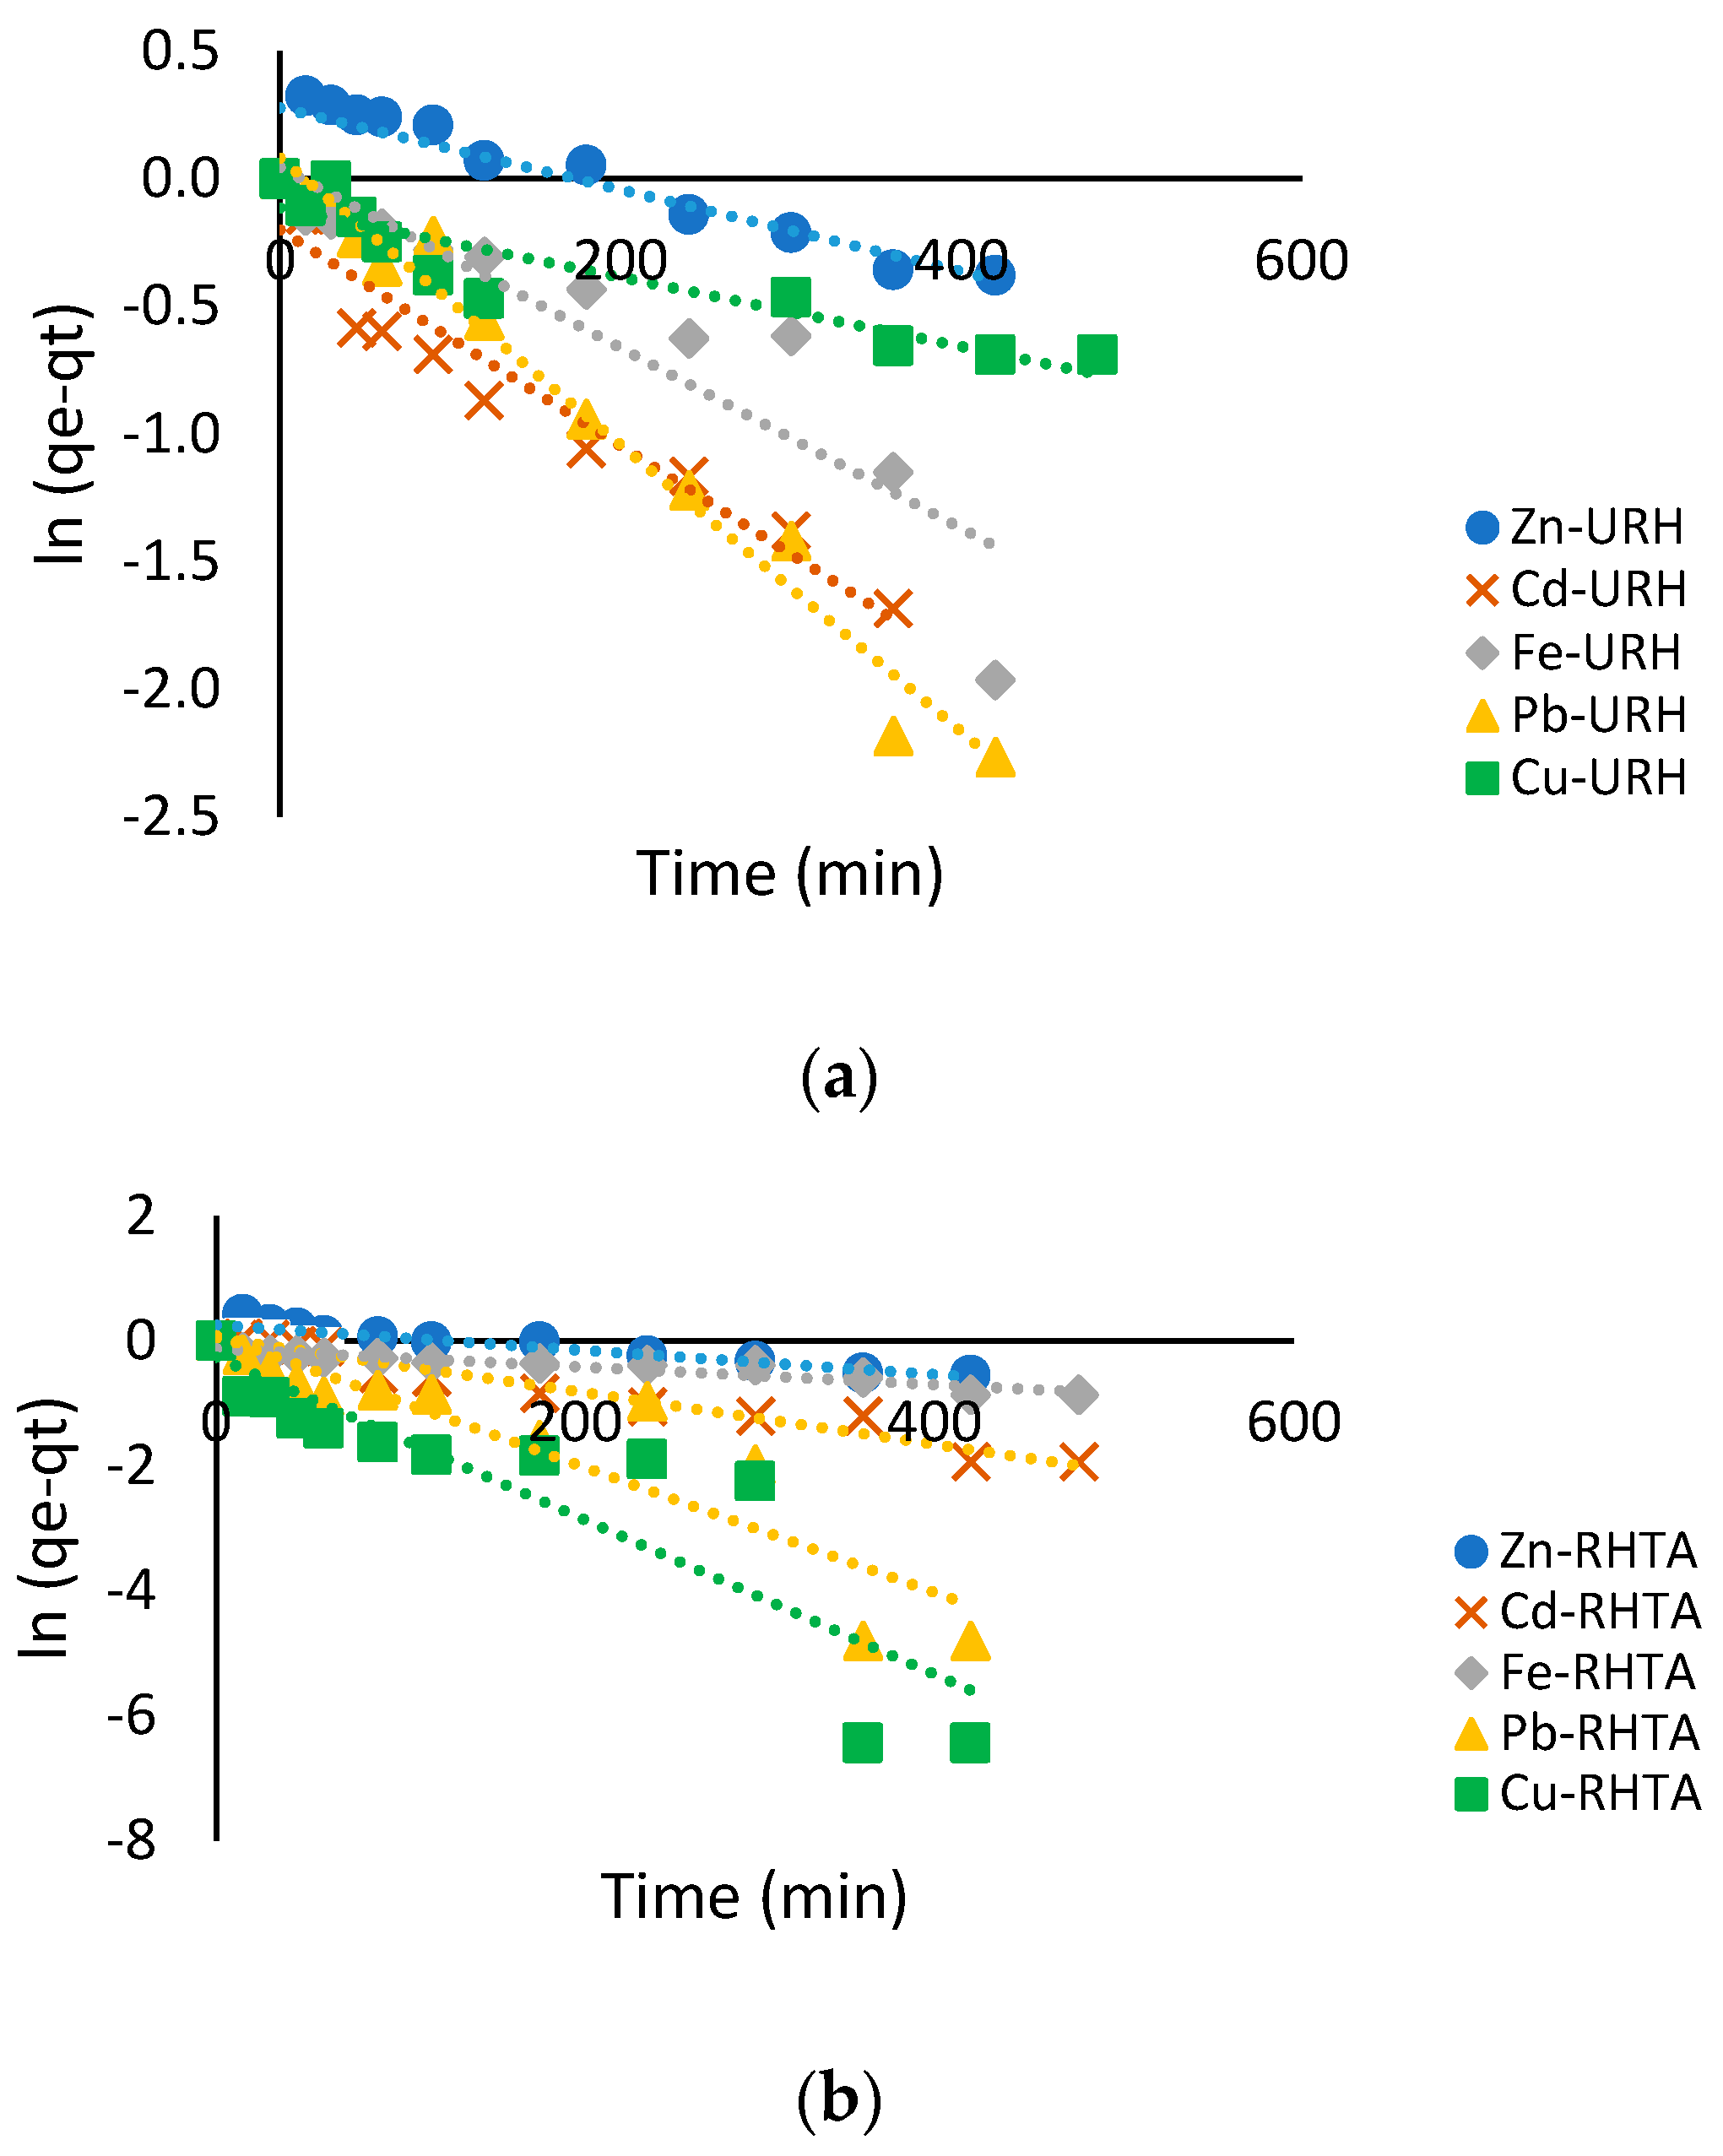
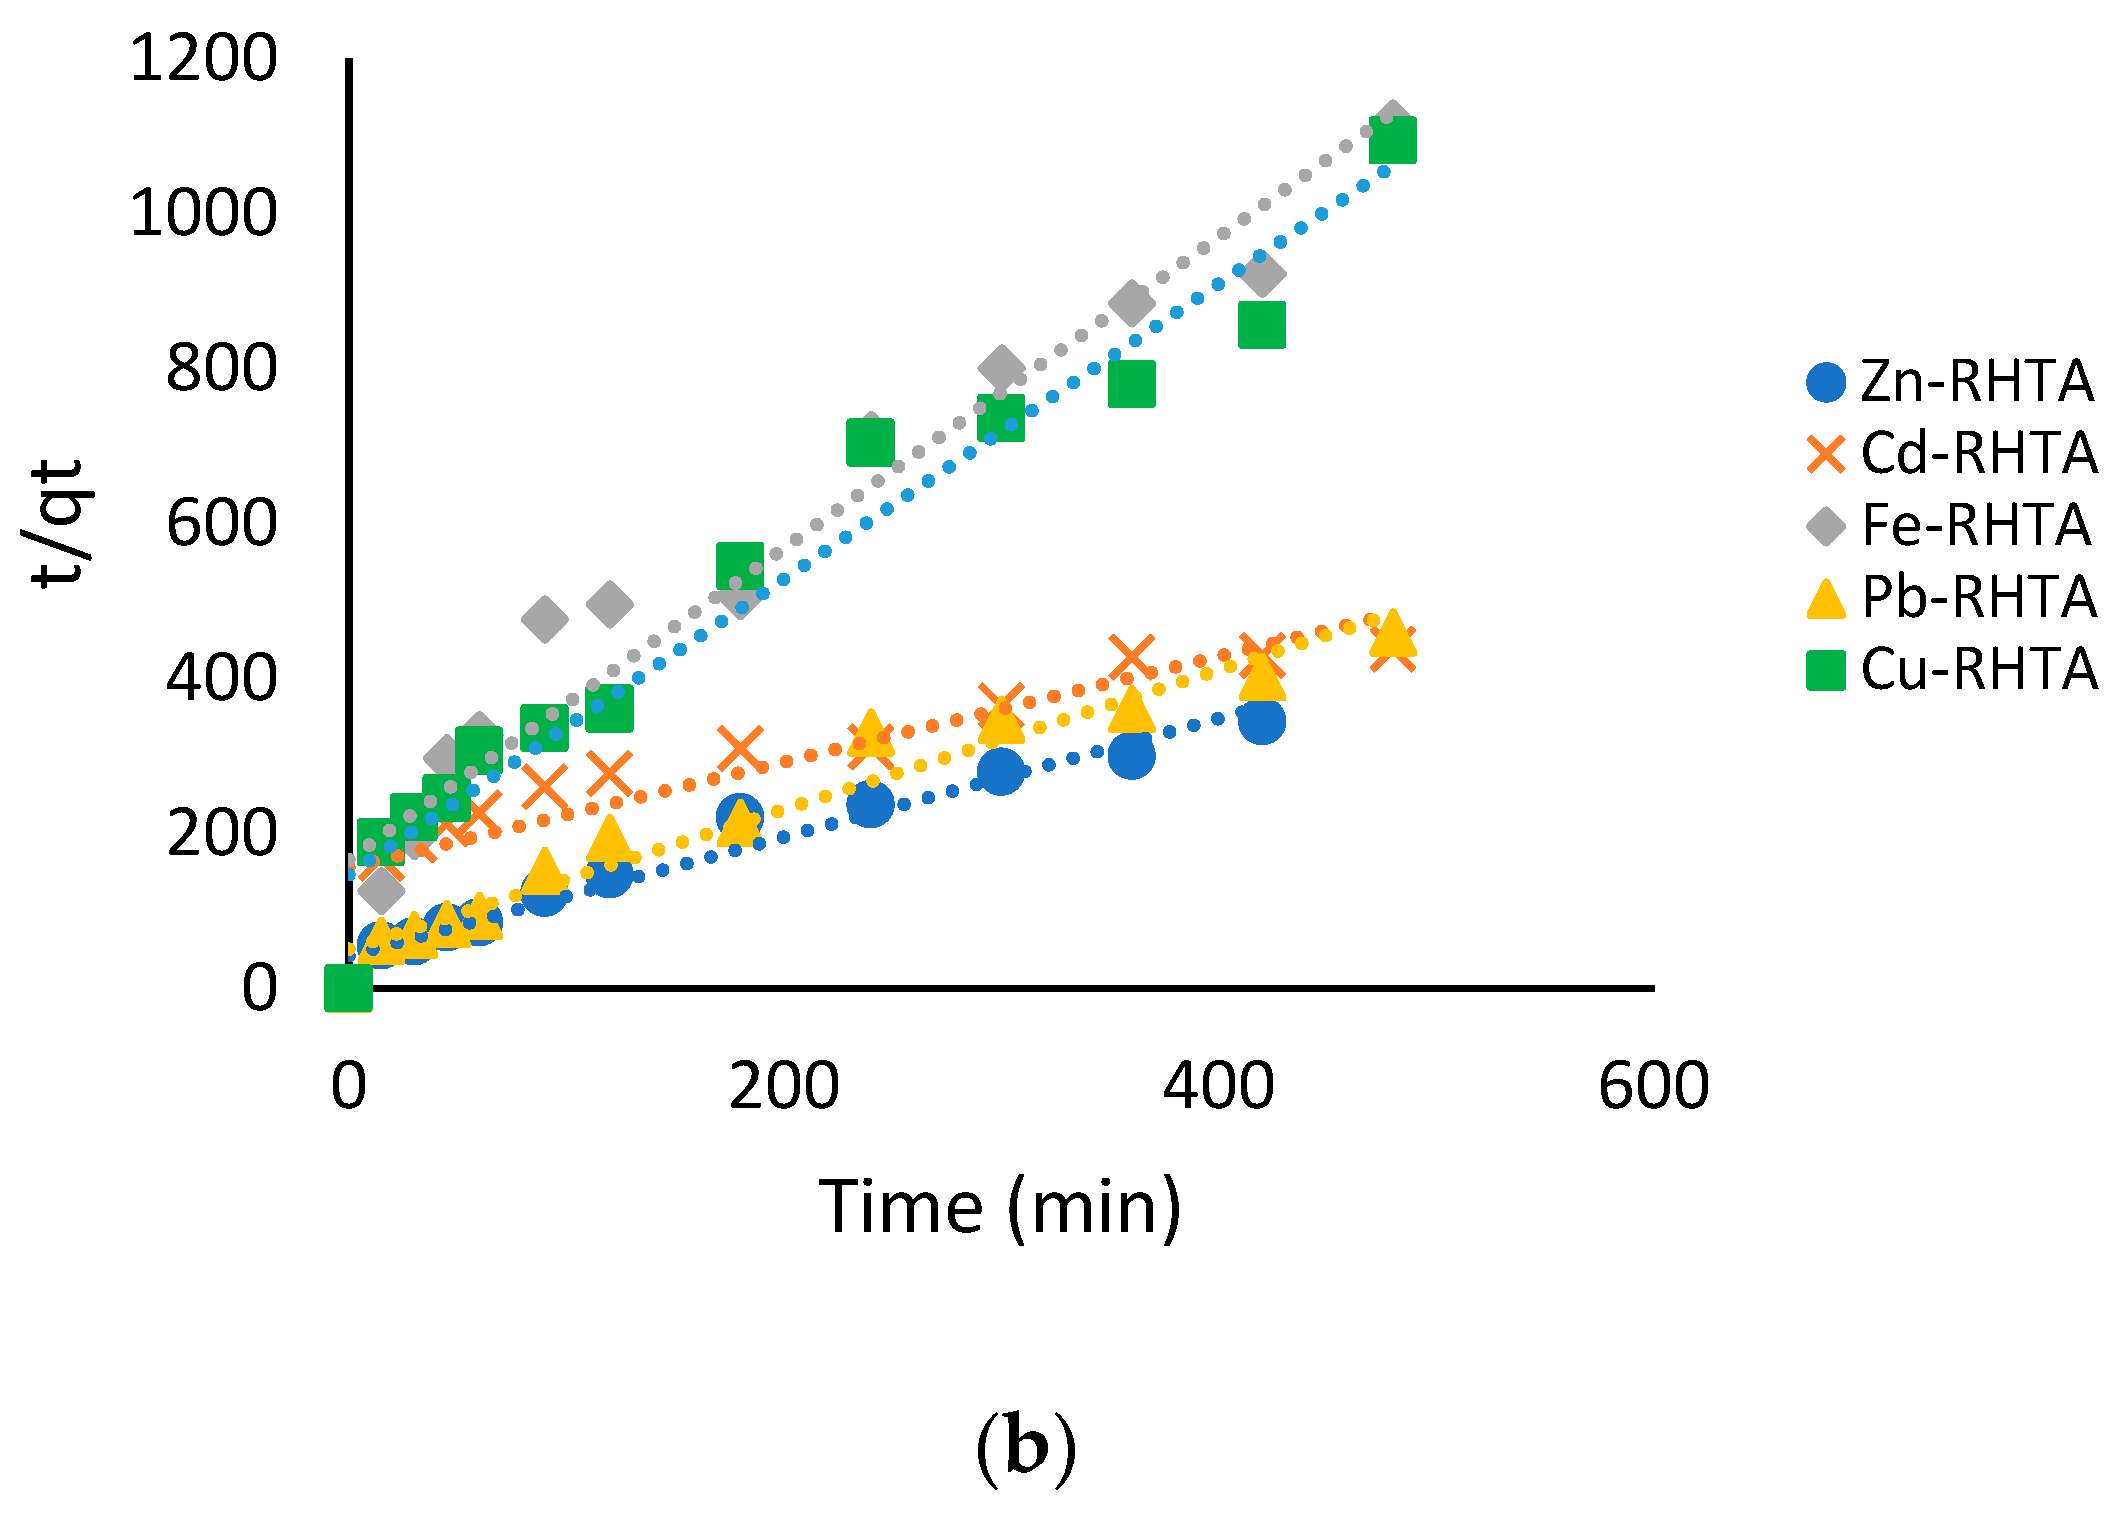
For the adsorption kinetics, the two types of pretreatments with the highest amount of biosorbent (URH1 and RHTA1) were used. Figure 9 and Figure 10 show the pseudo-first and pseudo-second-order kinetics. The application of these models to the data obtained from a pseudo-first-order action of time has been used to evaluate which of the models best explains the kinetics, as well as the passage of the metal ion in the biosorbent during adsorption [69].
Table 3 shows the parameters of kinetics. The best adjustment of the data was presented when using the pseudo-second-order model in 4 of the metals used in the rice husk with and without treatment, with correlations greater than 0.886 for the URH and for the husk with pre-treatment, except for Cd, where the data had a better fit to the pseudo-first-order model, with coefficients greater than 0.917. These results agree with other investigations [70,71], where the authors point out that the adsorption of different compounds in a solution using modified and unmodified biosorbents tends to adjust correctly to pseudo-second-order kinetics, in addition to the fact that this model can better fit most kinetic data sets [72], which indicates that the most important stage is the adsorption reaction, that is, the process is controlled by chemisorption, indicating attractive forces between the adsorbent and the adsorbate, additionally to the surface reaction that acts as the rate-limiting step, and the mechanism limited by diffusion [73], in fact that the adsorption rate depends to a greater extent on the active sites on the surface [74].
However, it is important to note that in the pseudo-second-order kinetics, the adsorption rate is higher in URH, being Cu > Pb > Fe > Zn > Cd, while in the case of RHTA the behavior is Cu > Zn > Fe > Pb > Cd. On the hand, the adsorption capacities in the second-order mechanism differ between treatments, since the behavior in URH is Zn > Cu > Cd > Pb > Fe, while with RHTA it is Cd > Pb > Zn > Fe > Cu.
It should be noted that the adsorption capacities indicated by the kinetics are small (<2.487 when using URH and <3.308 with RHTA) compared to using other biosorbents for removal, such as those of coconut shells, orange peel, and activated charcoal adsorb Cu (3.07, 3.65 and 3.56 mg/g) [75,76,77], or other work, in where the qe of metals such as Pb, Cu, Zn and Ca adsorbed by slag (rock), is 115.8, 11.74, 10.53 and 9.92 mg/g, respectively [78], which are higher than those reported in this work; however, one of the studies indicates that for Cd and Zn of 0.476 and 3.182 mg/g when using a concentration of 50 mg/L adsorbed by rice husk ash [79].
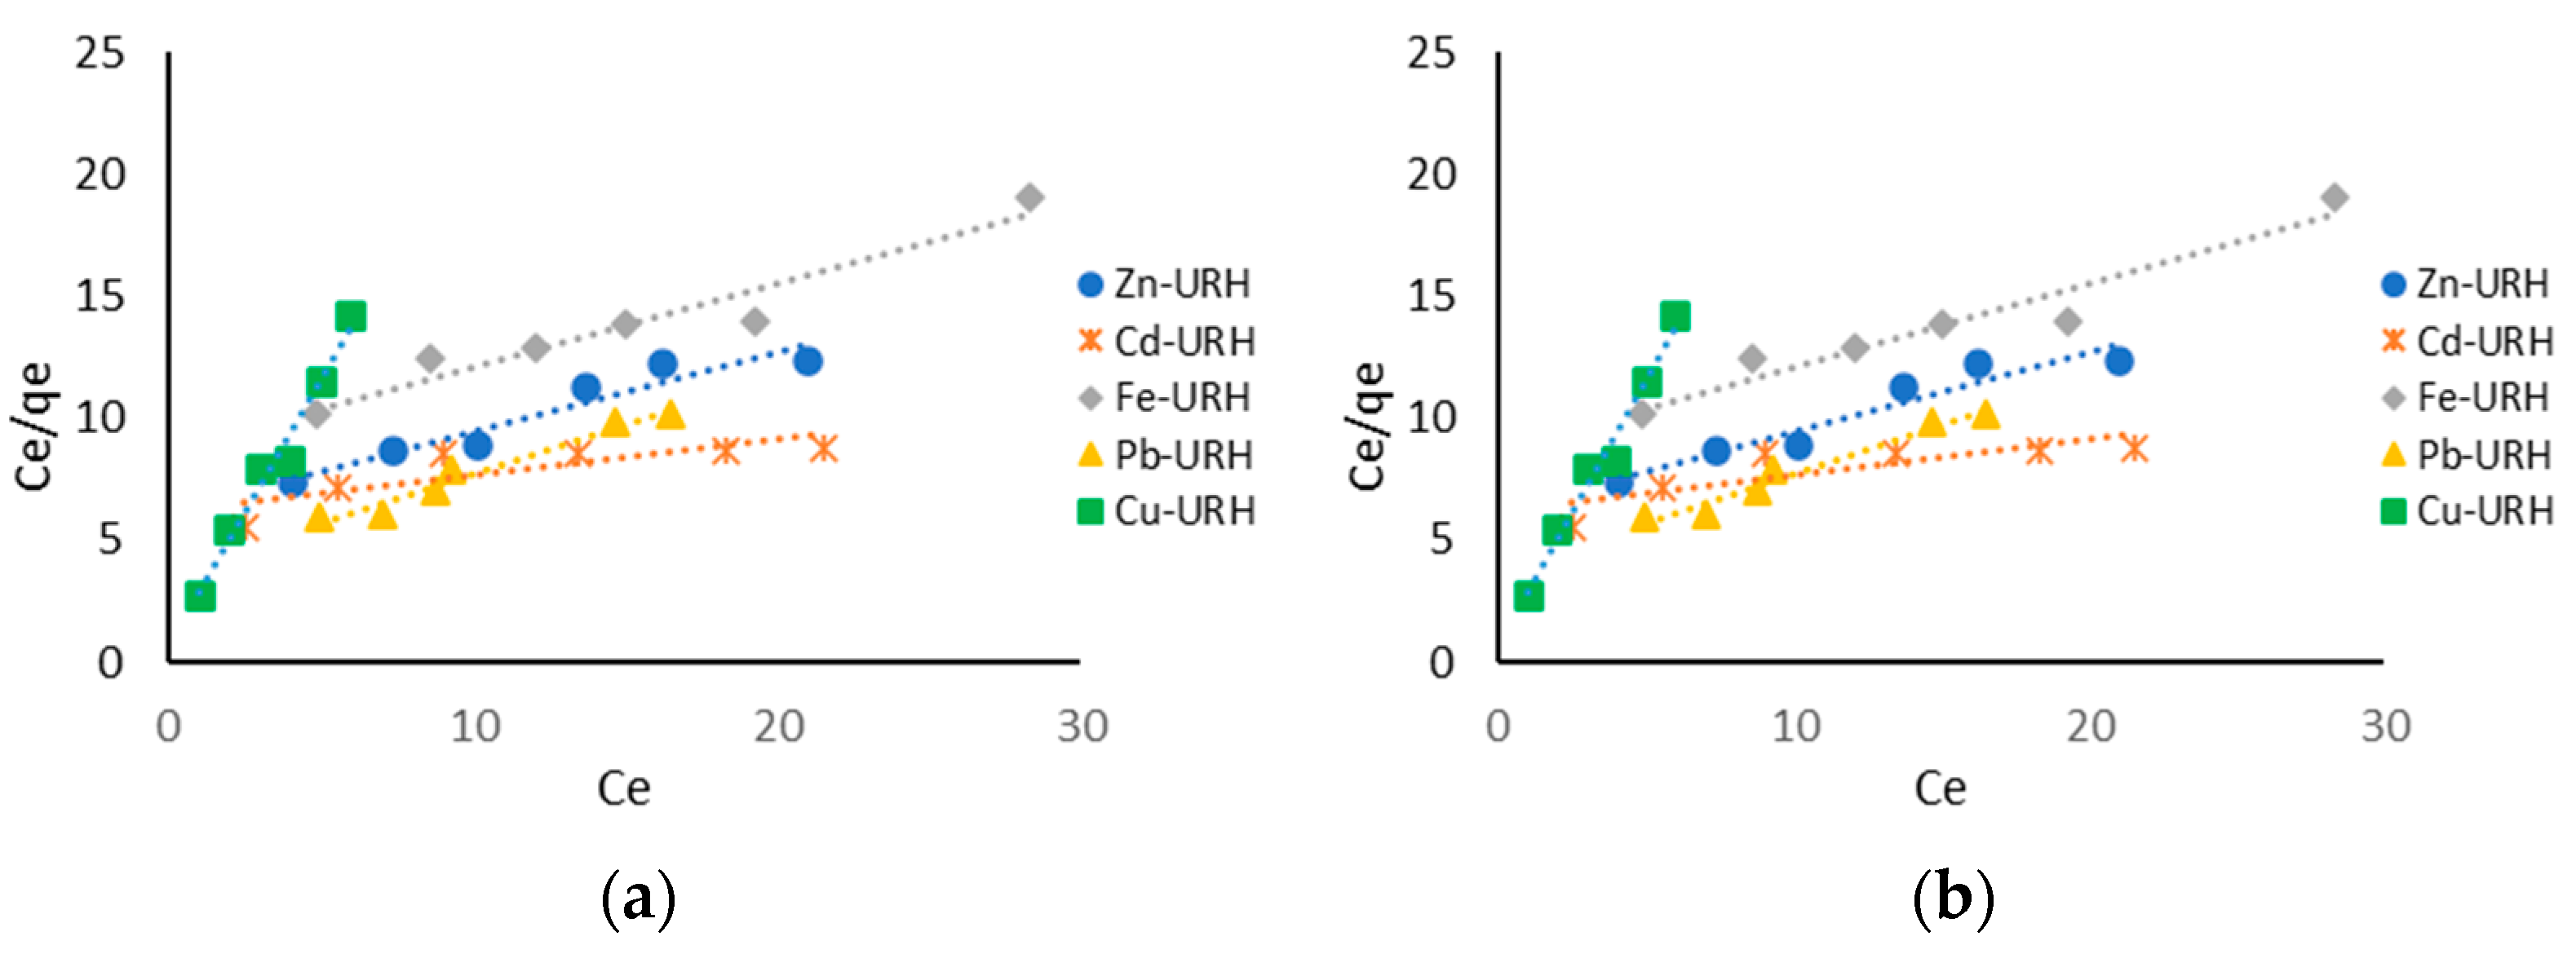
The adsorption isotherms representing the adsorption capacity of URH and RHTA to remove Cu(II), Pb(II), Fe(II), Cd(II), and Zn(II) were used. To know the type of adsorption that is carried out by the biosorbent, for this purpose two types of isotherms were used: Langmuir and Freundlich, where the Langmuir isotherm supposes a surface with homogeneous sites, sorption energies equivalent and without interaction between the adsorbed species, that is, a monolayer is formed, which indicates that each binding site cannot accommodate more than one metal on the biosorbent surface [80] and this form of adsorption is carried out if the bond strength between adsorbate-adsorbent molecules is stronger than adsorbate-solvent and adsorbent-solvent [81]; the Freundlich isotherm describes a multilayer adsorption [43]. The parameters obtained from the Langmuir and Freundlich isotherm models using URH and RHTA are shown in Table 4.
According to these models, the biosorbents with and without the pretreatment fit correctly to the Freundlich model (0.842–0.999) when in contact with the aforementioned metals, which would indicate that the adsorption process is carried out in the form of a multilayer [82]; while the Langmuir model, although with some metals the data were adjusted correctly, the fit was lower compared to Freundlich when the biosorbent was in contact with the metals, as can be seen in Figure 11 and Figure 12.
These results found in the Freundlich isotherms could be because when the adsorption isotherms are carried out with low solute concentrations they are often linear, that is, the r2 is higher [81]; however, some conditions do not allow this linearity, such as the mass of the solute versus the volume of solution, where an influence of this parameter has been observed due to two main reasons, such as the volume occupied by the suspended particles and their aggregation [83].

4. Conclusions

The characterization of the biosorbent indicates a high percentage of lignin and cellulose, in addition to silica, that was observed by XRD. These compounds presented the functional groups (OH, C-O, CH2, CH3, Si-O2, Si-OH, Si-O-Si-OH), which are reported to have active sites available in different biosorbents that could bond to metals. There is a potential to use the URH for its efficiency in removing high percentages of Fe and Pb and without the metal desorption from contaminated water containing a mixture of heavy metals. In other ways, it was determined that Cd and Zn were adsorbed at a lower extent to RHTA due to the presence of the other heavy metal competitors for the adsorption available sites. The metal adsorption studies indicate that, using RHTA, the adsorption of those metals is higher than 80%, except for Cd, where its removal was 42%. In addition, the RHTA desorbs the metals to a low (35%) extent, except for Cd and Zn. It was concluded that only Pb adsorption was enhanced by 80% in the ATRH; other ways Cd and Zn are highly desorbed from URH and RHTA by the presence of other heavy metals.
It is important to point out that it is possible to obtain the adsorption equilibrium by fitting the experimental data to the Freundlich model, which indicates that the rice husk adsorbed the heavy metals in the form of a multilayer. In addition, those data were adjusted to the pseudo-second-order kinetics, which indicates that the most important phase is the adsorption process, which depends to a greater extent on the active sites found on the surface of the rice hulls in which metal ions might be interacted. For these reasons, it is considered that the RHTA could be a viable option for Cd and Zn removal from contaminated water with a mixture of other heavy metals, with a further recovery of those heavy metals. In addition, it was found that a high Fe and Pb removal was feasible, with a relatively low metal desorption.

Author Contributions

Conceptualization, Methodology: A.K.I.F.-T. and R.R.-V., Investigation, Validation, Visualization, Writing—original draft, Writing—review and editing: A.K.I.F.-T., R.R.-V. and A.G.M.-M.; Formal analysis: A.K.I.F.-T., and A.G.M.-M.; Funding acquisition, Project administration, Supervision: R.R.-V. All authors have read and agreed to the published version of the manuscript.

Funding

This work was supported by the Consejo Nacional de Humanidades Ciencias y Tecnologías (CONAHCYT) with a postdoctoral scholarship awarded to Flores-Trujillo A.K.I. (No. 592589) and a doctoral scholarship awarded to Morales-Mendoza A.G. (No. 998228).

Data Availability Statement

Data are contained within the article.

Acknowledgments

The authors are grateful for the technical support of Marcela Guerrero from the Physics Department of CINVESTAV-IPN, for her support in the XRD and FTIR analyses, as well as Ángel Guillen from the Physics Department of CINVESTAV-IPN, for his support in the SEM and EDS analyses. The authors also acknowledge M. en C. Josué Benito Rodríguez Gamez for his contribution to illustration.

Conflicts of Interest

The authors declare no conflicts of interest.

References

  1. Akhtar, N.; Syakir Ishak, M.I.; Bhawani, S.A.; Umar, K. Various natural and anthropogenic factors responsible for water quality degradation: A review. Water 2021, 13, 2660. [Google Scholar] [CrossRef]
  2. Razzak, S.A.; Faruque, M.O.; Alsheikh, Z.; Alsheikhmohamad, L.; Alkuroud, D.; Alfayez, A.; Zakir Hossain, S.M.; Hossain, M.M. A comprehensive review on conventional and biological-driven heavy metals removal from industrial wastewater. Environ. Adv. 2022, 7, 100168. [Google Scholar] [CrossRef]
  3. Shahabudin, M.M.; Musa, S. Occurrence of Surface Water Contaminations: An Overview. IOP Conf. Ser. Earth Environ. Sci. 2018, 140, 012058. [Google Scholar] [CrossRef]
  4. Vardhan, K.H.; Kumar, P.S.; Panda, R.C. A review on heavy metal pollution, toxicity and remedial measures: Current trends and future perspectives. J. Mol. Liq. 2019, 290, 111197. [Google Scholar] [CrossRef]
  5. Abdullah, N.; Yusof, N.; Lau, W.J.; Jaafar, J.; Ismail, A.F. Recent trends of heavy metal removal from water/wastewater by membrane technologies. J. Ind. Eng. Chem. 2019, 76, 17–38. [Google Scholar] [CrossRef]
  6. Al-Ghouti, M.A.; Ashfaq, M.Y.; Khan, M.; Al Disi, Z.; Da’na, D.A.; Shoshaa, R. State-of-the-art adsorption and adsorptive filtration based technologies for the removal of trace elements: A critical review. Sci. Total Env. 2023, 895, 164854. [Google Scholar] [CrossRef] [PubMed]
  7. Rahmati, N.; Rahimnejad, M.; Pourali, M.; Muallah, S.K. Effective removal of nickel ions from aqueous solution using multi-wall carbon nanotube functionalized by glycerol-based deep eutectic solvent. Colloid. Interface Sci. Commun. 2021, 40, 100347. [Google Scholar] [CrossRef]
  8. Collivignarelli, M.C.; Abbà, A.; Caccamo, F.M.; Carnevale Miino, M.; Durante, A.; Bellazzi, S.; Baldi, M.; Bertanza, G. How to produce an alternative carbon source for denitrification by treating and drastically reducing biological sewage sludge. Membranes 2021, 11, 977. [Google Scholar] [CrossRef]
  9. Collivignarelli, M.C.; Sorlini, S.; Milanese, C.; Illankoon, W.A.M.A.N.; Caccamo, F.M.; Calatroni, S. Rice industry by-products as adsorbent materials for removing fluoride and arsenic from drinking water—A review. Appl. Sci. 2022, 12, 3166. [Google Scholar] [CrossRef]
  10. Quansah, J.O.; Hlaing, T.; Lyonga, F.N.; Kyi, P.P.; Hong, S.H.; Lee, C.G.; Park, S.J. Nascent rice husk as an adsorbent for removing cationic dyes from textile wastewater. Appl. Sci. 2020, 10, 3437. [Google Scholar] [CrossRef]
  11. Gómez-Aguilar, D.L.; Rodríguez-Miranda, J.P.; Salcedo-Parra, O.J. Fruit peels as a sustainable waste for the biosorption of heavy metals in wastewater: A review. Molecules 2022, 27, 2124. [Google Scholar] [CrossRef] [PubMed]
  12. Priya, A.K.; Gnanasekaran, L.; Dutta, K.; Rajendran, S.; Balakrishnan, D.; Soto-Moscoso, M. Biosorption of heavy metals by microorganisms: Evaluation of different underlying mechanisms. Chemosphere 2022, 307, 135957. [Google Scholar] [CrossRef] [PubMed]
  13. Corral-Bobadilla, M.; González-Marcos, A.; Vergara-González, E.P.; Alba-Elías, F. Bioremediation of waste water to remove heavy metals using the spent mushroom substrate of Agaricus bisporus. Water 2019, 11, 454. [Google Scholar] [CrossRef]
  14. Akhter, F.; Soomro, S.A.; Jamali, A.R.; Chandio, Z.A.; Siddique, M.; Ahmed, M. Rice husk ash as green and sustainable biomass waste for construction and renewable energy applications: A review. Biomass Convers. Biorefinery 2023, 13, 4639–4649. [Google Scholar] [CrossRef]
  15. Thakur, V.; Sharma, E.; Guleria, A.; Sangar, S.; Singh, K. Modification and management of lignocellulosic waste as an ecofriendly biosorbent for the application of heavy metal ions sorption. Mater. Today Proc. 2020, 32, 608–619. [Google Scholar] [CrossRef]
  16. Sulyman, M.; Namiesnik, J.; Gierak, A. Low-cost Adsorbents Derived from Agricultural By-products/Wastes for Enhancing Contaminant Uptakes from Wastewater: A Review. Pol. J. Environ. Stud. 2017, 26, 479–510. [Google Scholar] [CrossRef] [PubMed]
  17. Izwan, S.M.; Sapuan, S.M.; Zuhri, M.Y.M.; Mohamed, A.R. Effects of benzoyl treatment on NaOH treated sugar palm fiber: Tensile, thermal, and morphological properties. J. Mater. Res. Technol. 2020, 9, 5805–5814. [Google Scholar] [CrossRef]
  18. Zafar, S.; Khan, M.I.; Lashari, M.H.; Khraisheh, M.; Almomani, F.; Mirza, M.L.; Khalid, N. Removal of copper ions from aqueous solution using NaOH-treated rice husk. Emergent Mater. 2020, 3, 857–870. [Google Scholar] [CrossRef]
  19. Mahmood, H.; Moniruzzaman, M.; Iqbal, T.; Khan, M.J. Recent advances in the pretreatment of lignocellulosic biomass for biofuels and value-added products. Curr. Opin. Green. Sustain. Chem. 2019, 20, 18–24. [Google Scholar] [CrossRef]
  20. Kumar, R.; Sharma, R.K.; Singh, A.P. Cellulose based grafted biosorbents-Journey from lignocellulose biomass to toxic metal ions sorption applications-A review. J. Mol. Liq. 2017, 232, 62–93. [Google Scholar] [CrossRef]
  21. Dhaouadi, F.; Sellaoui, L.; Chavez-Gonzalez, B.; Reynel-Ávila, H.E.; Diaz-Muñoz, L.L.; Mendoza-Castillo, D.I.; Bonilla-Petriciolet, A.; Lima, E.C.; Tapia-Picazo, J.C.; Lamine, A.B. Application of a heterogeneous physical model for the adsorption of Cd2+, Ni2+, Zn2+ and Cu2+ ions on flamboyant pods functionalized with citric acid. Chem. Eng. J. 2021, 417, 127975. [Google Scholar] [CrossRef]
  22. Cai, T.; Du, H.; Liu, X.; Tie, B.; Zeng, Z. Insights into the removal of Cd and Pb from aqueous solutions by NaOH–EtOH-modified biochar. Environ. Technol. Innov. 2021, 24, 102031. [Google Scholar] [CrossRef]
  23. Nizam, N.U.M.; Hanafiah, M.M.; Mahmoudi, E.; Mohammad, A.W.; Oyekanmi, A.A. Effective adsorptive removal of dyes and heavy metal using graphene oxide based Pre-treated with NaOH/H2SO4 rubber seed shells synthetic graphite Precursor: Equilibrium Isotherm, kinetics and thermodynamic studies. Sep. Purif. Technol. 2022, 289, 120730. [Google Scholar] [CrossRef]
  24. Thi-Quyen, V.; Pham, T.H.; Kim, J.; Thanh, D.M.; Thang, P.Q.; Van Le, Q.; Hoon Jung, S.; Kim, T. Biosorbent derived from coffee husk for efficient removal of toxic heavy metals from wastewater. Chemosphere 2021, 284, 131312. [Google Scholar] [CrossRef]
  25. Salcedo Sánchez, E.R.; Martínez, J.M.E.; Morales, M.M.; Talavera Mendoza, O.; Alberich, M.V.E. Ecological and health risk assessment of potential toxic elements from a mining area (water and sediments): The San Juan-Taxco River System, Guerrero, Mexico. Water 2022, 14, 518. [Google Scholar] [CrossRef]
  26. Afzaal, M.; Hameed, S.; Liaqat, I.; Ali Khan, A.A.; Abdul Manan, H.; Shahid, R.; Altaf, M. Heavy metals contamination in water, sediments and fish of freshwater ecosystems in Pakistan. Water Pract. Technol. 2022, 17, 1253–1272. [Google Scholar] [CrossRef]
  27. Şener, E.; Şener, Ş.; Bulut, C. Assessment of heavy metal pollution and quality in lake water and sediment by various index methods and GIS: A case study in Beyşehir Lake, Turkey. Mar. Pollut. Bull. 2023, 192, 115101. [Google Scholar] [CrossRef] [PubMed]
  28. El-Degwy, A.A.; Negm, N.A.; El-Tabl, A.S.; Goher, M.E. Assessment of heavy metal pollution in water and its effect on Nile tilapia (Oreochromis niloticus) in Mediterranean Lakes: A case study at Mariout Lake. Appl. Water Sci. 2023, 13, 50. [Google Scholar] [CrossRef]
  29. AO, A.; PO, O.; PO, A. Evaluation of water pollution monitoring for heavy metal contamination: A case study of Agodi Reservoir, Oyo State, Nigeria. Environ. Monit. Assess. 2022, 194, 675. [Google Scholar] [CrossRef]
  30. De León-Gómez, H.; Martin del Campo-Delgado, M.A.; Esteller-Alberich, M.V.; Velasco-Tapia, F.; Alva-Niño, E.; Cruz-López, A. Assessment of nitrate and heavy metal contamination of groundwater using the heavy metal pollution index: Case study of Linares, Mexico. Environ. Earth Sci. 2020, 79, 1–19. [Google Scholar] [CrossRef]
  31. Fernandes, I.J.; Calheiro, D.; Kieling, A.G.; Moraes, C.A.; Rocha, T.L.; Brehm, F.A.; Modolo, R.C. Characterization of rice husk ash produced using different biomass combustion techniques for energy. Fuel 2016, 165, 351–359. [Google Scholar] [CrossRef]
  32. Soltani, N.; Soltani, S.; Bahrami, A.; Pech-Canul, M.I.; Gonzalez, L.A.; Möller, A.; Tapp, J.; Gurlo, A. Electrical and thermomechanical properties of CVI-Si3N4 porous rice husk ash infiltrated by Al-Mg-Si alloys. J. Alloys Compd. 2017, 696, 856–868. [Google Scholar] [CrossRef]
  33. Steven, S.; Restiawaty, E.; Pasymi, P.; Bindar, Y. An appropriate acid leaching sequence in rice husk ash extraction to enhance the produced green silica quality for sustainable industrial silica gel purpose. J. Taiwan. Inst. Chem. Eng. 2021, 122, 51–57. [Google Scholar] [CrossRef]
  34. Shrestha, L.K.; Thapa, M.; Shrestha, R.G.; Maji, S.; Pradhananga, R.R.; Ariga, K. Rice husk-derived high surface area nanoporous carbon materials with excellent iodine and methylene blue adsorption properties. J. Carbon. Res. 2019, 5, 10. [Google Scholar] [CrossRef]
  35. Chen, S.; Qin, C.; Wang, T.; Chen, F.; Li, X.; Hou, H.; Zhou, M. Study on the adsorption of dyestuffs with different properties by sludge-rice husk biochar: Adsorption capacity, isotherm, kinetic, thermodynamics and mechanism. J. Mol. Liq. 2019, 285, 62–74. [Google Scholar] [CrossRef]
  36. Bakar, R.A.; Yahya, R.; Gan, S.N. Production of high purity amorphous silica from rice husk. Procedia Chem. 2016, 19, 189–195. [Google Scholar] [CrossRef]
  37. Alver, E.; Metin, A.Ü.; Brouers, F. Methylene blue adsorption on magnetic alginate/rice husk bio-composite. Int. J. Biol. Macromol. 2020, 154, 104–113. [Google Scholar] [CrossRef]
  38. Naseer, A.; Jamshaid, A.; Hamid, A.; Muhammad, N.; Ghauri, M.; Iqbal, J.; Rafiq, S.; Khuram, S.; Shah, N.S. Lignin and lignin based materials for the removal of heavy metals from waste water-an overview. Z. Für Phys. Chem. 2019, 233, 315–345. [Google Scholar] [CrossRef]
  39. Rafidah, M.S.; Jahimin, A.; Sani, S.M. Chemical functional groups of extractives, cellulose and lignin extracted from native Leucaena leucocephala bark. Wood Sci. Technol. 2021, 55, 295–313. [Google Scholar] [CrossRef]
  40. Lindholm-Lehto, P.C. Biosorption of heavy metals by lignocellulosic biomass and chemical analysis. BioResources 2019, 14, 4952–4995. [Google Scholar] [CrossRef]
  41. Wijeyawardana, P.; Nanayakkara, N.; Gunasekara, C.; Karunarathna, A.; Law, D.; Pramanik, B.K. Removal of Cu, Pb and Zn from stormwater using an industrially manufactured sawdust and paddy husk derived biochar. Environ. Technol. Innov. 2022, 28, 102640. [Google Scholar] [CrossRef]
  42. Priya, A.K.; Yogeshwaran, V.; Rajendran, S.; Hoang, T.K.; Soto-Moscoso, M.; Ghfar, A.A.; Bathula, C. Investigation of mechanism of heavy metals (Cr6+, Pb2+ & Zn2+) adsorption from aqueous medium using rice husk ash: Kinetic and thermodynamic approach. Chemosphere 2022, 286, 131796. [Google Scholar] [CrossRef] [PubMed]
  43. Flores-Trujillo, A.K.I.; Mussali-Galante, P.; de Hoces, M.C.; Blázquez-García, G.; Saldarriaga-Noreña, H.A.; Rodríguez-Solís, A.; Tovar-Sánchez, E.; Sánchez-Salinas, E.; Ortiz-Hernández, M.L. Biosorption of heavy metals on Opuntia fuliginosa and Agave angustifolia fibers for their elimination from water. Int. J. Environ. Sci. Technol. 2021, 18, 441–454. [Google Scholar] [CrossRef]
  44. Bayuo, J.; Pelig-Ba, K.B.; Abukari, M.A. Adsorptive removal of chromium (VI) from aqueous solution unto groundnut shell. Appl. Water Sci. 2019, 9, 107. [Google Scholar] [CrossRef]
  45. Martín-Lara, M.A.; Blázquez, G.; Ronda, A.; Pérez, A.; Calero, M. Development and characterization of biosorbents to remove heavy metals from aqueous solutions by chemical treatment of olive stone. Ind. Eng. Chem. Res. 2013, 52, 10809–10819. [Google Scholar] [CrossRef]
  46. Ponce, J.; Da Silva Andrade, J.G.; Dos Santos, L.N.; Bulla, M.K.; Barros, B.C.B.; Favaro, S.L.; Hioka, N.; Caetano, W.; Batistela, V.R. Alkali pretreated sugarcane bagasse, rice husk and corn husk wastes as lignocellulosic biosorbents for dyes. Carbohydr. Polym. Technol. Appl. 2021, 2, 100061. [Google Scholar] [CrossRef]
  47. Zakaria, S.M.; Idris, A.; Chandrasekaram, K.; Alias, Y. Efficiency of bronsted acidic ionic liquids in the dissolution and depolymerization of lignin from rice husk into high value-added products. Ind. Crops Prod. 2020, 157, 112885. [Google Scholar] [CrossRef]
  48. Hafid, H.S.; Omar, F.N.; Zhu, J.; Wakisaka, M. Enhanced crystallinity and thermal properties of cellulose from rice husk using acid hydrolysis treatment. Carbohydr. Polym. 2021, 260, 117789. [Google Scholar] [CrossRef] [PubMed]
  49. Sirviö, J.A.; Visanko, M. Lignin-rich sulfated wood nanofibers as high-performing adsorbents for the removal of lead and copper from water. J. Hazard. Mater. 2020, 383, 121174. [Google Scholar] [CrossRef]
  50. Hezam Saeed, A.A.; Harun, N.Y.; Sufian, S.; Afolabi, H.K.; Hussein Al-Qadami, E.H.; Shahirah Roslan, F.A.; Rahim, S.A.; Ghaleb, A.S. Production and characterization of rice husk biochar and kenaf biochar for value-added biochar replacement for potential materials adsorption. Ecol. Eng. Environ. Technol. 2021, 22, 1–8. [Google Scholar] [CrossRef]
  51. Sankar, S.; Sharma, S.K.; Kaur, N.; Lee, B.; Kim, D.Y.; Lee, S.; Jung, H. Biogenerated silica nanoparticles synthesized from sticky, red, and brown rice husk ashes by a chemical method. Ceram. Int. 2016, 42, 4875–4885. [Google Scholar] [CrossRef]
  52. Sultana, S.; Rehan, K.; Rehan, I.; Ali, F.; Waris, S.; Zahoor, M.; Salman, S.M.; Khan, S.; Rehan, M.S. Physicochemical and instrumental characterization of rice husk and its potential use as a low cost adsorbent for mutagenic dye bromophenol blue. Z. Für Phys. Chem. 2021, 235, 1263–1277. [Google Scholar] [CrossRef]
  53. Niculescu, V.C.; Raboaca, M.S. Efficient rice-husk-derived silica nanocatalysts for organic dye removal from water. Catalysts 2021, 11, 815. [Google Scholar] [CrossRef]
  54. Tokay, B.; Akpınar, I. A comparative study of heavy metals removal using agricultural waste biosorbents. Bioresour. Technol. Rep. 2021, 15, 100719. [Google Scholar] [CrossRef]
  55. Figueiredo Severo, F.; Souza da Silva, L.; Costa Moscôso, J.S.; Sarfaraz, Q.; Rodrigues Júnior, L.F.; Ferreria Lopes, A.; Brondani Marzari, L.; Dal Molin, G. Chemical and physical characterization of rice husk biochar and ashes and their iron adsorption capacity. SN Appl. Sci. 2020, 2, 1–9. [Google Scholar] [CrossRef]
  56. Amen, R.; Yaseen, M.; Mukhtar, A.; Klemeš, J.J.; Saqib, S.; Ullah, S.; Al-Sehemi, A.G.; Rafiq, S.; Babar, M.; Fatt, C.L.; et al. Lead and cadmium removal from wastewater using eco-friendly biochar adsorbent derived from rice husk, wheat straw, and corncob. Clean. Eng. Technol. 2020, 1, 100006. [Google Scholar] [CrossRef]
  57. Morcali, M.H.; Zeytuncu, B.; Yucel, O. Platinum uptake from chloride solutions using biosorbents. Mater. Res. 2013, 16, 528–538. [Google Scholar] [CrossRef]
  58. Rahmani, A.M.; Gahlot, P.; Moustakas, K.; Kazmi, A.A.; Ojha, C.S.P.; Tyagi, V.K. Pretreatment methods to enhance solubilization and anaerobic biodegradability of lignocellulosic biomass (wheat straw): Progress and challenges. Fuel 2022, 319, 123726. [Google Scholar] [CrossRef]
  59. Ali Redha, A. Removal of heavy metals from aqueous media by biosorption. Arab. J. Basic. Appl. Sci. 2020, 27, 183–193. [Google Scholar] [CrossRef]
  60. Li, Z.; Zheng, Z.; Li, H.; Xu, D.; Li, X.; Xiang, L.; Tu, S. Review on rice husk biochar as an adsorbent for soil and water remediation. Plants 2023, 12, 1524. [Google Scholar] [CrossRef]
  61. Lata, S.; Samadder, S.R. Removal of heavy metals using rice husk: A review. Int. J. Environ. Res. Dev. 2014, 4, 165–170. [Google Scholar]
  62. Ebrahimi, M.; Hassanpour, M.; Rowlings, D.W.; Bai, Z.; Dunn, K.; O’Hara, I.M.; Zhang, Z. Effects of lignocellulosic biomass type on nutrient recovery and heavy metal removal from digested sludge by hydrothermal treatment. J. Environ. Manag. 2022, 318, 115524. [Google Scholar] [CrossRef] [PubMed]
  63. Wonorahardjo, S.; Fajaroh, F.; Joharmawan, R.; Nazriati, N.; Budiasih, E. Cadmium and lead ions adsorption on magnetite, silica, alumina, and cellulosic materials. Sci. Rep. 2023, 13, 4213. [Google Scholar] [CrossRef] [PubMed]
  64. Wang, J.; Guo, X. Adsorption kinetics and isotherm models of heavy metals by various adsorbents: An overview. Crit. Rev. Environ. Sci. Technol. 2023, 53, 1–29. [Google Scholar] [CrossRef]
  65. Bayuo, J.; Rwiza, M.J.; Sillanpää, M.; Mtei, K.M. Removal of heavy metals from binary and multicomponent adsorption systems using various adsorbents–a systematic review. RSC Adv. 2023, 13, 13052–13093. [Google Scholar] [CrossRef] [PubMed]
  66. Neris, J.B.; Luzardo, F.H.M.; Da Silva, E.G.P.; Velasco, F.G. Evaluation of adsorption processes of metal ions in multi-element aqueous systems by lignocellulosic adsorbents applying different isotherms: A critical review. Chem. Eng. J. 2019, 357, 404–420. [Google Scholar] [CrossRef]
  67. Abdusattar, T.; Hadi, A.; Nuryoto, N.; Kurniawan, T. Kinetic study of ammonium desorption using natural zeolites from Cikalong. World Chem. Eng. J. 2021, 5, 12–17. [Google Scholar] [CrossRef]
  68. Chatterjee, A.; Abraham, J. Desorption of heavy metals from metal loaded sorbents and e-wastes: A review. Biotechnol. Lett. 2019, 41, 319–333. [Google Scholar] [CrossRef] [PubMed]
  69. Sadeek, S.A.; Negm, N.A.; Hefni, H.H.H.; Wahab, M.M.A. Metal adsorption by agricultural biosorbents: Adsorption isotherm, kinetic and biosorbents chemical structures. Int. J. Biol. Macromol. 2015, 81, 400–409. [Google Scholar] [CrossRef]
  70. Albis, A.; Cajar, L.V.; Domínguez, M.I. Análisis cinético de la adsorción de Cr (VI) en soluciones acuosas a concentraciones de 10–20 mg/L con el uso de cáscara de yuca amarga (Manihot esculenta). Prospectiva 2015, 13, 64–71. [Google Scholar] [CrossRef]
  71. Benhouria, A.; Islam, M.A.; Zaghouane-Boudiaf, H.; Boutahala, M.; Hameed, B.H. Calcium alginate–bentonite–activated carbon composite beads as highly effective adsorbent for methylene blue. Chem. Eng. J. 2015, 270, 621–630. [Google Scholar] [CrossRef]
  72. Revellame, E.D.; Fortela, D.L.; Sharp, W.; Hernandez, R.; Zappi, M.E. Adsorption kinetic modeling using pseudo-first order and pseudo-second order rate laws: A review. Clean. Eng. Technol. 2020, 1, 100032. [Google Scholar] [CrossRef]
  73. Hubbe, M.A.; Azizian, S.; Douven, S. Implications of apparent pseudo-second-order adsorption kinetics onto cellulosic materials: A review. BioResources 2019, 14, 7582–7626. [Google Scholar] [CrossRef]
  74. Zhang, Z.; Wang, T.; Zhang, H.; Liu, Y.; Xing, B. Adsorption of Pb (II) and Cd (II) by magnetic activated carbon and its mechanism. Sci. Total Env. 2021, 757, 143910. [Google Scholar] [CrossRef] [PubMed]
  75. Machida, M.; Aikawa, M.; Tatsumoto, H. Prediction of simultaneous adsorption of Cu(II) and Pb(II) onto activated carbon by conventional Langmuir type equations. J. Hazard. Mater. 2005, 120, 271–275. [Google Scholar] [CrossRef] [PubMed]
  76. Annadurai, G.; Juang, R.S.; Lee, D.J. Adsorption of heavy metals from water using banana and orange peels. Water Sci. Technol. 2003, 47, 185–190. [Google Scholar] [CrossRef]
  77. Low, K.S.; Lee, C.K.; Wong, S.L. Effect of dye modification on the sorption of copper by coconut husk. Environ. Technol. 1995, 16, 877–883. [Google Scholar] [CrossRef]
  78. Kwon, J.S.; Yun, S.T.; Lee, J.H.; Kim, S.O.; Jo, H.Y. Removal of divalent heavy metals (Cd, Cu, Pb, and Zn) and arsenic (III) from aqueous solutions using scoria: Kinetics and equilibria of sorption. J. Hazard. Mater. 2010, 174, 307–313. [Google Scholar] [CrossRef]
  79. Srivastava, V.C.; Mall, I.D.; Mishra, I.M. Characterization of mesoporous rice husk ash (RHA) and adsorption kinetics of metal ions from aqueous solution onto RHA. J. Hazard. Mater. 2006, 134, 257–267. [Google Scholar] [CrossRef]
  80. Nikolić, M.; Robert, R.J.; Girish, C.R. The adsorption of cadmium, nickel, zinc, copper and lead from wastewater using tea fiber Waste. ARPN J. Eng. Appl. Sci. 2019, 14, 7743–7755. [Google Scholar] [CrossRef]
  81. Khayyun, T.S.; Mseer, A.H. Comparison of the experimental results with the Langmuir and Freundlich models for copper removal on limestone adsorbent. Appl. Water Sci. 2019, 9, 170. [Google Scholar] [CrossRef]
  82. Rajendran, S.; Priya, A.K.; Kumar, P.S.; Hoang, T.K.; Sekar, K.; Chong, K.Y.; Khoo, K.S.; Ng, H.S.; Show, P.L. A critical and recent developments on adsorption technique for removal of heavy metals from wastewater-A review. Chemosphere 2022, 303, 135146. [Google Scholar] [CrossRef] [PubMed]
  83. Limousin, G.; Gaudet, J.P.; Charlet, L.; Szenknect, S.; Barthés, V.; Krimissa, M. Sorption isotherms: A review on physical bases, modeling and measurement. Appl. Geochem. 2007, 22, 249–275. [Google Scholar] [CrossRef]
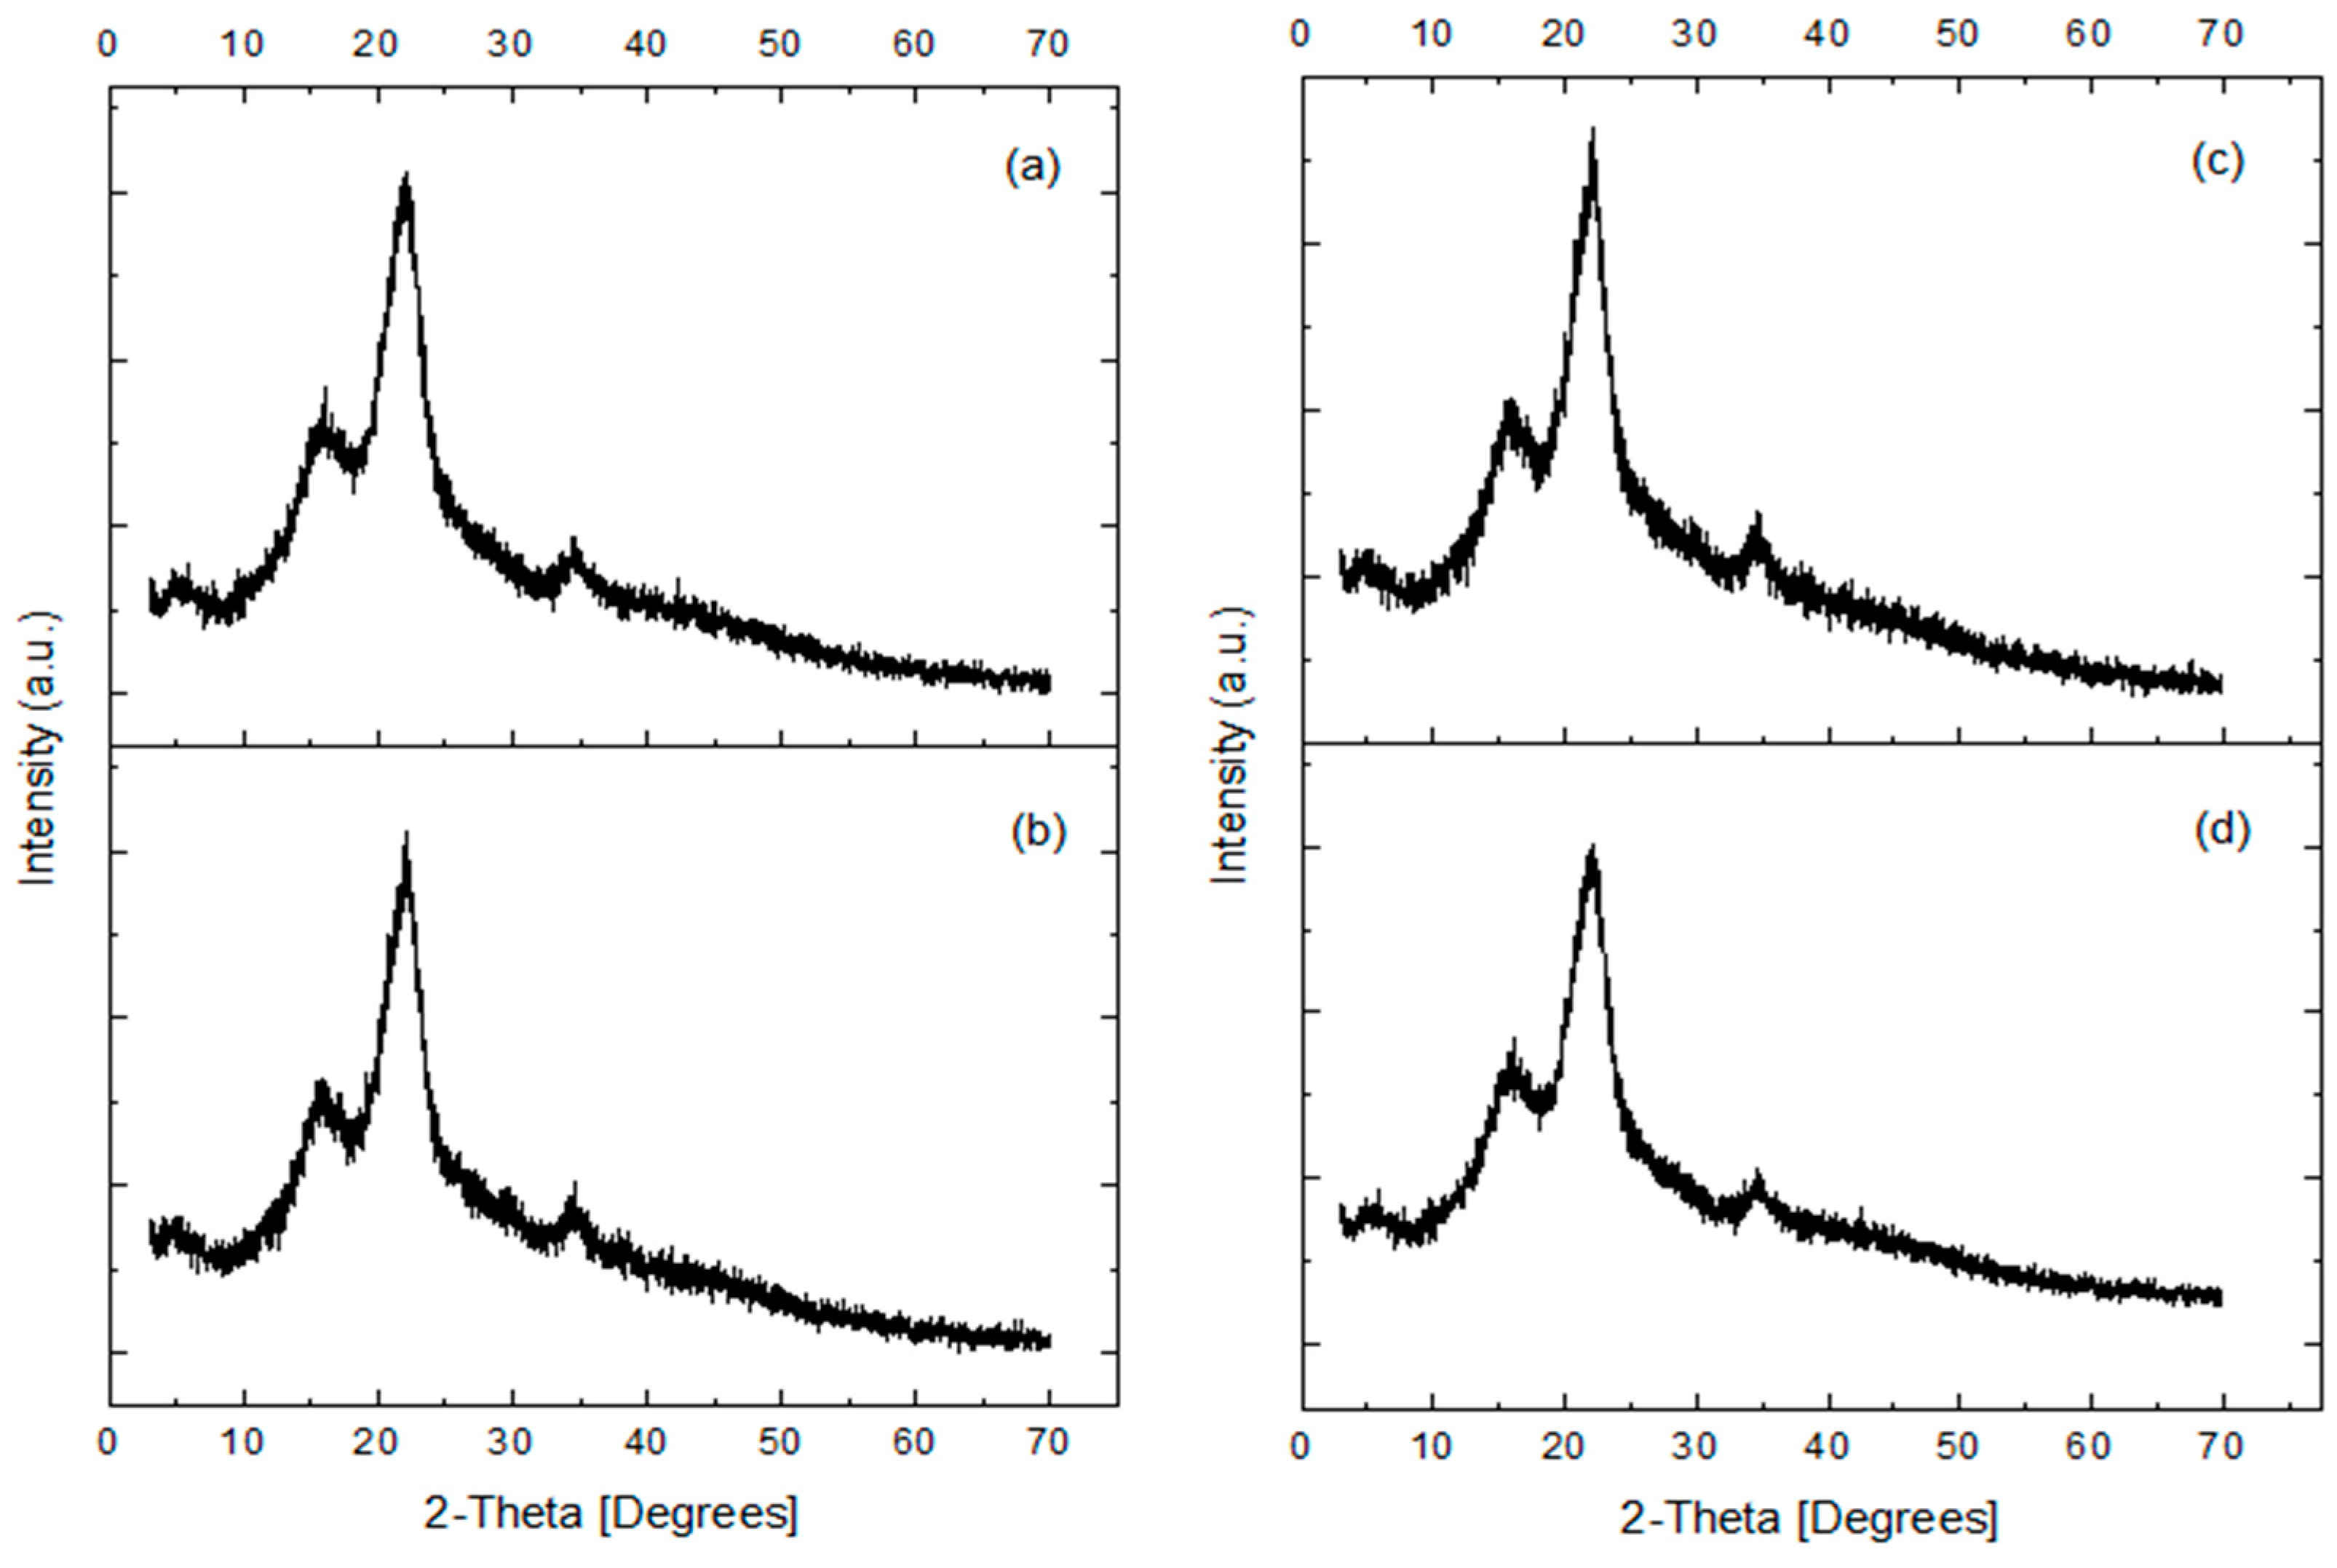
Figure 1. XRD patterns of: (a) URH (without heavy metals), (b) URH with heavy metals, (c) RHTA (without heavy metals), and (d) RHTA with heavy metals.
Processes 12 01299 g001
Figure 2. FTIR spectrum showing (a) URH control (without heavy metals), (b) URH with heavy metals, (c) RHTA control (without heavy metals), and (d) RHTA with heavy metals.
Processes 12 01299 g002
Figure 3. SEM analysis of URH: (a) Rice husk control (without heavy metals) and (b) rice husk with heavy metal.
Processes 12 01299 g003
Figure 4. EDS analysis of URH: (a) Rice husk control (without heavy metals) and (b) rice husk with heavy metals.
Processes 12 01299 g004
Figure 5. SEM analysis of RHTA: (a) Rice husk without heavy metals (control) and (b) rice husk with heavy metals.
Processes 12 01299 g005
Figure 6. EDS analysis of RHTA: (a) Rice husk without heavy metals (control) and (b) rice husk with heavy metals.
Processes 12 01299 g006
Figure 7. Percentage of metal adsorption using different treatments: URH (untreated rice husk) and RHTA (rice husk treated with alkali); the number corresponds to the amount of mass employed. The letters show statistically significant differences (p < 0.05) between the treatments of each metal; * indicates statistically significant differences between metals in a single treatment. The standard error value was placed on each bar.
Processes 12 01299 g007
Figure 8. Percentage of metal desorption using different treatments: URH (untreated rice husk) and RHTA (rice husk treated with alkali); the number corresponds to the amount of mass employed. The letters show statistically significant differences (p < 0.05) between the treatments of each metal; * indicates statistically significant differences between metals in a single treatment. The standard error value was placed on each bar.
Processes 12 01299 g008
Figure 9. Pseudo-first-order kinetics using selected metals: (a) untreated rice husk and (b) rice husk treated with alkali.
Processes 12 01299 g009
Figure 10. Pseudo-second-order kinetics using selected metals: (a) untreated rice husk and (b) rice husk treated with alkali.
Processes 12 01299 g010aProcesses 12 01299 g010b
Figure 11. Langmuir adsorption isotherms using selected metals: (a) URH and (b) RHTA.
Processes 12 01299 g011
Figure 12. Freundlich adsorption isotherms using selected metals: (a) URH and (b) RHTA.
Processes 12 01299 g012
Table 1. Examples of sites with heavy metal contamination around the world.
Site Water (mg/L) Sediment (mg/L) Reference
San Juan-Taxco River, MexicoCu (0.0078), Fe (0.316),
Pb (0.0182), Zn (0.2335)
Cu (393.0), Fe (23,223.0),
Pb (265.0), Cd (50.4),
Zn (4509.0)
[25]
River Kabul, PakistanPb (0.810), Cd (0.038) Pb (29), Cd (4) [26]
Beyşehir Lake, TurkeyCu (0.0012), Fe (0.0176),
Pb (0.0011), Zn (0.0074)
Cu (70.18), Fe (34,100),
Pb (16.50), Cd (0.26),
Zn (73.92)
[27]
Mariout Lake, EgyptCu (0.019), Fe (1.145),
Pb (0.0596),Cd (0.0099),
Zn (0.13)
NA[28]
Agodi Reservoir,
Nigeria
Cu (35.93), Fe (254.25),
Cd (0.36), Zn (134.52)
NA[29]
Groundwater, Linares, MexicoCu (0.0017), Fe (0.01),
Pb (0.00013), Cd (0.06),
Zn (0.05)
NA[30]
Table 2. Rice husk composition.
Lignin (%)Holocellulose (%)Ash (%)Humidity (%)
Hemicellulose (%)Cellulose
(%)
28.4016.0536.4015.463.69
Table 3. Parameters obtained from adsorption kinetics pseudo-first and second-order using URH and RHTA.
Adsorption Kinetics
Pseudo-First-Order
URHRHTA
qeK1R2qeK1R2
Cu1.245−5.0 × 10−50.8860.906−5.76 × 10−60.738
Pb2.005−2.22 × 10−60.8702.416−7.09 × 10−60.763
Fe0.864−9.50 × 10−60.9481.037−7.58 × 10−60.925
Cd2.196−3.25 × 10−60.9172.219−1.03 × 10−50.939
Zn1.771−3.33 × 10−60.9461.383−1.23 × 10−50.805
Pseudo-Second-Order
URHRHTA
qeK2R2qeK2R2
Cu2.3230.0220.9940.7000.0260.919
Pb1.4790.0200.9782.7990.0030.886
Fe1.4610.0180.9741.4880.0060.951
Cd1.7400.0040.8913.3080.0010.913
Zn2.4870.0070.9302.5690.0110.983
Table 4. Parameters obtained from Langmuir and Freundlich models isotherms using URH and RHTA.
Adsorption Isotherms Models
Langmuir
URHRHTA
qm,
(mg/g)
b,
(L/mg)
R2qm,
(mg/g)
b,
(L/mg)
R2
Cu2.6840.1180.9101.6270.1520.914
Pb2.4700.1170.9495.7690.0490.863
Fe2.9210.0350.8632.7150.0360.884
Cd6.8500.0240.7205.0320.0390.537
Zn3.0400.0590.9573.1360.0580.784
Freundlich
URHRHTA
Kf,
(mg/g)
NR2Kf,
(mg/g)
NR2
Cu0.5312.8800.9990.3672.6630.950
Pb0.0400.6540.9860.1411.4820.980
Fe0.1211.2160.9650.3661.5990.957
Cd0.2111.2970.9870.3241.6520.842
Zn0.0590.8250.9630.0480.7640.944
Disclaimer/Publisher’s Note: The statements, opinions and data contained in all publications are solely those of the individual author(s) and contributor(s) and not of MDPI and/or the editor(s). MDPI and/or the editor(s) disclaim responsibility for any injury to people or property resulting from any ideas, methods, instructions or products referred to in the content.