
The Application of Wood Biowaste Chemically Modified by Bi2O3 as a Sorbent Material for Wastewater Treatment

 , ,
, ,  ,
,  ,
, 
Abstract
1. Introduction
2. Materials and Methods
2.1. Reagents
2.2. Synthesis
2.3. Characterization
2.4. Sorption and Desorption Study
2.5. Kinetic and Isotherm Study
3. Results and Discussion
3.1. Characterization
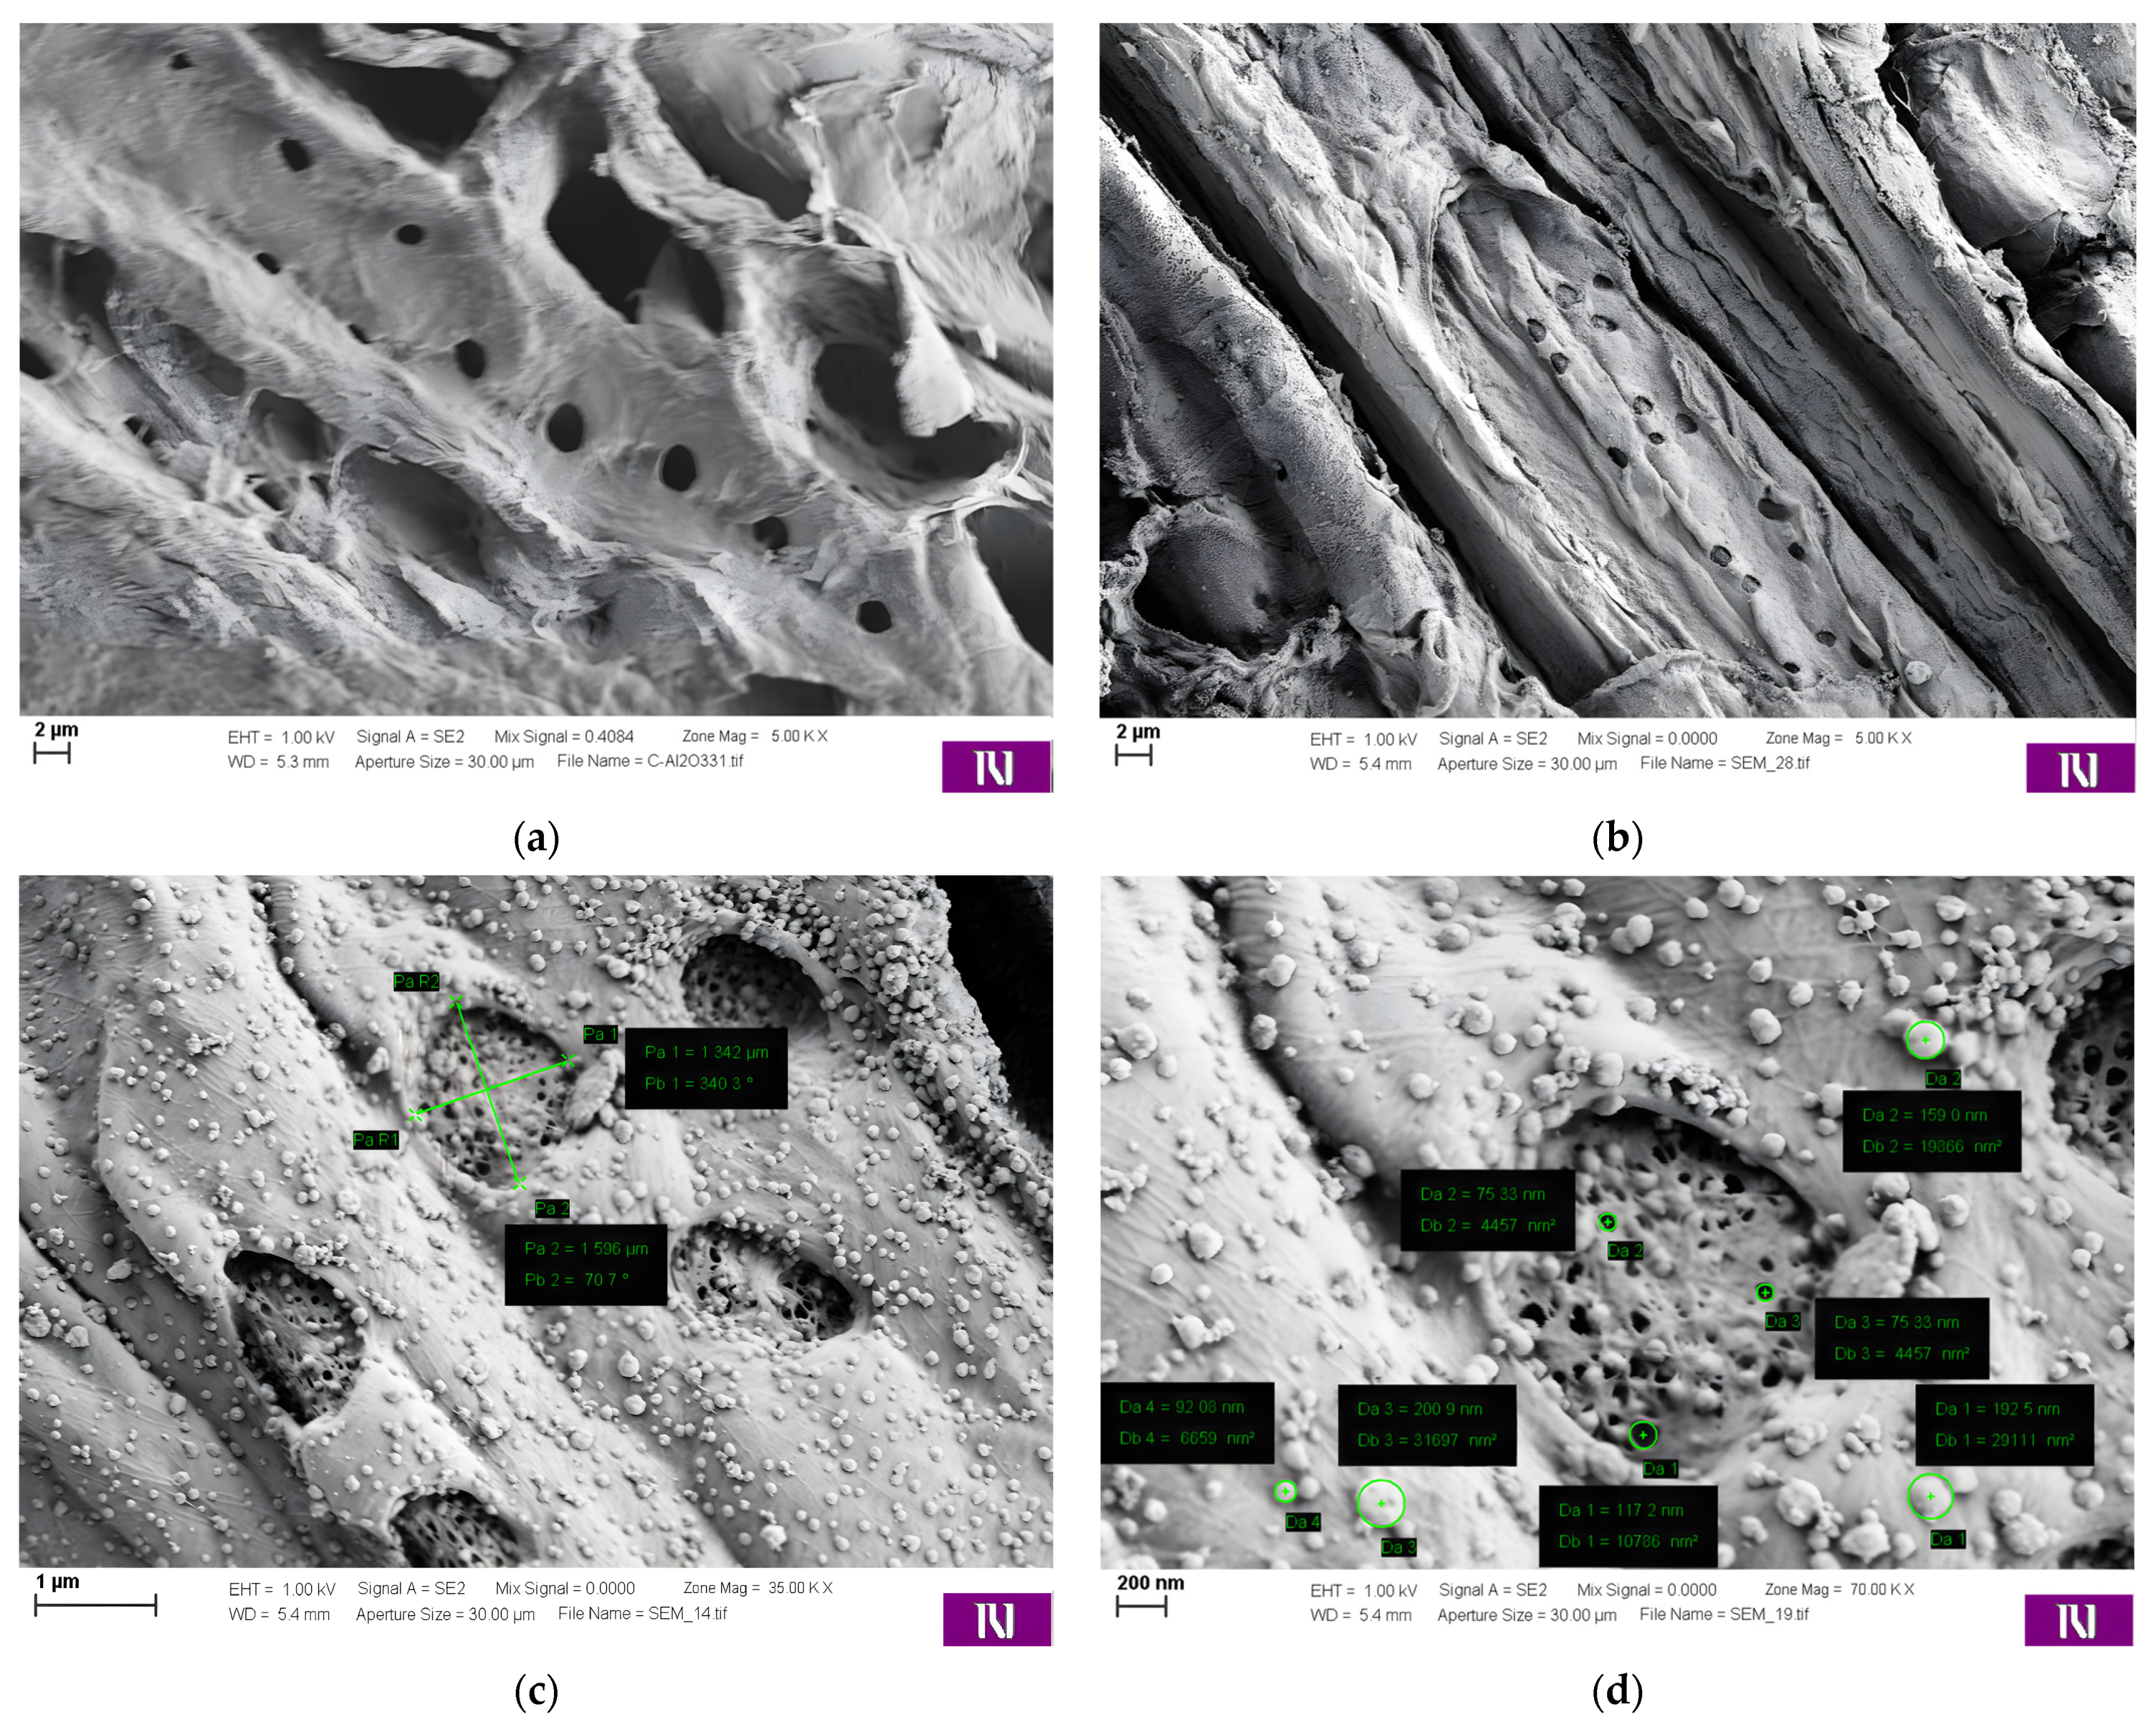
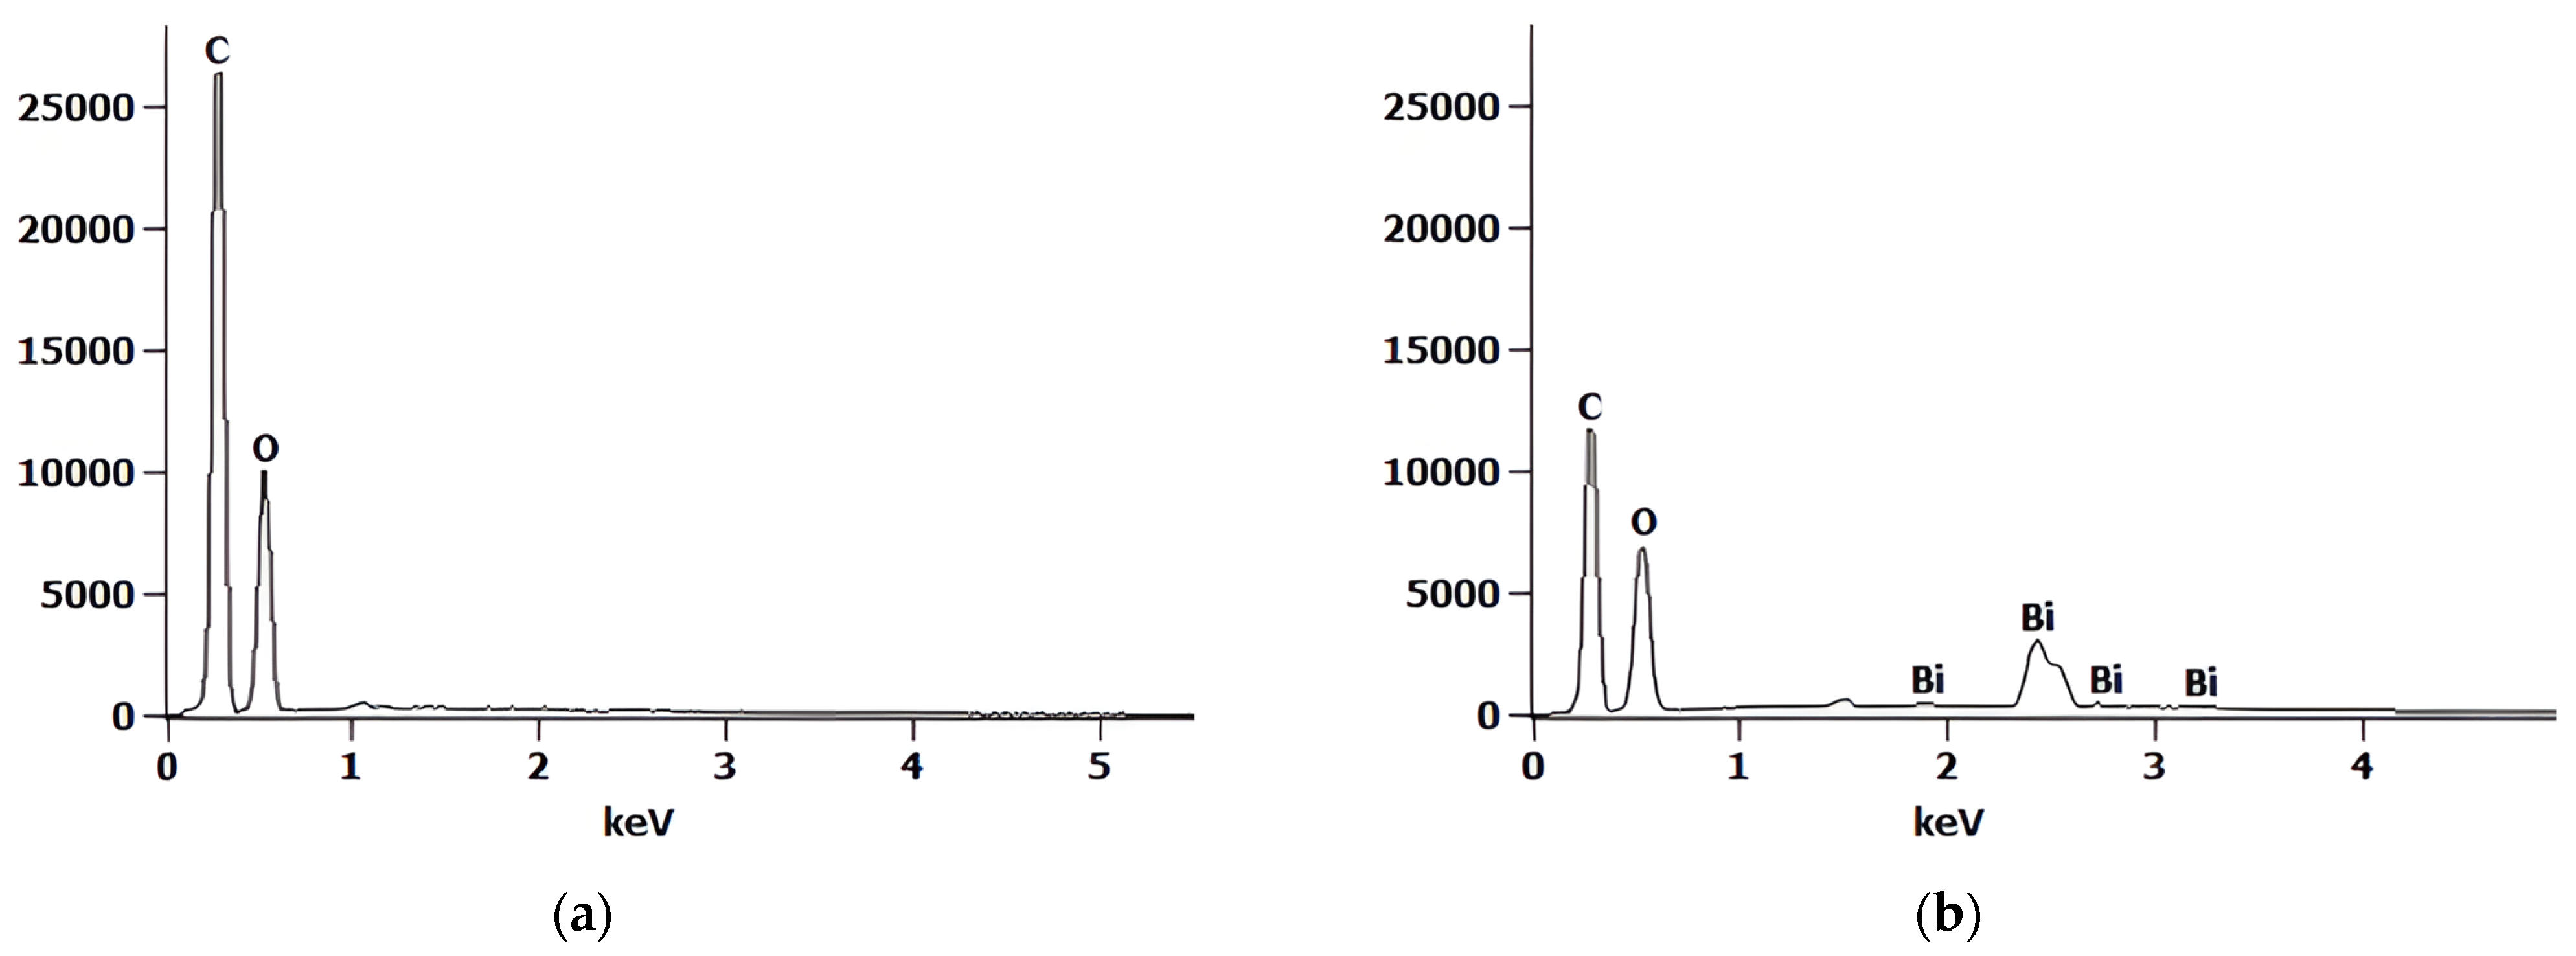
3.1.1. SEM-EDX
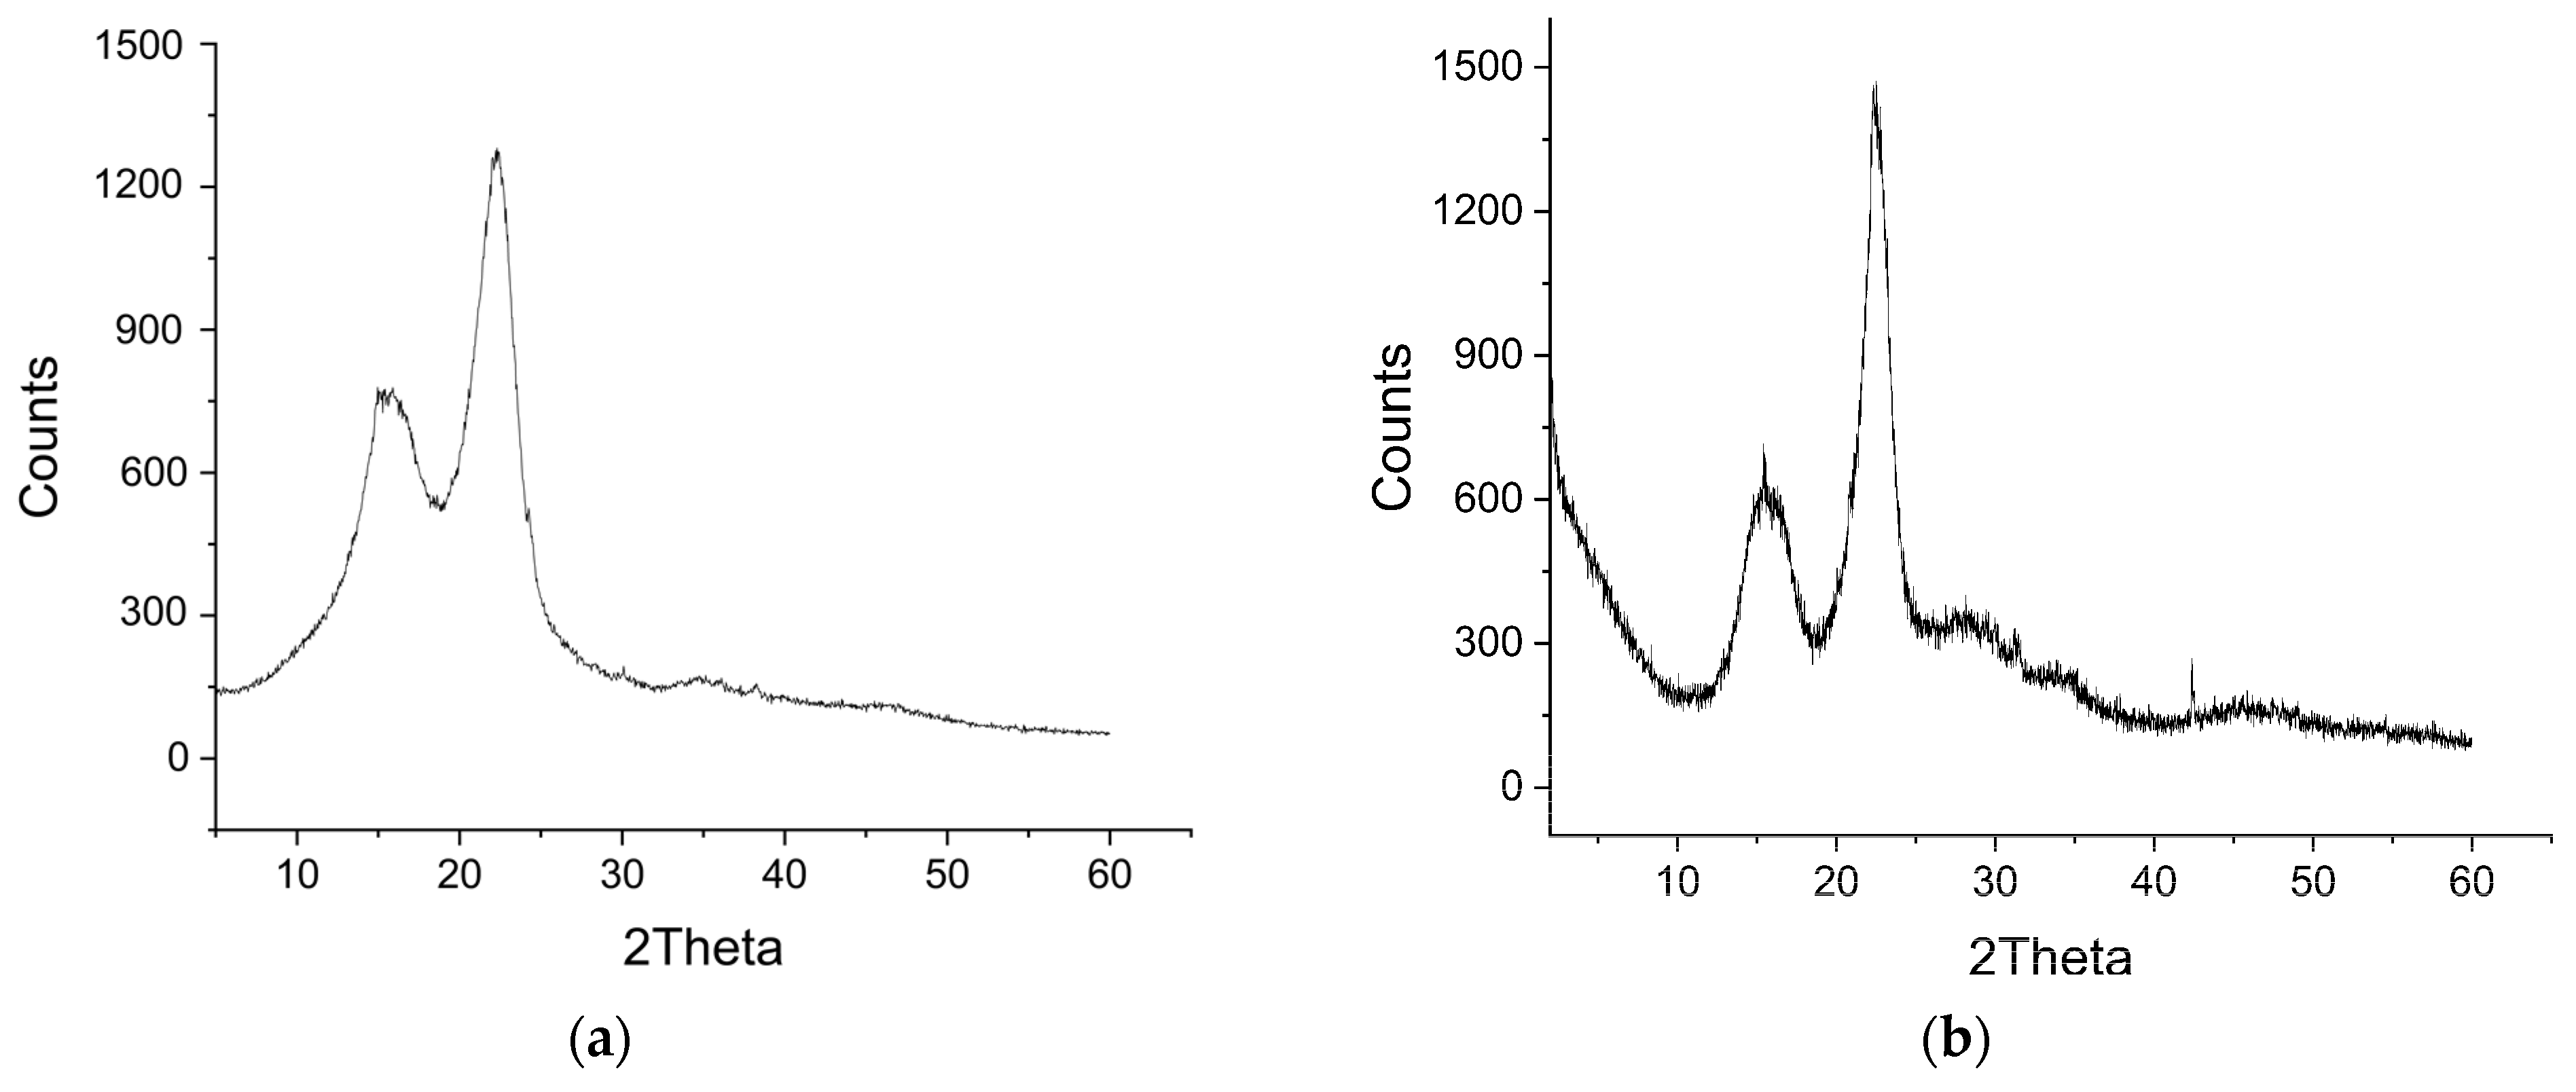
3.1.2. XRD
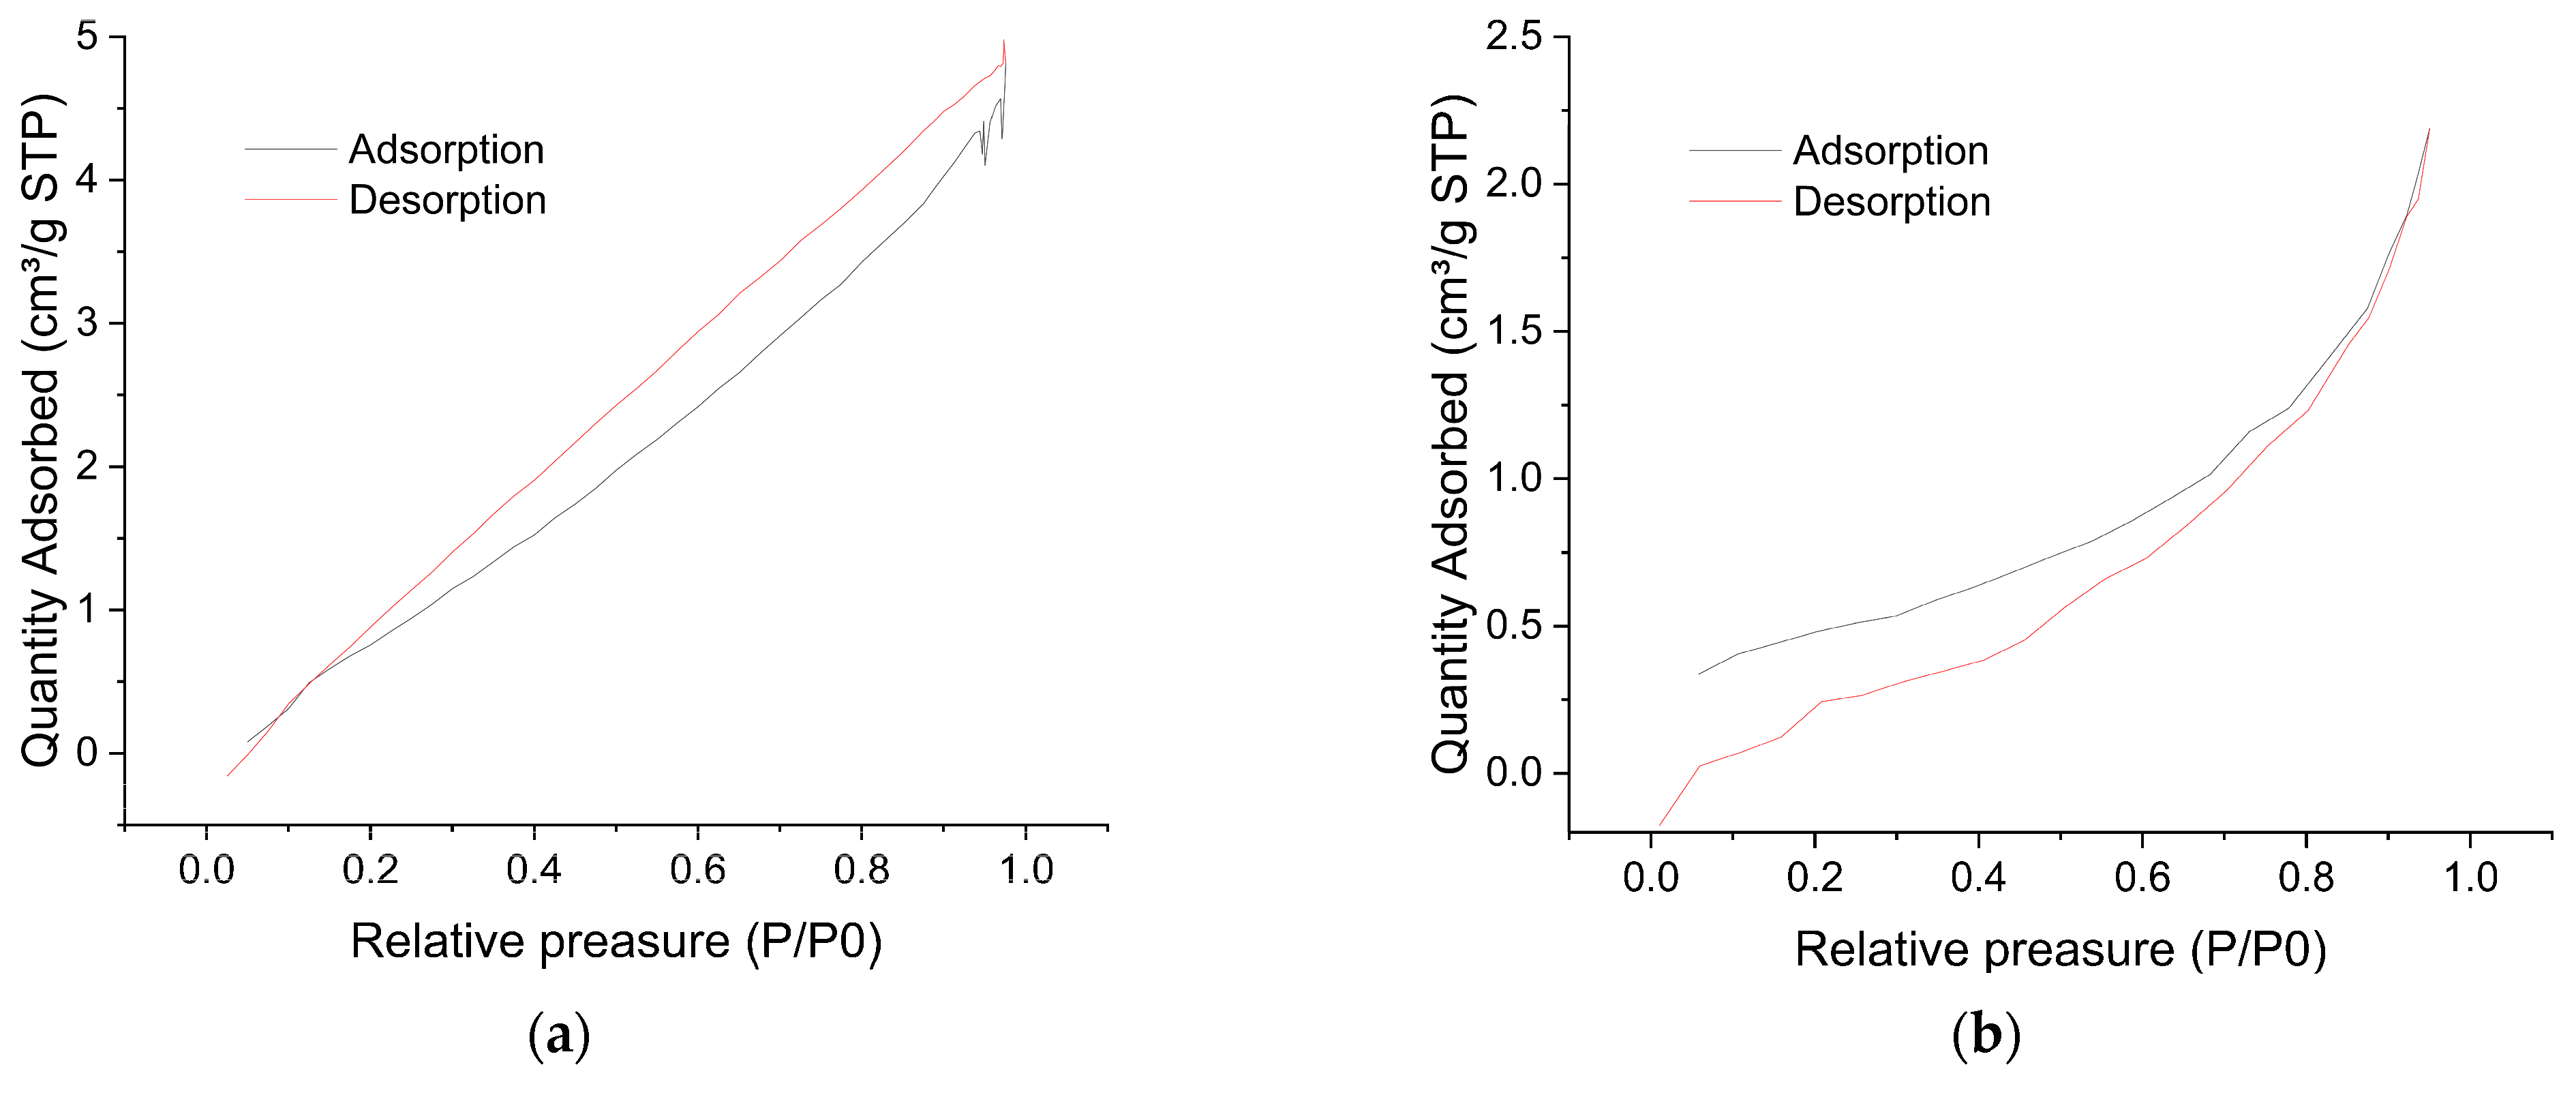
3.1.3. BET
3.1.4. FTIR
3.1.5. PZC
3.2. Sorption and Desorption Study
3.2.1. Contact Time
3.2.2. pH
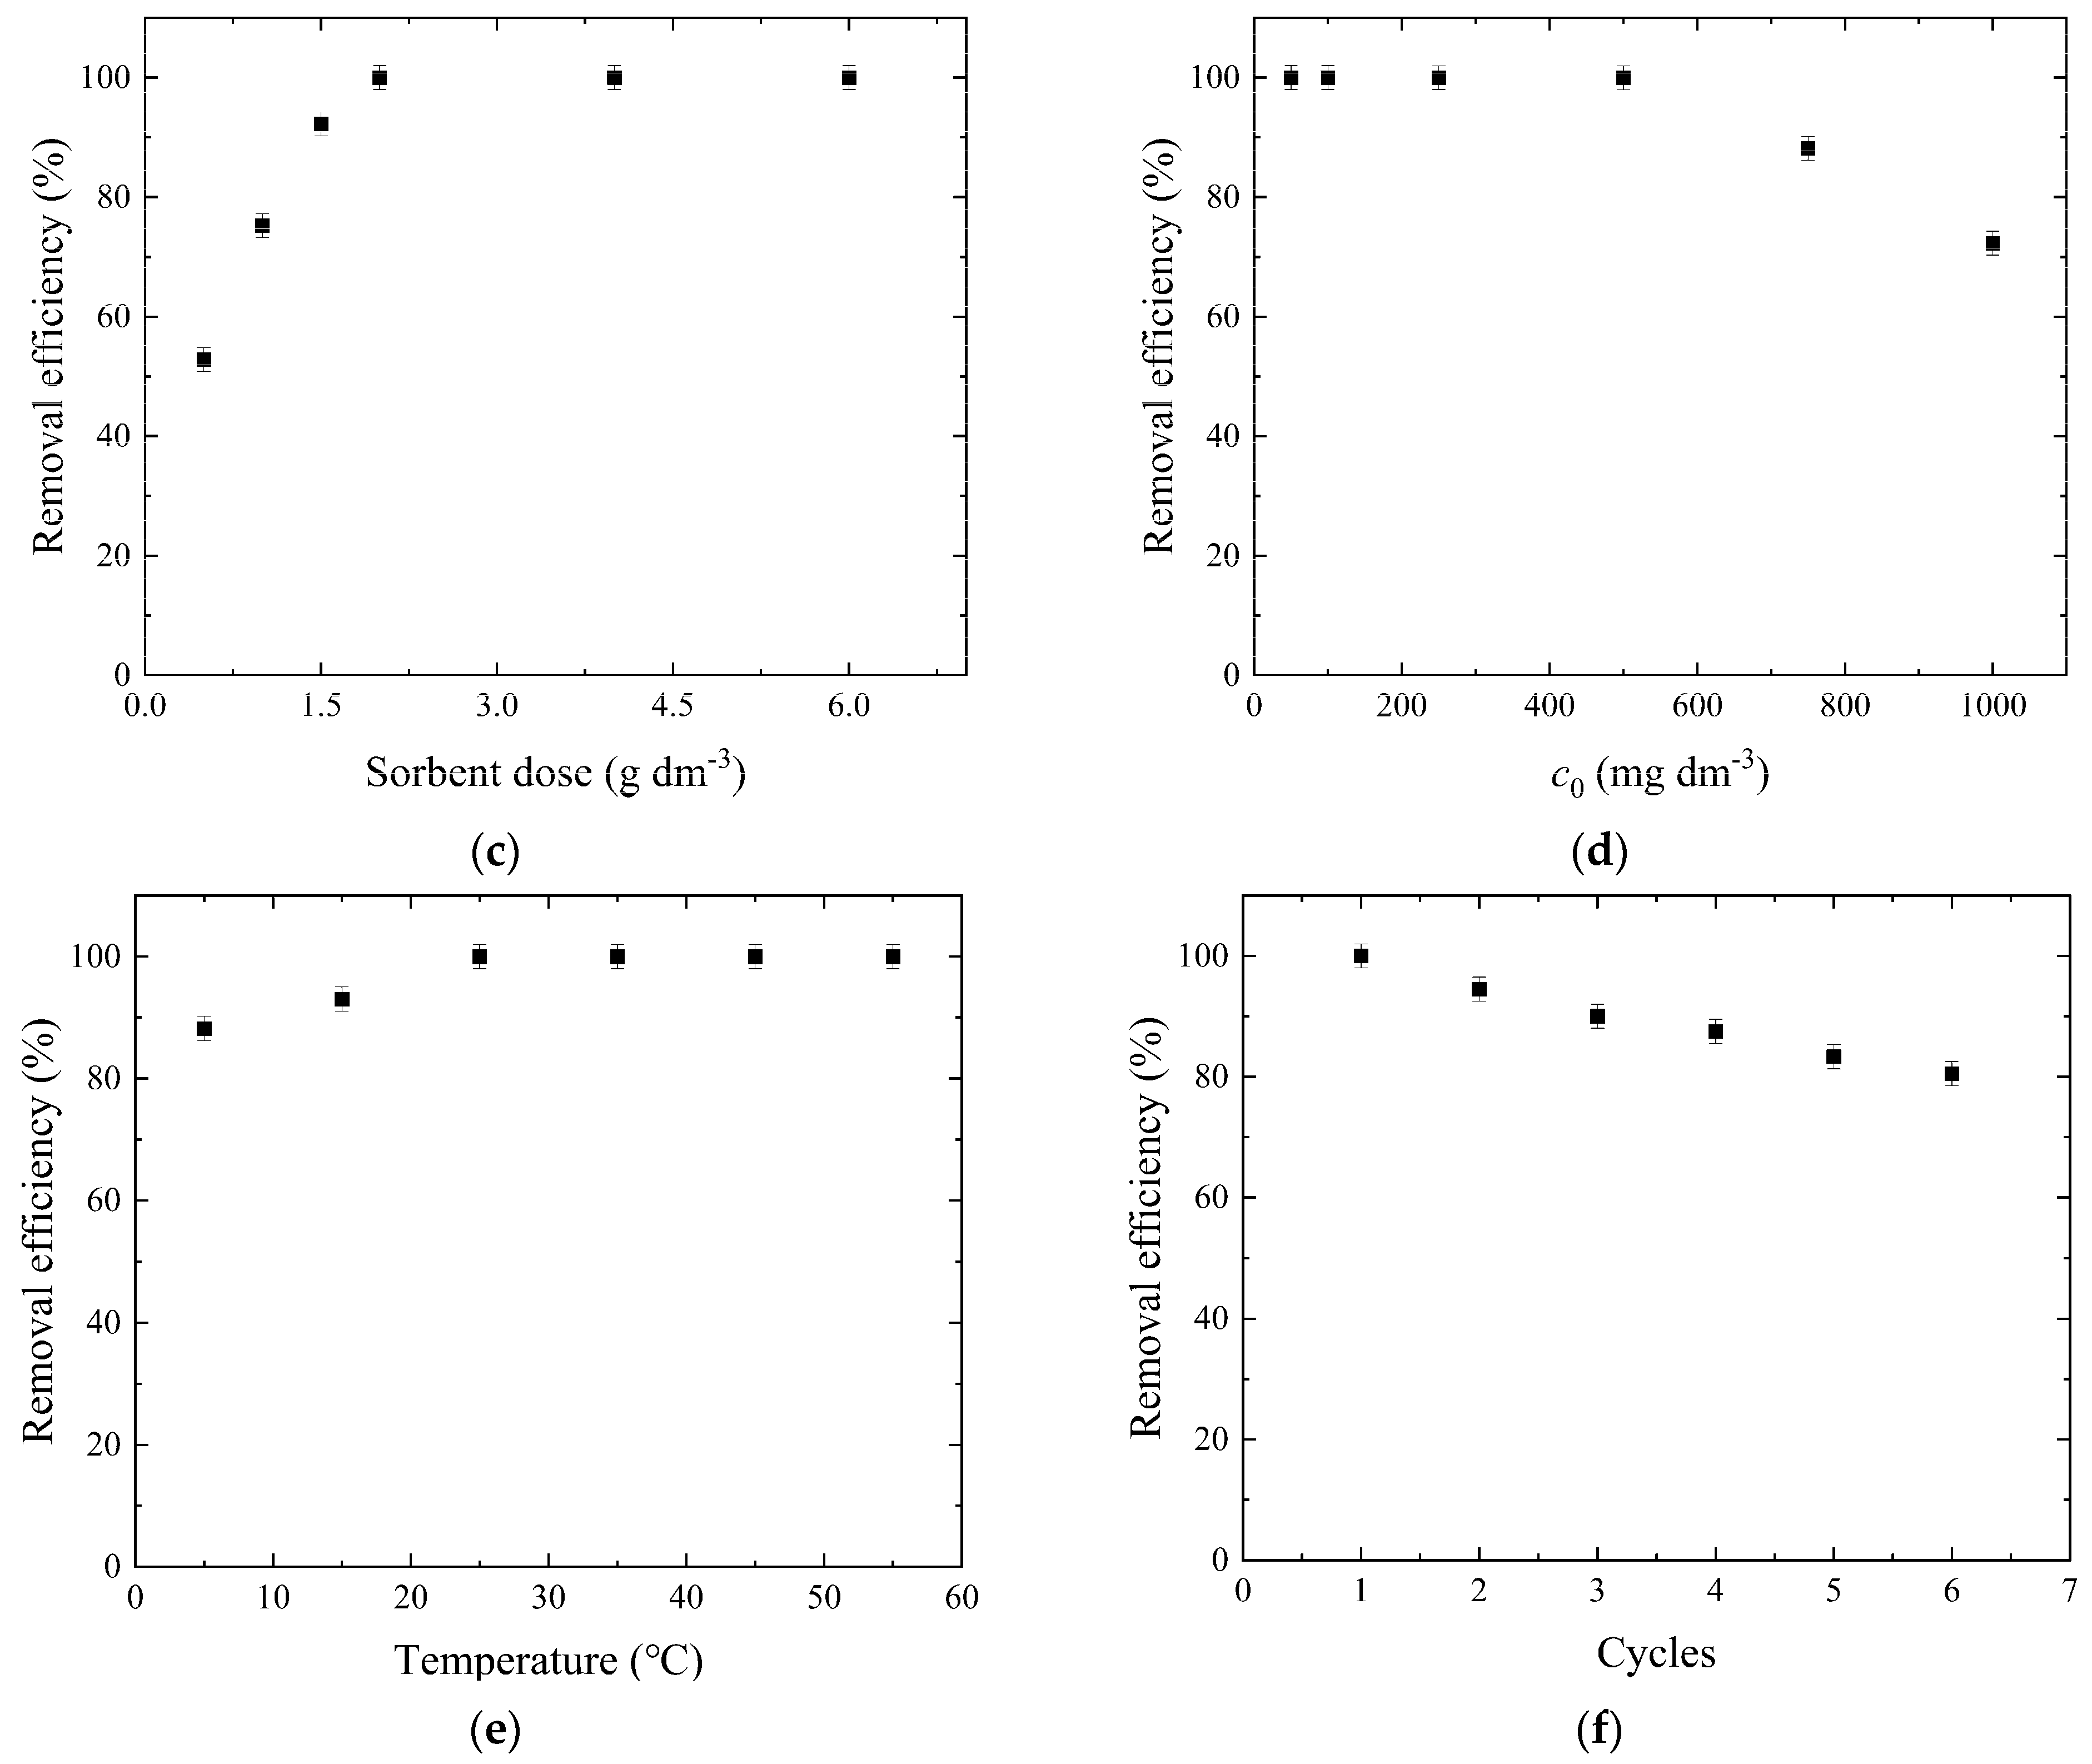
3.2.3. Sorbent Dose
3.2.4. Dye Concentration
3.2.5. Temperature
3.2.6. Desorption and Reusability
3.3. Kinetic and Isotherm Study
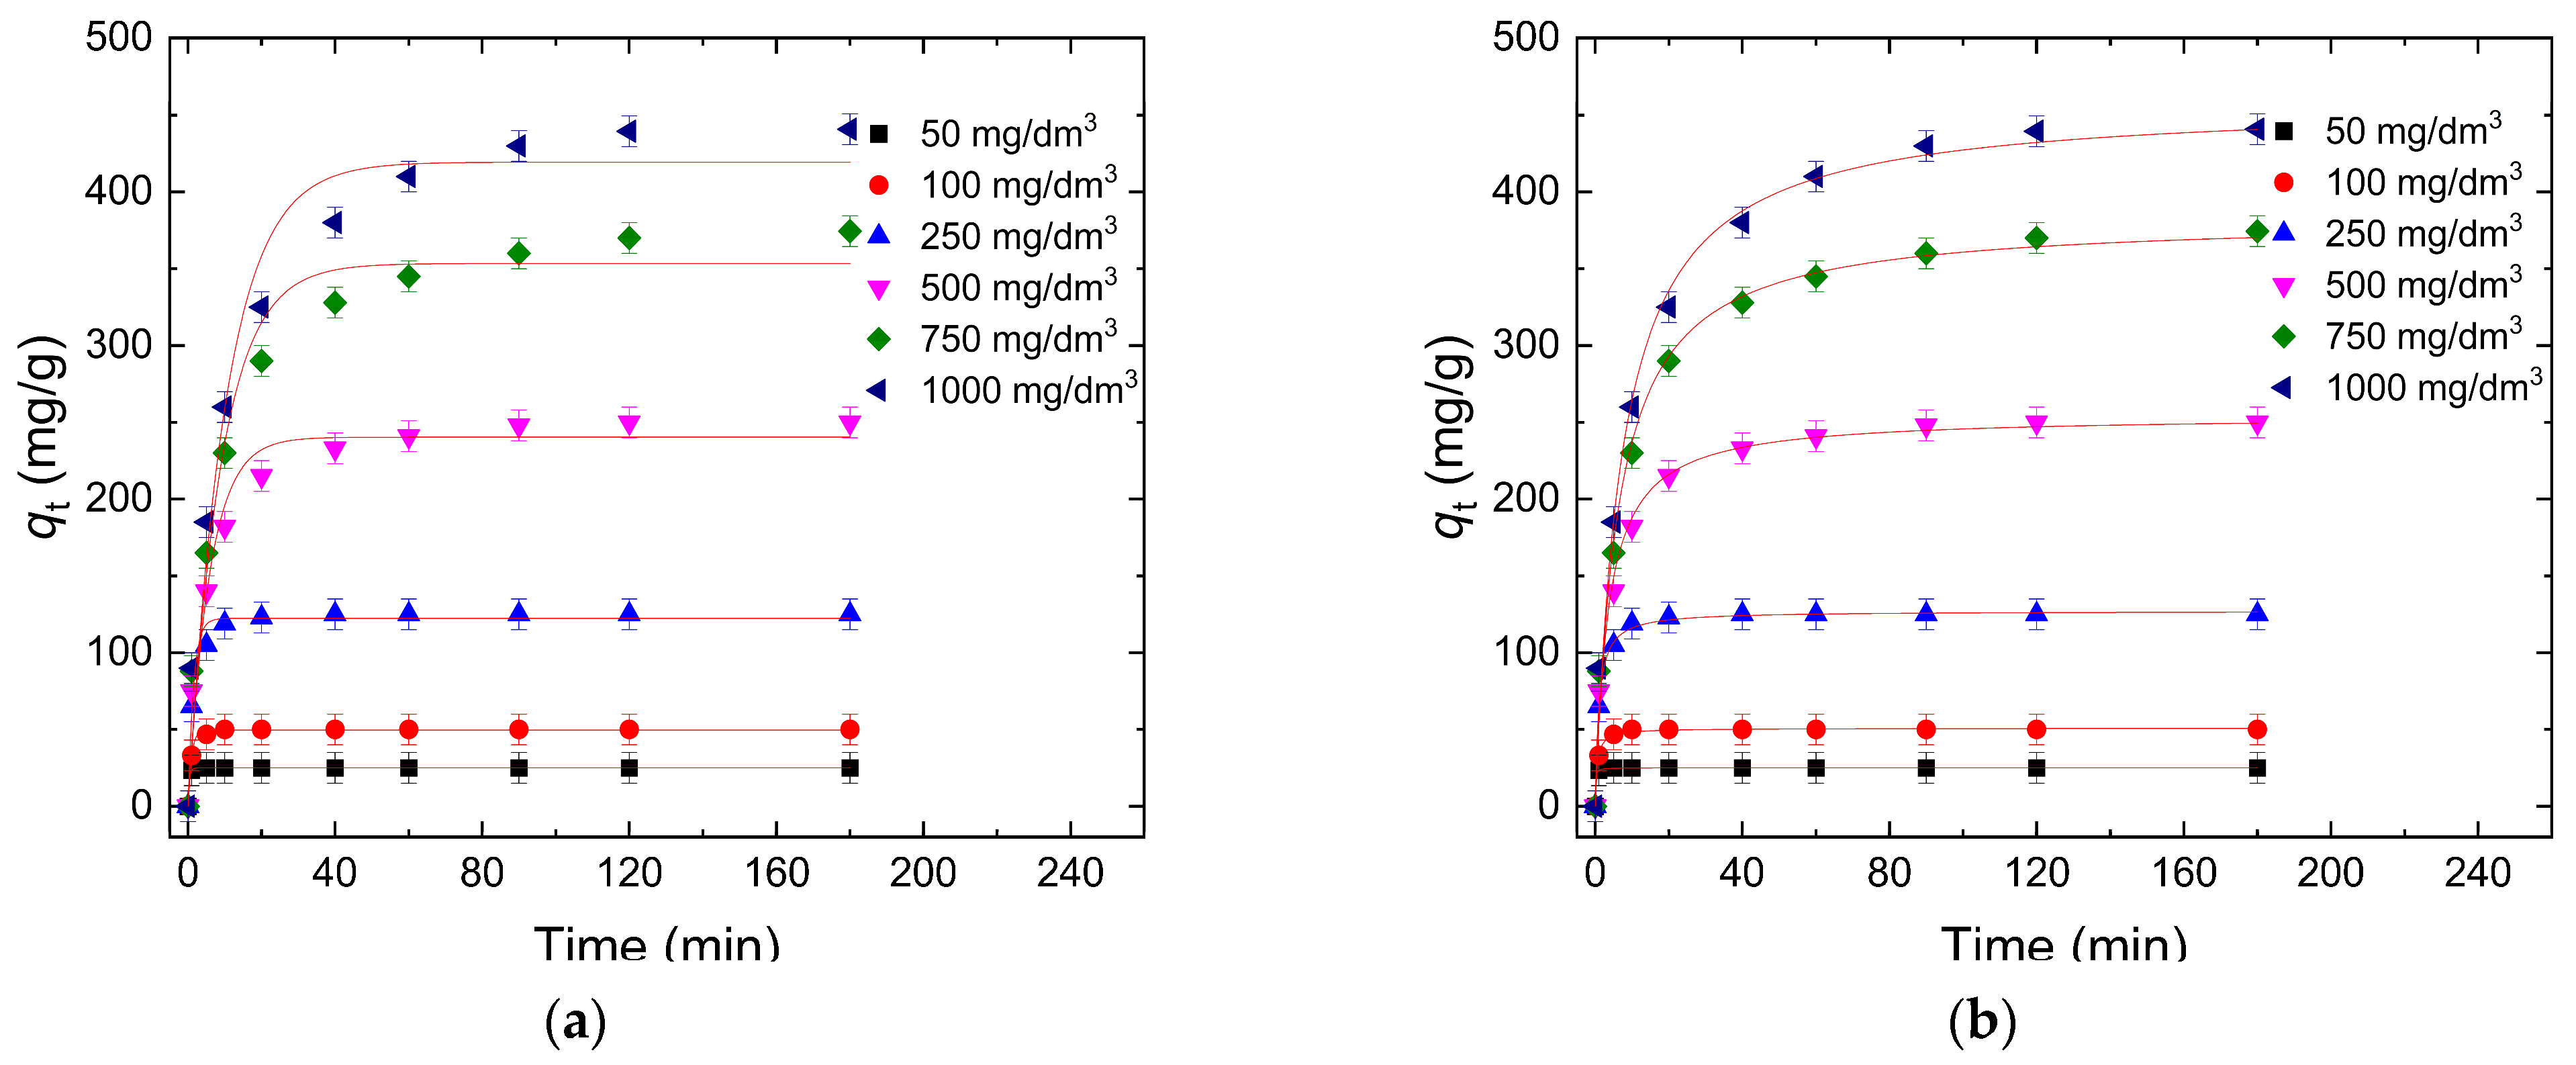
3.3.1. Sorption Kinetic
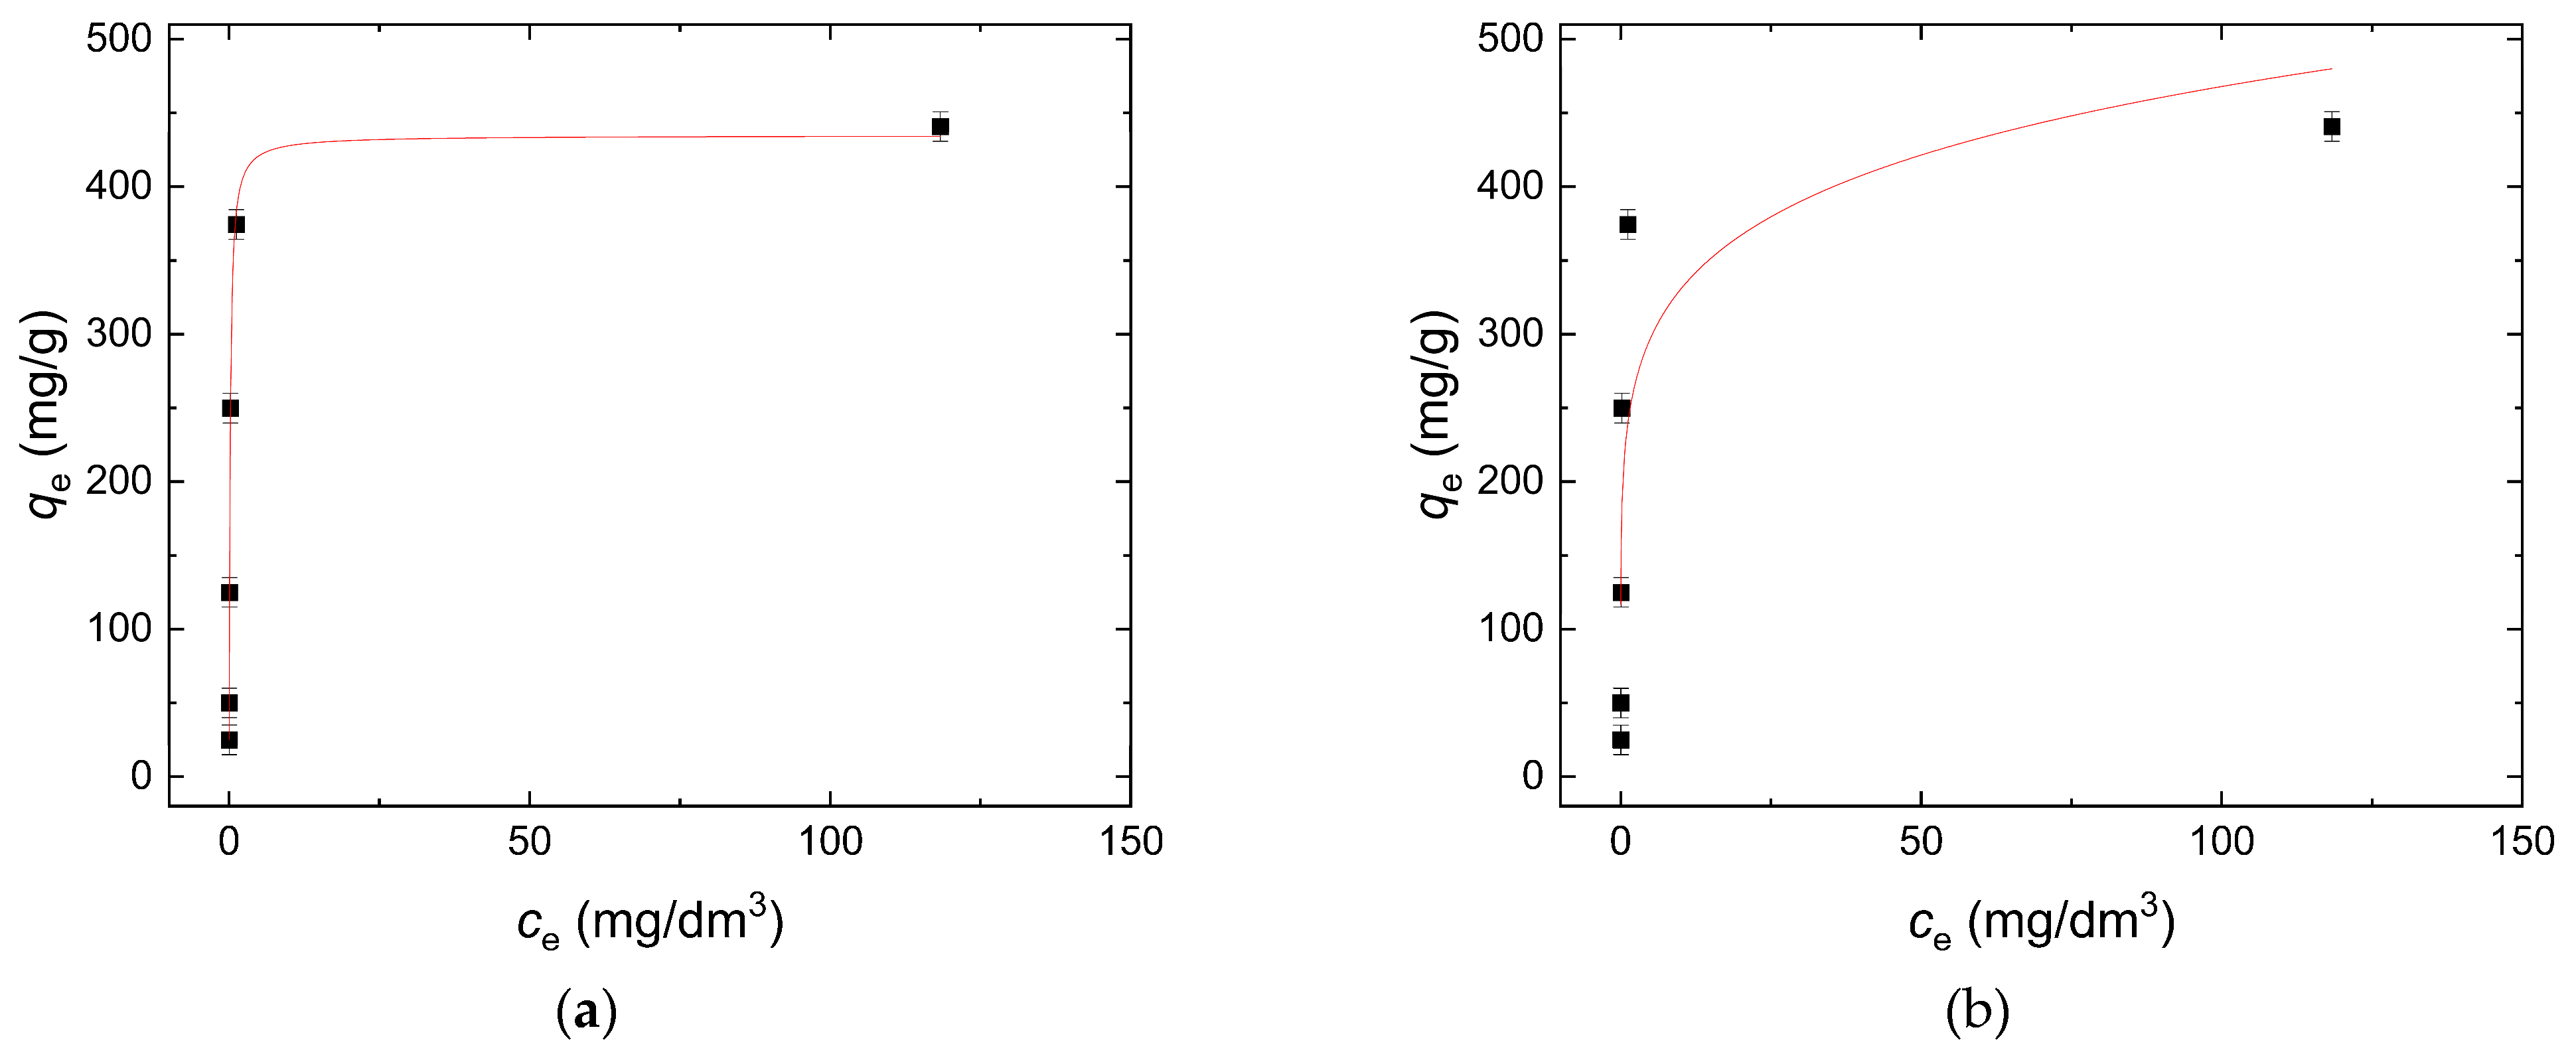
3.3.2. Sorption Isotherm
4. Conclusions
Supplementary Materials
Author Contributions
Funding
Data Availability Statement
Acknowledgments
Conflicts of Interest
References
- World Health Organization (WHO). Drinking-Water. 2023. Available online: https://www.who.int/news-room/fact-sheets/detail/drinking-water (accessed on 23 August 2024).
- United States Environmental Protection Agency (EPA). Nutrient Pollution: Sources and Solutions. 2023. Available online: https://www.epa.gov/nutrientpollution/sources-and-solutions (accessed on 23 August 2024).
- Centers for Disease Control and Prevention (CDC). What Causes Tap Water Contamination. 2023. Available online: https://www.cdc.gov/drinking-water/causes/?CDC_AAref_Val=https://www.cdc.gov/healthywater/drinking/contamination.html (accessed on 23 August 2024).
- European Parliament (EP). The Impact of Textile Production and Waste on the Environment (Infographics). 2020. Available online: https://www.europarl.europa.eu/topics/en/article/20201208STO93327/the-impact-of-textile-production-and-waste-on-the-environment-infographics (accessed on 23 August 2024).
- Christie, R.M. Environmental Aspects of Textile Dyeing; Woodhead Publishing: Sawston, UK, 2007; pp. 1–239. [Google Scholar]
- Wang, Z.; Xue, M.; Huang, K.; Liu, Z. Textile Dyeing Wastewater Treatment. In Advances in Treating Textile Wastewater; Hauser, P., Ed.; IntechOpen: London, UK, 2011; Volume 3, pp. 91–116. [Google Scholar]
- Khattab, T.A.; Abdelrahman, M.S.; Rehan, M. Textile Dyeing Industry: Environmental Impacts and Remediation. Environ. Sci. Eng. 2020, 27, 3803–3818. [Google Scholar] [CrossRef] [PubMed]
- Pehlivan, M.; Simsek, S.; Ozbek, S.; Ozbek, B. An optimization study on adsorption of Reactive Blue 19 dye from aqueous solutions by extremely effective and reusable novel magnetic nanoadsorbent. Desalination Water Treat. 2020, 191, 438–451. [Google Scholar] [CrossRef]
- Food and Agriculture Organization of the United Nations (FAO). Water Pollution from Agriculture: A Global Review. 2018. Available online: https://www.fao.org/3/ca0146en/CA0146EN.pdf (accessed on 23 August 2024).
- Al-Tohamy, R.; Ali, S.S.; Li, F.; Okasha, K.M.; Mahmoud, Y.A.-G.; Elsamahy, T.; Jiao, H.; Fu, Y.; Sun, J. A critical review on the treatment of dye-containing wastewater: Ecotoxicological and health concerns of textile dyes and possible remediation approaches for environmental safety. Ecotoxicol. Environ. Saf. 2022, 231, 113160. [Google Scholar] [CrossRef] [PubMed]
- Periyasamy, A.P. Recent Advances in the Remediation of Textile-Dye-Containing Wastewater: Prioritizing Human Health and Sustainable Wastewater Treatment. Sustainability 2024, 16, 495. [Google Scholar] [CrossRef]
- Mun, H.; Ri, C.; Liu, Q.; Tang, J. Characteristics of ball-milled PET plastic char for the adsorption of different types of aromatic organic pollutants. Environ. Sci. Pollut. Res. 2022, 29, 77685–77697. [Google Scholar] [CrossRef]
- Barracco, F.; Parisi, E.; Pipitone, G.; Simone, E.; Bensaid, S.; Fino, D. Valorization of pyrolytic plastic-derived char for adsorption of wastewater contaminants: A kinetic and thermodynamic investigation. Int. J. Environ. Sci. Technol. 2024, 21, 6513–6530. [Google Scholar] [CrossRef]
- Tran, H.N.; Nguyen, H.C.; Woo, S.H.; Nguyen, T.V. Removal of Various Contaminants from Water by Renewable Lignocellulose-Derived Biosorbents: A Comprehensive and Critical Review. Crit. Rev. Environ. Sci. Technol. 2019, 49, 2155–2219. [Google Scholar] [CrossRef]
- Fatma, S.; Hameed, A.; Noman, M.; Ahmed, T. Lignocellulosic Biomass: A Sustainable Bioenergy Source for the Future. Protein Pept. Lett. 2018, 25, 148–163. [Google Scholar] [CrossRef]
- Sugiarto, S.; Pong, R.R.; Tan, Y.C.; Leow, Y. Advances in Sustainable Polymeric Materials from Lignocellulosic Biomass. Mater. Today 2022, 26, 101022. [Google Scholar] [CrossRef]
- Peng, B.; Yao, Z.; Wang, X.; Crombeen, M. Cellulose-Based Materials in Wastewater Treatment of Petroleum Industry. J. Energy Environ. 2020, 5, 37–49. [Google Scholar] [CrossRef]
- Rao, J.; Lv, Z.; Chen, G.; Peng, F. Hemicellulose: Structure, Chemical Modification, and Application. Prog. Polym. Sci. 2023, 140, 101675. [Google Scholar] [CrossRef]
- Sajjadi, M.; Ahmadpoor, F.; Nasrollahzadeh, M. Lignin-Derived (Nano) Materials for Environmental Pollution Remediation: Current Challenges and Future Perspectives. Int. J. Environ. Pollut. 2021, 178, 394–423. [Google Scholar] [CrossRef] [PubMed]
- Hossain, M.J.; Ghosh, R.K.; Das, A.K.; Nath, S.C.; Islam, M.R.; Akhter, S.; Rahman, M.S. Investigation of the chemical profiles of seven wood species for their potential applications. Wood Mater. Sci. Eng. 2023, 18, 650–655. [Google Scholar] [CrossRef]
- Dhanasekaran, P.; Sahu, O. Arsenate and fluoride removal from groundwater by sawdust impregnated ferric hydroxide and activated alumina (SFAA). Groundw. Sustain. Dev. 2021, 12, 100490. [Google Scholar] [CrossRef]
- Ghasemi, A.; Sohrabi, M.R.; Motiee, F. Application of a Sawdust/Fe3O4 and Sawdust/Fe3O4/PEI as a Selective Adsorbent for Pb(II) Removal. Russ. J. Appl. Chem. 2017, 90, 2033–2038. [Google Scholar] [CrossRef]
- Pecoraro, E.; Pelé-Meziani, C.; Macchioni, N.; Lemoine, G.; Guilminot, E.; Shen, D.; Pizzo, B. The removal of iron from waterlogged archaeological wood: Efficacy and effects on the room temperature wood properties. Wood Mater. Sci. Eng. 2022, 18, 672–689. [Google Scholar] [CrossRef]
- Abegunde, S.M.; Idowu, K.S.; Adejuwon, O.M.; Adeyemi-Adejolu, T. A review on the influence of chemical modification on the performance of adsorbents. Resour. Environ. Sustain. 2020, 1, 100001. [Google Scholar] [CrossRef]
- Nyakairu, G.W.A.; Kapanga, P.M.; Ntale, M.; Lusamba, S.N.; Tshimanga, R.M.; Ammari, A.; Shehu, Z.S. Synthesis, characterization and application of Zeolite/Bi2O3 nanocomposite in removal of Rhodamine B dye from wastewater. Clean. Water 2024, 1, 100004. [Google Scholar] [CrossRef]
- Brunauer, S.; Emmett, P.H.; Teller, E. Adsorption of gases in multimolecular layers. J. Am. Chem. Soc. 1938, 60, 309–319. [Google Scholar] [CrossRef]
- Barrett, E.P.; Joyner, L.G.; Halenda, P.P. The determination of pore volume and area distributions in porous substances. I. Computations from nitrogen isotherms. J. Am. Chem. Soc. 1951, 73, 373–380. [Google Scholar] [CrossRef]
- Lagergren, S. Zur Theorie der sogenannten Adsorption gelöster Stoffe. Kungl. Sven. Vetensk. Handl. 1898, 24, 1–39. [Google Scholar]
- Ho, Y.S.; McKay, G. Kinetic models for the sorption of dye from aqueous solution by wood. Process Saf. Environ. Prot. 1998, 76, 183–191. [Google Scholar] [CrossRef]
- Langmuir, I. The adsorption of gases on plane surfaces of glass, mica and platinum. J. Am. Chem. Soc. 1918, 40, 1361–1403. [Google Scholar] [CrossRef]
- Freundlich, H.Z. Over the adsorption in solution. J. Phys. Chem. 1906, 57A, 385–470. [Google Scholar]
- Oudghiri-Hassani, H.; Rakass, S.; Al Wadaani, F.T.; Al-ghamdi, K.J.; Omer, A.; Messali, M.; Abboudi, M. Synthesis, characterization and photocatalytic activity of α-Bi2O3 nanoparticles. J. Taibah Univ. Sci. 2015, 9, 508–512. [Google Scholar] [CrossRef]
- Hokkanen, S.; Bhatnagar, A.; Sillanpää, M. A review on modification methods to cellulose-based adsorbents to improve adsorption capacity. Water Res. 2016, 91, 156–173. [Google Scholar] [CrossRef]
- Akbar, M.I.; Armynah, B.; Tahir, D. Comprehensive review of wood-based composites as microwave absorbers: Utilizing wood-derived materials such as carbon, metal/metal oxides, and polymer composites as fillers. Ind. Crops Prod. 2024, 220, 119397. [Google Scholar] [CrossRef]
- Lehto, J.; Louhelainen, J.; Kłosińska, T.; Drożdżek, M.; Alén, R. Characterization of alkali-extracted wood by FTIR-ATR spectroscopy. Biomass Conv. Biorefin. 2018, 8, 847–855. [Google Scholar] [CrossRef]
- Duan, G.; Zhang, C.; Li, A.; Yang, X.; Lu, L.; Wang, X. Preparation and characterization of mesoporous zirconia made by using a poly(methyl methacrylate) template. Nanoscale Res. Lett. 2008, 3, 118–122. [Google Scholar] [CrossRef]
- Gil, A.; Taoufik, N.; García, A.M.; Korili, S.A. Comparative removal of emerging contaminants from aqueous solution by adsorption on an activated carbon. Environ. Technol. 2018, 40, 3017–3030. [Google Scholar] [CrossRef]
- Saravanan, A.; Karishma, S.; Jeevanantham, S.; Jeyasri, S.; Kiruthika, A.R.; Kumar, P.S.; Yaashikaa, P.R. Optimization and Modeling of Reactive Yellow Adsorption by Surface Modified Delonix regia Seed: Study of Nonlinear Isotherm and Kinetic Parameters. Surf. Interfaces 2020, 20, 100520. [Google Scholar] [CrossRef]
- Tripathi, N. Cationic and Anionic Dye Adsorption by Agricultural Solid Wastes: A Comprehensive Review. IOSR J. Appl. Chem. 2013, 5, 91–108. [Google Scholar] [CrossRef]
- He, C.; Hu, X. Anionic Dye Adsorption on Chemically Modified Ordered Mesoporous Carbons. Ind. Eng. Chem. Res. 2011, 50, 14070–14083. [Google Scholar] [CrossRef]
- Munagapati, V.S.; Wen, H.-Y.; Gollakota, A.R.K.; Wen, J.-C.; Lin, K.-Y.A.; Shu, C.-M.; Reddy, G.M.; Zyryanov, G.V.; Wen, J.-H.; Tian, Z. Removal of Sulfonated Azo Reactive Red 195 Textile Dye from Liquid Phase Using Surface-Modified Lychee (Litchi chinensis) Peels with Quaternary Ammonium Groups: Adsorption Performance, Regeneration, and Mechanism. J. Mol. Liq. 2022, 368, 120657. [Google Scholar] [CrossRef]
- Gemici, B.T.; Ozel, H.U.; Ozel, H.B. Removal of Methylene Blue onto Forest Wastes: Adsorption Isotherms, Kinetics, and Thermodynamic Analysis. Environ. Technol. Innov. 2021, 22, 101501. [Google Scholar] [CrossRef]
- Tahir, M.A.; Bhatti, H.N.; Iqbal, M. Solar Red and Brittle Blue Direct Dyes Adsorption onto Eucalyptus angophoroides Bark: Equilibrium, Kinetics and Thermodynamic Studies. J. Environ. Chem. Eng. 2016, 4, 2431–2439. [Google Scholar] [CrossRef]
- Jawad, A.H.; Sahu, U.K.; Jani, N.A.; ALOthman, Z.A.; Wilson, L.D. Magnetic crosslinked chitosan-tripolyphosphate/MgO/Fe3O4 nanocomposite for reactive blue 19 dye removal: Optimization using desirability function approach. Surf. Interfaces 2022, 28, 101698. [Google Scholar] [CrossRef]
- Abdulhameed, A.S.; Hapiz, A.; Musa, S.A.; Kashi, E.; Wu, R.; ALOthman, Z.A.; Jawad, A.H.; Algburi, S. Organically modified montmorillonite composited with magnetic glyoxal-chitosan Schiff base for reactive blue 19 dye removal: Process optimization and adsorptive mechanism. Int. J. Biol. Macromol. 2024, 256, 128463. [Google Scholar] [CrossRef]
- Jawad, A.H.; Abdulhameed, A.S.; Surip, S.N.; Alothman, Z.A. Hybrid multifunctional biocomposite of chitosan grafted benzaldehyde/montmorillonite/algae for effective removal of brilliant green and reactive blue 19 dyes: Optimization and adsorption mechanism. J. Clean. Prod. 2023, 393, 136334. [Google Scholar] [CrossRef]
- Doondani, P.; Panda, D.; Gomase, V.; Peta, K.R.; Jugade, R. Novel Chitosan-ZnO nanocomposites derived from Nymphaeaceae fronds for highly efficient removal of Reactive Blue 19, Reactive Orange 16, and Congo Red dyes. Environ. Res. 2024, 247, 118228. [Google Scholar] [CrossRef]
- Alia, K.; Reghioua, A.; Atia, D.; Mbuvi, H.M.; Moussaoui, Y.; Jawad, A.H. Magnetic chitosan-benzoin Schiff’s base/fly ash for reactive blue 19 dye removal: Characterization and parametric optimization. Inorg. Chem. Commun. 2024, 169, 112988. [Google Scholar] [CrossRef]
- Liang, H.; Zhao, X.; Li, N.; Zhang, H.; Geng, Z.; She, D. Three-dimensional lignin-based polyporous carbon@polypyrrole for efficient removal of reactive blue 19: A synergistic effect of the N and O groups. Int. J. Biol. Macromol. 2023, 239, 124220. [Google Scholar] [CrossRef] [PubMed]
- Jawad, A.H.; Abdulhameed, A.S.; Abd Malek, N.N.; ALOthman, Z.A. Statistical optimization and modeling for color removal and COD reduction of reactive blue 19 dye by mesoporous chitosan-epichlorohydrin/kaolin clay composite. Int. J. Biol. Macromol. 2020, 164, 4218–4230. [Google Scholar] [CrossRef] [PubMed]
- Aumeier, B.M.; Augustin, A.; Thönes, M.; Sablotny, J.; Wintgens, T.; Wessling, M. Linking the effect of temperature on adsorption from aqueous solution with solute dissociation. J. Hazard. Mater. 2022, 429, 128291. [Google Scholar] [CrossRef]
- Park, J.H.; Wang, J.J.; Meng, Y.; Wei, Z.; DeLaune, R.D.; Seo, D.C. Adsorption/Desorption Behavior of Cationic and Anionic Dyes by Biochars Prepared at Normal and High Pyrolysis Temperatures. Colloids Surf. A: Physicochem. Eng. Asp. 2019, 572, 274–282. [Google Scholar]
- Lahuri, A.H.; Rahim, A.A.; Nordin, N.; Adnan, R.; Jaafar, N.F.; Taufiq-Yap, Y.H. Comparative Studies on Adsorption Isotherm and Kinetic for CO2 Capture Using Iron Oxide Impregnated Activated Carbon. Catal. Today 2023, 418, 114111. [Google Scholar] [CrossRef]


| Sorbent | qm (mg/g) | Reference |
|---|---|---|
| chitosan-tripolyphosphate/MgO/Fe3O4 | 120.3 | [44] |
| chitosan-glyoxal/organically modified montmorillonite | 122.3 | [45] |
| chitosan grafted-benzaldehyde/montmorillonite/algae | 213.6 | [46] |
| chitosan-ZnO derived from Nymphaeaceae fronds | 219.6 | [47] |
| magnetic chitosan-benzoin/fly ash | 309.6 | [48] |
| wood biowaste modified with Bi2O3 | 434.75 | This study |
| lignin-based polyporous carbon@polypyrrole | 537.52 | [49] |
| mesoporous chitosan-epichlorohydrin/kaolin clay | 560.9 | [50] |
| Sorption Kinetics | |||||||
|---|---|---|---|---|---|---|---|
| Pseudo-First Order | Pseudo-Second Order | ||||||
| c0 (mg/dm3) | exp qe (mg/g) | qe (mg/g) | k1 (1/min) | r2 | qe (mg/g) | k2 (g/mg·min) | r2 |
| 50.0 | 25.00 ± 0.00 | 24.97 ± 0.00 | 2.68 ± 0.005 | 0.997 | 25.00 ± 0.00 | 4.09 ± 0.008 | 0.999 |
| 100.0 | 49.99 ± 0.01 | 49.62 ± 0.01 | 1.07 ± 0.002 | 0.995 | 50.00 ± 0.00 | 1.98 ± 0.004 | 0.999 |
| 250.0 | 124.97 ± 0.03 | 122.22 ± 0.03 | 0.65 ± 0.001 | 0.981 | 125.01 ± 0.01 | 1.07 ± 0.002 | 0.999 |
| 500.0 | 249.89 ± 0.11 | 234.87 ± 0.11 | 0.16 ± 0.0001 | 0.964 | 250.03 ± 0.03 | 0.29 ± 0.0001 | 0.997 |
| 750.0 | 374.40 ± 0.60 | 348.64 ± 0.60 | 0.10 ± 0.0001 | 0.961 | 375.05 ± 0.05 | 0.17 ± 0.0001 | 0.995 |
| 1000.0 | 440.84 ± 0.88 | 417.12 ± 0.83 | 0.09 ± 0.0001 | 0.960 | 445.73 ± 0.89 | 0.15 ± 0.0001 | 0.993 |
| Sorption Isotherm | |||||
|---|---|---|---|---|---|
| Langmuir | Freundlich | ||||
| qm (mg/g) | KL (dm3/mg) | r2 | KF (mg/g) | n | r2 |
| 434.75 | 6.19 | 0.999 | 233.59 | 6.63 | 0.671 |
Disclaimer/Publisher’s Note: The statements, opinions and data contained in all publications are solely those of the individual author(s) and contributor(s) and not of MDPI and/or the editor(s). MDPI and/or the editor(s) disclaim responsibility for any injury to people or property resulting from any ideas, methods, instructions or products referred to in the content. |
© 2024 by the authors. Licensee MDPI, Basel, Switzerland. This article is an open access article distributed under the terms and conditions of the Creative Commons Attribution (CC BY) license (https://creativecommons.org/licenses/by/4.0/).
Share and Cite
Velinov, N.; Radović Vučić, M.; Jerman, I.; Marković Nikolić, D.; Nikolić, G.; Bojić, D.; Bojić, A. The Application of Wood Biowaste Chemically Modified by Bi2O3 as a Sorbent Material for Wastewater Treatment. Processes 2024, 12, 2025. https://doi.org/10.3390/pr12092025
Velinov N, Radović Vučić M, Jerman I, Marković Nikolić D, Nikolić G, Bojić D, Bojić A. The Application of Wood Biowaste Chemically Modified by Bi2O3 as a Sorbent Material for Wastewater Treatment. Processes. 2024; 12(9):2025. https://doi.org/10.3390/pr12092025
Chicago/Turabian StyleVelinov, Nena, Miljana Radović Vučić, Ivan Jerman, Dragana Marković Nikolić, Goran Nikolić, Danijela Bojić, and Aleksandar Bojić. 2024. "The Application of Wood Biowaste Chemically Modified by Bi2O3 as a Sorbent Material for Wastewater Treatment" Processes 12, no. 9: 2025. https://doi.org/10.3390/pr12092025
APA StyleVelinov, N., Radović Vučić, M., Jerman, I., Marković Nikolić, D., Nikolić, G., Bojić, D., & Bojić, A. (2024). The Application of Wood Biowaste Chemically Modified by Bi2O3 as a Sorbent Material for Wastewater Treatment. Processes, 12(9), 2025. https://doi.org/10.3390/pr12092025