Article

Optimization Design of Hydraulic Fracturing Fracture Parameters of Horizontal Wells in Algal Limestone Reservoir

1
Drilling and Production Technology Research Institute, Qinghai Oilfield Company, PetroChina, Dunhuang 736200, China
2
Key Laboratory of Oil and Gas Reservoir Stimulation, China University of Petroleum (Beijing), Beijing 102249, China
*
Author to whom correspondence should be addressed.
Processes 2024, 12(7), 1302; https://doi.org/10.3390/pr12071302
Submission received: 13 May 2024 / Revised: 19 June 2024 / Accepted: 20 June 2024 / Published: 23 June 2024
(This article belongs to the Section Energy Systems)

Abstract

:
The algal limestone reservoir has extremely low permeability, developed dissolution pores and weak structural planes, and has heterogeneity. There is a problem of significant differences in single-well production after fracturing in oilfield sites. It is crucial to clarify the matching relationship between hydraulic fracture parameters and production. This article establishes a triple medium seepage mathematical model of “fracture—dissolution pore—matrix pore” considering the lithological characteristics of algal limestone, which is used to predict the cumulative production of horizontal wells after fracturing, and its reliability is verified through example well production data. The influence of fracture parameters on the production of horizontal wells was revealed through numerical simulation, filling the gap in the study of parameters for the stimulation of algal limestone reservoirs. The results indicate that the proposed triple medium model can accurately characterize the characteristics of algal limestone and is suitable for simulating the production capacity of algal limestone reservoirs. The production of horizontal wells is influenced by various hydraulic fracture parameters. The length, conductivity, and height of hydraulic fractures are positively correlated with production, while the spacing between fractures is negatively correlated with production. Taking the overall production of the platform horizontal well group as the optimization objective, and the change in production increase as the discrimination criterion, the optimal values of various fracture parameters are determined. At the same time, simulation results show that using the staggered fracture pattern is beneficial for improving the overall production. The research results have reference significance for the development of algal limestone reservoirs

1. Introduction

The Lower Youshashan Formation in the western region of the Dafengshan tectonic belt in the Qaidam Basin is a typical algal limestone reservoir in China, with a large amount of oil and gas resources. Its efficient development is of great significance for increasing unconventional oil and gas storage and production in China. Due to the influence of structure, sedimentation, dissolution, and other factors, the oil storage space types of algal limestone reservoirs are dissolution pores, intergranular pores, and a small number of microfractures. The distribution of pore space is not obvious, resulting in extremely strong heterogeneity of the reservoir [1]. The stress difference between the two directions of the Lower Oil Sand Mountain Formation is as high as 13–16 MPa, and the complexity of artificial fractures is low. Drawing on unconventional resource development methods at home and abroad, the main fracturing technology for the Lower Oil Sand Mountain Formation algal limestone reservoir is horizontal well dense cutting volume fracturing. So far, a large amount of research has been conducted on the optimization design of horizontal well fracturing parameters in China, and certain achievements have been made. In 2012, Qu Zhanqing et al. [2] established a two-dimensional, two-phase fracture seepage model to optimize the fracture parameters of specific horizontal wells in the well network; in 2014, Xu Chuangchao et al. [3] considered the effects of start-up pressure gradient and wellbore friction, established a fracture network fracturing model, and conducted research on optimizing fracture parameters in low permeability reservoirs; in 2019, Mao Yingxiong [4] used an unstructured grid method to establish a horizontal well grid model, and conducted research on optimizing the parameters of oil and water well fractures; and in 2021, Qingyuan He et al. [5] proposed the UDEC model through an improved discrete element method, which effectively simulated the hydraulic fracture propagation morphology in heterogeneous rocks and revealed the influence of rock heterogeneity and strength on the fracture propagation path. Lu Huidong et al. [6] used CMG software to establish a segmented fracturing production capacity model for sandstone and conglomerate, and studied the impact of different fracture parameters on production capacity; Jiang Baoyun et al. [7] established a refined geological model based on the characteristics of poor reservoir heterogeneity in the Bin 425 area, with the goal of single-well production, optimizing fracture length, and flow conductivity. In 2023, Liang, XF. et al. [8] conducted a study on the self-healing characteristics of a salt rock pore structure using computer tomography (MCT), elucidating the mechanism of reservoir microstructure damage. Zhang, Z. et al. [9] established a rock mechanics model based on the theory of elastic thin plates, and analyzed the evolution characteristics of reservoir macroscopic mechanics under thermal hydraulic action. In 2024, Meng, T. et al. [10] considered the permeability and pore structure changes caused by the coupled thermal hydraulic mechanical (THM) problem of formation rock. They conducted experimental research on the evolution of rock permeability and mechanical properties under formation temperature and pressure conditions using a high-temperature and high-pressure THM-coupled universal testing machine. The research results provide a theoretical basis for hydraulic fracturing design.
Horizontal well fracturing technology has become a cutting-edge technology in the development of unconventional reservoirs in China [11]. However, due to the unique and heterogeneous pore structure of algal limestone reservoirs, it is difficult to conduct overall fracturing optimization research. There is relatively little research on optimizing the design of fracture parameters for algal limestone reservoirs. This article takes the western Fengxi block of the Dafengshan structural belt in the Qaidam Basin as the background, and focuses on the problem of unclear fracture parameters for dense cutting volume fracturing of horizontal wells in algal limestone reservoirs. A mathematical model of triple medium algal limestone reservoirs is established, with the overall production of platform wells as the goal. The optimization design of fracture parameters for horizontal wells is of great significance for improving the production of algal limestone reservoirs.

2. Methods

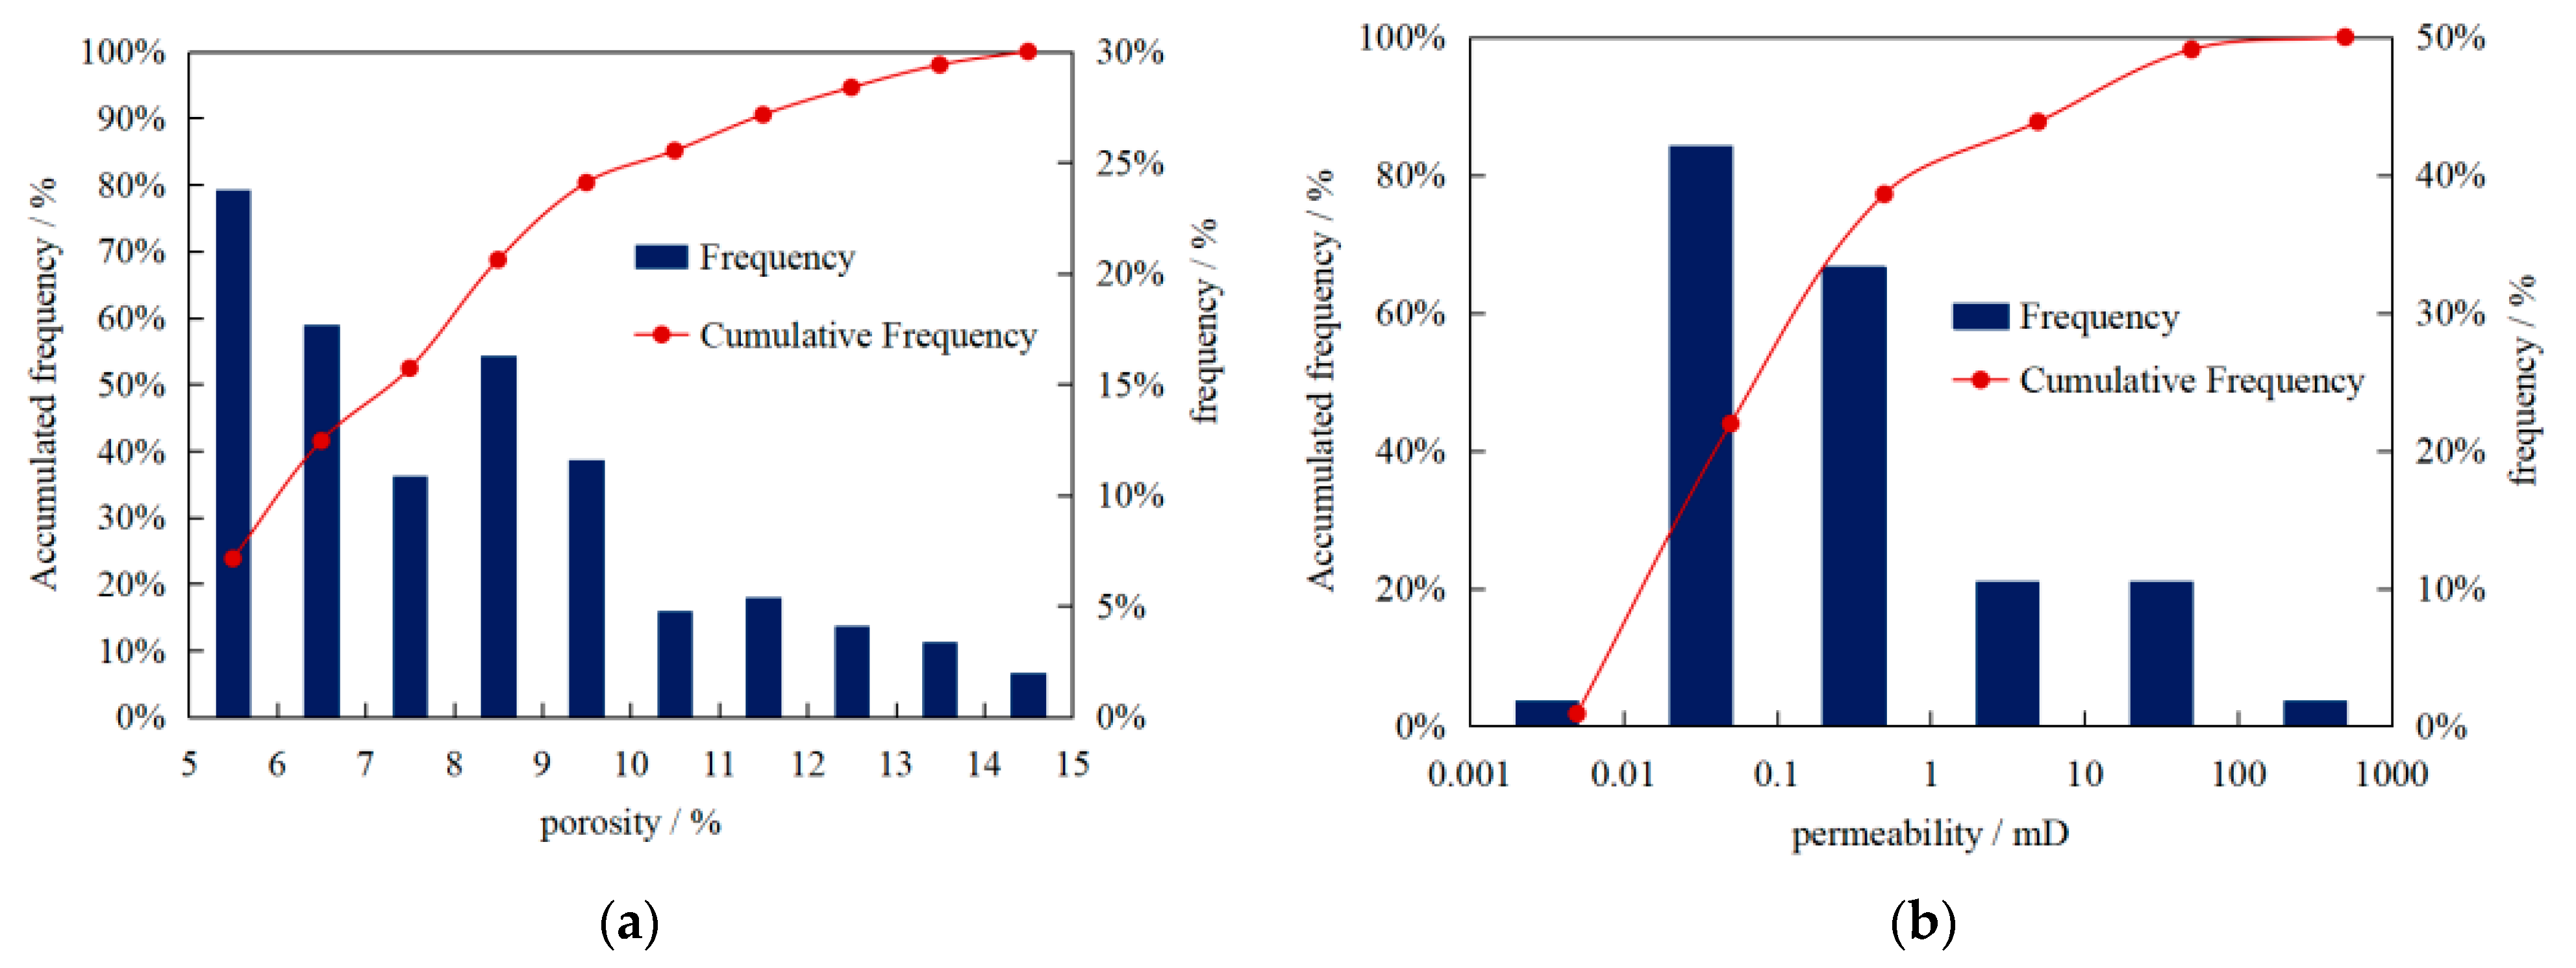
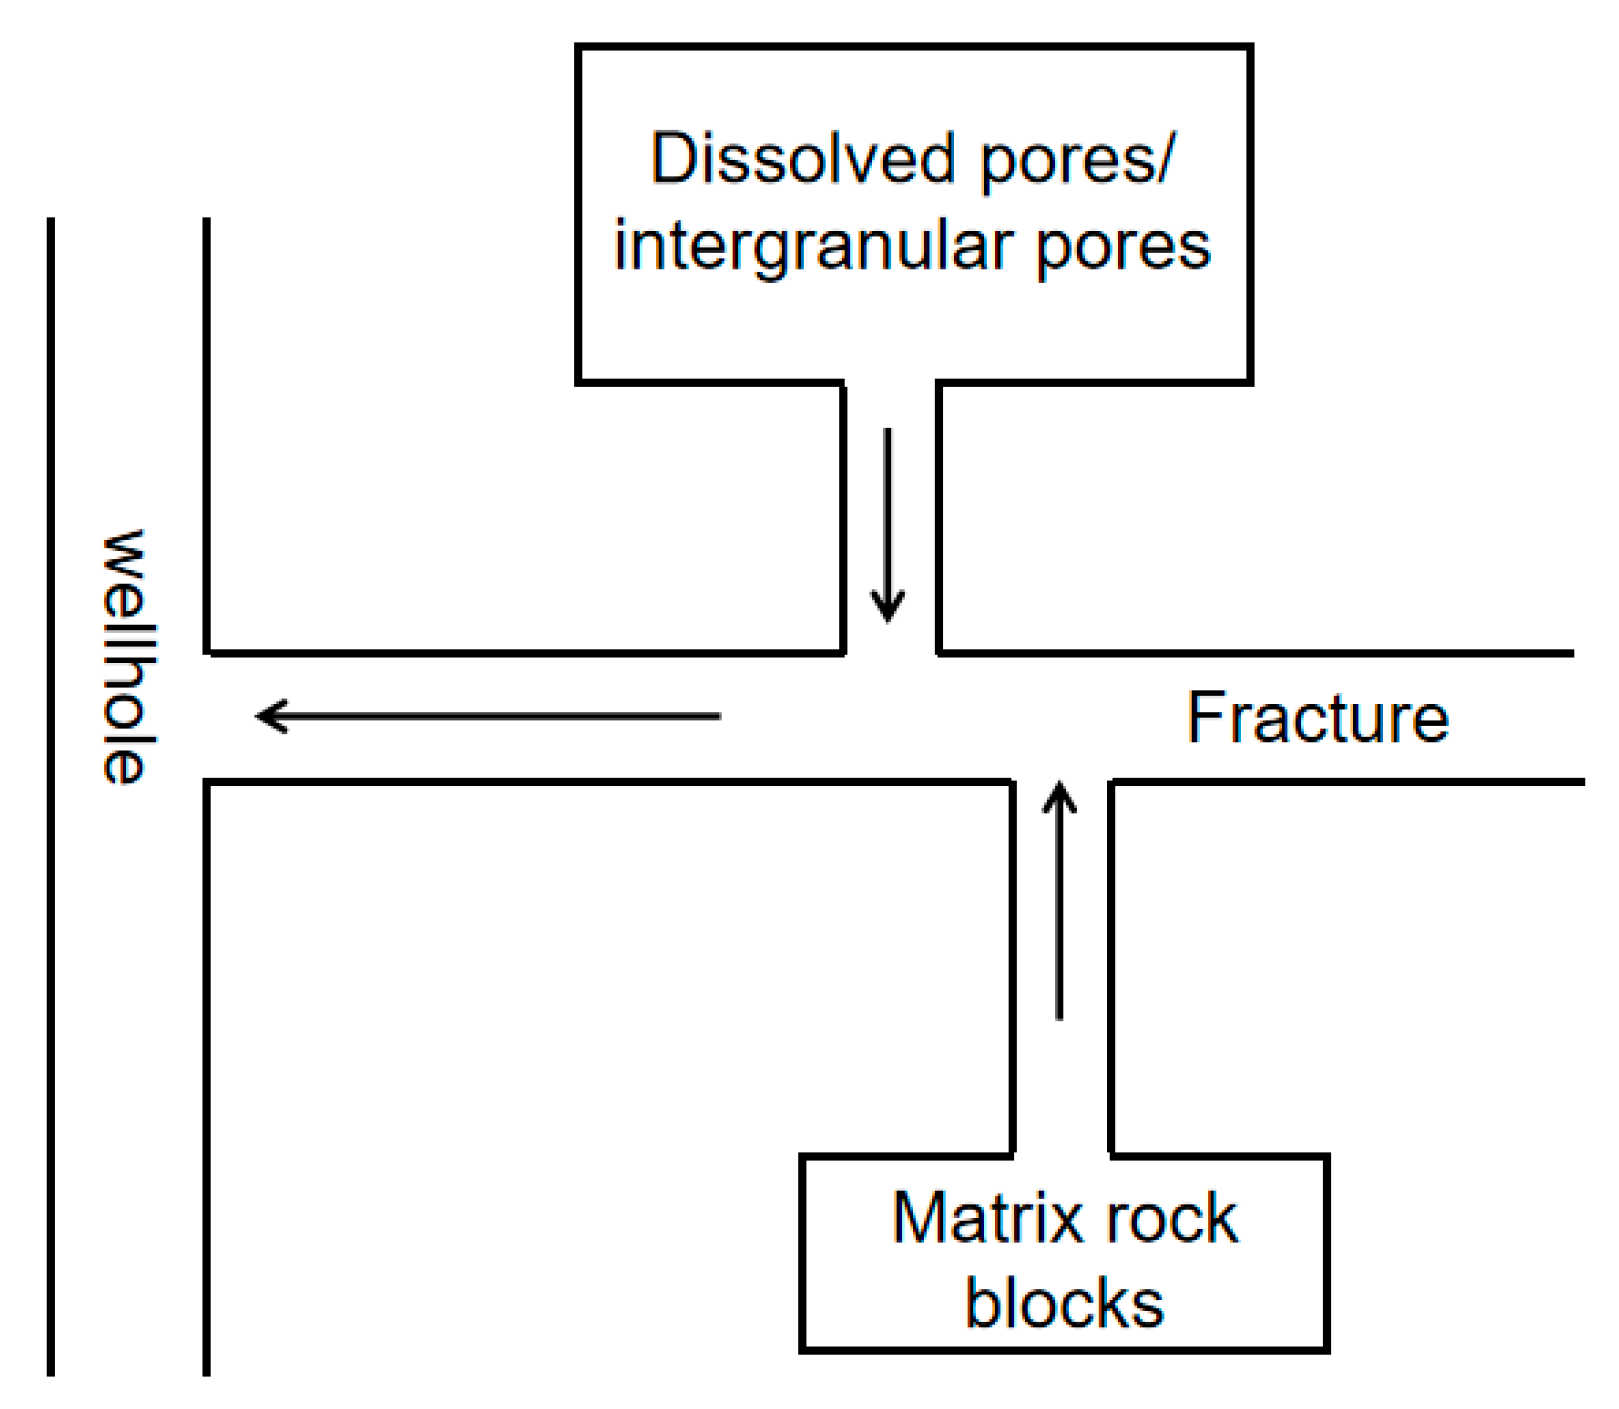
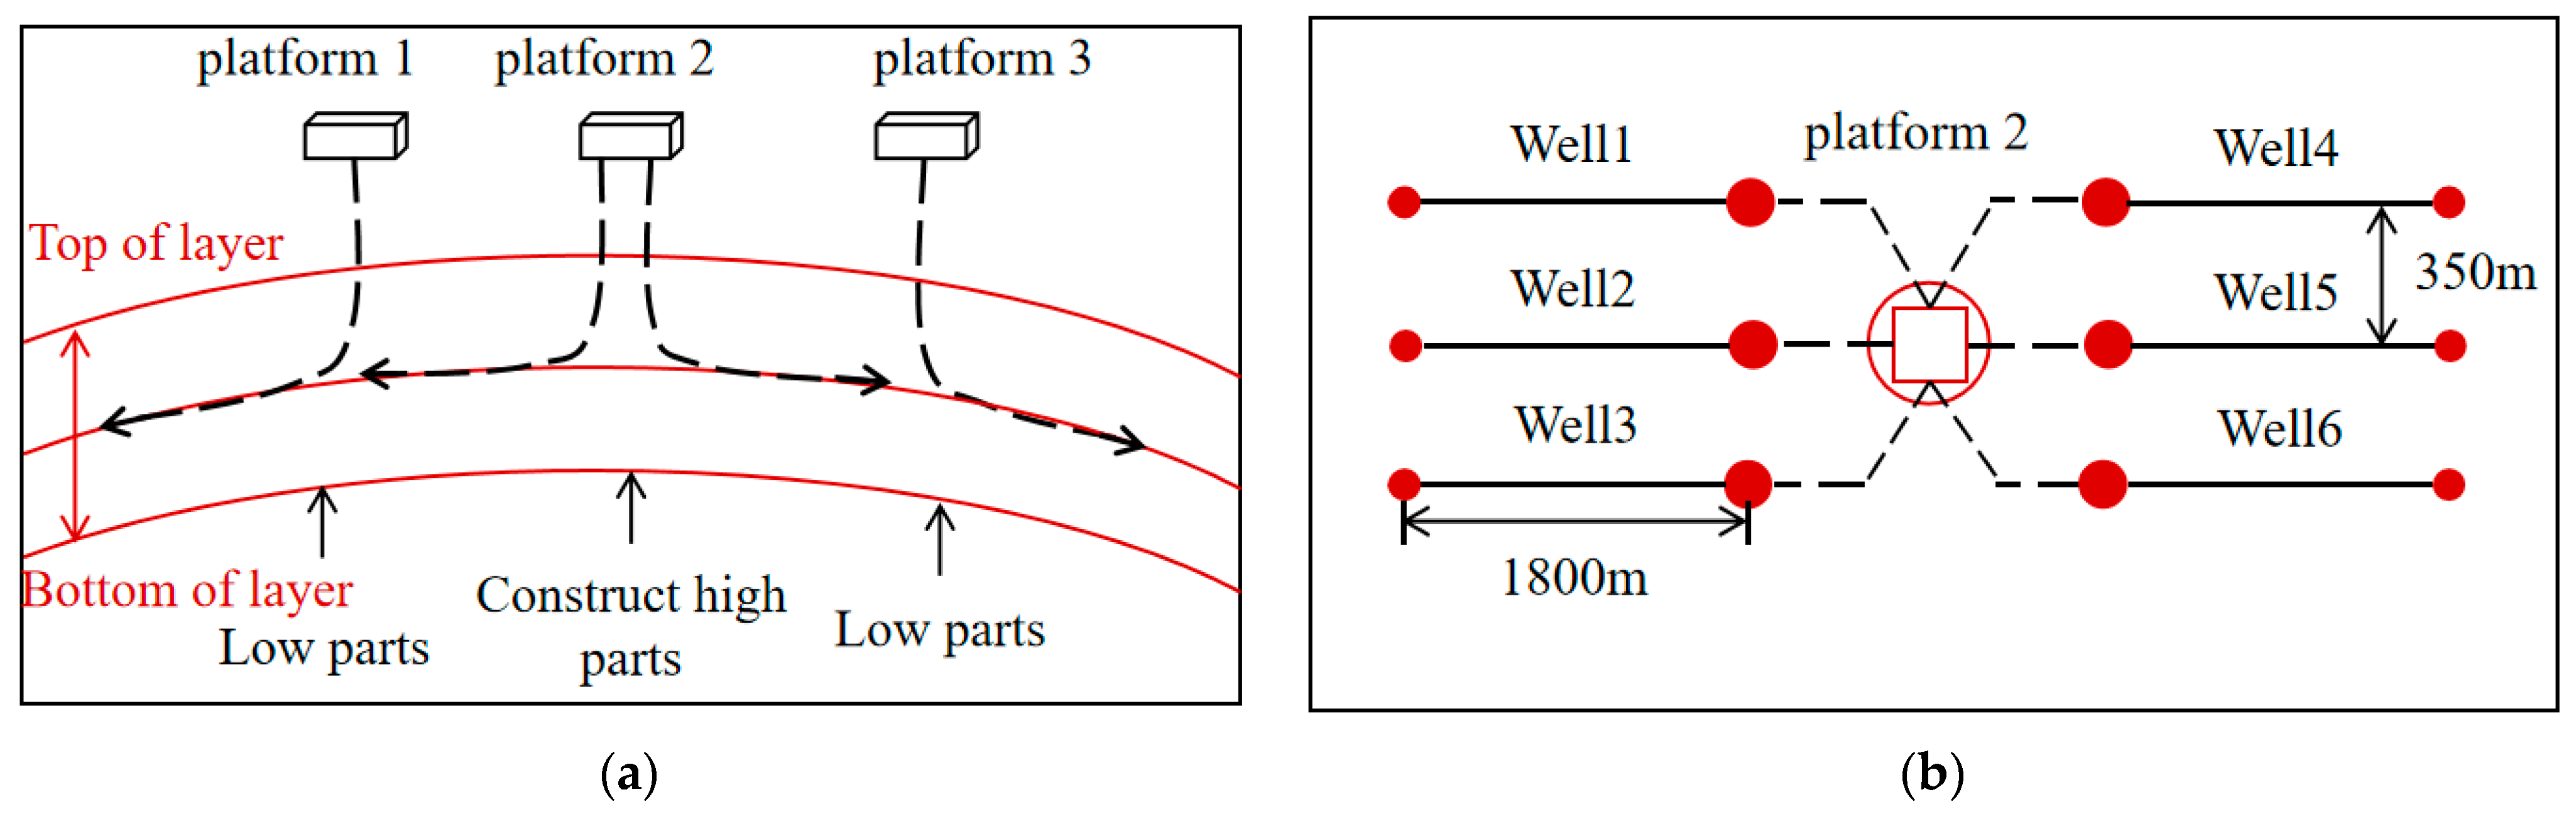
2.1. Characteristics of Algal Limestone Reservoir

The Xiayoushashan Formation algal limestone reservoir is generally a shallow to semi-deep lake deposit, with a large cumulative oil layer thickness, planar overlapping and continuous layers, stable stratigraphic distribution, and favorability for horizontal well development. The high-frequency oscillation of lake water results in the development of multiple favorable carbonate reservoirs, which interact and overlap with high-quality Hunan hydrocarbon source rocks, and have a good coupling relationship. Therefore, algal limestone is both a source rock and an oil storage rock, with good reservoir formation conditions and development potential.
The pore types of algal limestone are mainly dissolution pores and intergranular pores, with locally developed micro fractures or weak structural planes. Its physical properties are better than other rock types of the reservoir (such as block limestone, muddy siltstone, etc.); however, the scale of a single sedimentary body in the algal limestone layer is small, and although widely distributed, it exhibits characteristics of dispersion, thin layer, and relatively poor connectivity, with extremely strong reservoir heterogeneity [12,13]. According to the analysis and statistics of core wells, As shown in Figure 1, the distribution range of porosity in the Lower Oil Sand Mountain Formation reservoir is 0.1–15.0%, with an average effective reservoir porosity of 7.6% and a median of 6.6%; the permeability range is 0.023–17.5 mD, with an average of 1.53 mD, indicating a low porosity to ultra-low permeability reservoir; the distribution range of the reservoir pore throat radius is between 0.1–8 μm, while the pore throat radius is less than 0.1 μm and accounts for about 87%, with complex pore structure and poor connectivity; the capillary force of the reservoir is high, and the resistance to oil and gas injection is high, resulting in low oil saturation and high bound water saturation in the reservoir. The oil saturation range of the main development layer N21- III small layer is 42–46% (Figure 1).

2.2. Mathematical Model Establishment

A mathematical model of a fracture pore solution pore triple medium reservoir is established based on the characteristics of the algal limestone reservoir in the Lower Oil Sand Mountain Formation. In this model, multiple pore network structures are coupled with each other, and the three sets of hydrodynamic systems have spatial overlap characteristics. The model is shown in Figure 2, which assumes the reservoir is a three-dimensional oil–water two-phase reservoir with heterogeneity, anisotropic permeability, fluid with micro compressibility, and a constant compression coefficient [14,15].
The basic mathematical model for the triple medium of fractures, dissolution pores, and matrix pores in oil reservoirs is as follows:
K 1 μ 2 p 1 = ϕ 1 C 1 p 1 t q 1 K 2 μ 2 p 2 = ϕ 2 C 2 p 2 t q 2 K 3 μ 2 p 3 = ϕ 3 C 3 p 3 t + q 1 + q 2
In the case of quasi steady state flow, q1* and q2* are given by the following Equation:
q 1 = α 1 K 1 μ p 3 p 1 q 2 = α 2 K 2 μ p 3 p 2
Define dimensionless variables as follows:
r D = r r w t D = K 3 t μ r w 2 ϕ 3 C 3 + ϕ 1 C 1 + ϕ 2 C 2 p D j r D , t D = 2 π K 3 h μ p i p j r , t , j = 1 , 2 , 3
By making dimensionless changes to Equations (1)–(3) and organizing them, we can obtain the following:
1 r D r D r D p D 3 r D w 1 p D 1 t D w 2 p D 2 t D = 1 w 1 w 2 p D 3 t D w 1 p D 1 t D = λ 1 p D 3 p D 1 w 2 p D 2 t D = λ 2 p D 3 p D 2
The elastic storage capacity ratio is as follows:
w j = ϕ j C j ϕ 3 C 3 + ϕ 1 C 1 + ϕ 2 C 2
The cross flow coefficient is as follows:
λ j = α j K j r w 2 K 3 , j = 1 , 2
where K1,2,3 is the permeability of the triple medium of reservoir matrix rock blocks, dissolution pores, and fractures, μm2; μ is the fluid viscosity, mPa·s; p1,2,3 is the fluid pressure within the triple medium of reservoir matrix rock blocks, dissolution pores, and fractures, in MPa; φ1,2,3 is the porosity of matrix rock blocks, dissolution pores, and fractures, %; C1,2,3 is the fluid compression coefficient of matrix rock blocks, dissolution pores, and fractures, MPa−1; q1* and q2* are the flow rates of matrix rock blocks’ fractures and dissolution pores’ fractures, m3; α1,2 is the geometric shape factor, m−2; rw is the radius of the wellbore, cm; h is the thickness of the oil layer, cm; pi is the original formation pressure, 10−1 MPa; w1,2 is the elastic storage capacity ratio, dimensionless; and λ1,2 is the turbulence coefficient, dimensionless.
The auxiliary equation is as follows:
S o + S w = 1 p o = p w ϕ = ϕ o 1 + C f p p i
where So is the oil saturation,%; Sw is the water phase saturation,%; φo is the original porosity of the formation,%; Cf is the comprehensive compressibility coefficient of the formation, MPa−1; P is the pressure at any point in the reservoir, MPa; and Pi is the original formation pressure, MPa.
The definite solution condition is as follows:
p D 3 r D | r D = 1 = 1 , t D > 0 p D 3 r D , t D | r D r eD = 0 , t D > 0 p D j r D , t D | t D = 0 = 0 , j = 1 , 2 , 3 ; 1 r D +
where rD is the dimensionless oil leakage radius; PD3 is the dimensionless pressure of the fractured medium; reD is the dimensionless stratigraphic boundary; TD is dimensionless time; and PDj represents the dimensionless pressure of reservoir fractures, dissolution pores, and matrix pores.

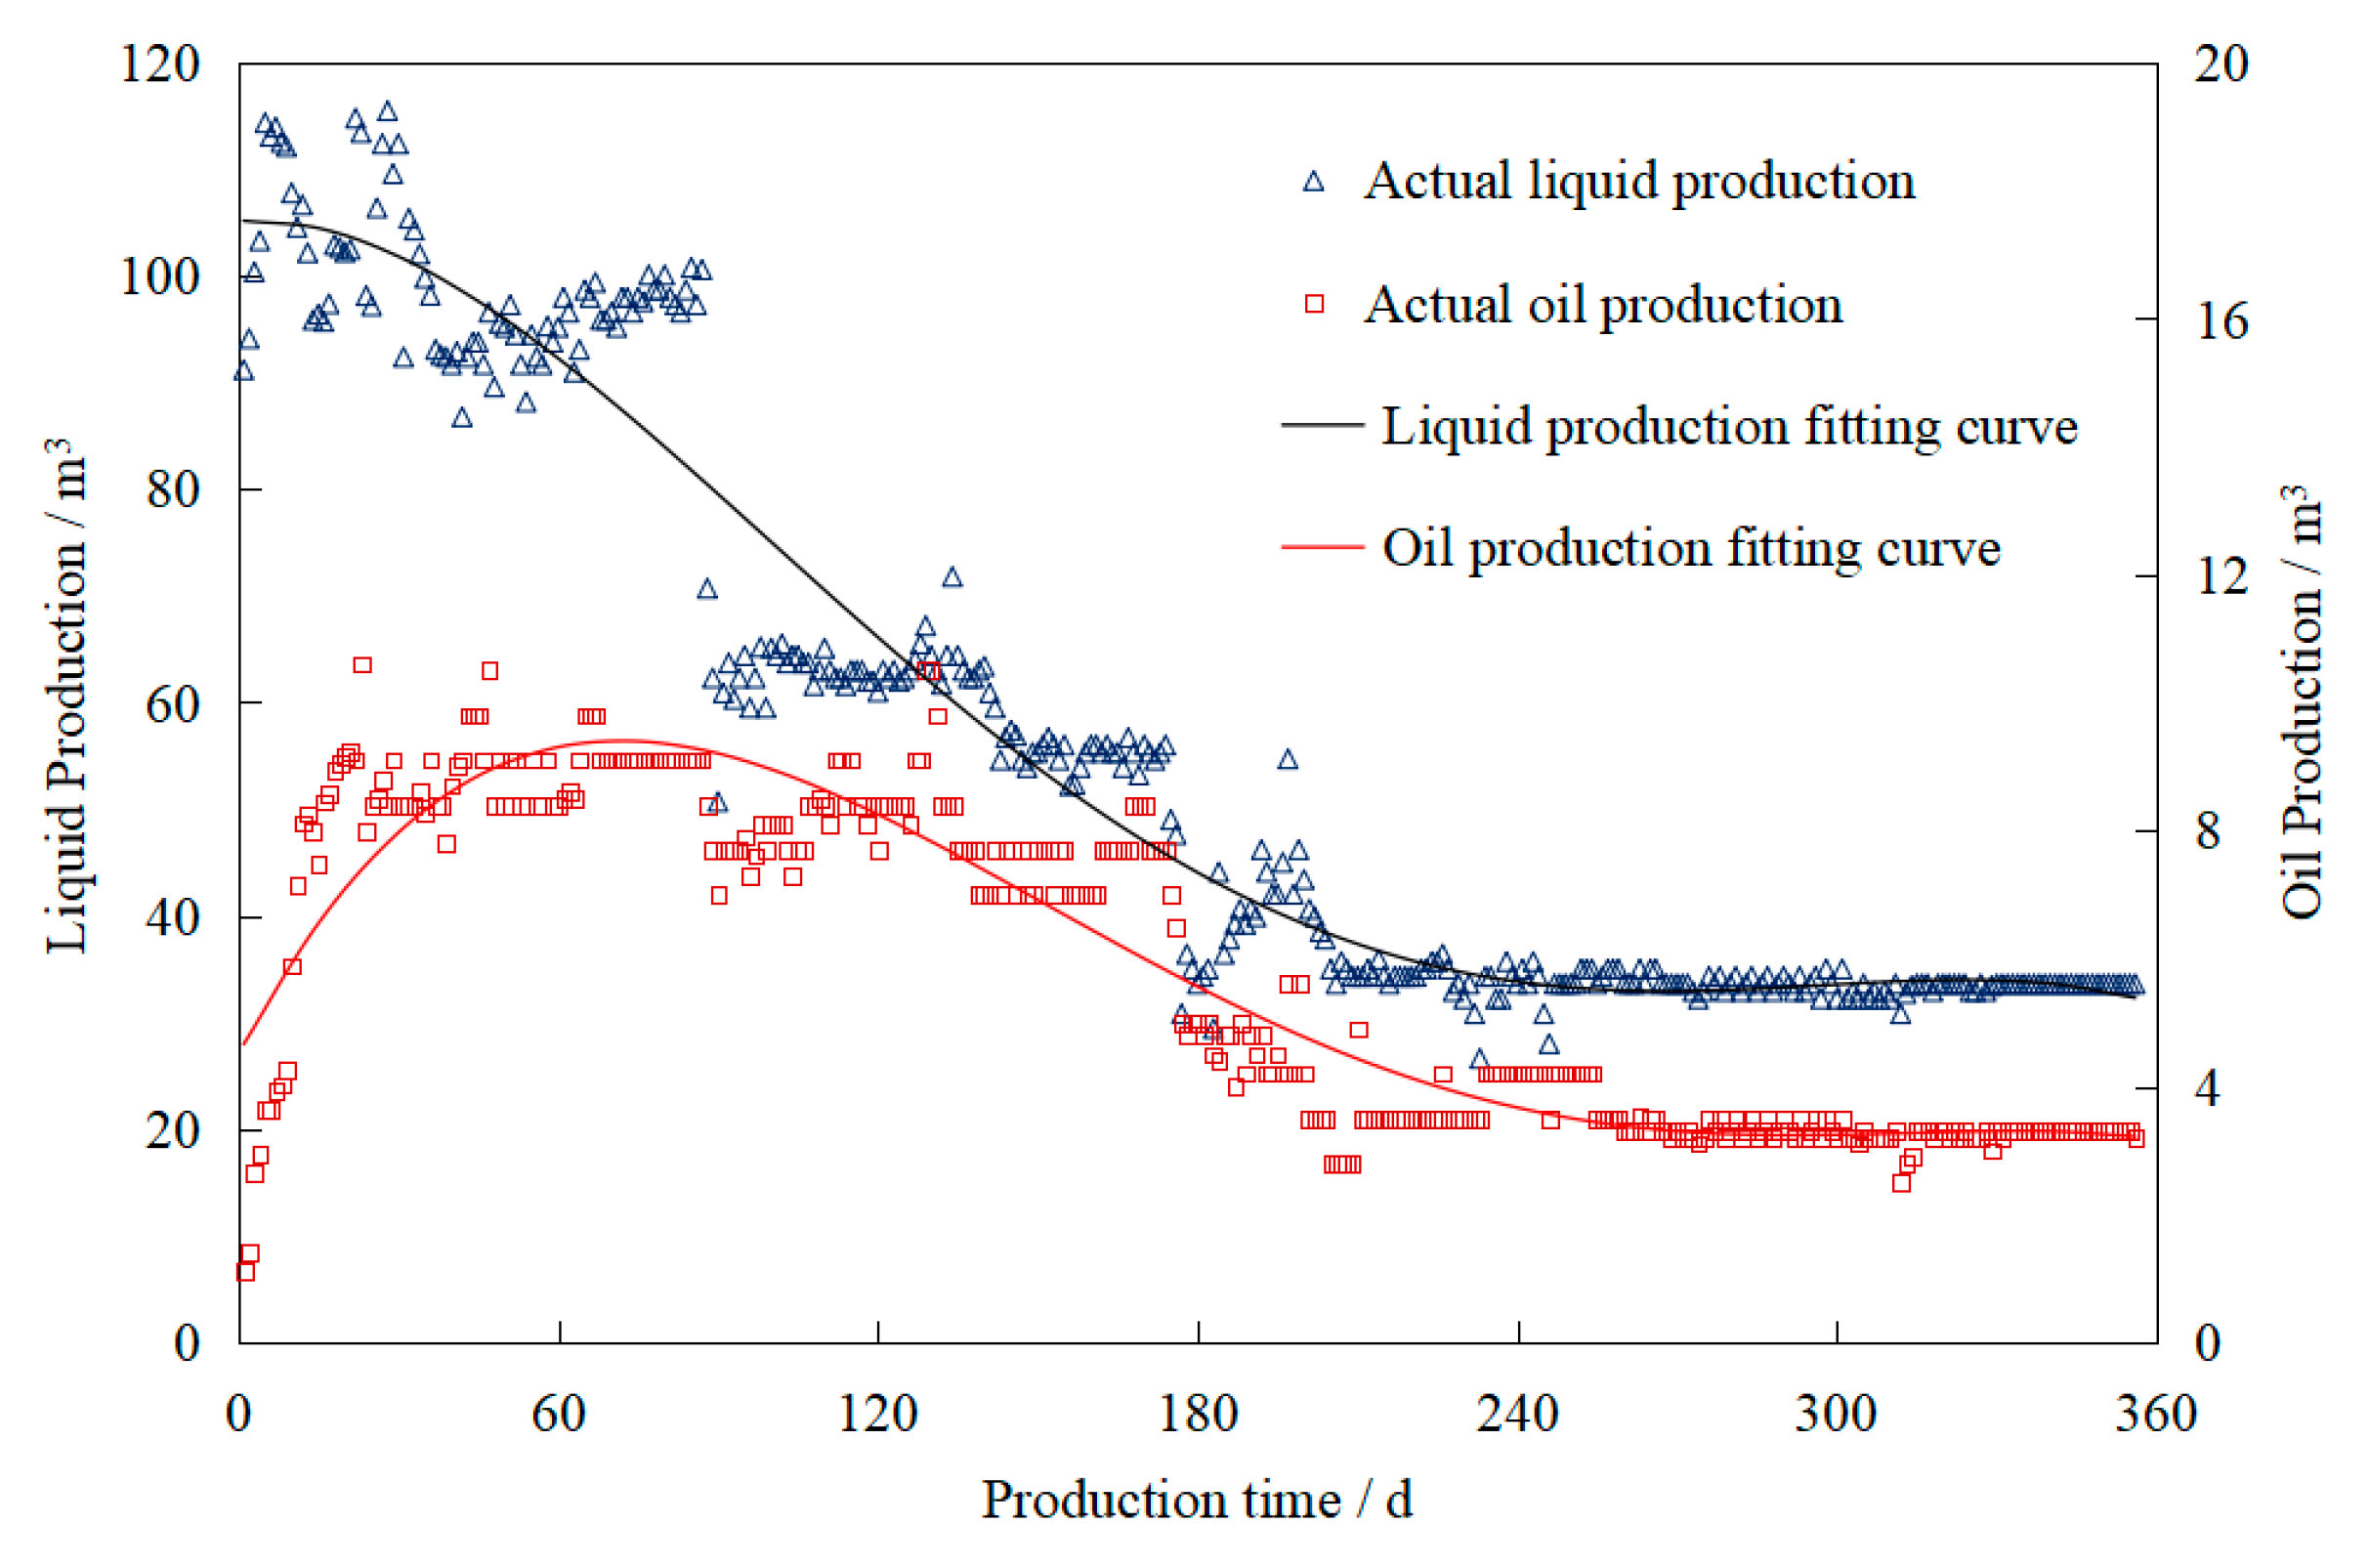
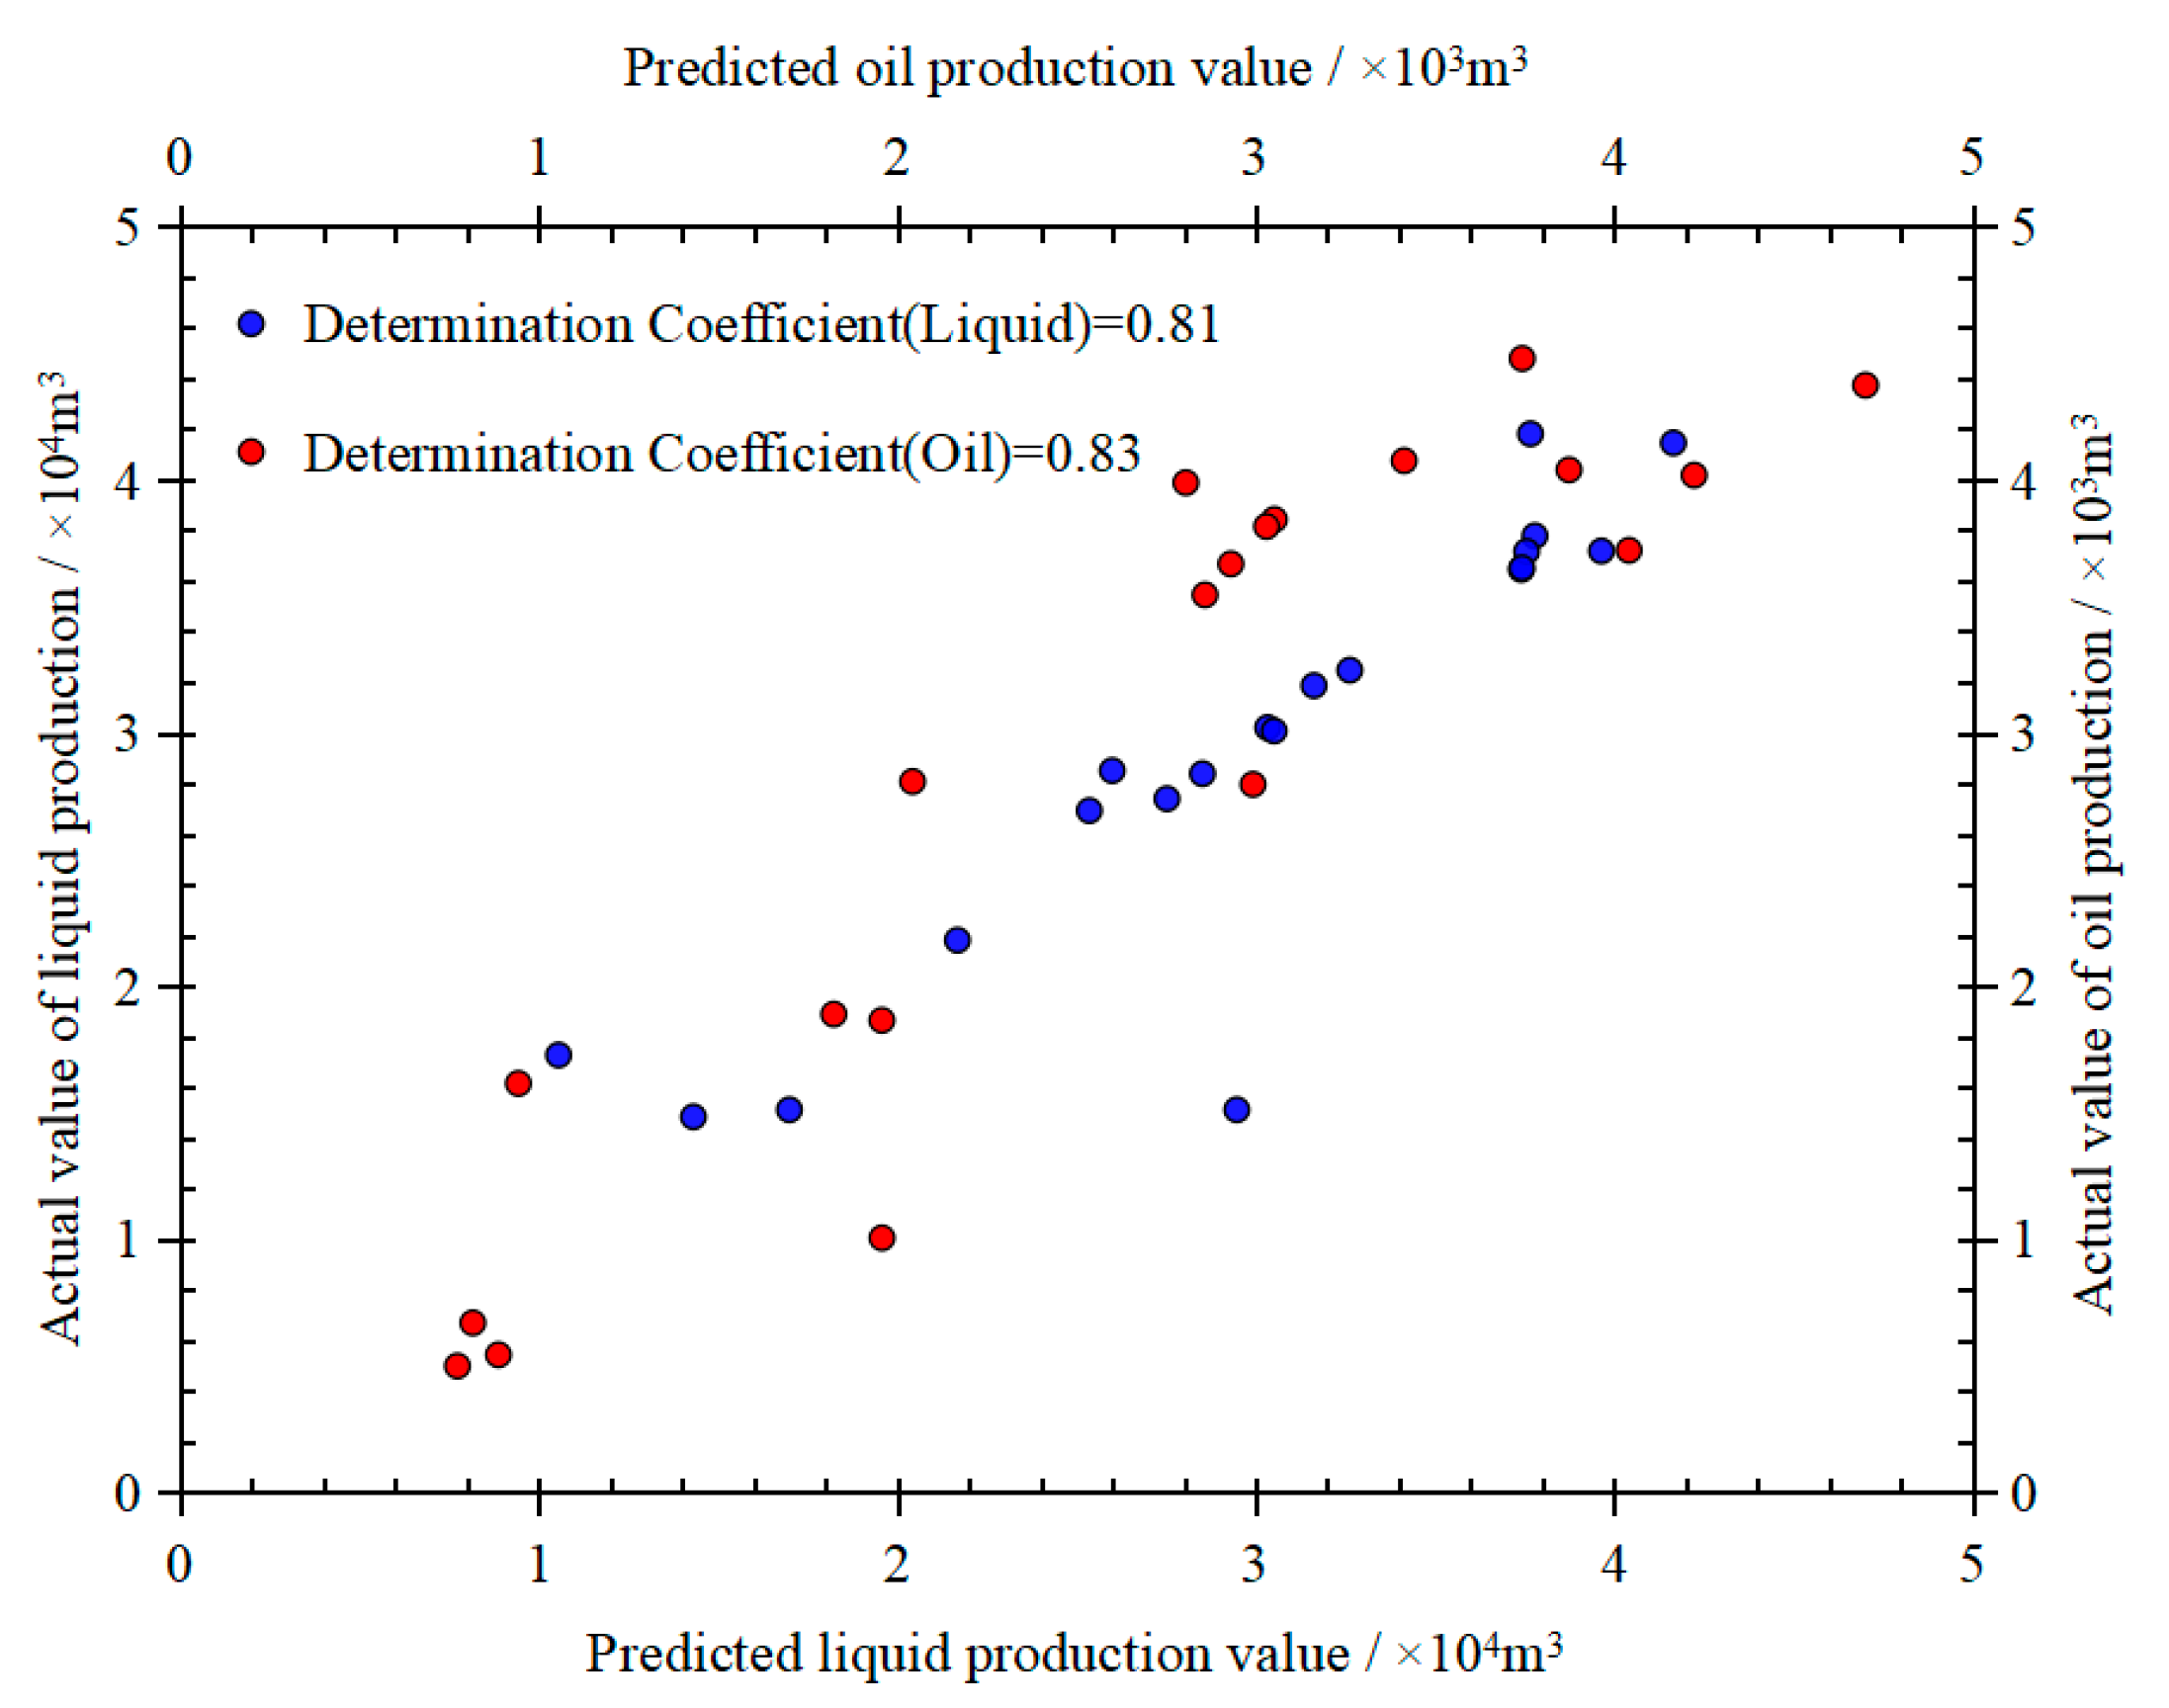
2.3. Model Validation

The mathematical model established above uses finite difference method to discretize the control equation and auxiliary equation, and solves it by constructing Jacobian matrix through automatic differentiation technology. Artificial fractures are characterized using unstructured mesh refinement methods to achieve hydraulic fracture characterization; then, one must edit the matrix, dissolution pores, capillary forces within fractures, PVT parameters, and permeability parameters separately to achieve fully coupled simulation calculations of crude oil, liquid, and rock.
To improve the accuracy of the model, based on the production data of a typical horizontal wells in the research area, historical fitting of the model calculation results was carried out, and the model parameters were corrected. The H1 well of a certain platform in the Lower Oil Sand Mountain Formation of the Chaidamu Basin was selected as the fitting object; the target layer of the well has a vertical depth of 2757 m and a horizontal section of 966 m. It is divided into 12 stages and consists of 46 clusters for fracturing, with an average of 4 clusters per stage, and an average cluster spacing of 20.5 m. The stimulation treatment is 10–14 m3/min, and the proppant addition strength is 1.0 m3/m. After the well is put into operation, the initial liquid production is relatively high, with an average of 105.7 m3/d, and the initial oil production is relatively low, with an average of 6.83 m3/d; the oil production gradually increased, reaching a peak of 8.26 m3 after the well was opened for 40 days. As a result, the oil production decreased, and the rate of decline slowed down. Currently, the daily oil production is 3.3 m3/d. The historical fitting results of the numerical simulation calculation and actual production are shown in Figure 3, with high data consistency. This model can characterize the production dynamic characteristics of algal limestone reservoirs after horizontal well fracturing.
To further verify the accuracy of the numerical model for algal limestone reservoirs, this model was used to predict the production of fractured wells in the study area, and correlation analysis was conducted with actual well production data [16]. The correlation between predicted production data and actual data is shown in Figure 4. According to the results shown in the Figure, the determination coefficient (R2) of the cumulative oil production data is 0.83, and the determination coefficient (R2) of the cumulative liquid production data is 0.81; the simulated production has a high degree of consistency with the production history data from on-site statistics, and the constructed model can accurately simulate the production data of horizontal wells in algal limestone reservoirs after hydraulic fracturing.

3. Results and Discussion

Based on the established triple medium reservoir numerical model, research is conducted on optimizing the main fracture parameters of algal limestone horizontal wells, including fracture half-length, fracture conductivity, fracture height, fracture spacing, etc., to maximize the utilization volume and oil production of algal limestone reservoirs. To clarify the impact of various parameters on production data, the control variable method is used to study the optimization problem of various fracture parameters.
The reservoir background in the simulation example is the algal limestone reservoir of the Oil Sand Mountain Formation in the Qaidam Basin. The reservoir thickness is 9.1 m, the reservoir depth is 2700–3000 m, the formation pressure coefficient is 1.12, the crude oil viscosity is 8.68 mPa·s (under 50 °C conditions), and the average crude oil density is 0.8416 g/cm3; the density of formation water is 1 g/cm3, and the viscosity of formation water is 1 mPa·s; and the algal limestone reservoir is developed as a whole using a horizontal well platform. Taking into account drilling costs and single-well controlled reserves, a surface platform well layout pattern is adopted, with a high platform well arrangement direction that is bidirectional, and other platform well arrangements’ directions that are unidirectional. The horizontal well spacing is 350 m, and the horizontal well section length is 1100 m. The schematic diagram of the platform well group is shown in Figure 5.

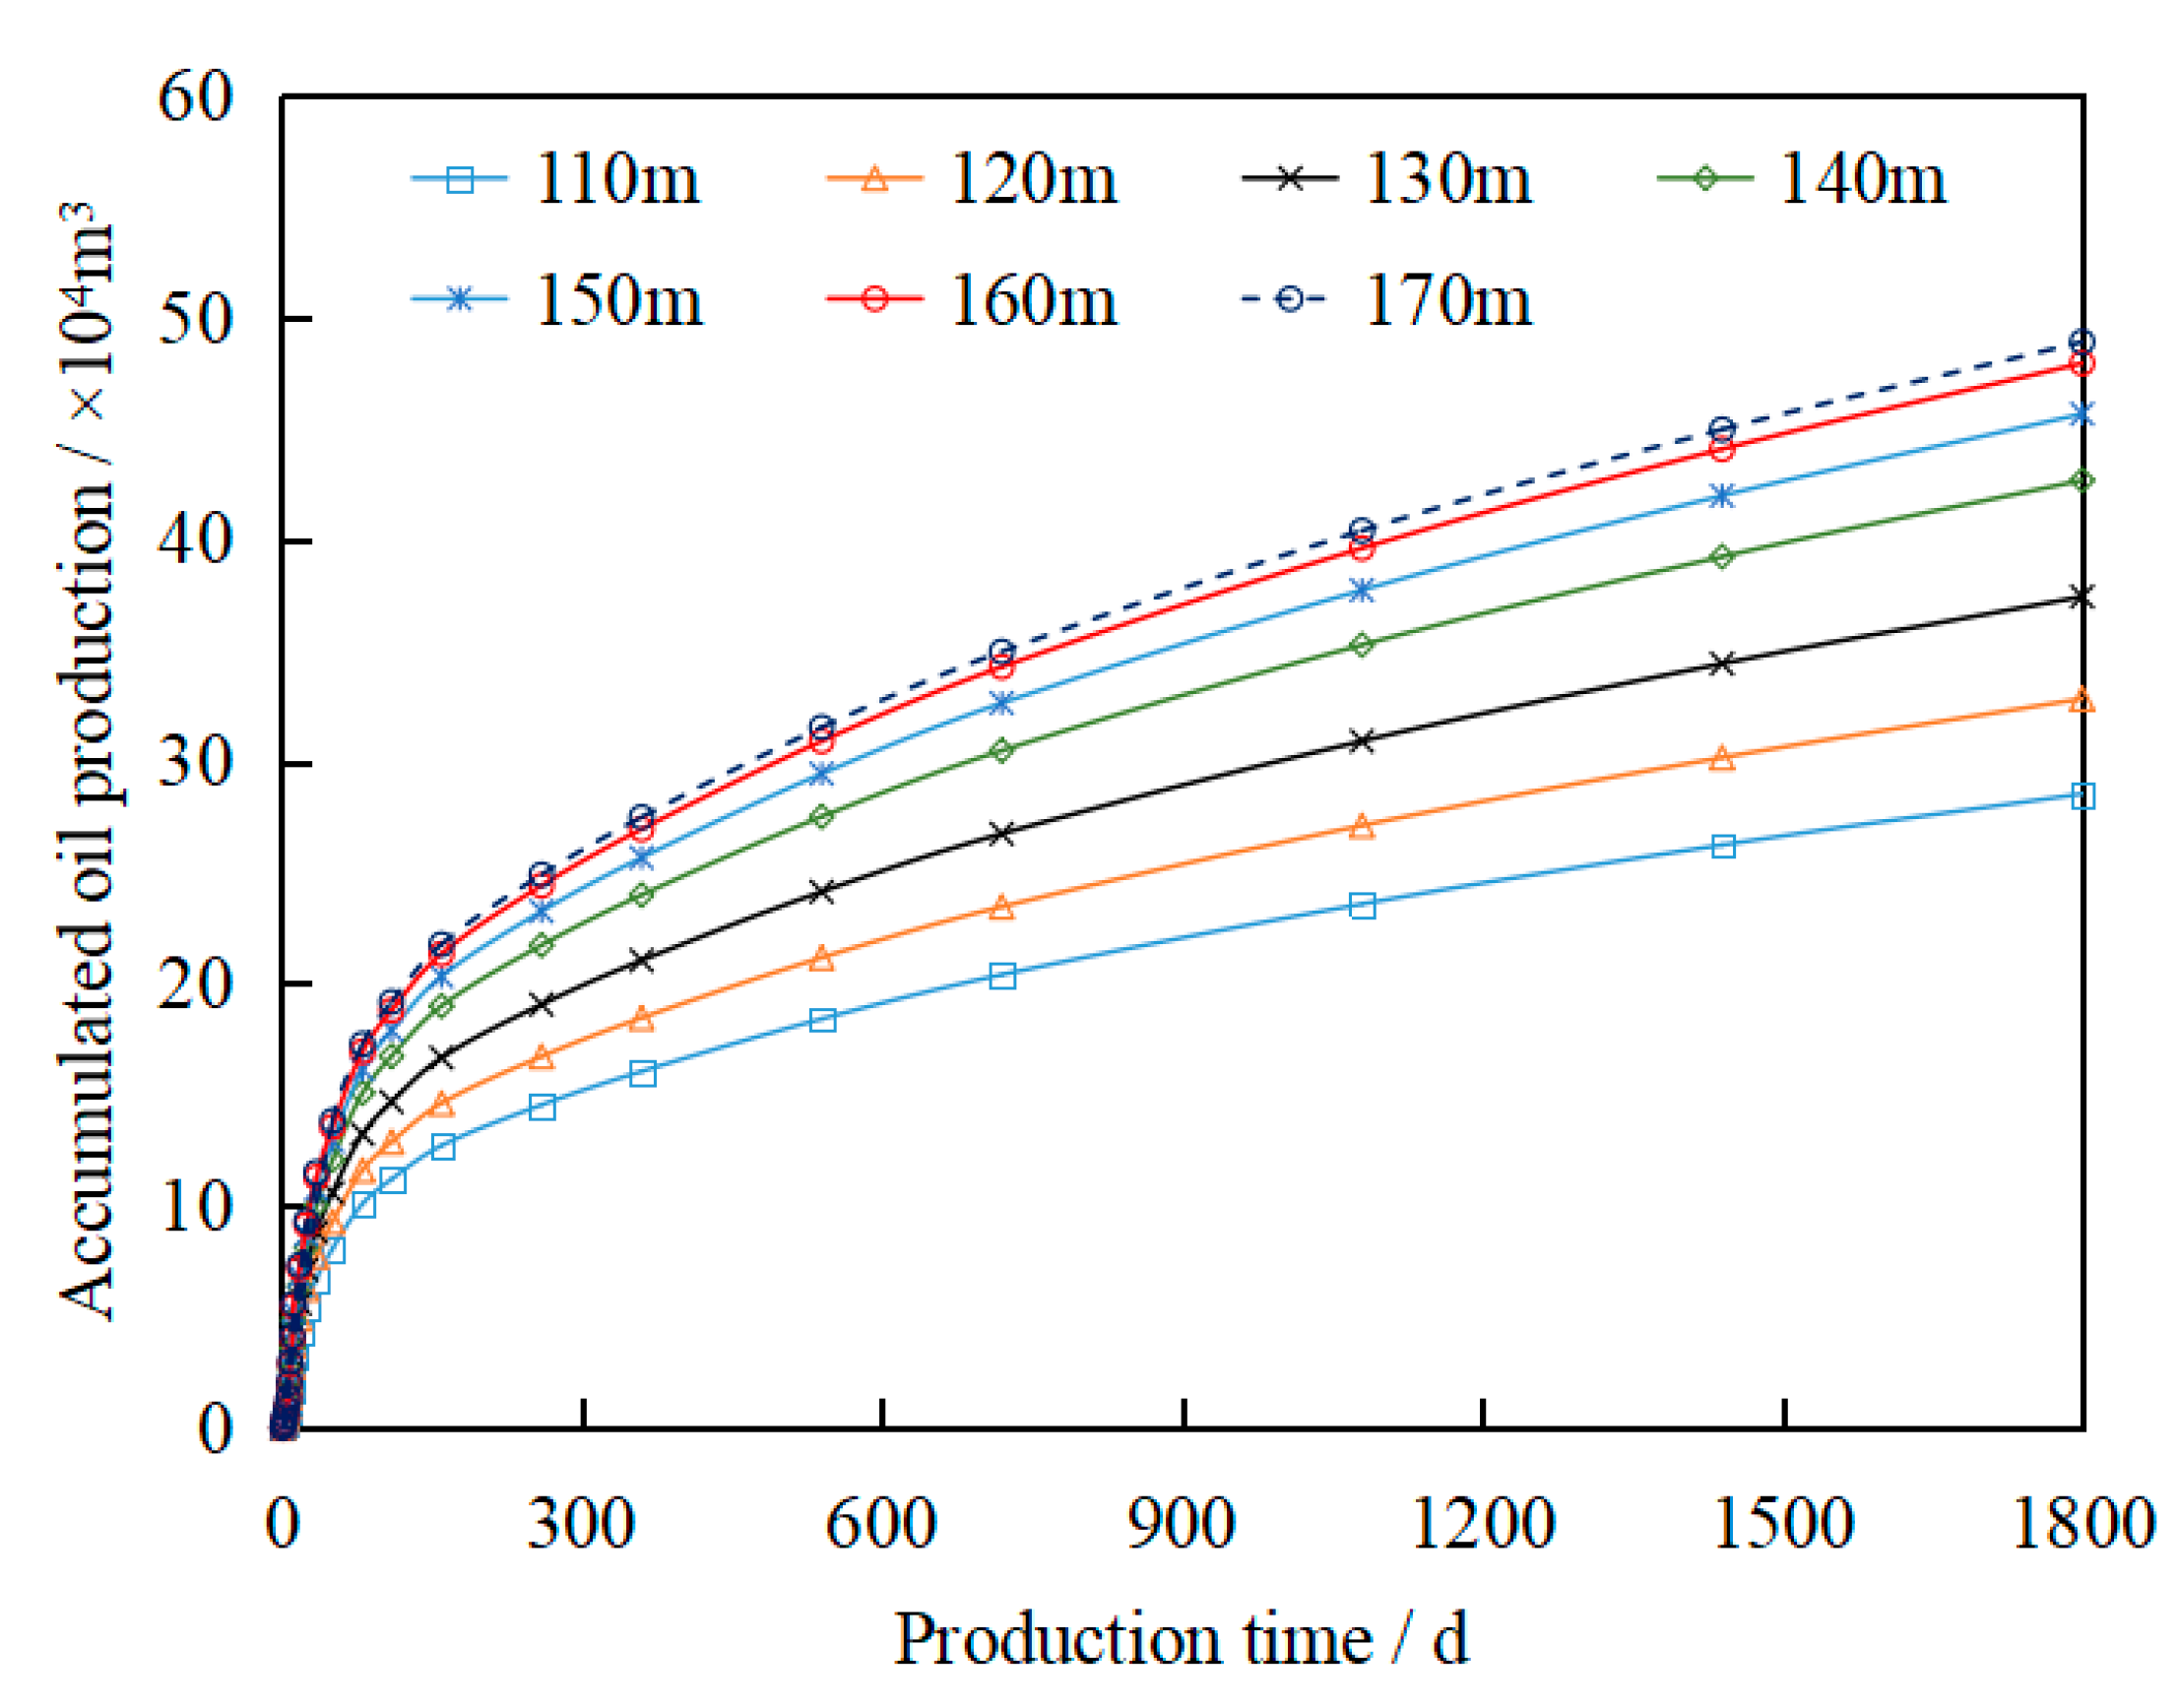
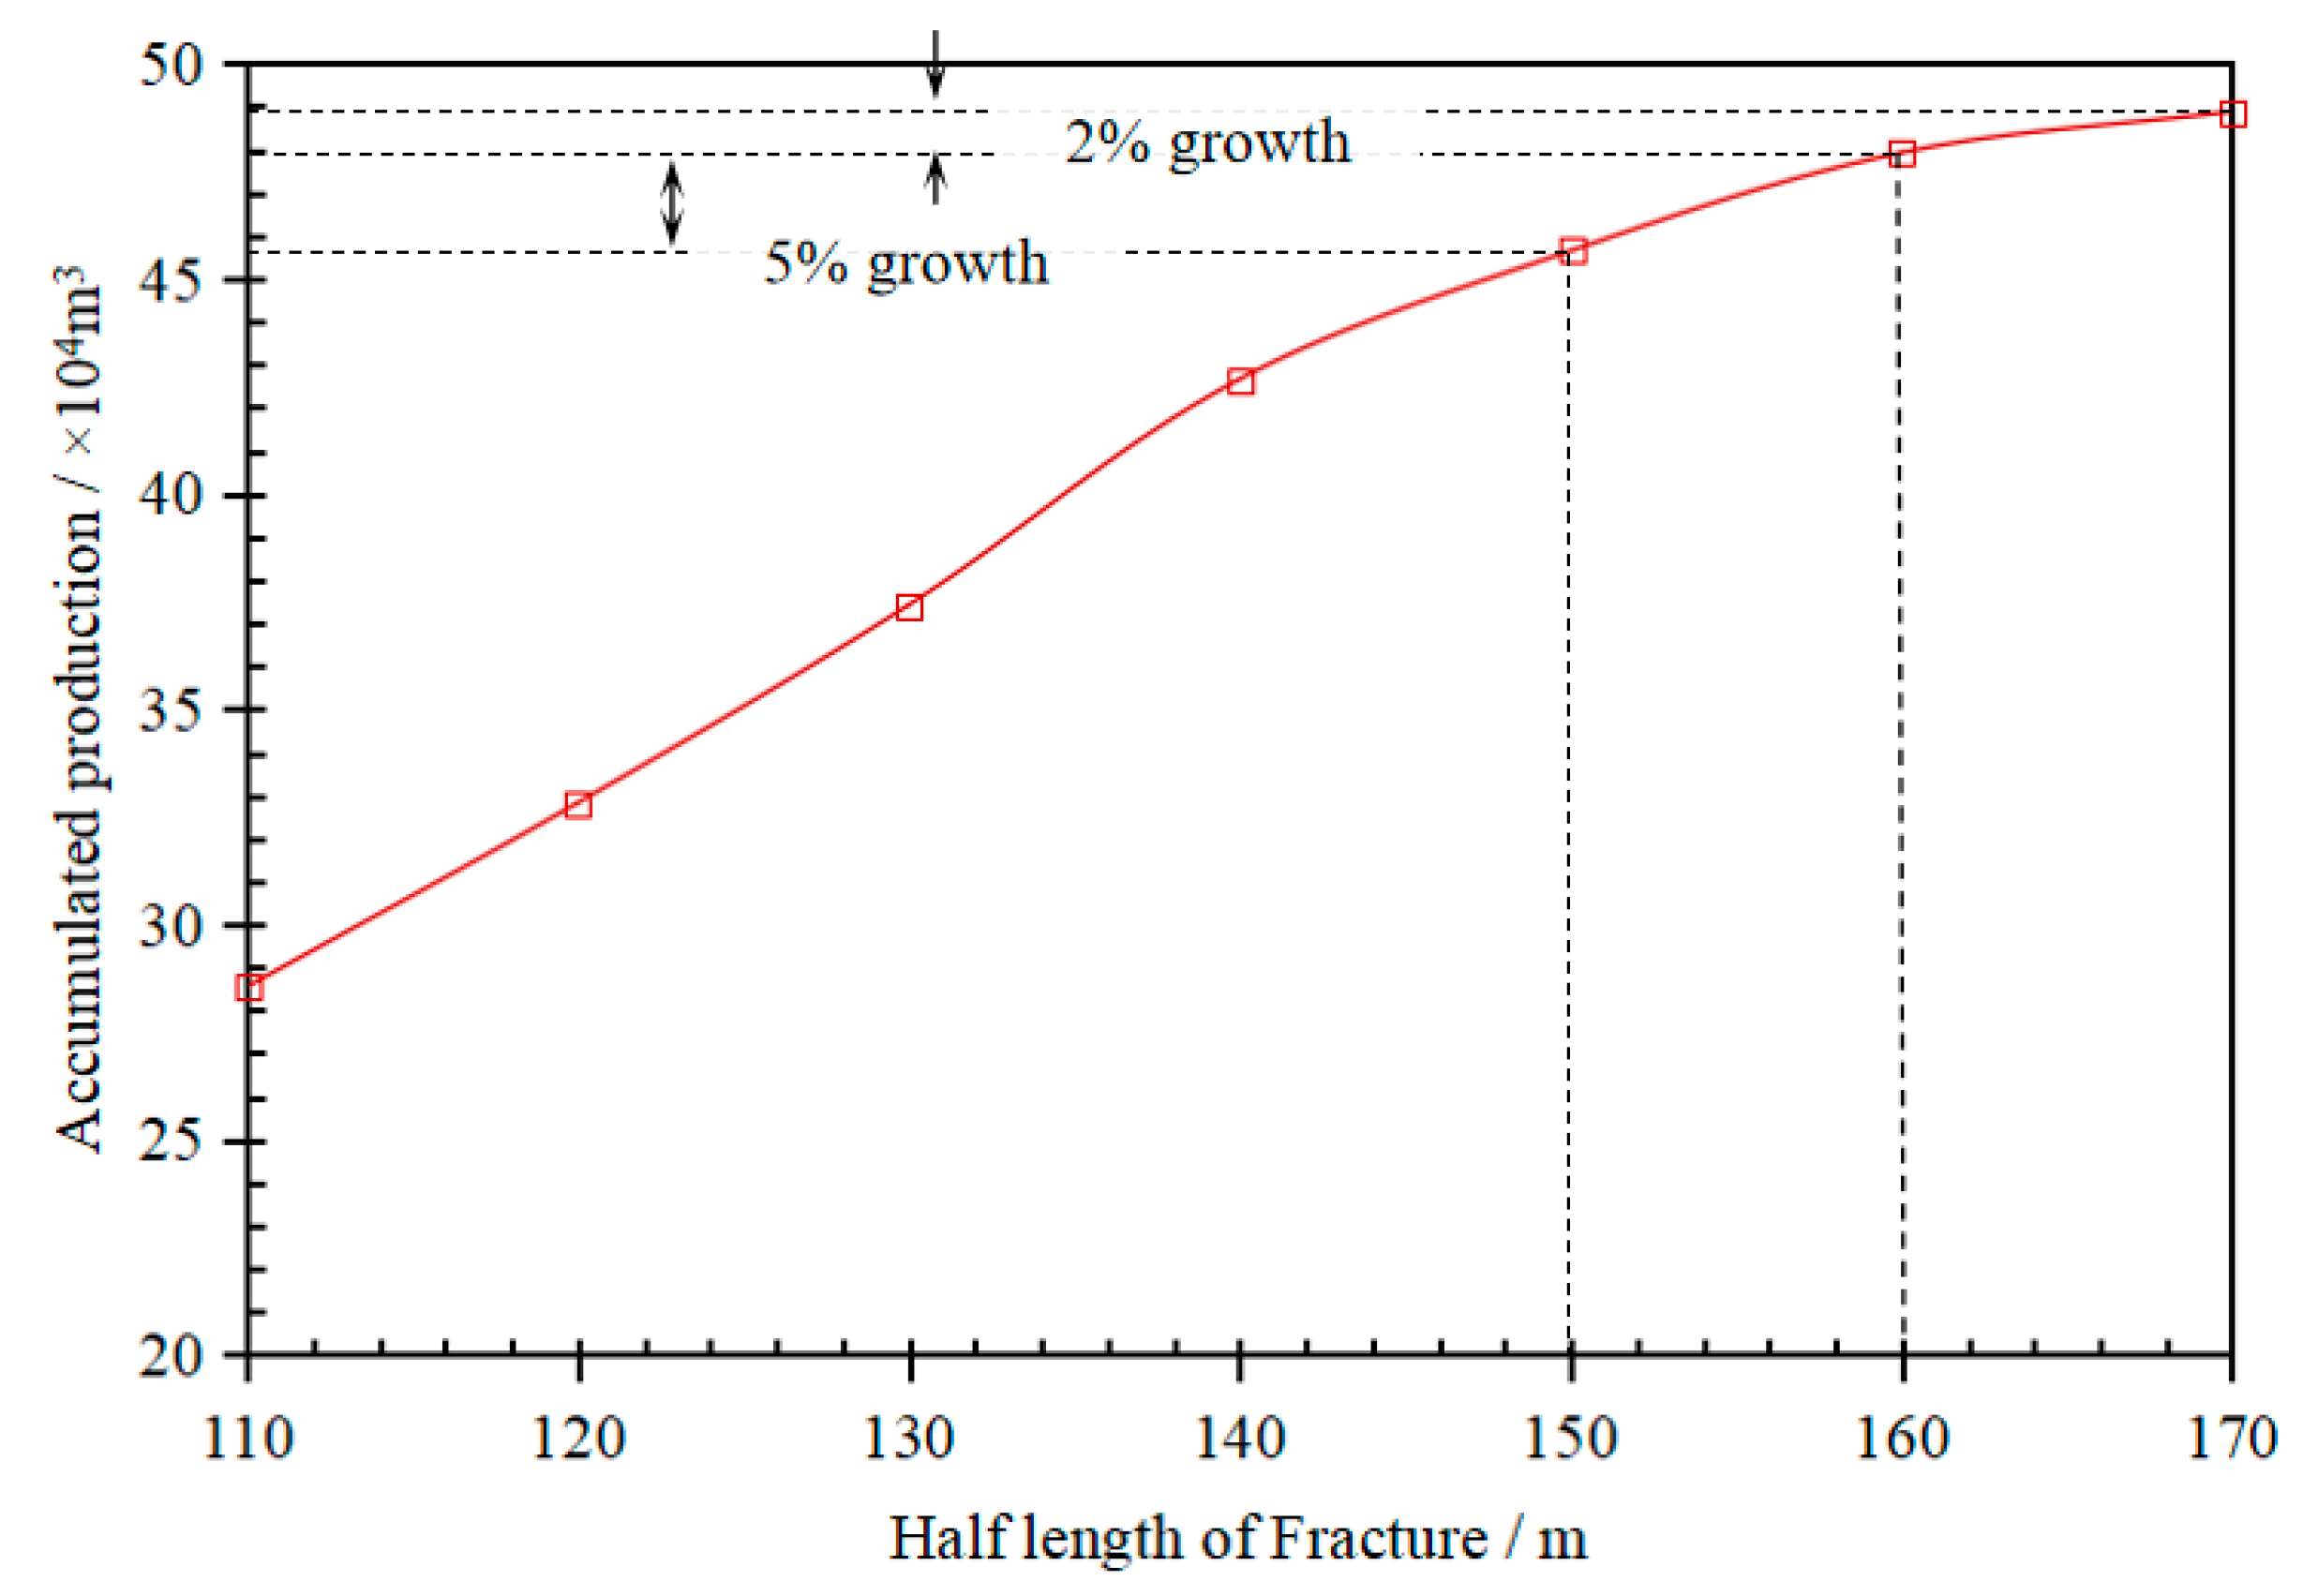
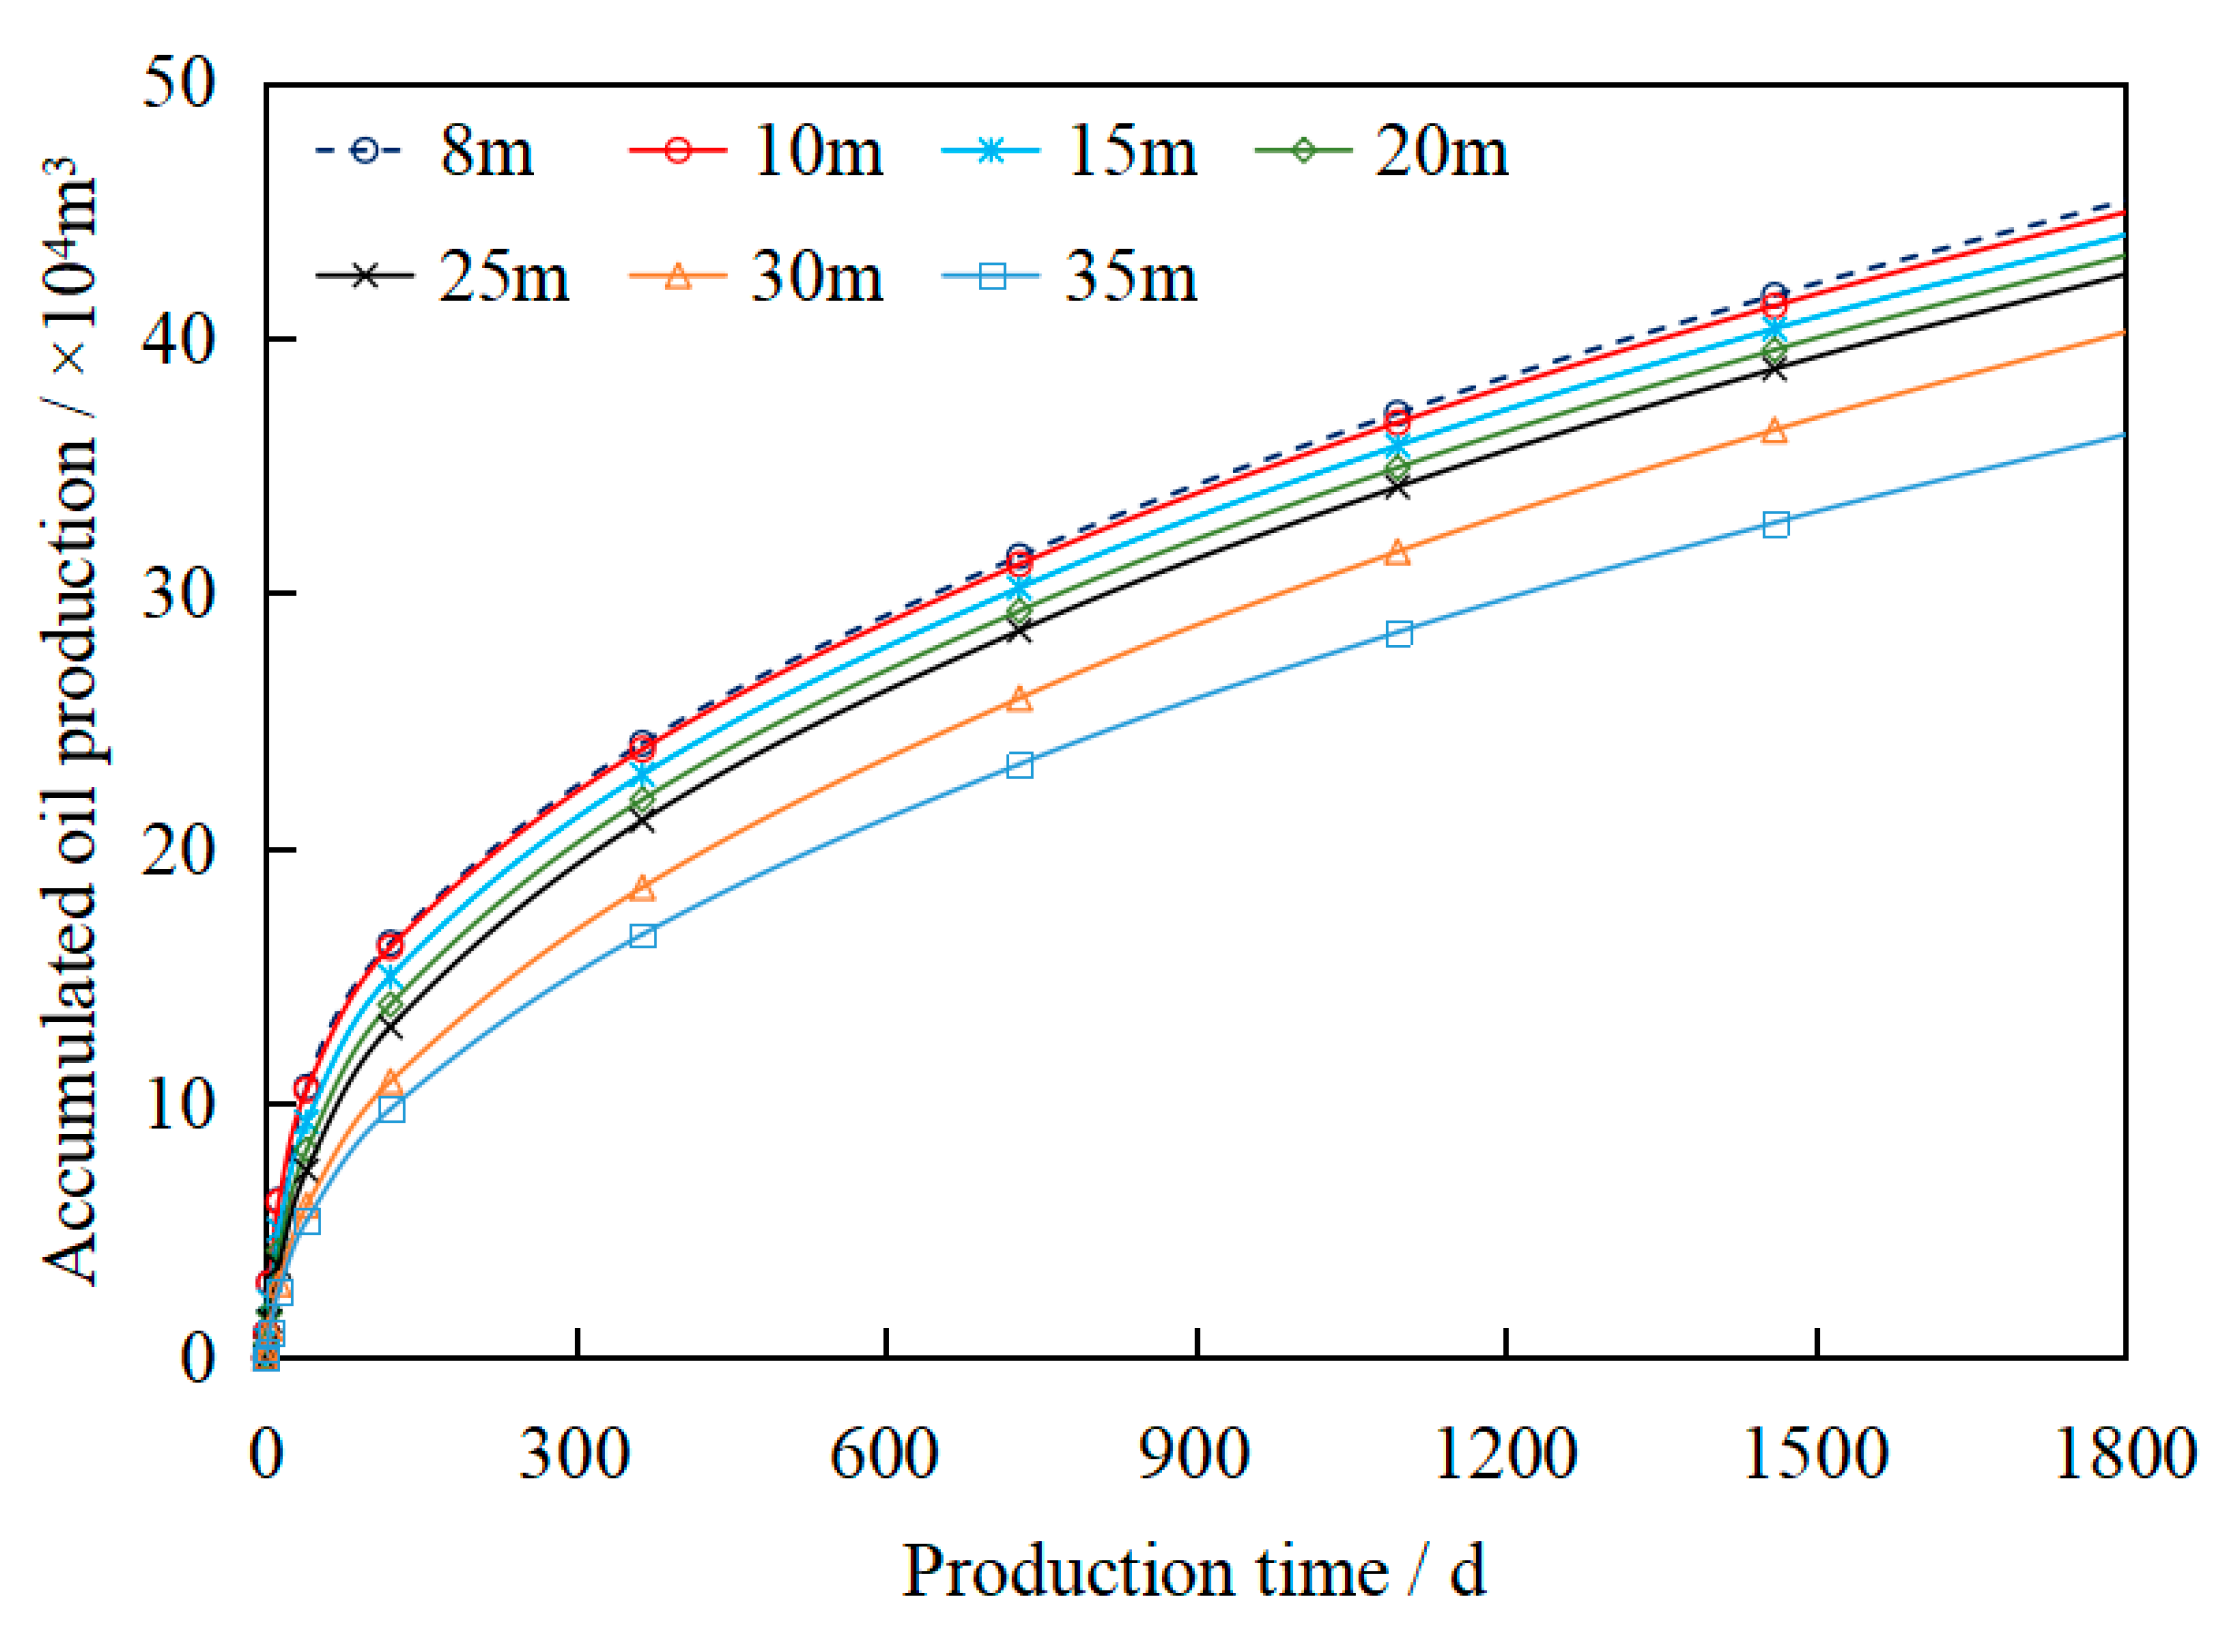
3.1. Fracture Length

The length of fractures is one of the key parameters in hydraulic fracturing, and the length of fractures in hydraulic fracturing directly affects the area of oil drainage, and the volume of reservoir reconstruction. According to the well layout of the algal limestone reservoir, under the condition of controlling the fracture spacing of 10 m, the fracture conductivity of 20 D·cm, and the fracture height of 30 m, the overall cumulative oil production of the horizontal well group is simulated when the half-lengths of the simulated fractures are 110 m, 120 m, 130 m, 140 m, 150 m, 160 m, and 170 m, respectively.
The simulation results of the variation of oil production in platform horizontal wells with production time under different fracture length conditions are shown in Figure 6. According to simulation calculations, the longer the half-length of the fracture, the larger the volume of reservoir utilization, and the higher the cumulative oil production. When the half-length is less than 160 m, the production is more sensitive to changes in the half-length of the fracture; when the half-length of the fracture is 110 m, the overall cumulative oil production of the platform well group is 28.5 × 10⁴ m3. When the half-length increases to 160 m, the cumulative production is 47.9 × 10⁴ m3. When the half-length exceeds 160 m, the increase in production slows down. When the half-length is 170 m, the cumulative production is 48.88 × 10⁴ m3.
The relationship between the overall oil production of a horizontal well group and the half-fracture length is shown in Figure 7. During the process of increasing the half-fracture length from 110 m to 150 m, for every 10 m increase in the half-length, the average cumulative oil production increases by 14%. Until the half-length of the fracture increased to 150 m, the increase in cumulative production slowed down. After the half-length increased from 160 m to 170 m, accumulated oil production only increased by 2%. At this time, increasing the length of the fracture did not significantly improve the degree of recovery. Taking into account the cost of fracturing construction, the optimal half-length of the horizontal well is determined to be 160 m.

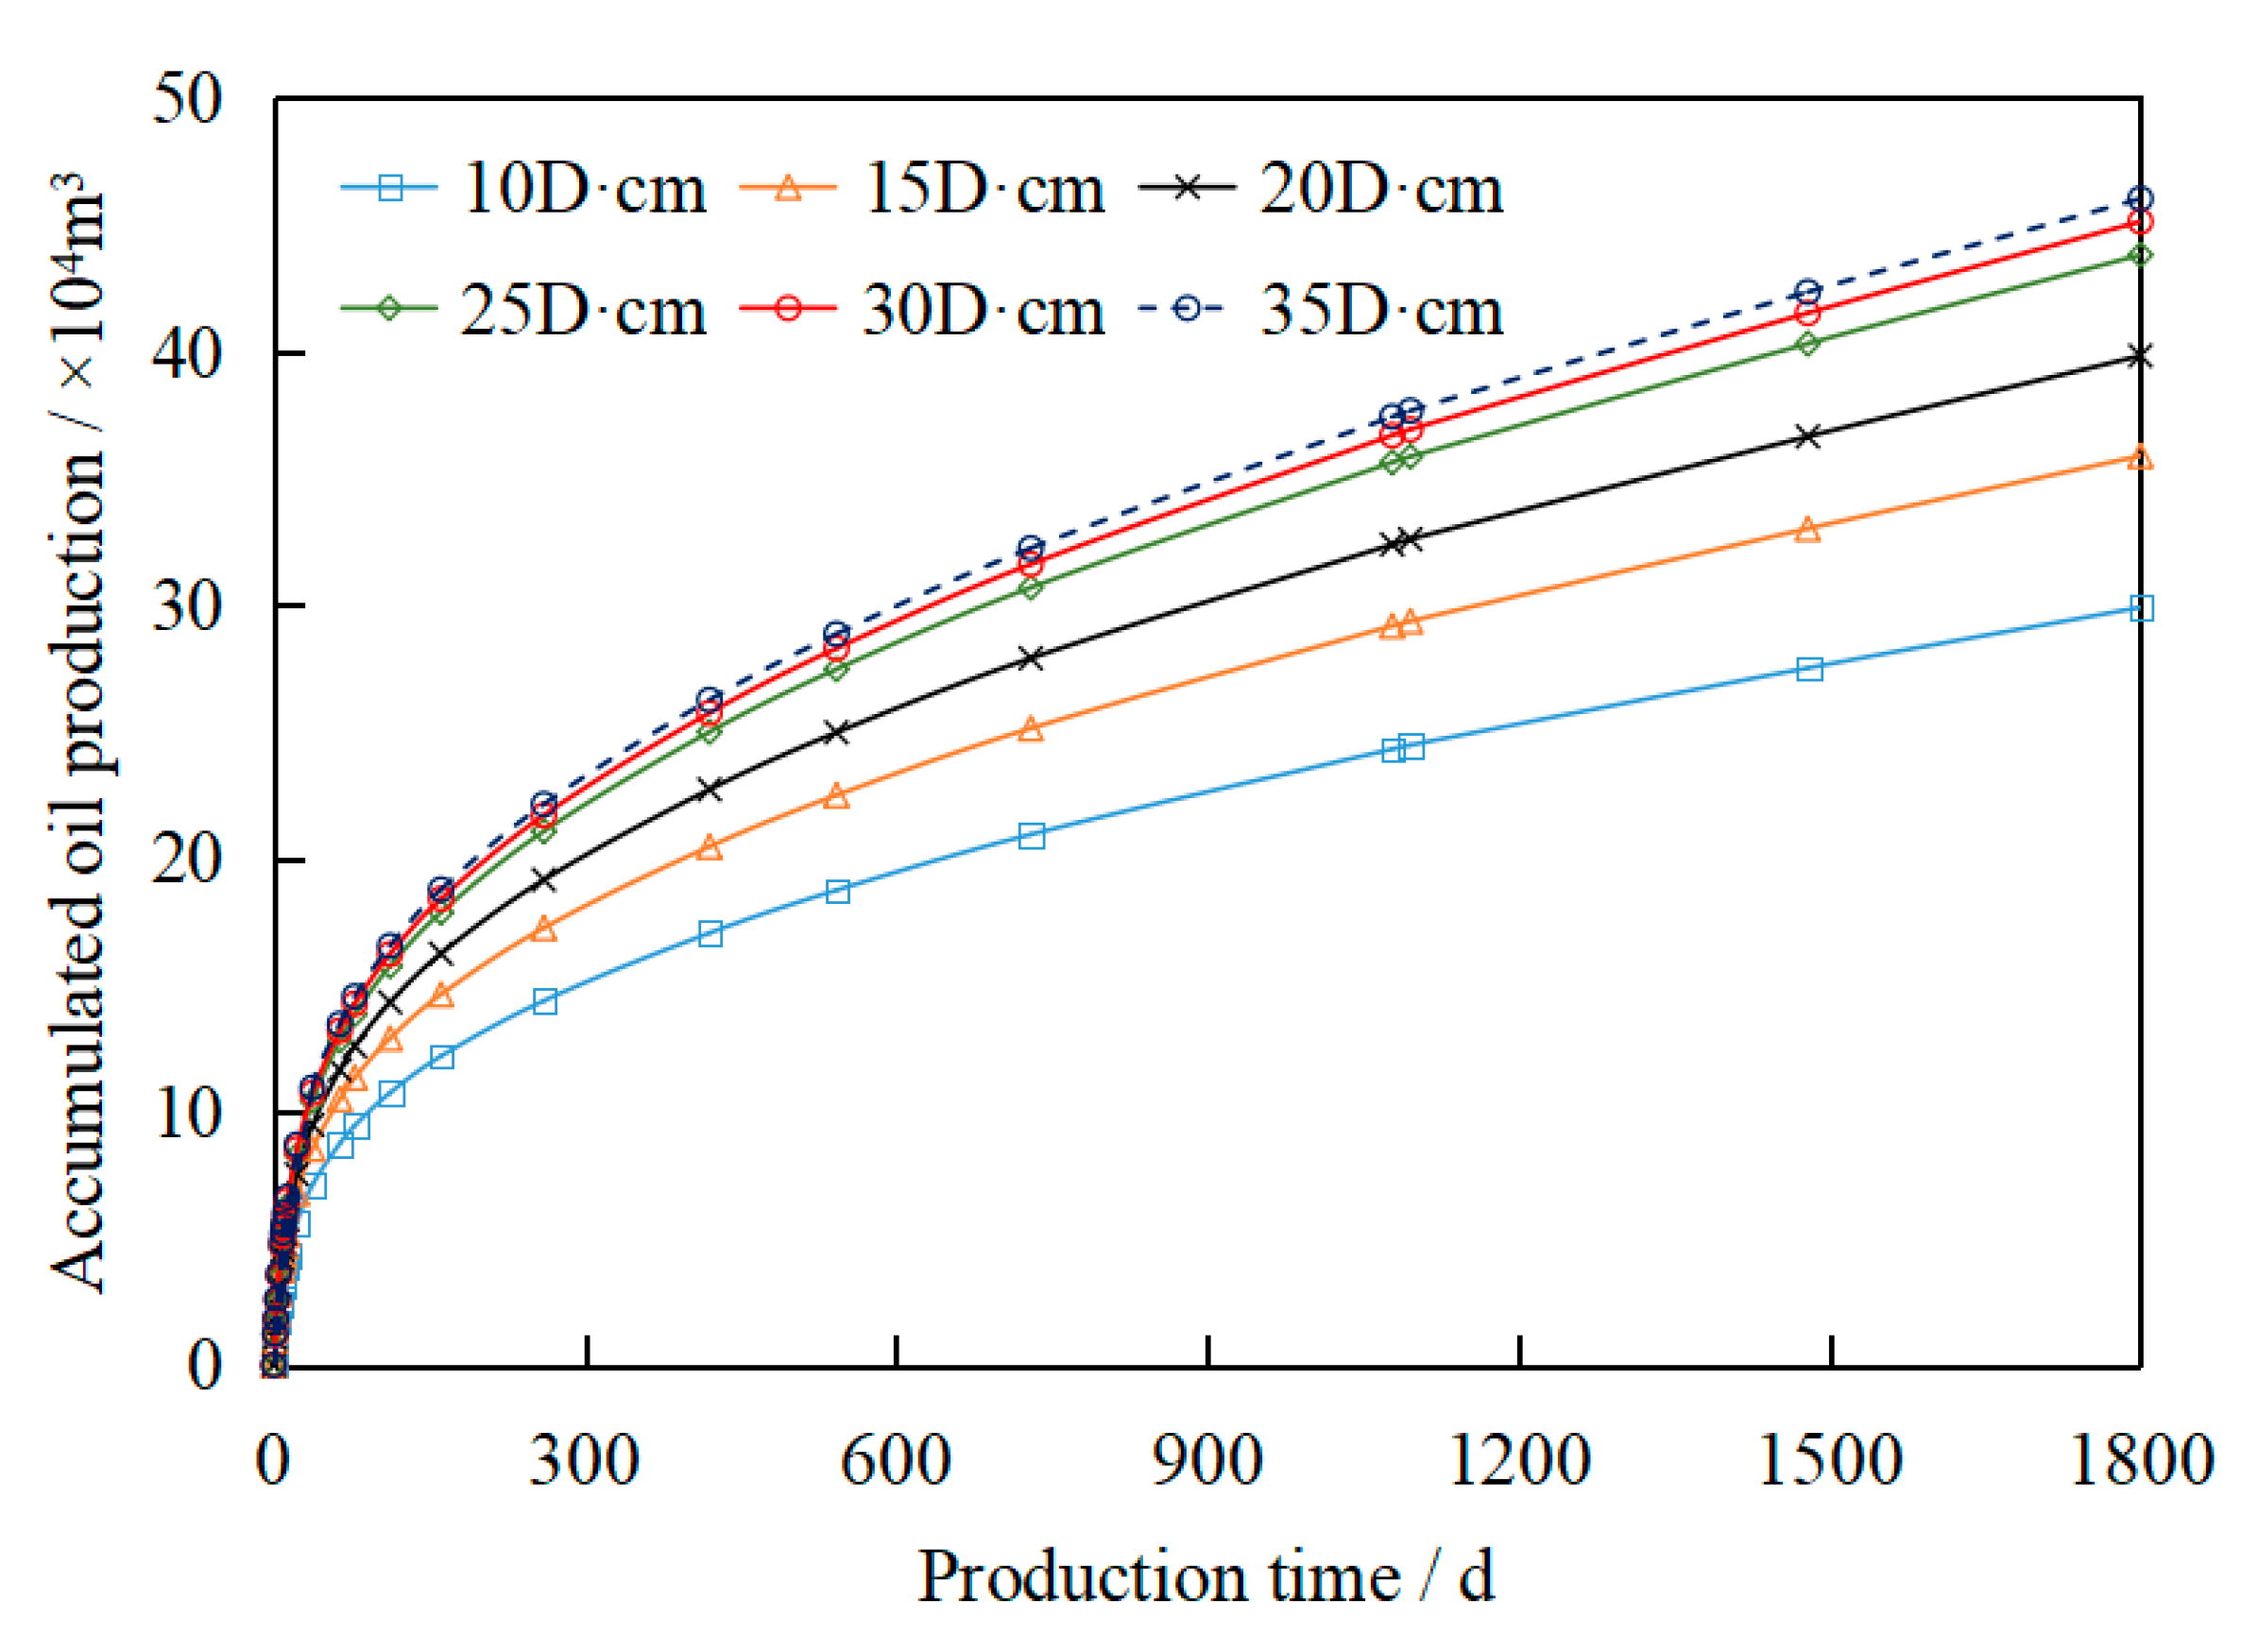
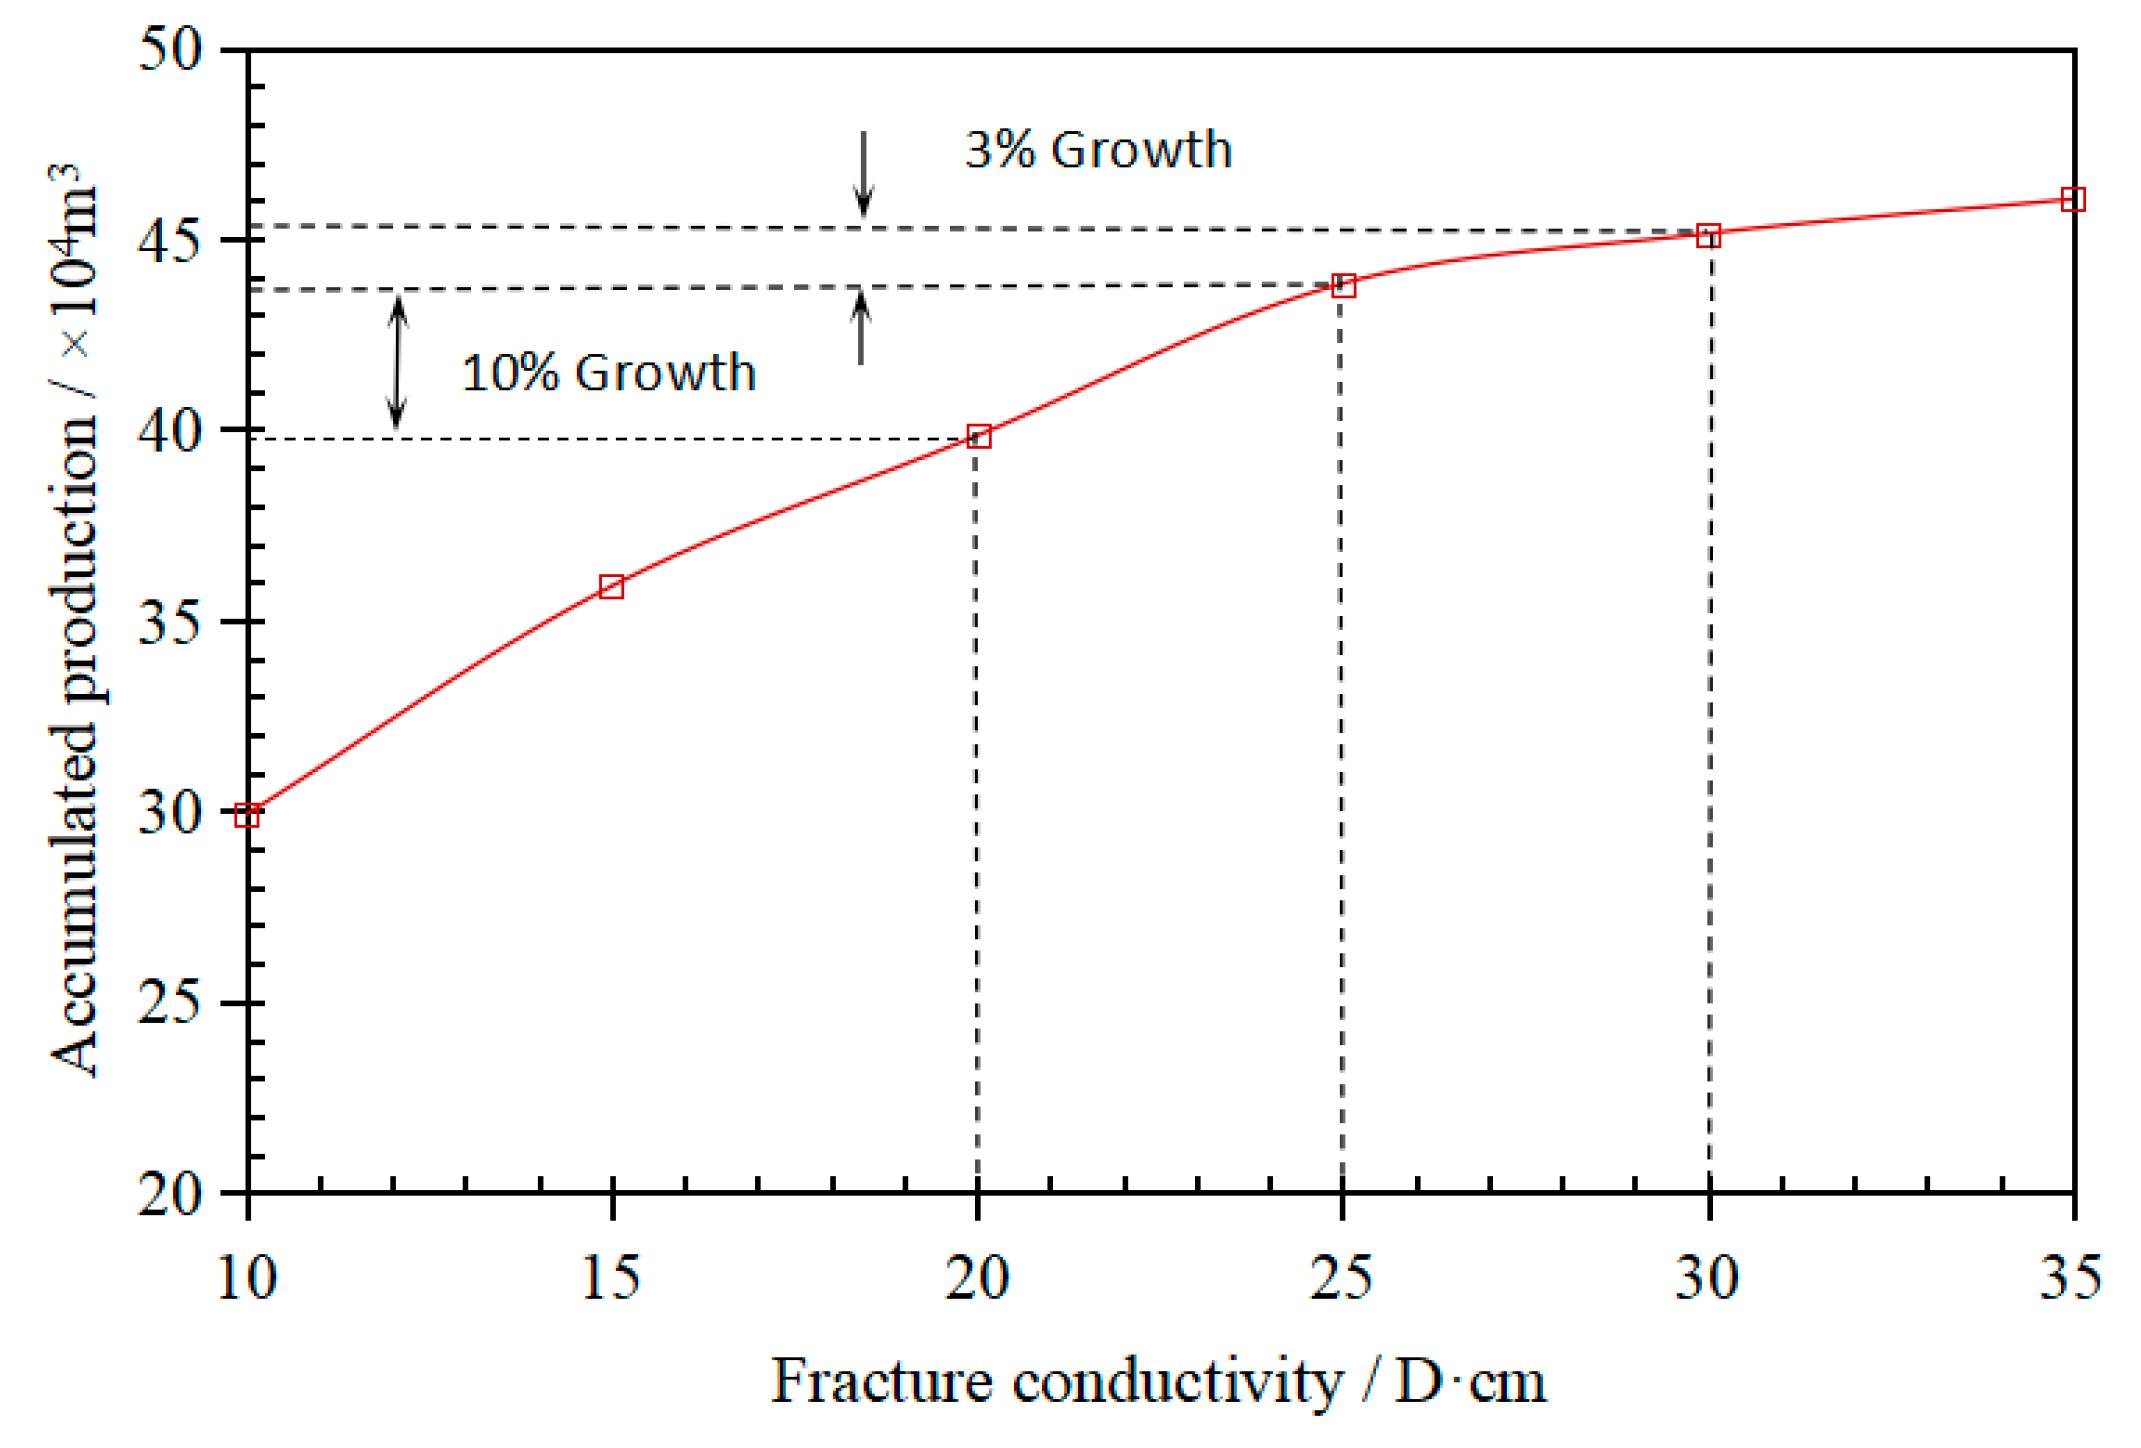
3.2. Fracture Conductivity

The hydraulic conductivity of fractures is an important indicator reflecting the quality of fractures. For a given reservoir condition, there exists an optimal hydraulic conductivity required by the formation. If it exceeds the required hydraulic conductivity of the formation, the contribution rate of artificial fractures to production will not increase [17]. Exploring the optimal hydraulic conductivity of the formation is of great significance for guiding fracturing design. Under the condition of controlling the fracture spacing to be 10 m, the half-length of the fracture to be 160 m, and the fracture height to be 30 m constant, the simulated hydraulic conductivity is 10 D·cm, 15 D·cm, 20 D·cm, 25 D·cm, 30 D·cm, and 35 D·cm, respectively, and the overall cumulative oil production of the horizontal well group is calculated.
The simulation results of the overall oil production of horizontal wells under different fracture conductivity conditions over time are shown in Figure 8. According to the simulation results, when the fracture conductivity is below 25 D·cm, increasing the fracture conductivity significantly increases production. When the formation fracture conductivity increases from 10 D·cm to 15 D·cm, the degree of recovery increases the most, and the overall oil production of the horizontal well group increases from 29.9 × 10⁴ m3 to 35.8 × 10⁴ m3. As the fracture conductivity continues to increase, the increase gradually slows down. When the fracture conductivity exceeds 25 D·cm, the cumulative oil production is basically unchanged.
The cumulative oil production variation curve under different fracture conductivity conditions is shown in Figure 9. After increasing the fracture conductivity from 15 D·cm to 20 D·cm, the cumulative oil production will increase by about 20%. During the process of increasing the fracture conductivity from 15 D·cm to 25 D·cm, the cumulative oil production increased steadily. For every increase of 5 D·cm in fracture conductivity, the cumulative oil production increased by about 15%. Production is more sensitive to changes in fracture conductivity; thus, when the fracture conductivity increases from 25 D·cm to 35 D·cm, the cumulative oil production is basically similar, with an increase of only 5%, and there is no significant change in the degree of recovery. Therefore, the required fracture conductivity of the formation is 25 D·cm~30 D·cm, and exceeding this fracture conductivity has little effect on improving overall production. The optimal value for fracture conductivity is 25 D·cm.

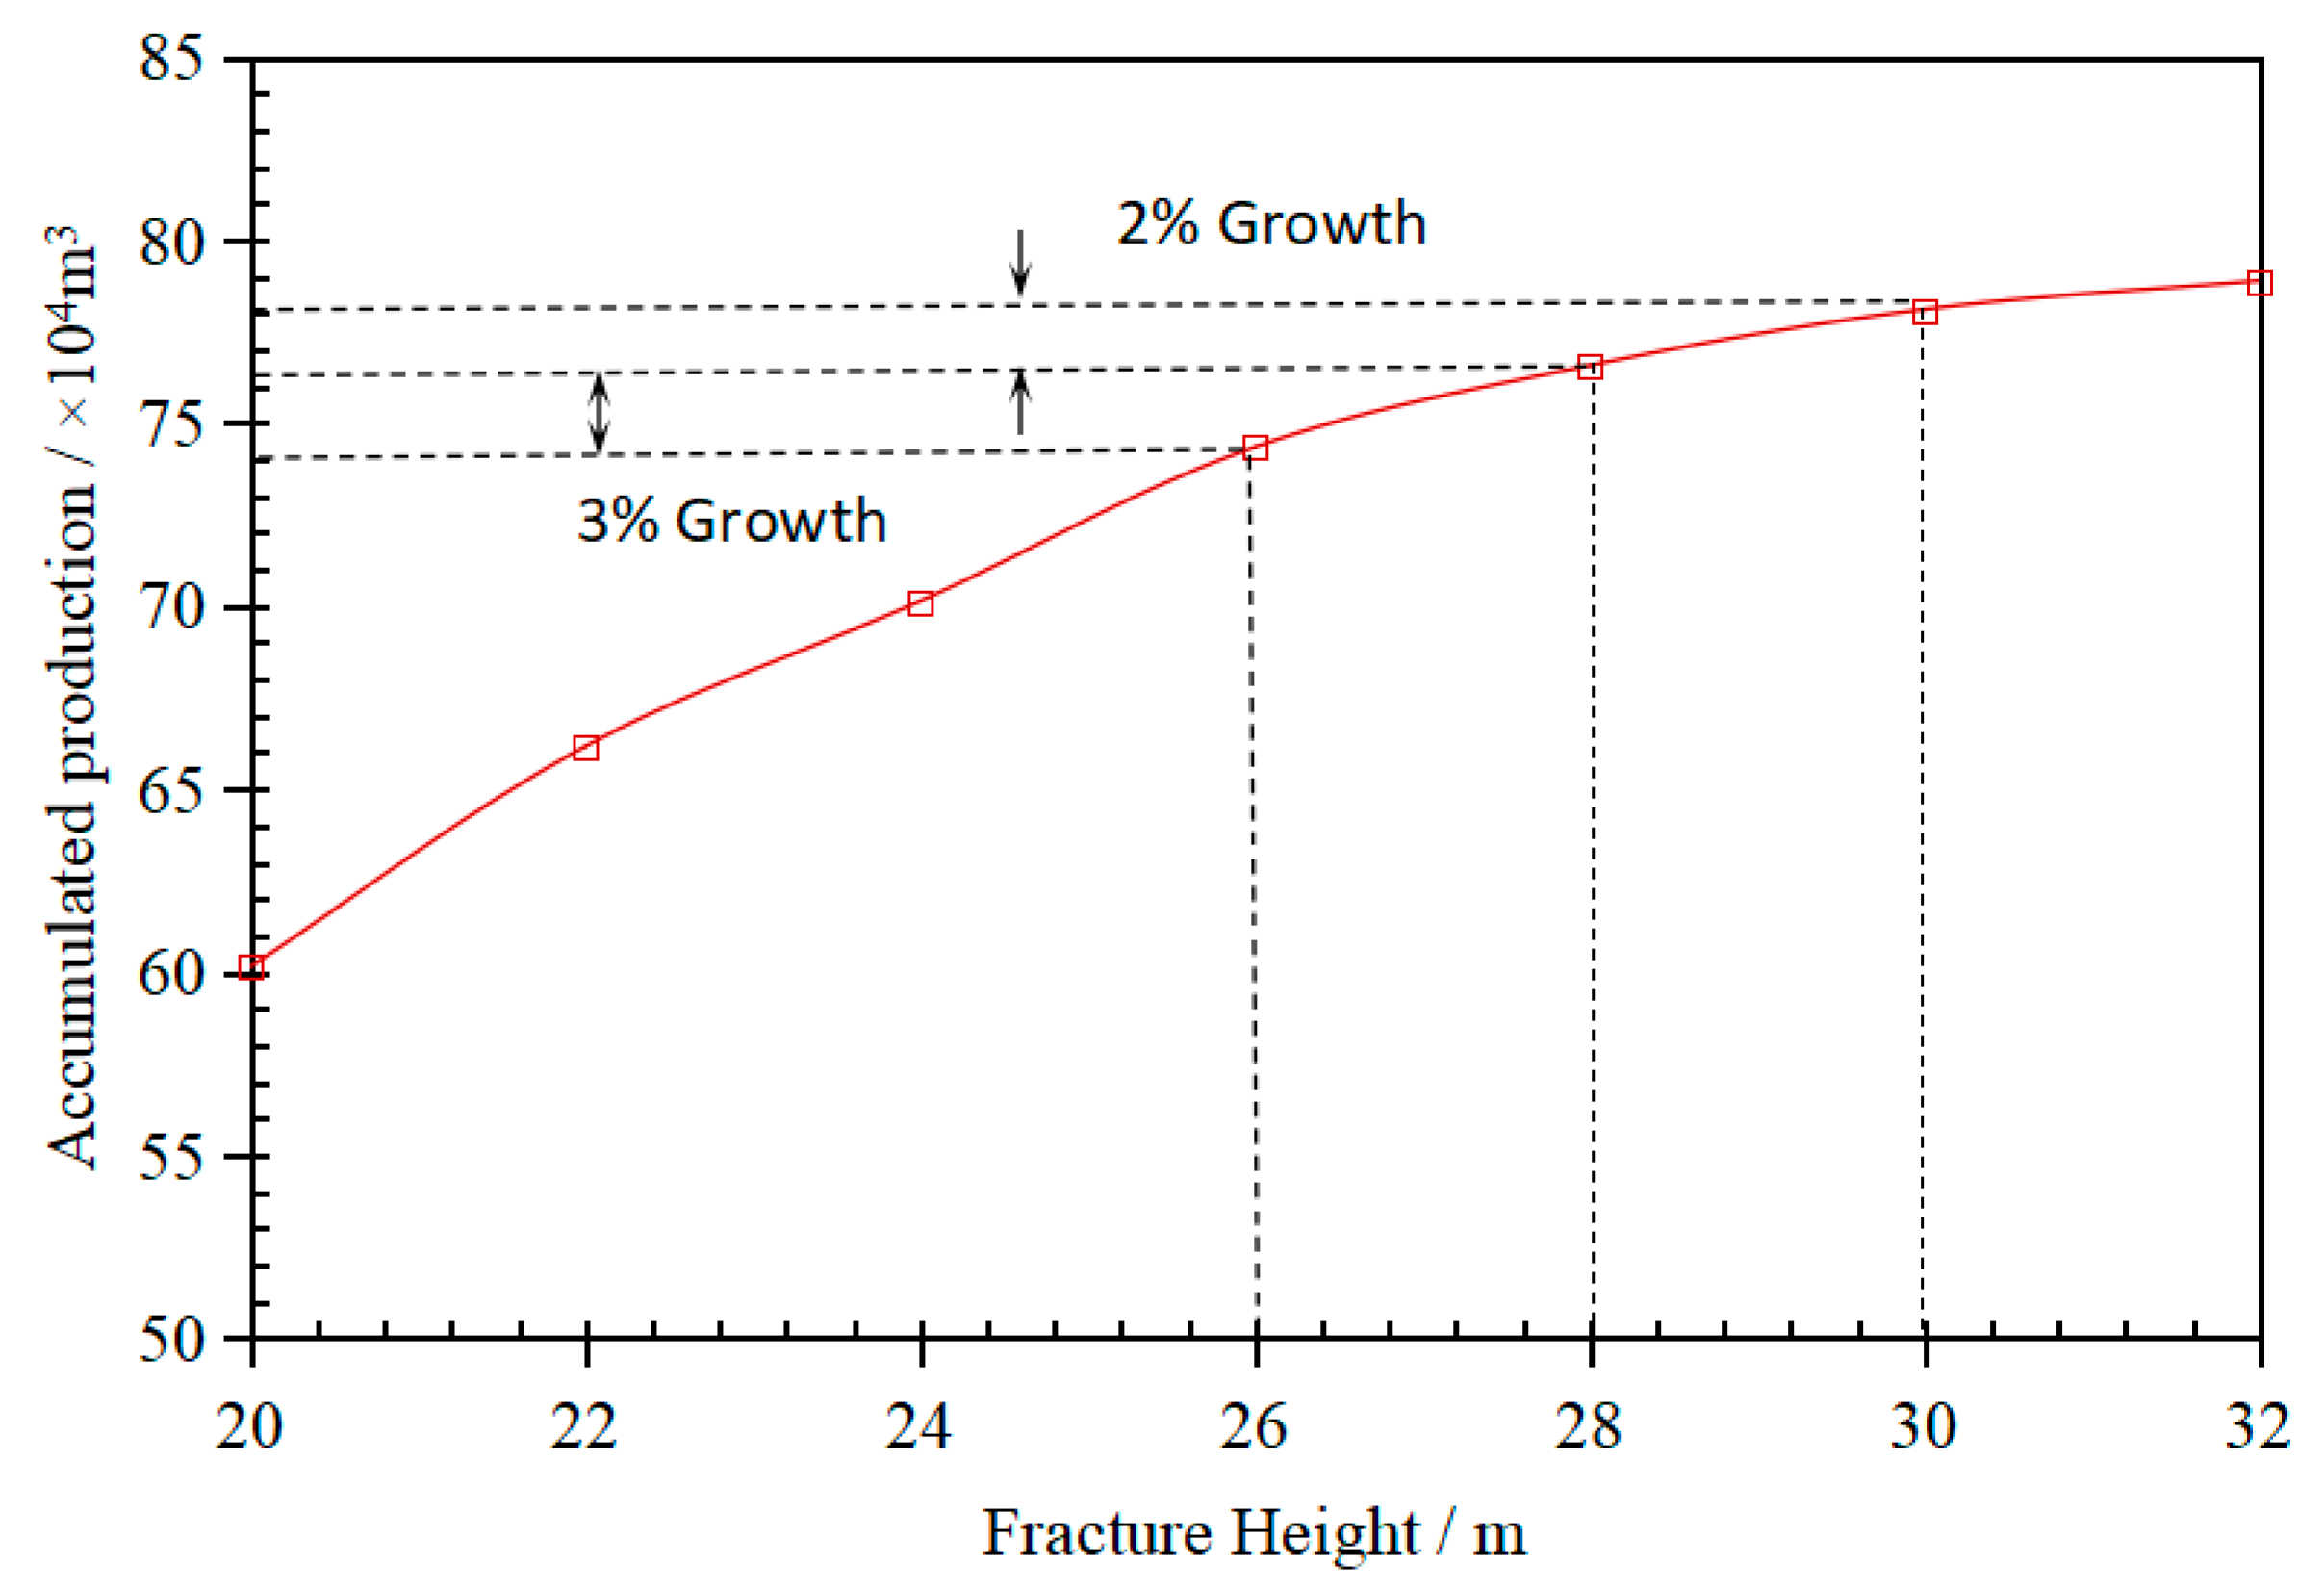
3.3. Fracture Height

The height of the fracture determines the vertical stimulation range of the reservoir, and the vertical extension range of the fracture needs to meet the sufficient stimulation of the oil layer. However, when the height of the fracture exceeds a certain value, it has little effect on improving the production of horizontal wells; furthermore, under a certain scale of fracturing construction, excessive expansion of fracture height will be accompanied by a decrease in fracture length, which is not conducive to improving the degree of reservoir utilization. In the simulation test, under the condition of controlling the fracture spacing of 10 m, the fracture conductivity of 20 D·cm, and the half-length of the fracture of 160 m unchanged, the overall cumulative oil production of the horizontal well group is simulated when the fracture heights are 20 m, 22 m, 24 m, 26 m, 28 m, 30 m, and 32 m, respectively.
The simulation results of the cumulative production of algal limestone horizontal wells under different fracture height conditions with production times are shown in Figure 10, and the corresponding relationship curve between fracture height and cumulative production is shown in Figure 11. According to the simulation calculation results, when the fracture height increases from 20 m to 26 m, the average increase in cumulative oil production is 7.33%; when the fracture height exceeds 26 m, the increase in cumulative oil production slows down. When the fracture height increases from 26 m to 28 m, the cumulative oil production increases by 3%. However, when the fracture height increases from 30 m to 32 m, the cumulative production only increases by 1%, indicating that the increase in fracture height has almost no significant effect on production after exceeding 28 m; therefore, the optimal fracture height is determined to be 28 m.

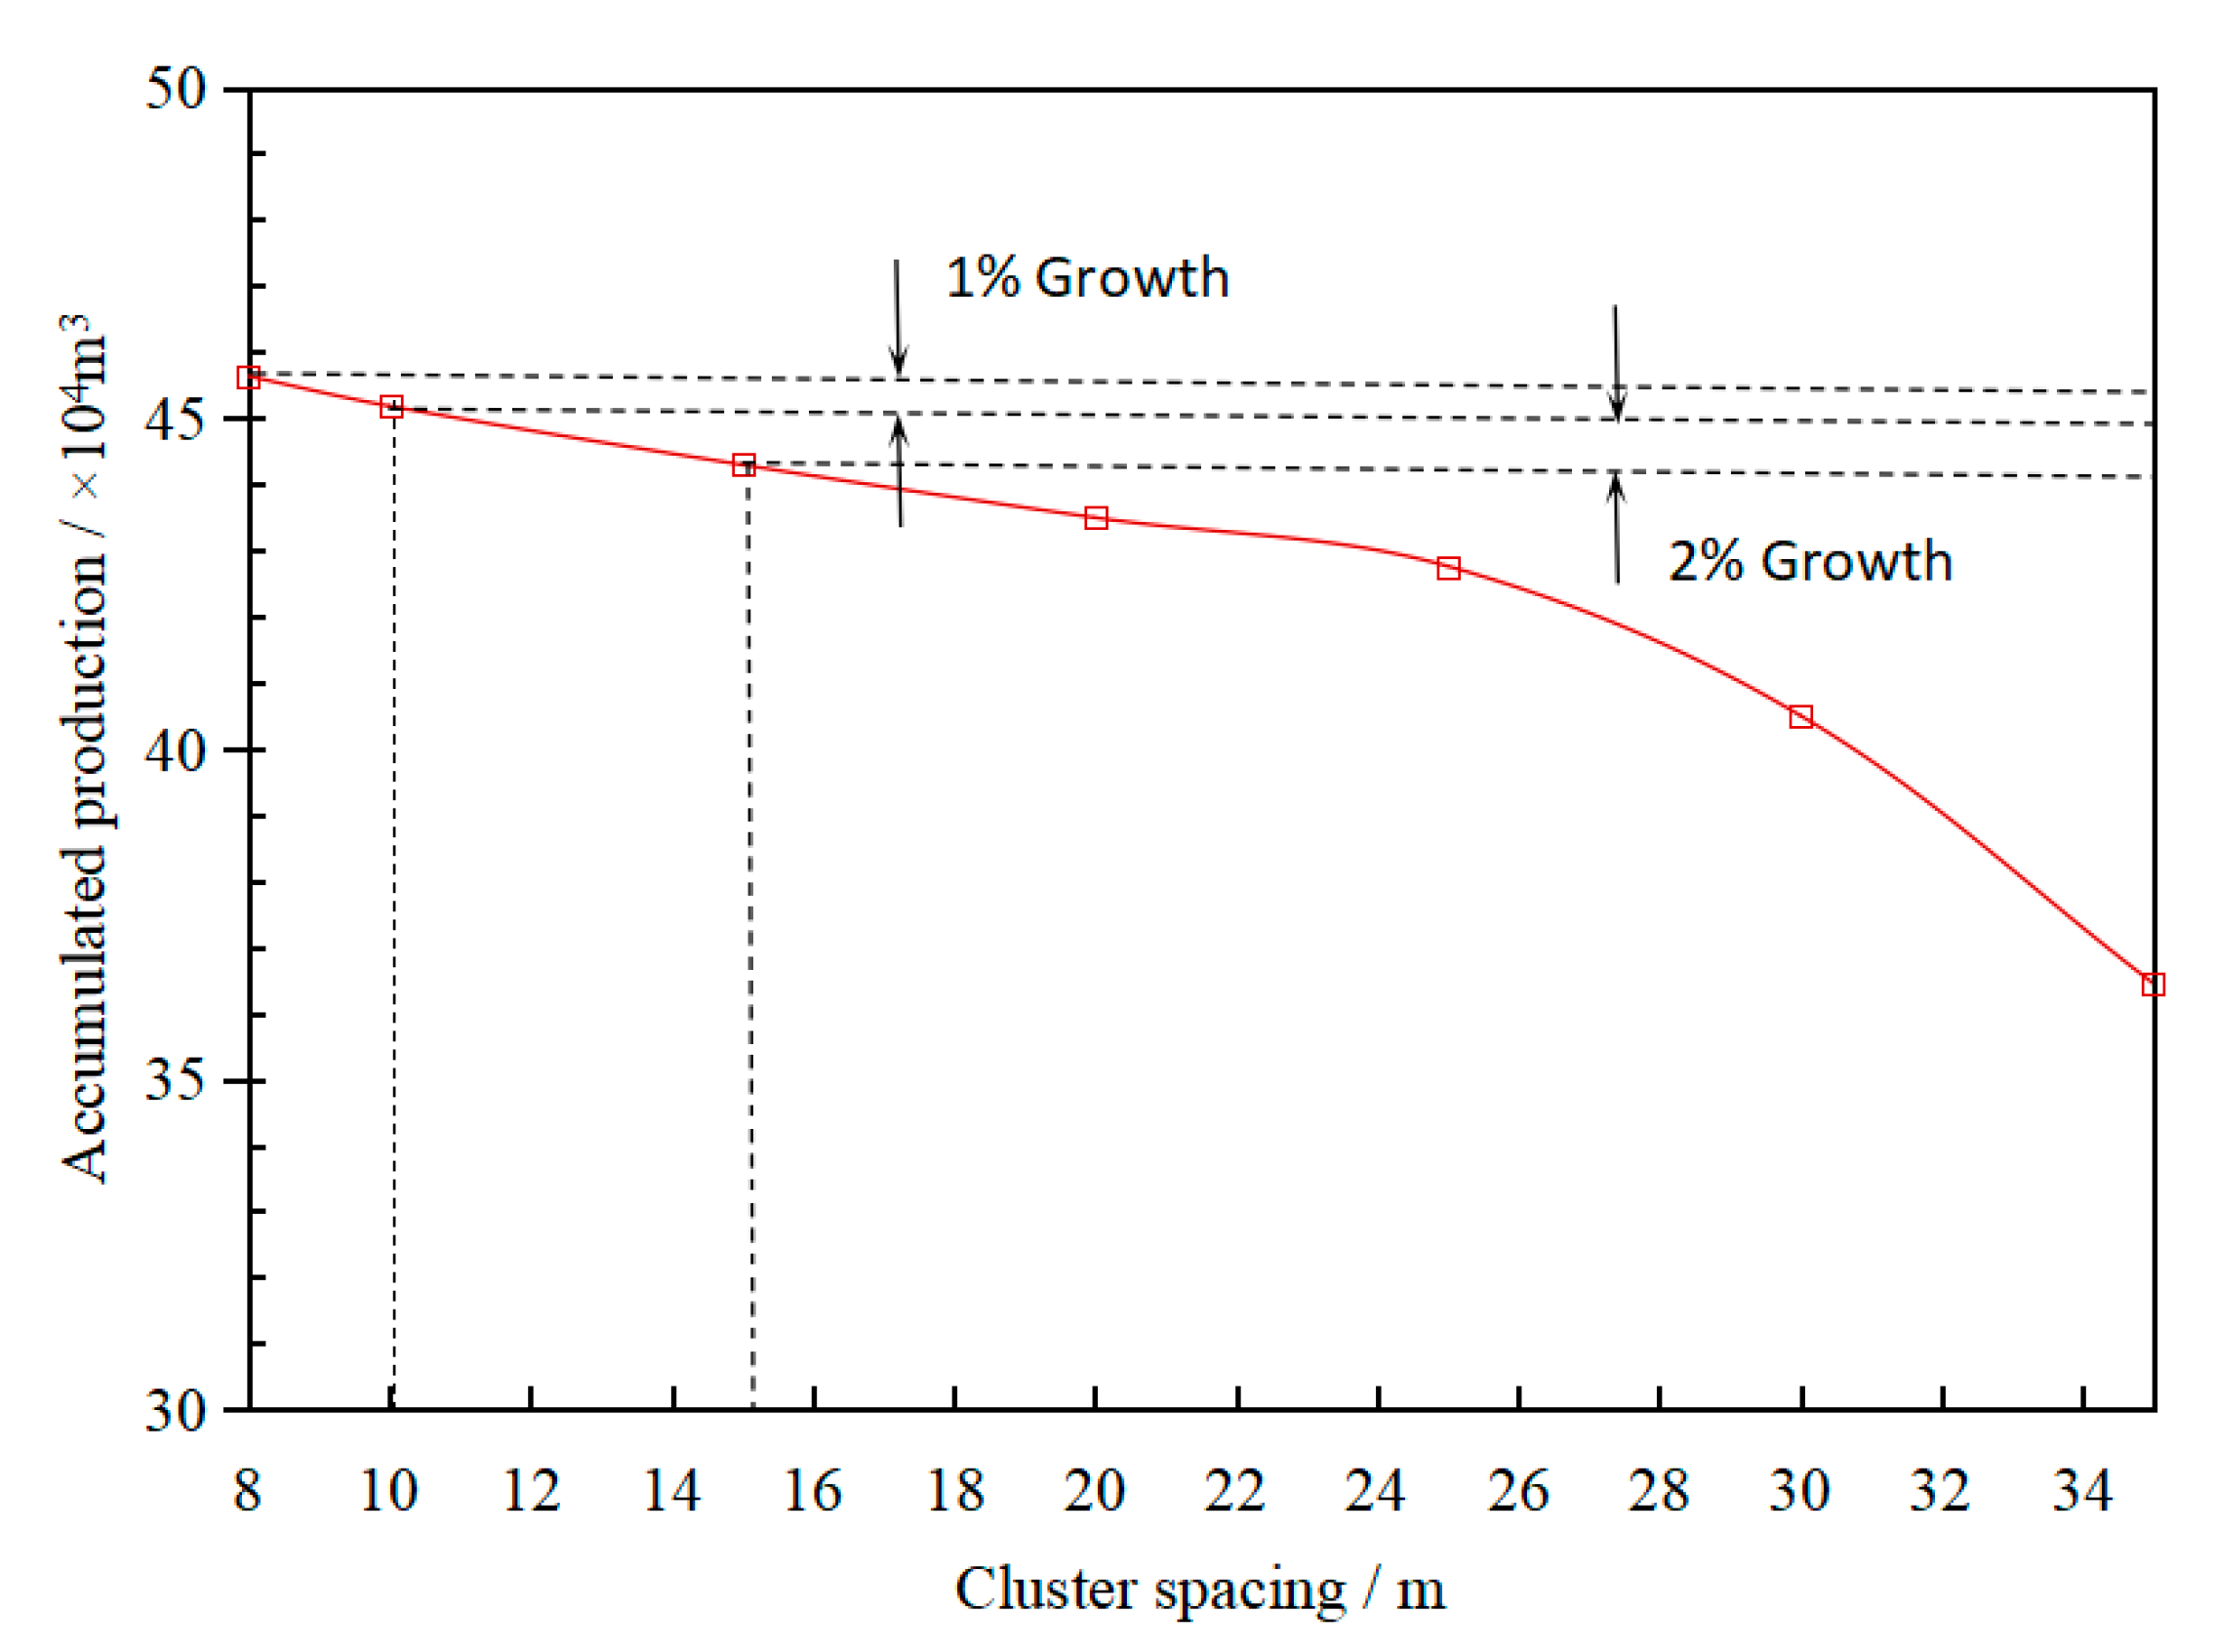
3.4. Fracture Spacing

The algal limestone reservoir has strong heterogeneity, poor reservoir physical properties, and a horizontal stress difference of more than 13 MPa. According to the microseismic monitoring results of fractured wells, artificial fractures are mainly single double-wing fractures with low complexity. Therefore, drawing on the concept of “fracture controlled reserves” stimulation and optimization technology [18], a “dense cutting” volume fracturing process is adopted for the horizontal well of the algal limestone reservoir in the Lower Oil Sand Mountain Formation. When optimizing the fracture spacing, the overall cumulative production of the horizontal well group is simulated with fracture spacing of 8 m, 10 m, 15 m, 20 m, 25 m, 30 m, and 35 m, under the condition that the half-length of the fracture is controlled to 160 m, the fracture conductivity is 25 D·cm, and the fracture height is kept constant at 28 m.
The simulation results of the overall oil production of a horizontal well group under different cluster spacing conditions as a function of production time are shown in Figure 12. According to simulation results, as the spacing between artificial fractures decreases, the more fully the controlled reserves of horizontal well fractures are utilized after fracturing stimulation. During the process of shortening the fracture spacing from 35 m to 25 m, the production increased significantly from 36 × 104 m3 to 42.7 × 10⁴ m3. When the fracture spacing is less than 25 m, although the yield increases, the increase slows down; however, when the fracture spacing was shortened from 10 m to 8 m, there was no significant change in production, maintaining around 45.2 × 10⁴ m3.
The relationship between cumulative production and fracture spacing is shown in Figure 13. When the fracture spacing is shortened from 35 m to 25 m, the cumulative oil production increases by 7.38%. With the further increase in artificial fracture density, the increase in cumulative oil production slows down. When the fracture spacing is shortened from 25 m to 10 m, the production increases by 5.66%; however, when the fracture spacing is further shortened to 8 m, the cumulative production is 45.63 × 10⁴ m3, only having an increase of 0.9%. The reason for this is that when the fracture spacing is 10 m, the reservoir can be fully utilized. Excessive reduction of the fracture spacing will cause interference between the fractures, create stress shadow areas, and form ineffective stimulation areas. Therefore, the optimal fracture spacing for a horizontal well is determined to be 10 m.

3.5. Fracturing Mode

Exploring the fracturing method of horizontal wells is a key part of optimizing the overall fracturing of platform wells, and the fracturing method has a significant impact on improving the production increase effect of platform wells after overall fracturing [19]. The main types of fracturing modes are staggered fracturing and facing fracturing. The schematic diagram of different fracturing methods is shown in Figure 14. The staggered distribution of artificial fracture spatial positions between adjacent horizontal wells is called staggered fracturing. Conversely, the pairwise relative distribution of artificial fracture spatial positions is called facing fracturing.
Taking the overall production of the platform’s horizontal well group as the optimization objective, under the condition of controlling the length, conductivity, height, and spacing of fractures between single-wells, the simulation of the cumulative oil production under the staggered and face-to-face fracturing modes between horizontal wells is realized. The production of horizontal well groups under different fracturing modes is shown in Figure 15. According to the simulation calculation results, the cumulative oil production of the staggered mode is significantly higher than that of facing, with an increase of about 8.98%. The reason for this is that under the condition of staggered fracturing, the contact area between the fractures and the reservoir is increased, and the range of oil and gas resources parallel to the horizontal well direction is expanded. Therefore, in the overall fracturing of the horizontal well platform, the optimal staggered fracturing mode is conducive to improving the overall oil production of the platform well group.

4. Conclusions

The lithology of algal limestone is influenced by sedimentation, and the pore types are mainly dissolution pores and intergranular pores. Local micro fractures or weak structural planes are relatively developed, and its physical properties are better than other lithologies of the reservoir. This article establishes a mathematical model for a triple medium reservoir consisting of fractures, dissolution pores, and matrix pores, making the study of optimization of fracture parameters in algal limestone reservoirs more targeted and practical for reference significance.
The cumulative oil production of horizontal well platform well groups is more sensitive to changes in the half-length of fractures and fracture conductivity (when the fracture length is small, the cumulative production increases by 14% for every 10 m increase in half-fracture length; when the conductivity is small, the cumulative production increases by 20% for every 5D·cm increase in conductivity), but is less sensitive to changes in fracture height and spacing (the cumulative oil production increases by about 7% with both changes). The reason for this is that for low porosity and ultra-low permeability reservoirs in algal limestone reservoirs, the production size is closely related to the scale of fracturing stimulation. The longer the artificial fractures with effective flow conductivity, the larger the contact area between the reservoir and the seepage channel, which is more conducive to the utilization of reserves in the far end of horizontal wells, and has a more significant impact on production. The algal limestone reservoir has the characteristics of thin and dispersed layers, which are influenced by the distribution characteristics of lithology. Although increasing the height of fractures and the density of artificial fractures can improve cumulative oil production within a certain range, the degree of reservoir utilization is limited. Therefore, the main controlling factors affecting production are the half-length of fractures and their conductivity.
For the platform-based integrated fracturing of algal limestone horizontal wells, there is a relatively optimal combination of fracture parameters. According to the numerical simulation results of the reservoir, the optimal half-length of the fractures for the algal limestone reservoir in the Lower Oil Sand Mountain Formation of the Chaidamu Basin is 160 m, while the fracture conductivity is 25D·cm, the fracture height is 28 m, the fracture spacing is 10 m, and the fracturing mode between adjacent horizontal wells on the platform is staggered. Under this fracture parameter combination mode, the full utilization of reservoir oil and gas resources can be achieved, and the optimization results have reference significance for the efficient development of domestic algal limestone reservoirs.

Author Contributions

Conceptualization, H.Z.; data curation, Z.W.; formal analysis, S.L., H.Z. and G.X.; investigation, T.X., H.Z. and Y.L.; methodology, D.G., X.M. and Y.L.; resources, H.Z.; software, Y.W. and G.X.; validation, S.L. and X.M.; writing—review and editing, H.Z. All authors have read and agreed to the published version of the manuscript.

Funding

This research received no external funding.

Data Availability Statement

The data presented in this study are available on request from the corresponding author.

Conflicts of Interest

Authors Shiduo Liu, Tingsong Xiong, Yong Liu, Delong Guo, Youyu Wan, Guiqi Xie and Zhisheng Wang were employed by the company Qinghai Oilfield Company, PetroChina. The remaining authors declare that the research was conducted in the absence of any commercial or financial relationships that could be construed as a potential conflict of interest. The company had no role in the design of the study; in the collection, analyses, or interpretation of data; in the writing of the manuscript, or in the decision to publish the results.

References

  1. Zhou, L.; Yang, D.; Zhang, L.; Yin, T. Characteristics of algal limestone reservoirs in Huatugou oil field and their relationship with oil and gas. Spec. Oil Gas Reserv. 2010, 17, 60–62. [Google Scholar]
  2. Qu, Z.; Zhao, Y.; Wen, Q.; Yu, J.; Liu, G. Optimization design of overall fracturing fracture parameters for horizontal wells. Pet. Geol. Recovery Effic. 2012, 19, 5. [Google Scholar]
  3. Xu, C.; Chen, C.; Wang, B.; Wu, Y.; Peng, C. Optimization of fracture parameters for horizontal well network fracturing in low-permeability and tight oil reservoirs. Block Oil Gas Fields 2014, 21, 5. [Google Scholar]
  4. Mao, Y. Optimization of overall fracturing fracture parameters for horizontal wells in ultra-low permeability reservoirs. J. Yangtze Univ. (Nat. Sci. Ed.) 2019, 16, 6. [Google Scholar]
  5. He, Q.; Zhu, L.; Li, Y.; Li, D.; Zhang, B. Simulating Hydraulic Fracture Re-orientation in Heterogeneous Rocks with an Improved Discrete Element Method. Rock Mech. Rock Eng. 2021, 54, 2859–2879. [Google Scholar] [CrossRef]
  6. Lu, H.; Li, Y.; Zhang, J.; Huang, A.; Li, X.; Wang, Y.; Qu, Z. Layer Selection Combination and Fracture Parameter Optimization Design of Staged Fracturing in Glutenite Reservoir. J. Chengde Pet. Coll. 2021, 23, 7. [Google Scholar]
  7. Jiang, B.; Zhou, Y.; Chen, L.; Yuan, H.; Tang, Z.; Ma, L.; Lu, C. Optimization of fracture parameters for heterogeneous reservoir in B425 block. Sci. Technol. Eng. 2021, 21, 9322–9329. [Google Scholar]
  8. Liang, X.; Meng, T.; Feng, G.; Zhao, G.; Wang, Z.; Liu, P. Evolution of permeability and pore structure of salt rock and its self-healing mechanism under coupled thermo-hydro-mechanical environment. J. Energy Storage 2023, 66, 107476. [Google Scholar] [CrossRef]
  9. Zhang, Z.; Meng, T.; Feng, G.; Zhang, D.; He, Y.; Liang, X. Study on the Periodic Collapse of Suspended Sandstone Interlayer under Coupled Thermo–Hydro–Mechanical Environment. Int. J. Geomech. 2023, 23, 04023113. [Google Scholar] [CrossRef]
  10. Meng, T.; Zhang, Z.; Taherdangkoo, R.; Zhao, G.; Butscher, C. Temperature-dependent evolution of permeability and pore structure of marble under a high-temperature thermo-hydro-mechanical coupling environment. Acta Geotech. 2024, 1–22. [Google Scholar] [CrossRef]
  11. Zhang, S.; Li, S.; Zou, Y.; Li, J.; Ma, X.; Zhang, X.H.; Wang, Z.; Wu, S. Experimental study on fracture height propagation during multi-stage fracturing of horizontal wells in shale oil reservoirs. J. China Univ. Pet. (Ed. Nat. Sci.) 2021, 45, 77–86. [Google Scholar]
  12. Du, Y.; Shan, Y. Characteristics of rock mechanical parameters and application of logging interpretation in the Xuwu section of western Sichuan. Petrochem. Technol. 2015, 8, 177–179. [Google Scholar]
  13. Liu, E.; Shen, Z. Research on Brittleness of Rock and Soil Materials. J. Rock Mech. Eng. 2005, 24, 5. [Google Scholar]
  14. Cheng, L. Exploration of Integrated 3D Fracturing Design for Geological Engineering of Shale Oil Horizontal Wells in Jimusaer Depression. Pet. Geol. Eng. 2021, 35, 5. [Google Scholar]
  15. Zhang, C.; Zhou, H.; Feng, X.; Zhang, Z.; Dong, S.Y. Interpolation Balance Method for Obtaining Local Stress Field. Geotech. Mech. 2008, 29, 9. [Google Scholar]
  16. Li, D.; Roohollah, S.F.; Lv, A.; Wang, X.; Roshan, H. A data-driven field-scale approach to estimate the permeability of fractured rocks. Int. J. Min. Reclam. Environ. 2022, 36, 671–687. [Google Scholar] [CrossRef]
  17. Xu, Y.; Lei, Q.; Chen, M.; Wu, Q.; Yang, N.; Weng, D.; Li, D.; Jiang, H. Theoretical research progress and development direction of volume transformation technology. Pet. Explor. Dev. 2018, 45, 14. [Google Scholar] [CrossRef]
  18. Lei, Q.; Yang, L.; Duan, Y.; Weng, D.; Wang, X.; Guan, B.; Wang, Z.; Guo, Y. Optimization design technology for unconventional oil and gas “fracture controlled reserves” transformation. Pet. Explor. Dev. 2018, 45, 8. [Google Scholar] [CrossRef]
  19. Chen, M.; Xu, Y.; Wu, Q.; Li, D.; Yang, N.; Weng, D.; Guan, B. Algorithm for Expanding Multiple Fractures in Horizontal Well Volume Reconstruction: A Study on Different Fracturing Patterns. Nat. Gas Ind. 2016, 36, 9. [Google Scholar]
Figure 1. Statistical results of core analysis on porosity and permeability conditions of algal limestone reservoir. (a) Statistical results of porosity core analysis. (b) Statistical results of permeability core analysis.
Processes 12 01302 g001
Figure 2. Triple medium connectivity model.
Processes 12 01302 g002
Figure 3. Comparison between simulated production data of H1 well and actual on-site data.
Processes 12 01302 g003
Figure 4. Relationship between the actual and predicted production.
Processes 12 01302 g004
Figure 5. Deployment of horizontal well platform in algal limestone reservoir of lower Youshashan formation. (a) Side view. (b) Top view.
Processes 12 01302 g005
Figure 6. Relationship between different seam lengths and cumulative oil production.
Processes 12 01302 g006
Figure 7. Relationship curve between fracture half-length and production.
Processes 12 01302 g007
Figure 8. Relationship between different fracture conductivities and cumulative oil production.
Processes 12 01302 g008
Figure 9. Relationship curve between fracture conductivity and production change.
Processes 12 01302 g009
Figure 10. Relationship between different fracture heights and cumulative oil production.
Processes 12 01302 g010
Figure 11. Relationship curve between fracture height and production change.
Processes 12 01302 g011
Figure 12. Relationship between different fracture spacings and cumulative production change.
Processes 12 01302 g012
Figure 13. Relationship curve between fracture spacing and production change.
Processes 12 01302 g013
Figure 14. Schematic diagram of fracturing mode. (a) Staggered fracturing. (b) Facing fracturing.
Processes 12 01302 g014
Figure 15. Relationship between different sewing methods and cumulative output change.
Processes 12 01302 g015
Disclaimer/Publisher’s Note: The statements, opinions and data contained in all publications are solely those of the individual author(s) and contributor(s) and not of MDPI and/or the editor(s). MDPI and/or the editor(s) disclaim responsibility for any injury to people or property resulting from any ideas, methods, instructions or products referred to in the content.

