
Oscillation Times in Water Hammer Signatures: New Insights for the Evaluation of Diversion Effectiveness in Field Cases

 ,
,
Abstract
1. Introduction
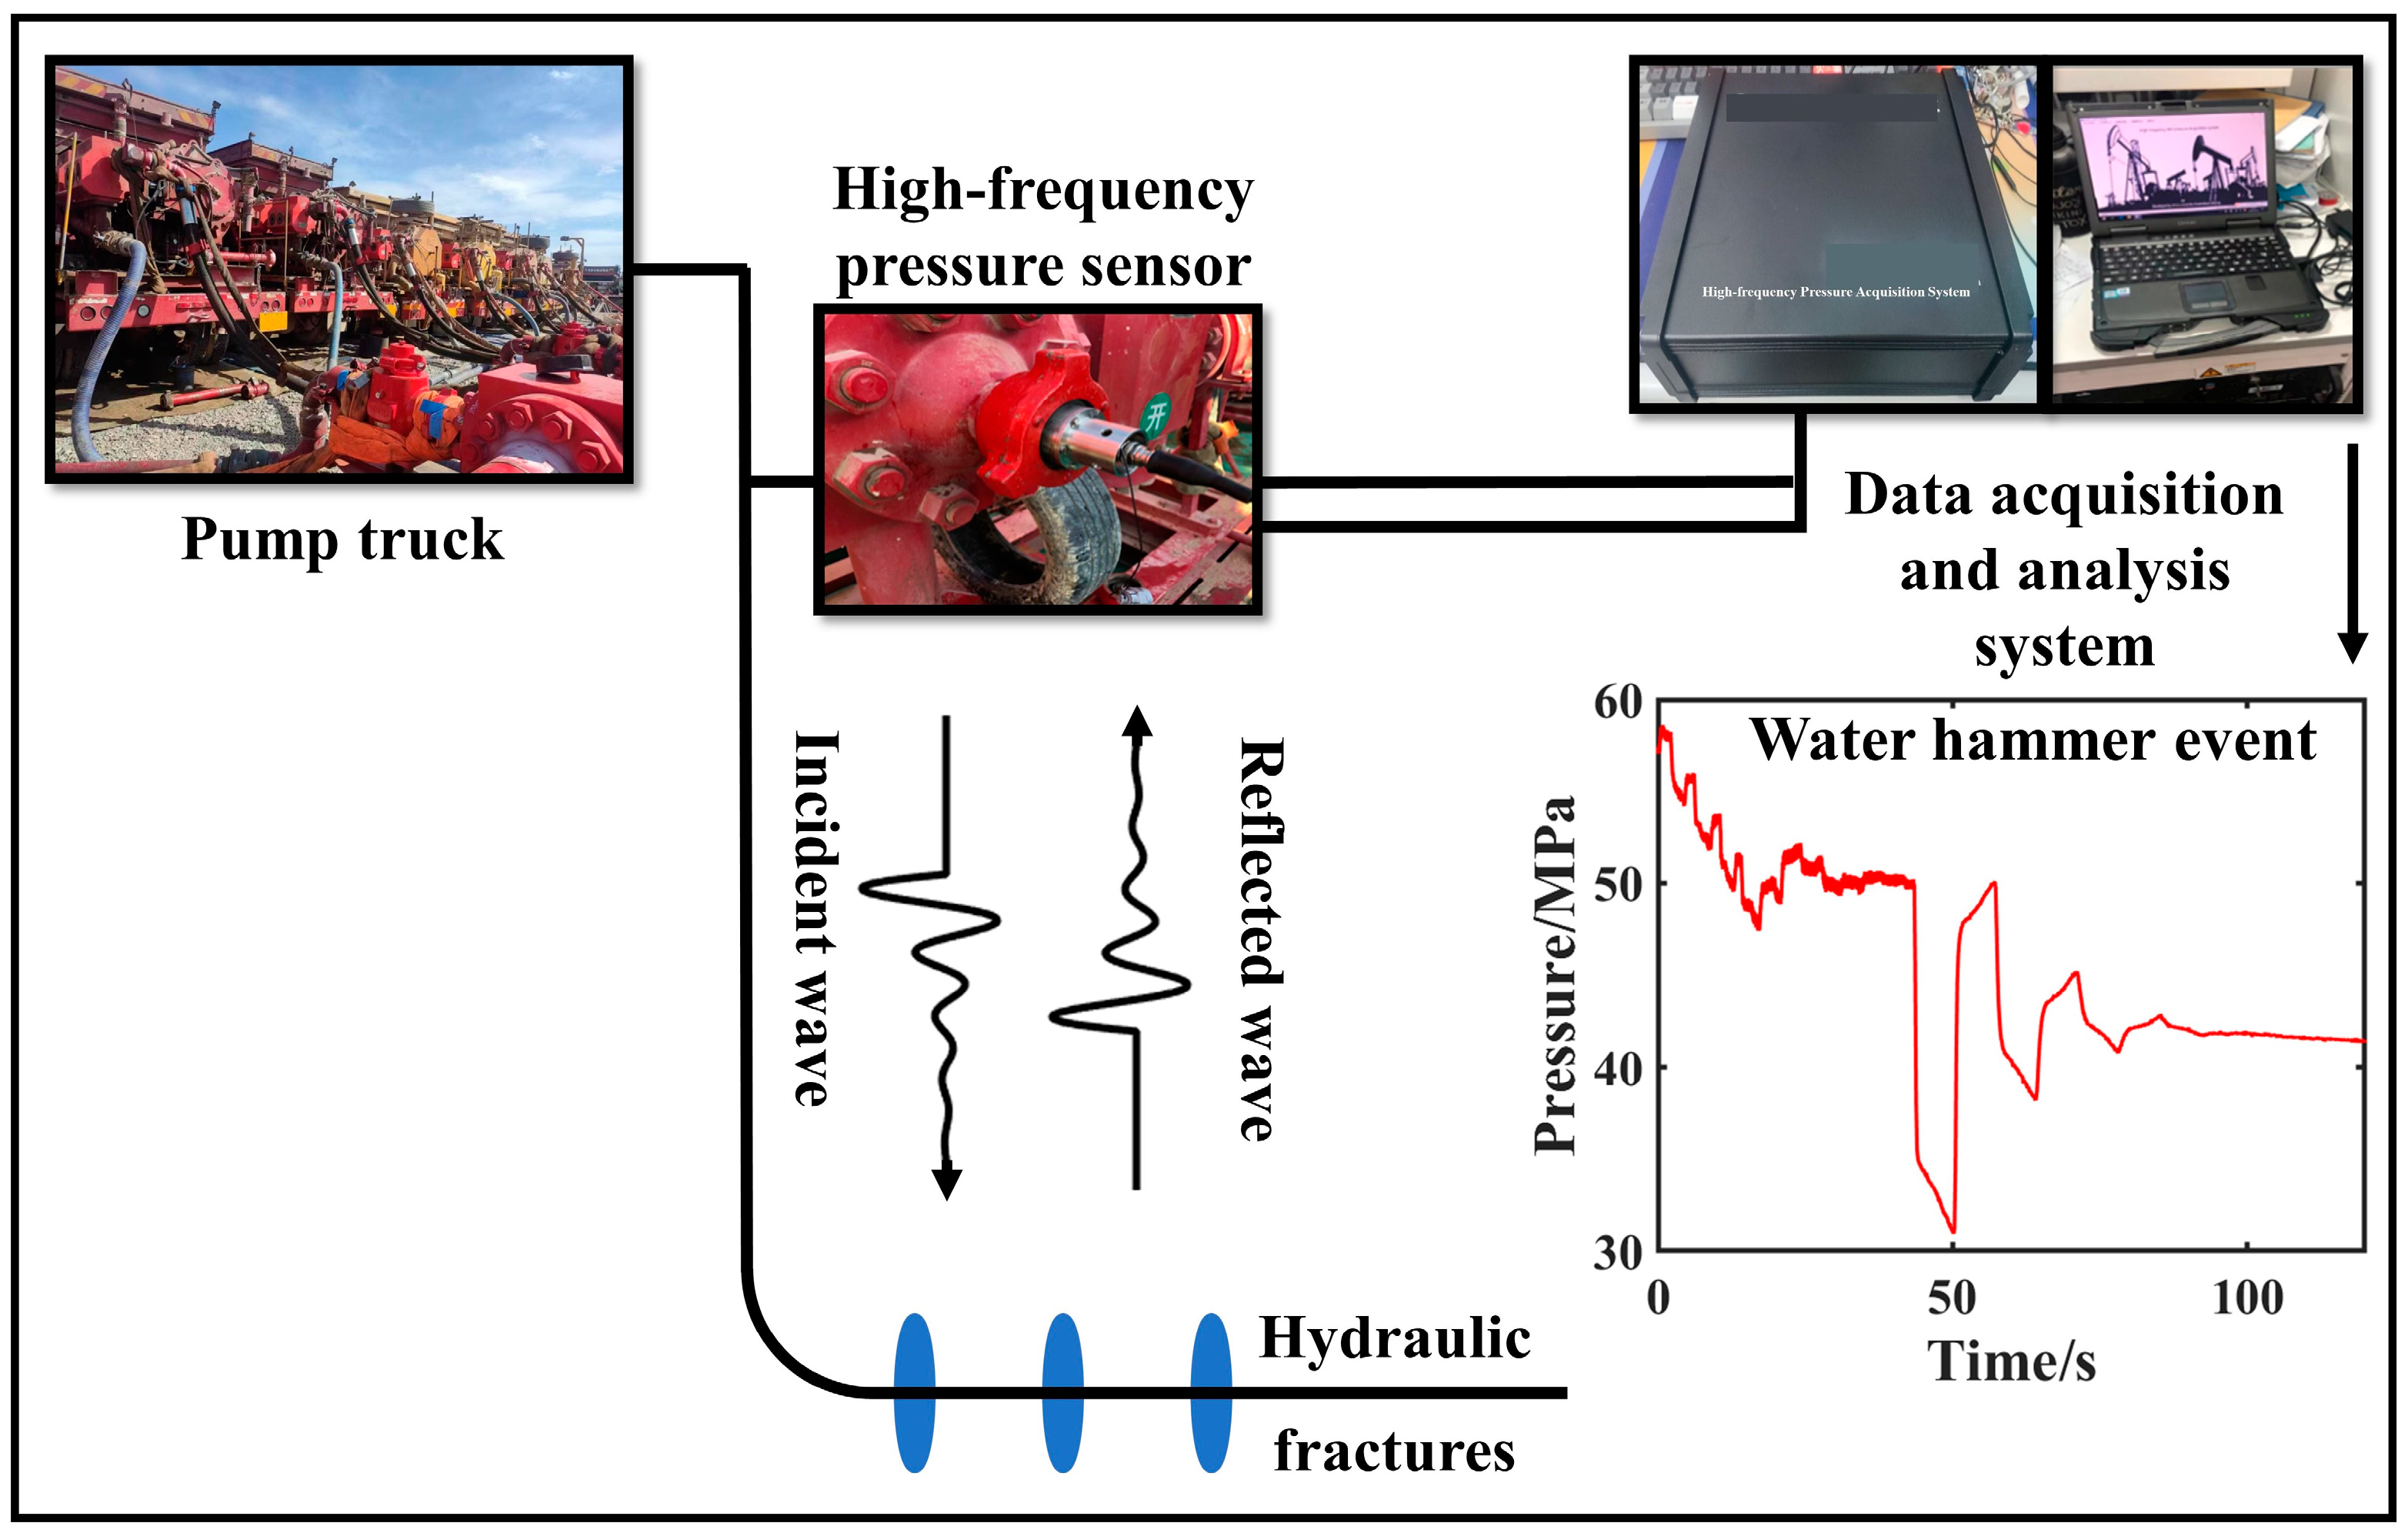
2. Methods
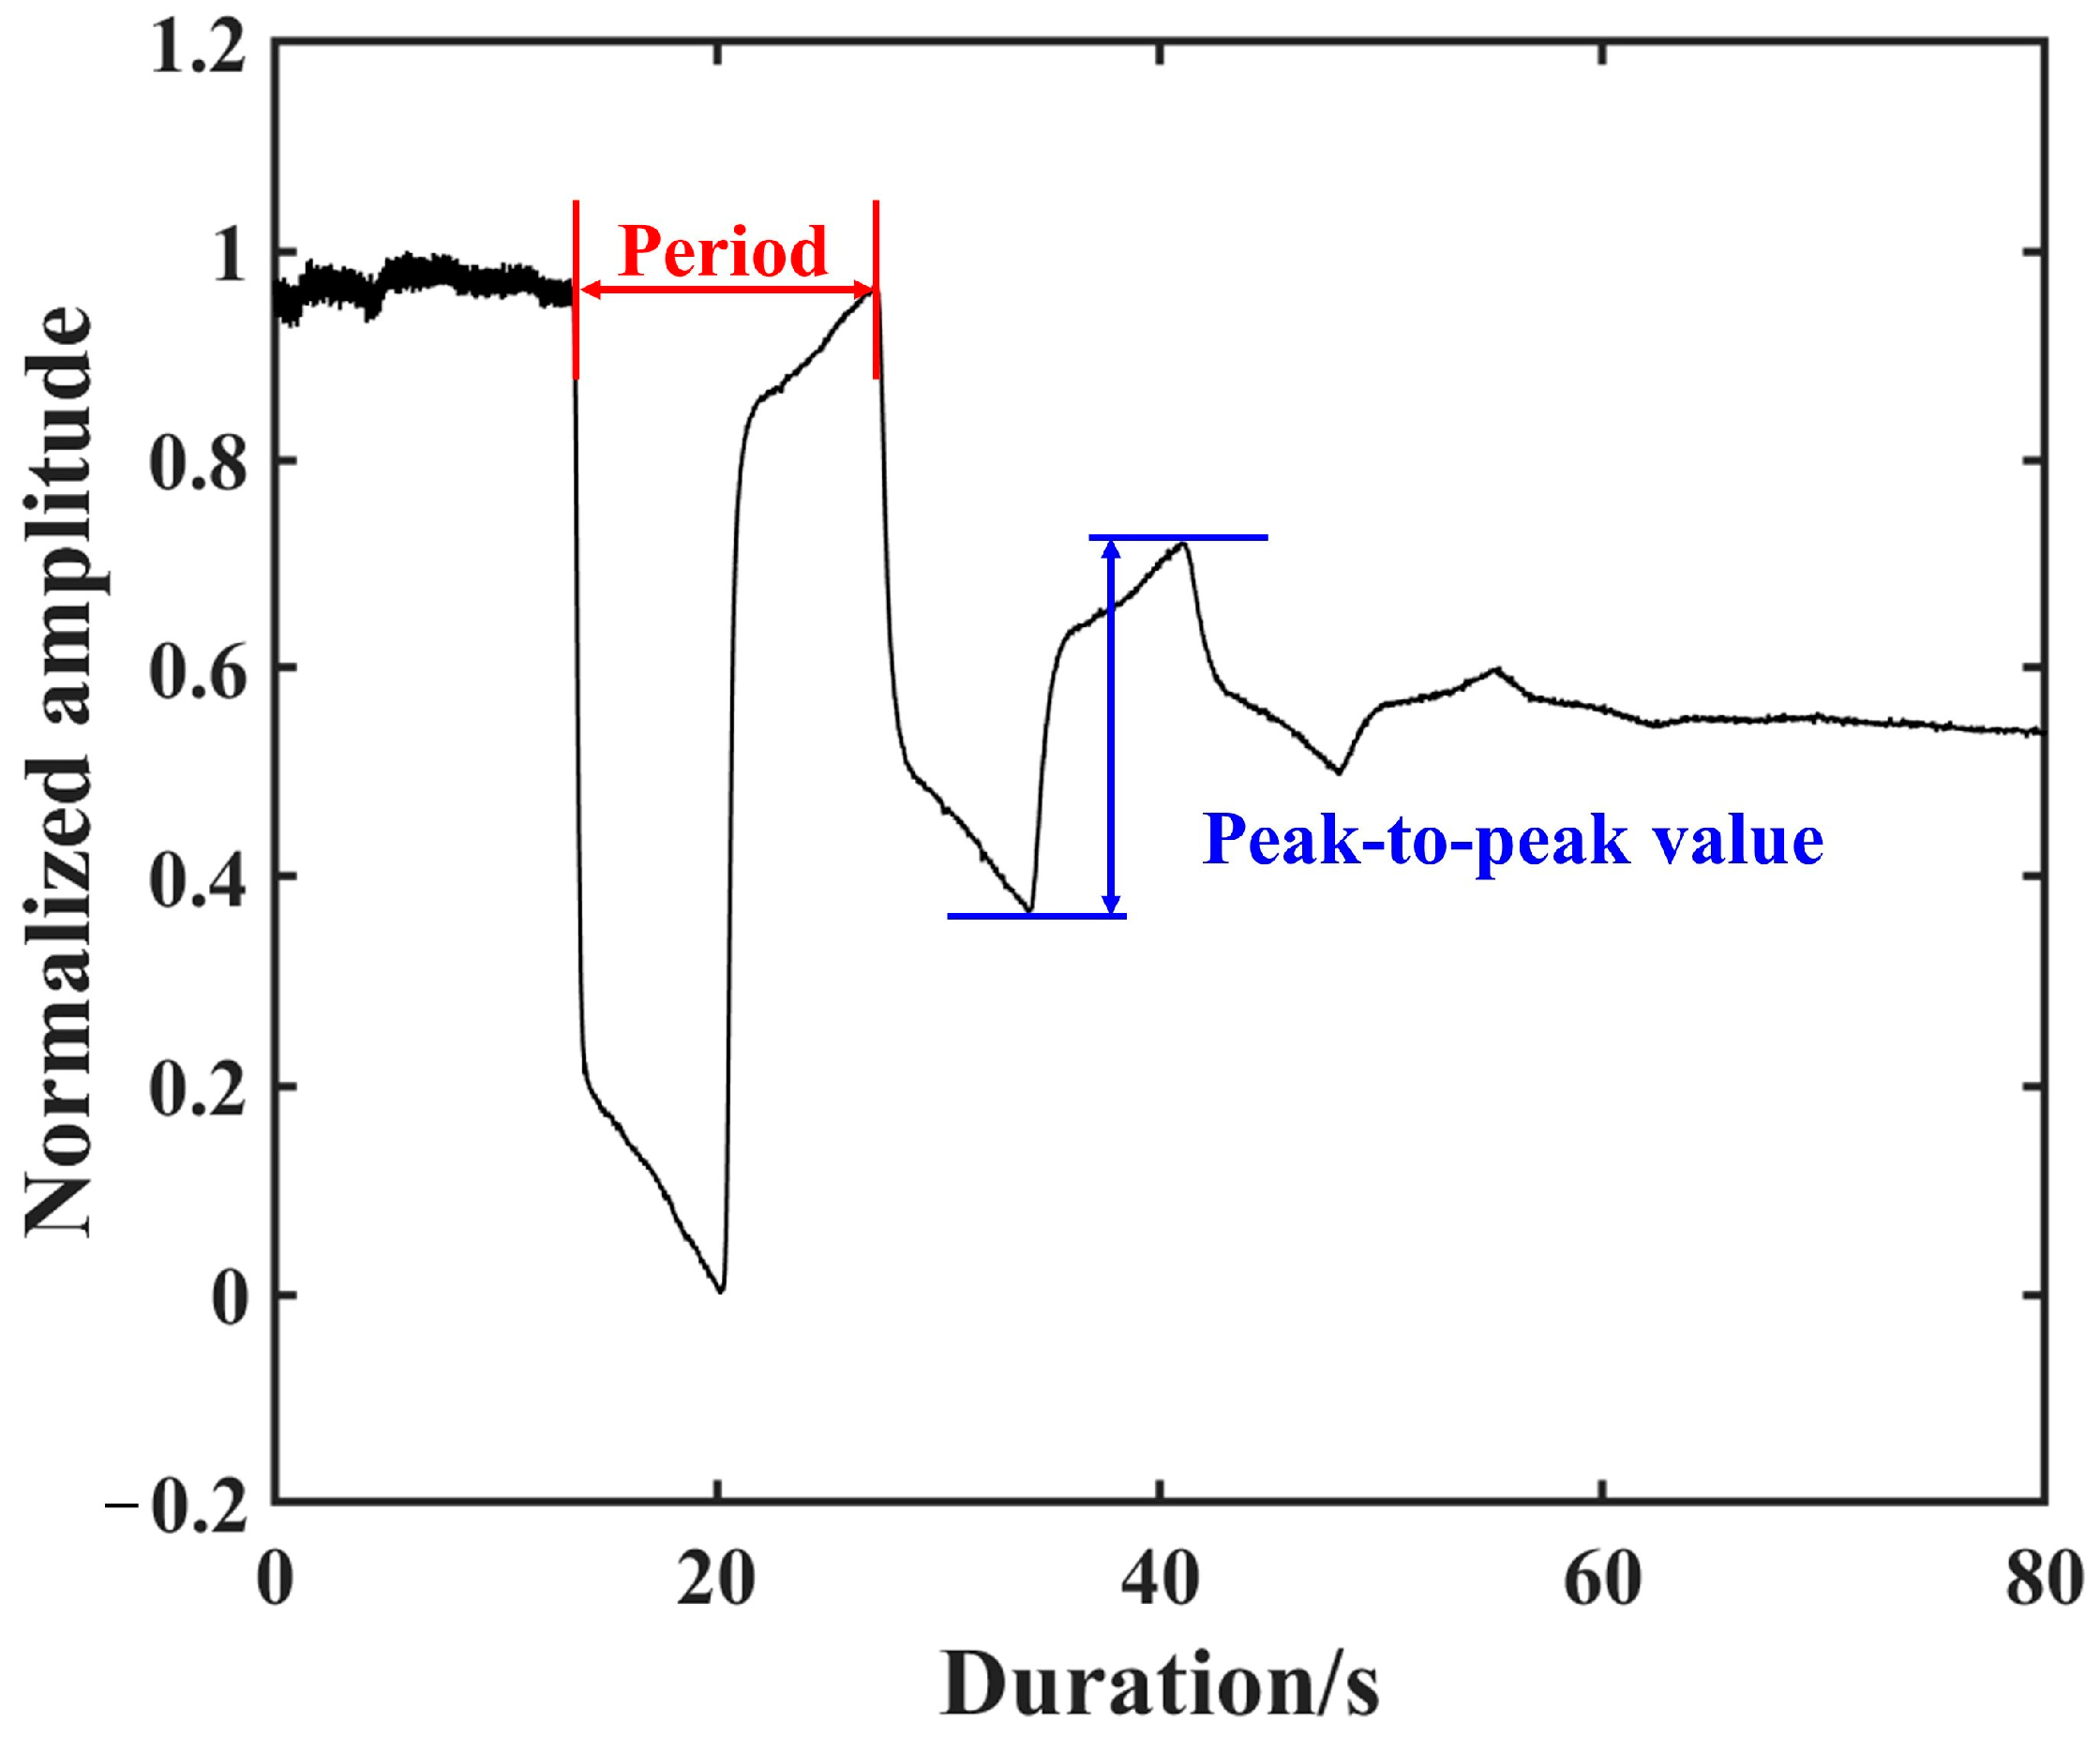
2.1. The Feature Extraction of Water Hammer Oscillation Times
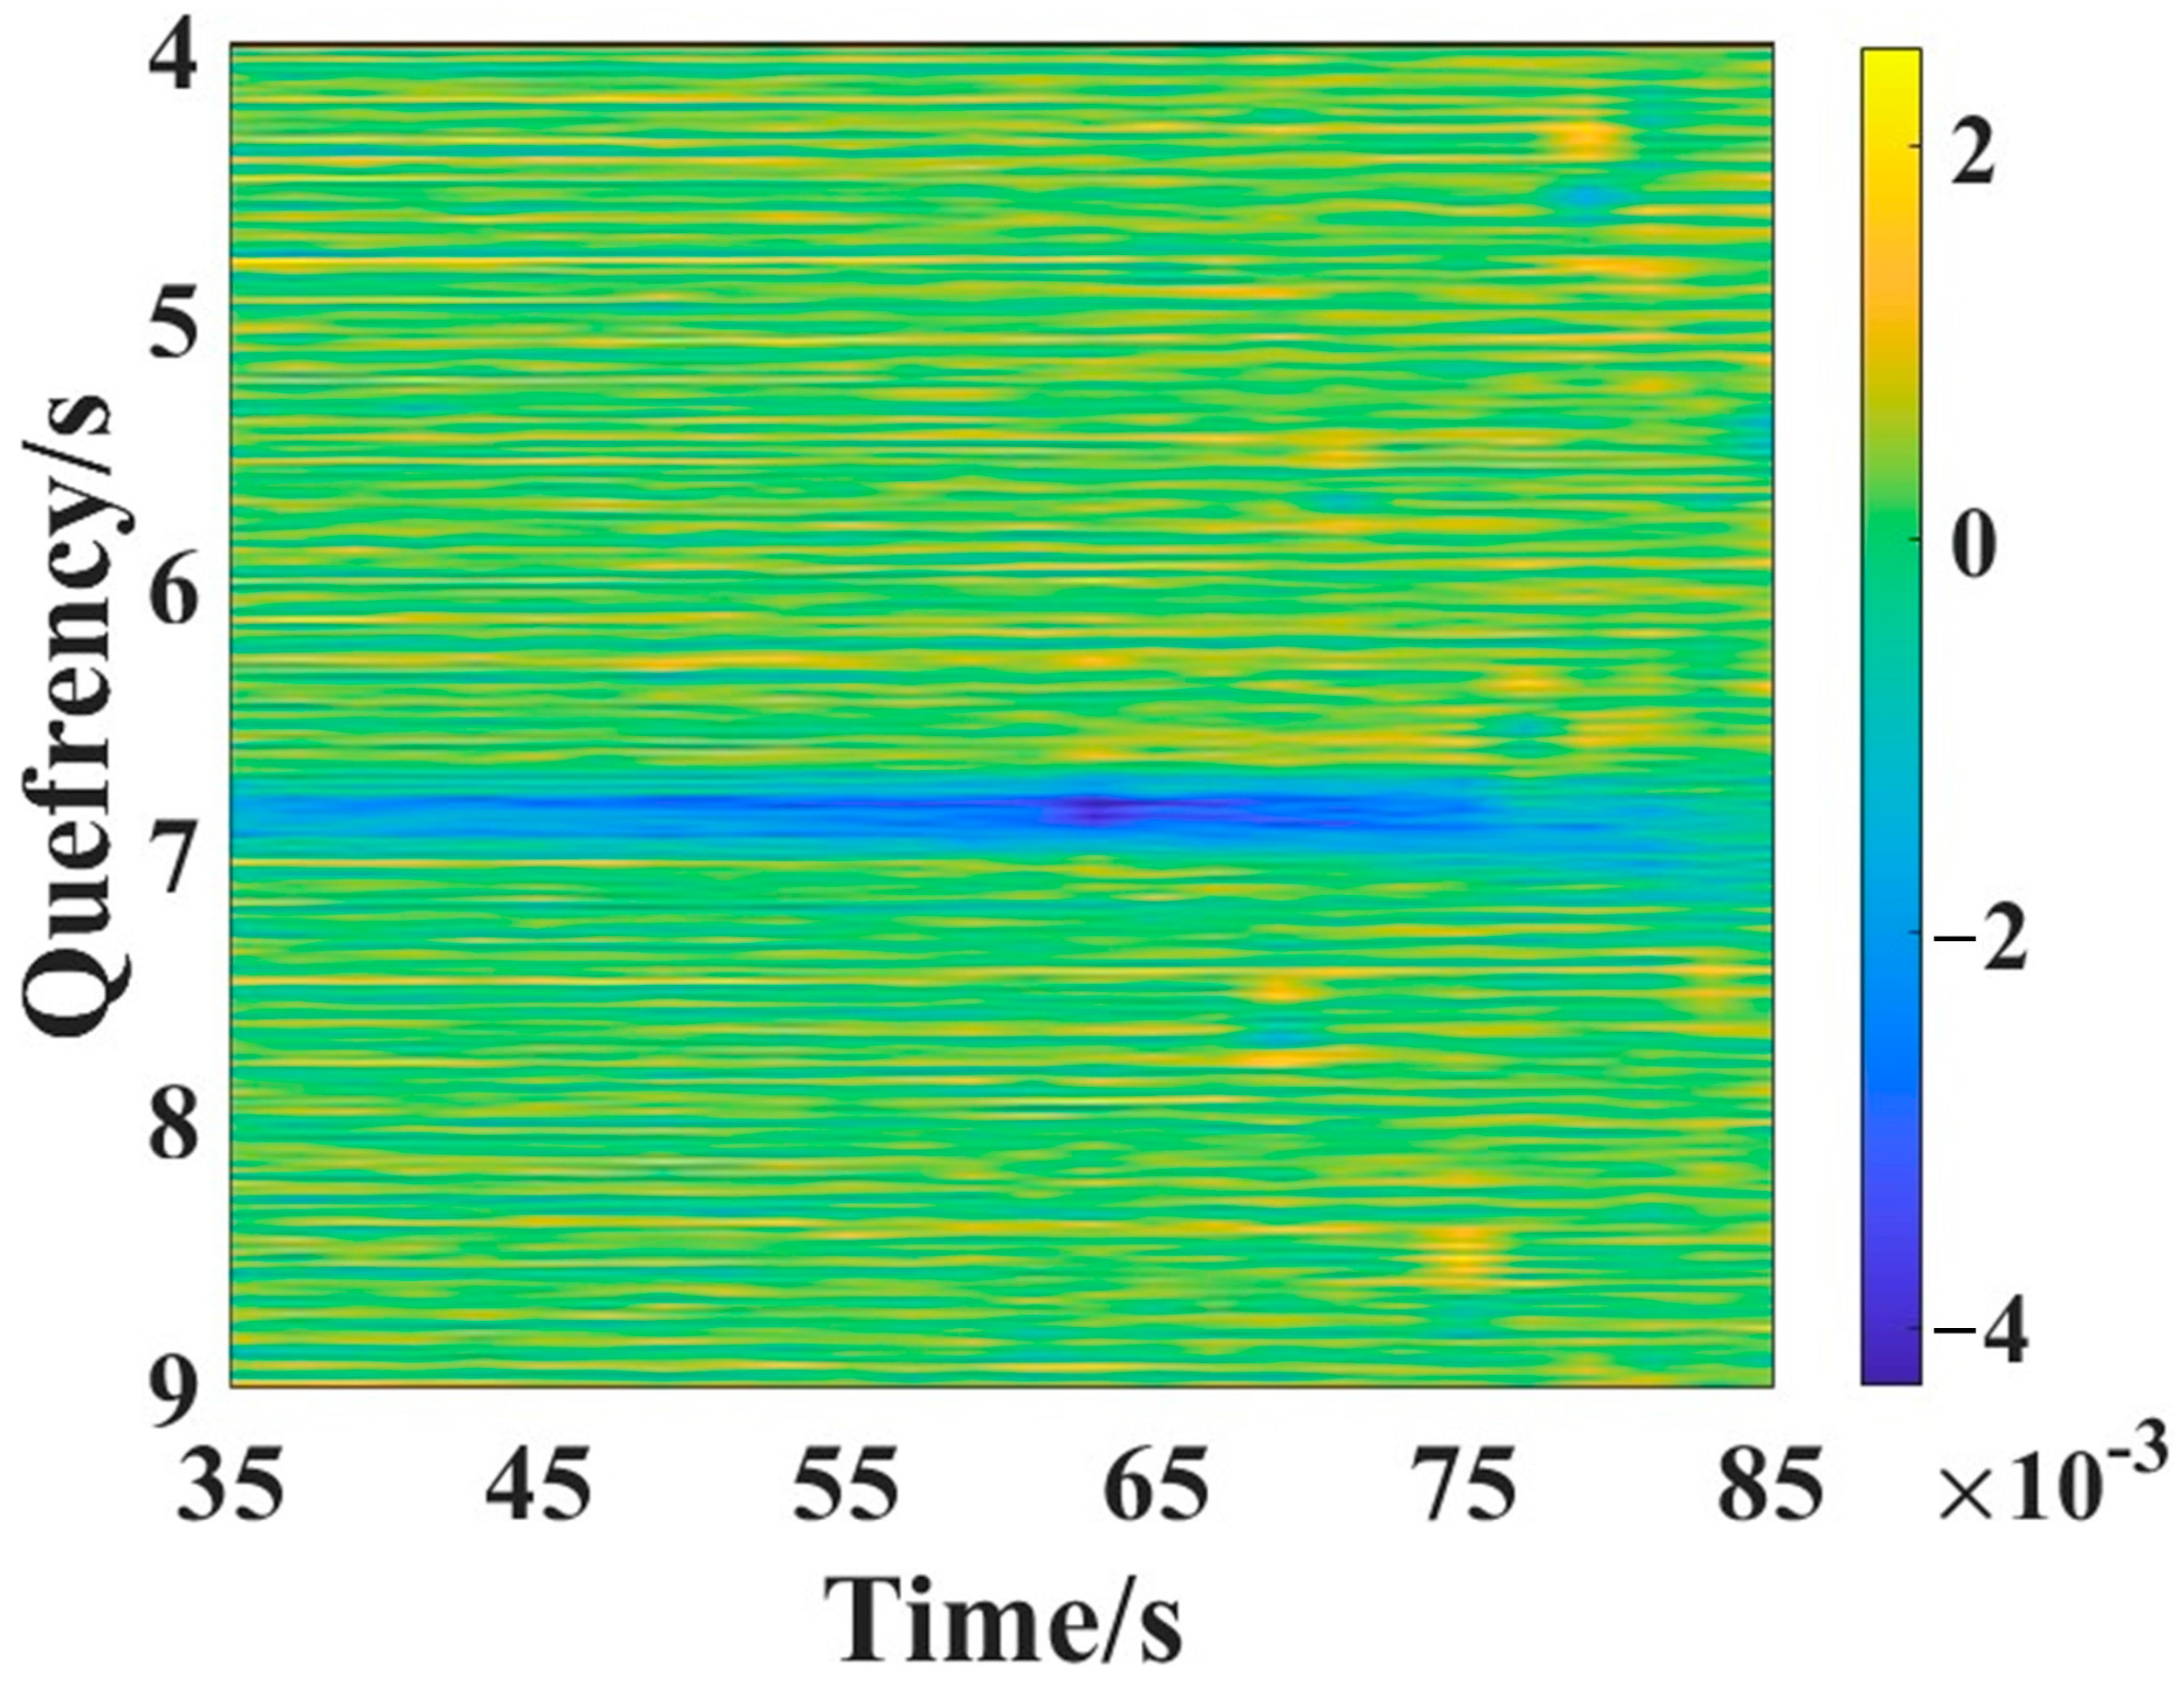
2.2. The Cepstrum Analysis and Error Function
2.3. Treating Pressure Response
3. Field Data Results and Discussion
3.1. Well Introduction
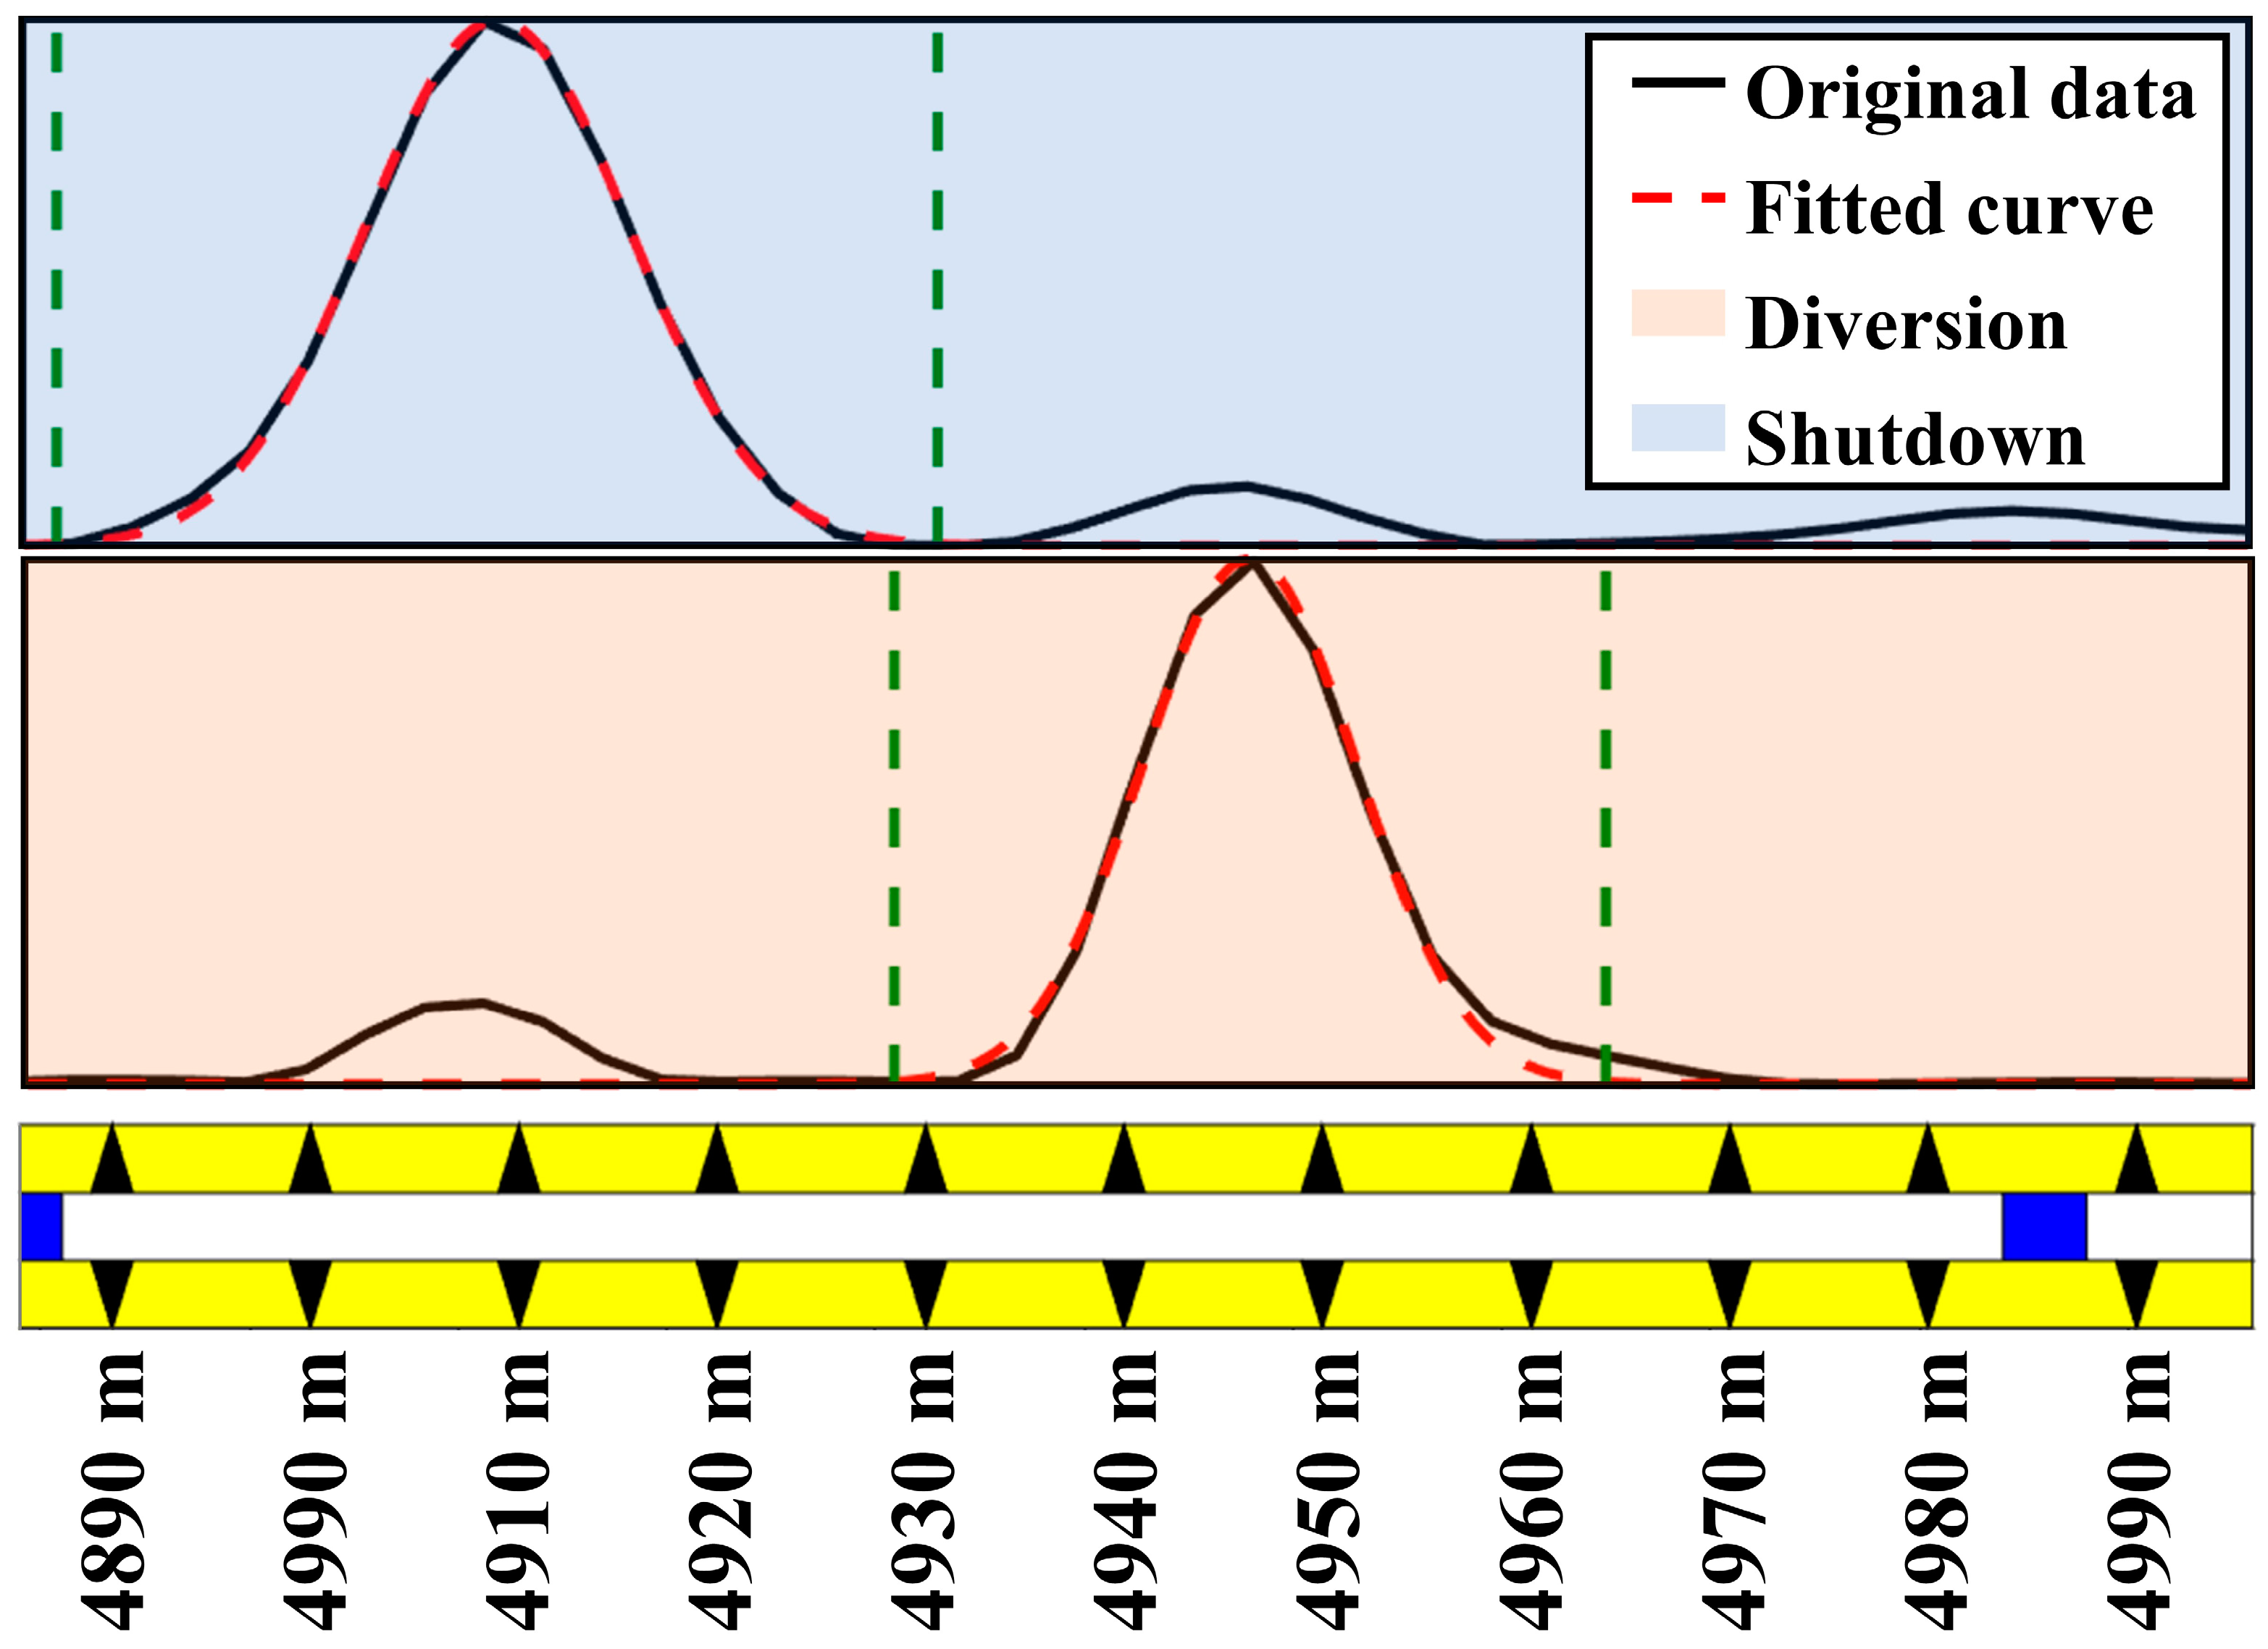
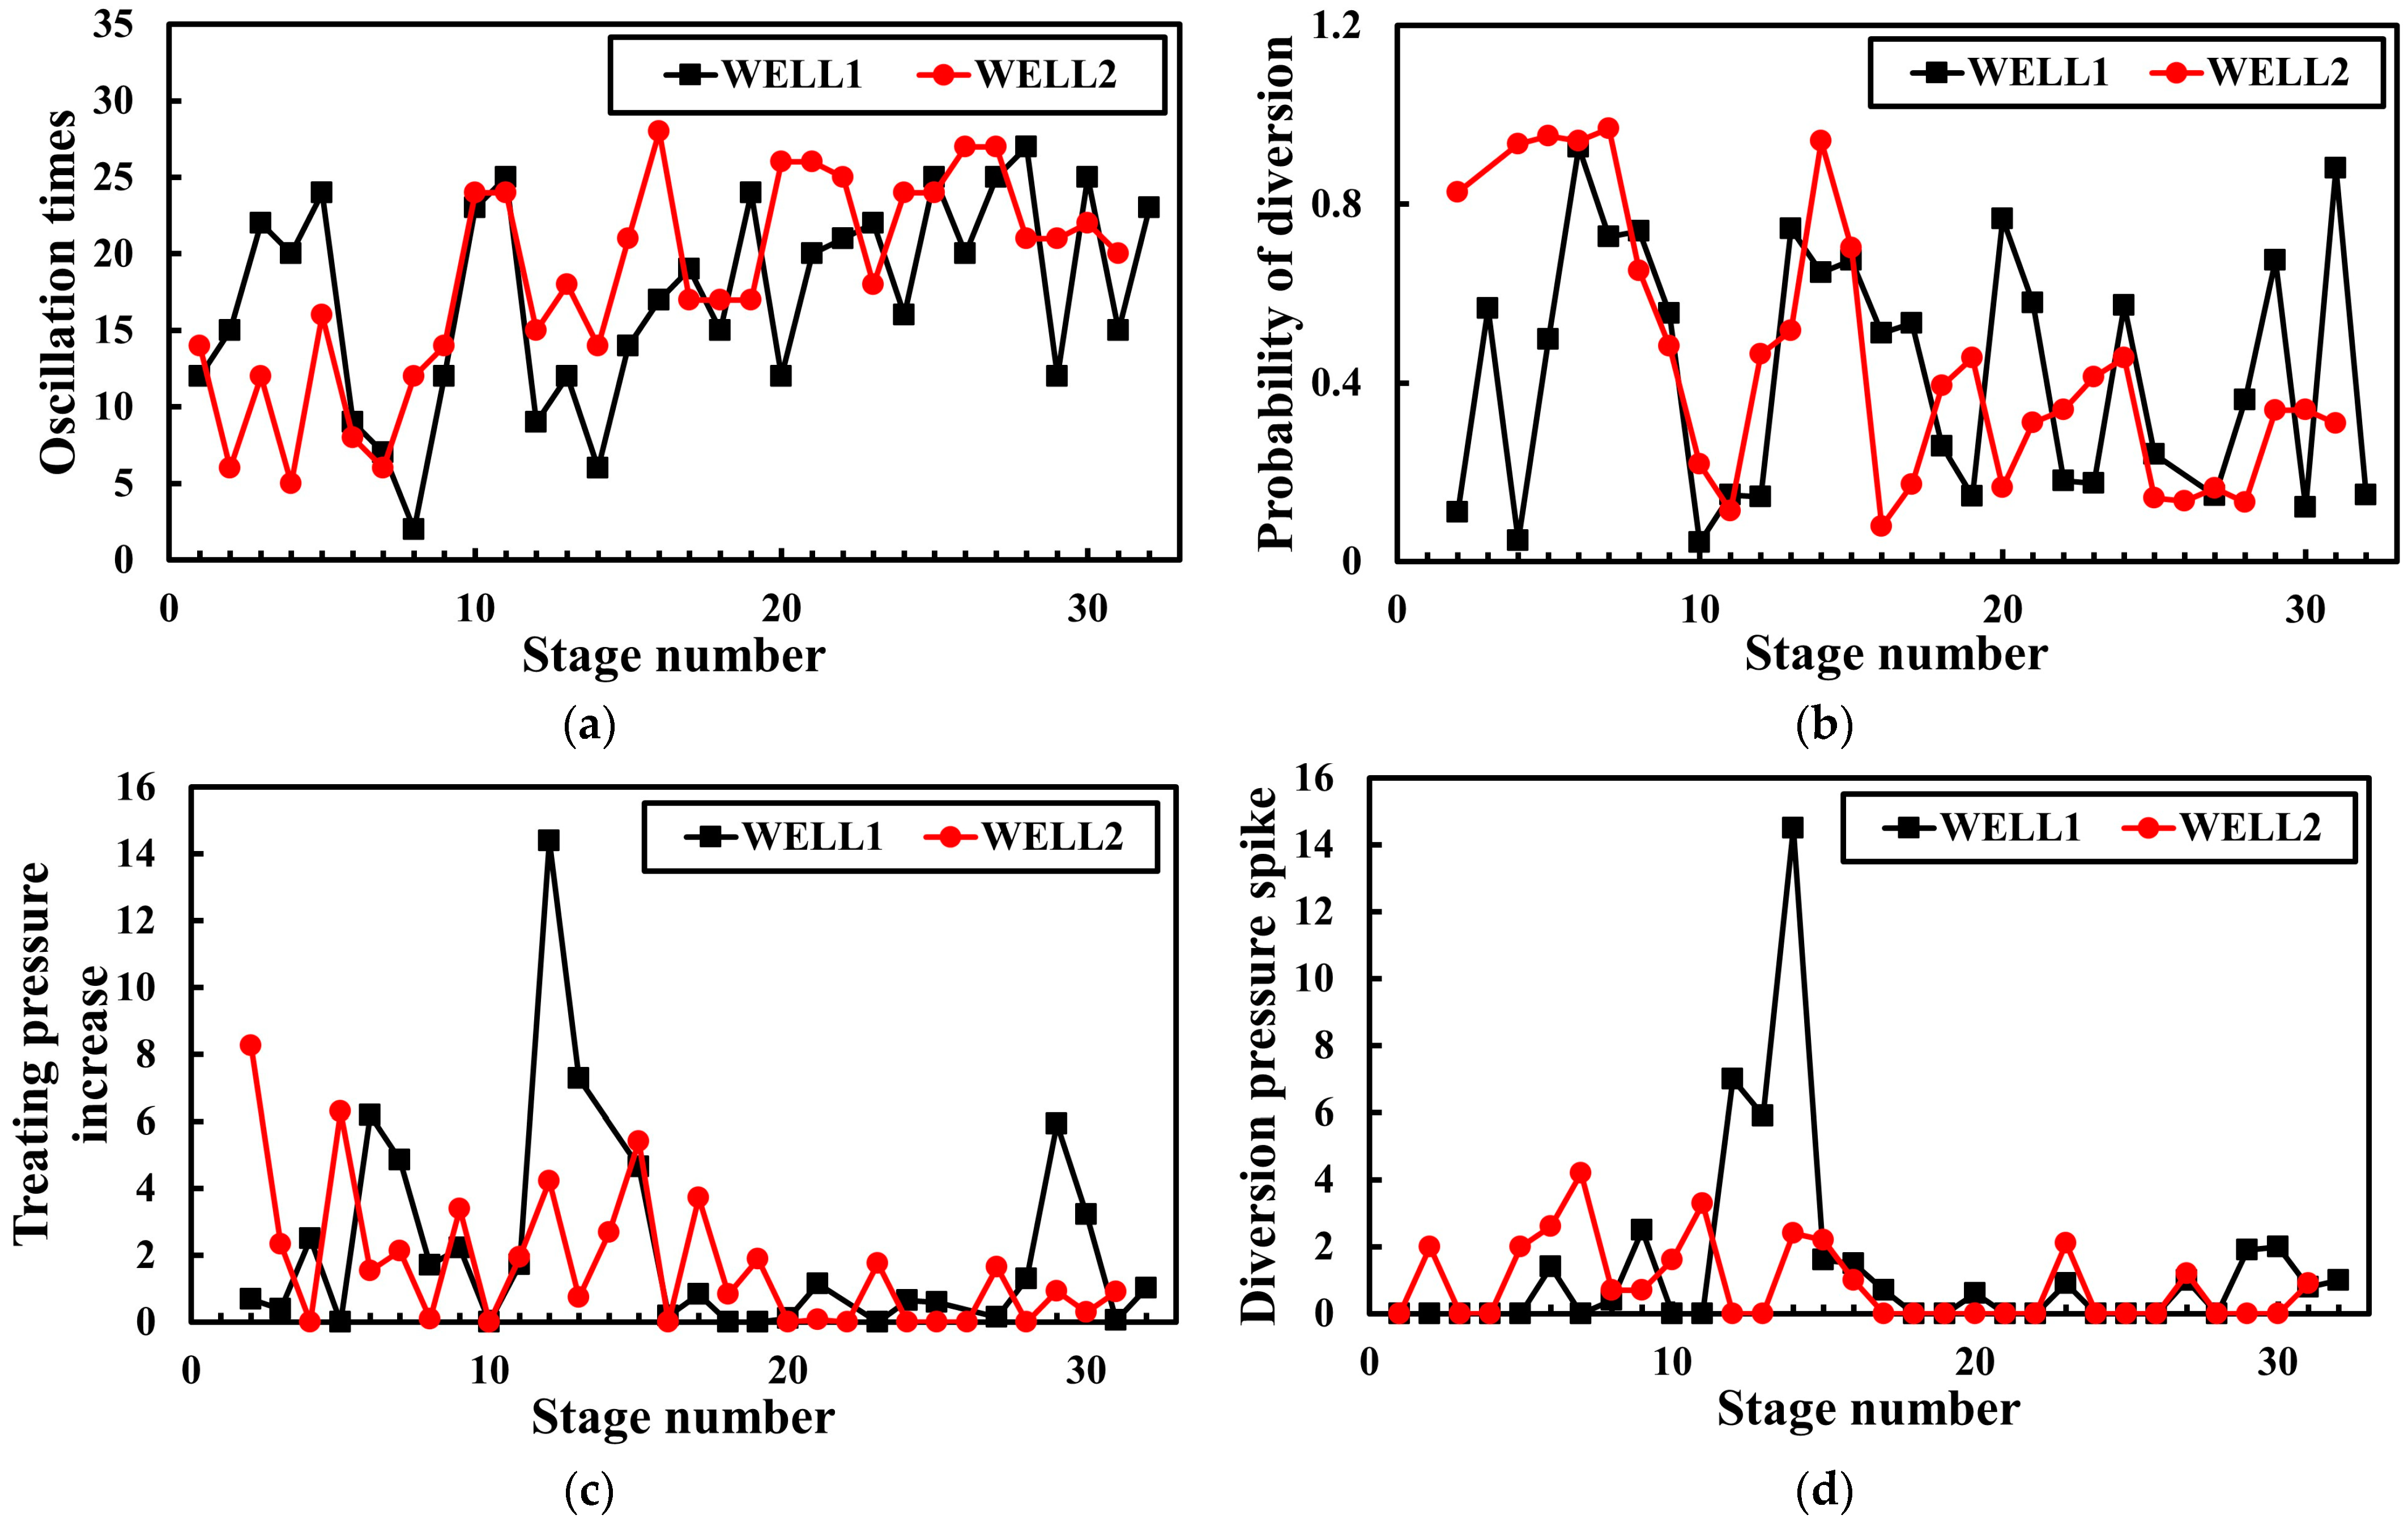
3.2. Results and Discussion
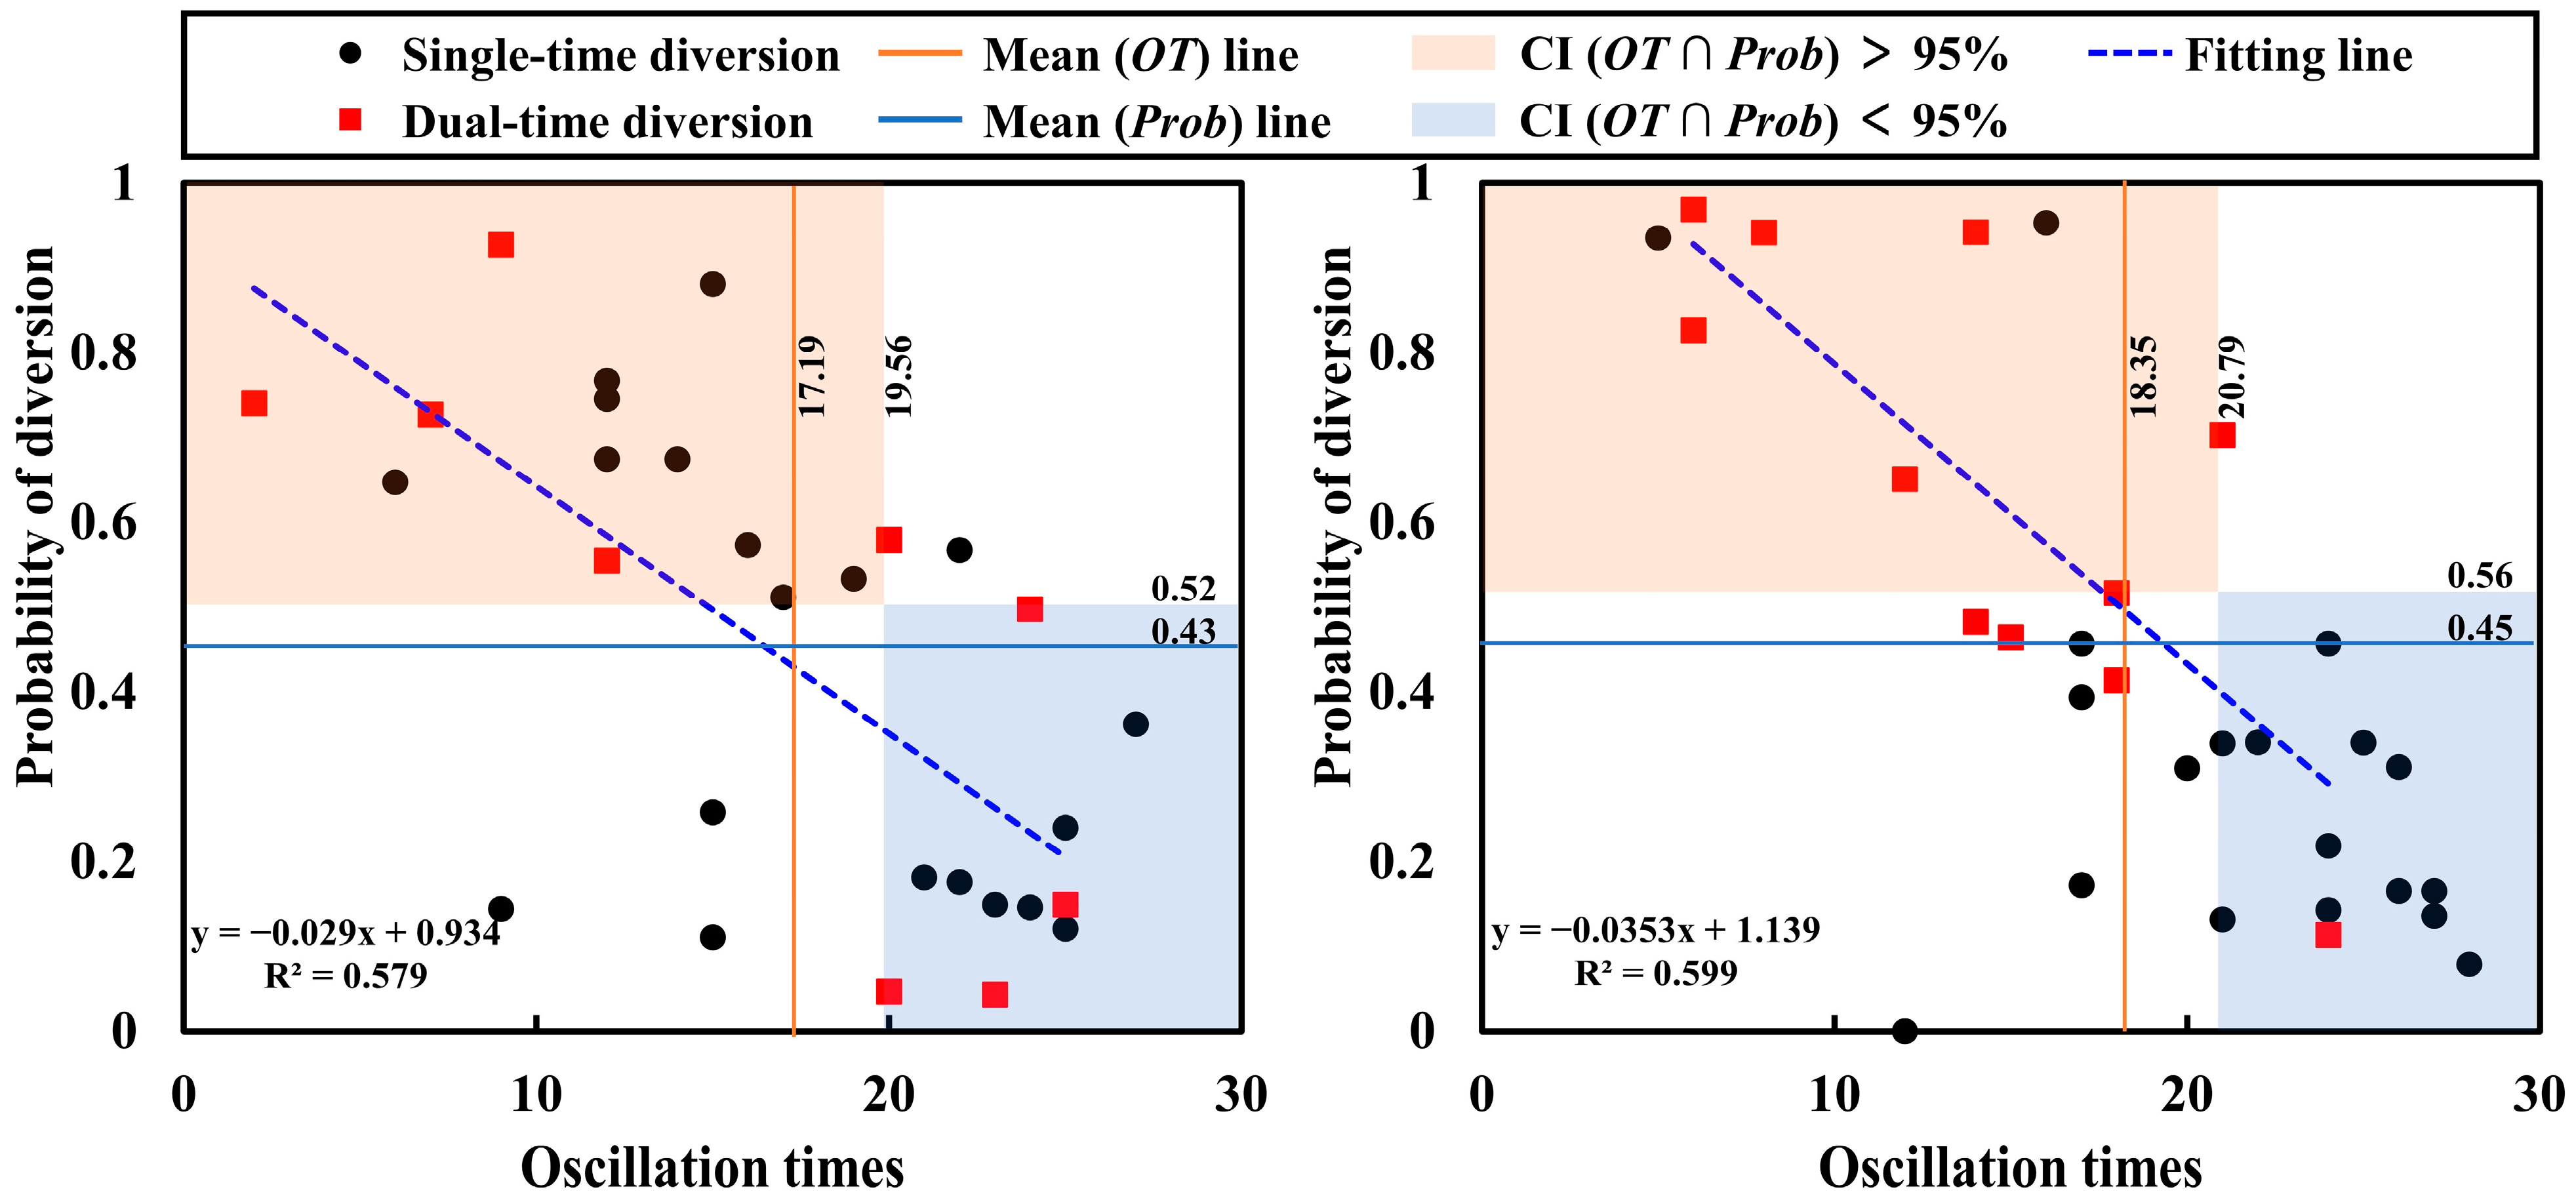
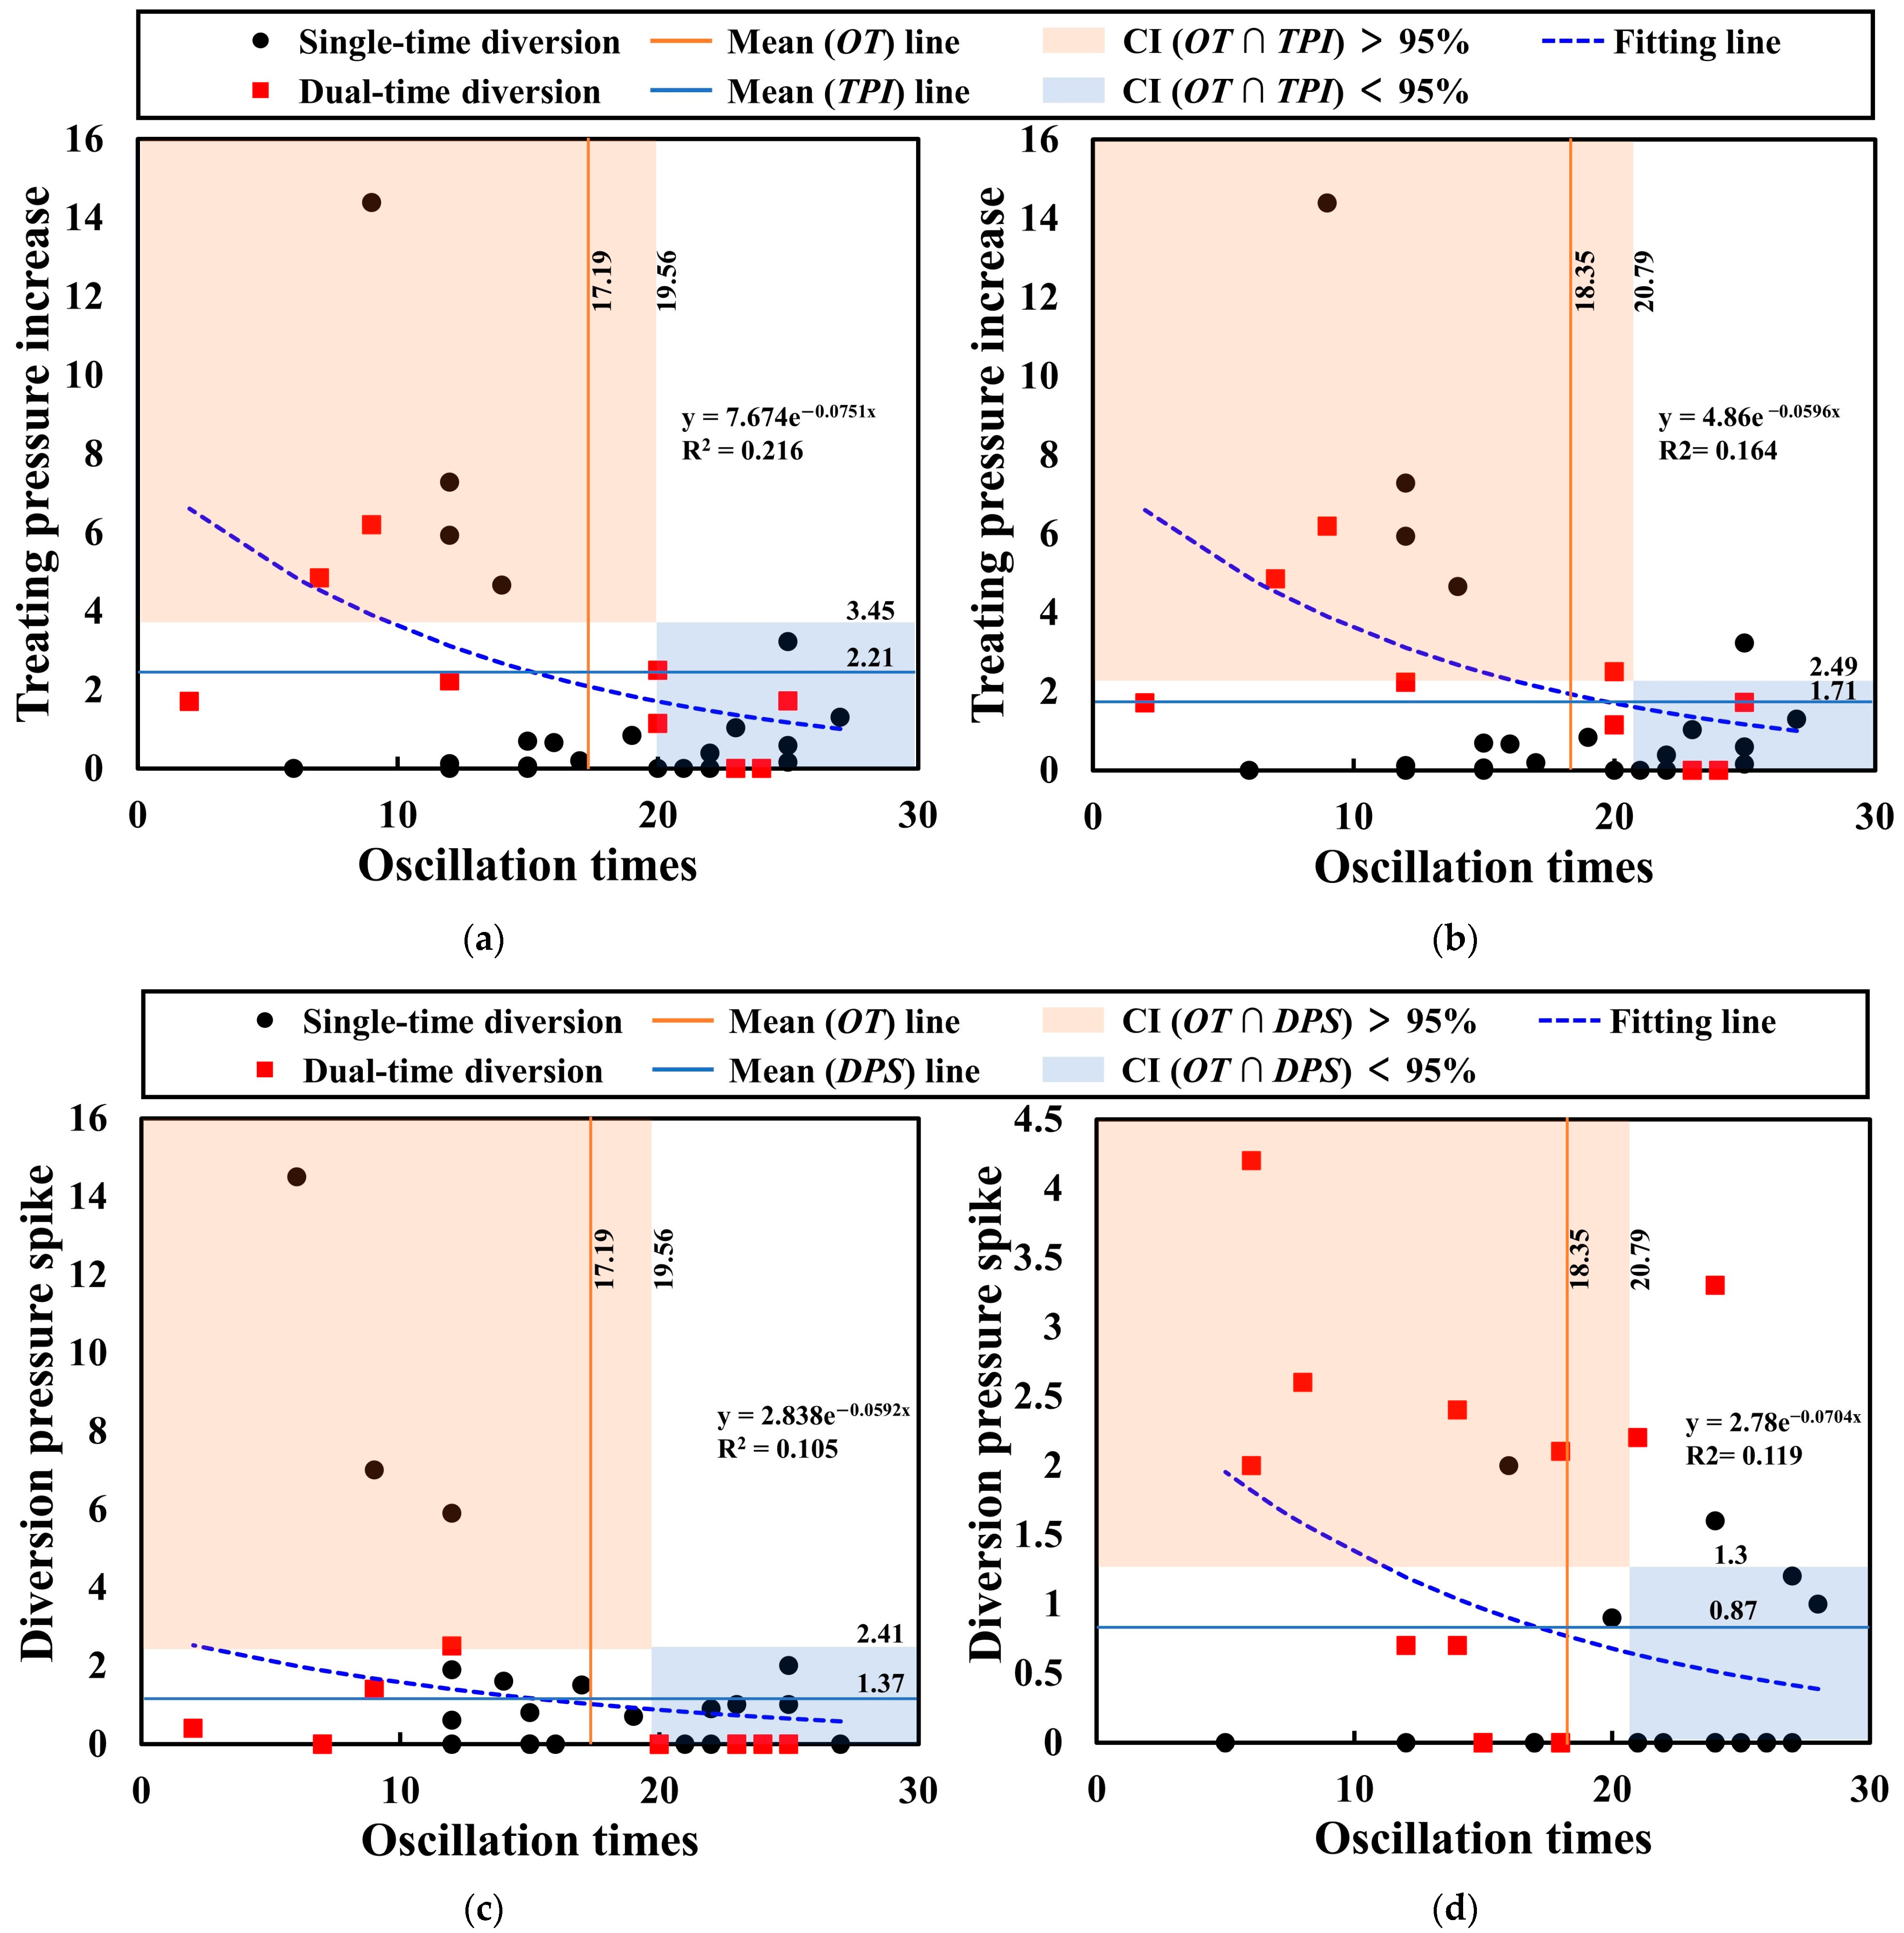
3.3. A Rapid Judgment Method for Diversion Effectiveness Based on Oscillation Times
4. Conclusions
Author Contributions
Funding
Data Availability Statement
Conflicts of Interest
Nomenclature
| P | w | Original water hammer signal |
| P′ | Processed signal by mean normalization | |
| Pmin | MPa | The minimum value of the original water hammer signal |
| Pmax | MPa | The maximum value of the original water hammer signal |
| Pmin′ | The minimum value of the processed water hammer signal | |
| Pmax′ | The maximum value of the processed water hammer signal | |
| Tp2, Tp1 | s | The time corresponding to the two adjacent peaks |
| Period | s | The time required for the water hammer wave to complete a round trip in the wellbore |
| Vpp | The pressure difference between the peak and the valley | |
| The cepstrum result of water hammer signal P | ||
| τ | s | The quefrency, with the characteristics of the reflection time dimension |
| ti, tj | s | Different physical times of intercepted water hammer signal |
| Vectors with different physical times | ||
| The scalar product of vectors with different physical times | ||
| Fτ | The function of the reflection time and energy magnitude | |
| L | m | Location of the reflection event |
| a | m/s | Wave speed in the pipeline |
| σ | m | Location error |
| time | The mean value of the oscillation times | |
| n | The number of stages in a well | |
| time | The oscillation time of the i-th stage | |
| s | The standard deviation of the oscillation time dataset | |
| C | time | The critical condition |
| Z | The critical value of the standard normal distribution | |
| probOT | % | The probability of diversion effectiveness using the rapid judgment method for diversion effectiveness based on the oscillation times |
References
- Cao, X.; Wang, M.; Kang, J.; Wang, S.; Liang, Y. Fracturing Technologies of Deep Shale Gas Horizontal Wells in the Weirong Block, Southern Sichuan Basin. Nat. Gas Ind. B 2020, 7, 64–70. [Google Scholar] [CrossRef]
- Al-Shargabi, M.; Davoodi, S.; Wood, D.A.; Ali, M.; Rukavishnikov, V.S.; Minaev, K.M. A Critical Review of Self-Diverting Acid Treatings Applied to Carbonate Oil and Gas Reservoirs. Petrol. Sci. 2023, 20, 922–950. [Google Scholar] [CrossRef]
- Borisenko, A.; Parkhonyuk, S.; Zotov, K.; Korkin, R.; Kiselev, N.V.; Laptev, A.; Rapeyko, V.T. Advanced Pressure Monitoring Technique—New Horizons of Workover in Russia. In Proceedings of the SPE Russian Petroleum Technology Conference, Virtual, 11–13 October 2020. [Google Scholar] [CrossRef]
- Kabannik, A.; Parkhonyuk, S.; Korkin, R.; Litvinets, F.; Dunaeva, A.; Nikolaev, M.; Usoltsev, D. Can We Trust the Diversion Pressure as a Decision-Making Tool: Novel Technique Reveals the Truth. In Proceedings of the Abu Dhabi International Petroleum Exhibition & Conference, Abu Dhabi, United Arab Emirates, 4–7 November 2018. [Google Scholar] [CrossRef]
- Zhou, F.; Yuan, L.; Liu, X.; Wang, B.; Li, M.; Li, B. Advances and Key Techniques of Temporary Plugging and Diverting Fracturing. Pet. Sci. Bull. 2022, 3, 365–381. [Google Scholar] [CrossRef]
- Sheng, M.; Zhang, J.; Zhang, Y.; Cheng, G.S. A New Data-Driven Effectiveness Evaluation Model of Temporary Plugging Fracturing for Horizontal Wells. Nat. Gas Ind. 2023, 43, 132–140. [Google Scholar]
- Chen, H.; Gao, C.; Cai, C.; Sun, H. The Effectiveness and Influencing Factors of Blocking Perforation of Ball-Activated Temporary Plugging Fracturing in Horizontal Well. Drill. Prod. Technol. 2023, 46, 78–84. [Google Scholar]
- Wang, B.; Zhou, F.; Yang, C.; Wang, D.; Yang, K.; Liang, T. Experimental Study on Injection Pressure Response and Fracture Geometry during Temporary Plugging and Diverting Fracturing. SPE J. 2020, 25, 573–586. [Google Scholar] [CrossRef]
- Gomaa, A.M.; Nino-Penaloza, A.; McCartney, E.; Mayor, J. Engineering Solid Particulate Diverter to Control Fracture Complexity: Experimental Study. In Proceedings of the SPE Hydraulic Fracturing Technology Conference, The Woodlands, TX, USA, 9–11 February 2016. [Google Scholar] [CrossRef]
- Bogdan, A.V.; Keilers, A.; Oussoltsev, D.; Lecerf, B. Real-Time Interpretation of Leak Isolation with Degradable Diverter Using High Frequency Pressure Monitoring. In Proceedings of the SPE Asia Pacific Oil & Gas Conference and Exhibition, Perth, Australia, 25–27 October 2016. [Google Scholar] [CrossRef]
- Rodionov, Y.; Defeu, C.; Gakhar, K.; Mullen, K.; Mayo, J.T.; Shan, D.; Usoltsev, D.; Ejofodomi, E. Optimization of Infill Well Development Using a Novel Far-Field Diversion Technique in the Eagle Ford Shale. In Proceedings of the SPE/AAPG/SEG Unconventional Resources Technology Conference, Austin, TX, USA, 24–26 July 2017. [Google Scholar] [CrossRef]
- Holzhausen, G.R.; Gooch, R.P. Impedance of Hydraulic Fractures: Its Measurement and Use for Estimating Fracture Closure Pressure and Dimensions. In Proceedings of the SPE/DOE Low Permeability Gas Reservoirs Symposium, Denver, CO, USA, 19–22 May 1985. [Google Scholar] [CrossRef]
- Wang, X.; Hovem, K.; Moos, D.; Quan, Y. Water Hammer Effects on Water Injection Well Performance and Longevity. In Proceedings of the SPE International Symposium and Exhibition on Formation Damage Control, Lafayette, LA, USA, 13–15 February 2008. [Google Scholar] [CrossRef]
- Urbanowicz, K.; Jing, H.; Bergant, A.; Stosiak, M.; Lubecki, M. Progress in Analytical Modeling of Water Hammer. ASME J. Fluids Eng. 2023, 145, 081203. [Google Scholar] [CrossRef]
- Parkhonyuk, S.; Fedorov, A.; Kabannik, A.; Korkin, R.; Nikolaev, M.; Tsygulev, I. Measurements While Fracturing: Nonintrusive Method of Hydraulic Fracturing Monitoring. In Proceedings of the SPE Hydraulic Fracturing Technology Conference and Exhibition, The Woodlands, TX, USA, 23–25 January 2018. [Google Scholar] [CrossRef]
- Korkin, R.; Parkhonyuk, S.; Fedorov, A.; Badazhkov, D.; Kabannik, A. High Frequency Pressure Monitoring and Data Analytics for Stimulation Efficiency Determination: New Perspectives or Potential Limits. In Proceedings of the SPE Hydraulic Fracturing Technology Conference and Exhibition, The Woodlands, TX, USA, 4–6 February 2020. [Google Scholar] [CrossRef]
- Parkhonyuk, S.; Korkin, R.; Kabannik, A.; Fedorov, A.; Nikolaev, M.; Litvinets, F. Novel Monitoring Technology Helps to Make Informed Decisions and Maximize the Efficiency of Completion Strategy. In Proceedings of the SPE/AAPG/SEG Unconventional Resources Technology Conference, Houston, TX, USA, 23–25 July 2018. [Google Scholar] [CrossRef]
- Ciezobka, J.; Maity, D.; Salehi, I. Variable Pump Rate Fracturing Leads to Improved Production in the Marcellus Shale. In Proceedings of the SPE Hydraulic Fracturing Technology Conference, The Woodlands, TX, USA, 9–11 February 2016. [Google Scholar] [CrossRef]
- Iriarte, J.; Merritt, J.; Kreyche, B. Using Water Hammer Characteristics as a Fracture Treating Diagnostic. In Proceedings of the SPE Oklahoma City Oil and Gas Symposium, Oklahoma City, OK, USA, 27–31 March 2017. [Google Scholar] [CrossRef]
- Hu, X.; Luo, Y.; Zhou, F.; Qiu, Y.; Li, Z.; Li, Y. Evaluation of Multi-Fractures Geometry Based on Water Hammer Signals: A New Comprehensive Model and Field Application. J. Hydrol. 2022, 612, 128240. [Google Scholar] [CrossRef]
- Luo, Y.; Hu, X.; Zhou, F.; Qiu, Y.; Lu, X.; Li, J.; Wang, Y. A New Water Hammer Decay Model: Analyzing the Interference of Multiple Fractures and Perforations on Decay Rate. SPE J. 2023, 28, 1973–1985. [Google Scholar] [CrossRef]
- Panjaitan, M.L.; Moriyama, A.; McMillan, D.; Dunaeva, A.; Rutledge, L.; Xu, J.; Parkhonyuk, S.; Kabannik, A.; Korkin, R.; Warren, M.; et al. Qualifying Diversion in Multi Clusters Horizontal Well Hydraulic Fracturing in Haynesville Shale Using Water Hammer Analysis, Step-Down Test and Microseismic Data. In Proceedings of the SPE Hydraulic Fracturing Technology Conference and Exhibition, The Woodlands, TX, USA, 23–25 January 2018. [Google Scholar] [CrossRef]
- Chang, H.; Yi, D.Q.; Lv, Y.; Zhao, M.; Cao, P.L.; Zhang, L.; Hou, R.; Di, Y.L.; Chen, J.; Zhang, L.; et al. Outside the Box: Innovative Application of Diversion as a Replacement for Bridge Plug. In Proceedings of the SPE Middle East Oil & Gas Show and Conference, Event Canceled, 15 November 2021. [Google Scholar] [CrossRef]
- Alobaid, H.; Khan, A.M.; Almulhim, A.; Hansen, J.; Kabannik, A. Comprehensive Design and Diagnostic Approach for Horizontal Completions in Carbonate Environment. In Proceedings of the ADIPEC, Abu Dhabi, United Arab Emirates, 31 October 2022. [Google Scholar] [CrossRef]
- Alobaid, H.; Khan, A.M.; Hansen, J.; Khudorozhkova, A. Stimulation Efficiency with Significantly Fewer Stages: Perforation Strategy Combined with Multimodal Diverters and Novel Nonintrusive Monitoring Algorithm. In Proceedings of the SPE Annual Technical Conference and Exhibition, Houston, TX, USA, 3–5 October 2022. [Google Scholar] [CrossRef]
- Haustveit, K.; Dahlgren, K.; Greenwood, H.; Peryam, T.; Kennedy, B.; Dawson, M. New Age Fracture Mapping Diagnostic Tools-A STACK Case Study. In Proceedings of the SPE Hydraulic Fracturing Technology Conference and Exhibition, The Woodlands, TX, USA, 25 January 2017. [Google Scholar] [CrossRef]
- Qiu, Y.; Hu, X.; Zhou, F.; Li, Z.; Li, Y.; Luo, Y. Water Hammer Response Characteristics of Wellbore-Fracture System: Multi-Dimensional Analysis in Time, Frequency and Quefrency Domain. J. Pet. Sci. Eng. 2022, 213, 110425. [Google Scholar] [CrossRef]
- Montgomery, D.C.; Runger, G.C.; Hubele, N.F. Engineering Statistics; John Wiley & Sons: Hoboken, NJ, USA, 2009. [Google Scholar]


| Well Number | Well 1 | Well 2 |
|---|---|---|
| Reservoir type | Shale | |
| The method of hydraulic fracturing | Diversion fracturing and staged fracturing | |
| The method of fracturing diagnosis | Water hammer diagnostics | |
| The method of treating | Zipper fracturing | |
| Depth of well | 6168 m | 6396 m |
| Horizontal segment length | 2700 m | 2706 m |
| Diversion plan stages | 32 | 31 |
| No diversion | 2 | 1 |
| Single-time diversion | 21 | 19 |
| Dual-time diversion | 9 | 11 |
| Diverter | Conic diverter | Spherical and powdered diverter |
Disclaimer/Publisher’s Note: The statements, opinions and data contained in all publications are solely those of the individual author(s) and contributor(s) and not of MDPI and/or the editor(s). MDPI and/or the editor(s) disclaim responsibility for any injury to people or property resulting from any ideas, methods, instructions or products referred to in the content. |
© 2024 by the authors. Licensee MDPI, Basel, Switzerland. This article is an open access article distributed under the terms and conditions of the Creative Commons Attribution (CC BY) license (https://creativecommons.org/licenses/by/4.0/).
Share and Cite
Liu, B.; Yue, W.; Wang, Y.; Gu, Z.; Wen, R.; Qiu, Y.; Yi, P.; Hu, X. Oscillation Times in Water Hammer Signatures: New Insights for the Evaluation of Diversion Effectiveness in Field Cases. Processes 2024, 12, 1312. https://doi.org/10.3390/pr12071312
Liu B, Yue W, Wang Y, Gu Z, Wen R, Qiu Y, Yi P, Hu X. Oscillation Times in Water Hammer Signatures: New Insights for the Evaluation of Diversion Effectiveness in Field Cases. Processes. 2024; 12(7):1312. https://doi.org/10.3390/pr12071312
Chicago/Turabian StyleLiu, Bingxiao, Wenhan Yue, Yajing Wang, Zhibin Gu, Ran Wen, Yang Qiu, Pukang Yi, and Xiaodong Hu. 2024. "Oscillation Times in Water Hammer Signatures: New Insights for the Evaluation of Diversion Effectiveness in Field Cases" Processes 12, no. 7: 1312. https://doi.org/10.3390/pr12071312
APA StyleLiu, B., Yue, W., Wang, Y., Gu, Z., Wen, R., Qiu, Y., Yi, P., & Hu, X. (2024). Oscillation Times in Water Hammer Signatures: New Insights for the Evaluation of Diversion Effectiveness in Field Cases. Processes, 12(7), 1312. https://doi.org/10.3390/pr12071312