Article

In Situ Combustion Characteristics of Heavy Oil in the Liaohe Oilfield at Different Temperatures

1
Exploration and Development Research Institute, Liaohe Oilfield Company, PetroChina, Panjin 124000, China
2
Lanzhou Institute of Chemical Physics, Chinese Academy of Sciences, Lanzhou 730030, China
*
Author to whom correspondence should be addressed.
Processes 2024, 12(7), 1320; https://doi.org/10.3390/pr12071320
Submission received: 3 June 2024 / Revised: 22 June 2024 / Accepted: 24 June 2024 / Published: 26 June 2024
(This article belongs to the Section Energy Systems)

Abstract

:
This study conducted in situ combustion oxidation experiments on crude oil from Block D within the Liaohe Oilfield, utilizing a kettle furnace low-pressure oxidation reaction method at various temperatures. The molecular composition of oxidation products was analyzed using gas chromatography–mass spectrometry (GC–MS) and high-resolution mass spectrometry. The results reveal that the molecular composition of the products remains relatively stable up to 300 °C, exhibiting a slight increase in C13-C30 alkanes. The ratio of the peak area for C21 to bisnorhopane is 0.082. From 300 °C to 450 °C, compounds with long alkyl chains gradually undergo thermal cracking, resulting in a significant increase in the production of alkanes within the C10–C30 range. The concentration of saturated hydrocarbons produced through thermal cracking reaches its maximum at a temperature of 400 °C. The most abundant peak of n-alkane is observed at C21, with a quantified ratio of peak area for C21 to bisnorhopane at 6.5, indicating a two-order magnitude increase compared to crude oil. From 500 °C to 600 °C, compounds undergo more profound thermal cracking and condensation processes. The predominant hydrocarbons consist of aromatic molecules containing two to six rings substituted with short side chains. The double bond equivalent (DBE) values of carbazoles and carboxylic acids are determined as 30 and 25, respectively. At 600 °C, the peak area ratio of naphthalene to biodecane is 300, indicating a remarkable increase of five orders of magnitude compared to the crude oil. The present study elucidates the correlation between the characteristics of combustion components in crude oil and the corresponding combustion temperature. Primary cracking reactions within crude oil are promoted effectively when keeping the combustion zone at 350 °C and 450 °C. This process significantly reduces the viscosity of heavy oil and enhances its fluidity.

1. Introduction

In situ Combustion (ISC) [1,2,3] is a heavy oil production method that has seen significant experimental breakthroughs. The ISC method heats the oil layer by combusting heavy components, resulting in a series of temperature zones within the formation that decrease from high to low [4,5]. Research on fire-drive mechanisms has been extensively conducted since the 1960s [6,7]. Field tests have yielded positive results, thereby establishing a relatively comprehensive supporting technology. Recent research has predominantly concentrated on the attributes of reservoir zones in high-temperature fire flooding [8], the kinetics of crude oil oxidation at elevated temperatures [9], the procedure and oxidation characteristics of coke deposition [10,11], and the examination of well patterns in high-temperature fire flooding [12]. The oxidation characteristics of oxygen and crude oil exhibit significant variations across different temperature zones [8]. Techniques such as Thermogravimetric Analysis (TG) [13], Differential Scanning Calorimetry (DSC) [14], and Pseudo-component Preparation [15] are commonly used to scrutinize the oxidation characteristics of heavy oil. China has undertaken successive fire-flooding pilot tests in various oil fields [16,17,18]. Notably, the Liaohe oil field commenced fire flooding application tests in block D in 2005. The Liaohe D block, situated southwest of the Shuguang oilfield, is part of the middle section of the western depression oblique slope within the Liaohe Depression Basin’s western depression basin. The crude oil in this block is a typical thin interlayer ordinary heavy oil reservoir, with typical lake sedimentation and delta sedimentation characteristics. Liao et al. [19] investigated the pyrolysis of Liaohe crude oil and tar sand bitumens utilizing gold tubes. Pan et al. [20] performed a quantitative analysis of asphaltenes precipitated from crude oils of varying biodegradation degrees using Py-GC and THM-GC techniques. It was found that heavily biodegradable Liaohe crude oil began to thermally decompose at lower temperatures, preferentially cracking out hydrogen components such as normal and branched alkanes.
The chemical composition of crude oil is intricate, necessitating extensive pretreatment steps for component separation. Hashemi-Nasab et al. [21] classified oil wells in Iran using gas chromatography analysis (GC) and Fourier transform infrared spectroscopy (FT-IR) fingerprinting. Sviridenko et al. [22] studied the composition of saturated compounds and aromatic compounds in both pre-and post-catalytic cracking of heavy oil from the Mordovo-Karmalskoye oilfield utilizing gas chromatography–mass spectrometry (GC–MS). Lelevic et al. [23] utilized two-dimensional comprehensive gas chromatography to quantitatively analyze hydrocarbons in gas oils. While these chromatographic techniques have improved the qualitative capacity of separation, they remain limited to analyzing only a subset of crude oil components. The effective separation of certain mixtures from crude oil remains challenging. However, with advancements in separation technology, high-resolution mass spectrometry [24] and its combined technologies [25] have emerged as crucial analytical tools for separating and identifying crude oil due to their simultaneous time–space separation and in situ detection capabilities. Therefore, it is essential to thoroughly investigate the micrographic changes in air-flooded crude oil properties and conduct a comprehensive examination of the changes in chemical composition to facilitate the identification of various stages of the oxidation reaction. Analyzing chromatographic fingerprint scans can only confirm that the components of fire-flooded crude oil have undergone significant changes [26]; it cannot directly evaluate the specific high-temperature processes involved in crude oil or reflect the combustion characteristics of fire inundation at different temperature stages.
Current research does not provide specific, operationally feasible, and convenient methods for assessing the combustion temperature during fire flooding. This paper details the results of oxidation experiments conducted on crude oil in the Liaohe oil field’s D block. The components of the produced crude oil were characterized using GC–MS and Fourier transform ion cyclotron resonance mass spectrometry (FT-ICR MS) [27], coupled with ESI and atmospheric pressure photoionization ionization (APPI) sources [28], and their variation characteristics at different temperatures were analyzed. This research has found that the peak area ratio of C21 to bisnorhopane is an indicator for evaluating the temperature variation of saturated hydrocarbons, while the peak area ratio of naphthalene to bisnorhopane is an indicator for measuring the temperature variation of aromatic hydrocarbons. By analyzing the changes in these indicators, it is possible to effectively evaluate the thermal reaction stages experienced by the oil produced by the fire drive, which is helpful for the evaluation of combustion temperature and gas injection control at the fire-drive site.

2. Materials and Methods

2.1. Oxidation Process of the Crude Oil

The crude oil underwent oxidation in a low-pressure kettle furnace [10]. The reactor has a single-track relief valve, when the pressure in the reactor is higher than 5.0 MPa, the high-pressure gas in the reactor can be released to maintain a consistent pressure of 5.0 MPa. Initially, a mixture comprising 10.0 g of experimental crude oil and 5.0 g of well reservoir cuttings was meticulously integrated into a 1 L high-temperature reaction kettle. The stirring and condensation system was activated, with the temperature-programmed heating rate set at 5 °C/min. Prior to sealing the reactor, air was injected to establish an internal pressure of 0.1 MPa. Following this, in-situ combustion of the crude oil was conducted at temperatures of 200 °C, 250 °C, 300 °C, 350 °C, 400 °C, 450 °C, 500 °C, 550 °C, and 600 °C, respectively. The temperature was maintained at each level for a duration of 2 h, followed by a cooling period of 3 h using an air cooling device to restore the system to room temperature. The solid–liquid products that accumulated in the reactor post-reaction were collected and their yield calculated. The solid–liquid product is then washed with trichloroethylene. The soluble fraction of trichloroethylene represents the residual oil, while the weight of the cokes is ascertained by subtracting the weight of cuttings from the insoluble portion.

2.2. Characterization of Oil Samples

The SARA components of the crude oil and thermal reaction products were analyzed by the China Petroleum Industry Standard SY/T 5119-2016.
The oil samples underwent analysis using a 7890B-5977A GC–MS (Agilent, Santa Clara, CA, USA), which was outfitted with a VF-5ht MS column (30 m × 0.25 mm × 0.1 μm). High-purity helium served as the carrier gas. The initial temperature was established at 60 °C, which was subsequently increased to 350 °C at a rate of 5 °C/min and maintained at 350 °C for 5 min. The injection port’s temperature was set at 280 °C, while the auxiliary heating temperature for the mass spectrometer interface was maintained at 250 °C. The flow rate of the carrier gas was maintained at 1 mL/min. The oil samples were dissolved in dichloromethane at a concentration of 100 mg/L, with an injection volume of 1.0 μL and a split ratio of 10:1.
The high-resolution mass spectrometry analysis was performed on the Fusion Orbitrap MS (ThermoFisher, Waltham, MA, USA). Carbazoles and carboxylic acids were analyzed using the negative ion mode of the ESI source. The crude oil was dissolved in toluene to prepare a 10 mg/mL solution, and 20 μL of the sample solution was diluted with 1 mL of toluene/methanol (1:3, v/v) for negative ion ESI Orbitrap MS analysis. The sample was directly injected into the ESI ion source using a syringe pump at a flow rate of 10 μL/min. The main parameters for the negative ion ESI Orbitrap MS were set as follows: Sheath gas flow rate at 8.0 Arb, auxiliary gas flow rate at 3.0 Arb, ion transfer tube and evaporator temperature at 300 °C and 200 °C, respectively. Hydrocarbons were analyzed using the positive ion mode of the APPI source. The crude oil was dissolved in toluene to prepare a 0.4 mg/mL solution, and the sample solution was directly injected into the APPI ion source using a syringe pump at a flow rate of 40 μL/min. The main parameters for the positive ion APPI Orbitrap MS were set as follows: sheath gas flow rate at 20.0 Arb, auxiliary gas flow rate at 10.0 Arb, ion transfer tube and evaporator temperature at 300 °C and 280 °C, respectively. The mass scanning range was set from 200 to 900 Da, with a cumulative scan time of 1.5 min for the spectra. Data analysis was performed using Thermo Xcalibur Qual Browser.

3. Results and Discussion

3.1. Composition Characteristics of Crude Oil in Block D

The crude oil was procured from block D, located in the Liaohe oilfield (sampling date: July 2021, viscosity at 50 °C: 3437 mPa·s, total acid number 1.35 mgKOH/g). The SARA composition of the crude oil is as follows: 32.14% saturates, 21.71% aromatics, 43.01% resins, and 3.15% asphaltenes. The elemental composition of the crude oil is determined to be 0.66% Nitrogen (N), 84.69% Carbon (C), 11.61% Hydrogen (H), and 2.35% Oxygen (O).
In the selected ion chromatogram at m/z 85 and 191 (Figure 1b), the abundance of phytane (Ph) and hopanes is significant, while the chromatographic peaks of n-alkanes are not significant. This indicates severe biodegradation of the crude oil. The most abundant carbon number of n-alkanes is C23, and the values of Pr/nC17 and Ph/nC18 are much greater than 1, with the ∑C21−/∑C22+ value less than 1, indicating a significant distribution advantage of high-carbon-number hydrocarbons. Moreover, the relative abundance of gammacerane in pentacyclic terpenoids is significantly low. C29 and C30 hopane are the predominant compounds, with bisnorhopane exhibiting the highest concentration. This characteristic is particularly noteworthy for D block heavy oil.

3.2. Effect of Reaction Temperature on the Yield of Thermal Reaction Products

The simulation experiments of in situ oxidation combustion were conducted at nine distinct temperature points ranging from 200 °C to 600 °C. In this study, the term “solid–liquid yield” is defined as the ratio of the weight of the accumulated solid–liquid products in the reactor after the reaction minus the weight of the well reservoir cuttings to the initial mass of the oil samples introduced into the reaction. Each temperature was evaluated twice, with the average yield subsequently calculated.
According to the distribution of solid–liquid yield, the thermal reaction of crude oil can be divided into three stages (Figure 2). Within the temperature range of 200–250 °C, the solid–liquid yield is approximately 84%. The characteristic of this stage is that crude oil has the smallest participation in the reaction, with only about 16% of the components undergoing combustion and partly transforming into gaseous products. As the temperature increases to 300–400 °C, the solid–liquid yield decreases to around 60%. The characteristic of this stage is that the cracking reaction of crude oil intensifies, with over 40% of the oil components partly converted into gaseous products, and the oil achieves complete conversion, resulting in a significant decrease in viscosity. In the final stage of 450–600 °C, the solid–liquid yield significantly decreased to 22–37%. This phase is characterized by extensive cracking and combustion of crude oil components, leading to a significant loss of crude oil. Overall, it can be observed that as the temperature rises, the oil sample gradually transforms into coke.

3.3. Effect of Thermal Reaction Products on SARA Components

The analysis results of saturated hydrocarbons, aromatic hydrocarbons, resins, and asphaltenes (SARA) are shown in Table 1. Based on the distribution of SARA components, the thermal reaction can be divided into three stages.
The concentrations of saturated hydrocarbons and aromatic hydrocarbons declined with a temperature increase ranging from 200–300 °C, whereas resin and asphaltene levels rose. During this period, oxidative polymerization resulted in the formation of a large amount of oxidized polymer products, which led to an increase in asphaltene content to 27.59%. When the reaction temperature exceeds 300 °C, the side chains of saturated alkane on these oxidized polymeric products commence cracking, resulting in a decrease in asphaltene content to 8.15%. Between 350–450 °C, substantial amounts of resin in the oil samples undergo cracking, yielding long-chain alkanes and olefins. At 450 °C, the saturated hydrocarbon content surges significantly to 46.61%, while the aromatic hydrocarbon content plummets to 14.04%. The resin content also significantly decreased to 24.4%, while the asphaltene content remained stable at 14.87%. After exceeding 500 °C, combustion significantly reduces the light components in the oil sample, leading to a significant increase in the relative content of asphaltene.

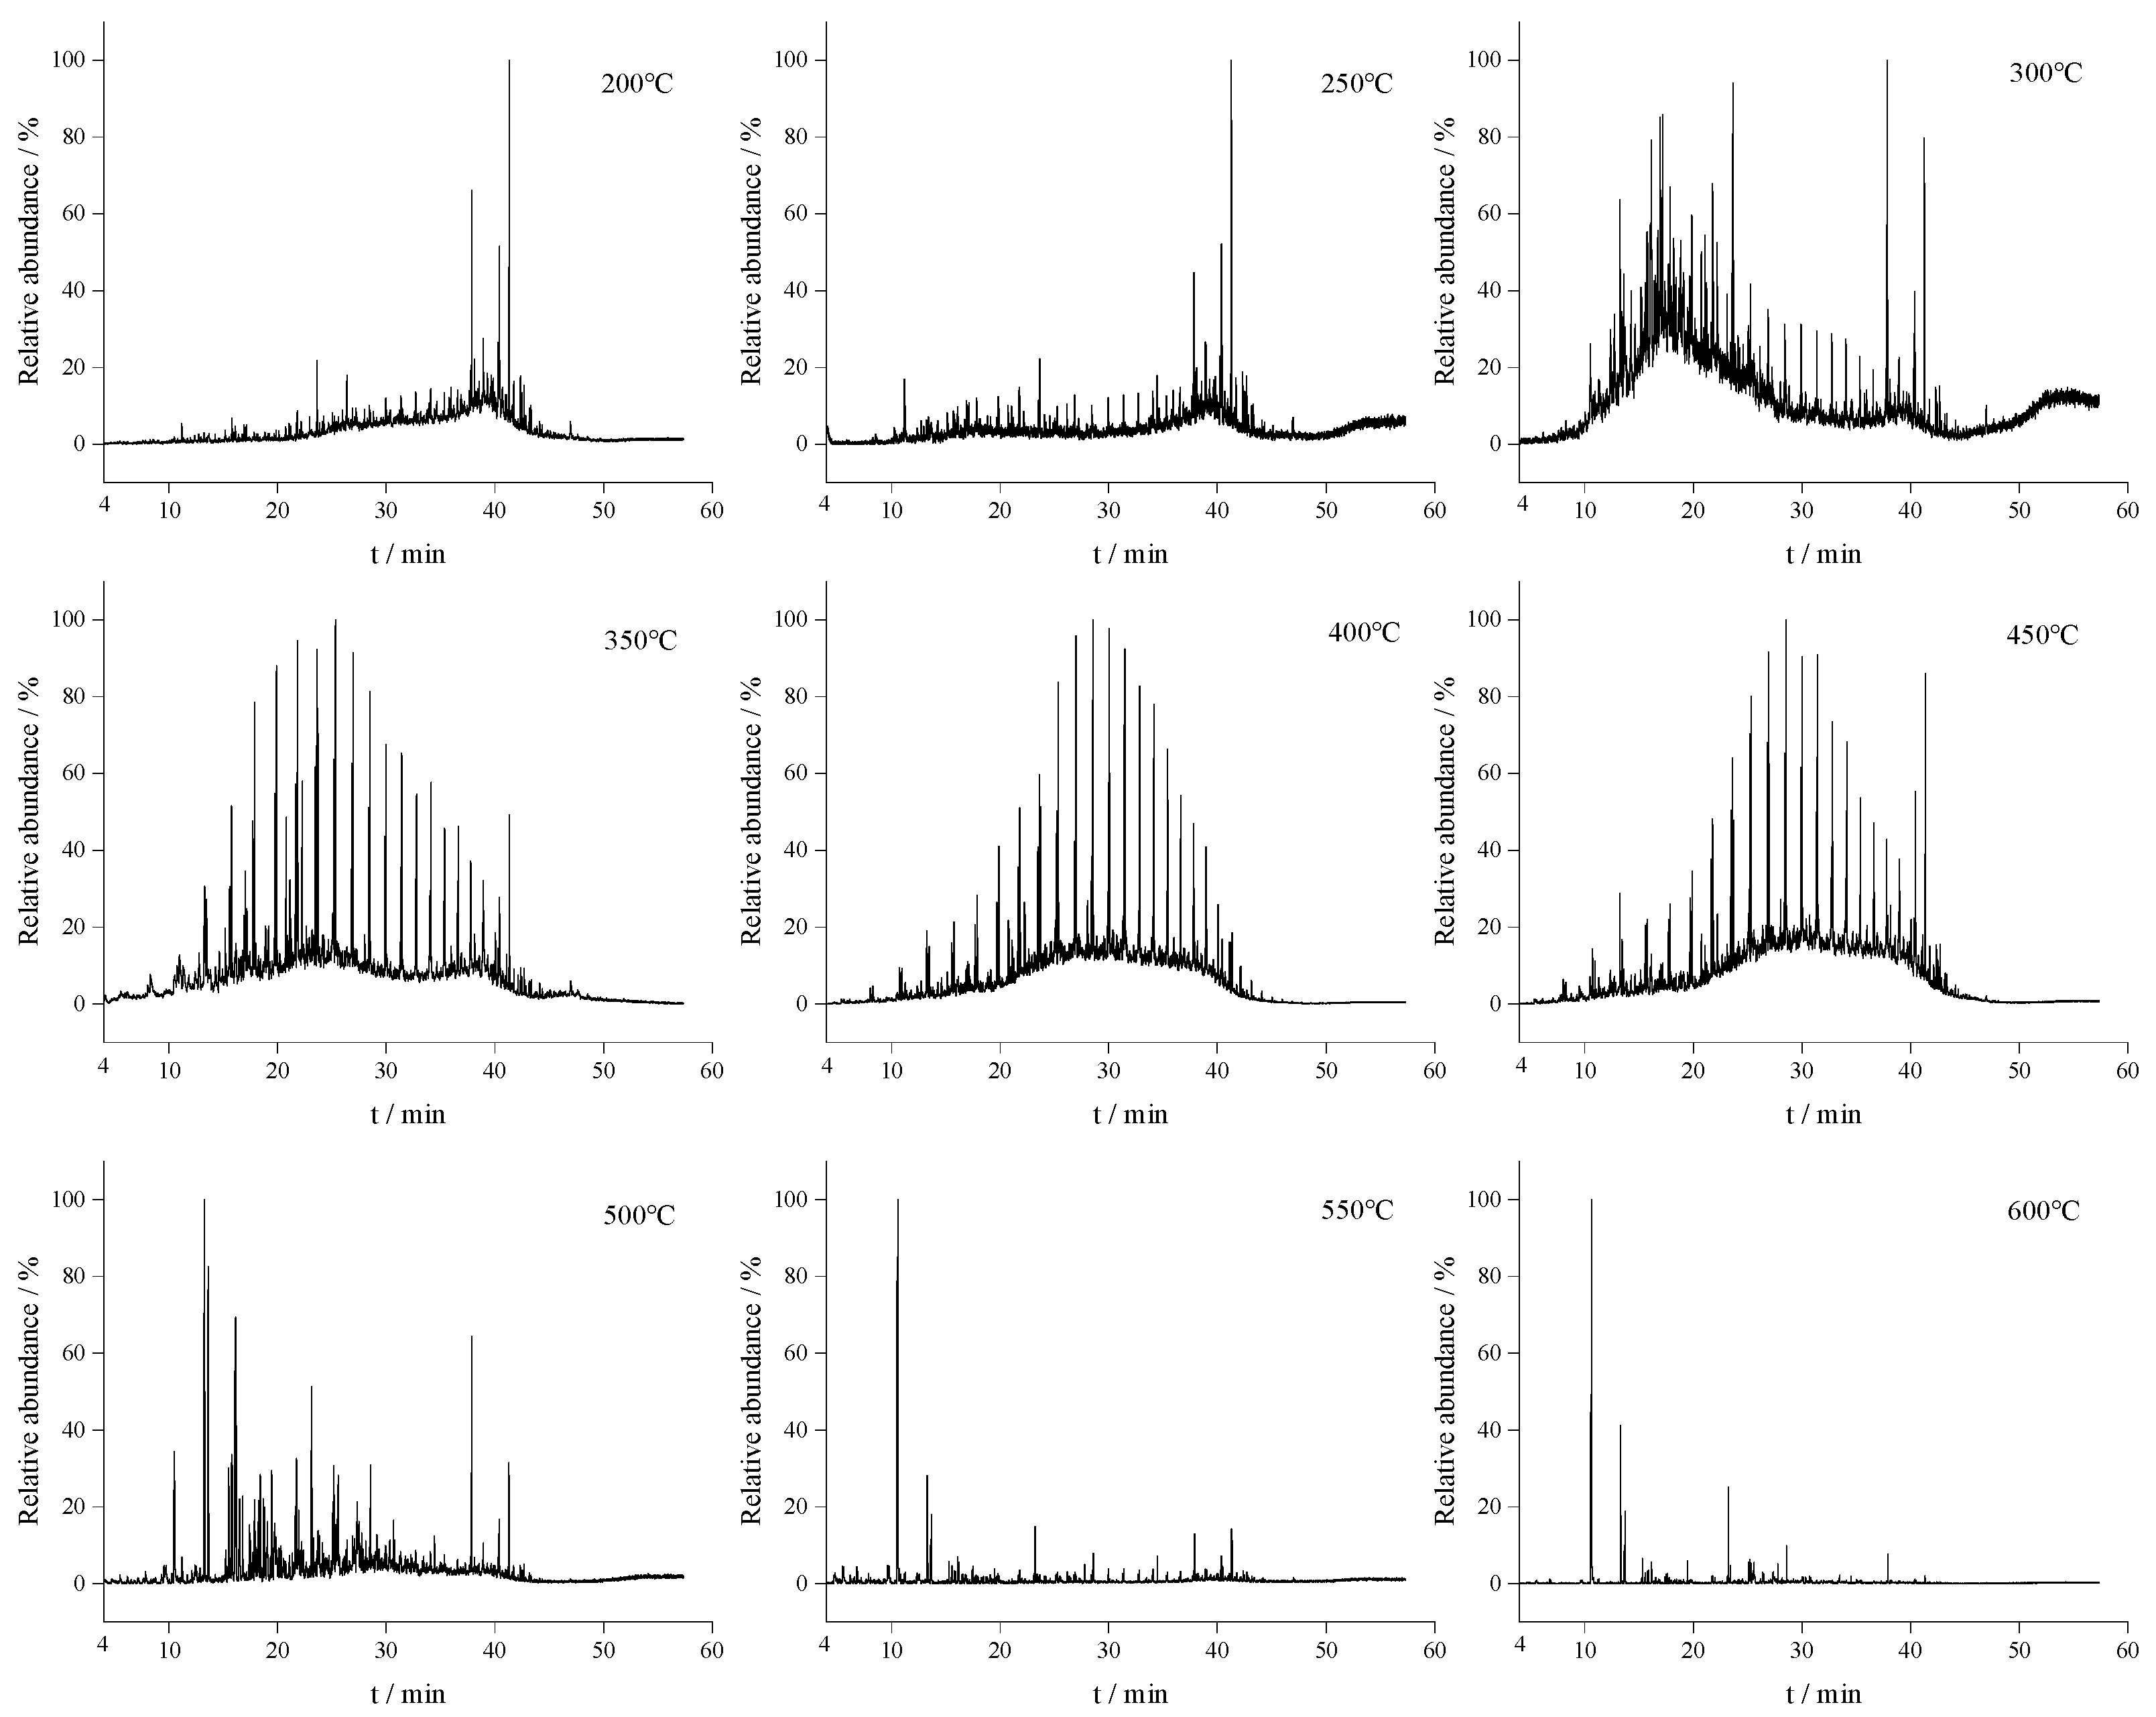
3.4. Characterization of Thermal Reaction Products by GC–MS

Figure 3 shows the GC–MS chromatograms of products at different reaction temperatures. The composition of thermal reaction products exhibits significant variations with reaction temperature. As the reaction temperature increases, the abundance of long-chain alkanes significantly increases. Considering that the absolute contents of C21 and naphthalene vary greatly, the ratio of peak area for C21 to bisnorhopane can be used as an indicator to evaluate the changes in saturated hydrocarbons caused by temperature. Similarly, the ratio of naphthalene to bisnorhopane can be used as an indicator to evaluate the changes in aromatic hydrocarbons caused by temperature. These ratios increase significantly with the increasing reaction temperature of crude oil. As shown in Table 2, both indices exhibit strong correlation with reaction temperature and the compositional profile of reaction products.
At 200–300 °C, the predominant reactions are identified as the oxidation and combustion of light components. The chromatogram at this temperature closely mirrors that of the initial stage, with a marginal increase observed in the saturated hydrocarbon content of C12–C30. The distribution of n-alkanes progressively becomes complete, while Pr and Ph also begin to emerge in the iso-alkanes. Toluene and xylene components are identifiable in the reactant gas. The peak area ratio of C21 and bisnorhopane is 0.082, slightly increasing compared to the initial crude oil ratio. The cracking reaction predominantly transpires at temperatures ranging from 300 to 450 °C, with the production of long-chain hydrocarbons escalating in tandem with the temperature. The peak area ratio of C21 and bisnorhopane is observed to be 0.16 and 1.63 at 300 °C and 350 °C, respectively. At 400 °C, the generation of C11–C30 alkanes is most pronounced. The primary carbon peak is identified as C21, accompanied by appearance of low boiling point components. The peak area ratio of C21 to bisnorhopane is 6.46, with an improvement of two orders of magnitude compared to the crude oil. At temperatures exceeding 400 °C, the crude oil undergoes a substantial cracking reaction reforming process. The observed spectra display characteristics indicate a loss in peak for low boiling points, with the ratio of peak area for C21 to bisnorhopane being 0.91.
At temperatures ranging from 500–600 °C, the primary reactions observed are combustion and the cracking of macromolecular compounds. It is worth noting that this temperature range exceeds the decomposition temperature of hopane compounds, leaving only a portion of the oil sample after the reaction. At a temperature of 600 °C, the peak area ratio for C21 and bisnorhopane in the product is 0.01, while that for naphthalene and bisnorhopane stands at 300.6. Compared to crude oil, there is a five-fold increase in the peak area ratio for naphthalene to bisnorhopane.
In contrast to the research conducted by Liao [19] and Pan [20] on the thermal reaction products of Liaohe crude oil, this study extends the discussion by proposing a relationship between variations in thermal reaction products content and temperature. This proposal is instrumental in effectively assessing the stages of thermal reactions experienced by oil produced through fire flooding.

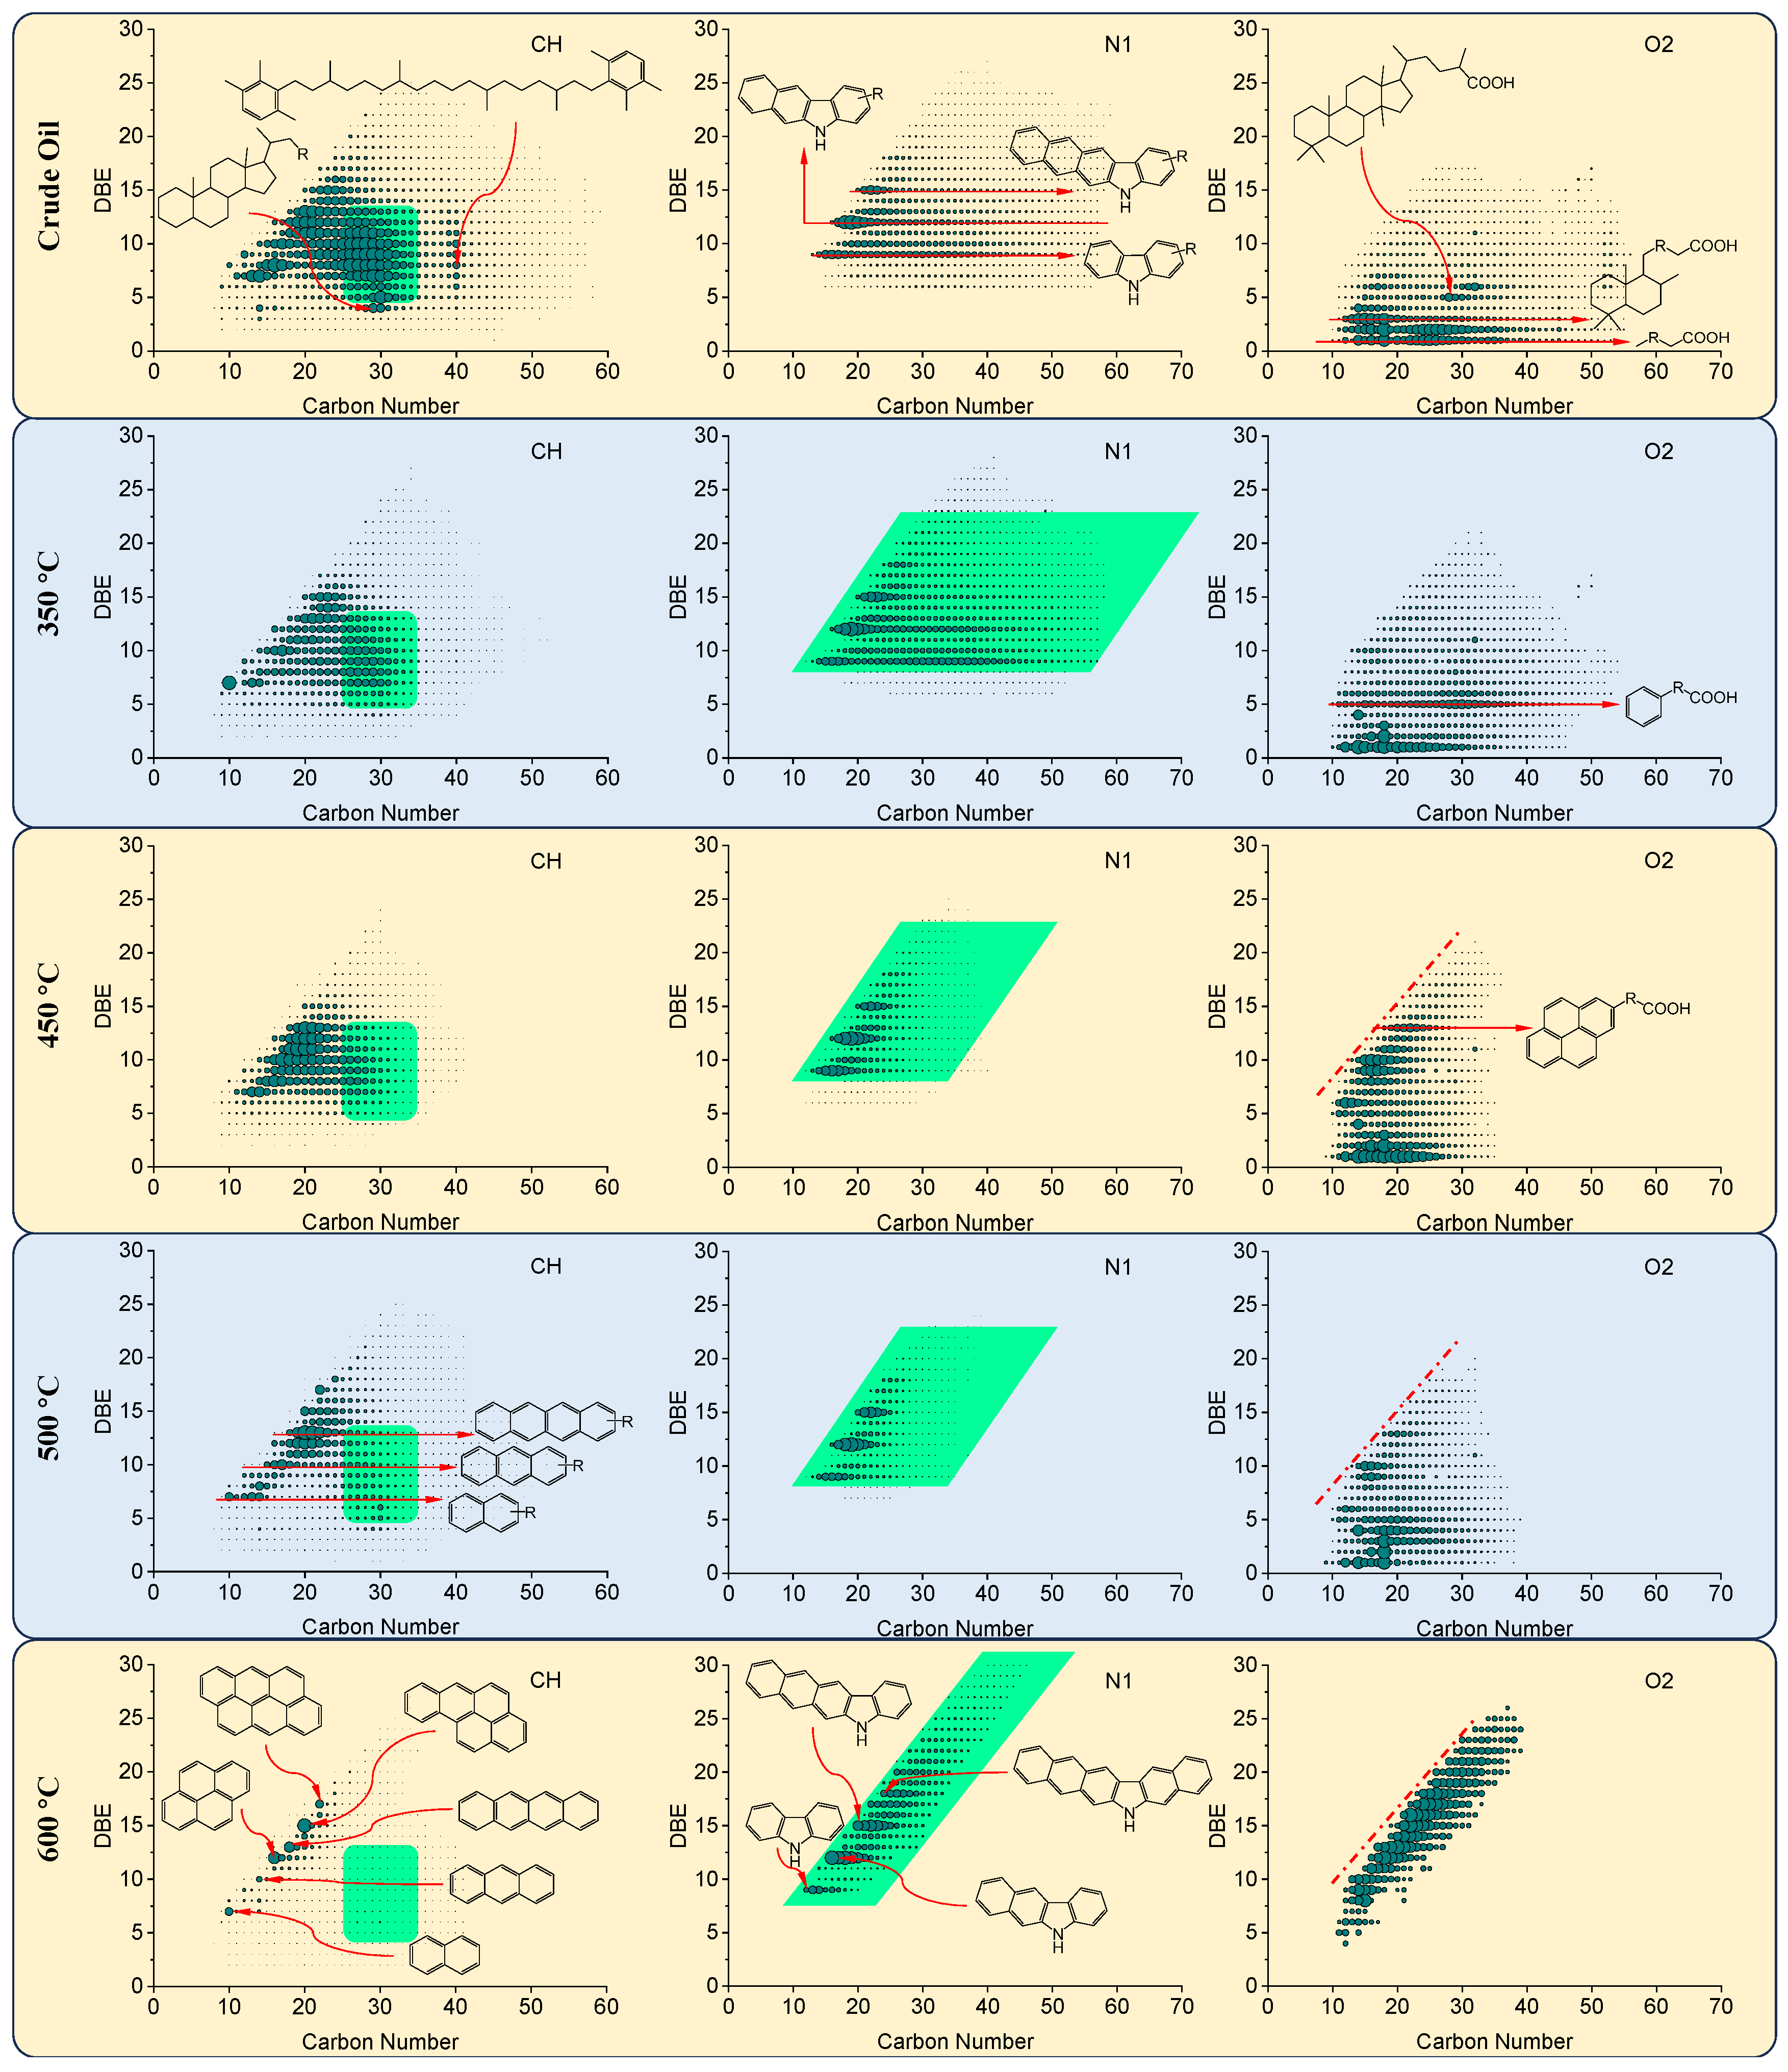
3.5. Characterization of Thermal Reaction Products by High-Resolution Mass Spectrometry

GC–MS analysis of crude oil and thermal reaction products at different temperatures primarily reveals changes of light hydrocarbons. It is unable to characterize the compounds in the UCM (unresolved complex mixture) hump of the chromatogram. High-resolution mass spectrometry is unrestricted by the boiling points of compounds in crude oil and can achieve molecular composition analysis of petroleum samples.
Figure 4 shows the distribution of the double bond equivalent (DBE) of hydrocarbons, carbazoles, and carboxylic acids in crude oil and thermal oxidation products at different temperatures as a function of carbon number. The carbon number distribution of hydrocarbons and heteroatomic compounds in crude oil is up to C60. Hydrocarbons mainly contain biomarker structures of C40 carotenoids, steranes, and hopanes (near C30). Carbazoles are neutral nitrogen compounds with DBE values of 9, 12, and 15. Carboxylic acids are alkanoic acids, naphthenic acids with 1–2 rings, steranoic acid, and hopanoic acid. As the temperature increases, all detected compounds show a trend of decreasing carbon numbers and increasing condensation degrees (higher DBE values).
At 350 °C, C40 carotenoids, steranoic acid, and hopanoic acid undergo significant thermal decomposition. At 450 °C, the carbon numbers of various compounds are lower than C30, indicating that cracking reactions are more violent. Pyrolysis of alkanoic acids and naphthenic acids leads to a significant increase in the relative abundance of highly condensed carboxylic acids. At 500 °C, the thermal cracking of all compounds deepens, the carbon numbers of hydrocarbons decrease below C25, and the alkyl chain length of alkanoic acids also decreases significantly. At 600 °C, hydrocarbons mainly contain aromatic hydrocarbons with two to six aromatic rings, and their alkyl substituent chain lengths are generally less than five carbon numbers. The condensation degree of carbazoles further increases, and DBE values reach up to 30. Alkanoic acids and naphthenic acids are almost pyrolyzed completely, resulting in a large abundance of high-condensation carboxylic acids, with a maximum DBE value of 25.

3.6. Analysis of Oil Samples from Fire-Flooding Wells

Field-produced oil is typically a mixture of products from different thermal reactions. The compositional differences described in Table 2 and Figure 3 for field-produced oil are usually sufficient rather than necessary. For the analysis of crude oil from production wells, GC–MS can be utilized to analyze and compare alterations in alkanes, naphthalene, and low boiling point spectral peaks with the distribution of typical compounds that react at varying temperatures. This comparison can provide a valuable reference for distinguishing temperature histories in fire-driven modified oil samples.
Figure 5 illustrates the GC–MS chromatogram of an oil sample derived from a fire-flooding production well. Compared to Figure 1, within the retention time range of 10–20 min, there is a marked increase in the content of components with low boiling points within the chromatogram. Additionally, a minor increase in saturated alkane components ranging from C11–C30 is observed. However, the results of the thermal reaction experiment indicate that when the temperature exceeds 400 °C, there is a significant surge in the saturated alkane components of C16–C30, with the primary carbon peak being observed at C21. The rise in the oil sample’s C16–C30 saturated alkane component is not significantly notable. In addition, the dominant carbon peak of n-alkane is identified as C14, which indicates that the oil sample remains in the early stages of fire flooding and has not yet undergone a cracking process exceeding 400 °C. Concurrently, this oil sample from the production well is not only the fire-flooding oil and contains a substantial amount of unreacted crude oil. Despite the considerable dilution of the fire-flooding oil sample due to the displacement of crude oil, the peak area ratio for C21 to bisnorhopane is 0.157, and the peak area ratio of naphthalene to bisnorhopane is 0.409. These results indicate that the oil sample undergoes a cracking reaction at temperatures exceeding 300 °C. We can infer that the oil sample reacts at an approximate temperature of 350 °C, and the volume of injected gas can be adjusted to elevate the reaction temperature.

4. Conclusions

The in situ oxidation simulation was conducted to investigate the oxidation and cracking reactions of crude oil across a temperature range of 200–600 °C. This study aimed to compare the characteristics of crude oil components at varying temperatures, thereby elucidating the compositional alterations of crude oil under different conditions. Between 350–450 °C, compounds with long alkyl chains experience cracking reactions producing a significant quantity of alkane compounds, which is a notable characteristic of high-temperature oxidation in Block D of the Liaohe Oilfield. At temperatures between 400–450 °C, there is a marked increase in the content of saturated hydrocarbons, resulting in the generation of a substantial amount of saturated hydrocarbons with carbon numbers ranging from C11 to C30. The hydrocarbons with the most abundant peak observed at C21 are produced by cracking reaction. When the oxidation temperature surpasses 500 °C, the compounds experience deep cracking and condensation, characterized by an elevation in DBE and a reduction in alkyl substituent chains. A significant difference is observed between unreacted heavy oil and the reacted oil sample, as the reacted samples contain a substantial presence of light components, indicative of the complete upgrading of crude oil within the specified temperature range. The identification of characteristic compounds in fire-driven crude oil helps to determine the burning temperature at the fire front, thereby facilitating the adjustment of gas injection parameters.

Author Contributions

Conceptualization, Y.G. (Yong Guo) and X.W.; Formal analysis, Y.G. (Yong Guo); Investigation, Y.G. (Yuning Gong); Methodology, Y.S. and T.F.; Project administration, Y.G. (Yong Guo); Resources, Y.G. (Yuning Gong); Supervision, Y.G. (Yong Guo); Writing—original draft, Y.G. (Yuning Gong), Y.S., T.F. and X.W.; Writing—review & editing, Y.G. (Yuning Gong), Y.G. (Yong Guo) and X.W. All authors have read and agreed to the published version of the manuscript.

Funding

This research was funded by the China Petroleum Science and Technology Special Project (2023ZZ23YJ06).

Data Availability Statement

Data will be made available on request from Authors.

Acknowledgments

The authors gratefully acknowledge the financial support of the China Petroleum Science and Technology Special Project (2023ZZ23YJ06). The authors extend their gratitude to the anonymous reviewers for their insightful and constructive feedback.

Conflicts of Interest

Authors Yuning Gong, Yang Song and Tian Feng are employed by the company Exploration and Development Research Institute of Liaohe Oilfield Company, PetroChina, Panjin, China. The remaining authors declare that the research was conducted in the absence of any commercial or financial relationships that could be construed as a potential conflict of interest.

References

  1. Shi, Q.; Zhao, S.Q.; Zhou, Y.S.; Gao, J.S.; Xu, C.M. Development of heavy oil upgrading technologies in China. Rev. Chem. Eng. 2020, 36, 1–19. [Google Scholar] [CrossRef]
  2. Minakov, A.V.; Meshkova, V.D.; Guzey, D.V.; Pryazhnikov, M.I. Recent Advances in the Study of In Situ Combustion for Enhanced Oil Recovery. Energies 2023, 16, 4266. [Google Scholar] [CrossRef]
  3. Tao, L.; Hu, Z.W.; Xu, Z.X.; Zhang, X.; Ding, Y.C.; Wang, C.H.; Chen, D.Q.; Li, S.Y. Experimental investigation of in situ combustion (ISC) in heavy oil thermal recovery. Geoenergy Sci. Eng. 2024, 233, 212488. [Google Scholar] [CrossRef]
  4. Zhu, Z.Y.; Liu, C.H.; Chen, Y.J.; Gong, Y.N.; Song, Y.; Tang, J.S. In-situ Combustion Simulation from Laboratory to Field Scale. Geofluids 2021, 2021, 8153583. [Google Scholar] [CrossRef]
  5. Wang, L.; Sun, W.Y.; Chu, S.L.; Liu, H.Q.; Dong, X.H.; Luan, G.H. Experimental Simulation of the Zones Characteristics Considering Oily Bubble Behavior During in Situ Combustion. Energy Fuels 2019, 33, 4964–4975. [Google Scholar] [CrossRef]
  6. Burger, J.G. Chemical society of petroleum aspects of in-situ combustion: Heat of combustion and kinetics. Eng. J. 1971, 12, 410–422. [Google Scholar] [CrossRef]
  7. Freitag, N.P. Chemical-reaction mechanisms that govern oxidation rates during in-situ combustion and high-pressure air injection. SPE Res. Eval. Eng. 2016, 19, 645–654. [Google Scholar] [CrossRef]
  8. Yuan, S.B.; Jiang, H.Y.; Yang, F.X.; Shi, Y.L.; Bai, Y.; Du, K. Research on characteristics of fire flooding zones based on core analysis. J. Pet. Sci. Eng. 2018, 170, 607–610. [Google Scholar] [CrossRef]
  9. Mahinpey, N.; Murugan, P.; Mani, T. Comparative kinetics and thermal behavior: The study of crude oils derived from Fosterton and Neilburg fields of Saskatchewan. Energy Fuels 2010, 24, 1640–1645. [Google Scholar] [CrossRef]
  10. Su, R.G.; Wang, X.S.; Sun, J.H.; Tang, J.S.; Chen, S.; Pan, J.J.; Guo, Y. Formation and Combustion Heat Release of Naphthenic-Based Crude Oil Cokes at Different Reaction Temperatures. ACS Omega 2022, 7, 15106–15112. [Google Scholar] [CrossRef]
  11. Hascakir, B.; Ross, C.M.; Castanier, L.M.; Kovscek, A.R. Fuel formation and conversion during in-situ combustion of crude oil. SPE J. 2013, 18, 1217–1228. [Google Scholar] [CrossRef]
  12. Guan, W.L.; Zhang, X.L.; Xi, C.F.; Wang, X.C.; Yang, F.X.; Shi, X.R.; Li, Q. Displacement and development characteristics of fire flooding of vertical wells in old heavy oil areas. Pet. Res. 2018, 3, 165–179. [Google Scholar] [CrossRef]
  13. Anto-Darkwah, E.; Cinar, M. Effect of pressure on the isoconversional in situ combustion kinetic analysis of Bati Raman crude oil. J. Pet. Sci. Eng. 2016, 143, 44–53. [Google Scholar] [CrossRef]
  14. Zhao, S.; Pu, W.F.; Su, L.; Shang, C.; Song, Y.; Li, W.; He, Z.H.; Li, Y.F.; Liu, Z.Z. Properties, combustion behavior, and kinetic triplets of coke produced by low-temperature oxidation and pyrolysis: Implications for heavy oil in-situ combustion. Pet. Sci. 2021, 18, 1483–1491. [Google Scholar] [CrossRef]
  15. Zhao, R.B.; Wei, Y.G.; Wang, Z.M.; Yang, W.; Yang, H.J.; Liu, S.J. Kinetics of Low-Temperature Oxidation of Light Crude Oil. Energy Fuels 2016, 30, 2647–2654. [Google Scholar] [CrossRef]
  16. Yang, F.X.; Sun, X.G.; Xin, W.B.; Zhan, H.Y.; Gao, C.G.; Yuan, S.B. Study on the sweep control method of in-situ combustion reservoir in Xinjiang Hongqian oilfield based on asynchronous injection and production. Pet. Sci. Technol. 2023, 1–18. [Google Scholar] [CrossRef]
  17. He, H.F.; Liu, P.C.; Li, Q.; Tang, J.S.; Guan, W.L.; Chen, Y.J. Experiments and simulations on factors affecting the stereoscopic fire flooding in heavy oil reservoirs. Fuel 2022, 314, 123146. [Google Scholar] [CrossRef]
  18. Zhang, X.; Liu, Q.C.; Che, H.C. Parameters Determination during In Situ Combustion of Liaohe Heavy Oil. Energy Fuels 2013, 27, 3416–3426. [Google Scholar] [CrossRef]
  19. Liao, Y.H.; Liu, W.M.; Pan, Y.H.; Wang, X.F.; Wang, Y.P.; Peng, P.A. Superimposed secondary alteration of oil reservoirs. Part I: Influence of biodegradation on the gas generation behavior of crude oils. Org. Geochem. 2020, 142, 103965. [Google Scholar] [CrossRef]
  20. Pan, Y.H.; Liao, Y.H.; Zheng, Y.J. Effect of Biodegradation on the Molecular Composition and Structure of Asphaltenes: Clues from Quantitative Py-Gc and Thm-Gc. Org. Geochem. 2015, 86, 32–44. [Google Scholar] [CrossRef]
  21. Hashemi-Nasab, F.S.; Parastar, H. Pattern recognition analysis of gas chromatographic and infrared spectroscopic fingerprints of crude oil for source identification. Microchem. J. 2020, 153, 104326. [Google Scholar] [CrossRef]
  22. Sviridenko, N.N.; Pevneva, G.S.; Voronetskaya, N.G. GC-MS analysis of hydrocarbons formed after catalytic cracking of heavy oil. Pet. Sci. Technol. 2023, 42, 2158–2170. [Google Scholar] [CrossRef]
  23. Lelevic, A.; Geantet, C.; Moreaud, M.; Lorentz, C.; Souchon, V. Quantitative analysis of hydrocarbons in gas oils by two-dimensional comprehensive gas chromatography with vacuum ultraviolet detection. Energy Fuels 2021, 35, 13766–13775. [Google Scholar] [CrossRef]
  24. Li, Y.Y.; Liao, G.Z.; Wang, Z.M.; Su, R.G.; Ma, S.; Zhang, H.; Wang, L.G.; Wang, X.S.; Pan, J.J.; Shi, Q. Molecular composition of low-temperature oxidation products in a simulated crude oil in-situ combustion. Fuel 2022, 316, 123297. [Google Scholar] [CrossRef]
  25. Wang, L.L.; Wang, P.F.; Zhang, Y.; Peng, X.Q.; Song, W.; Yang, J.S.; Yuan, C.D. Oxidation behaviors of Hongqian heavy crude oil characterized by TG-DSC-FTIR-MS within full temperature regions. Fuel 2023, 353, 129242. [Google Scholar] [CrossRef]
  26. Liu, Q.L.; Xia, C.Q.; Wang, L.; Tang, J.C. Fingerprint analysis reveals sources of petroleum hydrocarbons in soils of different geographical oilfields of China and its ecological assessment. Sci. Rep. 2022, 12, 4808. [Google Scholar] [CrossRef] [PubMed]
  27. Ma, S.; Li, Y.Y.; Su, R.G.; Wang, X.S.; Pan, J.J.; Shi, Q.; Liao, G.Z.; Xu, C.M. Molecular composition of low-temperature oxidation products of the heavy oil. Pet. Sci. 2023, 20, 3264–3271. [Google Scholar] [CrossRef]
  28. Ma, S.; Li, Y.Y.; Su, R.G.; Wu, J.X.; Xie, L.Y.; Tang, J.S.; Wang, X.S.; Pan, J.J.; Wang, Y.F.; Shi, Q.; et al. Ketones in Low-Temperature Oxidation Products of Crude Oil. Processes 2023, 11, 1664. [Google Scholar] [CrossRef]
Figure 1. GC–MS chromatograms of the crude oil. (a) Total ion chromatogram; (b) Mass chromatogram of m/z 85,191.
Processes 12 01320 g001
Figure 2. Total yields of solid and liquid product of the thermal reactions.
Processes 12 01320 g002
Figure 3. GC–MS total ion chromatograms of thermal reaction products.
Processes 12 01320 g003
Figure 4. Scatter plots of DBE as a function of carbon number for hydrocarbons (CH), carbazoles (N1), and carboxylic acids (O2) in crude oil and their thermal reaction products at 350 °C, 450 °C, 500 °C, and 600 °C by Orbitrap MS.
Processes 12 01320 g004
Figure 5. GC–MS total ion chromatogram of fire-flooding oil sample.
Processes 12 01320 g005
Table 1. Yields and SARA of thermal reaction products.
SamplesSaturates
(wt%)
Aromatics
(wt%)
Resins
(wt%)
Asphaltenes
(wt%)
Residue Oils
(wt%)
Cokes
(wt%)
Crude oil32.1421.7143.013.15--
Products at 200 °C24.438.9551.3215.3084.50
Products at 250 °C23.438.9640.0327.5983.50.6
Products at 300 °C14.1410.5755.348.1559.22.3
Products at 350 °C53.4813.5924.558.3853.95.7
Products at 400 °C36.4010.5644.788.2653.19.3
Products at 450 °C46.6114.0424.4814.8722.914.2
Products at 500 °C2.447.668.3281.578.213.9
Table 2. Peak area ratios of thermal reaction products obtained at different temperatures.
Temperature (°C)Crude Oil200250300350400450500550600
Peak area ratios (C21/bisnorhopane)0.0140.0510.0820.161.66.50.910.190.220.01
Peak area ratios (naphthalene/bisnorhopane)0.0470.0630.0700.440.790.530.321144300
Disclaimer/Publisher’s Note: The statements, opinions and data contained in all publications are solely those of the individual author(s) and contributor(s) and not of MDPI and/or the editor(s). MDPI and/or the editor(s) disclaim responsibility for any injury to people or property resulting from any ideas, methods, instructions or products referred to in the content.

