Article

Investigation of Cavitation Flow and Entropy Production Characteristics in a Dual-Rotor Turbine Flowmeter

1
School of Energy and Power Engineering, Jiangsu University of Science and Technology, Zhenjiang 212100, China
2
Beijing Power Machinery Institute, Beijing 100074, China
3
Ningbo Dooya Mechanic and Electronic Technology Co., Ltd., Ningbo 315100, China
*
Author to whom correspondence should be addressed.
Processes 2024, 12(7), 1329; https://doi.org/10.3390/pr12071329
Submission received: 29 May 2024 / Revised: 17 June 2024 / Accepted: 24 June 2024 / Published: 26 June 2024
(This article belongs to the Special Issue New Research on Oil and Gas Equipment and Technology)

Abstract

:
Flow meters are extensively utilized in fields such as chemical engineering, petroleum, and aerospace, and are an indispensable component of modern industry. This paper examines the metrological properties of a dual-rotor turbine flow meter within its measurable flow range through experimental approaches and investigates the cavitation flow dynamics within the flow meter using numerical methods. First, the flow characteristics curve of the dual-rotor turbine flow meter was established experimentally, and the accuracy of numerical simulation results was validated. Secondly, the transient characteristics of the cavitation cavity were revealed using the Z-G-B cavitation model and dynamic mesh technology. Finally, entropy production theory was applied to investigate the energy losses caused by cavitation, analyzing the contributions of different types of energy losses during the cavitation process. Flow calibration experiments and numerical simulations reveal an increase in the meter coefficient of the dual-rotor turbine flow meter in high-flow cavitation zones, indicating that the displayed flow rate is slightly higher during cavitation compared to non-cavitating flows. Transient cavitation flow undergoes three stages: attachment, development, and collapse. At 323 K, the volume fractions of upstream and downstream cavities increase by 38.9% and 48.3%, respectively, with the cavitation cycle duration being 1.21 times that at 298 K. At 343 K, these increases are 75.3% and 239.2%, with the cycle duration being 2.63 times that at 298 K. Among the various sources of loss, the contribution from losses due to pulsating velocity gradients is the most significant, with maximum proportions of 81.95%, 85.1%, and 87.11% at 298 K, 323 K, and 343 K, respectively.

1. Introduction

The dual-rotor turbine flowmeter is a high-precision measuring instrument. Compared with the traditional turbine flowmeter, the dual-rotor turbine flowmeter has higher environmental adaptability and wider measurement range. Therefore, the dual-rotor turbine flowmeter can be widely used in industrial production, and can meet the measurement needs of oil, low temperature liquid, organic liquid, liquefied gas and natural gas in the process of mining and transportation. And because of the insensitivity of dual-turbine flowmeter to flow medium, it has been widely used in the fuel metering system of aero-engine. Under various complex working conditions, the dramatic change of the measuring medium will lead to the cavitation phenomenon in the dual-rotor turbine flowmeter. Cavitation on the solid surface causes damage to the rotor blades, which affects the measurement accuracy and threatens the normal operation of the equipment. Therefore, it is of great theoretical and practical significance to study the cavitation phenomenon in the double-rotor turbine flowmeter to ensure the reliability and accuracy of the dual-rotor turbine flowmeter in a complex environment.
In the research of dual-rotor turbine flow meters, the rotor response, combined with visualization experiments and unsteady simulations, was investigated by Ren et al. [1,2]. Their research showed that the downstream rotor speed compensates for speed calculation, reducing measurement instability of the upstream rotor. Additionally, it was found that the primary source of pressure pulsation inside the dual-rotor turbine flow meter is due to dynamic-static interference. In the field of cavitation flow, many scholars have conducted in-depth investigations through a combination of visualization experiments and numerical simulations over the past few decades. Flow patterns and structures of attached cavitation and vortex cavitation under different conditions were studied by combining visualization with quantitative information [3]. Through visual experiments and numerical simulations, the rotating cavitation flow induced by blade cracking in a high-speed centrifugal pump was investigated, and the influence of inlet blade angle on cavitation performance was evaluated [4,5]. It was found that a positive inlet blade angle improves cavitation performance, while a negative angle suppresses it. Similarly, a positive inlet guide vane angle improves cavitation performance, whereas a negative angle suppresses it. Peng’s [6] research shows that the strong adverse pressure gradient in the stagnation region at the downstream end of the attached cavity forces re-entrant flows into the vapor structure with a radially-diverging re-entrant jet and a pair of side-entrant jets, causing cavity shedding.
Due to the limitations of experimental measurements and advancements in computational fluid dynamics techniques, numerical simulations are increasingly being applied to investigate cavitating flow around hydrofoils. In recent years, numerous significant studies based on numerical models such as the Reynolds-averaged Navier–Stokes (RANS), partially averaged Navier–Stokes (PANS), large eddy simulation (LES), and direct numerical simulation (DNS) frameworks have explored the interactions between cavitation, vortices, and turbulence. For instance, by coupling the k-ω SST turbulence model with the homogeneous cavitation model, researchers have effectively simulated cavitation turbulence around propellers behind hulls [7]. Another study employed the shear stress transport (k-ω SST) turbulence model coupled with the Zwart-Gerber-Belamri (ZGB) cavitation model to simulate cavitation flow around a ship’s propeller in a non-uniform wake, yielding cavity evolution predictions that aligned well with experimental results [8]. Vorticity was primarily distributed in the cavitation region and behind the propeller, with unsteady cavitation and side-jet flow promoting local vorticity production and flow instability [9]. These studies have identified a relationship between vortices and cavitation formation. An enhanced single-component multiphase lattice Boltzmann method has also been employed to simulate complex cavitation phenomena [10]. Numerical simulations using the Large Eddy Simulation (LES) method have explored the unsteady cavitation flow around the NACA 0009 hydrofoil, revealing intricate details of bubble dynamics and vortex formation [11]. These simulations demonstrated how the suction-side bubble grows and squeezes the giant pressure bubble away from the trailing edge. After detachment, a new counterclockwise vortex or bubble appears at the pressure side, lifting the ridge towards the suction trailing edge and generating a strong vortex eye that pinches off the trailing portion of the suction-side bubble. The interaction mechanisms between cavitation, vortices, and turbulence were further investigated through numerical simulations, demonstrating the evolution of cavitation flow in three stages [12]. The Liutex method was used to capture vortex structures, while entropy transport analysis revealed that cavitation promoted vortex production and increased entropy with cavity instability. The vortex structures transitioned from vortex tubes to U-shaped, Ω-shaped, and streamwise vortices. Cavitation also facilitated the production, diffusion, and dissipation of turbulent kinetic energy. Movahedian [13] used LES combined with the Volume of Fluid (VOF) method to study unsteady cavitation-turbulence flow around three-dimensional twisted hydrofoils under different cavitation numbers. These studies have provided significant theoretical and experimental foundations for understanding and addressing cavitation phenomena [14,15,16,17,18]. In addition, some researchers have employed entropy production analysis to study cavitation flow from the perspective of energy loss [19,20,21]. Entropy production is a measure to describe the irreversible process in the system. In the process of cavitation, entropy production can be used to measure the energy dissipation and irreversibility during the formation and collapse of cavitation bubbles. The mechanism of entropy production in the process of flow around the cavitation hydrofoil is studied, and the interaction between vorticity and local entropy production rate is analyzed [22]. The entropy production theory was used to obtain the detailed distribution of hydraulic losses in the pump, and the hysteresis characteristics of hydraulic losses in the surge zone were analyzed by the entropy production analysis method [23]. Numerous studies have shown that the entropy production method can be used as a viable method to evaluate flow losses.
Although there has been substantial research on cavitation through experiments and numerical simulations, research on cavitation flow within the internal flow field of dual-rotor turbine flowmeters remains limited. The published literature on dual-rotor flowmeters is scarce and primarily involves comparisons with calibrated flow rates through experiments and investigations into their flow characteristics using numerical simulation methods. This leaves a gap in the research on internal cavitation flow. Therefore, this paper aims to validate the feasibility of numerical simulation methods by experimentally constructing the meter coefficient characteristic curve of the dual-rotor turbine flowmeter. Subsequently, cavitation flow numerical simulations based on the Z-G-B cavitation model will be conducted to analyze cavitation flow phenomena and energy losses in the dual-rotor turbine flowmeter, providing a basis for the range design of the dual-rotor turbine flowmeter.

2. Numeric Simulation Scheme

2.1. Geometry Description

A dual-rotor turbine flow meter is a type of velocity flow meter that measures fluid flow velocity by tracking the rotational speed of a turbine within the fluid. This rotational speed is then used to calculate the volumetric flow rate. As fluid flows through the meter, it exerts torque on the internal rotor blades, causing them to rotate. These rotor blades generate pulses that are proportional to the flow rate as they move through a radio frequency field created by a sensor. Each pulse is transmitted to the meter’s electronic device, which amplifies the pulse output and provides the volumetric flow rate. The internal structure of a dual-rotor turbine flow meter typically includes guide vanes, baffles, rotors, and a shaft, as illustrated in Figure 1. These components work together to ensure accurate measurement and efficient operation of the flow meter.

2.2. Governing Equations

2.2.1. Fundamental Governing Equation

Cavitation flow is a multiphase flow problem. Currently, most numerical models of cavitation flow use a homogeneous flow model. The fundamental governing equations of a homogeneous flow model are as follows:
For the continuity equation:
ρ m t + ( ρ m U j ) x j = 0
( ρ m U i ) t + ( ρ m U j U j ) x j = P x i + x j [ ( μ m + μ t u r ) ( U i x j + U j x i 2 3 U k x k δ i j ) ]
t ( ρ m ( h + f v L e v ) ) + x j ( ρ m U j ( h + f v L e v ) ) = x j [ ( μ m Pr l a m + μ t u r Pr t u r ) h x j ]
ρ l α l t + ρ l α l U j x j = m
μ e f f = μ m + μ t u r
m ˙ = m ˙ + + m ˙
ρ m = ρ l ( 1 α v ) + ρ v α
μ m = μ l ( 1 α v ) + μ v α
where ρ, u, and P represent density, velocity, and pressure, respectively; v, l, and m denote vapor phase, liquid phase, and mixed phase, respectively; f, μ, and h indicate mass fraction, viscosity, and enthalpy, respectively; Prlam is the laminar Prandtl number, and Prtur is the turbulent Prandtl number. m ˙ represents mass transfer during the gas-liquid phase transition, with the superscript + and − symbols representing condensation and evaporation in the phase change process. The subscripts ( i , j ) are used to indicate direction.

2.2.2. Cavitation Model

In this study, to resolve the basic governing equations, the SST turbulence model was selected, which combines the advantages of standard near the wall and in the main flow domain. For numerical simulation of cavitation flow, the ZGB cavitation model was selected. The expressions for the evaporation source term and the condensation source term are presents in Equations (9) and (10).
m + = C E v a p 3 α n u c ( 1 α v ) ρ v R B 2 3 ( p v p ) ρ l
m = C C o n d 3 α v ρ v R B 2 3 ( p p v ) ρ l
where RB = 1 × 10⁻⁶, αnuc = 5 × 10⁻⁴ is the volume fraction of non-condensing gas [20], CEvap and CCond are the evaporation and condensation source terms constants, respectively. For the simulation of water, 50 and 0.01 were set for the evaporation.

2.2.3. Entropy Production Theory

The formation and collapse of cavities result in energy dissipation, influencing the conversion of kinetic energy to mechanical energy in the dual-rotor turbine flowmeter. Hence, entropy production analysis allows for a quantitative assessment of energy losses in cavitation flow and the spatial distribution of these losses.
In the cavitation flow within the dual-rotor turbine flowmeter, we make the assumption that the temperature remains constant. The rate of entropy production [24] is defined as follows:
S ˙ = Φ T
In transient turbulent calculations, the production of entropy is caused by the dissipation induced by mean velocity and velocity fluctuations. The viscous dissipation coefficient can be expanded by velocity components and mixed viscosity. For incompressible flow, the mean velocity entropy production rate and the fluctuating velocity entropy production rate are defined as follows:
S ˙ D ¯ = μ m T [ ( u ¯ 2 x 1 + u ¯ 1 x 2 ) 2 + ( u ¯ 3 x 1 + u ¯ 1 x 3 ) 2 + ( u ¯ 2 x 3 + u ¯ 3 x 2 ) 2 ] 2 3 μ m T [ m ( 1 ρ l 1 ρ v ) 2 ] + 2 μ m T [ ( u ¯ 1 x 1 ) 2 + ( u ¯ 2 x 2 ) 2 + ( u ¯ 3 x 3 ) 2 ]
As fluctuating velocities are not directly measurable, researchers have related the entropy production rate induced by turbulent velocity fluctuations to the ε or ω terms in turbulent models.
In this paper, the SST k-ω turbulent model is employed, and the entropy production rate due to turbulent dissipation caused by fluctuating velocity gradients can be expressed as follows [25]:
S ˙ D = β ρ m k ω T
where is turbulent kinetic energy, and ω signifies the specific dissipation rate of turbulent kinetic energy.
For the dual-rotor turbine flowmeter, the impact of wall entropy production cannot be ignored. Therefore, wall entropy production is defined as.
S w = τ w μ p T
where is the wall shear stress, and signifies the average velocity of the fluid at the center of the first computational cell adjacent to the wall.
The entropy production of each part can be obtained by integrating the entropy production rate, thus the total entropy production (or energy loss) can be expressed as.
I = I D ¯ + I D + I w = V S D ¯ d v d t + V S D d v d t + w S w d a d
Among these, the energy loss caused by velocity gradient is I D = I D ¯ + I D .

2.3. Model Validation

In order to verify the cavitation model, Under the condition of the same cavitation number and incident angle, the pressure distribution in the cavitation process at the three temperatures is shown in the Figure 2a, which shows the comparison between the cavitation experiment and the numerical simulation conducted on the NACA 0015 hydrofoil. In general, the pressure coefficient obtained by the numerical simulation is basically consistent with that measured by the experiment. Among them, the error is larger at 343 K, Cervone [26] explained that at higher temperatures, the absorption of latent heat at the cavity interface increases, which reduces the vapor pressure below the unperturbed saturation value.
The number of grids is crucial for accurate numerical calculation results. For the grid independence test in the dual-rotor flowmeter calculations, five sets of grids were applied. When the number of grid cells increased to 3.58 million, the error range of the simulation results was within 1%, as illustrated in Figure 2b. Consequently, the scheme with 4.69 million grid cells was selected. The quality indicators for these grids are all above 0.7, satisfying the requirements for turbulent model calculations. The final grid configuration is depicted in Figure 3.

2.4. CFD Simulation Method

Typically, the blades of rotating machinery operate at a fixed speed, and during simulations, the accuracy of the rotational speed at current flow rates is determined by comparing the torque exerted on the blades. In this study, a User Defined Function (UDF) program was developed to achieve the actual scenario of rotor free rotation under fluid scouring. The CFD simulation model can only calculate fluid forces, so the forces generated by the turbine’s mechanical structure must be incorporated into the dynamic simulation through the UDF model.
The entire simulation process is depicted in Figure 4. The dynamic simulation of the rotor freely rotating under water flow impact was implemented using UDF programming. The specific steps are as follows: (1) Based on the simulation results, obtain the driving torque and viscous resistance torque acting on the turbine. (2) Calculate the resultant torque on the turbine and determine the current rotational speed. (3) Calculate the combined torque of the rotor’s next driving torque and viscous resistance moment, and calculate the increase of the combined torque.

3. Experimental Apparatus and Procedures

Flowmeter calibration is primarily conducted using methods such as the mass method, volume method, and volumetric tube method. Among these, volumetric tube flow calibration devices are commonly employed. The working principle is illustrated in Figure 5. Before flow verification, valves 1 and 2 are opened, while valve 3 is closed. A servo motor drives the piston to move within the active volume tube, generating a standard flow source. The liquid flows through valve 1, passes through the flowmeter under calibration, and finally enters the tank. The volumetric flow rate is determined by multiplying the piston’s travel distance, measured by the grating, by the piston’s cross-sectional area, and dividing by the operating time. Flowmeter calibration is achieved by comparing the indicated value of the flowmeter under calibration with the standard volumetric flow rate measured by the volumetric tube. And the experimental fluid can be heated by installing a heater in the water tank to achieve the purpose of controlling the fluid temperature
In the flow meter calibration experiment, in order to reduce the random error of a single measurement, the method of taking the average of multiple measurements is adopted. The calibration accuracy of the volume tube flowmeter can generally reach between ±0.1% and ±0.5%. The high precision Hall effect speed sensor SNDH-H3L-G01 from Honeywell was used to measure the speed of the turbine, and the measurement accuracy of the sensor was up to ±1.14%
The flowmeter coefficient is defined as:
K = 0.5 × ( f u p + f d o w n ) / Q × 3600
where fup is the upstream rotor output frequency, fdown is the upstream rotor output frequency, Q is the volumetric flow rate.
After multiple measurements, the average values at each flow rate point are taken as the final data for comparison with numerical simulation results, as illustrated in Figure 6. The comparison includes both the measured data and the numerical simulation results of the meter coefficients for the upstream and downstream rotors, with errors between the measured data and numerical simulation results remaining within 5%.
When the measured fluid flow rate exceeds qvm (the minimum flow rate at which the fluid overcomes the bearing’s static friction torque), the curve initially exhibits a nonlinear “camelback” shape. This is caused by the transition of the boundary layer behind the rotor blades from laminar to turbulent flow. Subsequently, the curve passes through a broad linear region known as the high-precision zone. Finally, it enters the cavitation region, where the internal flow field of the flow meter undergoes drastic changes, marking the upper measurement limit of the flow meter.

4. Result and Discussion

4.1. Cavitation Flow Anslysis

To study the interaction mechanism between cavitation and vortex-turbulence in a dual-rotor flowmeter, a parameterization study was conducted. The simulation results illustrate the dynamic evolution of cavitation.
As shown in Figure 7, from the pressure distribution, there is a lower pressure area in the downstream transition region. With the development of the cavity, the pressure distribution in this region changes periodically. With the evolution of cavitation inside the dual-rotor turbine flowmeter, the volume of the lower pressure zone in the downstream transition region first increases and then decreases, and the pressure value first decreases and then increases. At T0 + 2.75 ms, the volume of the cavity is the largest and the pressure of the downstream transition section is the lowest. As the cavity collapses, the pressure in this region increases.
As shown in Figure 8, the development of the flow meter cavity within a cycle can be clearly monitored through numerical simulation. At T0, the cavity is formed initially, appearing in the upstream and downstream rotor blades, downstream transition region, downstream support region. The volume of the downstream rotor domain cavity is larger than that of the upstream rotor domain. From T0 + 0.5 ms to T0 + 2.75 ms, the cavity entered the development stage, which showed that the void volume in the upstream and downstream rotor domain, the downstream transition region and the downstream support region increased significantly. Between T0 + 2.75 ms and T0 + 4.25 ms, the cavity continues to collapse. In a dual-rotor turbine flowmeter, the higher speed rotation of the rotor causes the pressure on the the rotor blade domain suction side to drop, and cavitation is easy to occur. In addition, the cavities shed from the upstream rotor domain were reattached to the downstream rotor domain, resulting in a significantly larger volume of cavities on the downstream rotor domain than the upstream rotor domain.
Cavitating flow exhibits significant unsteady and quasi-periodic characteristics, specifically reflected in variations in pressure, temperature, and vapor volume fraction. Essentially, cavitation involves phase changes between liquid and vapor, leading to instabilities in pressure and temperature fields and subsequently causing hydraulic losses. Figure 9 shows the unfolded diagram of the overall blades of the dual-rotor turbine flowmeter.
Figure 10 depicts the cavitation movement of the upstream and downstream rotor domain under a cavitation cycle, where the size of the cavitation is shown by water vapor volume fraction, and water vapor volume fraction represents the proportion of the gas phase in a certain volume. By using the vapor volume fraction, the development of the cavity inside the fluid can be visually observed and analyzed. The cavitation cycle can be divided into three stages. From T0 to T0 + 1 ms, the cavitation begins to appear and grows, and the volume of the cavitation on the downstream rotor domain is much larger than that on the upstream rotor domain. From T0 + 1 ms to T0 + 2.75 ms, the volume of cavitation on the upstream and downstream rotor domain continued to grow, and reached the maximum value at T0 + 2.75 ms. From T0 + 2.75 ms to T0 + 4.2 ms, the cavitation on the upstream and downstream rotor domain begins to collapse until it collapses.
Figure 10 also shows the vorticity and turbulence in the fluid domain of the upstream and downstream rotor domain during a cavitation cycle. The vorticity in the flow field is represented by magnitude vorticity, which describes the rotational strength of a point in the flow field and can be used to judge the rotational motion in the fluid. magnitude vorticity indicates the more intense the rotation; turbulent conditions are represented by turbulent kinetic energy, which can quantify the intensity of fluid velocity fluctuations, and higher TKE values indicate larger velocity fluctuations and more intense turbulent activity. At time T0, which marks the beginning of a new cavitation cycle, significant vorticity and turbulent kinetic energy still exist on the surface of the up-down swimming blades. With the development of cavitation, between T0 + 0.5 and T0 + 2.75 ms, the attached sheet cavitation develops downstream along the surface of the upstream and downstream rotor domain, and the vorticity and turbulent kinetic energy increase. With the further development of cavitation, the closed zone becomes more and more unstable, the cavitation begins to collapse, and the intensity of vorticity and turbulent kinetic energy gradually increases. The high value zone is mainly located at the cavitation interface, especially the area behind the cavity.
The results show that the locations of high vorticity and high turbulent kinetic energy are highly consistent, and the high vorticity region is accompanied by high turbulent kinetic energy, especially in the case of vortex fragmentation and strong turbulent excitation. And its evolution is closely related to the cavitation motion, the vorticity and turbulent kinetic energy mainly appear in the rear of the cavitation, and the high vorticity and high turbulent kinetic energy regions appear in the cavitation collapse.
The evolution characteristics of cavitation were studied under inflow temperatures ranging from 298 K to 343 K. Figure 11a shows the instrument coefficients of dual-rotor turbine flowmeters obtained by experiments and numerical simulations at different temperatures. In general, the instrument coefficient of the dual-rotor turbine flowmeter under experiment and numerical simulation decreases with the decrease of temperature, and the instrument coefficient of the dual-rotor turbine flowmeter under numerical simulation is slightly larger than that under experiment. Figure 11b illustrates the volume fractions of attached cavitation on the upstream and downstream rotor blades of the dual-rotor turbine flow meter. At an inflow temperature of 343 K, the maximum volume fraction of attached cavitation on the upstream rotor blade is 0.0044, while on the downstream rotor blade, it is 0.0285, with a cavitation cycle of 9.2 ms. At an inflow temperature of 323 K, the maximum volume fraction of attached cavitation on the upstream rotor blade is 0.0056, and on the downstream rotor blade, it is 0.0425, with a cavitation cycle of 4.25 ms. At an inflow temperature of 298 K, the maximum volume fraction of attached cavitation on the upstream rotor blade is 0.0069, and on the downstream rotor blade, it is 0.0905, with a cavitation cycle of 3.5 ms. As the temperature increases, the volume fractions of cavitation at an inflow temperature of 323 K increase by 38.9% and 48.3% for the upstream and downstream cavities, respectively, with a cavitation cycle 1.21 times that at 298 K. At an inflow temperature of 343 K, these increases are 75.3% and 239.2%, with a cavitation cycle 2.63 times that at 298 K.
At the maximum flow rate of the flow meter, the volume of attached cavitation on the upstream and downstream rotor blades of the dual-rotor turbine flow meter increases with temperature, while the cavitation cycle lengthens with rising inflow temperature. Moreover, the meter coefficient decreases as the temperature increases. These findings confirm that cavitating flow affects the accuracy of the dual-rotor turbine flow meter, indicating that the displayed flow rate will be slightly higher under cavitating conditions compared to non-cavitating conditions.

4.2. Entropy Production Analysis

To further investigate the evolution mechanisms of five different entropy production rates, Figure 12 illustrates the evolution of relative entropy production rates (EPRr) in the quasi-period, focusing on direct dissipation, turbulent dissipation, and the upstream and downstream rotor domains. Figure 13 depicts the variation of different types of entropy production rates in the in-terior of a dual-rotor turbine flowmeter over time at different inlet temperatures. Figure 14 depicts the relative total entropy production rate (TEPRr). This paper introduces a dimensionless parameter, the relative entropy production rate (EPRr), derived from Equation (17), to directly evaluate the variations in entropy production rates (EPR).
E P R r = E P R T E P R
Figure 12 illustrates the total entropy production rate (TEPR) within the dual-rotor flowmeter over the cavitation cycle at different incoming flow temperatures. The TEPR decreases as the incoming flow temperature increases. At an incoming flow temperature of 298 K, the maximum TEPR is 18.13 W, occurring at T0 + 2.75 ms. At 323 K, the maximum TEPR is 16.53 W, occurring at T0 + 3.54 ms. At 343 K, the maximum TEPR is 15.38 W, occurring at T0 + 6.29 ms. A peak TEPR value is observed at different incoming flow temperatures within one cavitation cycle. When compared with the cavitation volume fraction shown in Figure 11a, the peak TEPR appears slightly after the peak cavitation volume fraction. This indicates that as cavities collapse, the TEPR inside the dual-rotor flowmeter continuously increases until it reaches its peak.
Figure 13 depicts the variation of different types of entropy production rates in the interior of a dual-rotor turbine flowmeter over time at different inlet temperatures. Figure 13a–c show the entropy Entropy production rate by turbulent dissipation rate of turbulent dissipation, direct dissipation and wall entropy, respectively. In general, the three types of entropy production at different inlet temperatures have the same development trend in a cavitation cycle. The entropy production rate of turbulent dissipation caused by fluctuating flow velocity gradient shows a wave peak at the time of cavitation collapse, and the entropy production rate of direct dissipation and wall dissipation caused by average velocity gradient shows a wave peak at the time of cavitation collapse. And with the increase of inlet water temperature, the proportion of turbulent dissipation entropy production rate (EPTDr) caused by fluctuating flow velocity gradient increases, while the proportion of the other two losses decreases. Among all kinds of losses, the proportion of turbulent dissipation entropy production rate (EPTDr) caused by the fluctuation velocity gradient is the largest. When the inlet temperature is 298 K, the maximum proportion of turbulent dissipation entropy production rate caused by the fluctuation velocity gradient is 81.95%. At 323 K, this ratio increases to 85.1%. At 343 K, it is further increased to 87.11%. It indicates that the entropy production rate of turbulent dissipation increases with the collapse of the cavitation, and the collapse of the cavitation is the main factor of energy dissipation.
Figure 14 shows the evolution of the total entropy production rate (TEPR) for a cavitation cycle when the inlet and outlet medium temperature is 323 K. Initially, high TEPR is observed in the inlet region of both upstream and downstream rotor blades. With the development of cavities attached to the rotor blade surface, high TEPR appears at the interface of and behind these cavities. In addition, by comparing the vorticity and turbulent kinetic energy in Figure 10, it is found that the position of TEPR is highly consistent with that of vorticity and turbulent kinetic energy, and the time of high TEPR is the time when the cavitation begins to collapse. It shows that during the collapse of the cavity, shock waves and strong pressure fluctuations are generated in the fluid and these rapid pressure changes lead to dissipation of energy.

5. Conclusions

This study utilized both experimental and simulation approaches to investigate the behavior of a dual-rotor turbine flowmeter, particularly focusing on the impact of cavitation. The key findings are as follows:
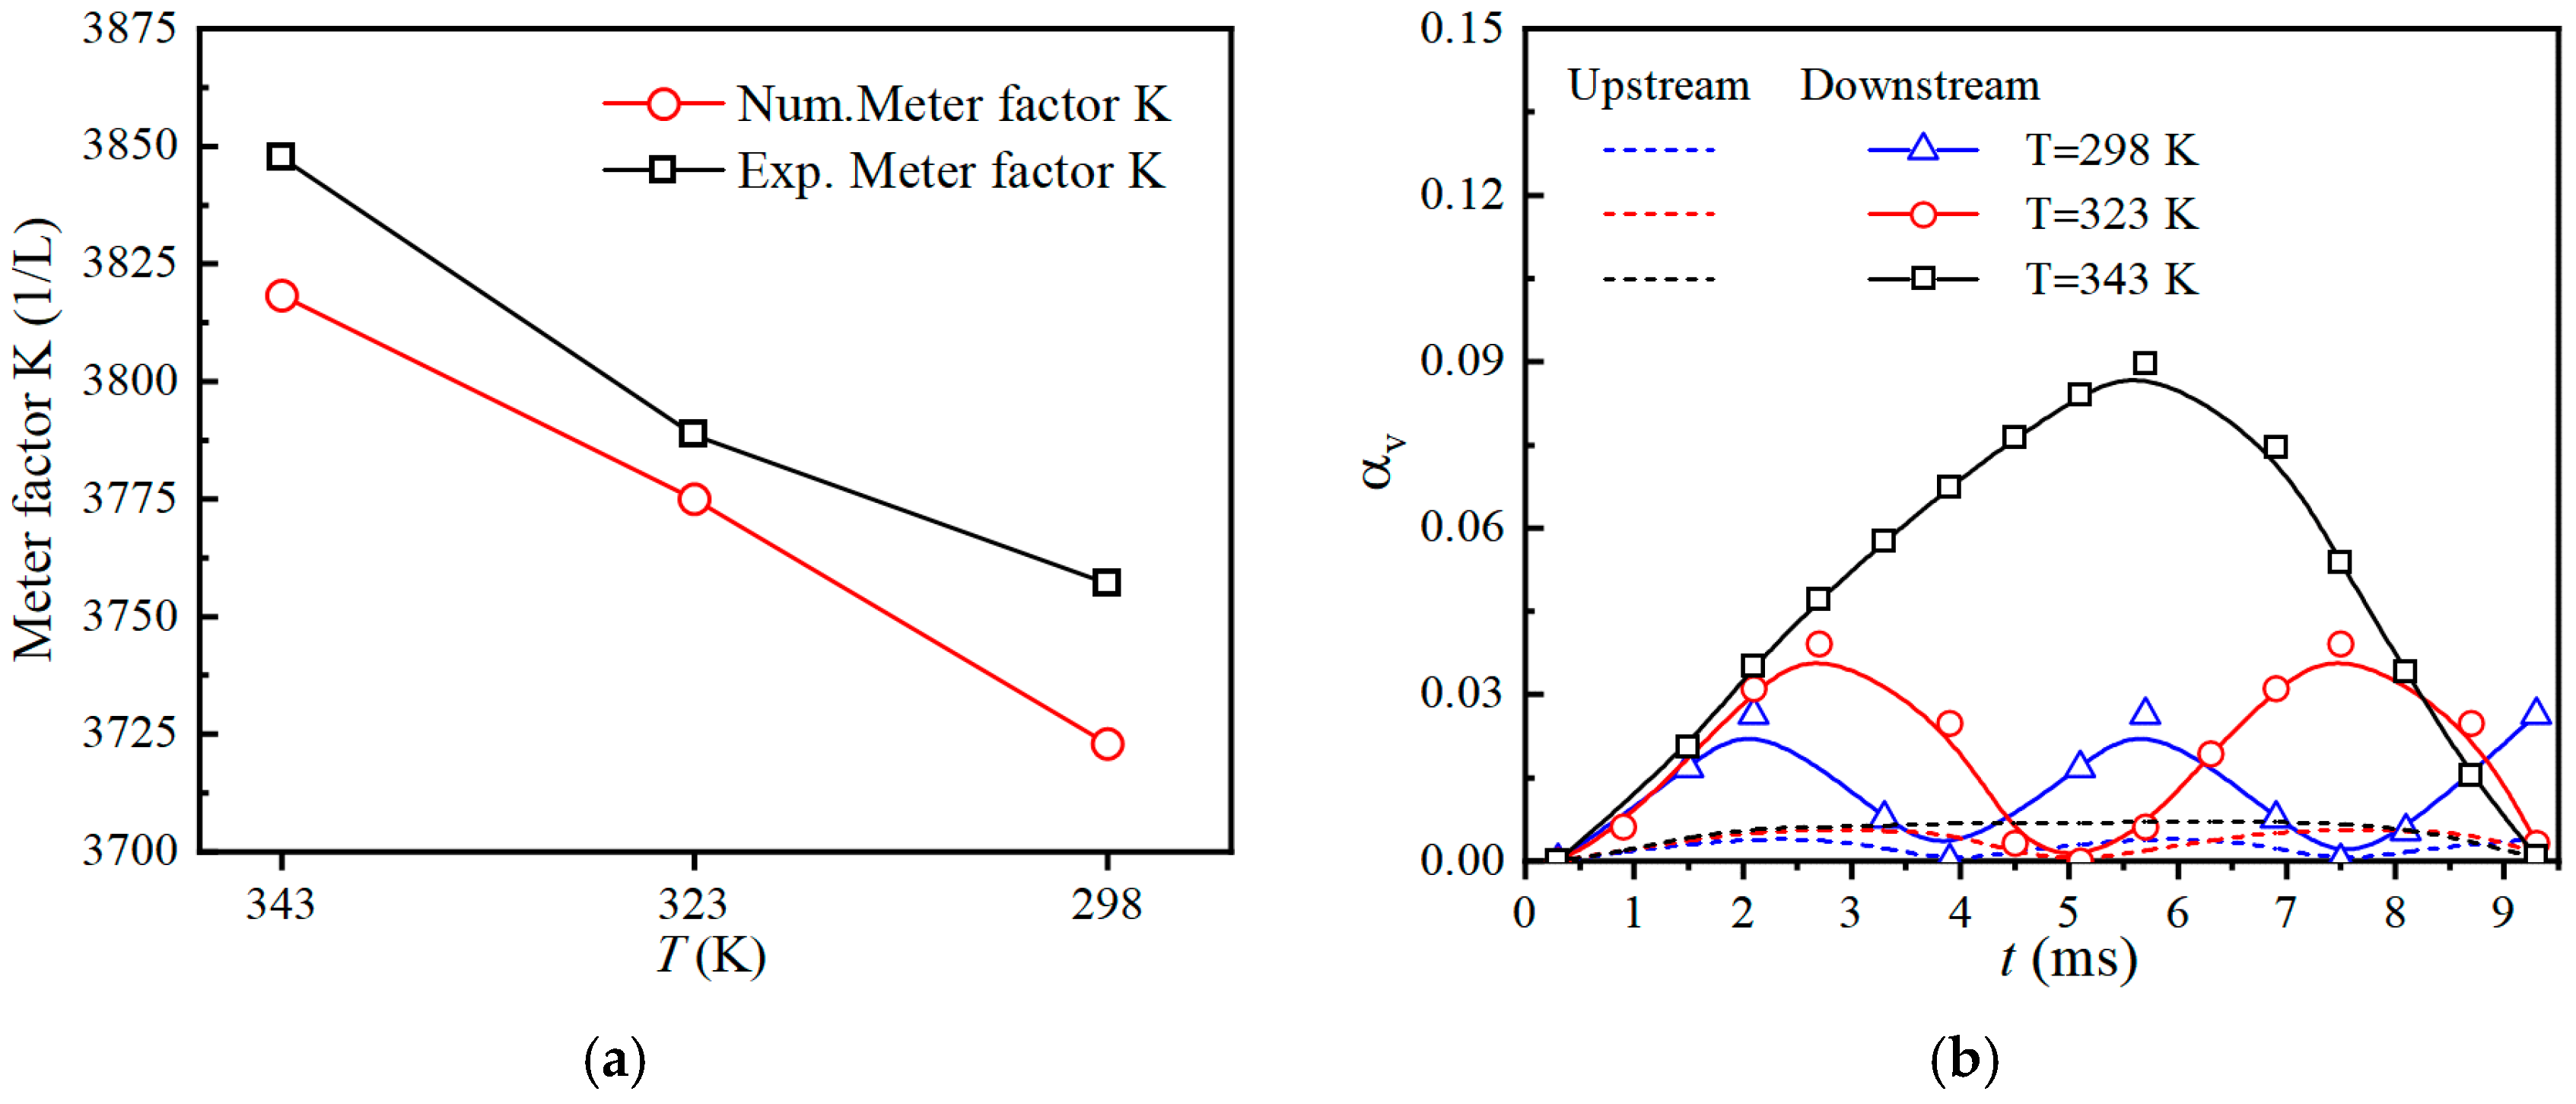
  • The meter factor of the dual-rotor turbine flowmeter increases at high flow points, which corresponds with the onset of cavitation. At maximum flow rates, the volume of attached cavities on both the upstream and downstream rotor blades increases with temperature, extending the cavitation cycle duration. However, the meter coefficient decreases with rising temperature, underscoring the influence of cavitation on the accuracy of the flowmeter. This phenomenon suggests that the displayed flow rate in cavitating conditions will be slightly higher than in non-cavitating conditions, with the cavitation region setting the maximum operational range of the flowmeter.
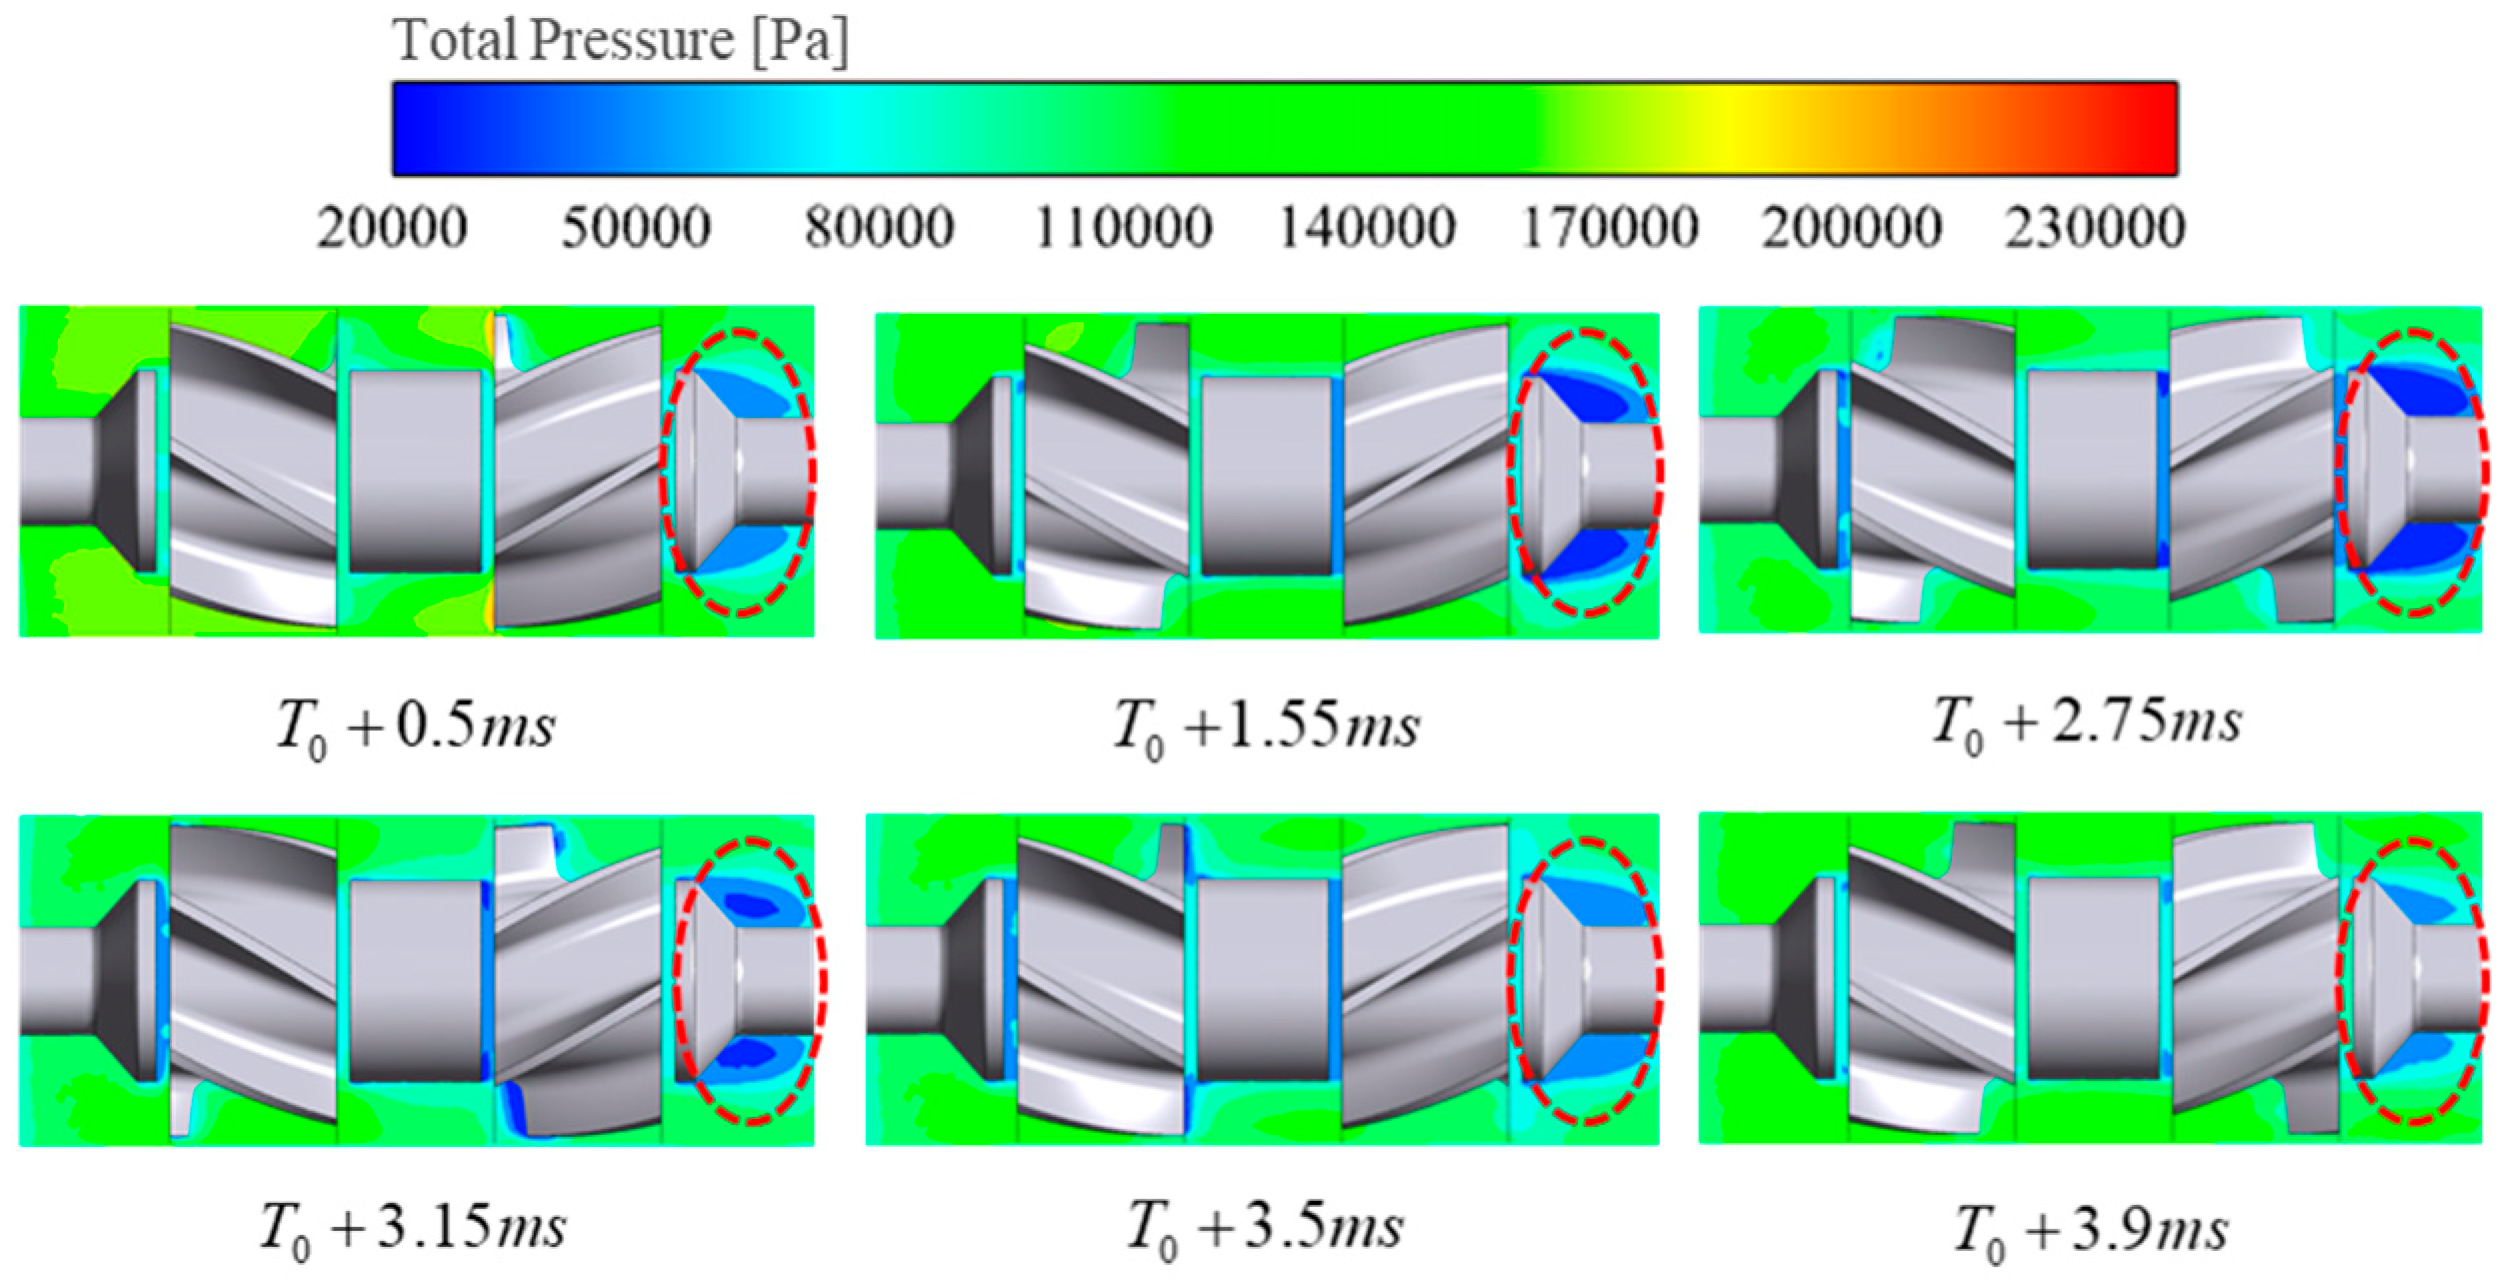
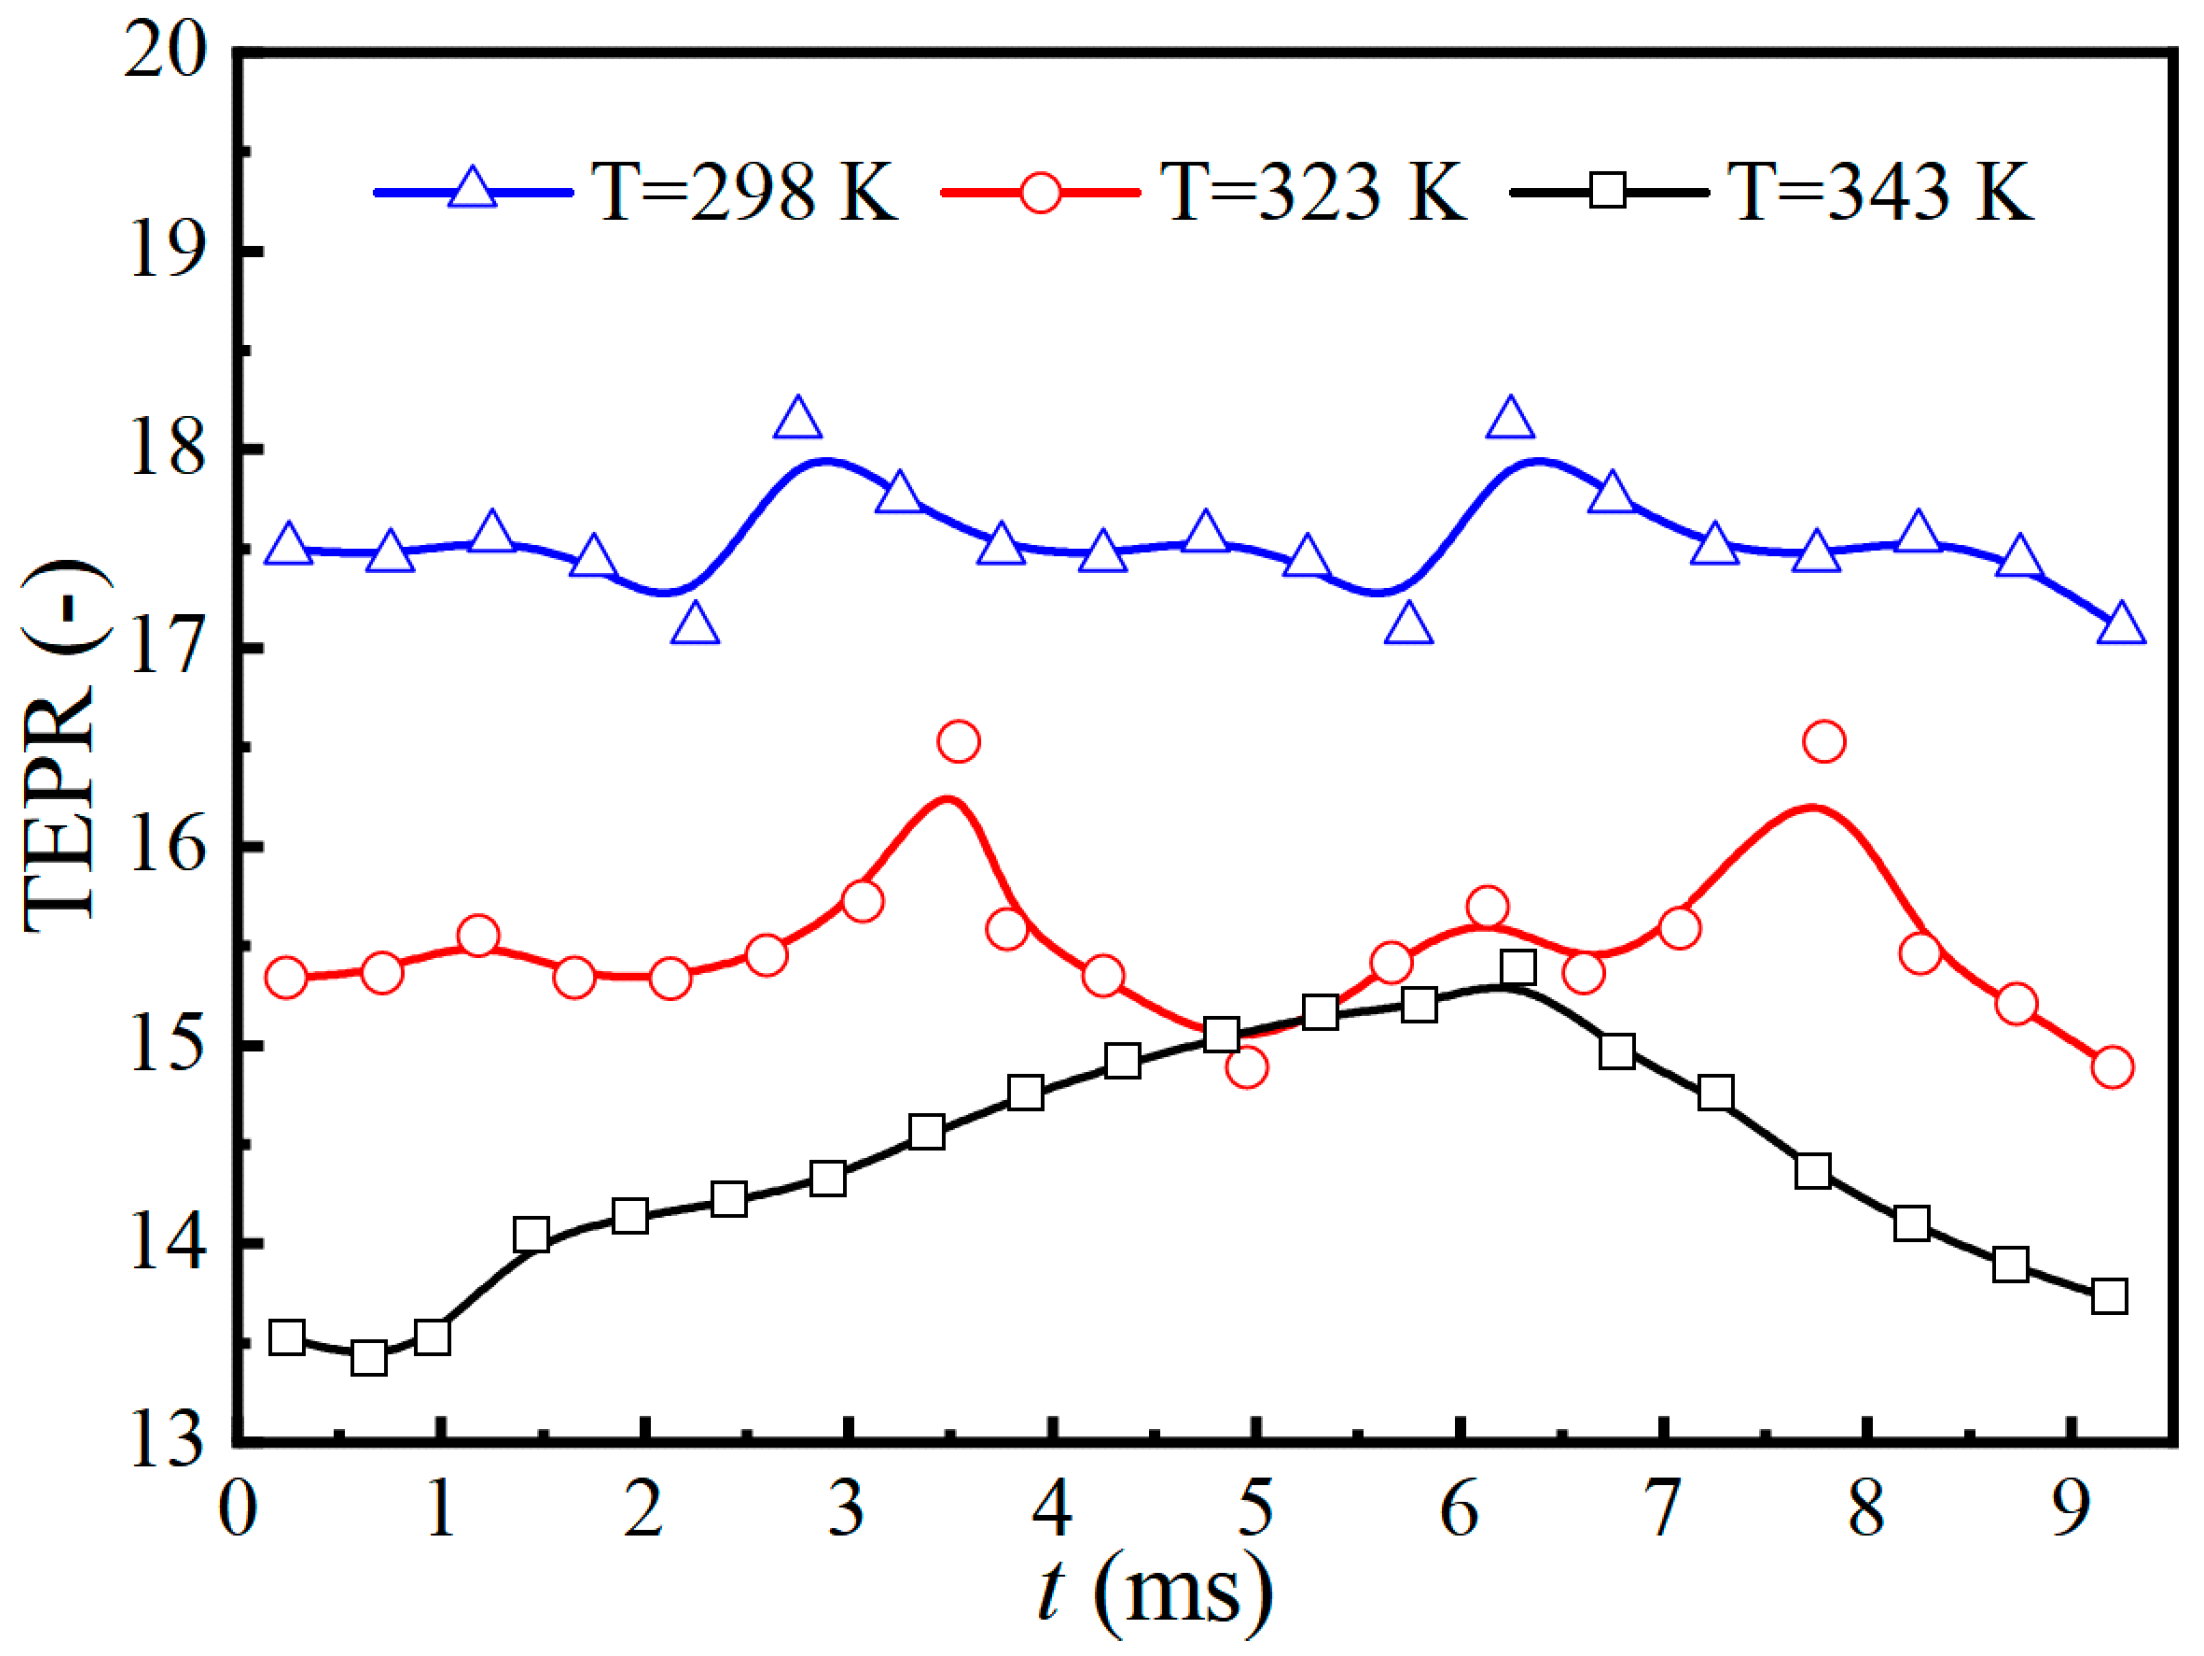
  • The transient evolution of cavitation flow is categorized into three stages: cavity production, development, and collapse. As the inlet water temperature increases, the proportion of energy losses attributed to turbulent dissipation entropy production rate (EPTD) induced by fluctuating velocity gradients also increases, while the proportions of other types of losses decrease. Specifically, EPTD accounts for a maximum proportion of 81.95% at 298 K, 85.1% at 323 K, and 87.11% at 343 K. Losses induced by fluctuating velocity gradients are predominant, followed by wall losses, with losses induced by mean velocity gradients being minimal.
  • Comparative analysis of cavitation motion, vortex development, turbulent kinetic energy evolution, and entropy evolution processes revealed that vortices, turbulent kinetic energy, and entropy primarily appear at the interfaces and rear parts of the attached cavities. This indicates that the instability of cavities leads to increased vorticity, turbulent kinetic energy, and entropy.
In summary, the study confirms that cavitation significantly affects the performance and accuracy of dual-rotor turbine flowmeters. The findings highlight the need to account for cavitation effects in flow measurements to ensure accurate readings, especially under varying temperature conditions.

Author Contributions

Conceptualization, M.C.; Methodology, B.W.; Software, J.L. and Y.H.; Validation, J.L. and B.W.; Investigation, Z.Z.; Writing—original draft, J.L.; Writing—review & editing, H.Z.; Visualization, F.H.; Supervision, H.Z. All authors have read and agreed to the published version of the manuscript.

Funding

This research received no external funding.

Data Availability Statement

The data presented in this study are available on request from the corresponding author.

Conflicts of Interest

Author Bing Wang was employed by the company Ningbo Dooya Mechanic and Electronic Technology Co., Ltd. The remaining authors declare that the research was conducted in the absence of any commercial or financial relationships that could be construed as a potential conflict of interest.

References

  1. Ren, Z.; Zhou, W.; Li, D. Response and flow characteristics of a dual-rotor turbine flowmeter. Flow Meas. Instrum. 2022, 83, 102120. [Google Scholar] [CrossRef]
  2. Ren, Z.; Zhou, W.; Li, D. Investigation on pressure fluctuations of dual-and analogical single-rotor turbine flowmeters. Proc. Inst. Mech. Eng. Part C J. Mech. Eng. Sci. 2022, 236, 7166–7178. [Google Scholar] [CrossRef]
  3. Huang, B.; Qiu, S.-C.; Li, X.-B.; Wu, Q.; Wang, G. A review of transient flow structure and unsteady mechanism of cavitating flow. J. Hydrodyn. 2019, 31, 429–444. [Google Scholar] [CrossRef]
  4. Guo, X.; Zhu, L.; Zhu, Z.; Cui, B.; Li, Y. Numerical and experimental investigations on the cavitation characteristics of a high-speed centrifugal pump with a splitter-blade inducer. J. Mech. Sci. Technol. 2015, 29, 259–267. [Google Scholar] [CrossRef]
  5. Guo, Z.; Pan, J.; Qian, Z.; Ji, B. Experimental and numerical analysis of the unsteady influence of the inlet guide vanes on cavitation performance of an axial pump. Proc. Inst. Mech. Eng. Part C J. Mech. Eng. Sci. 2019, 233, 3816–3826. [Google Scholar] [CrossRef]
  6. Peng, X.; Ji, B.; Cao, Y.; Xu, L.; Zhang, G.; Luo, X.; Long, X. Combined experimental observation and numerical simulation of the cloud cavitation with U-type flow structures on hydrofoils. Int. J. Multiph. Flow 2016, 79, 10–22. [Google Scholar] [CrossRef]
  7. Long, Y.; Long, X.; Ji, B.; Huang, H. Numerical simulations of cavitating turbulent flow around a marine propeller behind the hull with analyses of the vorticity distribution and particle tracks. Ocean Eng. 2019, 189, 106310. [Google Scholar] [CrossRef]
  8. Han, C.; Long, Y.; Bai, X.; Ji, B.J. Numerical investigation of unsteady cavitation flow around E779A propeller in a nonuniform wake with an insight on how cavitation influences vortex. Shock Vib. 2021, 2021, 5577517. [Google Scholar] [CrossRef]
  9. Ji, B.; Luo, X.; Arndt, R.E.; Wu, Y. Numerical simulation of three dimensional cavitation shedding dynamics with special emphasis on cavitation–vortex interaction. Ocean Eng. 2014, 87, 64–77. [Google Scholar] [CrossRef]
  10. Peng, C.; Tian, S.; Li, G.; Sukop, M.C. Simulation of multiple cavitation bubbles interaction with single-component multiphase Lattice Boltzmann method. Int. J. Heat Mass Transf. 2019, 137, 301–317. [Google Scholar] [CrossRef]
  11. Yin, T.-Y.; Pavesi, G.; Pei, J.; Yuan, S.-Q.; Gan, X.-C. Large eddy simulation of cloud cavitation and wake vortex cavitation around a trailing-truncated hydrofoil. J. Hydrodyn. 2022, 34, 893–903. [Google Scholar] [CrossRef]
  12. Tian, B.; Chen, J.; Zhao, X.; Zhang, M.; Huang, B. Numerical analysis of interaction between turbulent structures and transient sheet/cloud cavitation. Phys. Fluids 2022, 34, 047116. [Google Scholar] [CrossRef]
  13. Movahedian, A.; Pasandidehfard, M.; Roohi, E. LES investigation of sheet-cloud cavitation around a 3-D twisted wing with a NACA 16012 hydrofoil. Ocean Eng. 2019, 192, 106547. [Google Scholar] [CrossRef]
  14. Ren, Z.; Li, D.; Wang, C.; Wang, H.; Liu, J.; Li, Y. Hump and mass-transfer characteristics of dissolved oxygen induced by gaseous cavitation in a space micropump. Int. Commun. Heat Mass Transf. 2023, 145, 106830. [Google Scholar] [CrossRef]
  15. Ren, Z.; Li, D.; Hao, H.; Wang, H.; Liu, J.; Li, Y. Gas–liquid transport behaviors and mass transfer mechanism during oxygen dissolution and evolution processes in a micropump. J. Fluids Eng. 2023, 145, 071401. [Google Scholar] [CrossRef]
  16. Zhang, Y.; Peng, J.; Li, S. Flow characteristic investigation on Laval-type flow rate regulating valves by fluid-thermal-structure interaction. Int. Commun. Heat Mass Transf. 2023, 144, 106771. [Google Scholar] [CrossRef]
  17. Feng, G.; Zhang, J.; Chen, M.; Gao, J.; Bao, W. Mathematical representation of liquid jet diffusion characteristics effected with evaporation process in supersonic crossflow. Fuel 2023, 353, 129110. [Google Scholar] [CrossRef]
  18. Feng, G.; Zhang, J.; Chen, M.; Qiu, H.; Bao, W. Diffusion characteristics of liquid kerosene with heat transfer in a strut-equipped supersonic combustor. Acta Astronaut. 2023, 203, 246–251. [Google Scholar] [CrossRef]
  19. Bejan, A. Entropy Production Minimization: The Method of Thermodynamic Optimization of Finite-Size Systems and Finite-Time Processes; CRC Press: Boca Raton, FL, USA, 2013. [Google Scholar]
  20. Ren, Z.; Li, D.; Fu, X.; Wang, H.; Liu, J.; Li, Y. Synergistic effects of vapor and gaseous cavitation and mass-transfer mechanism in a mechanical pump. Phys. Fluids 2023, 35, 053335. [Google Scholar]
  21. An, Y.; Qinghong, T.; Daqing, Z. Entropy production analysis in thermodynamic cavitating flow with the consideration of local compressibility. Int. J. Heat Mass Transf. 2020, 153, 119604. [Google Scholar]
  22. Yu, A.; Tang, Q.; Zhou, D.; Liu, J. Entropy production analysis in two-phase cavitation flows with thermodynamic cavitation model. Appl. Therm. Eng. 2020, 171, 115099. [Google Scholar] [CrossRef]
  23. Li, D.; Wang, H.; Qin, Y.; Han, L.; Wei, X.; Qin, D. Entropy production analysis of hysteresis characteristic of a pump-turbine model. Energy Convers. Manag. 2017, 149, 175–191. [Google Scholar] [CrossRef]
  24. Long, Y.; Long, X.; Ji, B.; Xing, T. Verification and validation of Large Eddy Simulation of attached cavitating flow around a Clark-Y hydrofoil. Int. J. Multiph. Flow 2019, 115, 93–107. [Google Scholar] [CrossRef]
  25. Liu, Z.; Wang, B. Numerical simulation of the three-dimensional unsteady cavitating flow around a twisted hydrofoil. Ocean Eng. 2019, 188, 106313. [Google Scholar] [CrossRef]
  26. Cervone, A.; Bramanti, C.; Rapposelli, E.; d’Agostino, L. Thermal cavitation experiments on a NACA 0015 hydrofoil. ASME J. Fluids Eng. 2006, 128, 326–331. [Google Scholar] [CrossRef]
Figure 1. The inner structure.
Processes 12 01329 g001
Figure 2. Model validation. (a) The steady state cavitation flow pressure coefficients along the suction surface of hydrofoil are distributed at three different temperatures (u = 8 m/s, α0 = 5°, σ = 1.5). (b) Grid independence verification curve of a dual-rotor turbine flowmeter.
Processes 12 01329 g002
Figure 3. Grids of the dual-rotor turbine flowmeter: (a) fluid domain (b) rotor domain (c) inner structure.
Processes 12 01329 g003
Figure 4. Numerical simulation method.
Processes 12 01329 g004
Figure 5. Active volumetric flow calibration device system.
Processes 12 01329 g005
Figure 6. Comparison of experimental and numerical simulations of the coefficient characteristic curve of upstream and downstream turbine flowmeters.
Processes 12 01329 g006
Figure 7. Internal pressure distribution of a dual rotameter in a quasi-period at the free-stream temperature T = 323 K.
Processes 12 01329 g007
Figure 8. Development of the internal cavity of a dual rotor flowmeter in a quasi-period at the free-stream temperature T = 323 K.
Processes 12 01329 g008
Figure 9. The unfolded flow planes.
Processes 12 01329 g009
Figure 10. Comparison of water vapor volume fraction, magnitude vorticity and turbulent kinetic energy in a quasi-period at the free-stream temperature T = 323 K.
Processes 12 01329 g010
Figure 11. Change of cavitation volume fraction and meter coefficient of a dual rotor flowmeter at different temperature. (a) Experimental and numerical simulation of the instrument factor with temperature curve. (b) The volume fraction of water vapor at different temperatures in the upstream and downstream rotor domains.
Processes 12 01329 g011
Figure 12. The change of the total entropy production rate during the cavitation motion period at different inlet temperature.
Processes 12 01329 g012
Figure 13. The proportion of different types of energy loss at different inflow temperatures during the cavitation period. (a) Entropy production rate by turbulent dissipation. (b) Entropy production rate by direct dissipation. (c) Entropy production rate by wall shear.
Processes 12 01329 g013aProcesses 12 01329 g013b
Figure 14. The evolution of relative total entropy production rate in a cavity quasi–cycle.
Processes 12 01329 g014
Disclaimer/Publisher’s Note: The statements, opinions and data contained in all publications are solely those of the individual author(s) and contributor(s) and not of MDPI and/or the editor(s). MDPI and/or the editor(s) disclaim responsibility for any injury to people or property resulting from any ideas, methods, instructions or products referred to in the content.

