Article

Experimental and Numerical Studies of Modified Polyurethane Diffusion Behavior in Vertical Cracks Based on Line Source Grouting

School of Water Conservancy and Transportation, Zhengzhou University, Zhengzhou 450001, China
*
Author to whom correspondence should be addressed.
Processes 2024, 12(7), 1336; https://doi.org/10.3390/pr12071336
Submission received: 21 May 2024 / Revised: 14 June 2024 / Accepted: 24 June 2024 / Published: 27 June 2024
(This article belongs to the Section Materials Processes)

Abstract

:
The diffusion behavior of polyurethane slurry in vertical cracks, especially rough cracks, is not clear and needs to be studied to provide an effective reference for grouting design. In this study, the diffusion morphology and characteristics of modified polyurethane slurry in vertical cracks were investigated through modeling tests using the line source grouting method. Based on the viscous time-varying characteristics of the slurry, a numerical model of slurry diffusion was established using the joint FVM-VOF method. The numerical model was found to be accurate and reliable compared to the test results. Finally, building upon the basic theory of three-dimensional structure, a rough surface model with Gaussian distribution, more consistent with reality, was established. A numerical simulation system was then employed to study the diffusion morphology and characteristics of slurry in different rough cracks. The results indicate that the diffusion of modified polyurethane slurry within vertical cracks under line source grouting is roughly divided into three stages. Despite uniform crack opening, rougher roughness only increases the length of the crack, thereby reducing the straight-line distance of slurry diffusion. However, it has no significant effect on the flow and total distance of the slurry. Based on these findings, optimization of the grouting point arrangement is proposed.

1. Introduction

The scale of China’s water conservancy infrastructure is vast, and cracks resulting from the fracture of concrete channel slabs are a common issue. Concrete lining slabs are highly susceptible to varying degrees of cracking in the field under the influence of hydraulic forces, temperature differences, and cement drying and shrinking [1]. If not repaired in time, they can lead to further structural damage from water, chlorides, and other hazardous substances, exacerbating the loss of water resources and seriously weakening the performance of the lining plate. This can greatly reduce the mechanical properties of the structure, shorten its service life, and seriously affect the overall operational safety of the project [2,3,4]. The use of grouting to repair cracks and seal leakage channels to improve structural strength is a commonly employed and effective method. Therefore, studying the diffusion behavior of the slurry within the cracks holds significant importance for guiding grouting construction design [5,6].
Numerical simulation is one of the main methods used to study the diffusion behavior of slurry in cracks [7,8]. Compared with theoretical solutions, numerical simulation can continuously and dynamically illustrate the diffusion process of slurry in cracks under various working conditions and complex circumstances [9,10,11]. Therefore, many scholars have conducted extensive research in this area [12,13]. Hassler et al. [14] conducted a simulation study on the diffusion of Newtonian fluids in cracks and proposed the flow law of slurry in a single crack. Saeidi et al. [15] investigated the effect of different structural parameters on slurry diffusion under the regular network model using 2D discrete element UDEC. Luo et al. [16] studied the flow law of slurry in a spatial crack network by combining the flow equation of Bingham fluid within a single smooth crack. Yu et al. [17] based on the theory of U-shaped diffusion of dynamic water grouting in horizontal cracks, combined with experiments and Comsol investigated the effect of inclination angle less than 20° on the diffusion of cement slurry under borehole grouting. Zhang et al. [18] established a numerical simulation of slurry diffusion in horizontal smooth cracks, considering the inhomogeneity of spatial distribution of viscosity based on the time-varying viscosity characteristics of cement slurry, by combining experimental and simulation of borehole grouting. Mohajerani et al. [19] proposed a calculation method for slurry infiltration diffusion in one-dimensional cracks based on the EGFP algorithm and verified the rationality of the algorithm through tests. Li et al. [20] investigated the diffusion pattern and pressure distribution law of C-S slurry in horizontal cracks under a fixed injection rate during borehole grouting, based on plate tests and numerical simulation.
The current numerical simulation of crack grouting is mainly focused on horizontal single smooth cracks, and many results have been achieved for the theoretical and numerical simulation studies on the diffusion of slurry within horizontal smooth cracks. In actual engineering, the structural crack section is often non-smooth. For this reason, some scholars have carried out research in combination with rough surfaces. Zhang et al. [21] investigated the diffusion mechanism of cement slurry in horizontal rough cracks through visualization model tests. Li et al. [22] used JRC to quantitatively evaluate the surface of horizontal cracks, and employed finite elements to study the flow field distribution of slurry and the relationship between flow rate and differential pressure in rough cracks. Yang et al. [23] established a roughness model based on the Barton curve and found that the filling rate of carbon fiber composite cement slurry decreases with the increase of roughness. Zhou et al. [24] established models with uniform and inhomogeneous openings based on fractal theory, and investigated the seepage characteristics of two-phase flow in horizontal fractures using LBM simulation. Zhu et al. [25] modeled and evaluated the roughness model based on fractal theory and Z2, and investigated the effect of matrix permeability on non-Darcy flow properties in a horizontally roughened single fracture. Jeong et al. [26] modeled a horizontal rough fracture based on fractal dimensions and investigated the effects of fracture roughness and normal stress on solute transport properties using the particle tracking method. Hao et al. [27] investigated the diffusion characteristics of expanded polyurethane in vertical smooth cracks using a combination of experimental and simulation methods.
In the above studies, rough crack modeling is based on JRC and fractal theory, through which three-dimensional rough cracks tend to exhibit smooth regions. This leads to calculation results prone to infinity when Z2 is used to evaluate the roughness of 3D structures. The reason for this issue is that these theories are based on two-dimensional structures, which are fundamentally different from three-dimensional structures, and thus cannot effectively establish and characterize three-dimensional structural features [28,29]. Although some scholars have developed methods to characterize 3D rough surfaces by linking 3D morphology with JRC and Z2 to form a multi-parameter joint [30,31,32], JRC and fractal theory are still essentially two-dimensional profile curves, and Z2 is a two-dimensional average slope along a predetermined direction [33,34,35]. Therefore, the establishment and characterization of 3D structures using JRC, Z2, and fractal theory still, strictly speaking, evaluate the establishment and characterization of 2D profile surfaces [36,37,38,39]. This results in a significant error compared to the realistic 3D rough surface features [40], and the error in the model directly leads to an increase in the error in the numerical results [41].
In summary, current studies on the spreading of slurry in cracks, whether smooth or rough, are based on horizontal cracks, with the grouting method typically involving drilled grouting perpendicular to the crack surface. In a few studies on vertical cracks, drilling and grouting were also used [27]. However, drilled holes are highly susceptible to causing secondary damage to the crack structure [42]. Therefore, a line-source nondestructive grouting process was developed for vertical cracks [43]. In addition, vertical cracks are prevalent in actual projects and are fundamentally different from horizontal cracks. Currently, there are fewer studies on the diffusion of slurry in vertical cracks, which means that research on the theory of grouting in vertical cracks lags behind engineering practice. Therefore, the study of slurry diffusion in vertical cracks is of great practical significance. Based on the above background, this study investigates the diffusion behavior of modified polyurethane slurry in vertical cracks through line-source grouting tests and establishes a numerical model of slurry diffusion in vertical cracks. Subsequently, to compensate for the inadequacy of three-dimensional models created by two-dimensional theories, this study, based on the basic theories of Gaussian distribution and three-dimensional structure [40,44,45], establishes a rough model that more accurately reflects realistic characteristics. The diffusion behavior of modified polyurethane slurry in vertical rough cracks is systematically studied, aiming to provide guidance and a basis for construction.

2. Material and Model

2.1. Composition and Rheological Properties of Modified Polyurethane Materials

2.1.1. Material Composition

The modified polyurethane grouting material used by this institute is a non-foaming polyurethane developed for repairing channel concrete cracks. It primarily consists of Material A, Material B, and nano-silicon. Material A is transparent and comprises polyether polyol, penetrating diluent, surfactant, and catalyst. Material B, dark brown in color, primarily contains isocyanate, penetrating diluent, and flame retardant. The specific compositions of Materials A and B are shown in Table 1, and the materials were obtained from Wanhua Chemical Group Co. (Yantai, China). Nano-silicon nanoparticles are incorporated at a dosage of 5 wt%.

2.1.2. Rheological Properties of Materials

For grouting repair of cracks with openings less than 1 mm, the material used should be extremely groutable, which requires that the initial viscosity value of the material be less than 0.1 Pa·s [46]. At the same time, the viscosity change of the slurry is crucial for diffusion test studies and is also the basic data required for constructing hydrodynamic models [47,48,49]. Therefore, it is necessary to measure the viscosity parameters of the nano-modified polyurethane materials. The initial viscosity and time-varying measurements of the materials were recorded using an SNB-2 digital viscometer.
The apparent viscosities of the modified polyurethane slurries were measured at different ambient temperatures to investigate changes in the hysteresis properties of the slurries during diffusion motion. As shown in Figure 1, the initial viscosity of the slurry decreases with increasing ambient temperature, and the viscosity of the slurry does not change much before the gel point. However, the viscosity increases suddenly after reaching the gel point. Additionally, the viscosity-time inflection point of the slurry advances accordingly with the increase in ambient temperature. From this, it is inferred that as the slurry cures further, its resistance to diffusive movement increases, resulting in weakened fluidity. Modified polyurethane exhibits typical viscosity-time characteristics, and based on the test results, the slurry viscosity-time varying equation can be expressed as [50]:
μ ( t ) = μ 0 + A 1 e t / t 1
where μ 0 represents the initial viscosity, A 1 represents the viscosity coefficient, and t 1 represents the characteristic time. The Levenberg-Marquardt algorithm was utilized to fit the data to the experimental data depicted in Figure 1, and the function fitting curve is illustrated in Figure 1.
The viscosity models for polyurethane at 10, 20 and 30 °C are as follows:
μ 10 ( t ) = 114.54328 + 7.83 × 10 2 × e t 25.08171 , R 2 = 0.99458
μ 20 ( t ) = 63.96264 + 6.17238 × 10 6 × e t 7.65561 , R 2 = 0.96432
μ 30 ( t ) = 48.17332 + 1.2062 × 10 7 × e t 3.93955 , R 2 = 0.97621

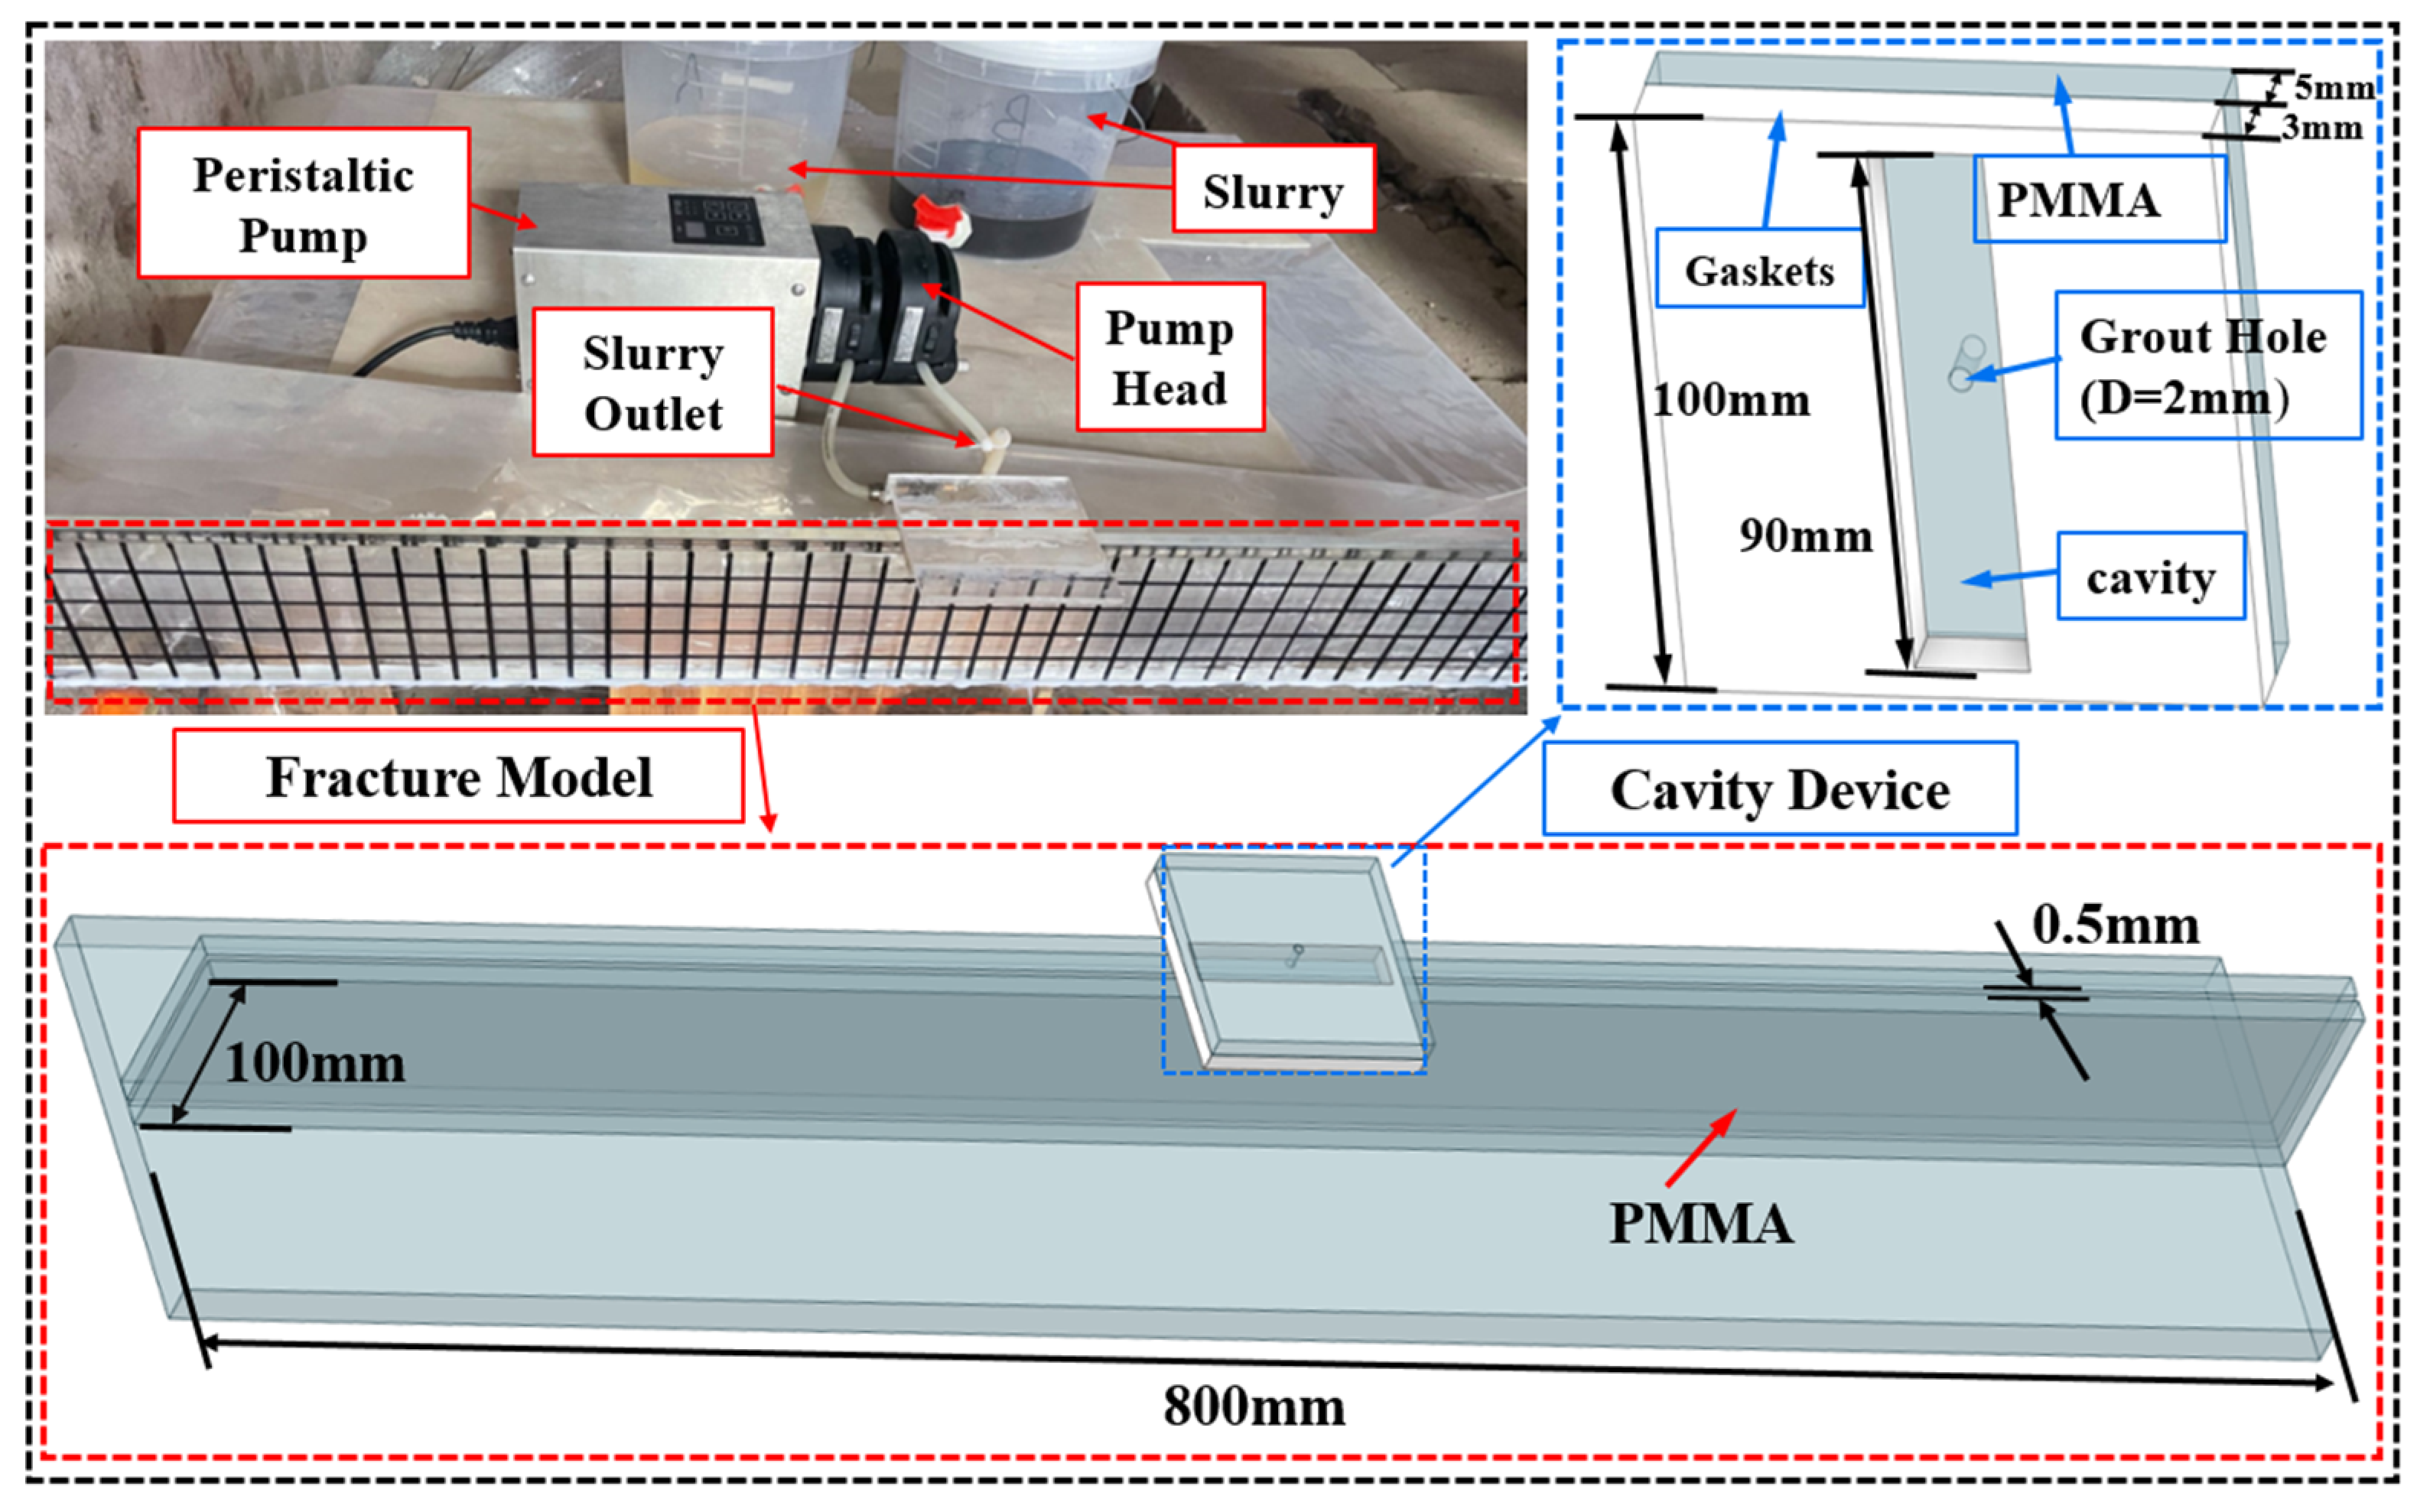
2.2. Line Source Grouting Test Device

2.2.1. Visual Grouting Test Device

In order to repair cracks in channel concrete slabs, nano-modified polyurethane repair materials were prepared. To study the diffusion mechanism of the modified polyurethane, a visualized crack model was made. The crack model, which serves as the main body, is made of transparent polymethyl methacrylate, and the thicknesses is 10 mm. From the front view, the size is 800 mm × 100 mm, and the depth of 100 mm is consistent with the depth of the channel concrete lining slab. In concrete structures, a crack of 0.5 mm is particularly important for assessing the crack bridging behavior of small cracks; therefore, the crack width was chosen to be 0.5 mm [51]. After placing the crack model with 0.5 mm galvanized sheets in the middle part, the model plates on both sides were tightly fitted and then fixed by adhesive bonding using ethylene vinyl acetate (EVA). The galvanized sheets were withdrawn after fixation. The bottom part was then bonded to the flat plate by EVA. The top and bottom of the model were set as closed boundaries, the two ends were the exits, and the cavity device was installed at the top center position. Figure 2 shows a schematic diagram of the visualized crack model device.
The grouting equipment uses a double pump head peristaltic pump, as shown in Figure 2. The peristaltic pump grouting speed is adjustable and constant, allowing for constant low pressure continuous grouting. The Peristaltic pump has good self-priming, and the double pump head ensures that the speed, suction, and flow are the same. The slurry tube length is the same, preventing reflux and overflow. Thus, the slurry can be fully and evenly mixed in the mixing tube. At the same time, there is no need to equip an air compressor, minimizing the influence of pressure on the crack structure. Thanks to the stable rotational speed of the peristaltic pump, the grouting flow rate remains constant, and the amount of grout injected can be determined by timing. In the grouting test on 0.5 mm cracks, the peristaltic pump speed is 20 rpm and the grouting rate is 0.8 g/s. The pump head is a YZ1515 three-roller pump head. The length of the slurry pipe is 0.4 m, and the mixing pipe is 0.1 m. The inner diameter of the slurry pipe is 4.8 mm, the outer diameter is 8 mm, and the wall thickness is 3.2 mm. At the end of the mixing tube, the slurry is injected into the cavity using a “rat tail” fitting. The tail of the rat-tail joint has a diameter of 5 mm and is embedded in the mixing tube and reinforced by a pipe clamp. The head has a diameter of 1.8 mm and can be embedded in the grouting hole to inject the slurry into the cavity.
In this study, the characteristics of cracks and the shortcomings of peristaltic pumps, which generate pulsatile flow during grouting, are addressed. The cavity device was developed as the slurry inlet during grouting, as shown in Figure 2. Cavity device changes the conventional use of conduit grouting, forming a long rectangular line source grouting. The cavity is placed between the grouting outlet and the crack, which can absorb pulses, ensuring the slurry is injected into the crack in a smooth and continuous manner. It also prevents air bubbles from entering the cracks and improves the filling effect. The cavity grouting device is mainly composed of two parts: the upper part of the main body, which is a cover plate made of PMMA, size 100 mm × 100 mm × 5 mm, and the lower part, which is a silicone gasket of the same size with a thickness of 3 mm. The size of the cavity body can be adjusted according to the crack grain characteristics and grouting requirements.

2.2.2. Test Recording Equipment

Considering the characteristics of microcracks, in order to reduce further damage to the structure by pressure, the grouting material used non-aqueous reactive isodense material, which does not have foaming properties. Therefore, the main focus of the measurement system is the diffusion pattern and diffusion range of the slurry. To facilitate the analysis of the diffusion pattern, a grid with an interval of 20 mm was drawn on the outside of the crack simulation plate. The slurry diffusion process was recorded using a Canon EOS-700D camera positioned in front of the model, as shown in Figure 3. To ensure the diffusion effect of the slurry, the test was conducted outdoors at an ambient temperature of 30 °C, with ambient humidity of about 40%. The grouting time was 60 s.

2.3. Numerical Model

2.3.1. Basic Assumption

In order to deeply study the diffusion of modified polyurethane slurry in vertical cracks, numerical simulation analysis is carried out considering the viscous time-varying characteristics of the modified polyurethane slurry. The correctness of the numerical simulation is verified by comparing the numerical analysis results with the test results. Through the rheological characterization test, it can be seen that the modified polyurethane slurry has a relatively constant viscosity before the gel inflection point and can be considered to flow like a Newtonian fluid. After the gel inflection point, the viscosity increases rapidly and stops flowing. This study addresses the diffusive behavior of modified polyurethane before the inflection point and therefore considers it as a Newtonian fluid [52]. The basic assumptions and prerequisites for modeling are as follows:
(1)
The modified polyurethane slurry is uniformly mixed and is an isotropic, incompressible, homogeneous, continuous fluid;
(2)
The slurry spreads as laminar flow in the cracks;
(3)
When the slurry flows in the crack, there is no slip on the walls on both sides of the crack, i.e., the flow rate of the slurry on the crack surface is 0;
(4)
Penetration of the slurry into the concrete structure on both sides of the crack is not considered;
(5)
The flow pattern of the slurry remains unchanged during the movement, with only the viscosity is time-varying. The value of the viscosity is constant until the inflection point, so it is considered a Newtonian fluid;
(6)
The changing state of the slurry in the delivery pipe and the cavity body is neglected.

2.3.2. Flow Control Equation

The diffusion of modified polyurethane slurry in a crack can be viewed as a two-phase flow problem. Its diffusion is controlled by the continuity equation and momentum conservation equation, expressed as follows:
ρ t + ρ U = 0
( ρ U ) t + ( ρ UU ) = p + μ U + U T + ρ g
where ρ represents the slurry density, t represents time, U represents the velocity vector, μ represents the dynamic viscosity, g represents the gravitational acceleration.
The visualized crack model has a relatively high aspect ratio, and the PMMA material is flexible. During the modeling process, uneven crack openings may exist. At the same time, due to the cavity body and the infusion tube, there will be a certain lag in the viscosity of the slurry. Therefore, the extrapolation of the density from the crack volume and the mass of the slurry injection will produce a large error. In contrast, the non-foamed polyurethane material used in this study has isodensity properties. Therefore, the average value of density after initial mixing and curing was used as the density parameter, and the density was taken as 1.255 g/cm3. The viscosity of the slurry versus time was expressed using Equation (4) at an ambient temperature of 30 °C. In the setup of the inlet, the cavity body is considered the inlet of the slurry during crack grouting. The length of the line source is 90 mm, which is the same as the length of the cavity, and the position is located in the middle of the model.

3. Comparative Analysis of Test and Simulation

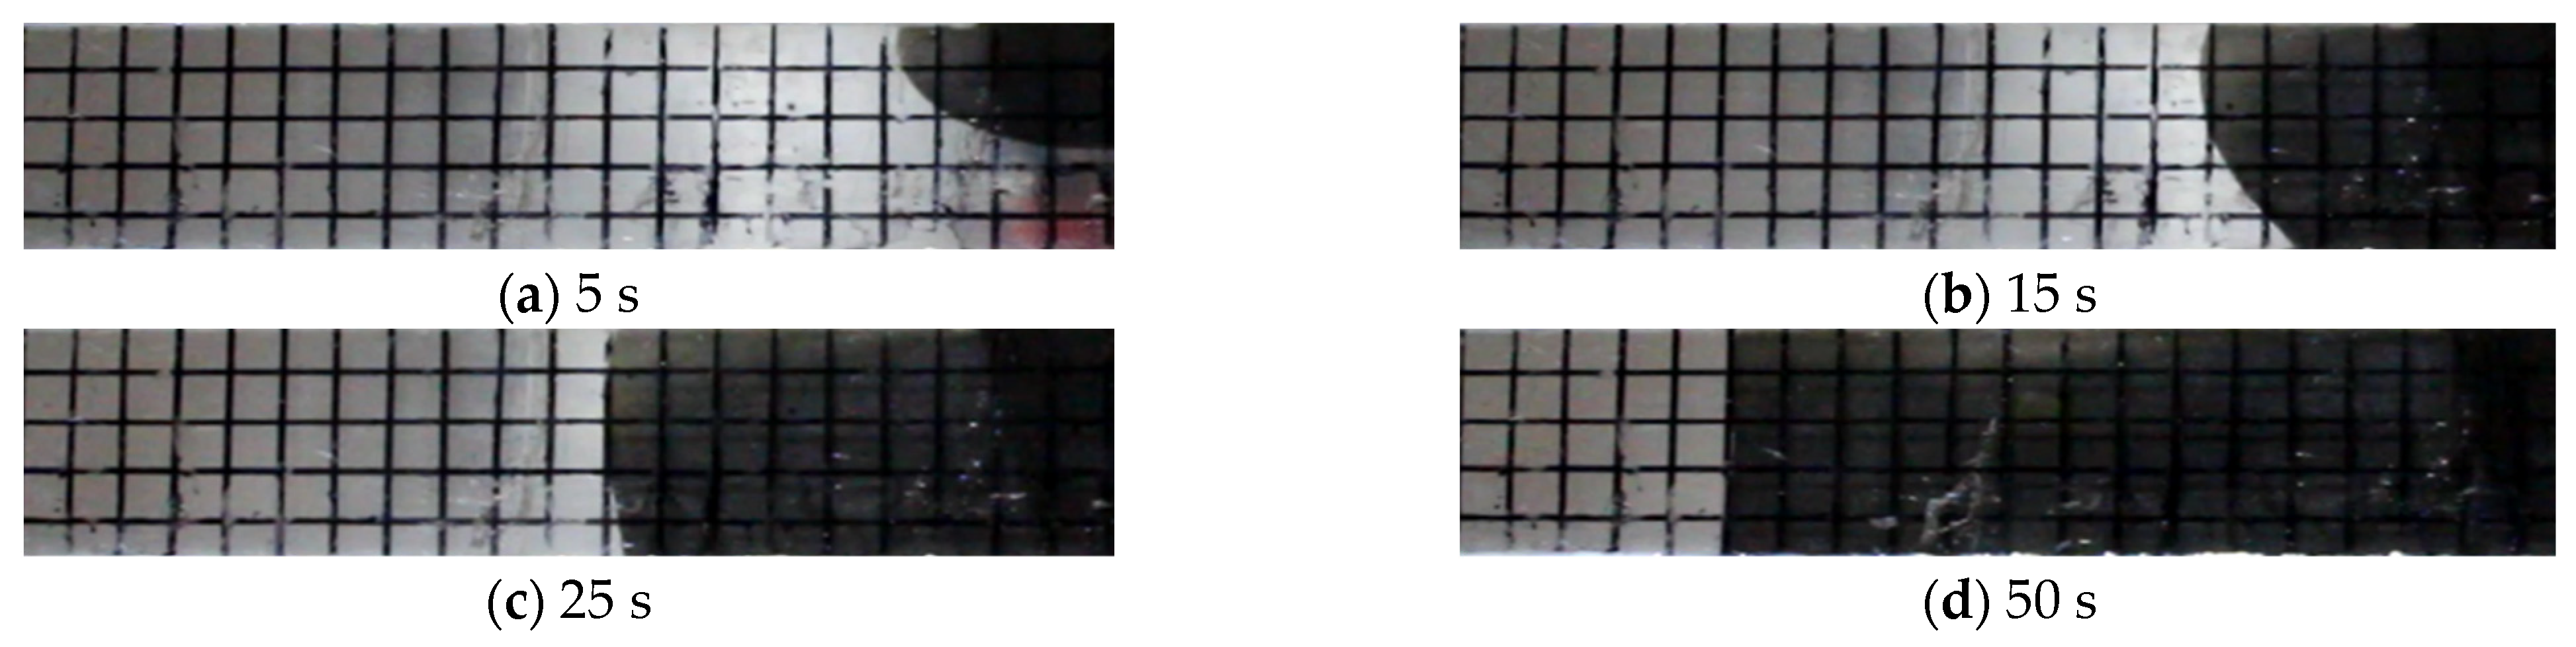
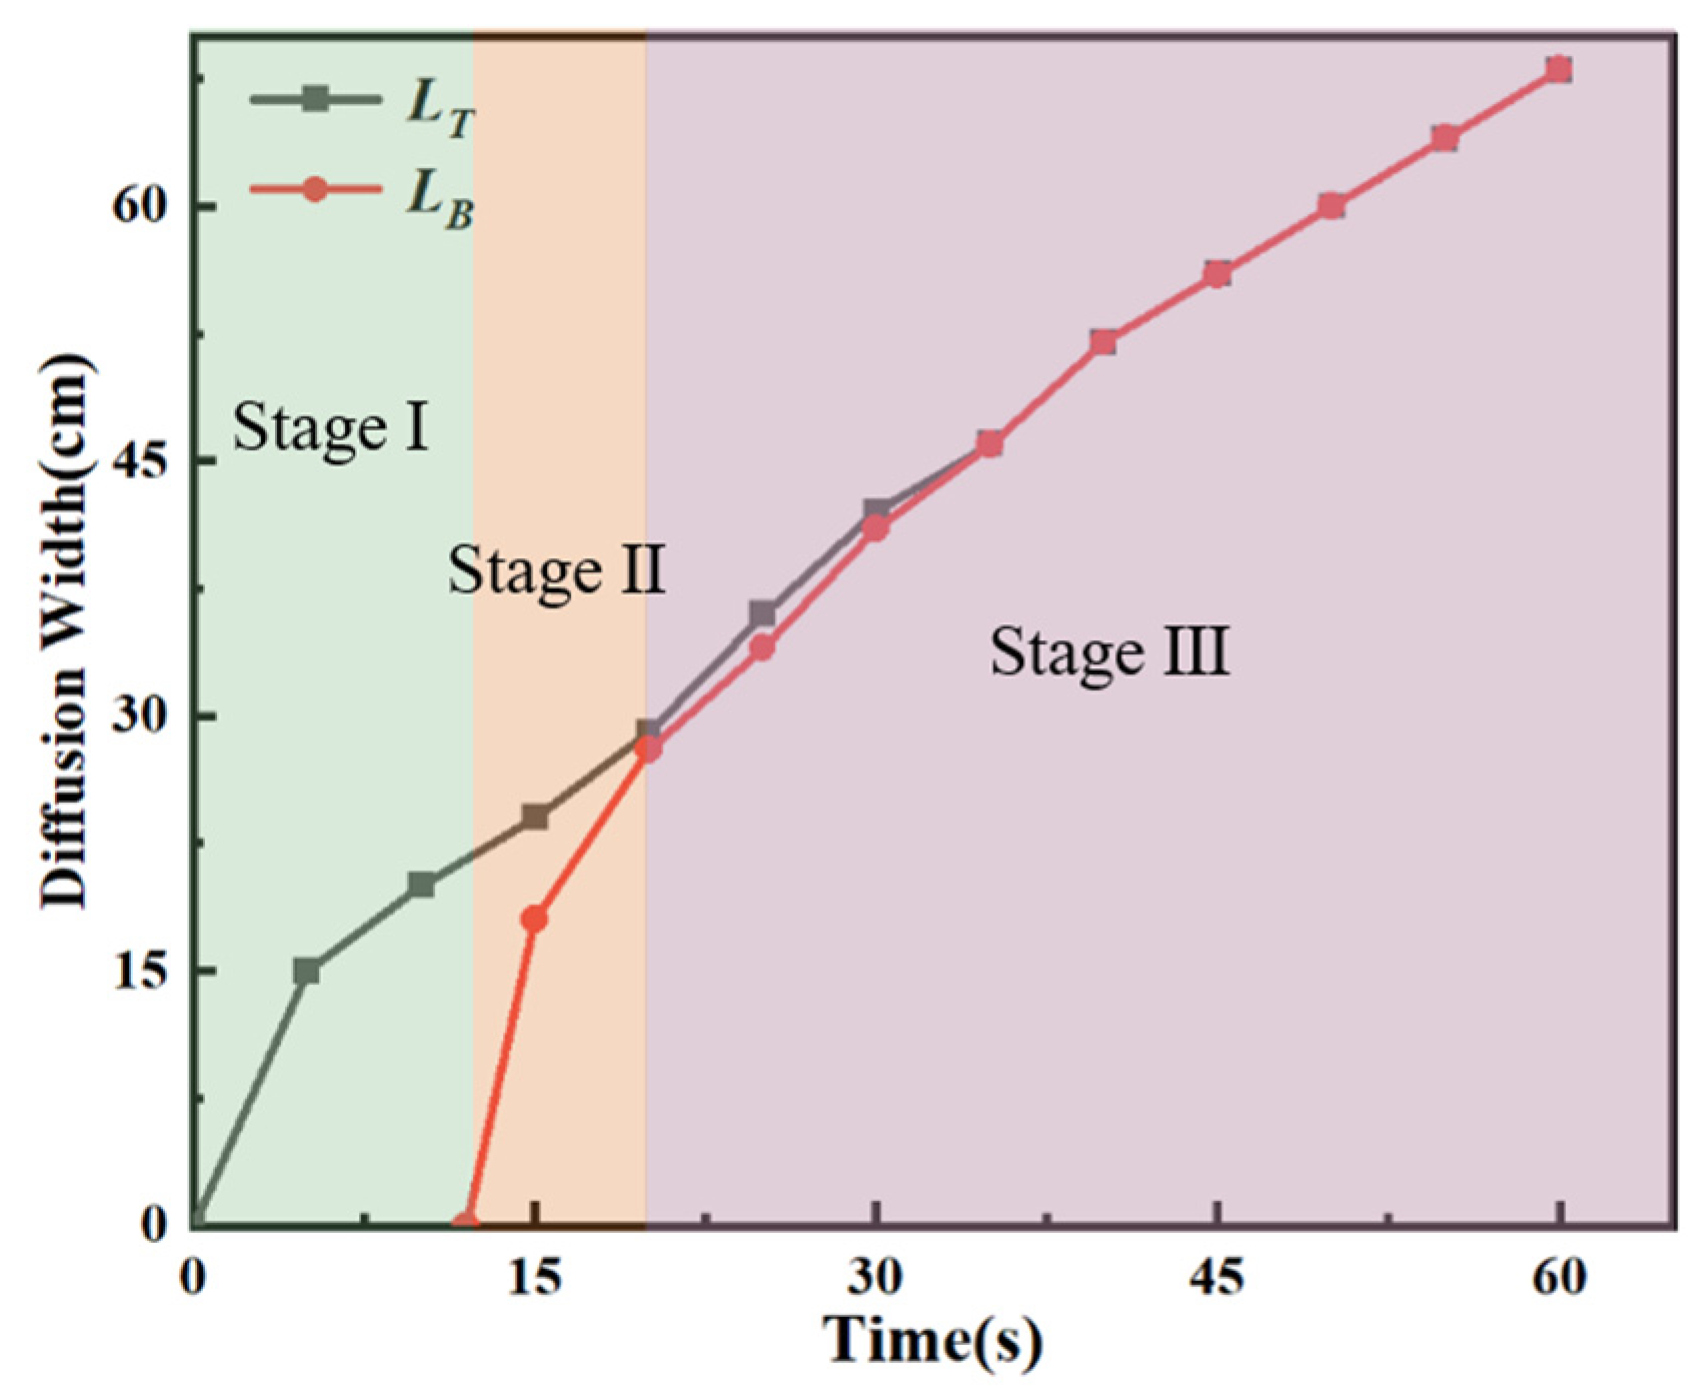
3.1. Analysis of Test Results

To establish a reference point for measuring distance, the center point of the model is used as the zero point. The sum of the diffusion distances on the left and right sides is defined as the slurry diffusion width. The diffusion widths at the top and bottom of the cracks are defined as L T and L B , respectively. Since the model is symmetric, one side is selected for observation, and the diffusion characteristics are shown in Figure 4.
As shown in Figure 4, the typical diffusion morphology of the modified polyurethane slurry during the diffusion in vertical cracks is illustrated. Before the slurry reaches the bottom boundary of the crack, the slurry diffusion morphology is roughly semicircular, as shown in Figure 4a. The slurry diffuses to the bottom of the crack in a semicircular shape, and the semicircular boundary is tangent to the bottom boundary of the crack. The diffusion morphology then instantly changes from a semicircular shape to an inverted trapezoidal shape, as shown in Figure 4b. Subsequently, the slurry diffusion velocity at the bottom of the crack starts to exceed that at the top until the diffusion widths at the top and bottom become nearly equal. Finally, the diffusion pattern of the slurry becomes rectangular and spreads steadily to both sides, as shown in Figure 4c,d.
The bottom diffusion width is zero when the slurry spreads in a semicircle before reaching the bottom. Therefore, the bottom diffusion width data is recorded from the time when the slurry becomes tangent to the bottom. The top diffusion width is denoted as L T and the bottom diffusion width is denoted as L B . The initial slopes of the L T and L B curves are larger than that of the bottom diffusion width. As shown in Figure 5, the initial slopes of the L T and L B curves are large, and the overall trend gradually becomes smaller and stabilized. The slopes of the curves indicating the diffusion speed of the slurry at different moments. Initially, the low viscosity of the slurry is very favorable for the diffusion, resulting in a very fast diffusion speed. When the slurry diffuses to the bottom of the crack, the bottom diffusion speed is extremely high due to the convergence of multiple directions of slurry at the bottom and the gradual connection of the semicircular boundary with the bottom. Subsequently, the diffusion pattern of the slurry changes from semicircular to inverted trapezoidal and finally to rectangular. At the beginning of this process, the initial diffusion velocity of the slurry at the bottom is large, and the amount of slurry increases rapidly, causing the velocity decays quickly. When the diffusion width of the top and bottom are approximately the same, the slopes of the L T and L B curves are basically the same. This indicates that the diffusion velocities at the top and the bottom are essentially the same, and the overall diffusion velocity of the slurry in the crack becomes stable.
In summary, the diffusion process of modified polyurethane slurry in vertical cracks can be roughly divided into three stages based on the diffusion speed and morphology: a semicircular downward diffusion stage, an inverted trapezoidal rapid diffusion stage, and a rectangular stable diffusion stage, as shown in Figure 5. In the first stage (Stage I), the slurry is injected into the vertical crack by a peristaltic pump, and the diffusion speed is faster due to the lower viscosity of the slurry. The spreading pattern of the slurry in this stage is semicircular, lasting from the beginning of grouting until contact with the bottom. In the second stage (Stage II), after the slurry diffused to the bottom, the slurry morphology immediately becomes inverted trapezoidal. At this time, the diffusion rate of the slurry at the bottom is faster than at the top, and the slurry morphology quickly develops into a rectangular shape. During this stage, the diffusion rate at the top gradually stabilizes, while the diffusion rate at the bottom rapidly decays to match the top’s rate. When the diffusion pattern becomes rectangular, the process enters the third stage (Stage III), in which the slurry diffuses in a rectangular shape and steadily spreads to both sides of the crack. In this stage, the slurry in the cavity, under the joint action of the slurry in the crack and the peristaltic pump, forms a stable grouting pressure, and the diffusion speeds at the top and bottom converge and stabilize. After stopping the grouting, the spreading of the slurry gradually ceases, and the viscosity of the initially injected slurry begins to increase and solidify. The strength and stability of the polyurethane gradually increases, keeping the later-injected slurry in a stable area and state, and gradually curing. Eventually, all the slurry in the crack is completely cured, completing the grouting repair of the crack.

3.2. Comparison of Numerical Simulation and Test Results

For numerical calculations, the joint FVM-VOF method was employed to numerically calculate the diffusion behavior of the slurry. The solution process was carried out using ANSYS Fluent 2021 R1 software for the laminar flow transient problem. The second-order upwind format was used to discretize the control equations, and the SIMPLE algorithm was used to solve iteratively. The phase interface of the air-slurry mixture was tracked and captured using the VOF method, and the volume fraction equation was solved using the geometric reconstruction method. Equation (4) was embedded by a UDF function to achieve real-time adjustment of the viscous time-varying properties of the material.
The dimensions and boundary conditions of the numerical model were kept the same as those in the tests. The slurry injection inlet was 90 mm long, identical to the physical model. The slurry injection rate was defined as the inlet boundary for the mass flow condition, with the flow rate set to 0.8 g/s by the condition function for a duration of 60 s, followed by zero flow rate. The results of the numerical simulation are depicted in Figure 6, where the red color in (a–d) represents the typical morphology and range of slurry diffusion at four moments: 5 s, 15 s, 25 s, and 50 s, respectively.
Comparison of diffusion patterns and widths between numerical simulations and tests is shown in Figure 7 and Figure 8. Figure 7 shows the diffusion of the slurry in the cracks at different time points, comparing the numerical simulation with the test results. From the figure, it can be observed that the diffusion pattern of the slurry remains basically the same at different stages. Combined with Figure 8, it can be seen that the width of slurry diffusion in the test is basically the same as in the numerical simulation. However, several differences also need to be noted. First, the diffusion range of the test is slightly larger than that of the numerical simulation in the early stage, while the range of the numerical simulation diffusion is larger than that of the test in the later stage. Second, in the numerical simulation, the slurry reaches the bottom boundary at a later point in time than in the test. Finally, the diffusion widths at the top of the crack are basically the same until 45 s, after which the simulated values start to gradually exceed the experimental values, while in the bottom widths, the experimental values are larger than the simulated values, and agreement is reached at 45 s, after which the simulated values gradually exceed the experimental values. Finally, the root mean square error (RMSE) was introduced to evaluate the error of the numerical model and the test, which was 2.82 at the top of the crack and 4.81 at the bottom, with an average of 3.82.
The reasons for these discrepancies may be due to the following:
(1)
During the grouting process, the silicone hose used shows a slight swelling phenomenon with the increase of grouting time. This is because the rotational speed of the peristaltic pump is constant, the output volume of slurry is constant, and the pressure of the peristaltic pump output is also constant. However, as the amount of slurry in the crack increases, the resistance to grouting at the exit of the slurry increases. Therefore, the output of slurry at the outlet will gradually decrease, causing the expansion of slurry accumulation in the hose. In the numerical simulation, the flow rate is constant and the effect of pressure is ignored accordingly.
(2)
During the test, the increase in the amount of slurry injection over time led to a gradual increase in the pressure near the injection port. In the late stage of the test, slurry overflow occurred near the grouting port at the top of the model, which directly led to the loss of slurry and further caused the reduction of diffusion distance. In contrast, in the numerical simulation, there is no slurry loss.
(3)
In the modeling tests, the length-to-height ratio of the crack face model was too large to keep the distribution of openings exactly the same when setting the crack openings. Therefore, with the same mass of slurry, numerical simulation can fill the cracks more adequately, which is difficult to achieve in the tests.
Considering the effects of relevant factors in the test, the root mean square error of the model is in the acceptable range. It can be concluded that the numerical model established by the joint FVM-VOF method in this study is reasonable. It can be used to predict the diffusion of modified polyurethane slurry in vertical cracks during line-source grouting.

4. Numerical Analysis of Rough Cracks

4.1. Basic Theory

The self-covariance function for a structured surface in 3D space is as follows:
ρ ( τ x , τ y ) = 1 ( L x τ x ) ( L y τ y ) · 0 L x τ x 0 L y τ y z ( x , y ) z ( x + τ x , y + τ y ) d x d y
Exponential autocorrelation function [53]:
R ( τ x , τ y ) = ρ ( τ x , τ y ) ρ ( 0 , 0 ) = σ 2 · exp ( 2.3 ( ( τ x / β x ) 2 + ( τ y / β y ) 2 ) 1 / 2 )
The normalization factor ρ ( 0 , 0 ) in Equation (8) is the variance of the surface height distribution, and the autocorrelation function R ( τ x , τ y ) is a dimensionless quantity. The power spectral density function is defined as the Fourier transform of the autocorrelation function:
G ( ω x , ω y ) = 1 2 π 2 · 0 0 ρ ( τ x , τ y ) cos ( ω x τ x + ω y τ y ) d τ x d τ y
The structure function equation is:
S ( τ x , τ y ) = 1 ( L x τ x ) ( L y τ y ) · 0 1 τ x 0 1 τ y ( z ( x , y ) z ( x + τ x , y + τ y ) ) 2 d x d y
The self-covariance function ρ ( τ x , τ y ) , the autocorrelation function R ( τ x , τ y ) , the power spectral density function G ( ω x , ω y ) , and the structure function S ( τ x , τ y ) contain the same information, but in different situations, these functions can characterize the rough surface differently [32]. In practical engineering, the rough surface becomes a discretized stochastic process after digital sampling, denoted as z ( x , y ) discretized:
R ( τ x , τ y ) = E ( z ( x , y ) z ( x + τ x , y + τ y ) )
The 2D digital filtering technique based on the AR model to generate rough surfaces with a specified autocorrelation function is based on the following principle:
An arbitrary random process η ( x , y ) is passed through a two-dimensional filter to obtain a random process z ( x , y ) :
z ( x , y ) = k = 0 n 1 l = 0 m 1 h ( τ x , τ y ) η ( x + τ x , y + τ y )
where τ x = 1 , , N , τ y = 1 , , N . n = N 2 , m = M 2 , h ( τ x , τ y ) are the corresponding functions of the filter shocks.
Equation (12) is Fourier transformed:
z ( ω x , ω y ) = H ( ω x , ω y ) A ( ω x , ω y )
where z ( ω x , ω y ) , H ( ω x , ω y ) , and A ( ω x , ω y ) are the Fourier transforms of z ( x , y ) , h ( τ x , τ y ) , and η ( x , y ) , respectively.
The Fourier transform of the autocorrelation function R yields the power spectral density function G ( ω x , ω y ) . Since H ( ω x , ω y ) is related to the power spectral density function as follows [54]:
H ( ω x , ω y ) = ( G ( ω x , ω y ) C ) 1 2
where C is the power spectral density of the input sequence, and C is a constant for a random sequence obeying a Gaussian distribution.
Based on the above basic theory, the steps for generating a rough surface with an exponential autocorrelation function using Matlab are as follows:
(1)
Generate a two-dimensional random sequence of Gaussian distributed white noise, and perform a Fourier transform;
(2)
The autocorrelation function R is Fourier transformed to obtain the output signal G z ( ω x , ω y ) , and the power spectral density C of the input sequence is determined;
(3)
H ( ω x , ω y ) is calculated from Equation (14);
(4)
The output sequence after passing the input sequence through the filter is Fourier transformed Z ( ω x , ω y ) through Equation (13);
(5)
The surface height distribution function z ( ω x , ω y ) is obtained by applying the Fourier inverse transform to Z ( ω x , ω y ) .
The roughness of rough surfaces is evaluated using the average slope Z 2 3 D in three dimensions as follows:
Z 2 3 D = 1 L x L y x = 0 x = L x y = 0 y = L y d z d x 2 + d z d y 2 d x d y = 1 ( N x 1 ) ( N y 1 ) i = 1 N x 1 i = 1 N y 1 z i + 1 , j z i , j x i + 1 , j x i , j 2 + z i , j + 1 z i , j y i , j + 1 y i , j 2
where N x and N y are the number of points along the x and y directions for rough surfaces L x and L y , respectively.
Both the generation of the height distribution function mentioned above and the evaluation of roughness were computed using Matlab for output.

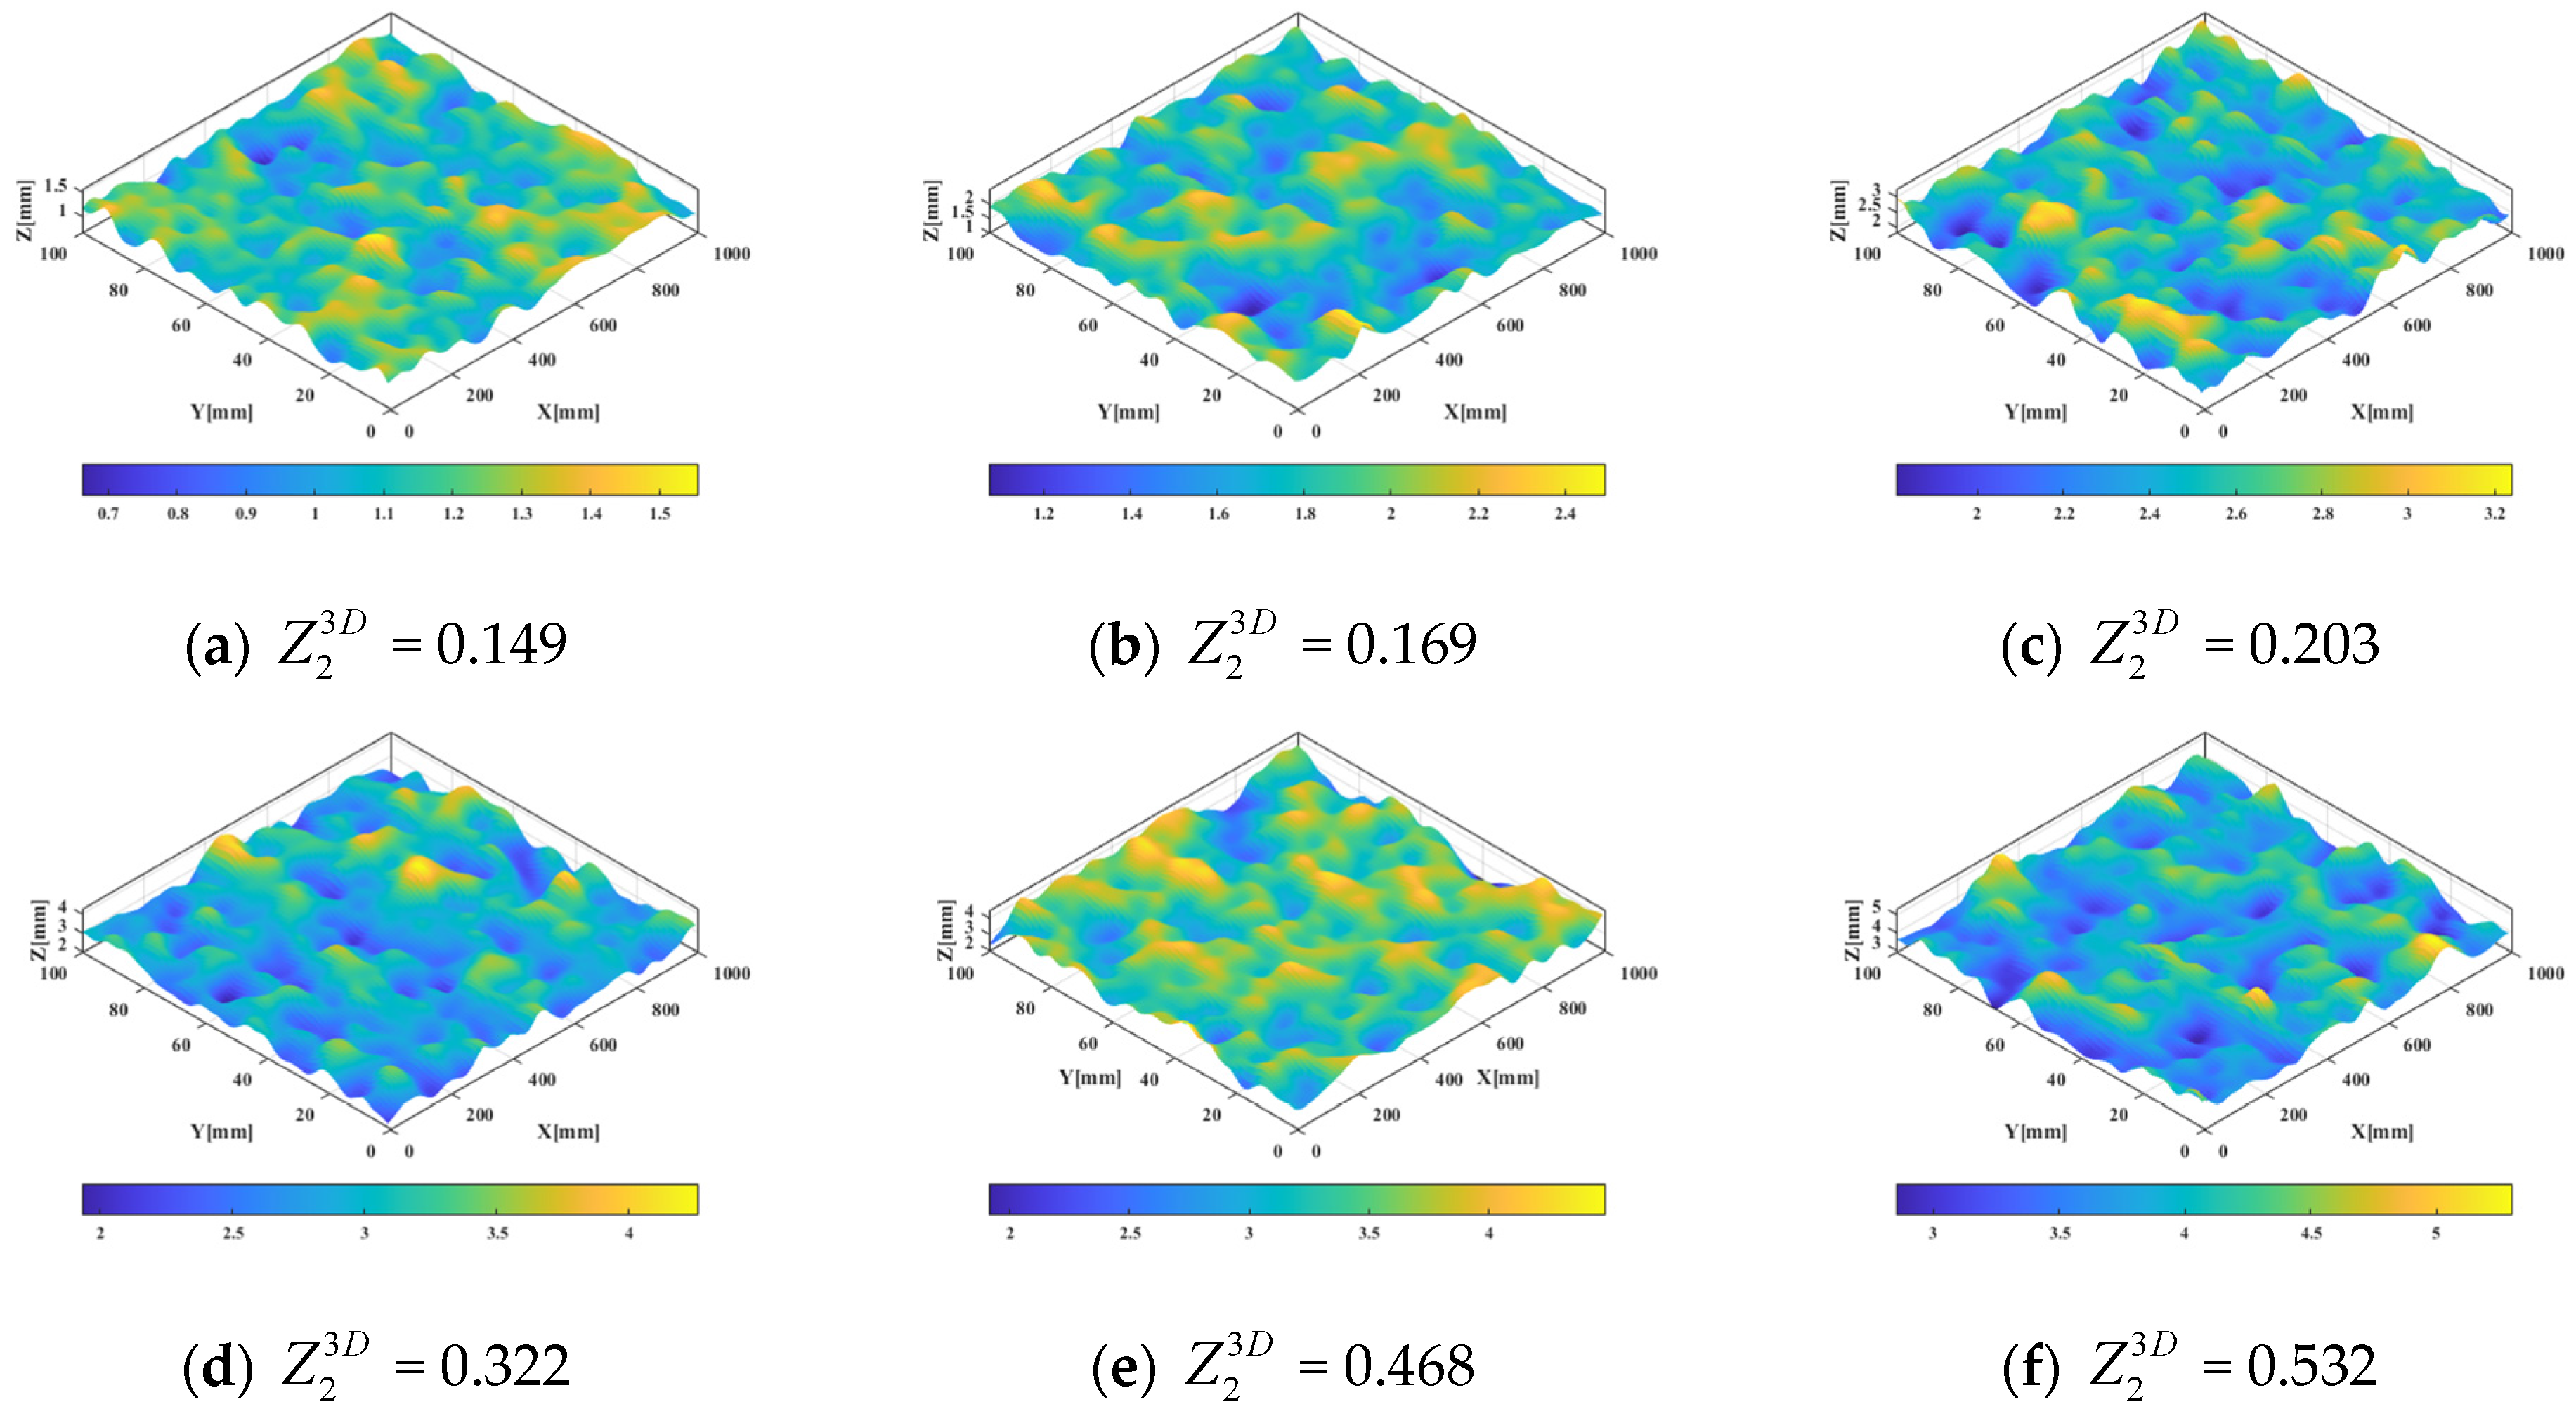
4.2. Rough Surface Model

As shown in Figure 9 and Figure 10, random rough surface elevation maps and models were generated using the exponential autocorrelation function. Figure 9a–f demonstrate that roughness gradually increases. The scale in Figure 9 indicates that the highest value of the rough surface increases as the roughness increases. Moreover, the frequency of the undulation changes on the crack surface gradually increases as the value of Z 2 3 D increases. From this, it can be inferred that the exponential autocorrelation function used in this study is feasible, and the variation trend of the generated rough surface is consistent with the basic theory of Z 2 3 D . The rough crack model was built using Comsol Multiphysics, as shown in Figure 10. The diffusion simulation of the slurry was conducted using Fluent, and the simulation setup mirrored that of the test.

4.3. Numerical Simulation Analysis of Rough Cracks

As shown in Figure 11, the diffusion patterns of slurry at different moments within the crack exhibit varying degrees of roughness. It is apparent that as roughness increases, the range of slurry diffusion at the same moment gradually decreases. Initially, in the first stage, the slurry exhibits semi-circular diffusion, but with increasing roughness, the semi-circular shape becomes less regular. Analyzing the diffusion pattern at t = 15 s, it becomes evident that higher roughness leads to a reduced contact area between the slurry and the bottom of the crack, indicating a longer duration for the slurry to reach the bottom from the top. This suggests a positive correlation between the time for the slurry to reach the bottom boundary and the roughness.
During the second and third stages, the diffusion pattern of the slurry remains similar to that within the smooth crack, gradually transitioning from an inverted trapezoid to a rectangle. In the second stage, however, the diffusion pattern of the slurry begins to exhibit less regularity with increasing roughness, indicating that roughness affects the diffusion pattern of the slurry to some extent. By the third stage, at t = 45 s and t = 60 s, the spreading range of the slurry decreases with increasing roughness, particularly noticeable at Z 2 3 D = 0.532. This highlights a gradual reduction in the spreading range of the slurry with increasing crack roughness. Therefore, for effective grouting repair of cracks, reducing the interval distance between grouting inlets is recommended to ensure complete filling of the crack space and achieve optimal repair outcomes.
The absolute path of slurry diffusion in the crack was measured along the Z-axis direction of the model in both top and elevation views, representing the diffusion width of the slurry at the top and bottom. As shown in Figure 12, the diffusion distance of the slurry at different moments within the cracks with varying roughness is illustrated. From the figure, it can be seen that the diffusion width of the slurry inside the crack does not change with the roughness compared to the simulation results of the flat plate crack. Combined with Figure 11, it can be seen that the increase in roughness is only results in a longer crack path length compared to that of the flat plate crack, but it does not affect the flow-diffusion properties of the slurry. This also indicates that the time for the slurry to diffuse from the top to the bottom is greater in cracks with large roughness than in cracks with small roughness. The underlying reason for this is the lengthening of the slurry diffusion path, which makes it take longer for the slurry to diffuse to the bottom. Therefore, it can be concluded that the diffusion behavior of modified polyurethane slurry in cracks with uniform openness but different roughness has no significant relationship with roughness. For cracks with the same straight-line distance, the greater the roughness, the longer the path length inside the crack, resulting in a longer path for slurry diffusion and accordingly more slurry is needed to fill the crack. At the same time, considering the rheological properties of the modified polyurethane slurry used in this study, the viscosity remains almost constant for the first 60 s and then increases gradually. Therefore, when grouting cracks for repair, each grouting session can last for about 60 s, and the spacing of the grouting devices should be set smaller than the spreading width of the slurry at 60 s.

5. Conclusions

The objective of this study is to investigate the diffusion behavior of modified polyurethane slurry in rough vertical cracks. The rheological properties and diffusion characteristics of the slurry were investigated through model tests. On this basis, the numerical model of slurry diffusion during grouting in vertical rough cracks was established, validated, and analyzed. The main conclusions are as follows:
For crack repair, a visualized crack grouting model, a constant pressure grouting system, and a cavity body grouting device were developed. By replacing the traditional drilling method of grouting with the cavity device, the line-source grouting method is used to inject the slurry into the cracks from the top, thus achieving non-destructive grouting repair of vertical cracks.
Based on the model test and numerical simulation study, the diffusion of modified polyurethane slurry in vertical cracks can be roughly divided into three stages: a downward diffusion stage in the form of a semicircle, a rapid diffusion stage in the form of an inverted trapezoid, and a stable diffusion stage in the form of a rectangle. The numerical results are in good agreement with the experimental results.
Using the exponential autocorrelation function, a more realistic rough crack model under Gaussian distribution is established. The three-dimensional spatial average slope parameter Z 2 3 D is used to characterize and evaluate the rough surface of the crack. The results show that the exponential autocorrelation function can effectively generate crack surfaces with different roughness levels, and the Z 2 3 D value correlates with the rough surface, allowing for quantitative evaluation of the rough surface.
Numerical simulations were used to study the diffusion behavior of modified polyurethane slurry in cracks with varying vertical roughness, and the relationship between slurry diffusion behavior and roughness was systematically analyzed. The results show that for cracks with the same straight-line distance, the increase in roughness only increases the path length of the crack and has no significant effect on the flow diffusion of the slurry. Based on this, the interval between grouting device should be reduced when repairing cracks through grouting.
In summary, this study is based on the diffusion test of modified polyurethane slurry, and the numerical model established is reasonable and can accurately predict the diffusion behavior of modified slurry in vertical cracks. It provides a foundation for the diffusion study of modified polyurethane slurry within vertical rough cracks.

Author Contributions

Conceptualization, B.F., X.L., S.X. and Y.Z.; methodology, B.F. and S.X.; validation, B.F.; investigation, B.F.; data curation, B.F.; writing-original draft preparation, B.F.; writing-review and editing, X.L., S.X., Y.Z. and B.Z.; supervision, X.L.; project administration, X.L.; funding acquisition, X.L. All authors have read and agreed to the published version of the manuscript.

Funding

This research was funded by the National Natural Science Foundation of China (Grant No. 52178401), Science and Technology Innovation Team Support Program for Henan Universities (Grant No. 23IRTSTHN014), Central Plains Talent Program in China (Grant No. 234200510014), and Water Conservancy Science and Technology Research Projects in Henan Province (Grant No. 72).

Data Availability Statement

The original contributions presented in the study are included in the article, further inquiries can be directed to the corresponding author.

Acknowledgments

We thank the National Natural Science Foundation of China (Grant No. 52178401), Science and Technology Innovation Team Support Program for Henan Universities (Grant No. 23IRTSTHN014), Central Plains Talent Program in China (Grant No. 234200510014), and Water Conservancy Science and Technology Research Projects in Henan Province (Grant No. 72).

Conflicts of Interest

The authors declare that they have no conflicts of interest.

References

  1. Mehta, P.K.; Monteiro, P.J.M. Concrete: Microstructure, Properties, and Materials; McGraw-Hill Education: New York, NY, USA, 2014. [Google Scholar]
  2. Wang, H.L.; Dai, J.G.; Sun, X.Y.; Zhang, X.L. Characteristics of concrete cracks and their influence on chloride penetration. Constr. Build. Mater. 2016, 107, 216–225. [Google Scholar] [CrossRef]
  3. Li, H.; Yang, H.; Li, X. Investigation on the working performance of a non-dispersible grouting material for the crack repairment of underwater structures. Constr. Build. Mater. 2023, 407, 133558. [Google Scholar] [CrossRef]
  4. Wu, H.; Zhu, M.; Liu, Z.; Yin, J. Developing a polymer-based crack repairing material using interpenetrate polymer network (IPN) technology. Constr. Build. Mater. 2015, 84, 192–200. [Google Scholar] [CrossRef]
  5. Liu, B.; Sang, H.M.; Liu, Q.S.; Liu, H.; Pan, Y.C.; Kang, Y.S. Laboratory study on diffusion and migration of grout in rock mass fracture network. Int. J. Geomech. 2021, 21, 04020242. [Google Scholar] [CrossRef]
  6. Li, Y.; Wu, C.; Jang, B.A. Effect of bedding plane on the permeability evolution of typical sedimentary rocks under triaxial compression. Rock Mech. Rock Eng. 2020, 53, 5283–5291. [Google Scholar] [CrossRef]
  7. Jin, L.; Sui, W. Experimental investigation on chemical grouting in rough 2D fracture network with flowing water. Bull. Eng. Geol. Environ. 2021, 80, 8519–8533. [Google Scholar] [CrossRef]
  8. Li, X.L.; Luo, X.Q.; Zhong, Y.H.; Zhang, B. Numerical model of planar fracture grouting based on FVM and VOF. J. Hydroelectr. Eng. 2018, 37, 142–150. [Google Scholar]
  9. Hu, Y.; Liu, W.; Ma, T. Study on visual simulation experiment of water-displacing grouting in fractured aquifer. Environ. Earth Sci. 2024, 83, 4. [Google Scholar] [CrossRef]
  10. Ao, X.F.; Wang, X.X.; Zhao, M.M.; Wu, H.; Zhu, Y. Three-dimensional grouting simulation in fractured rock mass of the dam bedrock. J. Hydraul. Eng. 2017, 48, 945–954. [Google Scholar]
  11. Yang, X.Z.; Wang, X.H.; Lei, J.S. Study on grouting diffusion radius of Bingham fluids. J. Hydraul. Eng. 2004, 6, 75–79. [Google Scholar]
  12. Wang, X.L.; Wang, Q.S.; Zhou, Z.Y.; Ao, X.F. Three-dimensional turbulent numerical simulation of Bingham fluid in the goaf grouting of the South-to-North Water Transfer Project. J. Hydraul. Eng. 2013, 44, 1295–1302. [Google Scholar]
  13. Wang, X.L.; Li, R.J.; Ao, X.F.; Deng, S.H. Three-Dimensional numerical simulation of grouting in stochastic fracture network of dam bedrock in hydropower engineering. Eng. Mech. 2018, 35, 148–159. [Google Scholar]
  14. Hässler, L.; Håkansson, U.; Stille, H. Computer-simulated flow of grouts in jointed rock. Tunn. Undergr. Space Technol. 1992, 7, 441–446. [Google Scholar] [CrossRef]
  15. Saeidi, O.; Stille, H.; Torabi, S.R. Numerical and analytical analyses of the effects of different joint and grout properties on the rock mass groutability. Tunn. Undergr. Space Technol. 2013, 38, 11–25. [Google Scholar] [CrossRef]
  16. Luo, P.P.; Chen, L.; Zou, Z.S. Numerical simulation of grouting in space fracture networks of rock mass. Chin. J. Geotech. Eng. 2007, 29, 1844–1848. [Google Scholar]
  17. Yu, W.S.; Li, P.; Zhang, X.; Wang, Q. Model test research on hydrodynamic grouting for single fracture with variable inclinations. Rock Soil Mech. 2014, 35, 2137–2143+2149. [Google Scholar]
  18. Zhang, Q.S.; Zhang, L.Z.; Zhang, X.; Liu, R.T.; Zhu, M.T.; Zheng, D.Z. Grouting diffusion in a horizontal crack considering temporal and spatial variation of viscosity. Chin. J. Rock Mech. Eng. 2015, 34, 1198–1210. [Google Scholar]
  19. Mohajerani, S.; Baghbanan, A.; Bagherpour, R.; Hashemolhosseini, H. Grout penetration in fractured rock mass using a new developed explicit algorithm. Int. J. Rock Mech. Min. Sci. 2015, 80, 412–417. [Google Scholar] [CrossRef]
  20. Li, S.; Liu, R.; Zhang, Q.S.; Sun, Z.Z.; Zhang, X.; Zhu, M.T. Research on C-S slurry diffusion mechanism with time-dependent behavior of viscosity. Chin. J. Rock Mech. Eng. 2013, 32, 2415–2421. [Google Scholar]
  21. Zhang, L.; Yang, Z.B.; Li, D.Q.; Chen, Y.F. Investigation into displacement behavior of grout in a transparent fracture replica through visualized experiments. Rock Soil Mech. 2023, 44, 1708–1718. [Google Scholar]
  22. Li, B.; Wang, Y.; Zou, L.C.; Yang, L. Displacement laws of grout-water two-phase flow in a rough-walled rock fracture through visualization tests. Chin. J. Geotech. Eng. 2022, 44, 1608–1616. [Google Scholar]
  23. Yang, P.; Liu, Y.H.; Gao, S.W.; Li, Z.C. Experiment on sealing efficiency of carbon fiber composite grout under flowing conditions. Constr. Build. Mater. 2018, 182, 43–51. [Google Scholar] [CrossRef]
  24. Zhou, X.; Sheng, J.L.; Ye, Z.Y. Study on two-phase displacement flow behavior through rough-walled fractures using LBM simulation. Chin. J. Theor. Appl. Mech. 2024, 56, 1475–1487. [Google Scholar]
  25. Zhu, Y.B.; Li, C.D.; Zhou, J.Q.; Xiang, L.Y.; Jiang, X.H.; Zhu, W.Y. Influernce of permeable matrix on non-Darcian flow in single rough-walled fracture. Rock Soil Mech. 2024, 45, 601–611. [Google Scholar]
  26. Jeong, W.; Song, J. A numerical study on flow and transport in a rough fracture with self-affine fractal variable apertures. Energy Sources Part A 2008, 30, 606–619. [Google Scholar] [CrossRef]
  27. Hao, M.M.; Song, T.; Li, X.L.; Zou, L.C.; Zhong, Y.H.; Zhang, B.; Wang, L.B. Propagation Analysis of Polymer Grout in Vertical Fractures: An Experimental and Numerical Study. KSCE J. Civ. Eng. 2024, 28, 1217–1226. [Google Scholar] [CrossRef]
  28. Beer, A.J.; Stead, D.; Coggan, J.S. Technical Note Estimation of the Joint Roughness Coefficient (JRC) by Visual Comparison. Rock Mech. Rock Eng. 2002, 35, 65–74. [Google Scholar] [CrossRef]
  29. Mandelbrot, B.B.; Wheeler, J.A. The Fractal Geometry of Nature. Am. J. Phys. 1983, 51, 286–287. [Google Scholar] [CrossRef]
  30. Fardin, N.; Stephansson, O.; Jing, L. The scale dependence of rock joint surface roughness. Int. J. Rock Mech. Min. Sci. 2001, 38, 659–669. [Google Scholar] [CrossRef]
  31. Chen, S.J.; Zhu, W.C.; Zhang, M.S.; Yu, Q.L. Fractal description of rock joints based on digital image processing technique. Chin. J. Geotech. Eng. 2012, 34, 2087–2092. [Google Scholar]
  32. Yin, H.M.; Zhang, Y.H.; Kong, X.H. Estimation of joint shear strength based on fractal method. Hydrogeol. Eng. Geol. 2011, 38, 58–62. [Google Scholar]
  33. Xiong, W. Study on Dynamic Water Grouting Test and Slurry Diffusion Model of Rock Fracture. Master Dissertation, Xi’an University of Technology, Xi’an, China, 2021. [Google Scholar]
  34. ISO 25178-2:2012; Geometrical Product Specifications (GPS)—Surface Texture: Areal—Part 2: Terms, Definitions and Surface Texture Parameters. International Organization for Standardization: Geneva, Switzerland, 2012.
  35. Ge, S.R.; Tonder, K. The fractal behavior and fractal characterization of rough surfaces. Tribology 1997, 17, 74–81. [Google Scholar]
  36. Ge, S.R.; Suo, S.F. The computation methods for the fractal dimension of surface profiles. Tribology 1997, 17, 66–74. [Google Scholar]
  37. Xiong, X.B.; Li, B.; Jiang, Y.J.; Kayama, T.; Zhang, C.H. Experimental and numerical study of the geometrical and hydraulic characteristics of a single rock fracture during shear. Int. J. Rock Mech. Min. Sci. 2011, 48, 1292–1302. [Google Scholar] [CrossRef]
  38. Zou, L.C.; Li, B.; Mo, Y.Y.; Cvetkovic, V. A high-resolution contact analysis of rough-walled crystalline rock fractures subject to normal stress. Rock Mech. Rock Eng. 2020, 53, 2141–2155. [Google Scholar] [CrossRef]
  39. Xu, L.; Ren, Q.W.; Ye, Z.C.; Xu, L.Y. Research on the scale effect on the 3-D surface topography of rock joint. J. Wuhan Univ. Technol. 2008, 30, 103–105. [Google Scholar]
  40. Thomas, T.R. Rough Surfaces, 2nd ed.; Imperial College Press: London, UK, 1999. [Google Scholar]
  41. Yan, P.; Wu, G.Q.; Fu, L.M.; Hun, X.J. Numerical Simulation of Flow Field around Car. J. Tongji Univ. Nat. Sci. 2003, 31, 1082–1086. [Google Scholar]
  42. Wang, K.; Wang, L.G.; Ren, B.; Fan, H. Study on seepage simulation of high pressure grouting in microfractured rock mass. Geofluids 2021, 2021, 1–12. [Google Scholar] [CrossRef]
  43. Li, X.L.; Fan, B.S.; Wang, J.X.; Ma, P.; Zhong, Y.H.; Wang, J.L.; Zhang, B.; Zhu, W.Y. A Visualized Concrete Crack Repair Sealing Grouting Device and Method of Use. Henan:CN202211323896.8, 13 January 2023. [Google Scholar]
  44. Chen, H.; Hu, Y.Z.; Wang, H. Computer Simulation of Rough Surfaces. Lubr. Eng. 2006, 10, 52–55+59. [Google Scholar]
  45. Thomas, T.R.; Zhou, G.R. Rough Surface Measurement, Characterisation and Applications; Zhejiang University Press: Zhejiang, China, 1987. [Google Scholar]
  46. Du, J.H.; Qin, M.W.; Xiao, R.J. Foreign Chemical Grouting Tutorial; Water Resources and Electric Power Press: Beijing, China, 1987. [Google Scholar]
  47. Seo, D.; Youn, J.R.; Tucker, C.L. Numerical simulation of mold filling in foam reaction injection molding. Int. J. Numer. Methods Fluids 2003, 42, 1105–1134. [Google Scholar] [CrossRef]
  48. Haagh, G.A.; Van De Vosse, F.N. Simulation of Three-Dimensional Polymer Mould Filling Processes Using a Pseudo-Concentration Method. Int. J. Numer. Methods Fluids 1998, 28, 1355–1369. [Google Scholar] [CrossRef]
  49. Rojas, A.J.; Marciano, J.H.; Williams, R.J. Rigid polyurethane foams: A model of the foaming process. Polym. Eng. Sci. 1982, 22, 840–844. [Google Scholar] [CrossRef]
  50. Hao, M.M.; Li, X.L.; Wang, X.L.; Zhong, Y.H.; Zhang, B.; Wang, F.M.; Zhang, Y.L. Experimental study on viscosity characteristics of expanding polymer grout. J. Wuhan Univ. Technol. Mater. Sci. Ed. 2021, 36, 297–302. [Google Scholar] [CrossRef]
  51. Zhao, J.T.; Zhao, D.; Liebscher, M.; Yin, B.; Mohammadi, M.; Butler, M.; Köberle, T.; Kaliske, M.; Mechtcherine, V. Temperature-dependent pullout behavior of geopolymer concrete reinforced with polymer-or mineral-impregnated carbon fiber composites: An experimental and numerical study. ACS Sustain. Chem. Eng. 2023, 11, 8474–8486. [Google Scholar] [CrossRef]
  52. El Tani, M.; Stille, H. Grout spread and injection period of silica solution and cement mix in rock fractures. Rock Mech. Rock Eng. 2017, 50, 2365–2380. [Google Scholar] [CrossRef]
  53. Loukjanov, I.V. Evaluation of the autocorrelation functions used when investigating surface roughness. J. Mech. Eng. Sci. 1979, 21, 105–113. [Google Scholar] [CrossRef]
  54. Wang, Y.Z.; Sun, Y.X.; He, Y.L.; Song, Y.Q.; Cao, W.J. Effect of CeO2 on microstructure and sliding wear properties of Cr2O3 ceramic coating with plasma spraying method. J. China Univ. Pet. Ed. Nat. Sci. 2002, 26, 65–67. [Google Scholar]
Figure 1. Material Viscosity-Time Variation at Different Ambient Temperatures and Fitting Curves.
Processes 12 01336 g001
Figure 2. Visualisation of crack grouting devices.
Processes 12 01336 g002
Figure 3. Visualisation of crack grouting test.
Processes 12 01336 g003
Figure 4. Diffusion of modified polyurethane slurry in vertical cracks.
Processes 12 01336 g004
Figure 5. Width of slurry spreading in the crack.
Processes 12 01336 g005
Figure 6. Numerical simulation of slurry diffusion (Red represents slurry, and blue represents air).
Processes 12 01336 g006
Figure 7. Numerical simulation compared to test diffusion.
Processes 12 01336 g007
Figure 8. Numerical simulation compared to test diffusion widths.
Processes 12 01336 g008
Figure 9. Rough Surface Elevation Map.
Processes 12 01336 g009
Figure 10. Rough surface of the crack model.
Processes 12 01336 g010aProcesses 12 01336 g010b
Figure 11. Comparison of simulated diffusion of slurry in cracks with different roughnesses.
Processes 12 01336 g011
Figure 12. Comparison of crack diffusion widths for different roughnesses.
Processes 12 01336 g012
Table 1. Polyurethane Components.
Main IngredientsCatalystsSurfactantDiluentFlame Retardant
Component APolyether polyolTriethylamine, DiethylenetriaminePolyoxyethylene-based nonionic active agentDibutyl phthalate\
Component BIsocyanate\\Dichloromethane, Dimethyl carbonateTrimethyl phosphate
Disclaimer/Publisher’s Note: The statements, opinions and data contained in all publications are solely those of the individual author(s) and contributor(s) and not of MDPI and/or the editor(s). MDPI and/or the editor(s) disclaim responsibility for any injury to people or property resulting from any ideas, methods, instructions or products referred to in the content.

