

Coordinated Optimization of Hydrogen-Integrated Energy Hubs with Demand Response-Enabled Energy Sharing


Abstract
:1. Introduction
1.1. Literature Review
1.2. Research Gaps and Contribution
- This work develops a tri-hub hydrogen-based integrated energy system that optimizes cost, reduces emissions, and facilitates energy-sharing coordination among producers, prosumers, and consumer hubs. This study aims to maximize the benefits of green hydrogen through electrolysis. Additionally, P2G can use a methanation reactor to increase energy efficiency and operating economics by preparing natural gas with less wind and photovoltaic electricity.
- This paper introduces an integrated demand response mechanism into the proposed energy-sharing model between energy hubs.
- This study evaluates the proposed model, including CCS-P2G and energy-sharing technology, by comparing it with the traditional multistage operating model. The proposed model enhances the coupling efficiency of electricity, natural gas, and carbon trading markets. TH-HIES can reduce overall costs and emissions by sharing them across nearby hubs.
1.3. Paper Layout
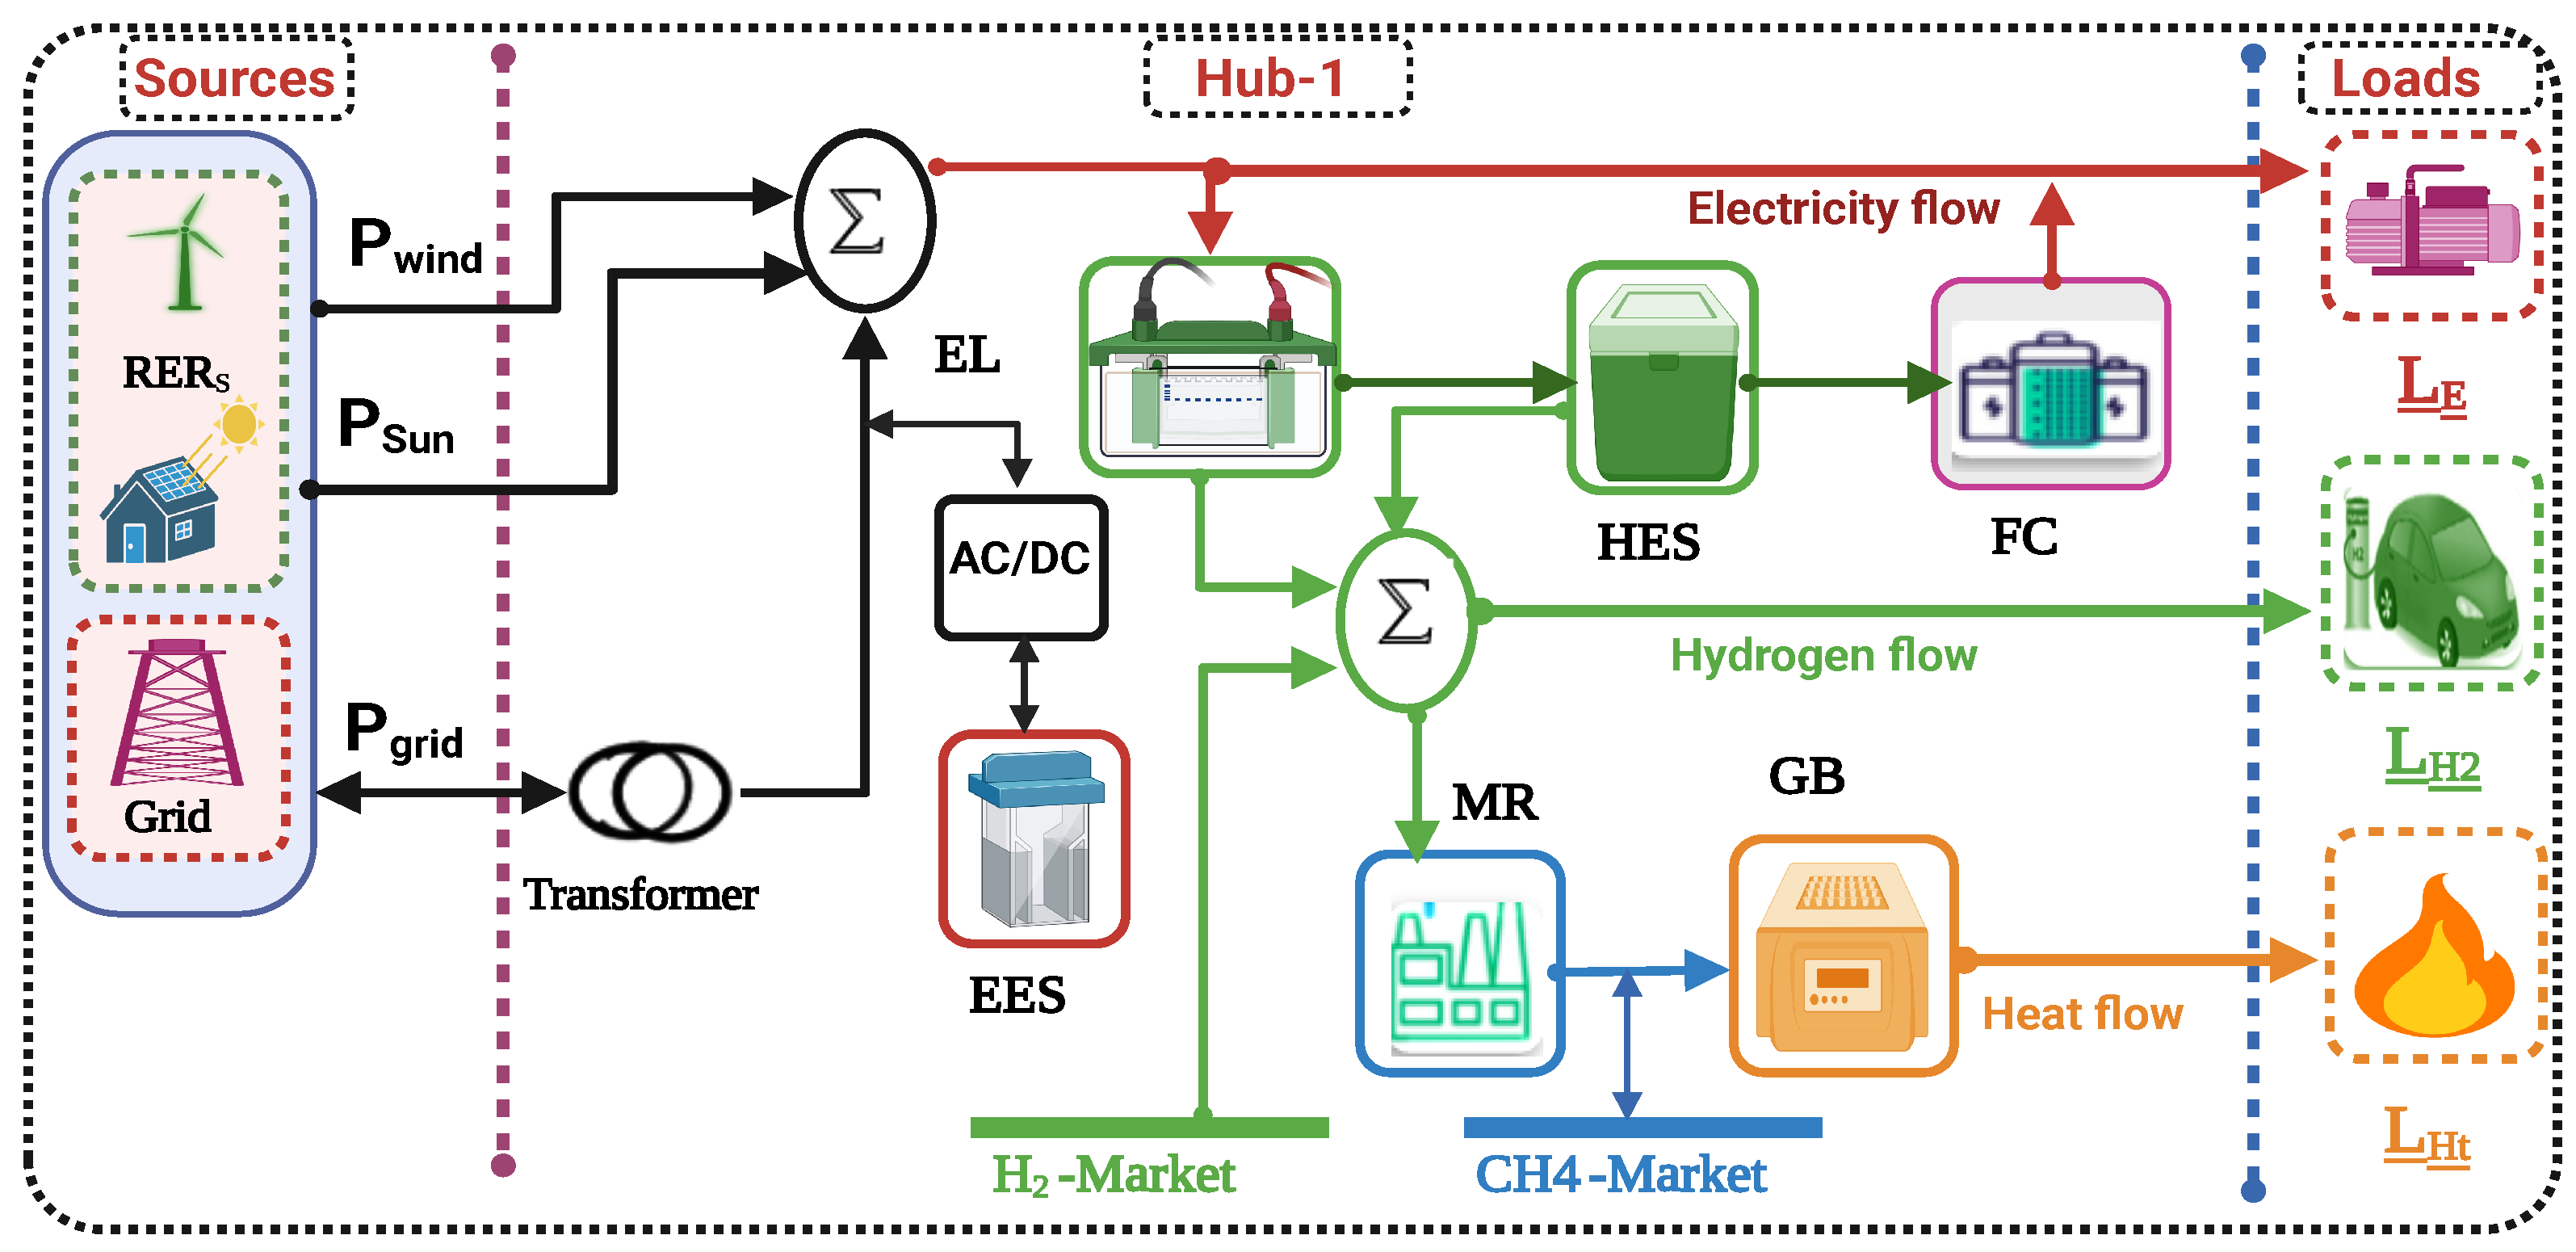
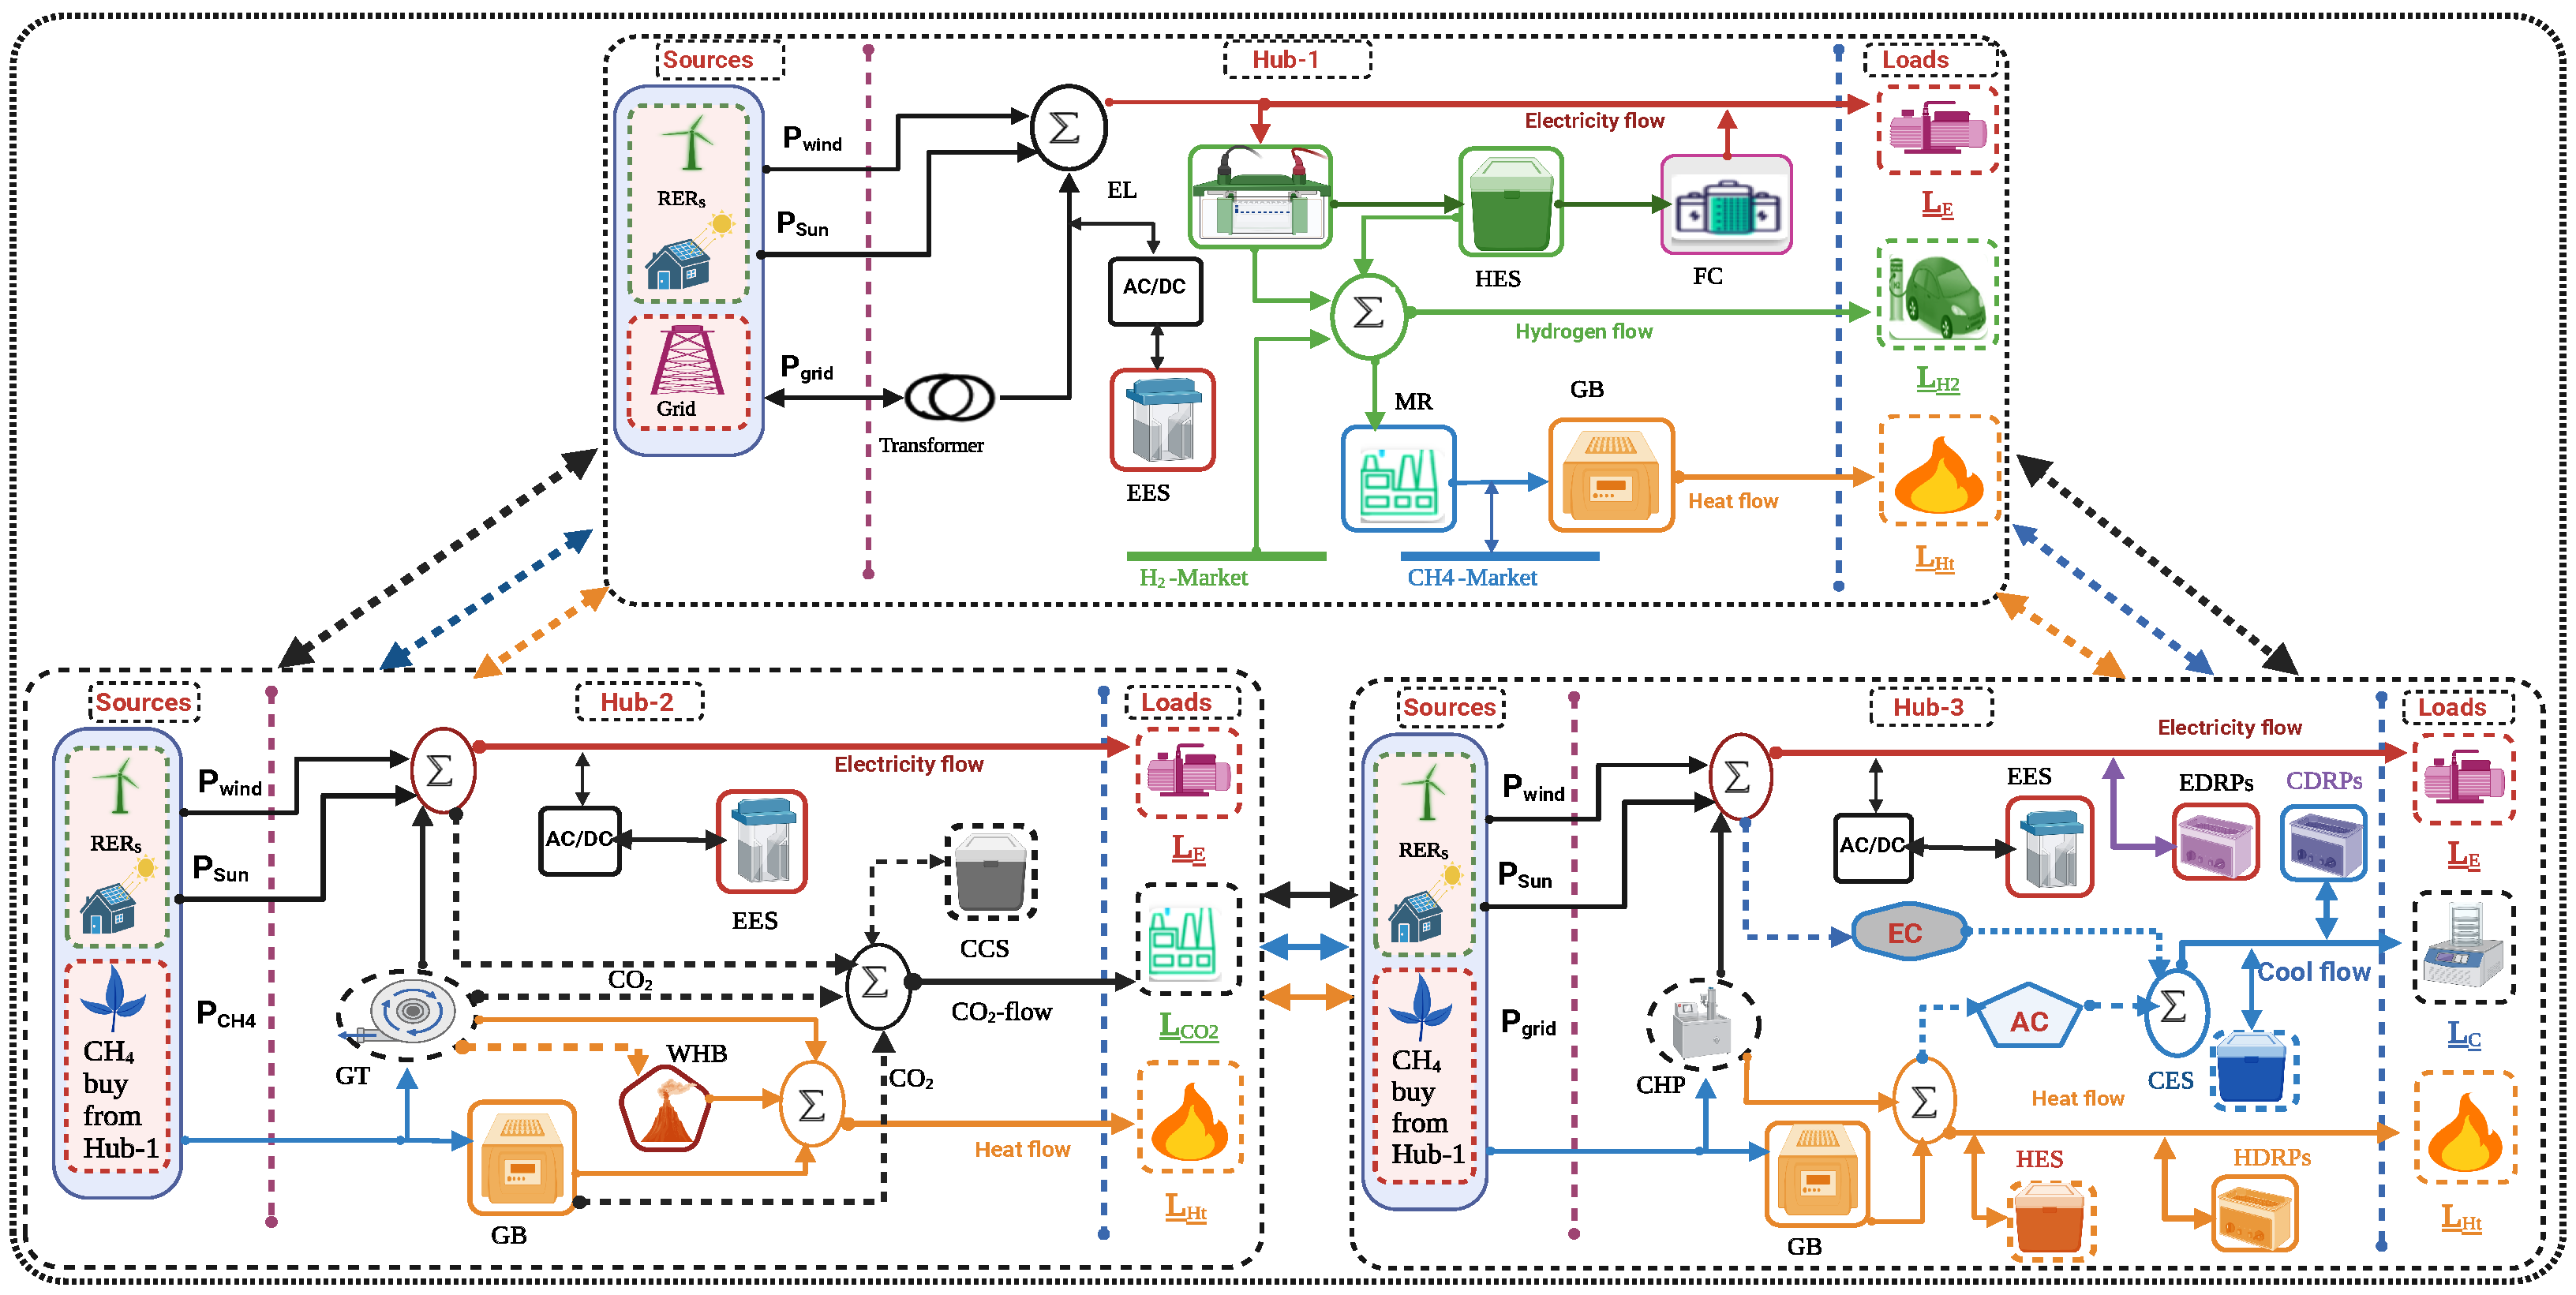
2. Model Structure
Integrated Energy Hubs Description
3. TH-HIES Operating Framework
3.1. Objective Function
3.2. Facility Cost Level Operation Constraints
3.2.1. Advanced Power to Hydrogen Gas and Methanation Reactor Constraints
3.2.2. Methanation Reactor Constraints
3.2.3. Energy Supply Equipment’s Model
3.2.4. Carbon Trading, Emission, and Government Quota Allocation Constraints
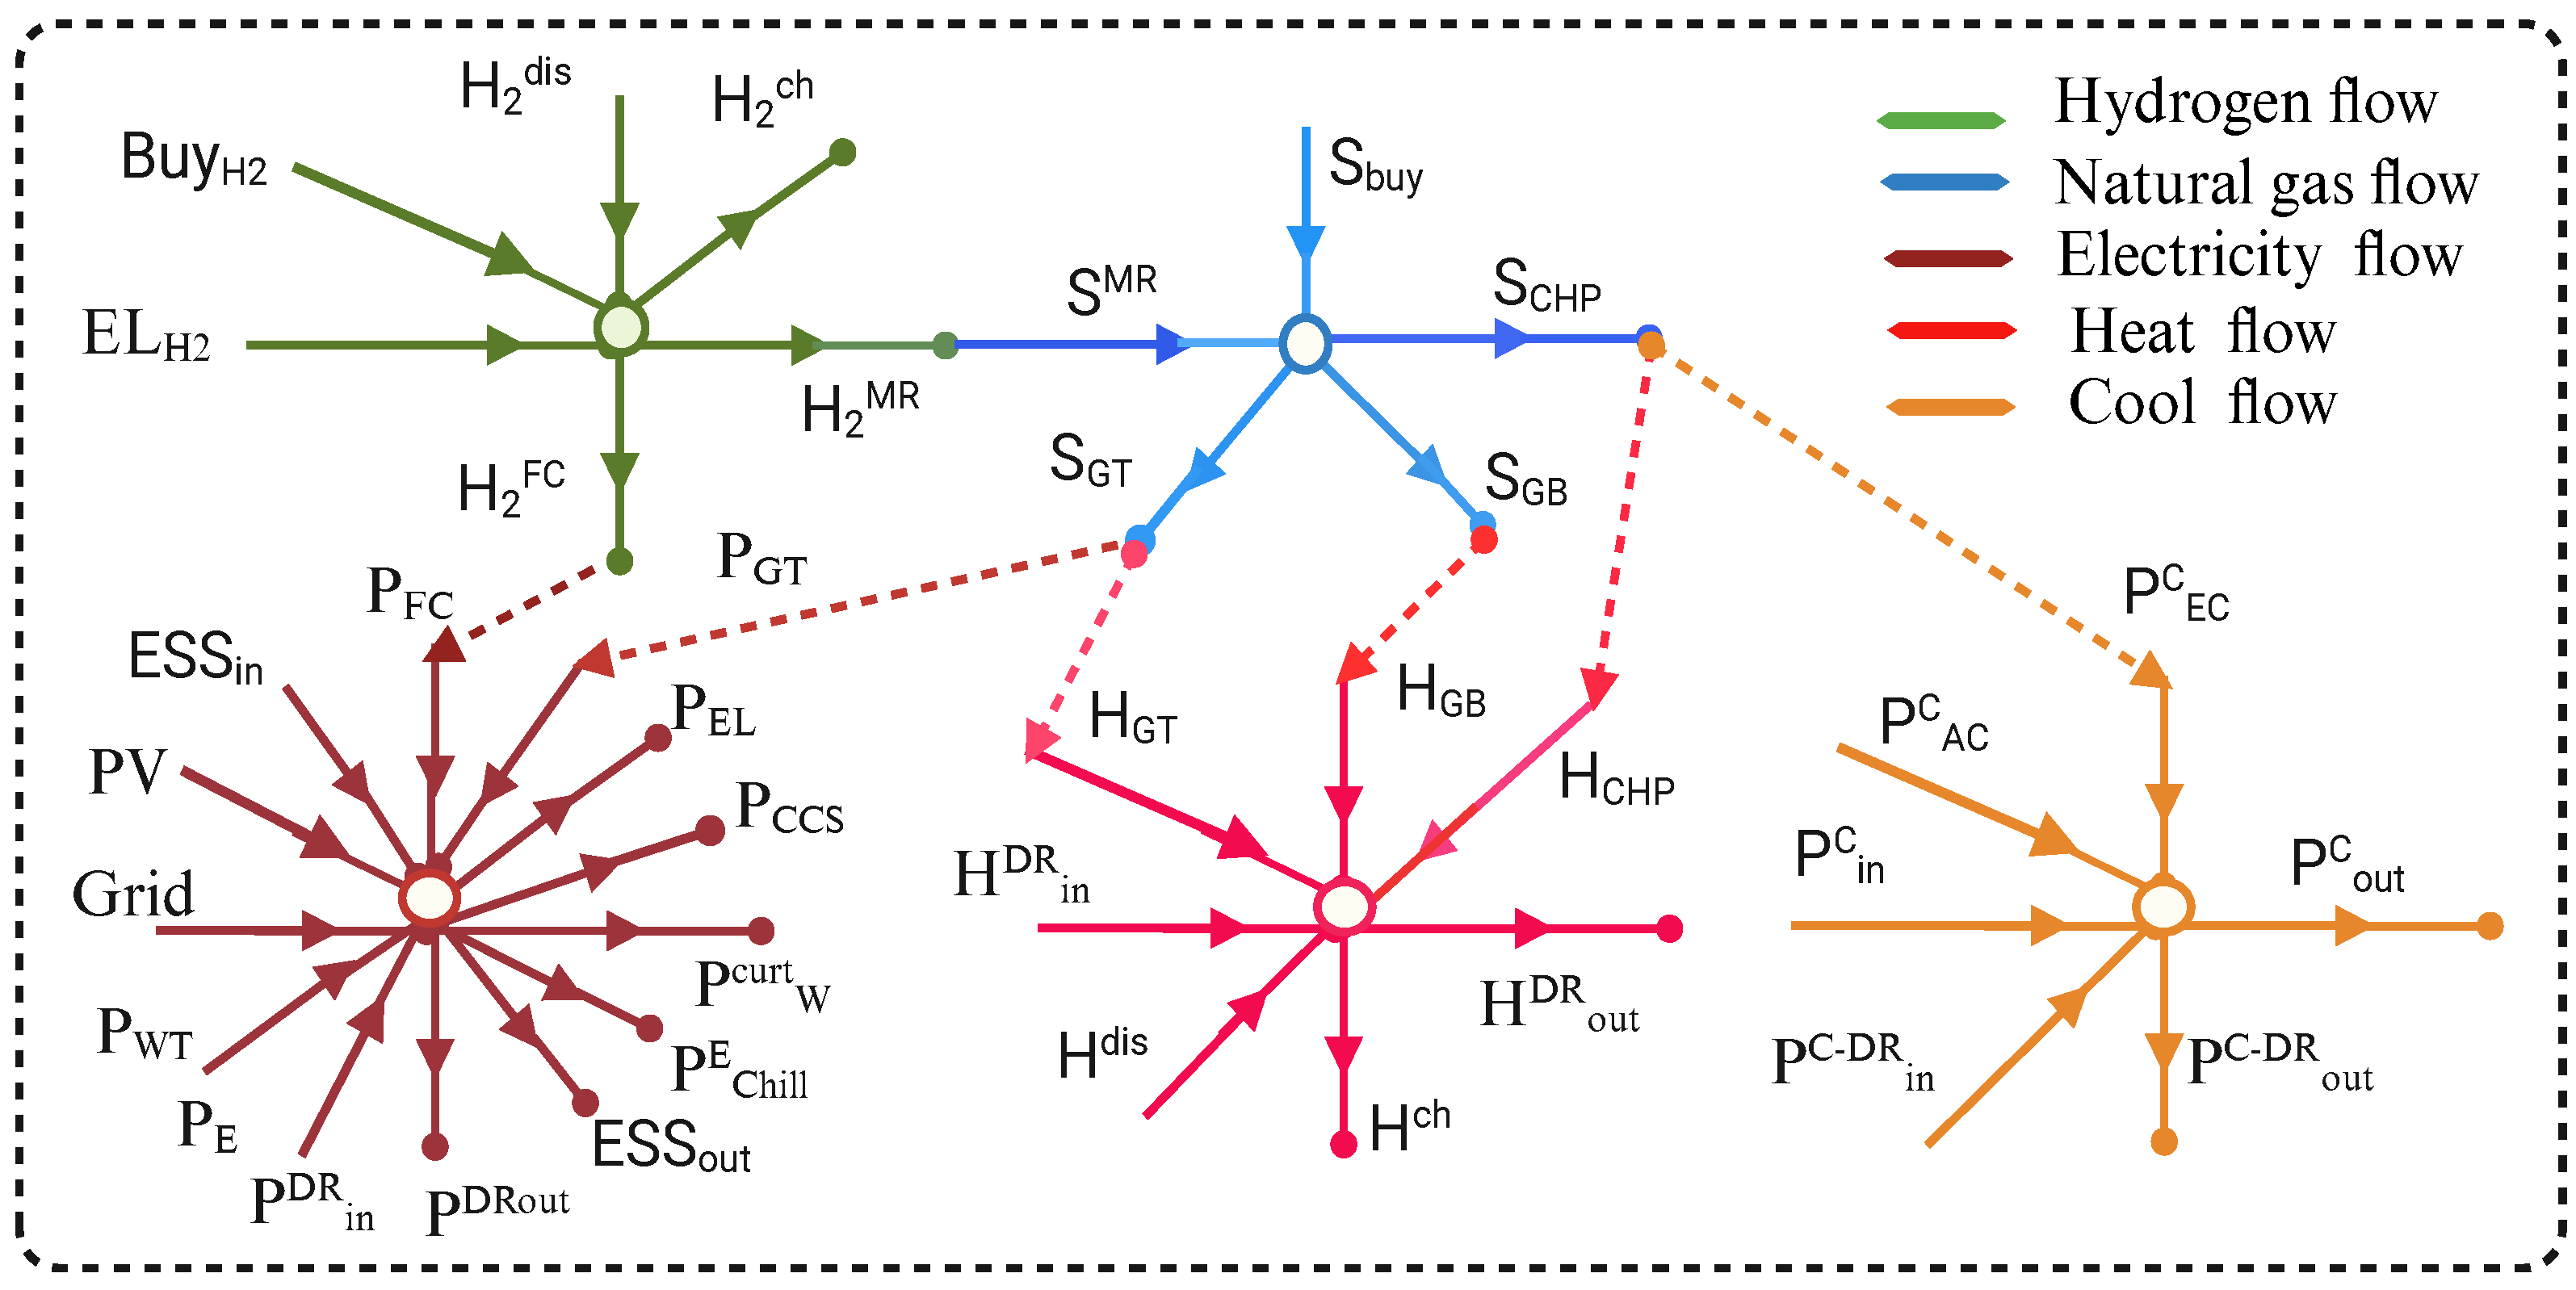
3.2.5. Energy Balance Constraints
3.2.6. Optimal Transportation Cost Constraints
3.3. Integrated Demand Response Programming’s (IDRPs) Model
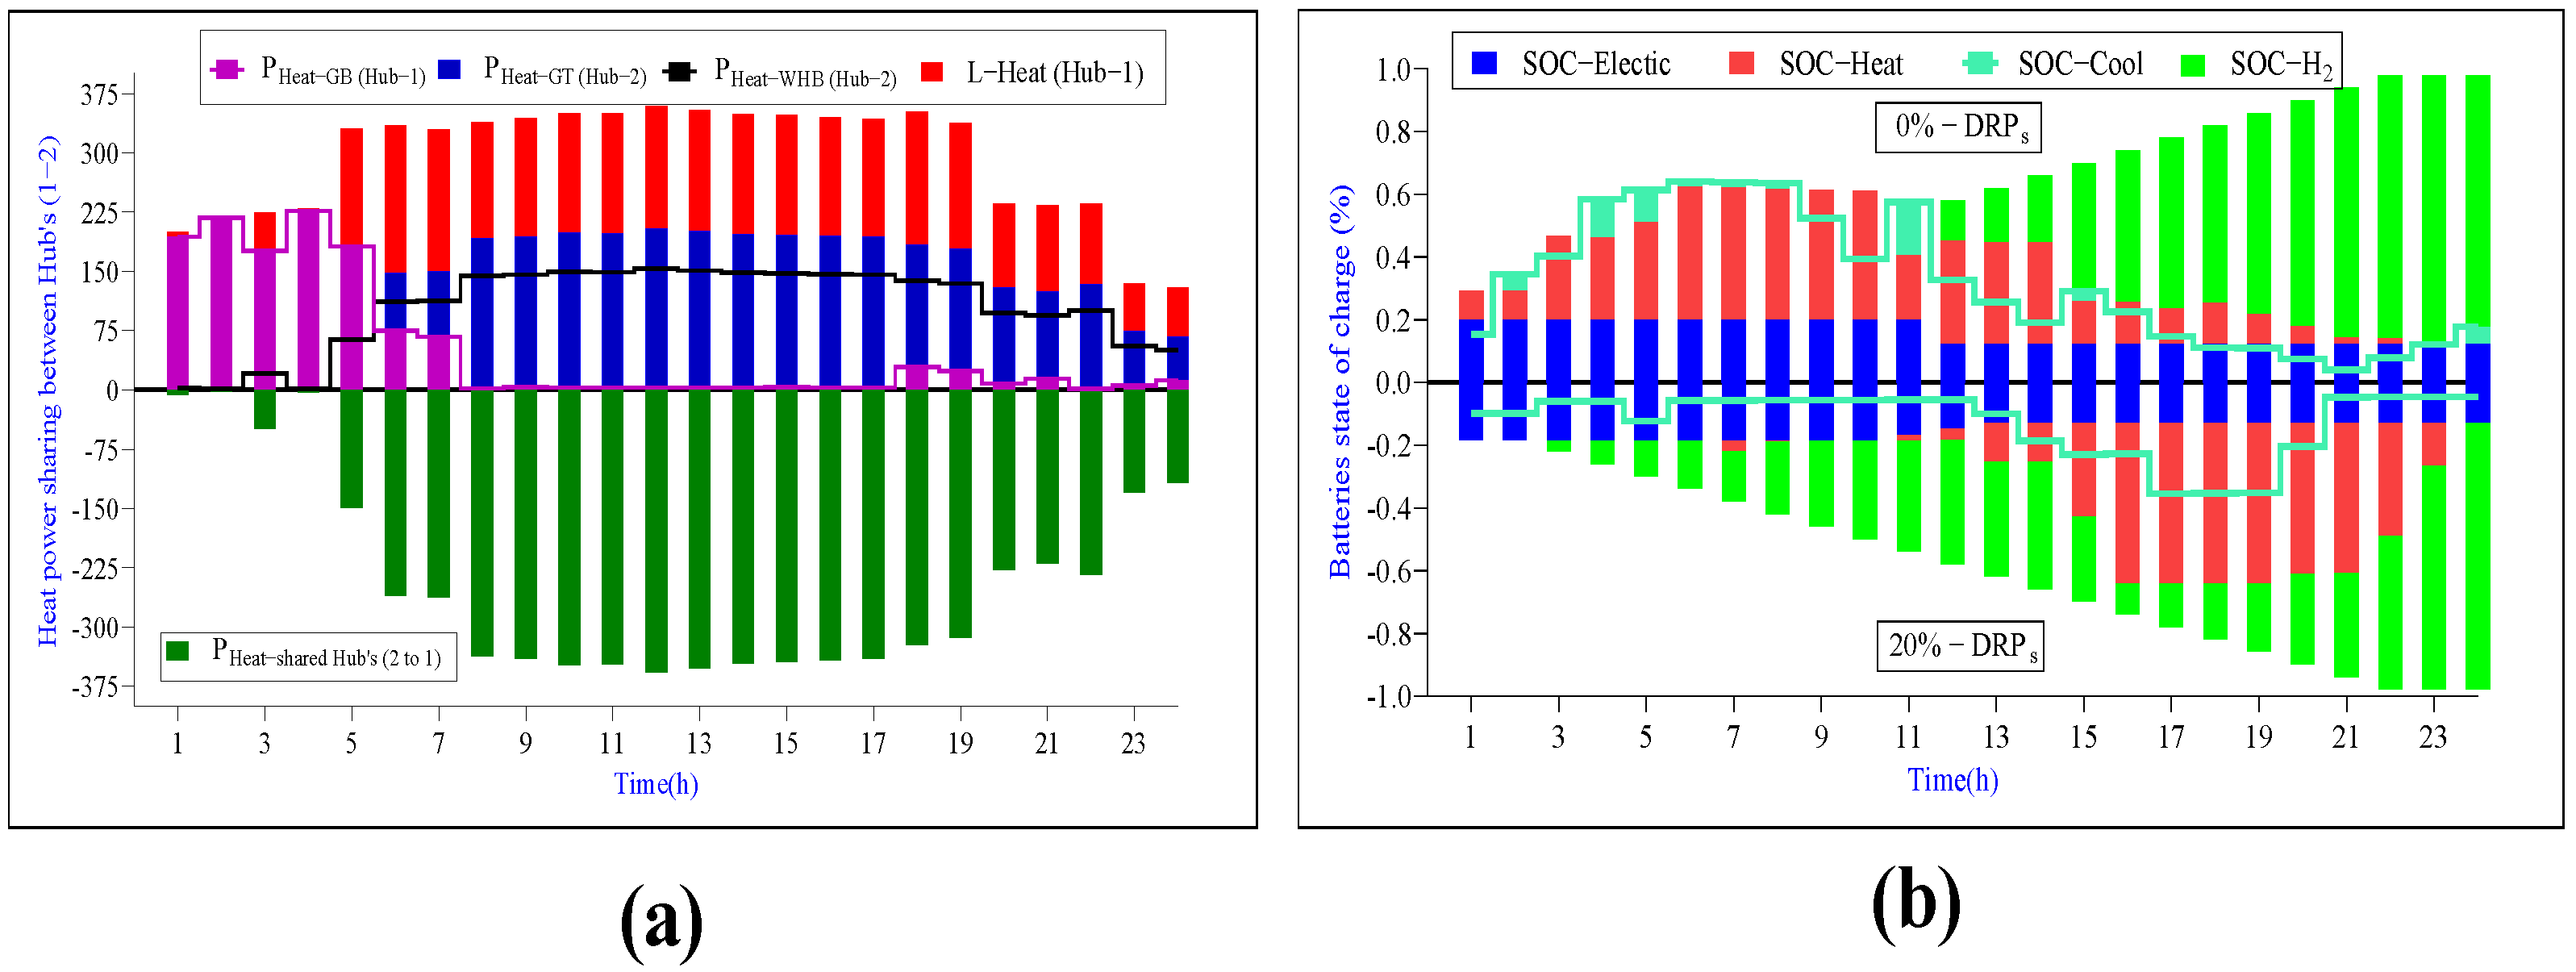
3.4. Energy Sharing Model
4. Simulation Results and Discussion
4.1. Data Description
4.2. Case Study
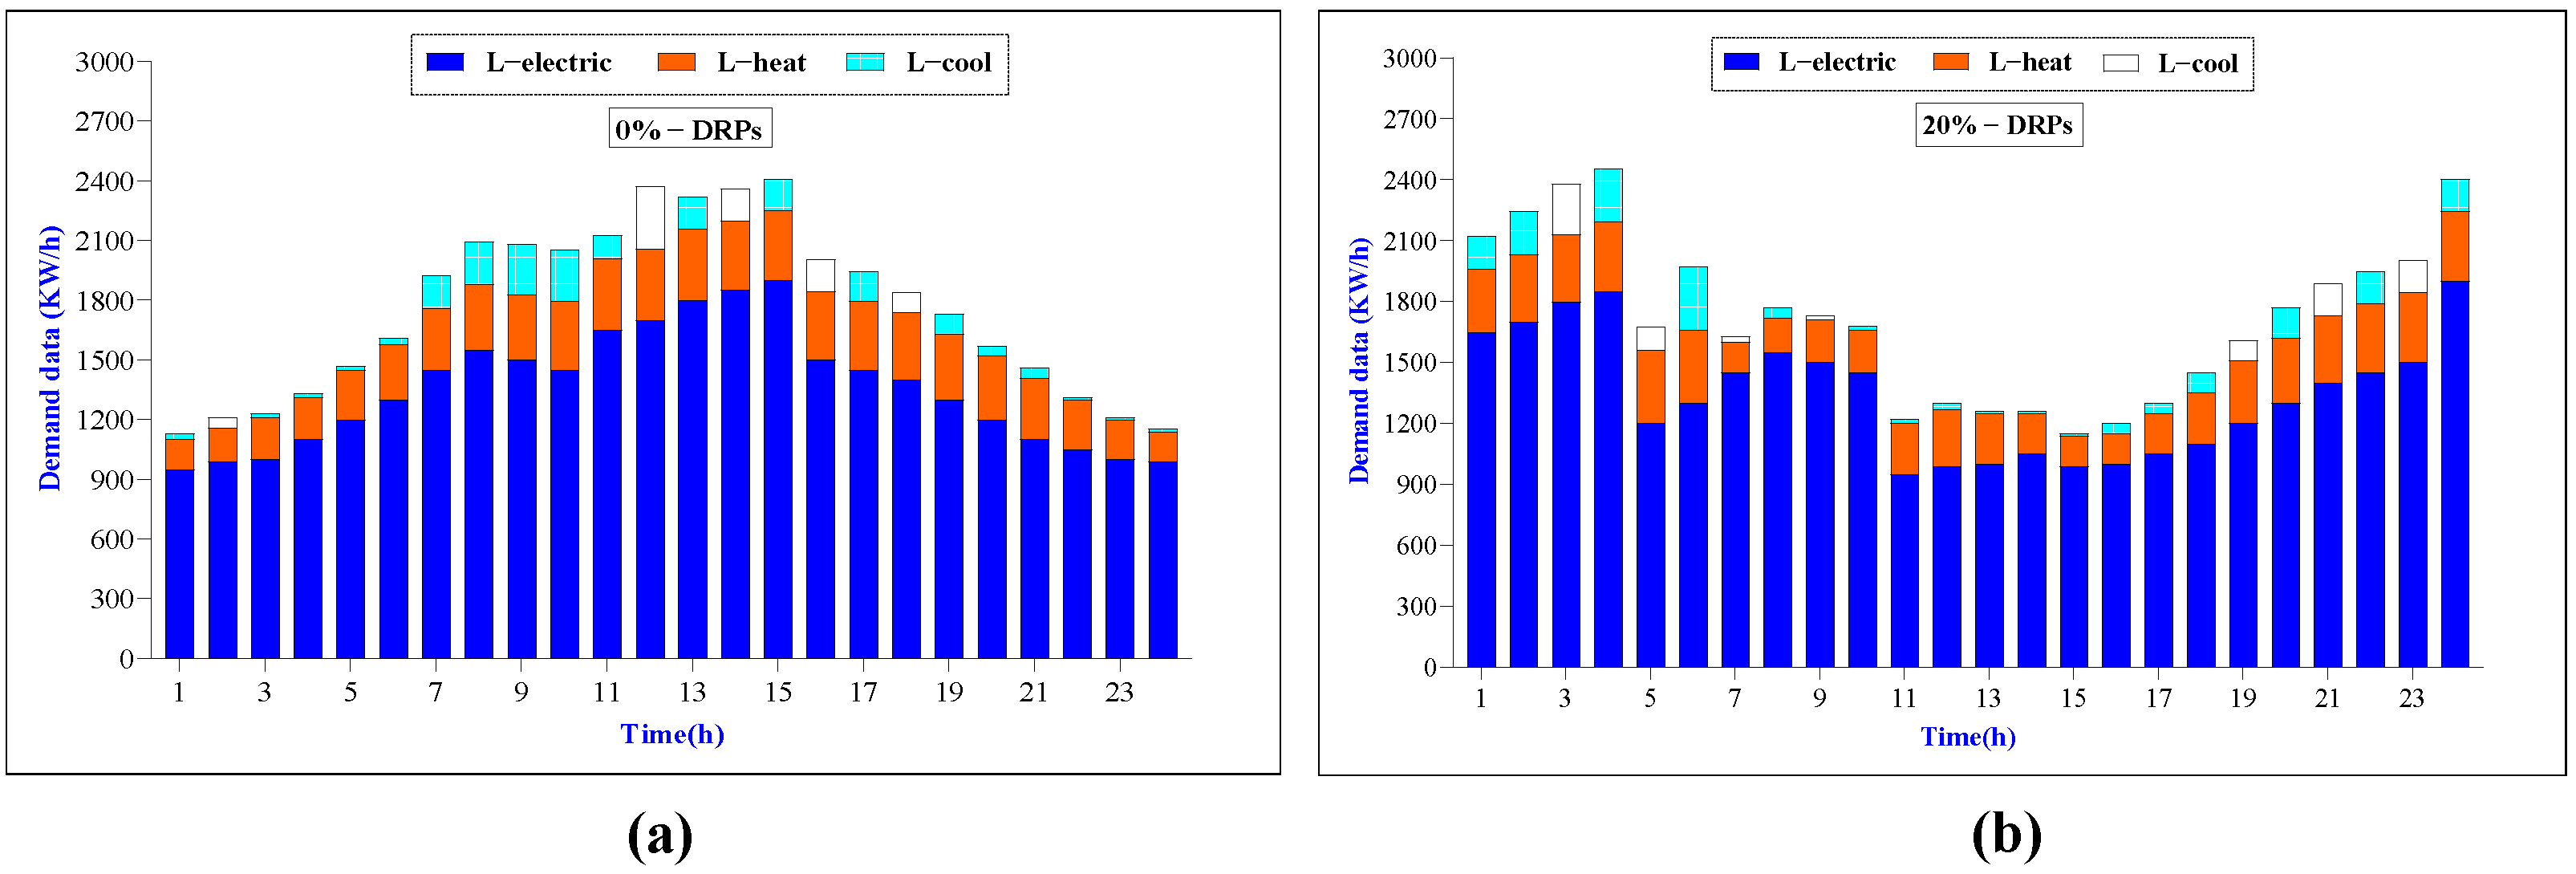
- Evaluate the proposed integration of multiple networks encompassing power, gas, heating, cooling, and hydrogen while incorporating carbon capture and storage and power-to-gas technologies. This assessment includes the analysis of power transportation costs, the presence of an energy storage system (ESS), energy sharing, and carbon trading, all under a fixed load condition with a 0% DRP.
- Investigate system flexibility and energy utilization efficiency by implementing a 20% DRP across electricity, heating, and cooling loads on the consumer side, with all other conditions remaining consistent with those in case 1.
4.3. Scheduling Results Analysis
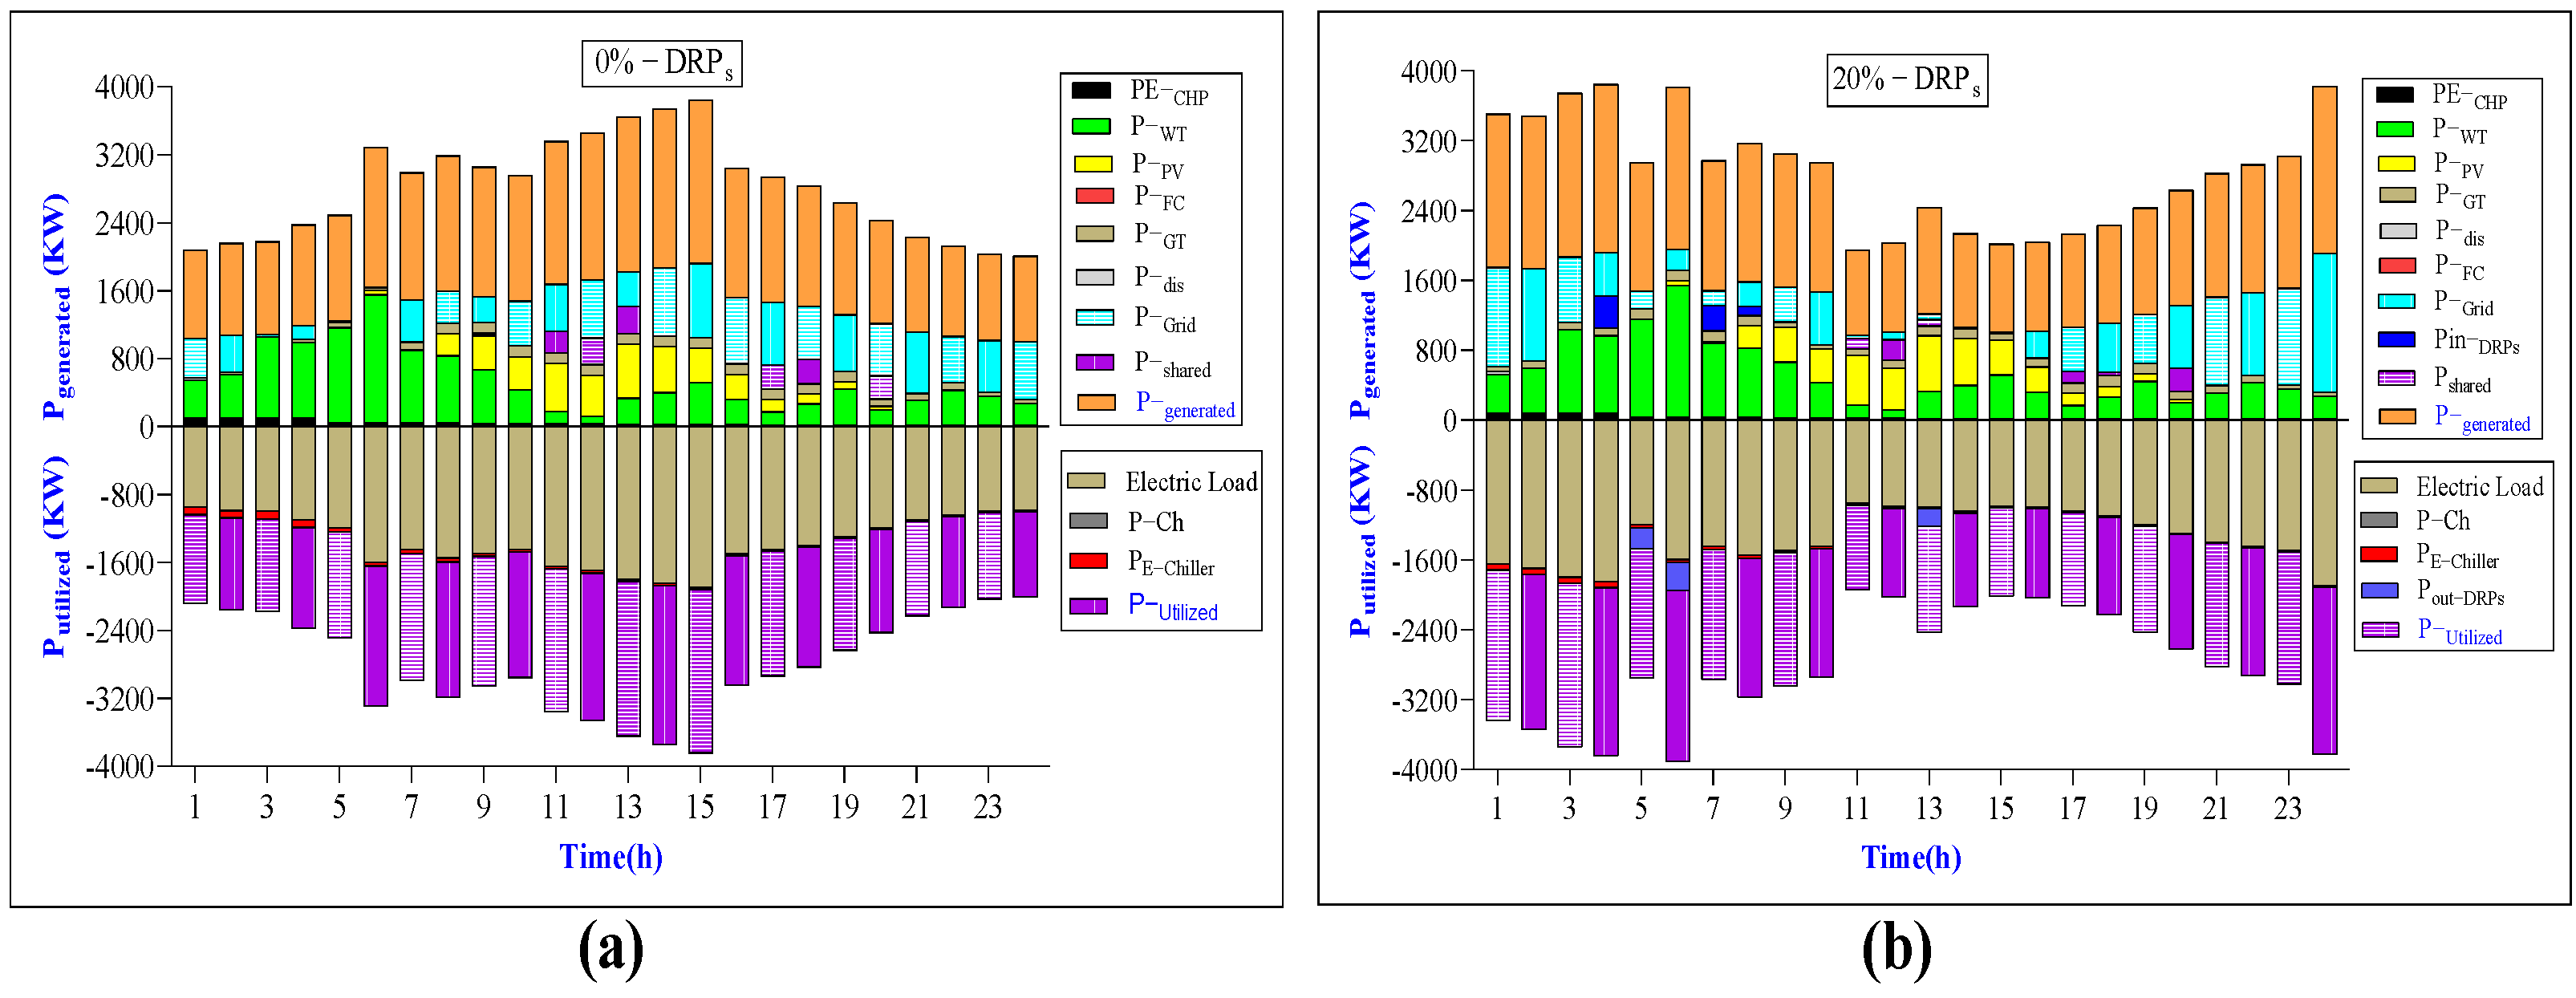
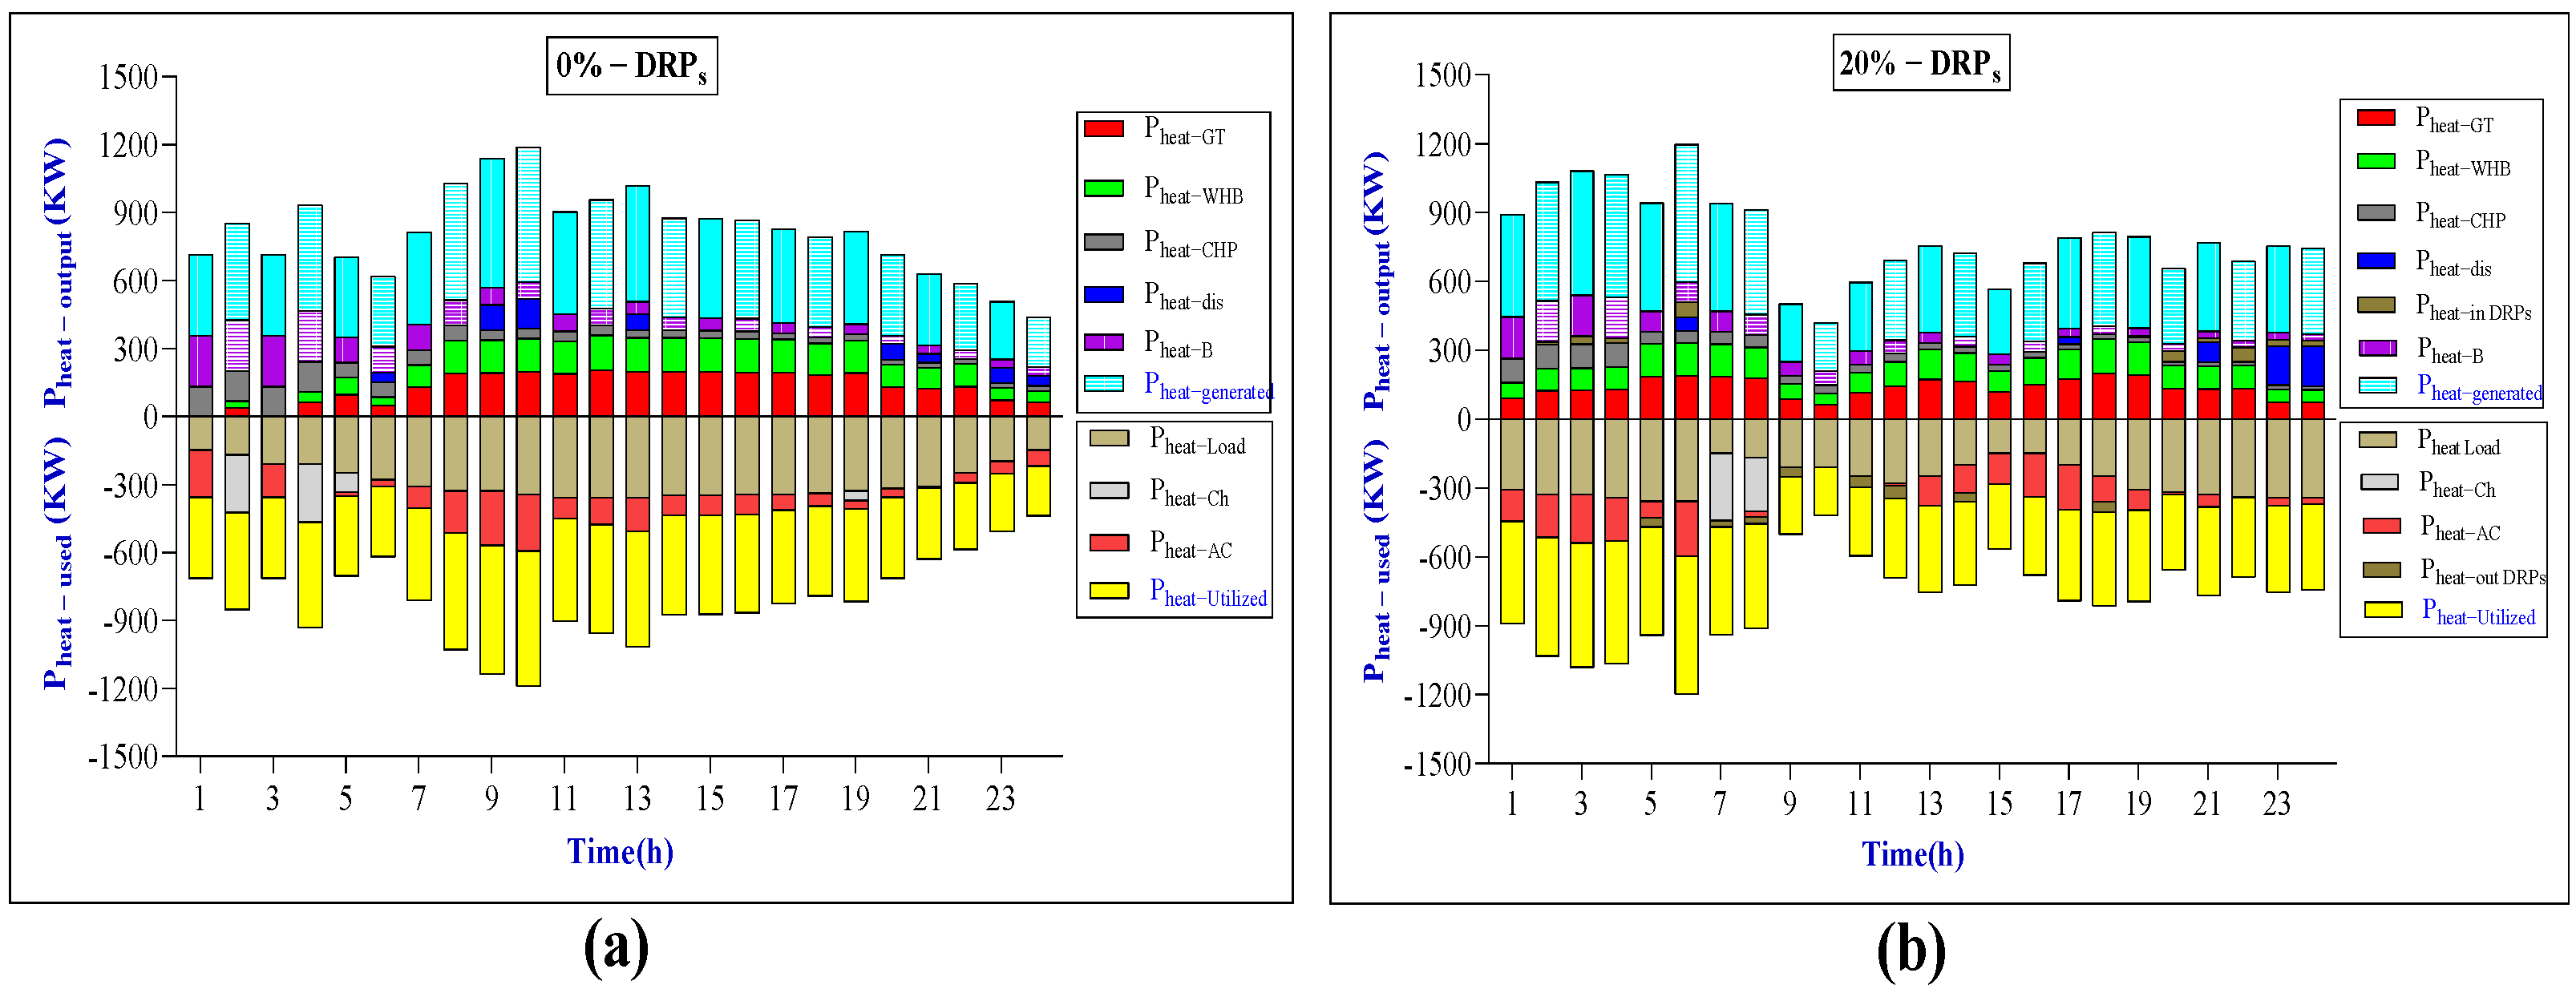
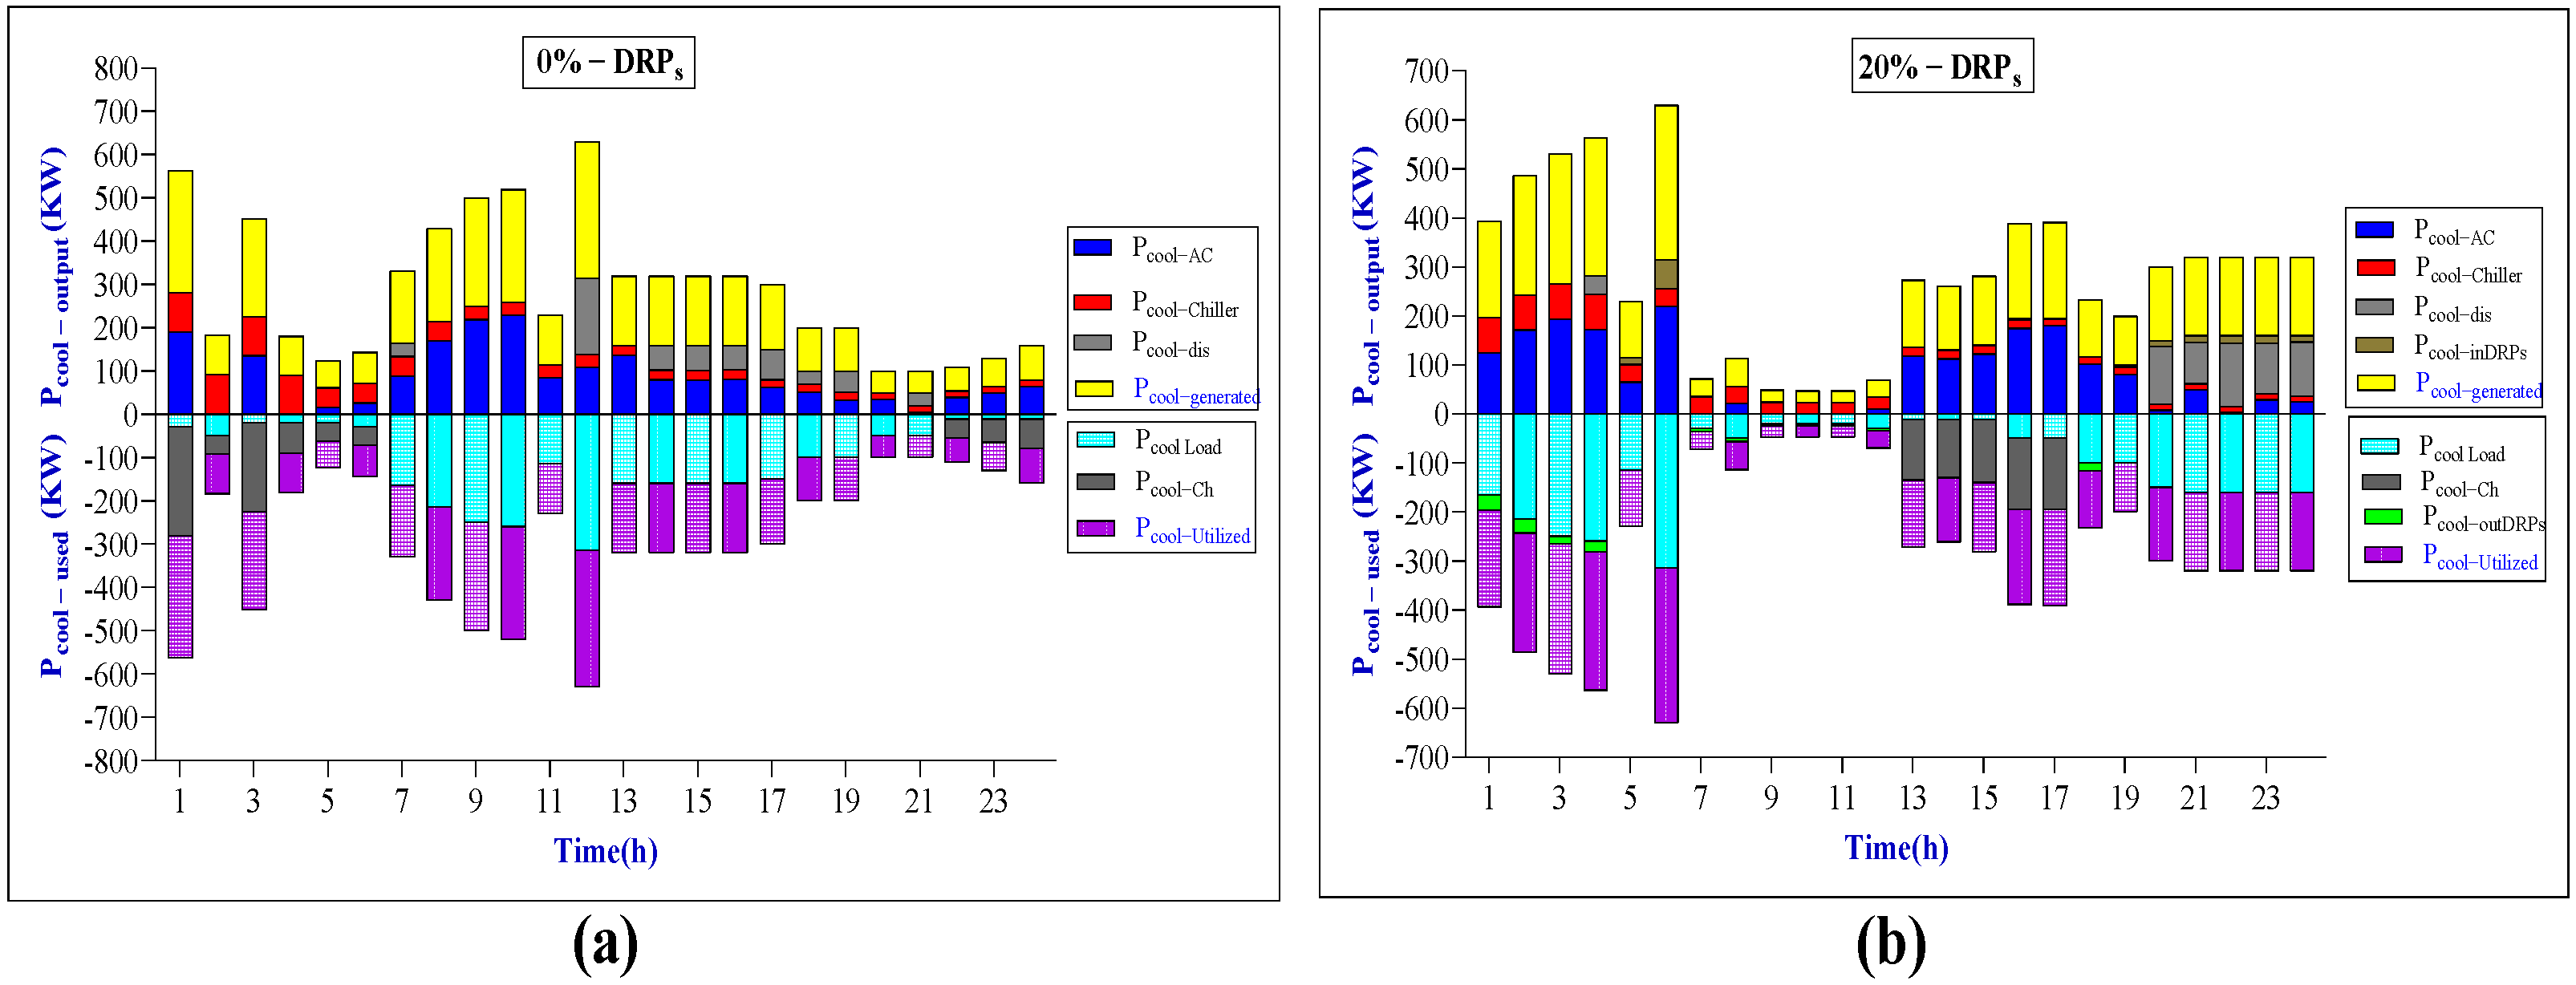
4.3.1. Electricity, Heating, Cooling, and Hydrogen Supply vs. Demand Balance Analysis
4.3.2. Assessing Integrated CCS, IDRP, and RERs to Optimize Grid Power
4.4. Environment–Economic–Energy Benefit Analysis
4.4.1. Environment Benefit Analysis
4.4.2. Economic Benefit Analysis
4.5. Validation Analysis of Proposed Model
4.5.1. Method Comparison
4.5.2. Statistical Outcome Validation Considering Non-Hydrogen Fuels
4.5.3. Statistical Outcome Validation Considering Hydrogen Fuel
5. Conclusions
- To enhance operational effectiveness and reliability, hydrogen energy dispatch, advanced P2G, and CCS technologies can meet hydrogen requirements. The integrated energy system group optimizes resource allocation and increases energy utilization efficiency through energy sharing and carbon transfer. These techniques, along with 20% customer demand response flexibility, reduce system operating costs by 17.30% without renewable power curtailments. Hydrogen and natural gas, combined with demand response methods for heating, electricity, and cooling, meet elastic consumer demand during peak, mid-peak, and off-peak periods, enhancing system performance.
- The P2G-CCS system optimizes the integration and coordination of electricity and carbon flows across energy supply, conversion, transmission, and trade by capturing, storing, and converting CO2 in a methanation reactor. This approach achieves a 13.14% reduction in total emissions, surpassing state-mandated quotas and substantially augmenting environmental advantages.
Author Contributions
Funding
Data Availability Statement
Conflicts of Interest
Nomenclature
| A. Acronym: | |
| MINLP | mix integer nonlinear programming |
| energy producer, prosumer and consumer hub respectively | |
| TH-HIES | tertiary hubs—hydrogen-based integrated energy system |
| P2G-CCS | power to gas—carbon capture and storage |
| IDRP | integrated demand response program |
| CHP | combine heat pump |
| EL | electrolyzer |
| FC | fuel cell |
| MR | methanation reactor |
| WHB | waste heat boiler |
| GT | gas turbine |
| GB | gas boiler |
| WT | wind turbine |
| PV | photovoltaic |
| B. Indexes and Set: | |
| t | subscript index of time periods |
| c | subscript index of simulated cases |
| H | subscript index of energy hubs demand |
| S | subscript index of energy suppliers |
| superscript index of maximum value | |
| superscript index of minimum value | |
| C. Parameters: | |
| heating, cooling and electric battery charging/discharging power at time t (MWh) | |
| maximum heating, cooling and electric battery charging power at time t (MWh) | |
| minimum heating, cooling and electric battery discharging power at time t (MWh) | |
| maximum hydrogen tank charging power at time t (Kg) | |
| minimum hydrogen tank discharging power at time t (Kg) | |
| initial battery state of Charge (MWh) | |
| maximum heat power across gas boiler (MW) | |
| maximum electric/heat power across CHP (MW) | |
| maximum gas power across CHP (MW) | |
| maximum electric power across electric chiller (MW) | |
| maximum electrolyzer power consumption at time t (MW) | |
| maximum fuel cell/photovoltaic power capacity (MW) | |
| power ramp up/down for electrolyzer/gas turbine (MW/h) | |
| maximum buying electric power/natural gas capacity from main grid (MW) | |
| imported natural gas/electricity capacity at time t (MW) | |
| hydrogen ramp up/down of MR unit (MW/h) | |
| maximum hydrogen used across MR unit at time t (Kg) | |
| coefficient of performance for gas turbine | |
| maximum/minimum gas turbine power (MW) | |
| maximum heat power across gas boiler/waste heat boiler at time t (MW) | |
| wind/photovoltaic curtailment Power at time t (MW) | |
| rated, cut in and cut out wind speed (m/s) | |
| transportation cost efficient | |
| electrolyzer/fuel cell efficiency | |
| combine heat pump/methanation reactor efficiency | |
| gas turbine/boiler efficiency | |
| heat loss efficiency | |
| electricity, heating, and cooling battery charge/discharge efficiency | |
| carbon capture storage unit efficiency | |
| carbon capture/storage cost coefficient (¥/ton) | |
| penalty wind curtailment cost (¥/MWh) | |
| carbon dioxide emission factor of gas | |
| baseline value for per unit generated power via GT (t-CO2/MWh) | |
| baseline value for per unit generated heat via GT (t-CO2/MWh) | |
| maximum demand at hub side (MW) | |
| transportation load flow maximum limit | |
| lower heating value of hydrogen (MWh/Kg) | |
| volume of hydrogen tank | |
| hydrogen tank/nominal cell temperature (K) | |
| maximum/minimum allowable energy level factor of electric storage | |
| maximum/minimum allowable energy level factor of electric storage charge | |
| maximum/minimum allowable energy level factor of heat/cool storage | |
| maximum/minimum allowable energy level factor of heat/cool storage charge | |
| participation percent for shift high of load by demand response unit | |
| participation percent for shift low of load by demand response unit | |
| C. Binary Variables: | |
| charge/discharge status of heat storage system at time t | |
| charge/discharge status of hydrogen bank system at time t | |
| turn on/off status of electrolyzer/fuel cell at time t | |
| turn on/off status of gas turbine/boiler at time t | |
| turn on/off status of waste heat boiler at time t | |
| for shifted low and high of electricity, cooling, and heating loads () by DRP | |
| unit at time t and case c | |
References
- Capurso, T.; Stefanizzi, M.; Torresi, M.; Camporeale, S.M. Perspective of the role of hydrogen in the 21st century energy transition. Energy Convers. Manag. 2022, 251, 114898. [Google Scholar] [CrossRef]
- El-Bahay, M.H.; Lotfy, M.E.; El-Hameed, M.A. Computational methods to mitigate the effect of high penetration of renewable energy sources on power system frequency regulation: A comprehensive review. Arch. Comput. Methods Eng. 2023, 30, 703–726. [Google Scholar] [CrossRef]
- Si, S.; Sun, W.; Wang, Y. A decentralized dispatch model for multiple micro energy grids system considering renewable energy uncertainties and energy interactions. J. Renew. Sustain. Energy 2024, 16, 015301. [Google Scholar] [CrossRef]
- Mu, Y.; Chen, W.; Yu, X.; Jia, H.; Hou, K.; Wang, C.; Meng, X. A double-layer planning method for integrated community energy systems with varying energy conversion efficiencies. Appl. Energy 2020, 279, 115700. [Google Scholar] [CrossRef]
- Liang, J.; Zhao, X.; Yang, S. Collaborative optimization model of renewable energy development considering peak shaving costs of various flexibility resources. Glob. Energy Interconnect. 2021, 4, 394–404. [Google Scholar] [CrossRef]
- Karimi, H.; Gharehpetian, G.B.; Ahmadiahangar, R.; Rosin, A. Optimal energy management of grid-connected multi-microgrid systems considering demand-side flexibility: A two-stage multi-objective approach. Electr. Power Syst. Res. 2023, 214, 108902. [Google Scholar] [CrossRef]
- Li, M.; Ming, P.; Huo, R.; Mu, H. Economic assessment and comparative analysis of hydrogen transportation with various technical processes. J. Renew. Sustain. Energy 2023, 15, 025904. [Google Scholar] [CrossRef]
- Mehrjerdi, H. Off-grid solar powered charging station for electric and hydrogen vehicles including fuel cell and hydrogen storage. Int. J. Hydrogen Energy 2021, 44, 11574–11583. [Google Scholar] [CrossRef]
- Zhu, L.; He, J.; He, L.; Huang, W.; Wang, Y.; Liu, Z. Optimal operation strategy of pv charging-hydrogenation composite energy station considering demand response. Energies 2022, 15, 5915. [Google Scholar] [CrossRef]
- Dini, A.; Hassankashi, A.; Pirouzi, S. A flexible reliable operation optimization model of the networked energy hubs with distributed generations, energy storage systems and demand response. Energy 2022, 239, 12192. [Google Scholar] [CrossRef]
- Fan, W.; Ju, L.; Tan, Z.; Li, X.; Zhang, A.; Li, X.; Wang, Y. Two-stage distributionally robust optimization model of integrated energy system group considering energy sharing and carbon transfer. Appl. Energy 2023, 331, 120426. [Google Scholar] [CrossRef]
- Wang, J.; Mao, J.; Hao, R.; Li, S.; Bao, G. Multi-energy coupling analysis and optimal scheduling of regional integrated energy system. Energy 2022, 254, 124482. [Google Scholar] [CrossRef]
- Wu, Q.; Li, C. Modeling and operation optimization of hydrogen-based integrated energy system with refined power-to-gas and carbon-capture-storage technologies under carbon trading. Energy 2023, 270, 126832. [Google Scholar] [CrossRef]
- Tiwari, S.; Singh, J.G. Optimal energy management of multi-carrier networked energy hubs considering efficient integration of demand response and electrical vehicles: A cooperative energy management framework. J. Energy Storage 2022, 51, 104479. [Google Scholar] [CrossRef]
- Alkhalifa, L. Comparison between five minlp solvers and new results related to trigonometric functions. Fractals 2022, 30, 2240249. [Google Scholar] [CrossRef]
- Li, J.; He, X.; Li, W.; Zhang, M.; Wu, J. Low-carbon optimal learning scheduling of the power system based on carbon capture system and carbon emission flow theory. Electr. Power Syst. Res. 2023, 218, 109215. [Google Scholar] [CrossRef]
- Chen, H.; Song, J.; Zhao, J. Synergies between power and hydrogen carriers using fuel cell hybrid electrical vehicle and power-to-gas storage as new coupling points. Energy Convers. Manag. 2021, 246, 114670. [Google Scholar] [CrossRef]
- Wang, Z.; Zhang, X.; Rezazadeh, A. Hydrogen fuel and electricity generation from a new hybrid energy system based on wind and solar energies and alkaline fuel cell. Energy Rep. 2021, 7, 2594–2604. [Google Scholar] [CrossRef]
- Ghappani, S.A.; Karimi, A. Optimal operation framework of an energy hub with combined heat, hydrogen, and power (CHHP) system based on ammonia. Energy 2023, 266, 126407. [Google Scholar] [CrossRef]
- Pazmiño-Arias, A.; Briceño-León, M.; Clairand, J.M.; Serrano-Guerrero, X.; Escrivá-Escrivá, G. Optimal scheduling of a dairy industry based on energy hub considering renewable energy and ice storage. J. Clean. Prod. 2023, 429, 139580. [Google Scholar] [CrossRef]
- Wu, M.; Wu, Z.; Shi, Z. Low carbon economic dispatch of integrated energy systems considering utilization of hydrogen and oxygen energy. Int. J. Electr. Power Energy Syst. 2024, 158, 109923. [Google Scholar] [CrossRef]
- Imeni, M.L.; Ghazizadeh, M.S.; Lasemi, M.A.; Yang, Z. Optimal scheduling of a hydrogen based energy hub considering a stochastic multi-attribute decision-making approach. Energies 2023, 16, 631. [Google Scholar] [CrossRef]
- Wu, M.; Xu, J.; Zeng, L.; Li, C.; Liu, Y.; Yi, Y.; Wen, M.; Jiang, Z. Two-stage robust optimization model for park integrated energy system based on dynamic programming. Appl. Energy 2022, 308, 118249. [Google Scholar] [CrossRef]
- Nirbheram, J.S.; Mahesh, A.; Bhimaraju, A. Techno-economic analysis of grid-connected hybrid renewable energy system adapting hybrid demand response program and novel energy management strategy. Renew. Energy 2023, 212, 1–16. [Google Scholar] [CrossRef]
- Zhang, S.; Hu, W.; Du, J.; Bai, C.; Liu, W.; Chen, Z. Low-carbon optimal operation of distributed energy systems in the context of electricity supply restriction and carbon tax policy: A fully decentralized energy dispatch strategy. J. Clean. Prod. 2023, 396, 136511. [Google Scholar] [CrossRef]
- Siqin, Z.; Niu, D.; Wang, X.; Zhen, H.; Li, M.Y.; Wang, J. A two-stage distributionally robust optimization model for p2g-cchp microgrid considering uncertainty and carbon emission. Energy 2022, 260, 124796. [Google Scholar] [CrossRef]
- Gupta, A.; Suhag, S. Evaluation of energy storage systems for sustainable development of renewable energy systems—A comprehensive review. J. Renew. Sustain. Energy 2022, 14, 032702. [Google Scholar] [CrossRef]
- Rakipour, D.; Barati, H. Probabilistic optimization in operation of energy hub with participation of renewable energy resources and demand response. Energy 2019, 173, 384–399. [Google Scholar] [CrossRef]
- Zhang, X.; Zhang, Y. Environment-friendly and economical scheduling optimization for integrated energy system considering power-to-gas technology and carbon capture power plant. J. Clean. Prod. 2020, 276, 123348. [Google Scholar] [CrossRef]
- Zhang, L.; Li, S.; Nie, Q.; Hu, Y. A two-stage benefit optimization and multi-participant benefit-sharing strategy for hybrid renewable energy systems in rural areas under carbon trading. Renew. Energy 2022, 189, 744–761. [Google Scholar] [CrossRef]
- Soroudi, A. Power System Optimization Modeling in GAMS; Springer: Cham, Switzerland, 2017; Volume 78. [Google Scholar]
- Brahman, F.; Honarm, M.; Jadid, S. Optimal electrical and thermal energy management of a residential energy hub, integrating demand response and energy storage system. Energy Build. 2015, 90, 65–75. [Google Scholar] [CrossRef]
- Xiao, H.; Long, F.; Zeng, L.; Zhao, W.; Wang, J.; Li, Y. Optimal scheduling of regional integrated energy system considering multiple uncertainties and integrated demand response. Electr. Power Syst. Res. 2023, 217, 109169. [Google Scholar] [CrossRef]
- Zhang, J.; Zhang, Z. Capacity configuration optimization of energy storage for microgrids considering source–load prediction uncertainty and demand response. J. Renew. Sustain. Energy 2023, 15, 064102. [Google Scholar] [CrossRef]
- Kholardi, F.; Assili, M.; Lasemi, M.A.; Hajizadeh, A. Optimal management of energy hub with considering hydrogen network. In Proceedings of the International Conference on Smart Energy Systems and Technologies (SEST), Seville, Spain, 10–12 September 2018; pp. 1–6. [Google Scholar]
- Wang, S.; Wang, S.; Zhao, Q.; Dong, S.; Li, H. Optimal dispatch of integrated energy station considering carbon capture and hydrogen demand. Energy 2023, 269, 126981. [Google Scholar] [CrossRef]
- Aghdam, F.H.; Kalantari, N.T.; Mohammadi-Ivatloo, B.A. A stochastic optimal scheduling of multi-microgrid systems considering emissions: A chance constrained model. J. Clean. Prod. 2020, 275, 122965. [Google Scholar] [CrossRef]
- Yang, X.; Chen, Z.; Huang, X.; Li, R.; Xu, S.; Yang, C. Robust capacity optimization methods for integrated energy systems considering demand response and thermal comfort. Energy 2021, 221, 119727. [Google Scholar] [CrossRef]
- Barman, P.; Dutta, L.; Bordoloi, S.; Kalita, A.; Buragohain, P.; Bharali, S.; Azzopardi, B. Renewable energy integration with electric vehicle technology: A review of the existing smart charging approaches. Renew. Sustain. Energy Rev. 2023, 183, 113518. [Google Scholar] [CrossRef]
- Chen, W.; Lu, H.; Wei, Z. Optimal allocation method for MIES-based shared energy storage using cooperative game theory and CSP. J. Renew. Sustain. Energy 2024, 16, 23701. [Google Scholar] [CrossRef]


| Ref. | Objective Function | CCU System | Tri-Hub’s IES | Demand Response | Multi-Energy Storage | Prosumer-H2 Synergy Coalition | Schedule Model | |||||||
|---|---|---|---|---|---|---|---|---|---|---|---|---|---|---|
| H2 | ||||||||||||||
| [6] | × | × | × | × | × | × | × | MILP | ||||||
| [9] | × | × | × | × | × | × | × | × | × | MILP | ||||
| [10] | × | × | × | × | × | × | × | × | MINLP | |||||
| [11] | × | × | × | × | × | × | MILP | |||||||
| [13] | × | × | × | × | × | × | × | × | MINLP | |||||
| [17] | × | × | × | × | × | × | × | × | × | MILP | ||||
| [18] | × | × | × | × | × | × | × | × | MINLP | |||||
| [19] | × | × | × | × | × | × | × | MILP | ||||||
| [20] | × | × | × | × | × | × | × | × | × | MILP | ||||
| [21] | × | × | × | × | × | × | × | × | × | MILP | ||||
| This Work | MINLP | |||||||||||||
| Hub’s | Devices | Process of Mentioned Units for This Proposed Model | Cost Paid |
|---|---|---|---|
| : | |||
| : | |||
| : |
|
| Cases | This Work | [35] P : 10 | [36] P : 10 | [37] P : 11–14 | [13] P : 12 | [38] P : 10 |
|---|---|---|---|---|---|---|
| em/t | em/t | em/t | em/t | em/t | em/t | |
| 1 | 1580 | |||||
| 2 | 1600 |
| Cases | Model Operation | Imported | MES Sharing | Power | Total | Exe- |
|---|---|---|---|---|---|---|
| MES, and | Carbon and | and CT | Transport | Model | Cution | |
| Imported Cost | Storage Cost | Return | Cost | Cost | Time | |
| ( ¥ × ) | ( ¥ × ) | ( ¥ × ) | ( ¥ × ) | ( ¥ × ) | (ms) | |
| 1 | 32 | |||||
| 2 | 31 |
| Ref. | Total Cost Reduction Rate | Total Emission Reduction Rate | Multi-Energy Sharing and Carbon Trading Return Rate | Integrated DRP Progress | Hydrogen Fuel or Electrolysis Precess |
|---|---|---|---|---|---|
| [6] | 15.75% | × | × | 15.75% | × |
| [11] | 6.93% | 9.57% | 1.85% | × | × |
| [13] | 31.68% | × | 17.59% | × | |
| [16] | 14.45% | 0.84% | 3.62%% | 6.44% | × |
| [19] | 16.8% | × | × | 4.33% | |
| [21] | 0.51% | 0.51% | 1.64% | × | |
| This work | 17.30% | 13.14% | 13.28% | 7.17% |
Disclaimer/Publisher’s Note: The statements, opinions and data contained in all publications are solely those of the individual author(s) and contributor(s) and not of MDPI and/or the editor(s). MDPI and/or the editor(s) disclaim responsibility for any injury to people or property resulting from any ideas, methods, instructions or products referred to in the content. |
© 2024 by the authors. Licensee MDPI, Basel, Switzerland. This article is an open access article distributed under the terms and conditions of the Creative Commons Attribution (CC BY) license (https://creativecommons.org/licenses/by/4.0/).
Share and Cite
Abbas, T.; Chen, S.; Zhang, X.; Wang, Z. Coordinated Optimization of Hydrogen-Integrated Energy Hubs with Demand Response-Enabled Energy Sharing. Processes 2024, 12, 1338. https://doi.org/10.3390/pr12071338
Abbas T, Chen S, Zhang X, Wang Z. Coordinated Optimization of Hydrogen-Integrated Energy Hubs with Demand Response-Enabled Energy Sharing. Processes. 2024; 12(7):1338. https://doi.org/10.3390/pr12071338
Chicago/Turabian StyleAbbas, Tasawar, Sheng Chen, Xuan Zhang, and Ziyan Wang. 2024. "Coordinated Optimization of Hydrogen-Integrated Energy Hubs with Demand Response-Enabled Energy Sharing" Processes 12, no. 7: 1338. https://doi.org/10.3390/pr12071338
APA StyleAbbas, T., Chen, S., Zhang, X., & Wang, Z. (2024). Coordinated Optimization of Hydrogen-Integrated Energy Hubs with Demand Response-Enabled Energy Sharing. Processes, 12(7), 1338. https://doi.org/10.3390/pr12071338