Article

Spent Lithium-Ion Battery Recycling Using Flotation Technology: Effect of Material Heterogeneity on Separation Performance

by
Luis Verdugo
1,2,*,
Lian Zhang
1,
Barbara Etschmann
2,
Joël Brugger
2,
Warren Bruckard
3,
Jorge Menacho
4,
Lorena Molina
5 and
Andrew Hoadley
1,*
1
Department of Chemical & Biological Engineering, Monash University, 18 Alliance Lane, Clayton, Melbourne, VIC 3800, Australia
2
School of Earth Atmosphere and Environment, Monash University, Melbourne, VIC 3800, Australia
3
CSIRO Mineral Resources, Melbourne, VIC 3169, Australia
4
De Re Metallica Ingeniería SpA, Avda. Del Valle 576, Huechuraba 8581151, Santiago, Chile
5
Materials Chemistry Department, University of Santiago, Estación Central 9170022, Santiago, Chile
*
Authors to whom correspondence should be addressed.
Processes 2024, 12(7), 1363; https://doi.org/10.3390/pr12071363
Submission received: 27 May 2024 / Revised: 23 June 2024 / Accepted: 24 June 2024 / Published: 29 June 2024
(This article belongs to the Topic The Electronic Waste (E-Waste) Management and Treatment)

Abstract

:
In this study, two types of recycling scenarios are assessed for spent battery materials using froth flotation. The first is for a single cathode chemistry and would be considered as the most likely scenario for a large battery manufacturer, who takes back their own batteries for reprocessing. The second scenario is for mixed cathode chemistry, and this would be the most likely scenario for regional reprocessing. The mixed spent battery materials assessed in this work were sourced from such an industrial recycling operation in Australia. Good results were obtained for both recycling scenarios. The anode recovery and anode grade in the final concentrate for both materials evaluated were for the single spent battery material 80.1% and 90.3%, respectively, and for the mixed spent battery material, 77.4% and 82.0%, respectively. For the final tailings, the cathode grades for both materials tested were 93.9% and 87.1%, respectively, with the lower grade for the mixed spent battery attributed to the high content of impurities in the original material. These results highlight the importance of the preprocessing ahead of the flotation process. The results confirm froth flotation as a feasible technique that can be used to achieve the bulk of the separation.

1. Introduction

The lithium-ion battery (LIB) industry represents a strategic sector due to the importance of complex devices which cannot be powered directly from the electricity grid such as electric cars and bicycles. By 2030 [1], the electric vehicle sector will represent approximately 89% of the total demand for LIBs in the world. Although LIB devices are designed for a medium life span (10–20 years), several forecasts indicate that there will be a high generation of LIB waste by 2030 [2]. Therefore, recycling is a critical issue due to the content of key materials for battery manufacturing such as cathode materials, graphite, base metals, electrolytes and secondary materials such as plastics. For sustainable development, it is necessary that spent batteries can be repurposed into either new batteries or other products. However, with the high expected growth in LIB usage, the materials recovered from spent batteries must be capable of being reused in new batteries with minimum processing. Therefore, the recovered electrode materials must meet the technical requirements for battery manufacturing, typically requiring a purity of over 99% for anode and cathode materials, respectively. Thus, choosing a technology or mix of technologies that is capable of achieving a sufficient recovery and purity of both the anode and cathode materials is critical in the overall scheme for the recycling of spent batteries [3,4].
Several technology options have been developed to recover the critical materials in spent LIBs. These technologies are mainly based on the use of acid leaching coupled with purification stages such as precipitation stages or solvent extraction and electrowinning stages. These processes are commonly efficient in terms of metal recovery, but they have downsides such as a high acid consumption and other reagents [5,6], and the environmental impact from the resultant wastewater/acid is also a concern. A second candidate which represents a much smaller proportion of the currently operating technologies is based on pyrometallurgical processes. Its advantage is its simplicity [7], but it presents a negative economic impact due to the loss of carbon-based materials during processing [8] and a high carbon footprint from the incineration of the inherent graphite [9]. Also, there are environmental impacts due to the production of toxic organic compounds during pyrolysis such as polycyclic aromatic hydrocarbons (PAHs) and fluorine compounds such as hydrogen fluoride (HF) [10].
An alternative to either hydro- or pyrometallurgy is the direct recycling of these materials using froth flotation. This technique is attractive as a mature technology for separating two solids where one of the materials is naturally hydrophobic, such as graphite in the case of LIBs [11]. Several bench-scale studies have been reported in the last 20 years. They have indicated froth flotation to be a highly efficient technique for the separation of anode materials from cathode materials [12]. In a typical froth flotation process, the anode material or graphite is recovered as the floated material, known as the concentrate with a graphite content ranging from 75 wt% to 85 wt%. The residue or tailings left in the flotation device are predominantly the cathode materials with lithium metal oxide purity ranging from 50 wt% up to 99 wt% [13,14]. This process is illustrated in Figure 1. The froth phase is shown with different components such as graphite attached to the bubbles and lithium metal oxide particles which are normally not captured by the froth but can sometimes be entrained into the froth (as shown as pink particles in the figure).
Several studies on spent LIB processing using froth flotation show that the different processing variables such as flotation time, reagent dosage, reagent type and pre-treatment techniques are very important for the separation process, but the recycling approach if using a mixed material or a differential processing by cathode chemistry has been lacking.
Therefore, one of the objectives of this study is to evaluate the flotation behaviour of two spent electrode materials with different pre-treatment approaches which represent two different recycling options for the collection of spent LIBs. The first material considered is of a single spent battery type with NMC-111 chemistry, model JH3, LG chem manufacturer. In this scenario, a LIB manufacturer may take back their batteries for reprocessing, or in the case of a regional recycling facility, the collection would involve separating the batteries into their known chemistry and reprocessing with conditions specific to this chemistry. The second scenario is also for a regional recycling facility but where the spent LIBs have been mixed, and therefore, they have a mixed cathode chemistry.
The second objective of this paper is the evaluation of three stages of flotation for the purification of the anode concentrate for both spent materials tested. The first stage consisted of “rougher” flotation. This stage conducts a rough separation of cathode materials and impurities, generating the initial anode concentrate. Then, a “cleaner” stage is considered in order to increase the anode grade in the concentrate, generating the final concentrate. Finally, tailings coming from the rougher stage are treated using a “scavenger” stage; this stage removes any non-floated graphite from the rougher stage, generating tailings with a low graphite content [15]. The investigation of a three-stage process provides a good indication of the likely grade of both the tailings and concentrate for a more complex processing.

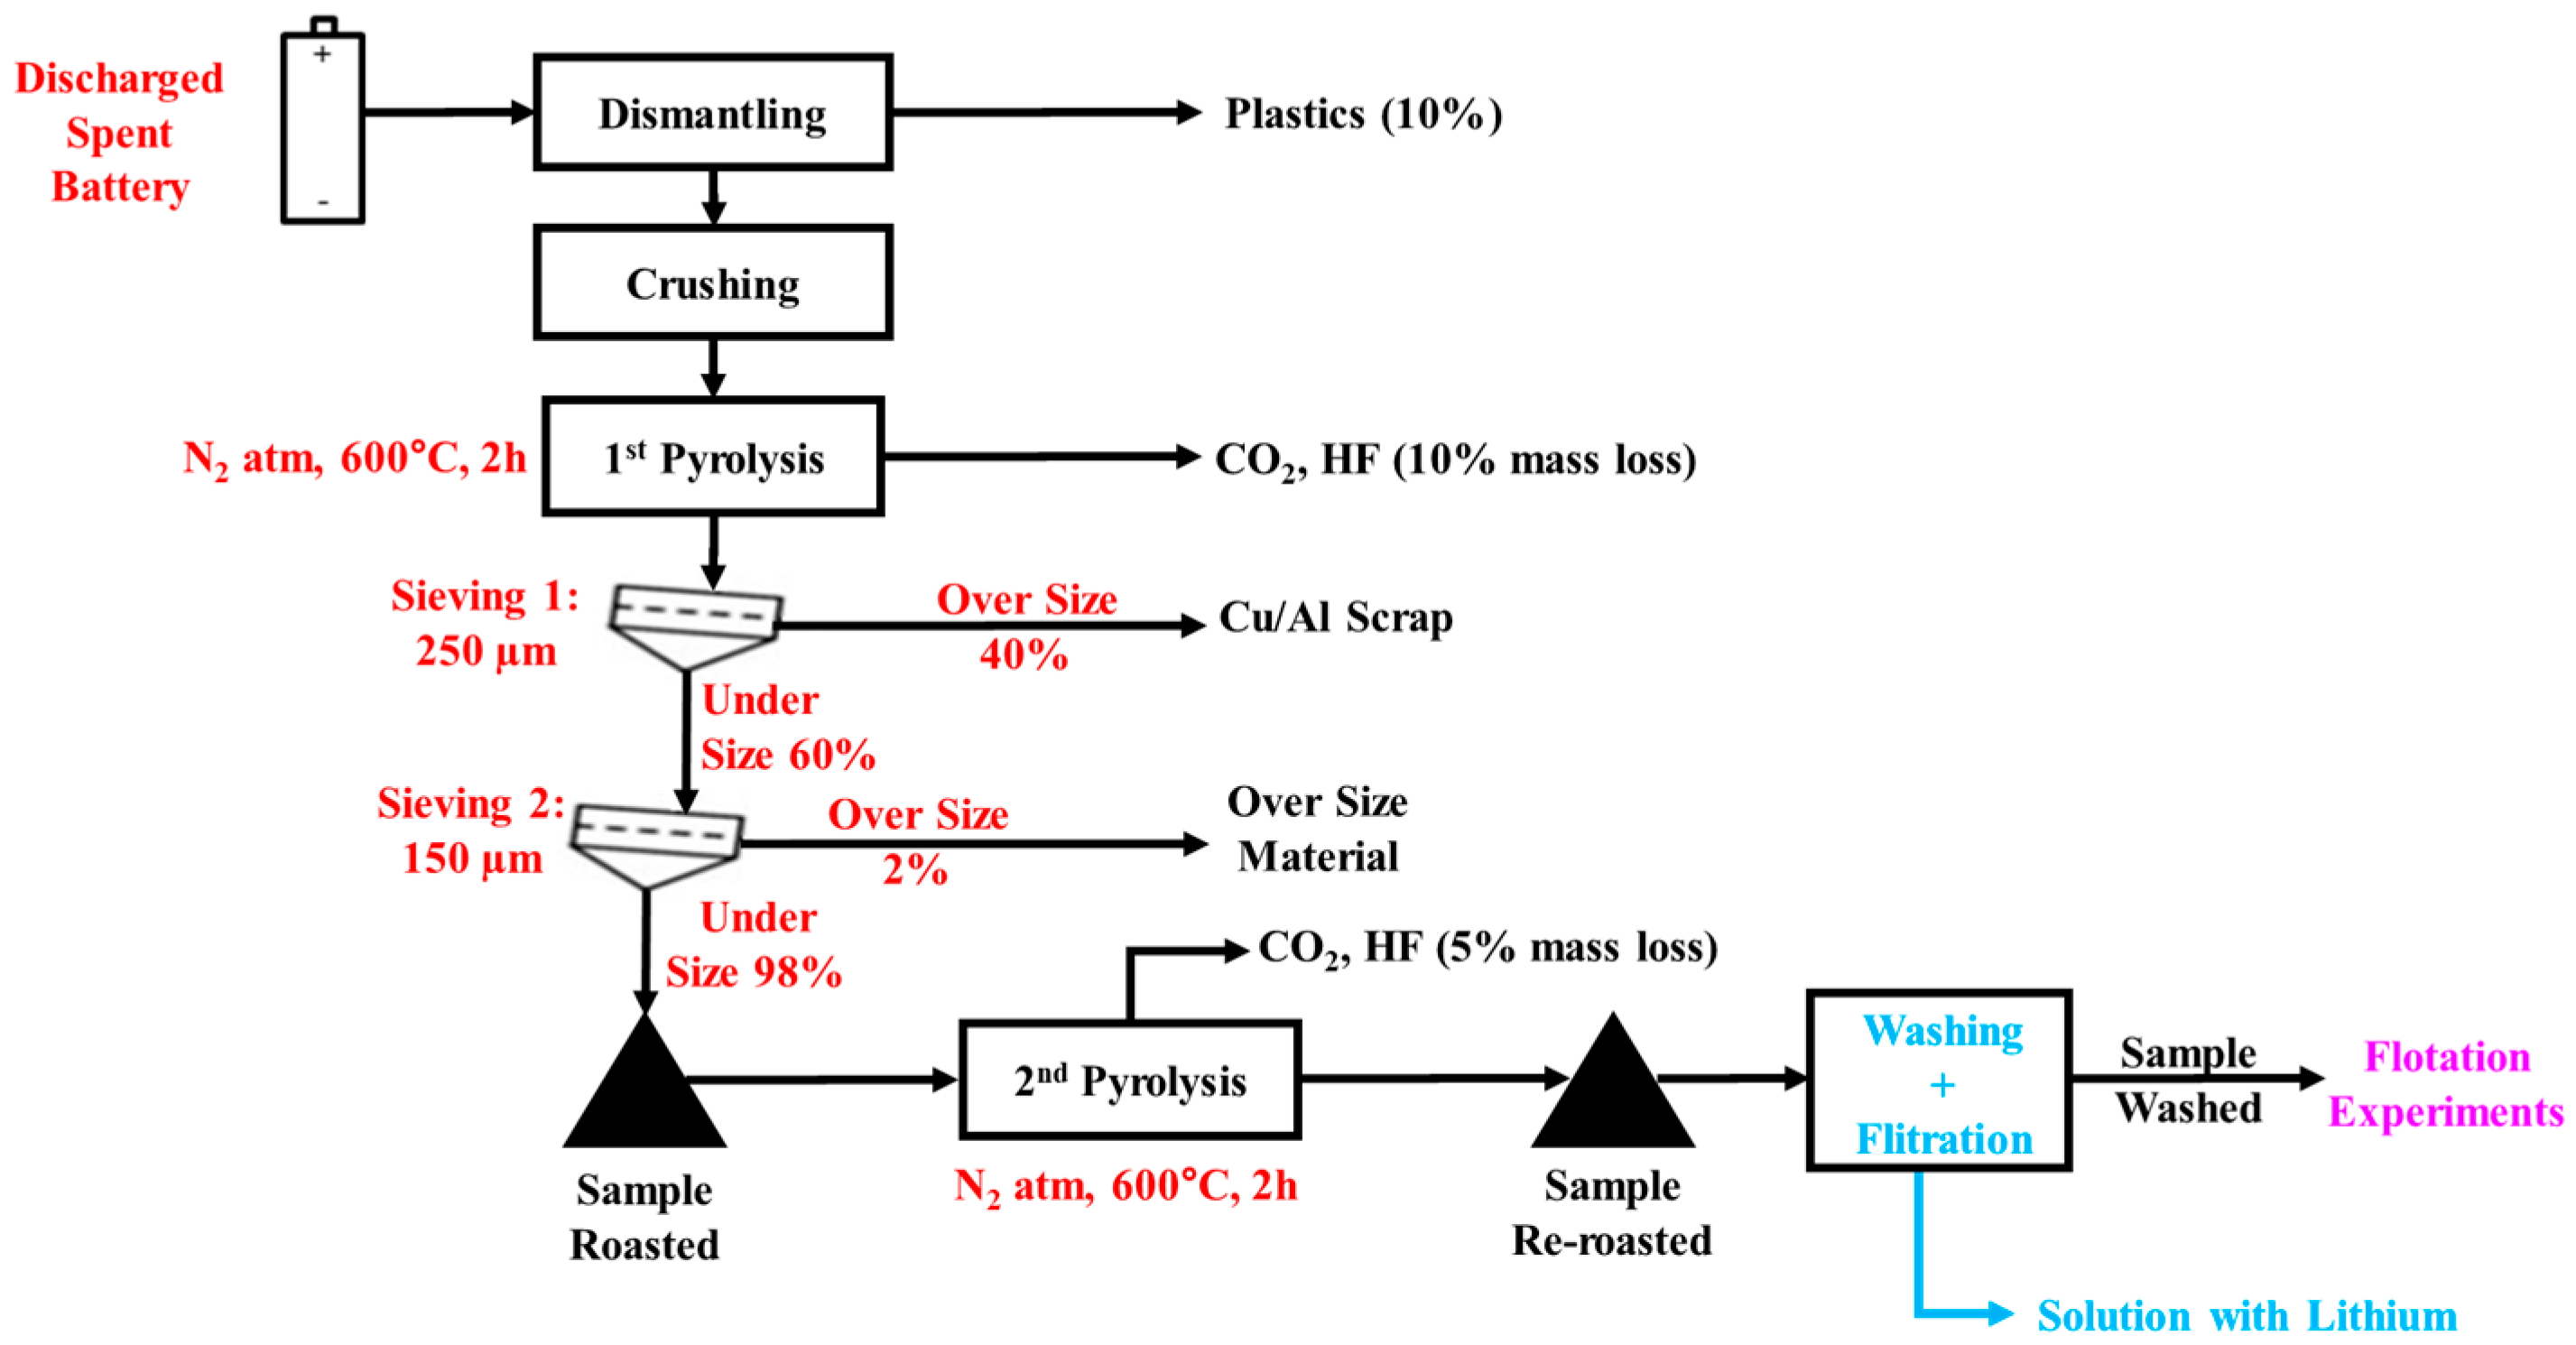
2. Materials and Methods

In this work, two samples were tested; the first material was a single spent lithium-ion battery with NMC-111 (lithium nickel manganese cobalt oxide, Li1.05Ni0.33Mn0.33Co0.33O2) cathode chemistry, model JH3, LG chem, and the second material was a mixture of preprocessed spent battery materials with LCO (lithium cobalt oxide, LiCoO2), NMC-111 (lithium nickel manganese cobalt oxide, Li1.05Ni0.33Mn0.33Co0.33O2) and LFP (lithium iron phosphate, LiFePO4) cathode chemistries. These materials were obtained from an industrial recycling company (Envirostream Australia Pty Ltd., Melbourne, Victoria, Australia).
In these flotation trials, Methyl-isobutyl Carbinol (MIBC) (purity 98%, Sigma Aldrich, St Louis, MO, USA) was used as a frother, and ExxolTM D80 (industrial grade, ExxonMobil, ASCC, Melbourne, Australia) was used as a collector. These flotation reagents are typically used for graphite flotation either for graphite production from natural ores or graphite recycling from spent lithium-ion batteries [13,16,17].
The flotation experiments were carried out using a Denver-type flotation cell (Laboratory XFD-12 Flotation Machine, Ganzhou, China), with air as the carrier gas delivered at 180 L/h equivalent to 1.05 cm/s superficial gas velocity, with a mixing speed of 900 rpm. This procedure is similar to previous works reported [13,18].
Alkalinity conditions in all slurries assayed were controlled using a pH meter (Hanna Instruments, model HI-98100, Nusfalau, Rumania), for all measurements. Note that the pH of the slurry is alkaline (~11). This is due to the hydrolysis of lithium ions in solution and presented in the anode and cathode fractions of the black mass material. Table 1 summarises the experimental conditions used for the flotation experiments.

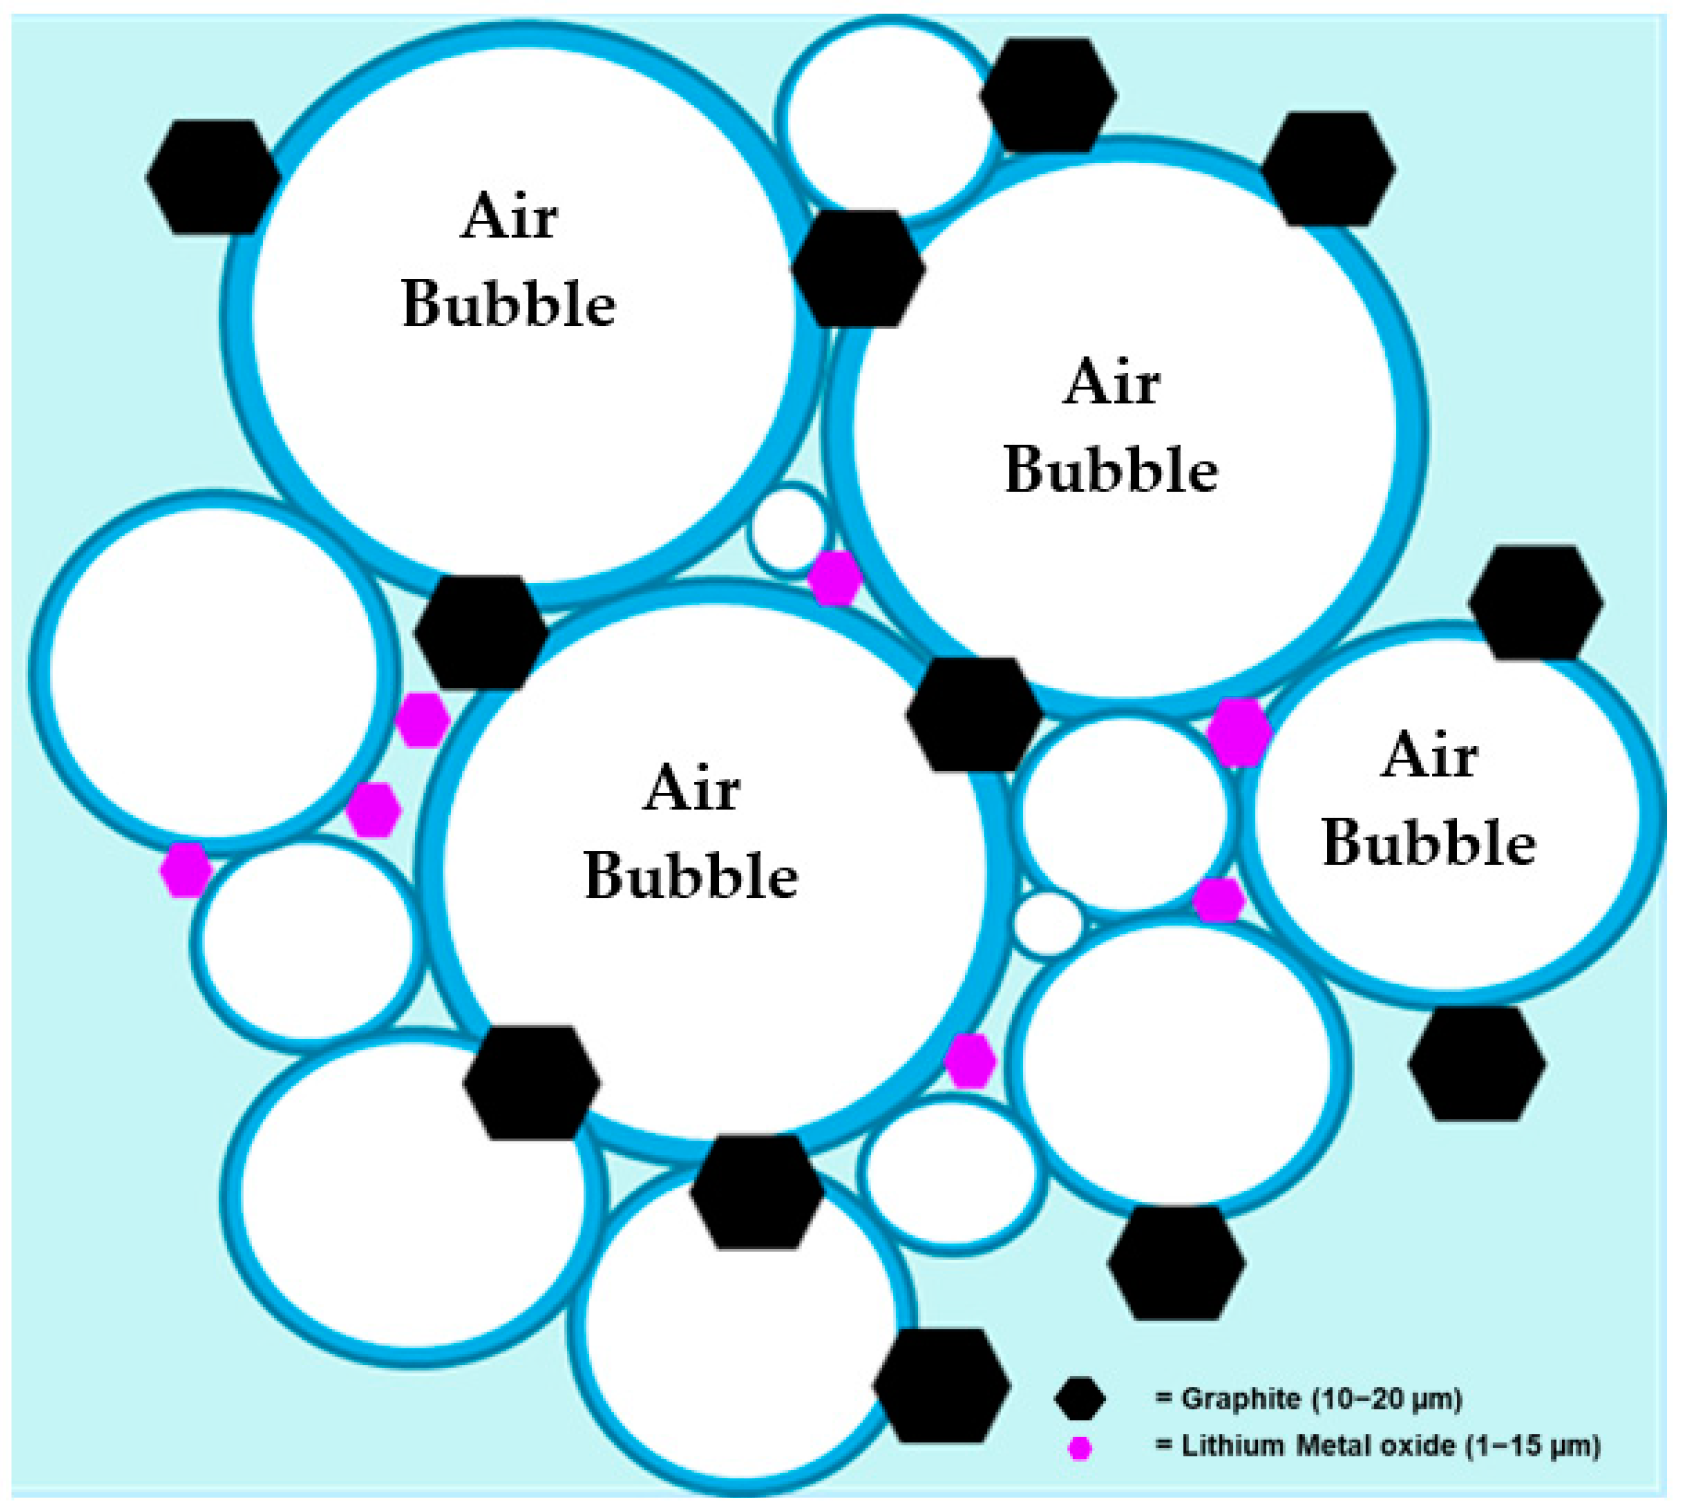
2.1. Characterisation of Feed Materials

The black mass materials used in these flotation experiments were characterised using the following instrumental techniques.
The total carbon (TC) analysis was carried out using a CHNS analyser (Thermo Fisher Scientific, Bremen, Germany). The reference material is the compound 2,5-bis(5-tert-butyl-2-benzoxazolyl) thiophene (BBOT), Analytical Standard, Elemental Microanalysis, Okehampton, UK.
The cathode material and impurity content in the feed, concentrate and tailings were quantified using an Ametek X-ray fluorescence instrument, model Spectro iQ II, Mahwah, NJ, USA.
The particle size analysis for all samples was carried out using a laser diffraction particle sizer, Malvern Panalytical, model Mastersizer 2000, Malvern, UK. All samples were dried before and analysed using the dry powder method.
In order to justify the pyrolysis methodology (pyrolysis and re-pyrolysis) used in this work, several analyses were carried out for the single cathode material; this is because the material can be recovered easily from the spent battery pad. After verifying that the pyrolysis conditions are appropriate for the sample preparation, the pyrolysis conditions were applied for all the materials used in this study. These verifying analyses were total fluorine analysis, thermogravimetric analysis and scanning electron microscopy.
The total fluorine analysis for materials before and after the pyrolysis stage was carried out using a combustion bomb with oxygen and coupled with ion chromatography analysis. The analytical technique was based on the European standard EN14582:2016 [22], “Characterization of waste. Halogen and sulfur content. Oxygen combustion in closed systems and determination methods”.
The effect of temperature on the decomposition of electrode materials during roasting was studied using a scanning differential calorimetry coupled with thermogravimetric analysis. For this purpose, a TGA/DSC instrument, (model TA SDT 650, TA instruments, New Castle, DE, USA) was used. In these experiments, 5 to 10 mg of electrode samples was transferred into 90 μL alumina crucibles. Samples were heated from room temperature up to 900 °C at 10 °C/min under nitrogen (100 mL/min), then heated to 1000 °C in air and then cooled to room temperature in air. The resulting thermogravimetric plot was processed and analysed.
The SEM analysis of samples was conducted using a JEOL JSM-7001F Schottky Emission Scanning Electron Microscope, Tokyo, Japan. Electron micrographs were taken to observe the morphology of samples before and after pyrolysis experiments. Samples were stuck on the stub’s surfaces using ethyl 2-cyanoacrylate adhesive or super glue. These samples were dried for 48h at room temperature and then coated with conducting carbon.

2.2. Sample Preparation Diagram of Feed Materials

The sample preparation is summarised in the process flow chart in Figure 2. Note that this diagram illustrates the processing for both materials tested. More details about the pre-processing of these materials can be found in the Supplementary Information section (Section S1 and See Figures S1–S4).
In this procedure, the pyrolysis of spent materials was carried out in two separated stages; the first stage helps to liberate the electrode materials from the current collectors, and the second pyrolysis helps to assure the binder decomposition that coats the cathode particles and to decompose the solid electrolyte interphase (SEI). This layer can affect the floatability of anode particles due to the presence of organic and inorganic lithium salts that negatively impact the hydrophobicity of graphite particles [23].
Additionally, the last stage of this procedure is sample washing. The purpose of this stage is to remove the soluble lithium that negatively impacts the cathode entrainment in anode concentrates. It is well known that the presence of some electrolytes in the flotation media can impact the flotation behaviour of materials due to the frothing effect of salts [24,25,26]. This phenomenon applied to the processing of these materials has been reported in a previous work by Verdugo et al. [18]. Therefore, the washing of these materials prior to flotation can help to reduce the frothing effect of lithium ions and therefore minimise the entrainment of cathode particles in anode concentrates. On the other hand, the effluent solution from the washing stage contains valuable lithium concentrations ~2 g/L which could be beneficiated throughout a precipitation stage either as carbonates or phosphate salts [27].

2.3. Experimental Procedure of Froth Flotation Trials

The procedure for all the flotation tests carried out in this study is summarised in Figure 3.
Depending on the flotation test being conducted, between 68 g and 76 g of sample with 500 mL of Milli-Q water was added to the 500 mL flotation cell. This gives a solid–liquid suspension of up to 13% solids. The experiment commenced by stirring at 900 rpm for 5 min which gave a homogenised black mass material.
Subsequently, the collector was added using a specific dosage according to the flotation stage essayed (see Table 1), followed by 4 min of conditioning. Finally, the frother was added in order to give a 30 mg/L frother concentration in the slurry, followed by two minutes of stirring. Then, air was blown into the flotation cell, marking the beginning of the flotation experiment.
After about ten seconds of air blowing into the cell, the froth became stable, and the froth was recovered manually and skimming every 5 s for all experiments.
The collection of timed concentrates enabled the calculation of flotation kinetics data. Milli-Q water at pH 11 (natural pH of slurries) with 30 mg/L of frother was added into the flotation cell as needed to maintain a set pulp level. Each froth fraction was recovered at different times depending on the flotation stage: 0.5, 1.0, 2.0, 4.0, 6.0 and 8.0 min for the rougher; 0.5, 2.0, 4.0 and 5.0 min for the scavenger; and 0.5, 2.0, 4.0 and 5.0 min for the cleaner stage. Finally, all the products collected (anode concentrates and tailings) were dried at 110 °C for 18 h in a convection oven (Binder Model M 53, Tuttlingen, Germany) prior to weighing using a scale (Mettler Toledo, model PE 3600, Greifensee, Switzerland), and then these samples were sent for chemical analysis.

2.4. Characterisation of Flotation Products

The analyses of flotation products (concentrates and tailings) were carried out using the procedures detailed in Section 2.2.

2.5. Flotation Data Processing Methodology

The following flotation parameters were used based on experimental results for the analysis of the flotation performance.

2.5.1. Flotation Kinetics

The flotation kinetics was evaluated using a first-order kinetics. This equation has been previously applied in the case of spent lithium-ion battery recycling using batch flotation [13,18]. In this model, R is the recovery at time (t), RI is the ultimate recovery, k is the kinetic rate constant and θ is the time correction factor as described in the following equation [28].
R = RI [ 1 − exp (−k (t + θ)]
The parameters RI, k and θ from Equation (1) can be obtained using a logarithmic–linear correlation given in Equation (2).
ln ( RI     R RI ) = kt + k θ
The slope and intercept of the linear regression gives the kinetic rate constant, and the intercept is related to the correction factor θ in Equation (1).

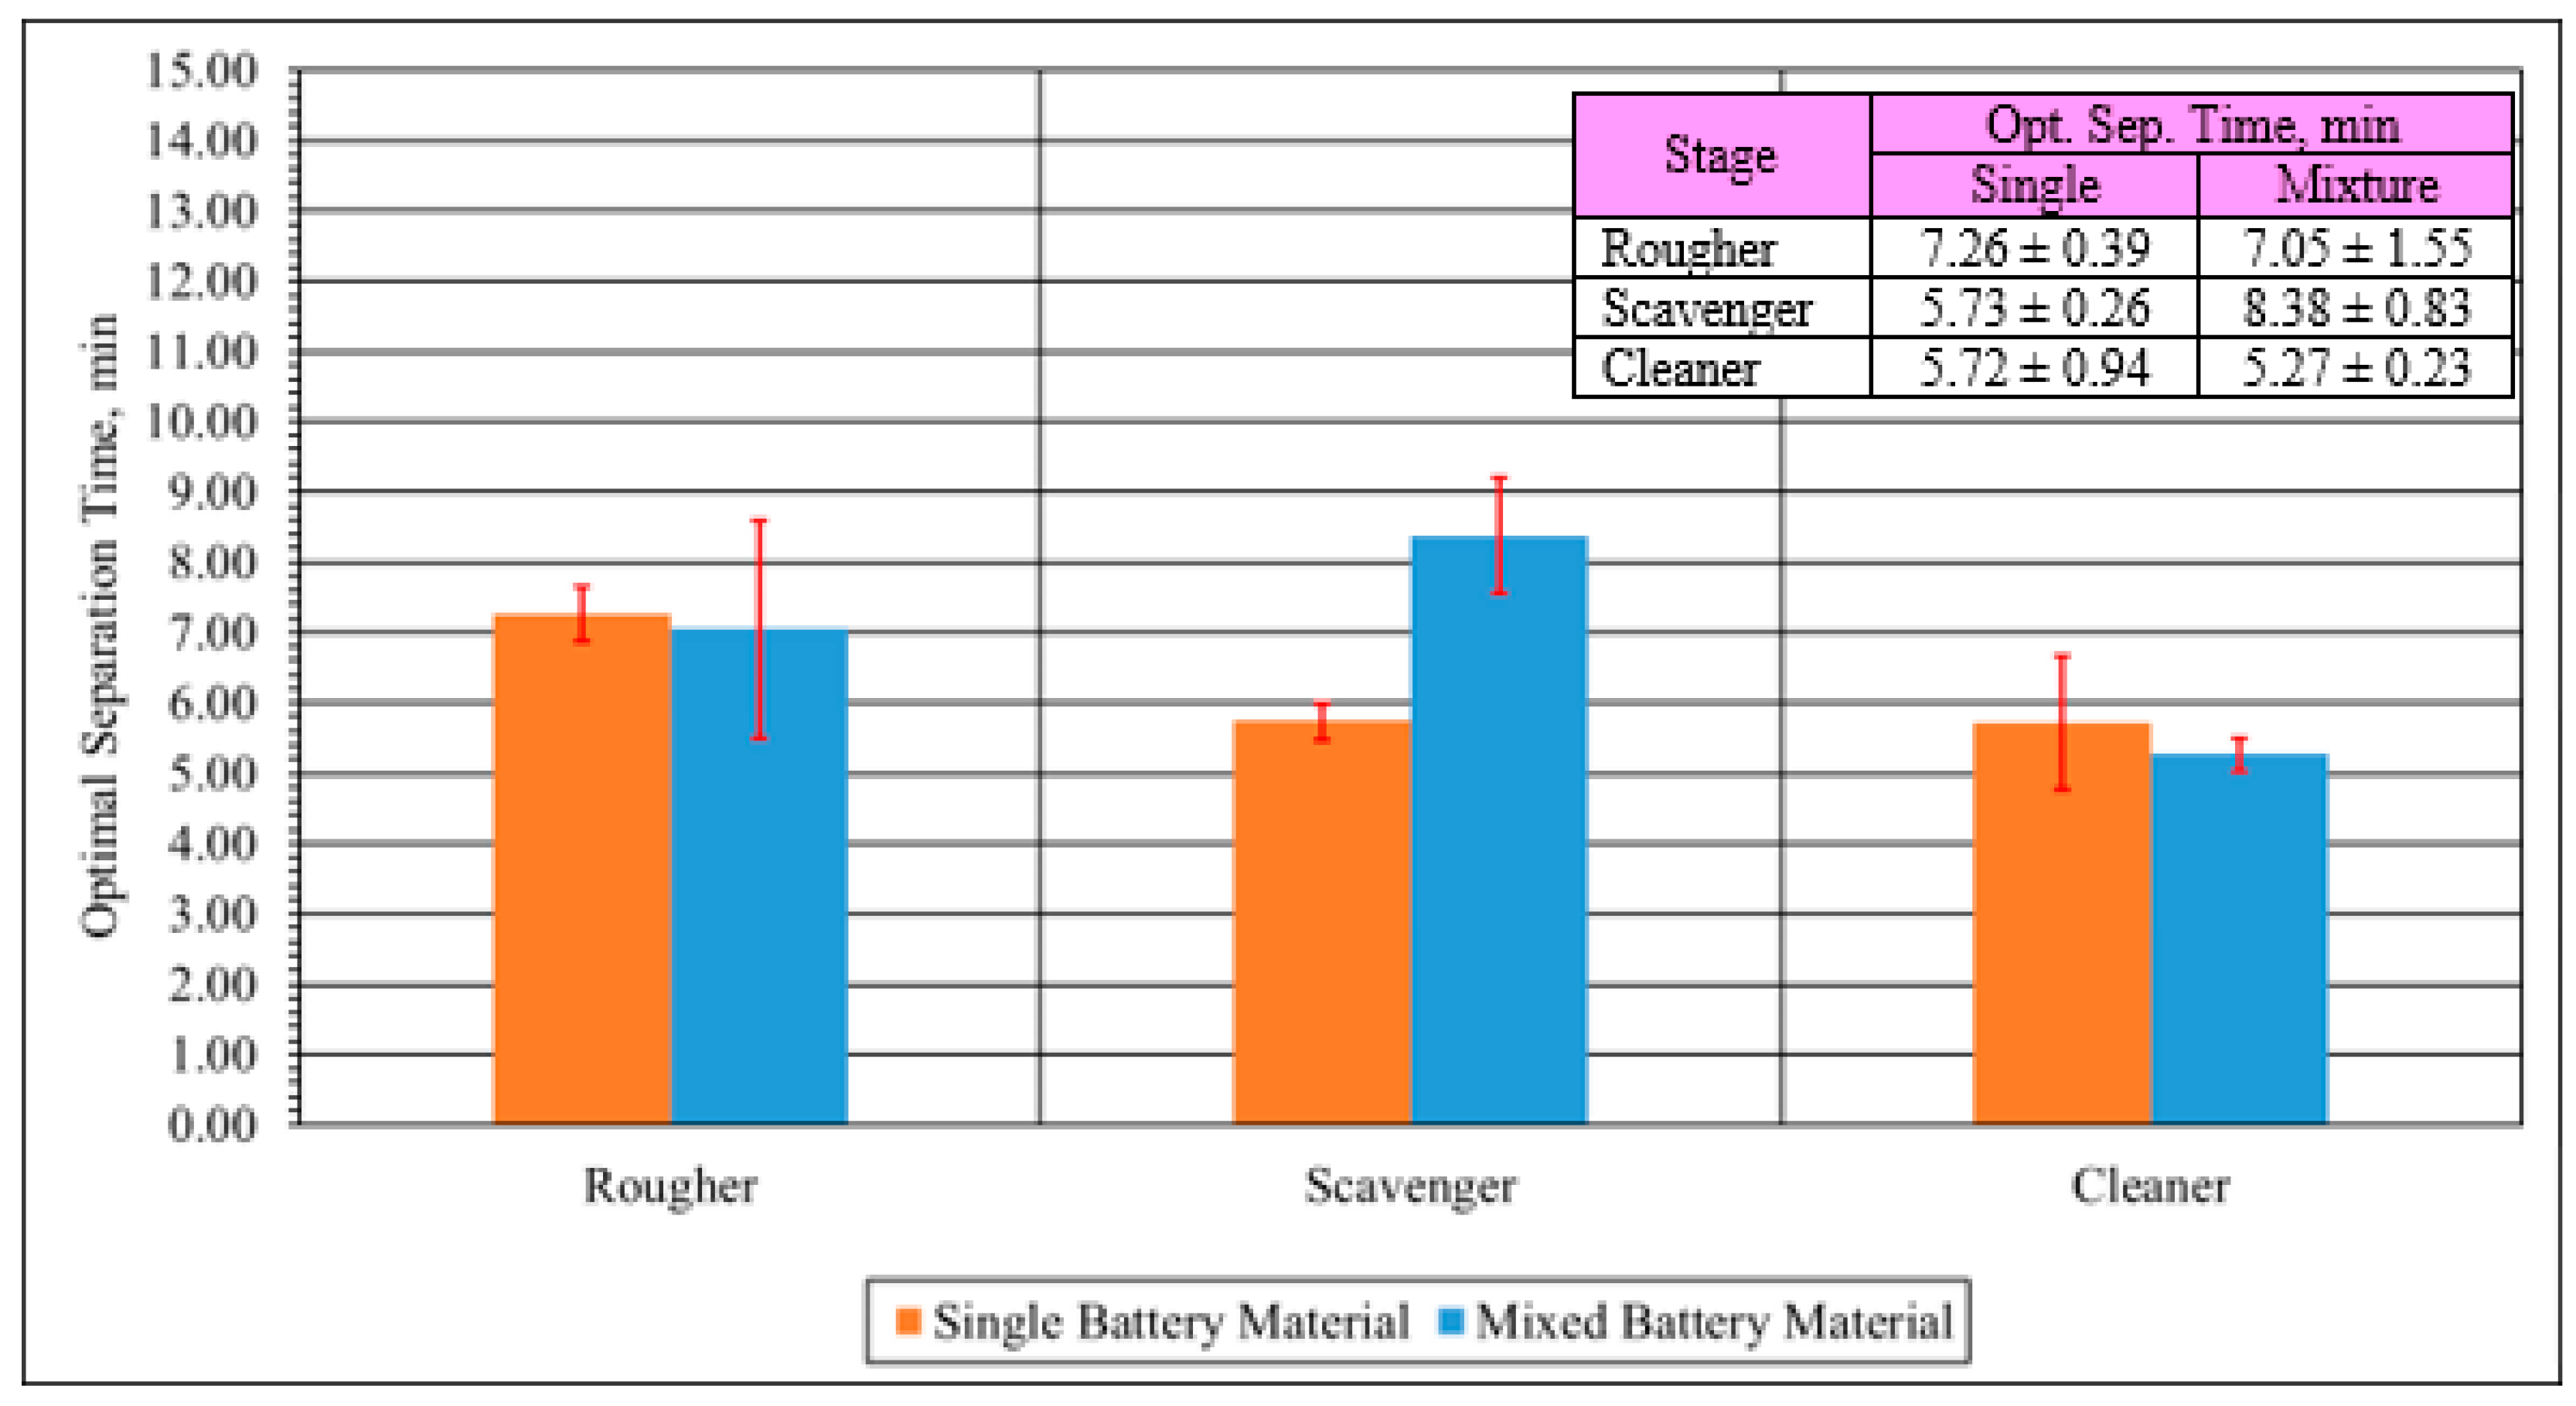
2.5.2. Optimum Flotation Time

Based on Agar’s approach, the optimum flotation time required for the maximum separation efficiency between the anode and cathode material is calculated using the following equation [29].
t Optimal = ln ( RI A k A RI C k C )     k A θ A + k C θ C k A   k C  
where the indexes A and C are for the anode and cathode material in the concentrate fraction, respectively.

2.5.3. Separation Efficiency

The metallurgical efficiency was evaluated using the Cumulative Separation Efficiency (CSE), which is the recovery difference between the anode and cathode material. It is shown in Equation (3) [30].
CSE = R A   R C
where RA (%) is the recovery of the anode material, and RC (%) is the cathode recovery at a specific time.

2.5.4. Selectivity Index

Based on Equations (1) and (2), the selectivity index (SI) can be calculated [31]. This is determined as the ratio of the modified rate constant of the anode (A) over the cathode (C) in the flotation system, that is,
SI = K A K C = RI A k A RI C k C
where RI is the ultimate recovery for each anode and cathode material (A, C) in the concentrate, and k is the kinetic rate constant for the materials studied (A, C), A being the anode material and C the cathode material.

2.5.5. Degree of Entrainment

In terms of the quantification of the degree of entrainment of cathode particles in the graphite concentrate, the Warren method was used for this purpose [32,33], due to a good correlation between the model and the experimental data. In this method, the cathode recovery is plotted versus water recovery. This model is presented as follows.
R C = R TF + e f R W
where RC is the cathode recovery in the concentrate, RTF is the recovery by true flotation, ef is the entrainment factor for the cathode particle and Rw is the cumulative water recovery.

3. Results

3.1. Characterisation of Feed Materials

3.1.1. Chemical and Physical Analysis of Feed Materials

Table 2 and Table 3 summarise the chemical and physical analysis for the samples tested and fed to flotation experiments and using experimental procedures mentioned in Section 2.2.
The XRF results for both samples indicate a high impurity content for industrial mixed samples such as phosphorous, copper and aluminium. This is due to the processing of these samples because they are mixed in the industrial operation, increasing impurities and heterogeneity.
Total carbon analysis carried out for all flotation stages indicates normal values of total carbon as graphite for mixtures with cleaner stages containing higher carbon content and scavenger stages lower carbon content. Rougher stages present a graphite content in the middle of this range. The same behaviour occurs for cathode materials. Regarding impurity content, single spent battery samples dismantled at lab scale present lower impurity content compared with mixed spent battery samples taken from an industrial recycling operation.
In terms of the statistical analysis of samples, they show a moderate standard deviation in the analyses; this is related to the heterogeneous nature of the materials analysed. This suggests some cautions must be taken during the dismantling and pre-processing (crushing and screening) of spent lithium-ion batteries in order to minimise the impurity content in samples.
Regarding particle size analyses, they indicate fine materials with a low–moderate standard deviation; it could again be related to the heterogeneous nature of the materials. In these analyses, the D50 size found in both materials is within or very close to the normal flotation range. It is between 10 and 150 µm [34,35].

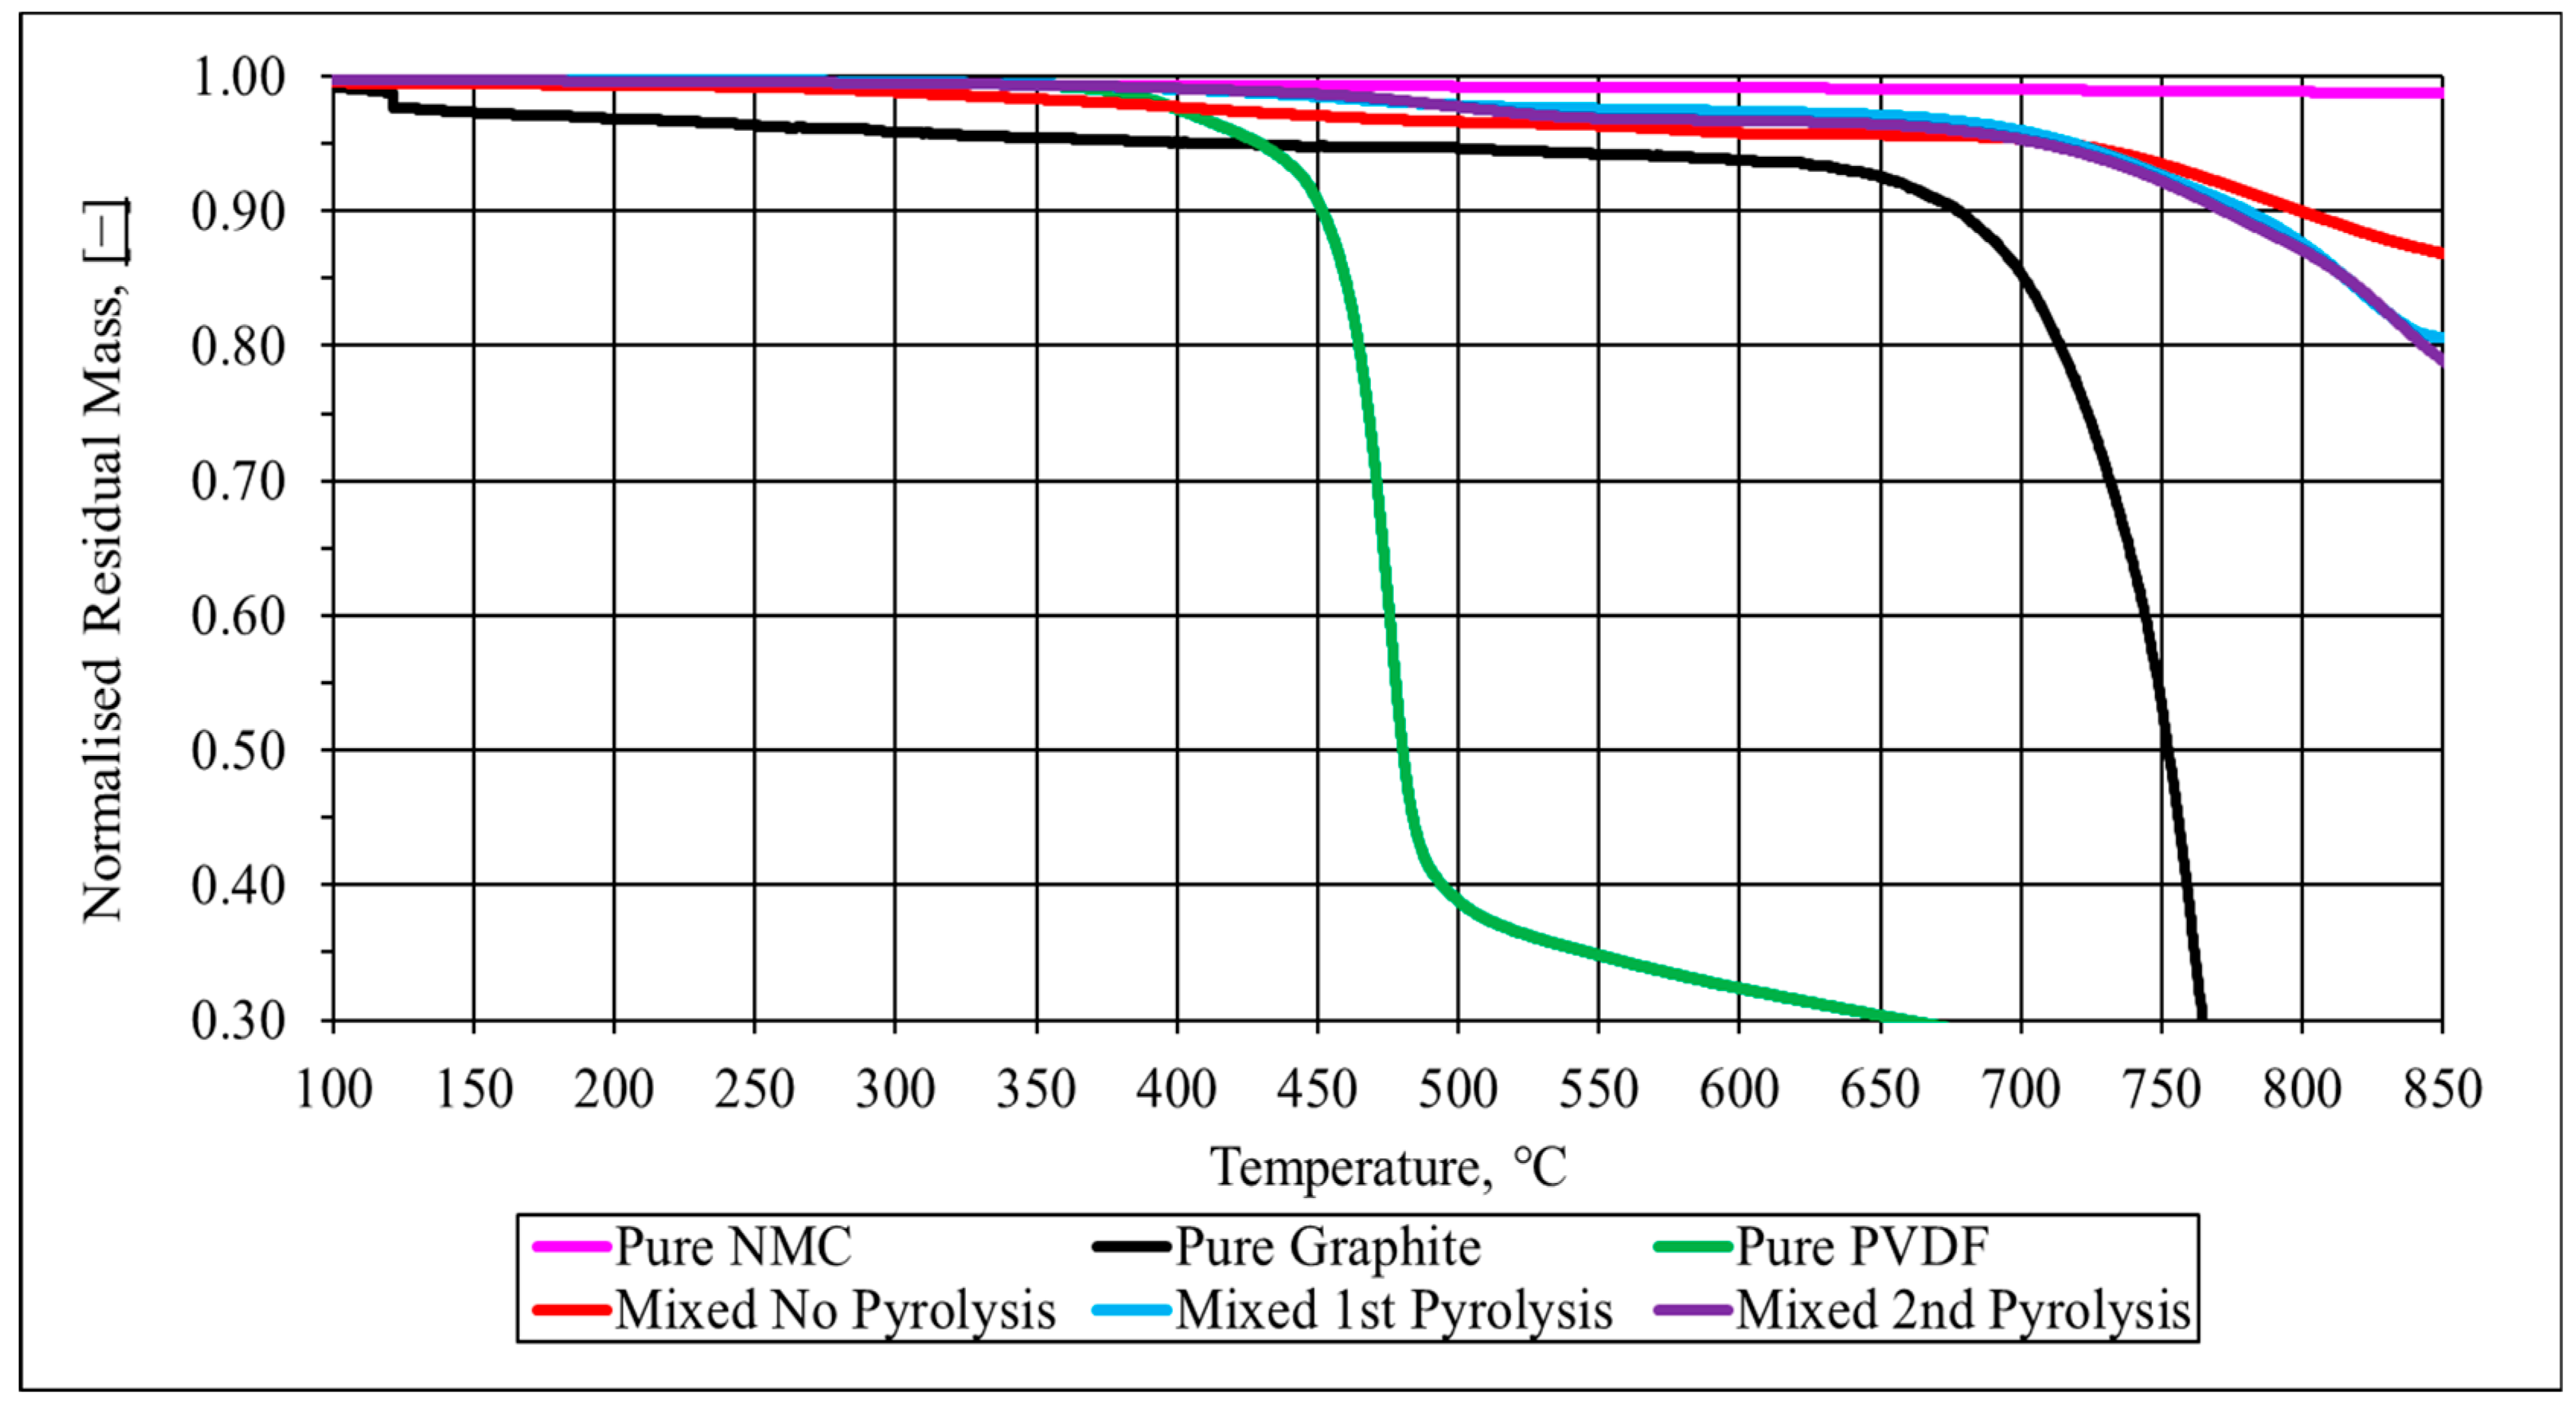
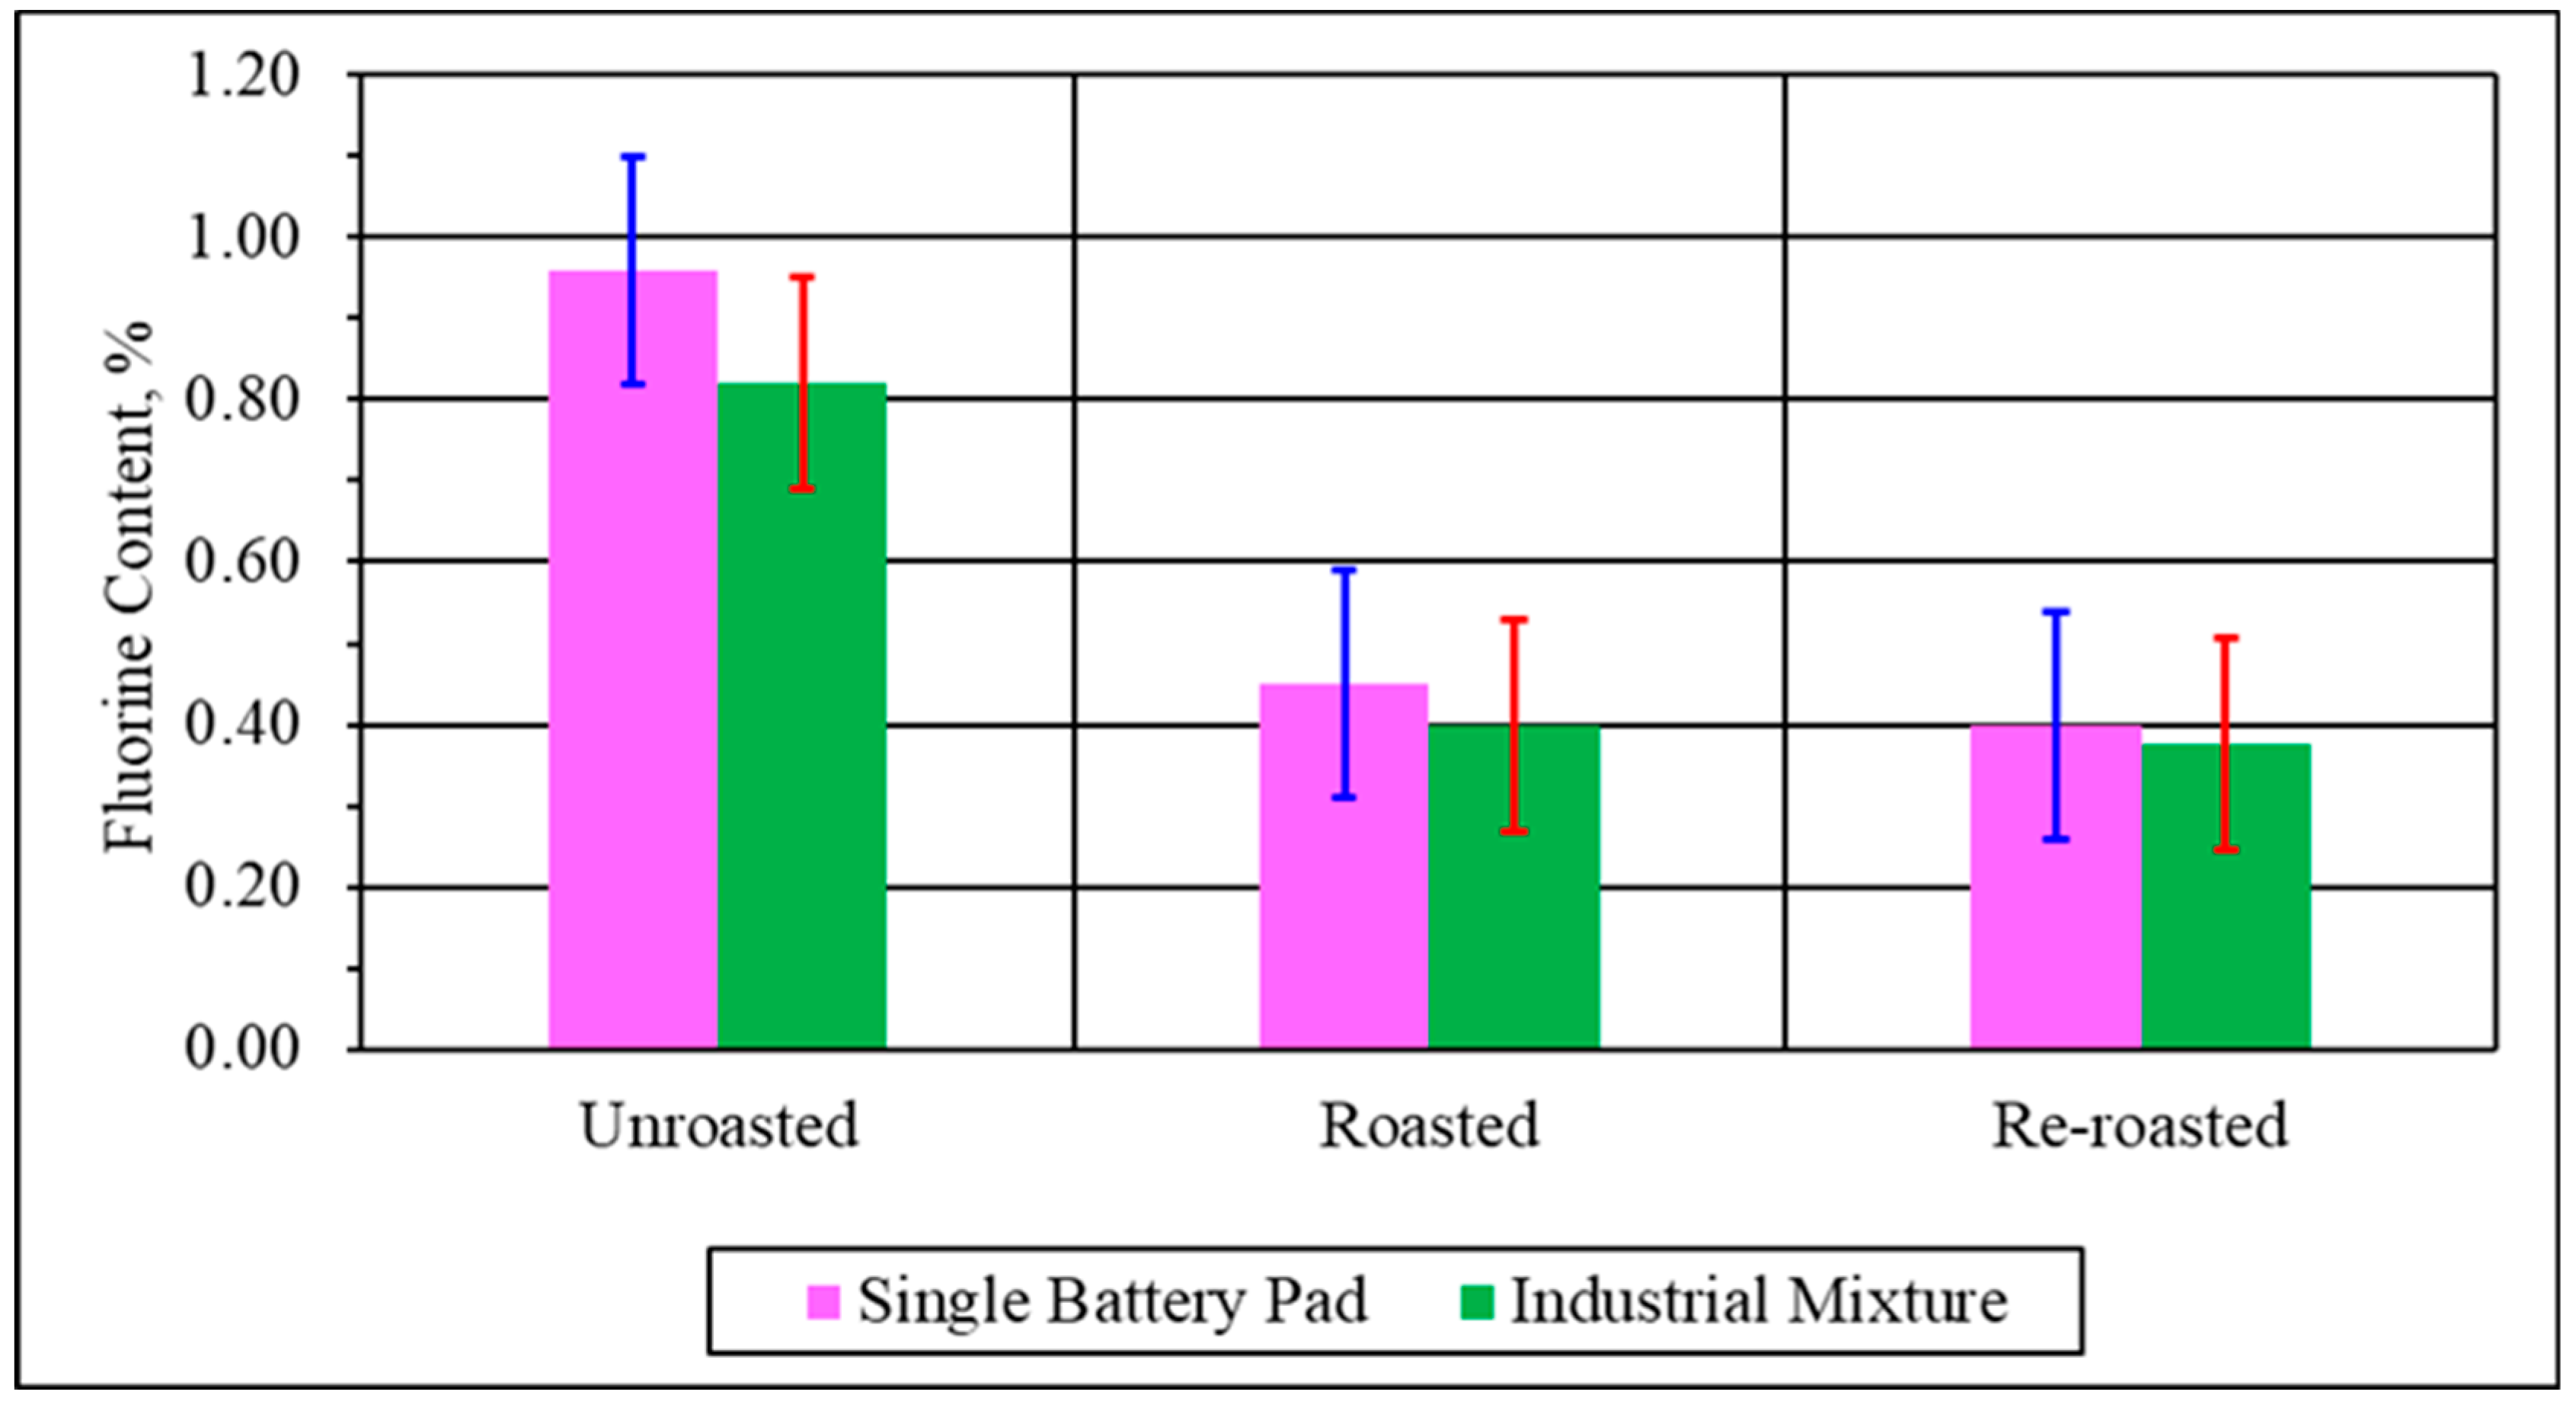
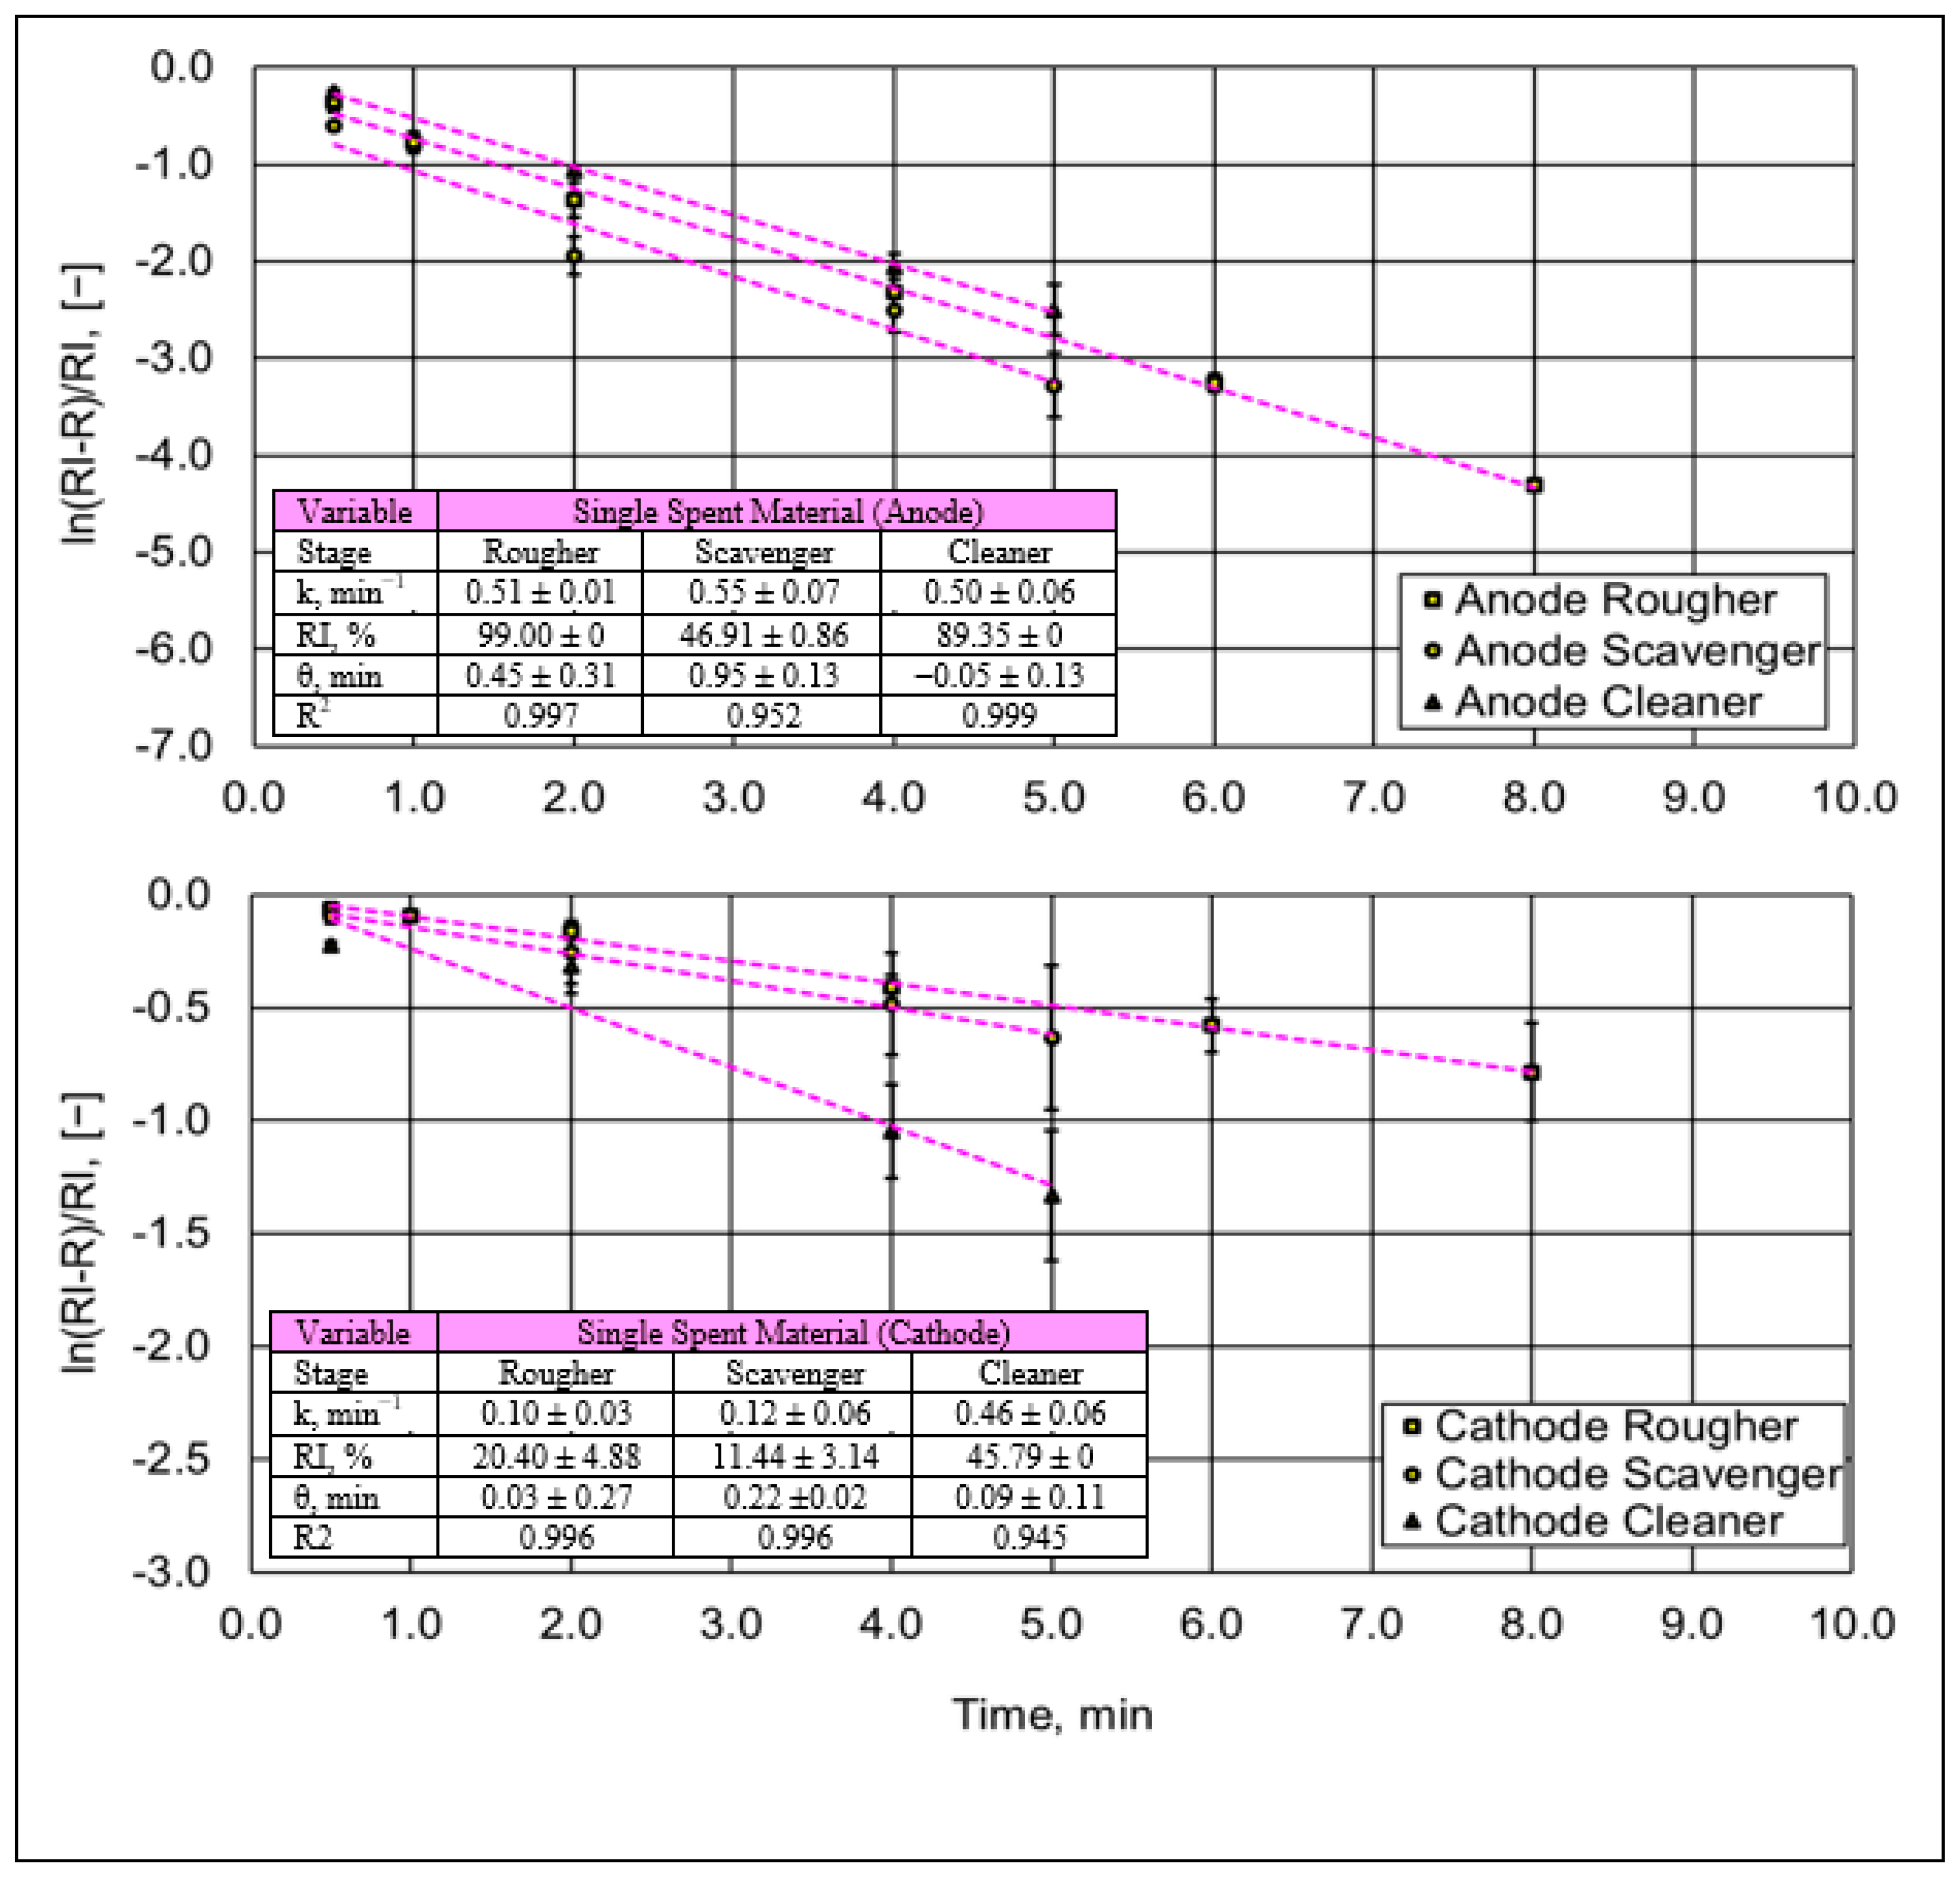
3.1.2. Pyrolysis Analysis in Spent Single Battery Material

Figure 4 shows the change in weight for mixed samples after pyrolysis and re-pyrolysis between 100 °C and 850 °C and contrasted with thermogravimetric analysis for pure polyvinylidene fluoride (PVDF) binder, pure graphite and pure NMC used as reference. The results at 600 °C indicated a weight of loss of 4.23%, 2.61% and 3.30% for unroasted, roasted and re-roasted materials, respectively. These results suggest the destruction of organic matter which could be related to the destruction of the binder. Instead, over 700 °C, the weight loss is due to the pyrolysis of graphite mainly.
For both the roasted and re-roasted samples, the similarity in terms of weight loss indicates that binder or fluorine by-products could still be present in the samples. This is supported by the thermogram for PVDF material which shows that at 600 °C, this polymer is not completely destroyed. This is because vinylidene polymers, such as PVDF, exhibit a thermal depolymerisation process between 500 °C and 600 °C where hydrofluoric acid (HF) is liberated and very stable fluoroaromatic compounds are formed [36,37].
In Figure 5, elemental fluorine analyses carried out for single and mixed materials sustain the TGA results due to the presence of fluorine residue from the binder in the samples. When samples were roasted once, the fluorine content in samples decreased by 53% and 51% for the single material and mixed materials, respectively. Instead, in the second pyrolysis, the fluorine change was 11% and 6% for the single and mixed material, and as a global result, the fluorine was removed by 58% and 54% for single materials and mixed materials, respectively.
These results indicate that fluorine removal is difficult due to the depolymerisation phenomenon mentioned before. This negatively impacts the fluorine removal, and this suggests that one pyrolysis does not give complete binder removal. Therefore, a pyrolysis strategy in two stages (pyrolysis and re-pyrolysis) was applied for all materials tested and prior to flotation experiments. Finally, the lower content of fluorine in industrial samples is highlighted. This could be related to the pre-treatment stages of these materials in order to remove or recover the solvent and electrolytes which are based on fluorine compounds.
In Figure 6, electron micrographs taken for the anode, cathode and mixtures of black mass materials with different pyrolysis degrees show changes in morphology before and after pyrolysis, indicating a lower agglomeration degree of materials after pyrolysis and much lower after the second pyrolysis. This could be expected to positively impact the separation of the anode material from cathode material as an indicator of better liberation. On the other hand, compositional analysis shows there are still some cathode materials (brighter colour) stuck to the graphite surface after pyrolysis, indicating that oxides would be carried with the graphite particles. Additionally, the agglomeration of graphite or anode particles is observed; this indicates the binder removal is not 100% efficient; this phenomenon agrees with the thermogravimetric analysis found in Figure 4 where the resin PVDF is not destroyed completely.

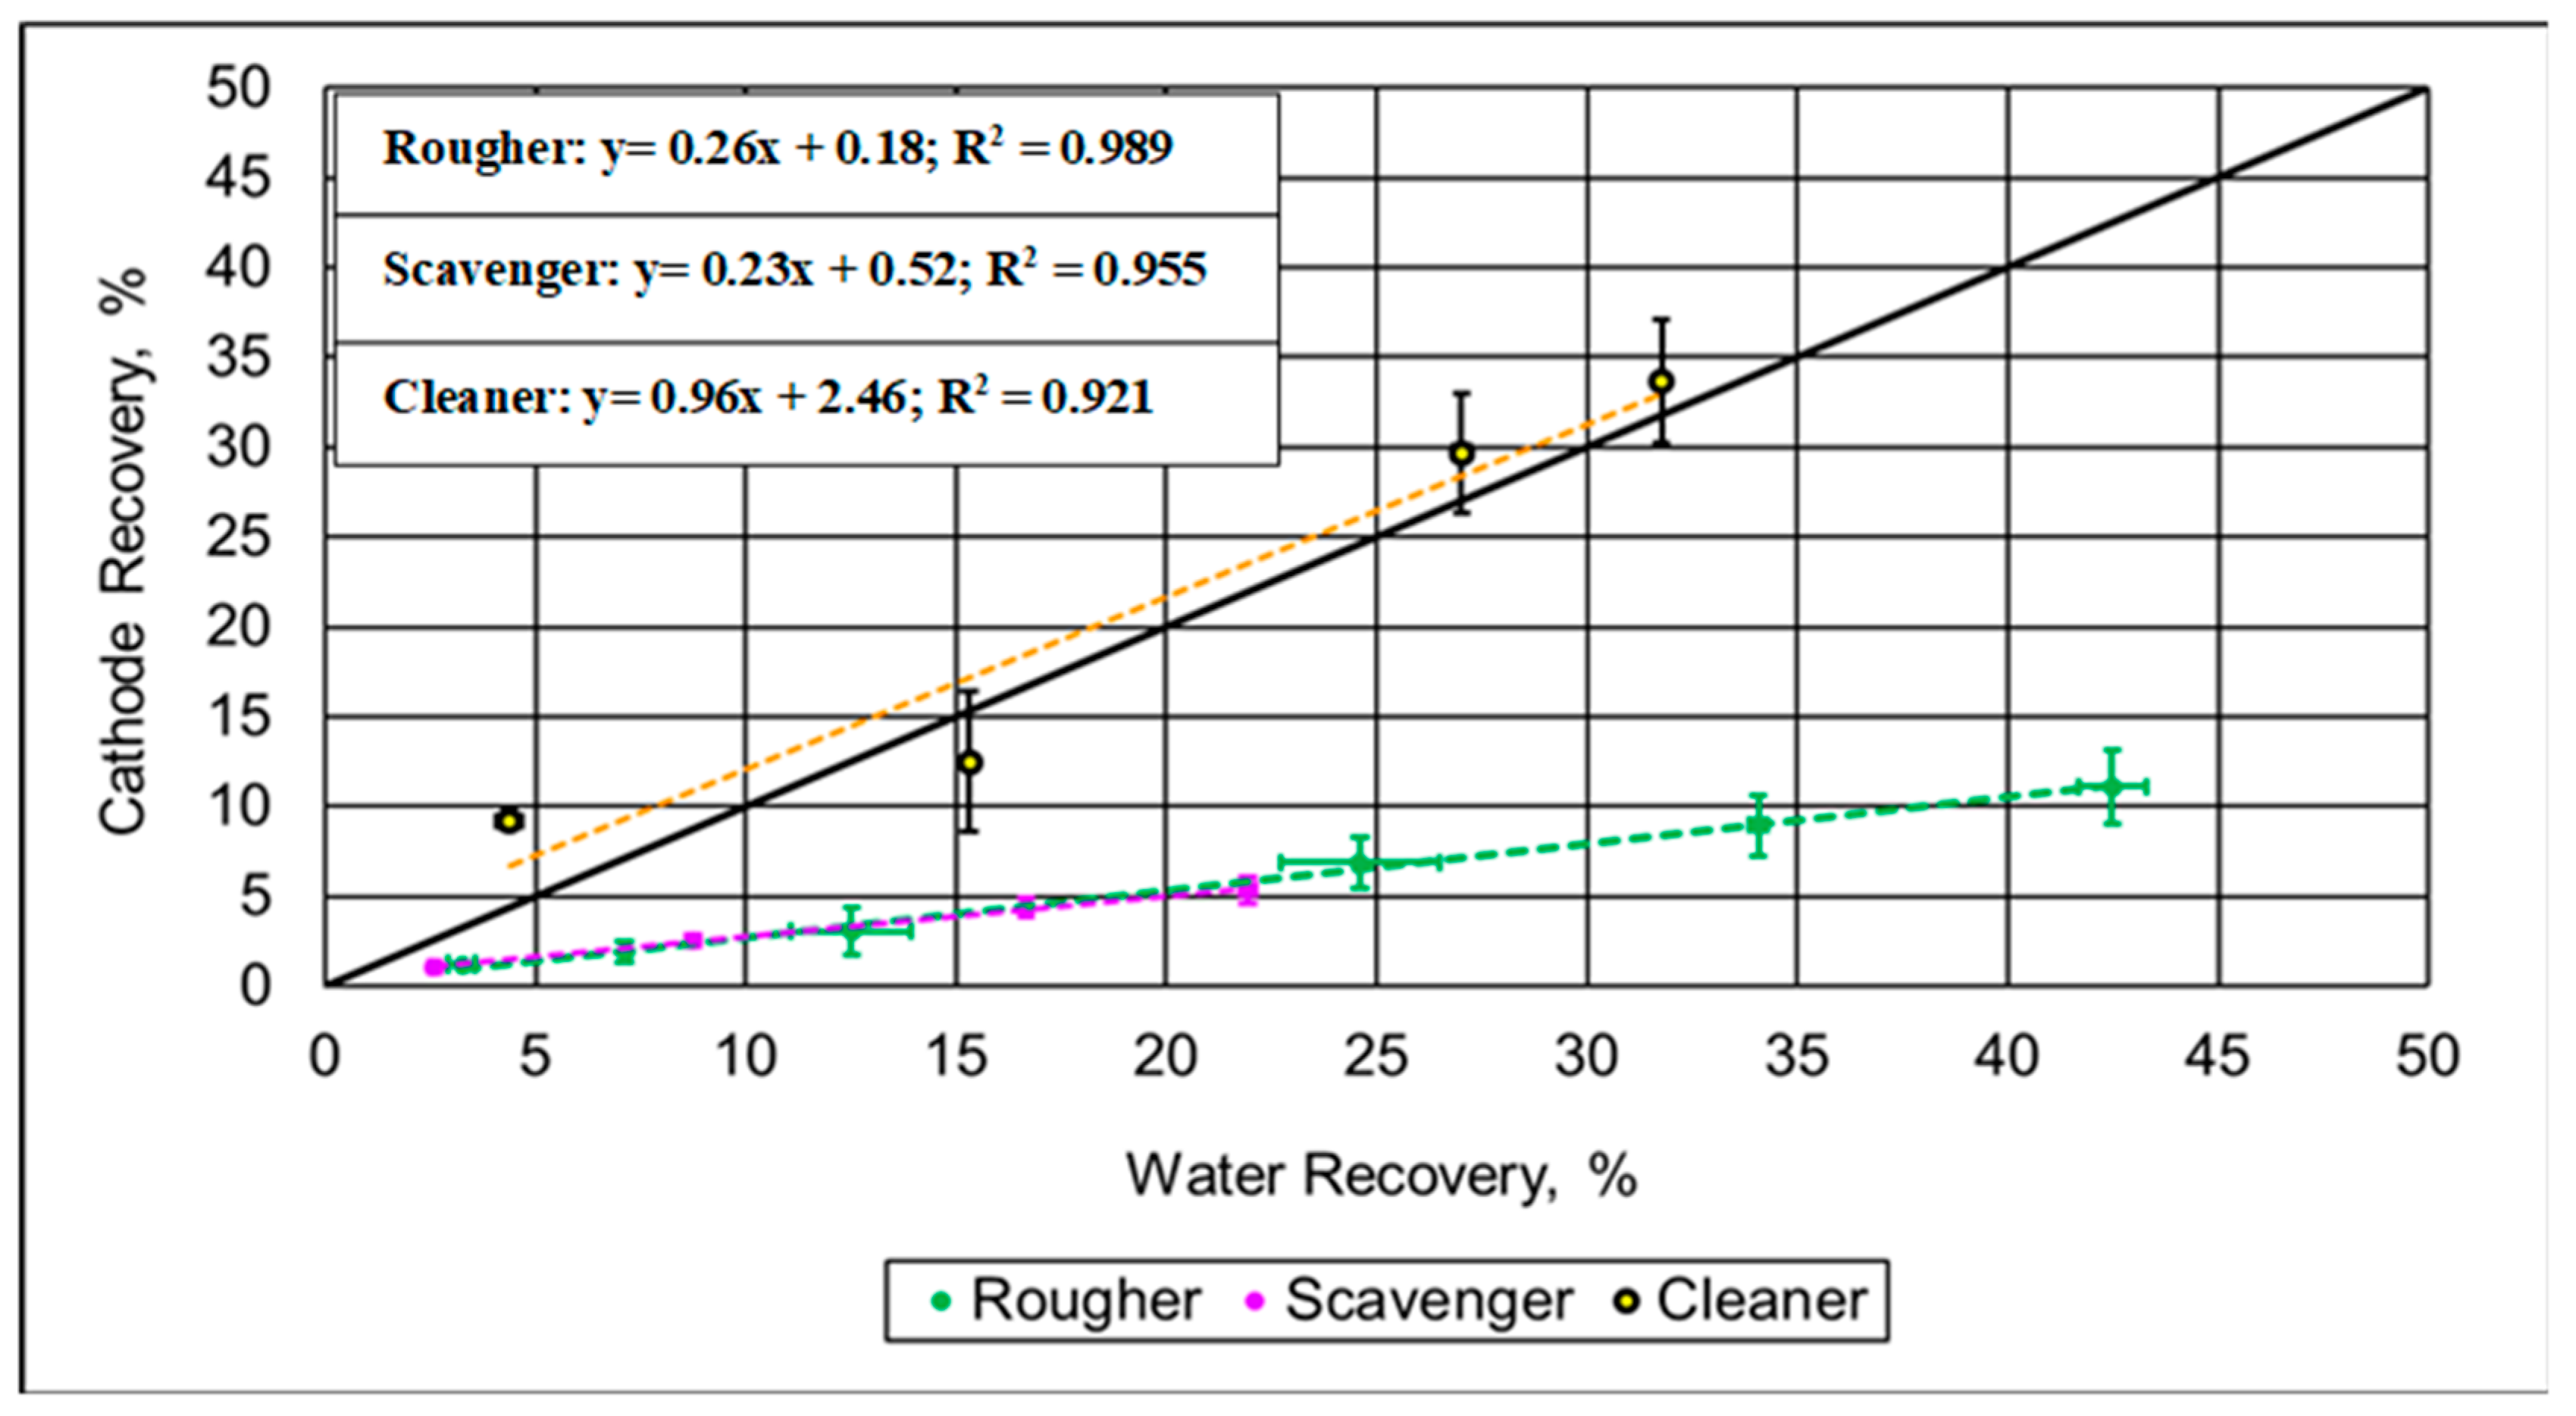
3.2. Flotation Trials on Single Spent Lithium-Ion Battery Materials

3.2.1. Flotation Trials on Single Spent Battery Materials

In this series of experiments, rougher, scavenger and cleaner flotation stages were carried out in open circuit in order to evaluate the flotation parameters based on the flotation kinetics of electrode materials for the further continuous circuit simulation.
In the rougher experiments, the composition of the feed material was kept constant. The average composition was 46.21 wt% anode material and 49.76 wt% cathode material; the residuals of mass (~4 wt%) were impurities such as copper, lithium and aluminium.
For the scavenger and the cleaner stages, the feed grade was not controlled and was dependent on the rougher stage. Figure 7 shows the component recovery as a function of flotation time for each electrode material.
The results in Figure 7 indicate a high recovery of the anode material for the rougher experiments; by contrast, for the scavenger stage, recoveries are much lower. This is due to a lower graphite content coming from the rougher tailings. Instead, anode recovery in the cleaner stage is much higher and close to the rougher recoveries.
Regarding the global indicators for this process, the final concentrate is composed of 90.31% graphite and 4.53% cathode material with global recoveries of 80.12% for graphite and 3.77% for cathode material, respectively. On the other hand, the final tailings coming from the scavenger stage contain 93.87% cathode material and 1.48% graphite, respectively. These values indicate a high separation efficiency and good selectivity for this process.
Figure 8 shows the entrainment plots for all stages evaluated, where a linear regression was also obtained by fitting the cathode recovery and water recoveries. From this analysis, the entrainment is highlighted as the main mechanism of recovery of cathode particles in the concentrate for the rougher and scavenger stages; this is because the plots are below the identity curve (y = x). By contrast, the cleaner stage plot is over the identity curve, which means that another mechanism of entrainment occurs during the separation process; this can be due to the entrainment or attachment of cathode particles onto the graphite surface due to the high content of graphite in the slurry, and quantitatively, it is measured by the entrainment factor that is the slope of the curve in the linear regression applied. From all the curves analysed, they can be classified as type 5 entrainment curves, which means that cathode particles float by entrainment and true flotation [38].
Figure 9 shows the kinetics plots for the anode and the cathode material in all flotation stages. This linear regression is obtained by fitting the anode and cathode recoveries (Figure 8) to Equation (2) to obtain the rate of recovery at different flotation times. The linear regression constants are given in the figure. A fast flotation kinetics is reported for anode materials in all flotation stages with similar flotation rate constant values (k). By contrast, for ultimate recovery values, significant differences are seen for all stages evaluated.
For the cathode material, a fast flotation kinetics is reported in the cleaner stage. Instead, the rougher stage shows the slowest kinetics for cathode materials with a similar response in the scavenger stage. Regarding ultimate recovery values, the results indicate a higher value of recovery for the cleaner stage compared with the rougher and scavenger stages.

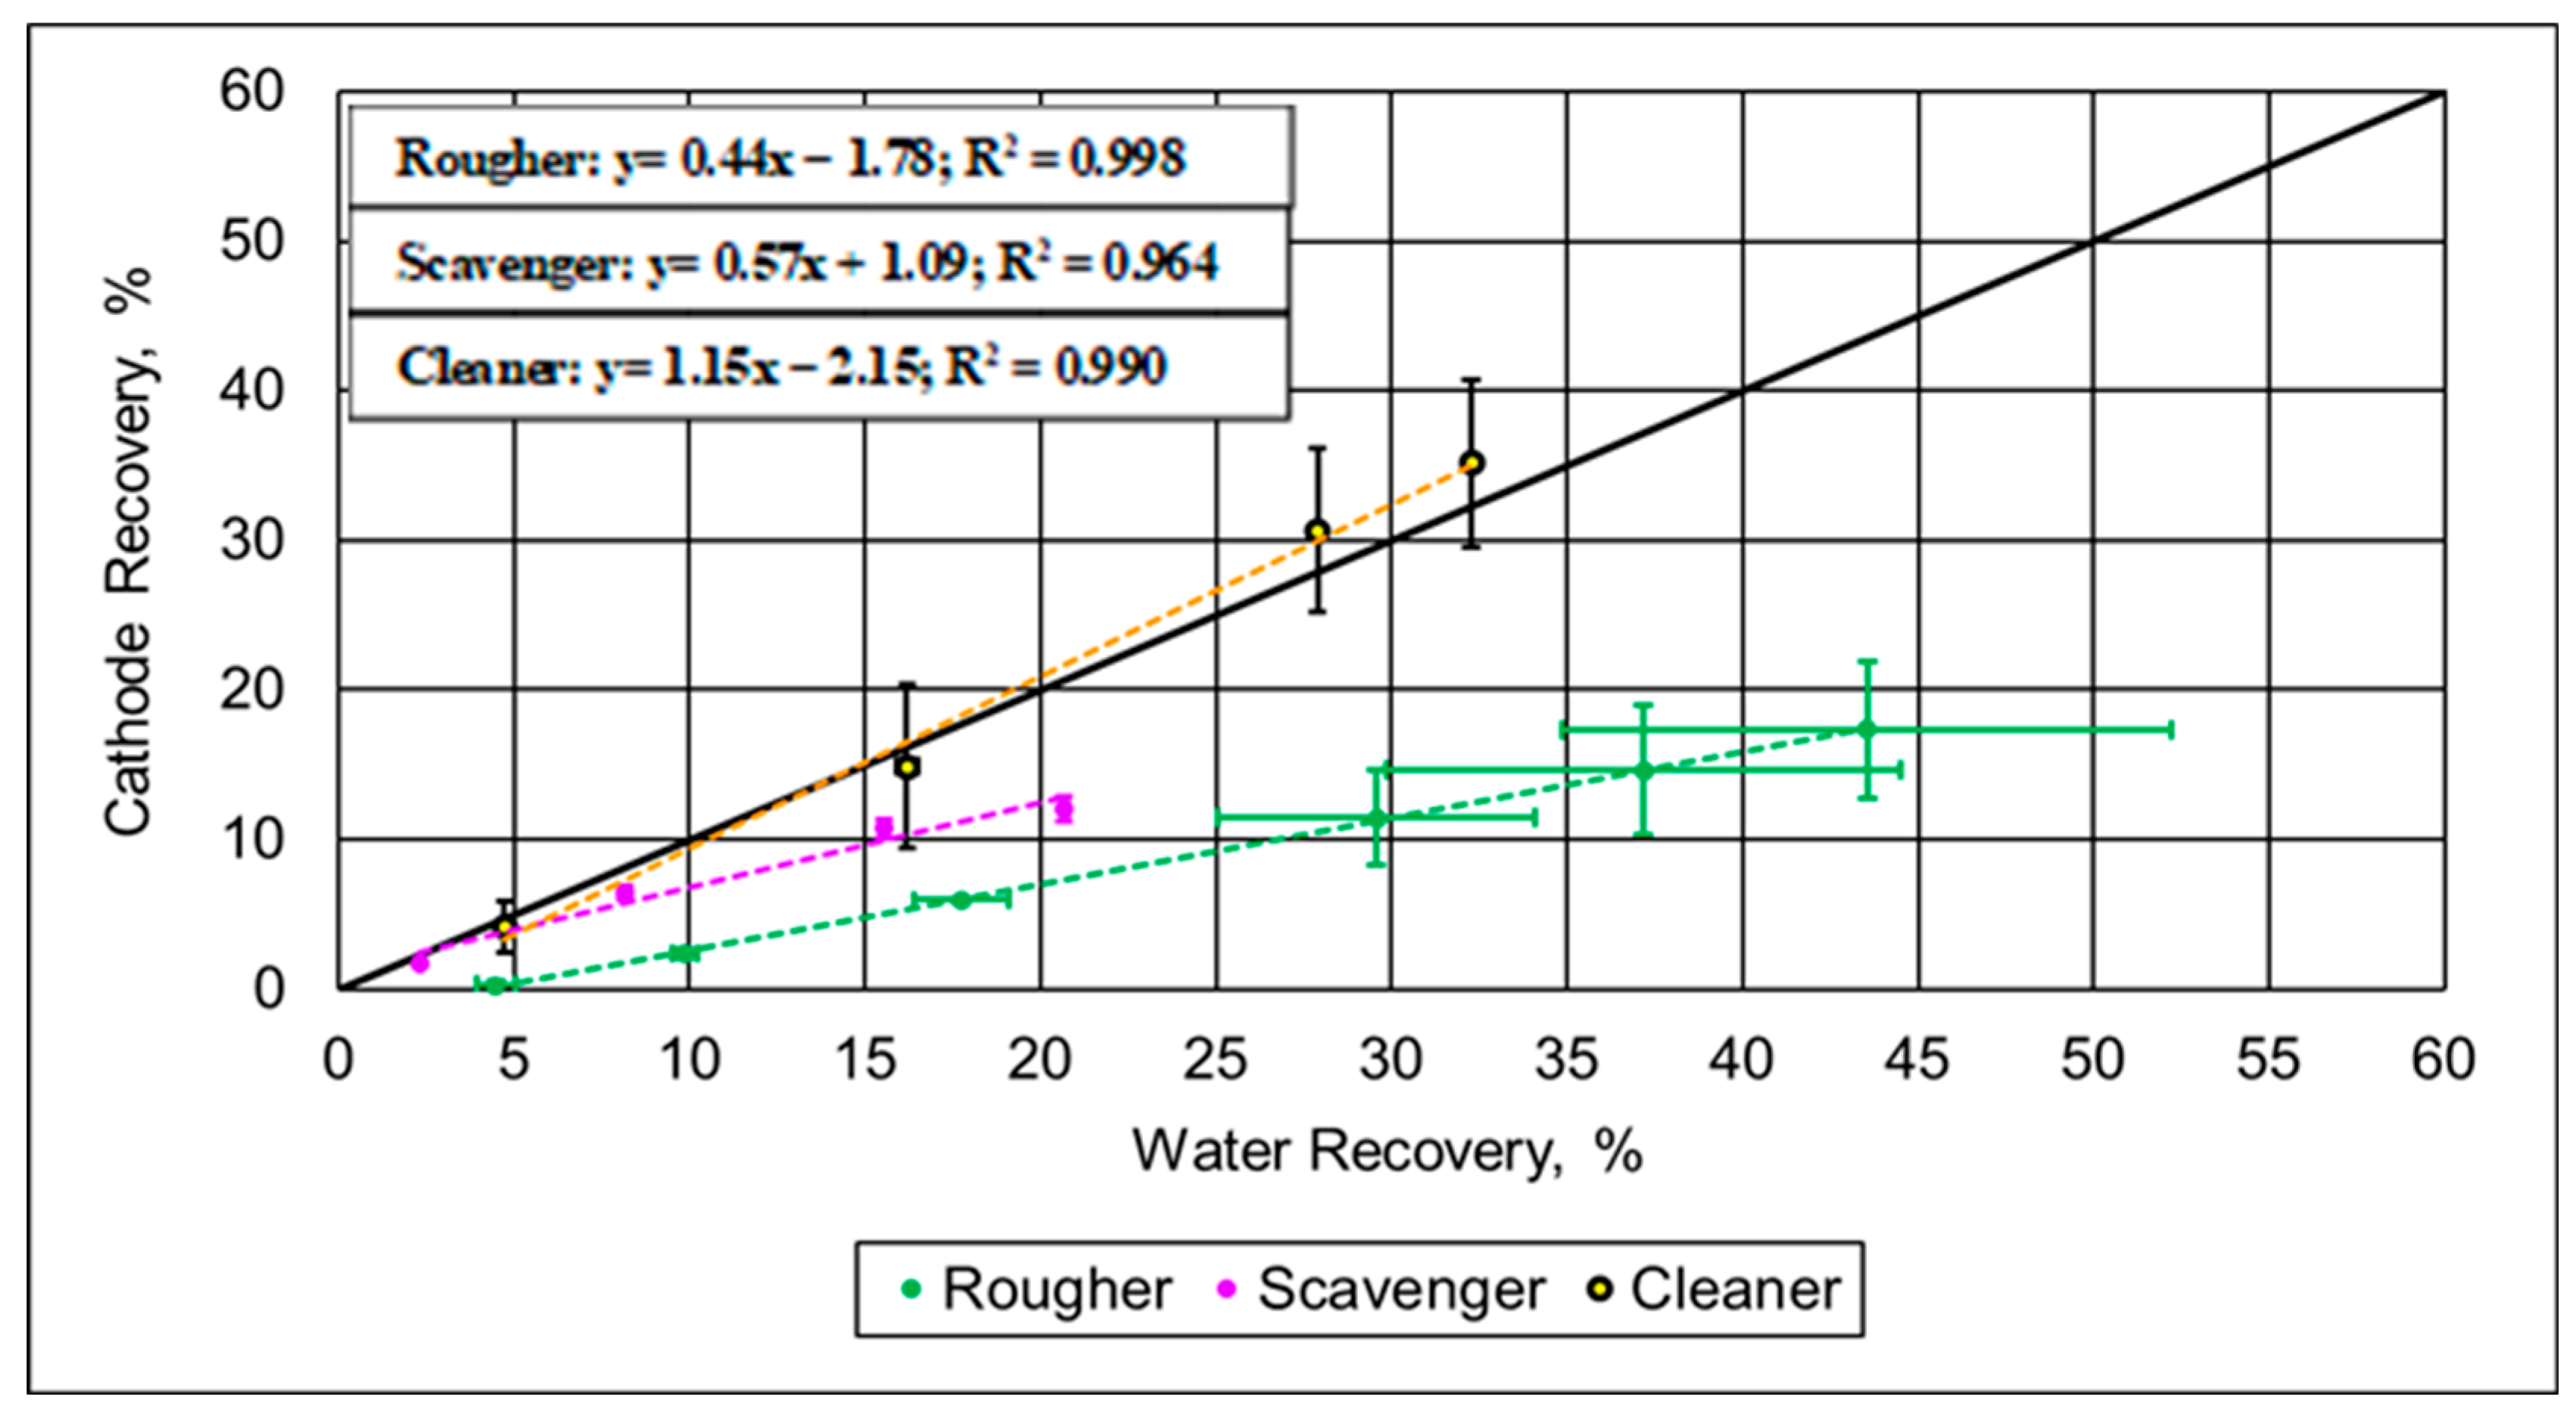
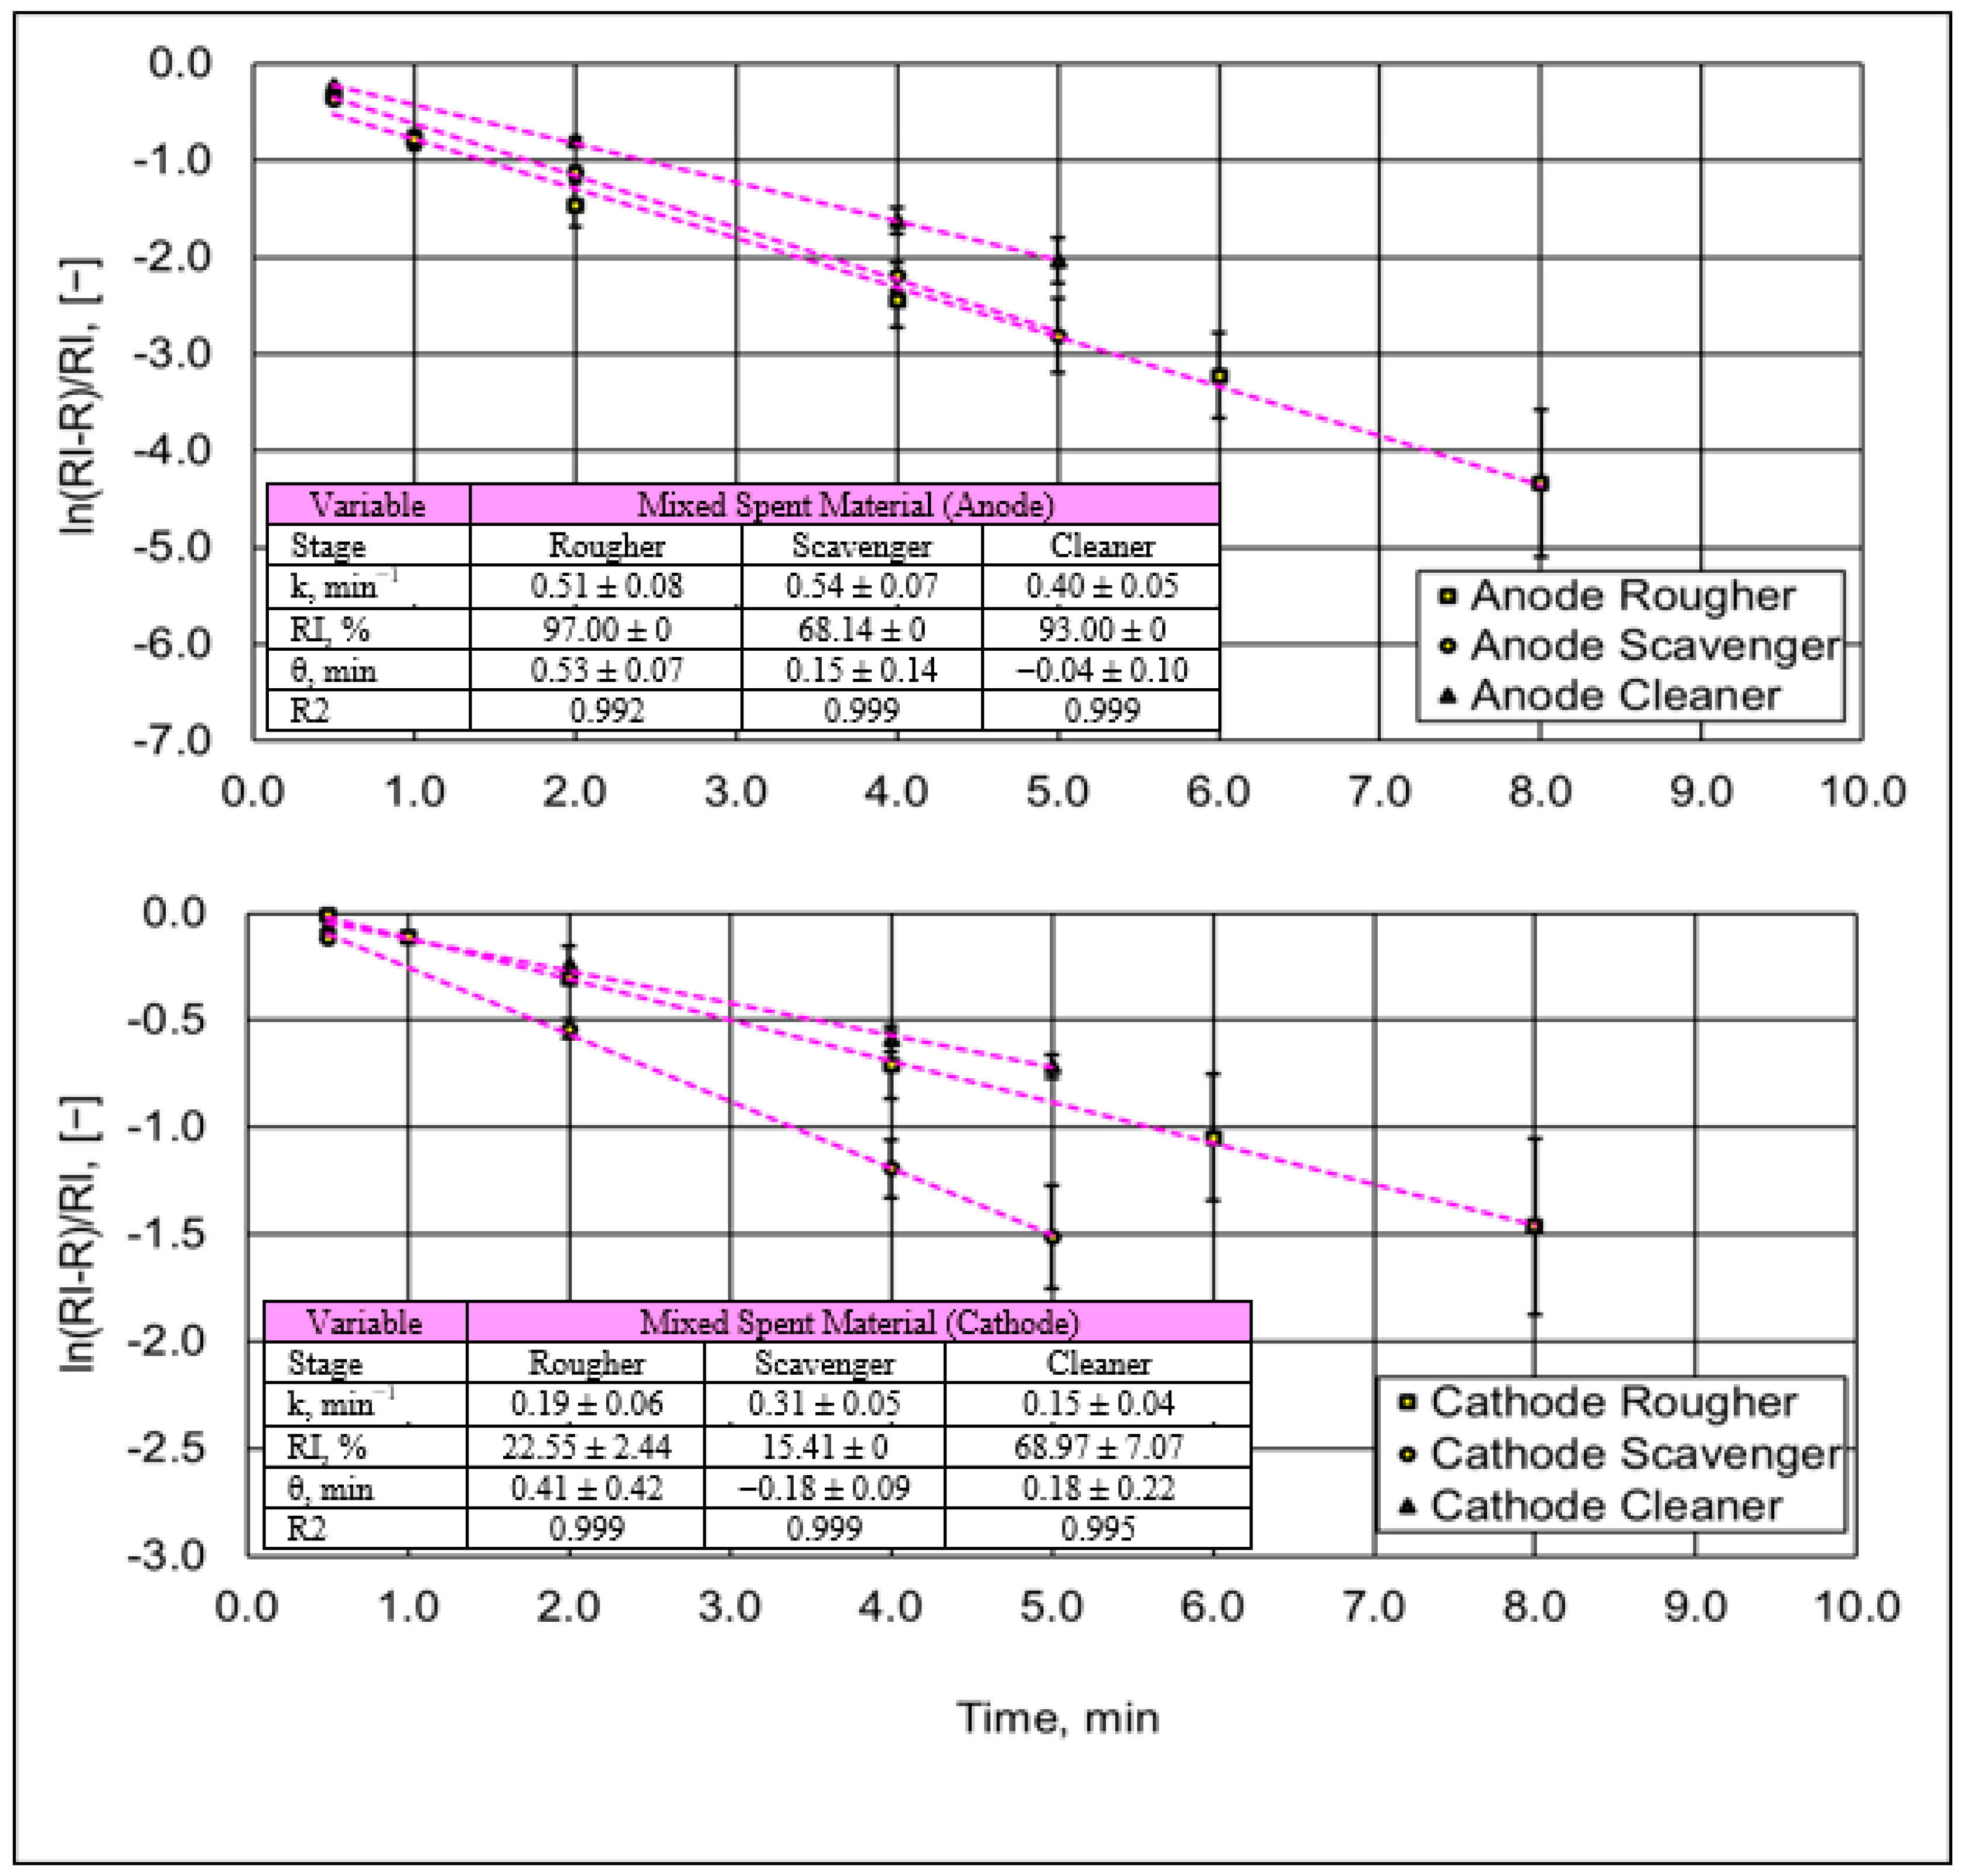
3.2.2. Flotation Trials on Spent Battery Mixed Materials

In these flotation experiments, a mixed spent battery taken from a recycling operation was tested in the rougher, scavenger and cleaner stage. The average composition was 36.61 wt% anode material and 45.91 wt% cathode material; the residuals (17.47 wt%) were impurities present in the material such as copper lithium, phosphorous and aluminium. The processing conditions used in these flotation trials were the same used in the rougher, scavenger and cleaner trials with single battery materials (the processing conditions are mentioned in Table 1).
The results in Figure 10 indicate a high recovery of the anode material (graphite) for the rougher and cleaner stages which is normal due to the high graphite content. Instead, for the scavenger stage, the recovery was lower due to the low graphite content from rougher tailings.
Regarding to the anode and cathode recoveries, results indicate a good separation efficiency for rougher and scavenger stages. By contrast, separation efficiency of anode and cathode materials in the cleaner stage is lower.
Regarding the global indicators for this process for mixed battery materials, the final concentrate is composed of 81.96% graphite and 8.05% cathode material with global recoveries of 77.42% for graphite and 5.97% for cathode material, respectively. On the other hand, the final tailings coming from the scavenger stage contain 87.09% cathode material and 2.53% graphite, respectively. These values indicate a high separation efficiency and good selectivity for this process. However, although these values are lower than the values found for single battery materials, they indicate a high separation efficiency, but more separation stages need to be applied to achieve a commercial anode concentrate required for battery manufacturing.
Figure 11 shows the entrainment plots for all stages evaluated; additionally, a linear regression was obtained by fitting the cathode recovery and water recoveries. The same as in Figure 8, the entrainment is highlighted as the main mechanism of recovery of cathode particles in the concentrate for the rougher and scavenger stages; this is because the plots are below the identity curve (y = x). Instead, in the cleaner stage, the entrainment plot is over the identity curve, which means that another mechanism of entrainment occurs during the separation process; this can be related to the attachment of cathode particles onto the graphite surface due to the high content of graphite in the slurry; this phenomenon is measured by the entrainment factor that is higher for this stage compared with the others. From all the curves analysed, they can be classified as a type 5 entrainment curve [38]; for the scavenger stage, this is because the intercept is positive which means that cathode particles float by entrainment and true flotation. Instead, for the rougher and cleaner stages, the intercept is negative; these curves can be classified as type 2 entrainment curves; this is because they are shifted in relation to the origin of the plot, which can indicate that feed materials can contain coarse particles, and the height of the froth is low during the experiments; this phenomenon is more appreciable in the rougher and cleaner stages with a lower value of the intercept and where these curves are more shifted than the scavenger curve.
Figure 12 shows the kinetics plots for the anode and cathode materials in all flotation stages. These linear regressions are obtained by fitting the anode and cathode recoveries (Figure 10) to Equation (2) to obtain the rate of recovery at different flotation times. A fast flotation kinetics for the anode material is reported in the scavenger and rougher stages. For the cleaner stage, the flotation kinetics are slower. Regarding ultimate recovery values, they show significant differences for all stages evaluated. This is related to the graphite content fed to each stage.
For cathode materials, a fast flotation kinetics is reported in the scavenger stage. Instead, the cleaner stage shows the slowest kinetics for cathode materials with a similar response in the rougher stage. Regarding ultimate recovery values, the results indicate a higher value of recovery for the cleaner stage compared with the rougher and scavenger stages.

4. Discussion

The separation efficiency (SE) for the open-cycle flotation tests is shown in Figure 13. The SE results indicate that for the single battery material, the separation efficiency is higher in the rougher and cleaner stages compared with mixed battery materials. This was expected due to the cleaner chemistry of the single battery material. The exception is the scavenger stage where a higher SE value is obtained for the mixed battery materials. However, this is likely to be due to the higher graphite content present in the rougher tailings which are the feed to the scavenger stage, 5.62% (mixed material) compared with 2.40% carbon (single material).
The selectivity index values in Figure 14 show the impact of feed composition for the three different flotation stages. For the rougher stage, the SI value is the highest due to the moderate graphite content in the feed materials. As mentioned in relation to the CSE for the scavenger stage, the SI values are somewhat lower due to the lower content of graphite that is available to be separated. In contrast, for the cleaner stages, the SI values are much lower also due to the high graphite content. When there is a high graphite content, there is a much higher probability of the entrainment of lithium metal oxides in the concentrate. The same behaviour is reported for both materials tested. This low separation index for the cleaner stage shows why it is difficult to obtain high purity for anode materials without requiring multiple cleaner stages. Additionally, this phenomenon could be explained by some association mechanisms between the cathode materials and graphite particles when cathode materials are in a lower mass ratio compared with cathode materials.
Figure 15 shows differences in terms of entrainment factors calculated for single materials and mixed materials for all flotation stages tested. Comparing both materials, the results indicate a higher entrainment level for all stages in mixed materials compared with single materials.
For the single materials in the rougher and scavenger stages, the entrainment factor is relatively similar, but for the cleaner stage, the entrainment factor is much higher, which indicates the effect of another mechanism apart from water entrainment that increases the cathode recovery in the concentrate fraction. The same behaviour was observed for the mixed material with a high entrainment factor.
In Figure 16, the optimal flotation time estimated for the rougher and cleaner stages for both materials tested indicates a relatively small difference between the time calculated using Equation (3) and the experimental flotation time selected. However, for the scavenger stage, the difference is more appreciable for the mixed material tested. A possible explanation for this phenomenon is based on the cathode material kinetics which is faster when mixed materials are treated (see Figure 12) compared to when a single battery material is processed. When the kinetic rate constant value (k) for cathode material is higher, this increases the flotation time required to maximise the separation efficiency, such as that detailed in Equation (3). Additionally, this phenomenon could indicate a possible physical association mechanism or entrainment between cathode and anode materials that increases its content in graphite concentrates.
Finally, in this work, good flotation results were obtained for spent lithium-ion battery samples taken from different sources and using a simple flotation circuit involving up to three possible stages. However, this is just one of many possible flotation circuits, and more studies must be carried out in order to analyse the feasibility of processing these materials in more complex flotation circuits.

5. Conclusions

In this experimental study, the separation of anode and cathode materials in a multi-stage process was evaluated for two types of battery materials. The first was a single cathode chemistry material which was disassembled in a controlled process prior to the flotation separation stage. The second was a mixed cathode chemistry material received from an industrial recycling facility. Different performance parameters were calculated based on the flotation kinetics for each material. The conclusions are as follows:
  • The graphite grade in the concentrate of the cleaner stage is higher for the single battery material, with grades over 90 wt% of anode material achieved. In the case of mixed battery materials, the maximum graphite grade is over 81 wt%. The difference is attributed to the impurities in the feed for the mixed material.
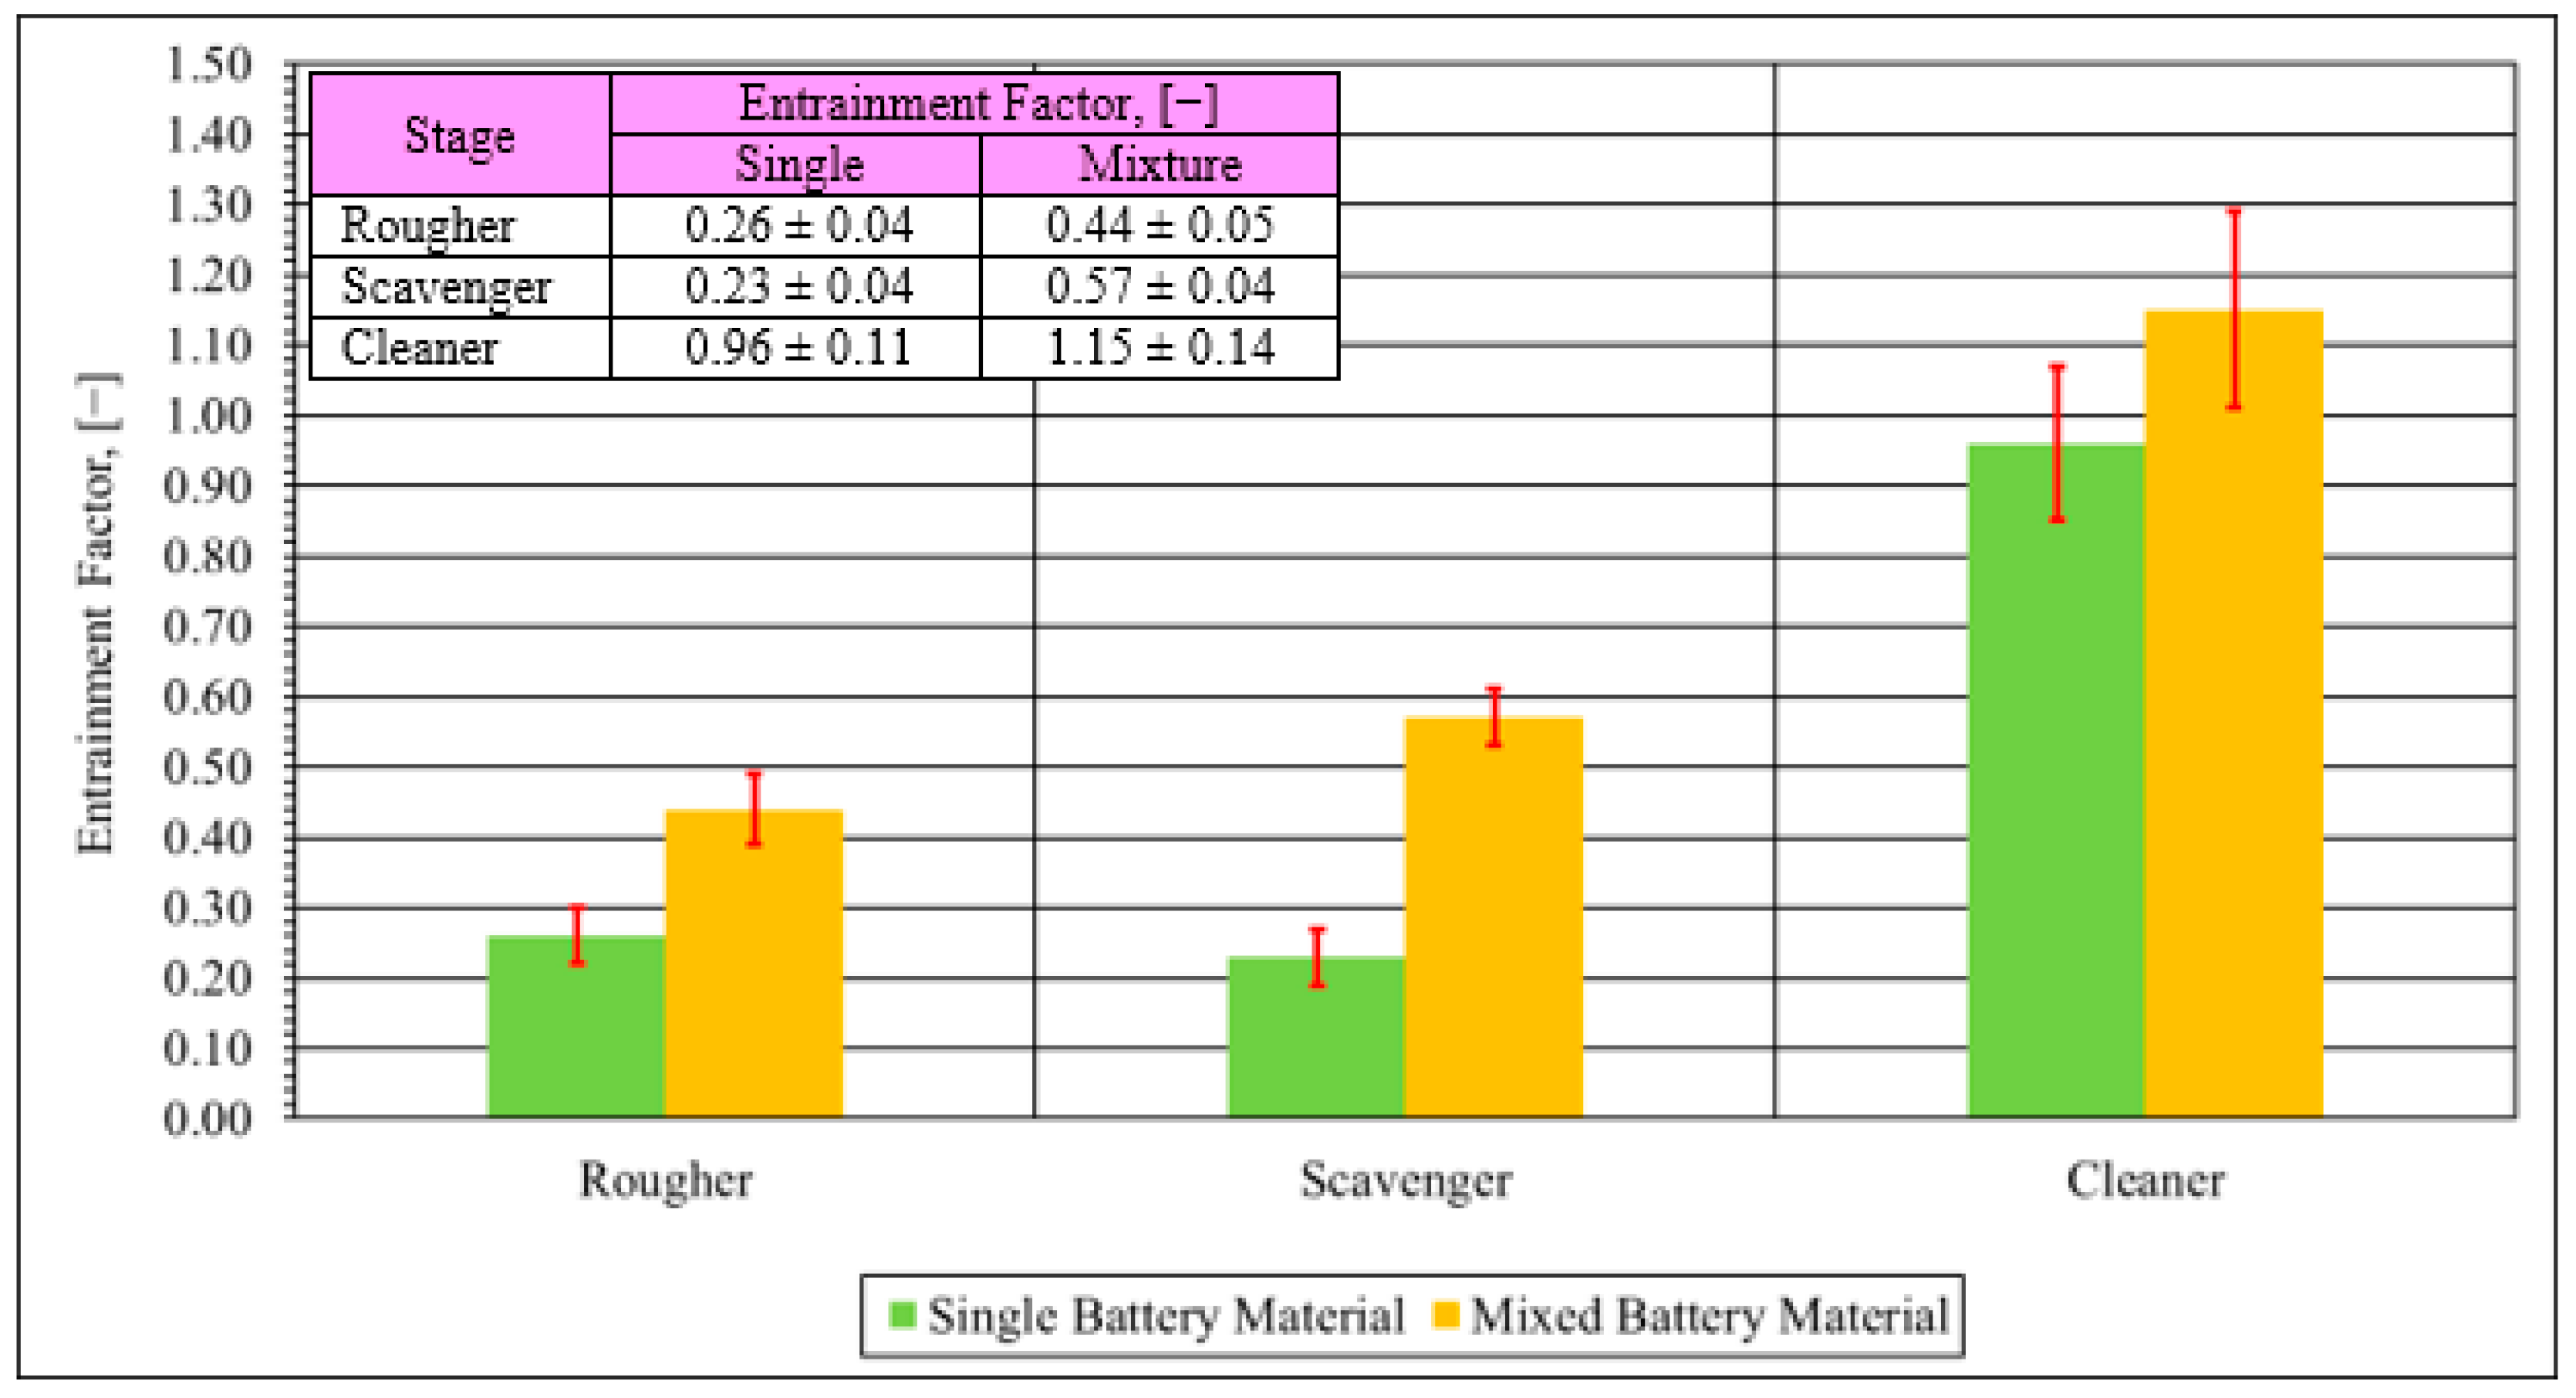
  • The entrainment results for the rougher and scavenger stages were relatively low for both types of materials, indicating that water entrainment is the main entrainment mechanism.
  • A much higher entrainment factor was observed for both materials for the cleaner stage. This indicates an interaction between cathode material particles with the anode materials when cathode materials have a comparatively low concentration.
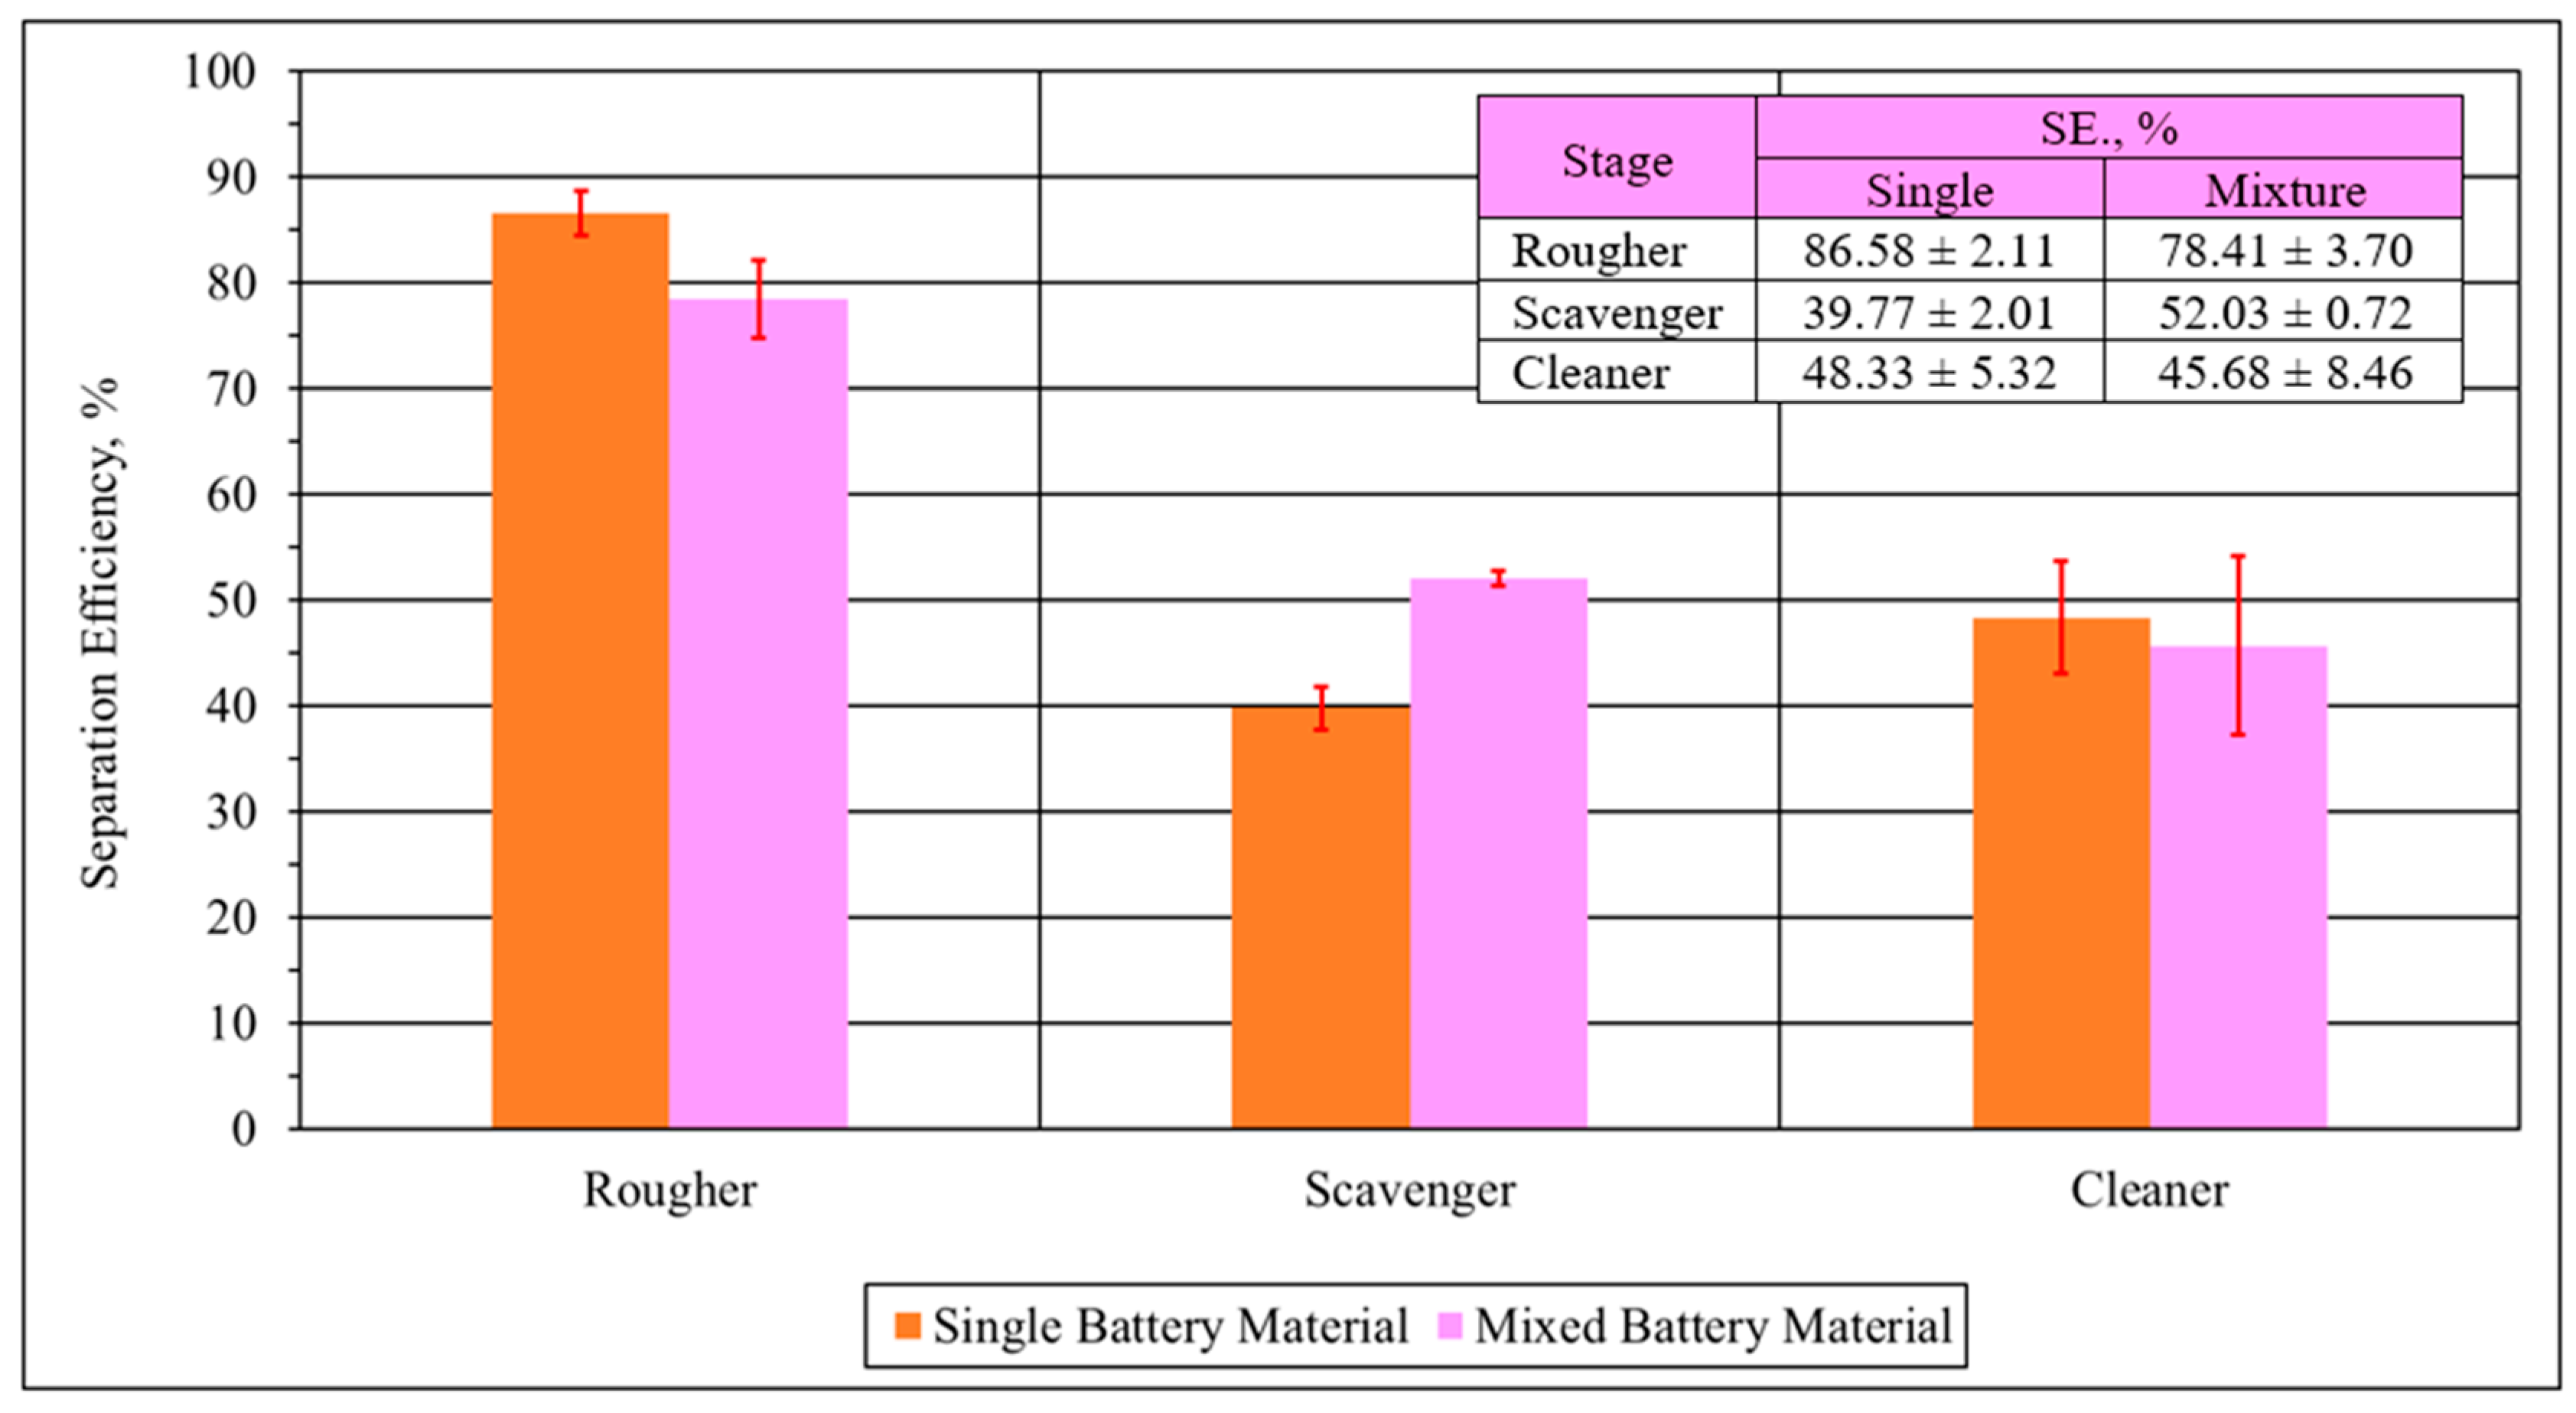
  • The impurity content of the recycled electrode material negatively impacts the flotation performance. Therefore, if possible, battery materials should be processed separately according to their cathode chemistry in order to achieve the best subsequent separation. The selectivity index of the single material was double that of the mixed materials for both the rougher and scavenger stages.
Despite the grades obtained, to achieve commercial graphite purity, either more cleaner stages are required, a different type of flotation technology such as a flotation column could be used or alternative purification technologies using acid leaching for the concentrate could be employed.

Supplementary Materials

The following supporting information can be downloaded at https://www.mdpi.com/article/10.3390/pr12071363/s1, Figure S1: Sample preparation procedure for all materials tested; Figure S2: Anode and cathode electrodes separated from battery pads; Figure S3: Photographs of materials after shredding (a) and after crushing process (b); Figure S4: Photograph of the muffle furnace used for the sample pyrolysis; Table S1: Mass collector ratios used for dosage calculation; Table S2: Mass collector ratios used for time calculation.

Author Contributions

L.V.: conceptualisation, experiments, data processing and writing; J.M.: methodology and reviewing; W.B.: methodology, experiments and reviewing; A.H.: supervision; L.Z.: supervision; B.E.: reviewing; J.B.: reviewing; L.M.: reviewing. All authors have read and agreed to the published version of the manuscript.

Funding

The financial support for the flotation equipment and experiments was funded by the Australian Research Council, ARC Research Hub for Energy-efficient Separation, granted to Lian Zhang, project number: IH170100009.

Data Availability Statement

Data will be made available on request.

Acknowledgments

The authors would like to acknowledge The Chilean National Agency for Research and Development, (ANID), for the financial support given to this research through a PhD scholarship, number: 72180491; Monash University for the development of this research work, Riley Whitehouse from ASCC Australia for the reagent ExxolTM D80, Tom Austin from CSIRO Mineral Resources for his help with pyrolysis experiments and Envirostream Pty Ltd. (Lithium Australia) for the provision of samples.

Conflicts of Interest

Author Jorge Menacho was employed by the company De Re Metallica Ingeniería SpA. The remaining authors declare that the research was conducted in the absence of any commercial or financial relationships that could be construed as a potential conflict of interest.

References

  1. WEF. A Vision for a Sustainable Battery Value Chain in 2030; World Economic Forum: Cologny, Switzerland, 2019; 52p. [Google Scholar]
  2. Lei, Y.; Zhang, J.; Chen, X.; Min, W.; Wang, R.; Yan, M.; Xu, J. From spent lithium-ion batteries to high performance sodium-ion batteries: A case study. Mater. Today Energy 2022, 26, 100997. [Google Scholar] [CrossRef]
  3. Parka, Y.; Leea, K. Evaluation of low-purity natural graphite as a cost-effective anode active material for lithium ion batteries. J. Ceram. Process. Res. 2016, 17, 348–351. [Google Scholar]
  4. Jara, A.D.; Betemariam, A.; Woldetinsae, G.; Kim, J.Y. Purification, application and current market trend of natural graphite: A review. Int. J. Min. Sci. Technol. 2019, 29, 671–689. [Google Scholar] [CrossRef]
  5. Boxall, N.J.; King, S.; Cheng, K.Y.; Gumulya, Y.; Bruckard, W.; Kaksonen, A.H. Urban mining of lithium-ion batteries in Australia: Current state and future trends. Miner. Eng. 2018, 128, 45–55. [Google Scholar] [CrossRef]
  6. Baum, Z.J.; Bird, R.E.; Yu, X.; Ma, J. Lithium-Ion Battery Recycling—Overview of Techniques and Trends. ACS Energy Lett. 2022, 7, 712–719. [Google Scholar] [CrossRef]
  7. Gaines, L.; Sullivan, J.; Burnham, A. Life-Cycle Analysis for Lithium-Ion Battery Production and Recycling. In Proceedings of the Transportation Research Board 90th Annual Meeting, Washington, DC, USA, 23–27 January 2011. [Google Scholar]
  8. Winslow, K.M.; Laux, S.J.; Townsend, T.G. A review on the growing concern and potential management strategies of waste lithium-ion batteries. Resour. Conserv. Recycl. 2018, 129, 263–277. [Google Scholar] [CrossRef]
  9. Dunn, J.B.; Gaines, L.; Sullivan, J.; Wang, M.Q. Impact of Recycling on Cradle-to-Gate Energy Consumption and Greenhouse Gas Emissions of Automotive Lithium-Ion Batteries. Environ. Sci. Technol. 2012, 46, 12704–12710. [Google Scholar] [CrossRef]
  10. Held, M.; Tuchschmid, M.; Zennegg, M.; Figi, R.; Schreiner, C.; Mellert, L.D.; Welte, U.; Kompatscher, M.; Hermann, M.; Nachef, L. Thermal runaway and fire of electric vehicle lithium-ion battery and contamination of infrastructure facility. Renew. Sustain. Energy Rev. 2022, 165, 112474. [Google Scholar] [CrossRef]
  11. Folayan, T.-O.; Lipson, A.L.; Durham, J.L.; Pinegar, H.; Liu, D.; Pan, L. Direct Recycling of Blended Cathode Materials by Froth Flotation. Energy Technol. 2021, 9, 2100468. [Google Scholar] [CrossRef]
  12. Kim, Y.; Matsuda, M.; Shibayama, A.; Fujita, T. Recovery of LiCoO2 from Wasted Lithium Ion Batteries by using Mineral Processing Technology. Resour. Process. 2004, 51, 3–7. [Google Scholar] [CrossRef]
  13. Verdugo, L.; Zhang, L.; Saito, K.; Bruckard, W.; Menacho, J.; Hoadley, A. Flotation behavior of the most common electrode materials in lithium ion batteries. Sep. Purif. Technol. 2022, 301, 121885. [Google Scholar] [CrossRef]
  14. Kaya, M. State-of-the-art lithium-ion battery recycling technologies. Circ. Econ. 2022, 1, 100015. [Google Scholar] [CrossRef]
  15. Gupta, A.; Yan, D.S. Chapter 16—Flotation. In Mineral Processing Design and Operation; Gupta, A., Yan, D.S., Eds.; Elsevier Science: Amsterdam, The Netherlands, 2006; pp. 555–603. [Google Scholar] [CrossRef]
  16. Chehreh Chelgani, S.; Rudolph, M.; Kratzsch, R.; Sandmann, D.; Gutzmer, J. A Review of Graphite Beneficiation Techniques. Miner. Process. Extr. Metall. Rev. 2016, 37, 58–68. [Google Scholar] [CrossRef]
  17. Vanderbruggen, A.; Sygusch, J.; Rudolph, M.; Serna-Guerrero, R. A contribution to understanding the flotation behavior of lithium metal oxides and spheroidized graphite for lithium-ion battery recycling. Colloids Surf. A Physicochem. Eng. Asp. 2021, 626, 127111. [Google Scholar] [CrossRef]
  18. Verdugo, L.; Zhang, L.; Etschmann, B.; Bruckard, W.; Menacho, J.; Hoadley, A. Effect of lithium ion on the separation of electrode materials in spent lithium ion batteries using froth flotation. Sep. Purif. Technol. 2023, 311, 123241. [Google Scholar] [CrossRef]
  19. Wakamatsu, T.; Numata, Y. Flotation of graphite. Miner. Eng. 1991, 4, 975–982. [Google Scholar] [CrossRef]
  20. Dunne, R.C.; Lane, G.S.; Richmond, G.D.; Dioses, J. Flotation data for the design of process plants Part 2—case studies. Miner. Process. Extr. Metall. 2013, 119, 205–215. [Google Scholar] [CrossRef]
  21. Muzenda, E.; Abdulkareem, A.; Afolabi, A. Reagent Optimization across a UG2 Plant. Lect. Notes Eng. Comput. Sci. 2013, 1, 575–579. [Google Scholar]
  22. Zhang, S.; Zhao, T.; Wang, J.; Qu, X.; Chen, W.; Han, Y. Determination of fluorine, chlorine and bromine in household products by means of oxygen bomb combustion and ion chromatography. J. Chromatogr. Sci. 2013, 51, 65–69. [Google Scholar] [CrossRef]
  23. Zhan, R.; Yang, Z.; Bloom, I.; Pan, L. Significance of a Solid Electrolyte Interphase on Separation of Anode and Cathode Materials from Spent Li-Ion Batteries by Froth Flotation. ACS Sustain. Chem. Eng. 2021, 9, 531–540. [Google Scholar] [CrossRef]
  24. Henry, C.L.; Karakashev, S.I.; Nguyen, P.T.; Nguyen, A.V.; Craig, V.S. Ion specific electrolyte effects on thin film drainage in nonaqueous solvents propylene carbonate and formamide. Langmuir 2009, 25, 9931–9937. [Google Scholar] [CrossRef] [PubMed]
  25. Michaux, B.; Rudolph, M.; Reuter, M.A. Challenges in predicting the role of water chemistry in flotation through simulation with an emphasis on the influence of electrolytes. Miner. Eng. 2018, 125, 252–264. [Google Scholar] [CrossRef]
  26. Wang, B.; Peng, Y. The effect of saline water on mineral flotation—A critical review. Miner. Eng. 2014, 66–68, 13–24. [Google Scholar] [CrossRef]
  27. Murphy, O.; Haji, M.N. A review of technologies for direct lithium extraction from low Li+ concentration aqueous solutions. Front. Chem. Eng. 2022, 4, 1008680. [Google Scholar] [CrossRef]
  28. Agar, G.E.; Barrett, J. The use of flotation rate data to evaluate reagents. CIM Bull. 1983, 76, 157–162. [Google Scholar]
  29. Agar, G.E.; Stratton-Crawley, R.; Bruce, T.J. Optimizing the Design of Flotation Circuits; Canadian Institute of Mining, Metallurgy and Petroleum: Westmount, QC, Canada, 1980. [Google Scholar]
  30. Schulz, N.F. Separation Efficiency; Society for Mining, Metallurgy & Exploration: Englewood, CO, USA, 1969. [Google Scholar]
  31. Xu, M. Modified flotation rate constant and selectivity index. Miner. Eng. 1998, 11, 271–278. [Google Scholar] [CrossRef]
  32. Gutierrez, L.; Betancourt, F.; Uribe, L.; Maldonado, M. Influence of Seawater on the Degree of Entrainment in the Flotation of a Synthetic Copper Ore. Minerals 2020, 10, 615. [Google Scholar] [CrossRef]
  33. Warren, L.J. Determination of the contributions of true flotation and entrainment in batch flotation tests. Int. J. Miner. Process. 1985, 14, 33–44. [Google Scholar] [CrossRef]
  34. Norori-McCormac, A.; Brito-Parada, P.R.; Hadler, K.; Cole, K.; Cilliers, J.J. The effect of particle size distribution on froth stability in flotation. Sep. Purif. Technol. 2017, 184, 240–247. [Google Scholar] [CrossRef]
  35. Trahar, W.J.; Warren, L.J. The flotability of very fine particles—A review. Int. J. Miner. Process. 1976, 3, 103–131. [Google Scholar] [CrossRef]
  36. de Jesus Silva, A.J.; Contreras, M.M.; Nascimento, C.R.; da Costa, M.F. Kinetics of thermal degradation and lifetime study of poly(vinylidene fluoride) (PVDF) subjected to bioethanol fuel accelerated aging. Heliyon 2020, 6, e04573. [Google Scholar] [CrossRef] [PubMed]
  37. Montaudo, G.; Puglisi, C.; Scamporrino, E.; Vitalini, D. Correlation of thermal degradation mechanisms: Polyacetylene and vinyl and vinylidene polymers. J. Polym. Sci. Part A Polym. Chem. 1986, 24, 301–316. [Google Scholar] [CrossRef]
  38. Konopacka, Z.; Drzymala, J. Types of particles recovery—Water recovery entrainment plots useful in flotation research. Adsorption 2010, 16, 313–320. [Google Scholar] [CrossRef]
Figure 1. Froth illustration with graphite and cathode particles entrained.
Processes 12 01363 g001
Figure 2. Sample preparation procedure for all materials tested.
Processes 12 01363 g002
Figure 3. Illustration of open-cycle flotation test procedure.
Processes 12 01363 g003
Figure 4. Thermogravimetric analysis of spent mixed battery samples.
Processes 12 01363 g004
Figure 5. Elemental fluorine analysis for spent battery materials.
Processes 12 01363 g005
Figure 6. Electron micrographs of feed samples (single battery); anode (A), cathode (B), before pyrolysis (C), after pyrolysis (D) and after second pyrolysis (E).
Processes 12 01363 g006
Figure 7. Flotation kinetics of concentrate fractions for anode and cathode for all single battery experiments.
Processes 12 01363 g007
Figure 8. Entrainment plots for all stages tested.
Processes 12 01363 g008
Figure 9. Kinetic plot for anode and cathode materials in single battery experiments.
Processes 12 01363 g009
Figure 10. Flotation kinetics of concentrate fractions for anode and cathode for all mixed battery experiments.
Processes 12 01363 g010
Figure 11. Entrainment plots for all stages tested for all mixed battery experiments.
Processes 12 01363 g011
Figure 12. Kinetic plot for anode and cathode materials in mixed battery experiments.
Processes 12 01363 g012
Figure 13. Separation efficiency for each material tested by stage.
Processes 12 01363 g013
Figure 14. Selectivity index for each material tested by stage.
Processes 12 01363 g014
Figure 15. Entrainment factors for each material tested by stage.
Processes 12 01363 g015
Figure 16. Optimal flotation time for each material tested using Equation (3).
Processes 12 01363 g016
Table 1. Experimental conditions used in batch flotation trials.
Processing ConditionUnitsRougherScavengerCleaner
Cell VolumeL0.50
Stirring Speedrpm900
Sample Massg766868
Solid Content, Cw%131212
pH[−]111111
Collector Dosage * [19]g/t500250167
Flotation Time * [20,21]min855
Frother Concentrationmg/L30
Superficial Gas Ratecm/s1.05
* The flotation time and collector dosage calculation are detailed in the Supplementary Information section (Section S2 and See Tables S1 and S2).
Table 2. Chemical–physical properties of single battery samples.
VariableUnitsFeed Sample to Flotation Stage
RougherScavengerCleaner
Anode Content *%46.21 ± 1.682.40 ± 0.1484.81 ± 0.27
Cathode Content *%49.79 ± 1.6592.43 ± 0.3710.56 ± 0.24
Impurities%4.00 ± 2.005.16 ± 0.254.64 ± 0.52
Particle Size D50µm21.49 ± 1.2015.17 ± 1.1019.48 ± 1.21
Anode Content * = Total carbon analysis in samples. Cathode Content * = Total lithium metal oxide content.
Table 3. Chemical–physical properties of mixed battery samples.
VariableUnitsFeed Sample to Flotation Stage
RougherScavengerCleaner
Anode Content *%36.61 ± 3.355.62 ± 0.1569.15 ± 0.92
Cathode Content *%45.91 ± 2.4578.98 ± 1.3015.62 ± 0.53
Impurities%17.47 ± 2.6015.40 ± 1.5515.23 ± 1.80
Particle Size D50µm16.51 ± 1.1514.95 ± 1.4518.09 ± 1.27
Anode Content * = Total carbon analysis in samples. Cathode Content * = Total lithium metal oxide content.
Disclaimer/Publisher’s Note: The statements, opinions and data contained in all publications are solely those of the individual author(s) and contributor(s) and not of MDPI and/or the editor(s). MDPI and/or the editor(s) disclaim responsibility for any injury to people or property resulting from any ideas, methods, instructions or products referred to in the content.

