Figure 1.
Temperature vs. depth plot illustrating possible geothermal gradients and their association with geothermal energy systems.
Figure 1.
Temperature vs. depth plot illustrating possible geothermal gradients and their association with geothermal energy systems.
Figure 2.
Map of the greater Wattenberg area, located within the Denver-Julesburg Basin of Colorado. West-east cross-section A-A′ showing the structural setting of the Denver Basin, Colorado, adapted from [
9].
Figure 2.
Map of the greater Wattenberg area, located within the Denver-Julesburg Basin of Colorado. West-east cross-section A-A′ showing the structural setting of the Denver Basin, Colorado, adapted from [
9].
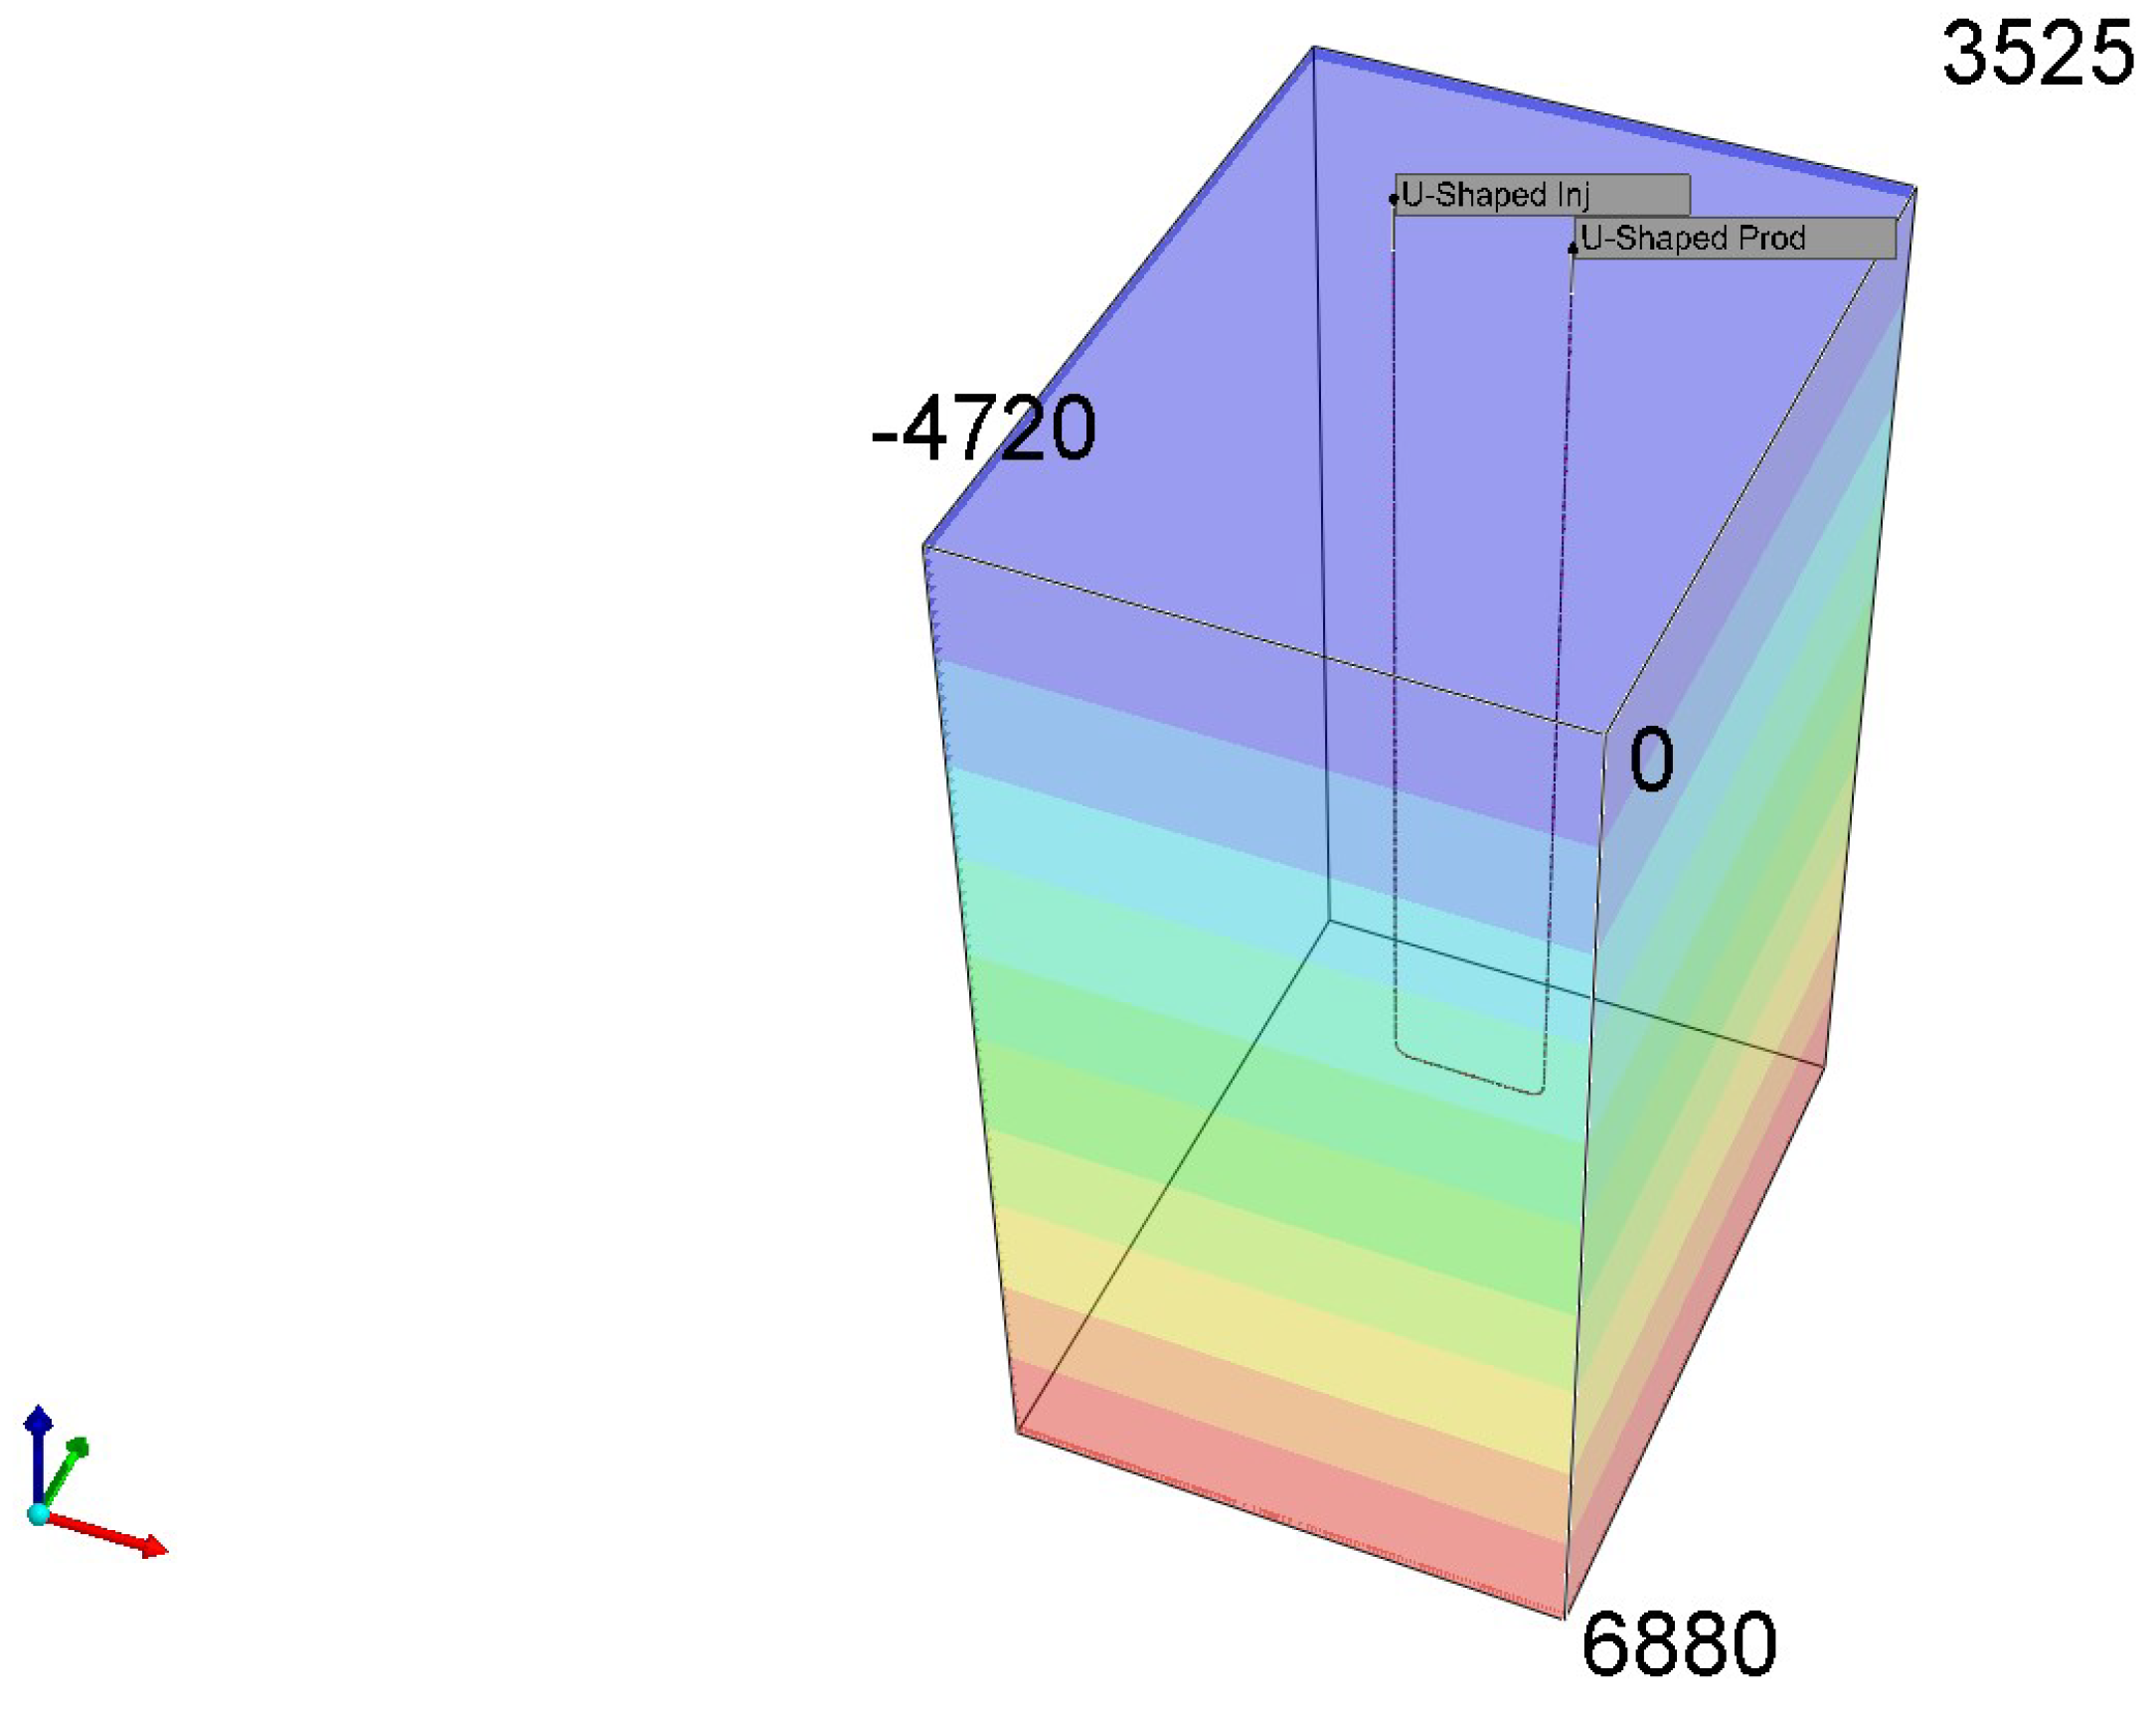
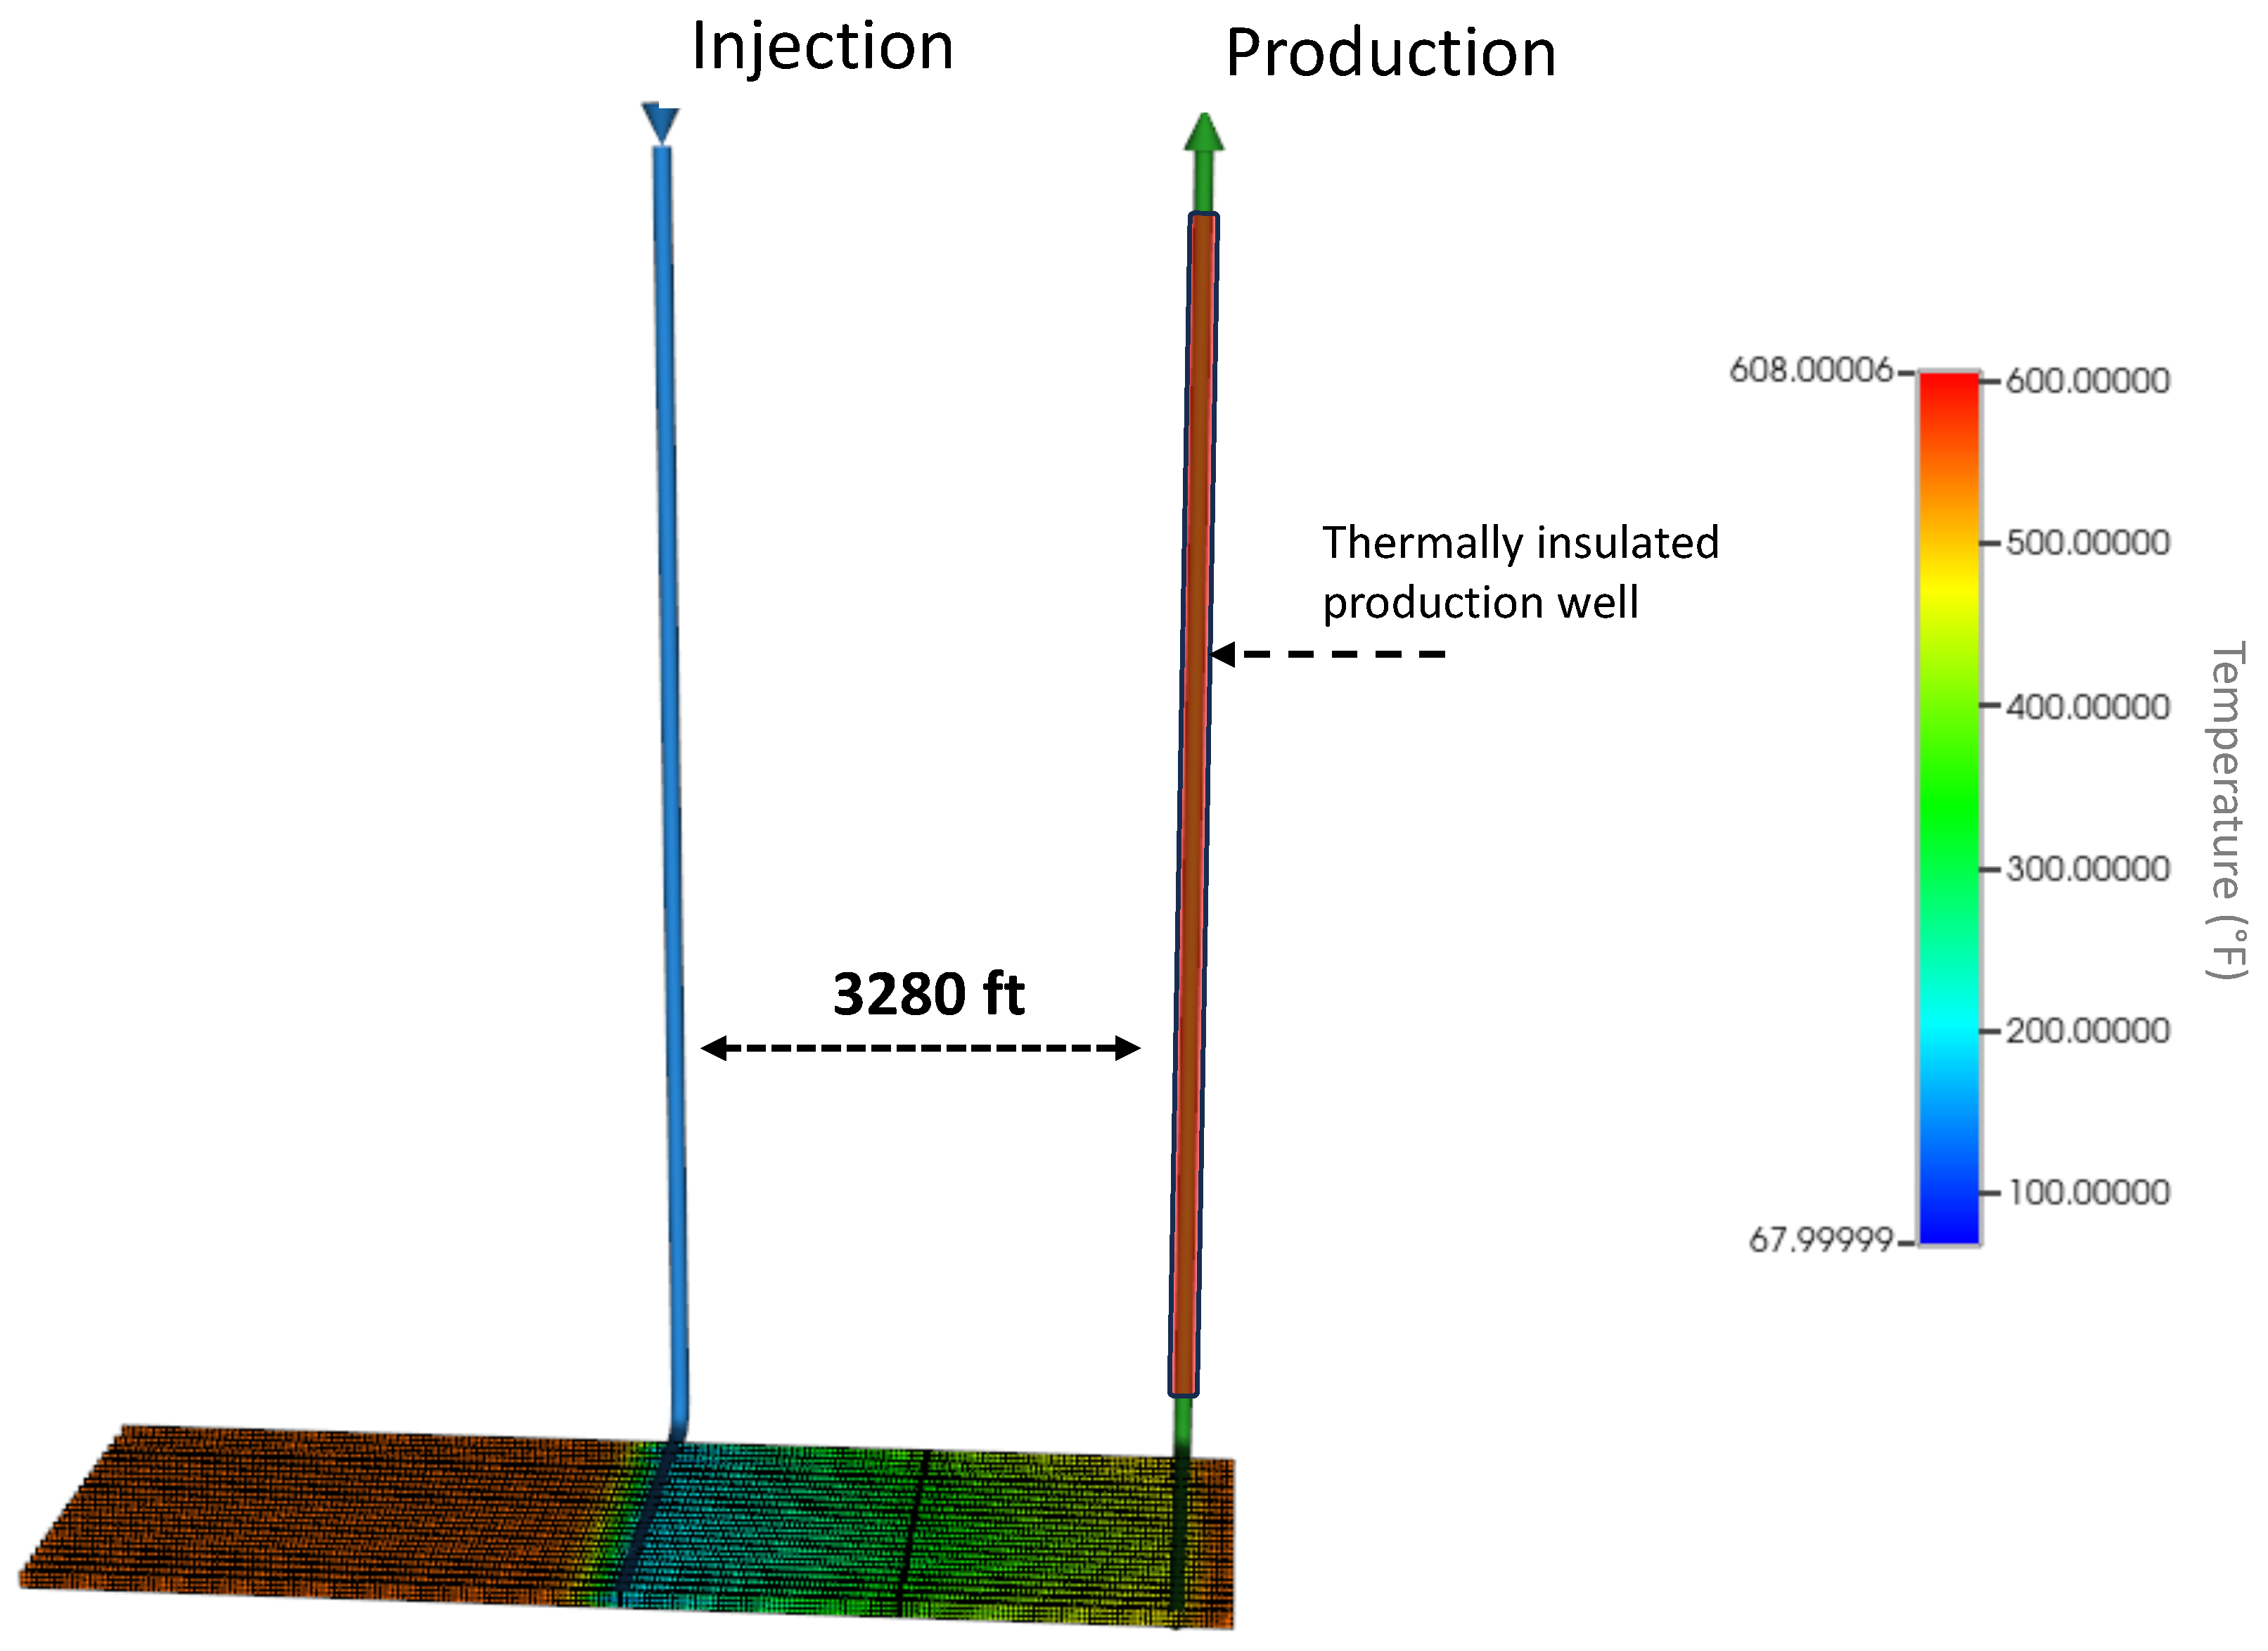
Figure 3.
Geothermal reservoir 3-dimensional model, indicating global coordinates and injection and production wells location within the model.
Figure 3.
Geothermal reservoir 3-dimensional model, indicating global coordinates and injection and production wells location within the model.
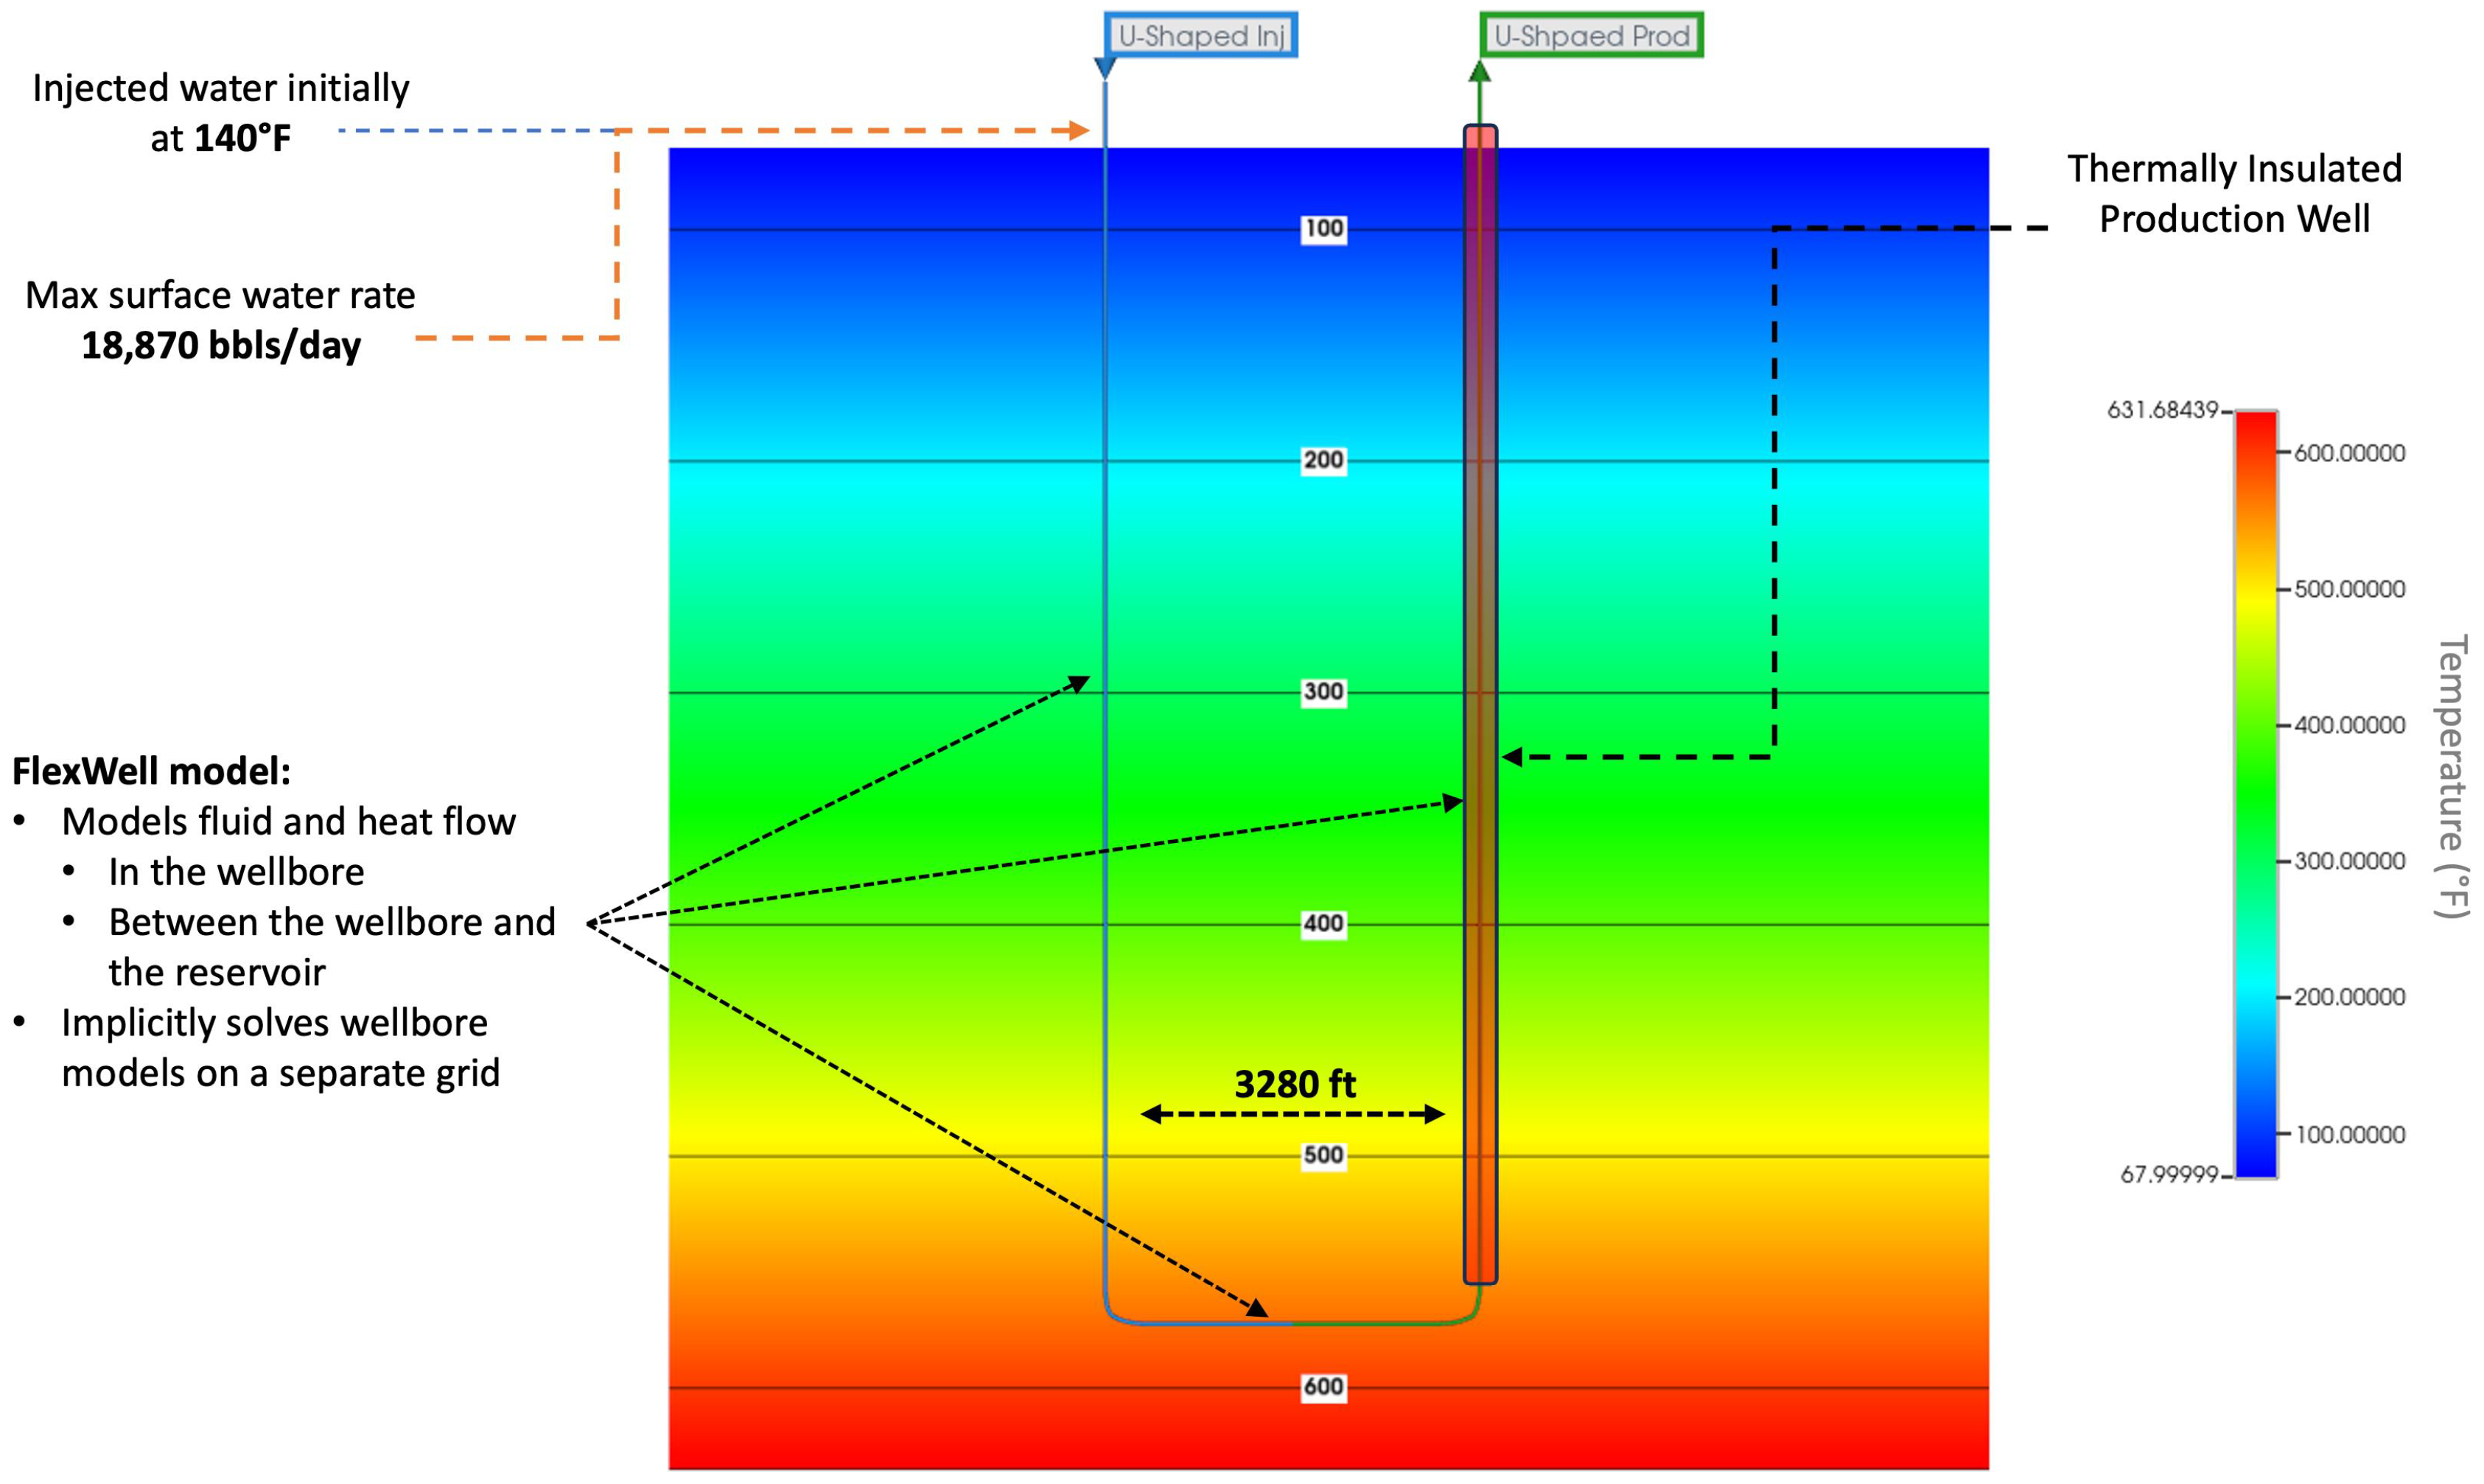
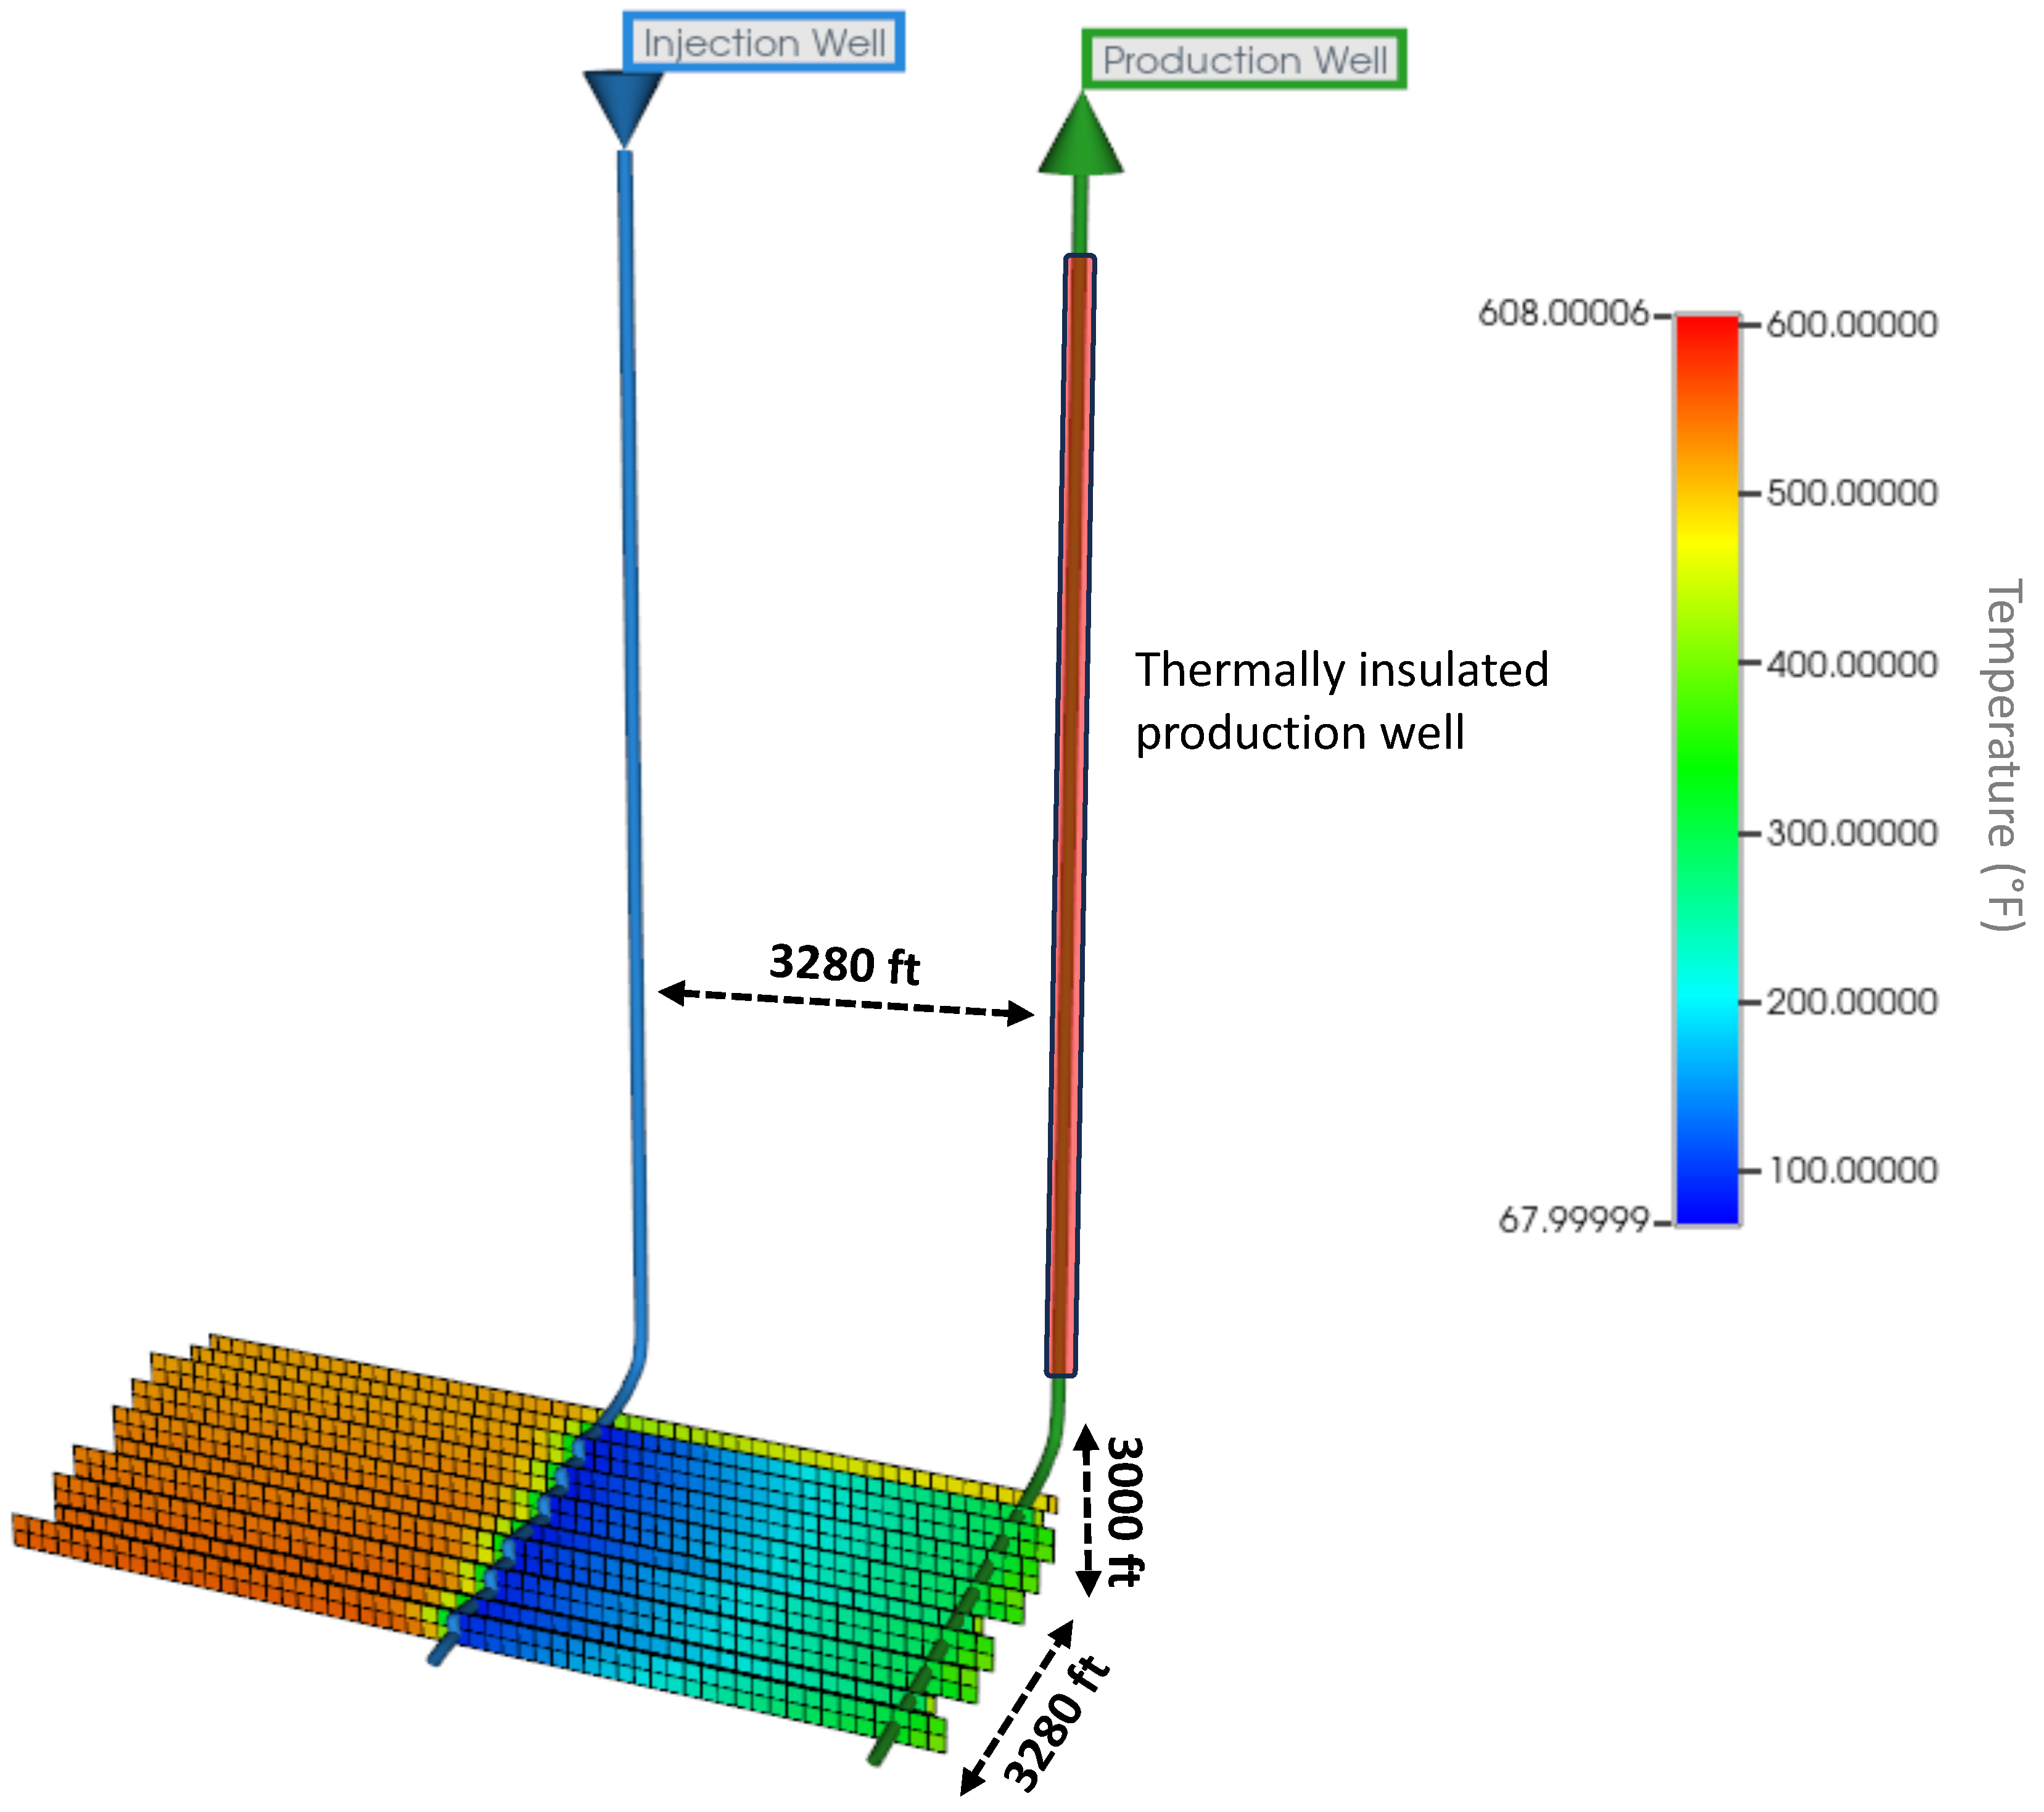
Figure 4.
U-shaped closed-loop well model depiction.
Figure 4.
U-shaped closed-loop well model depiction.
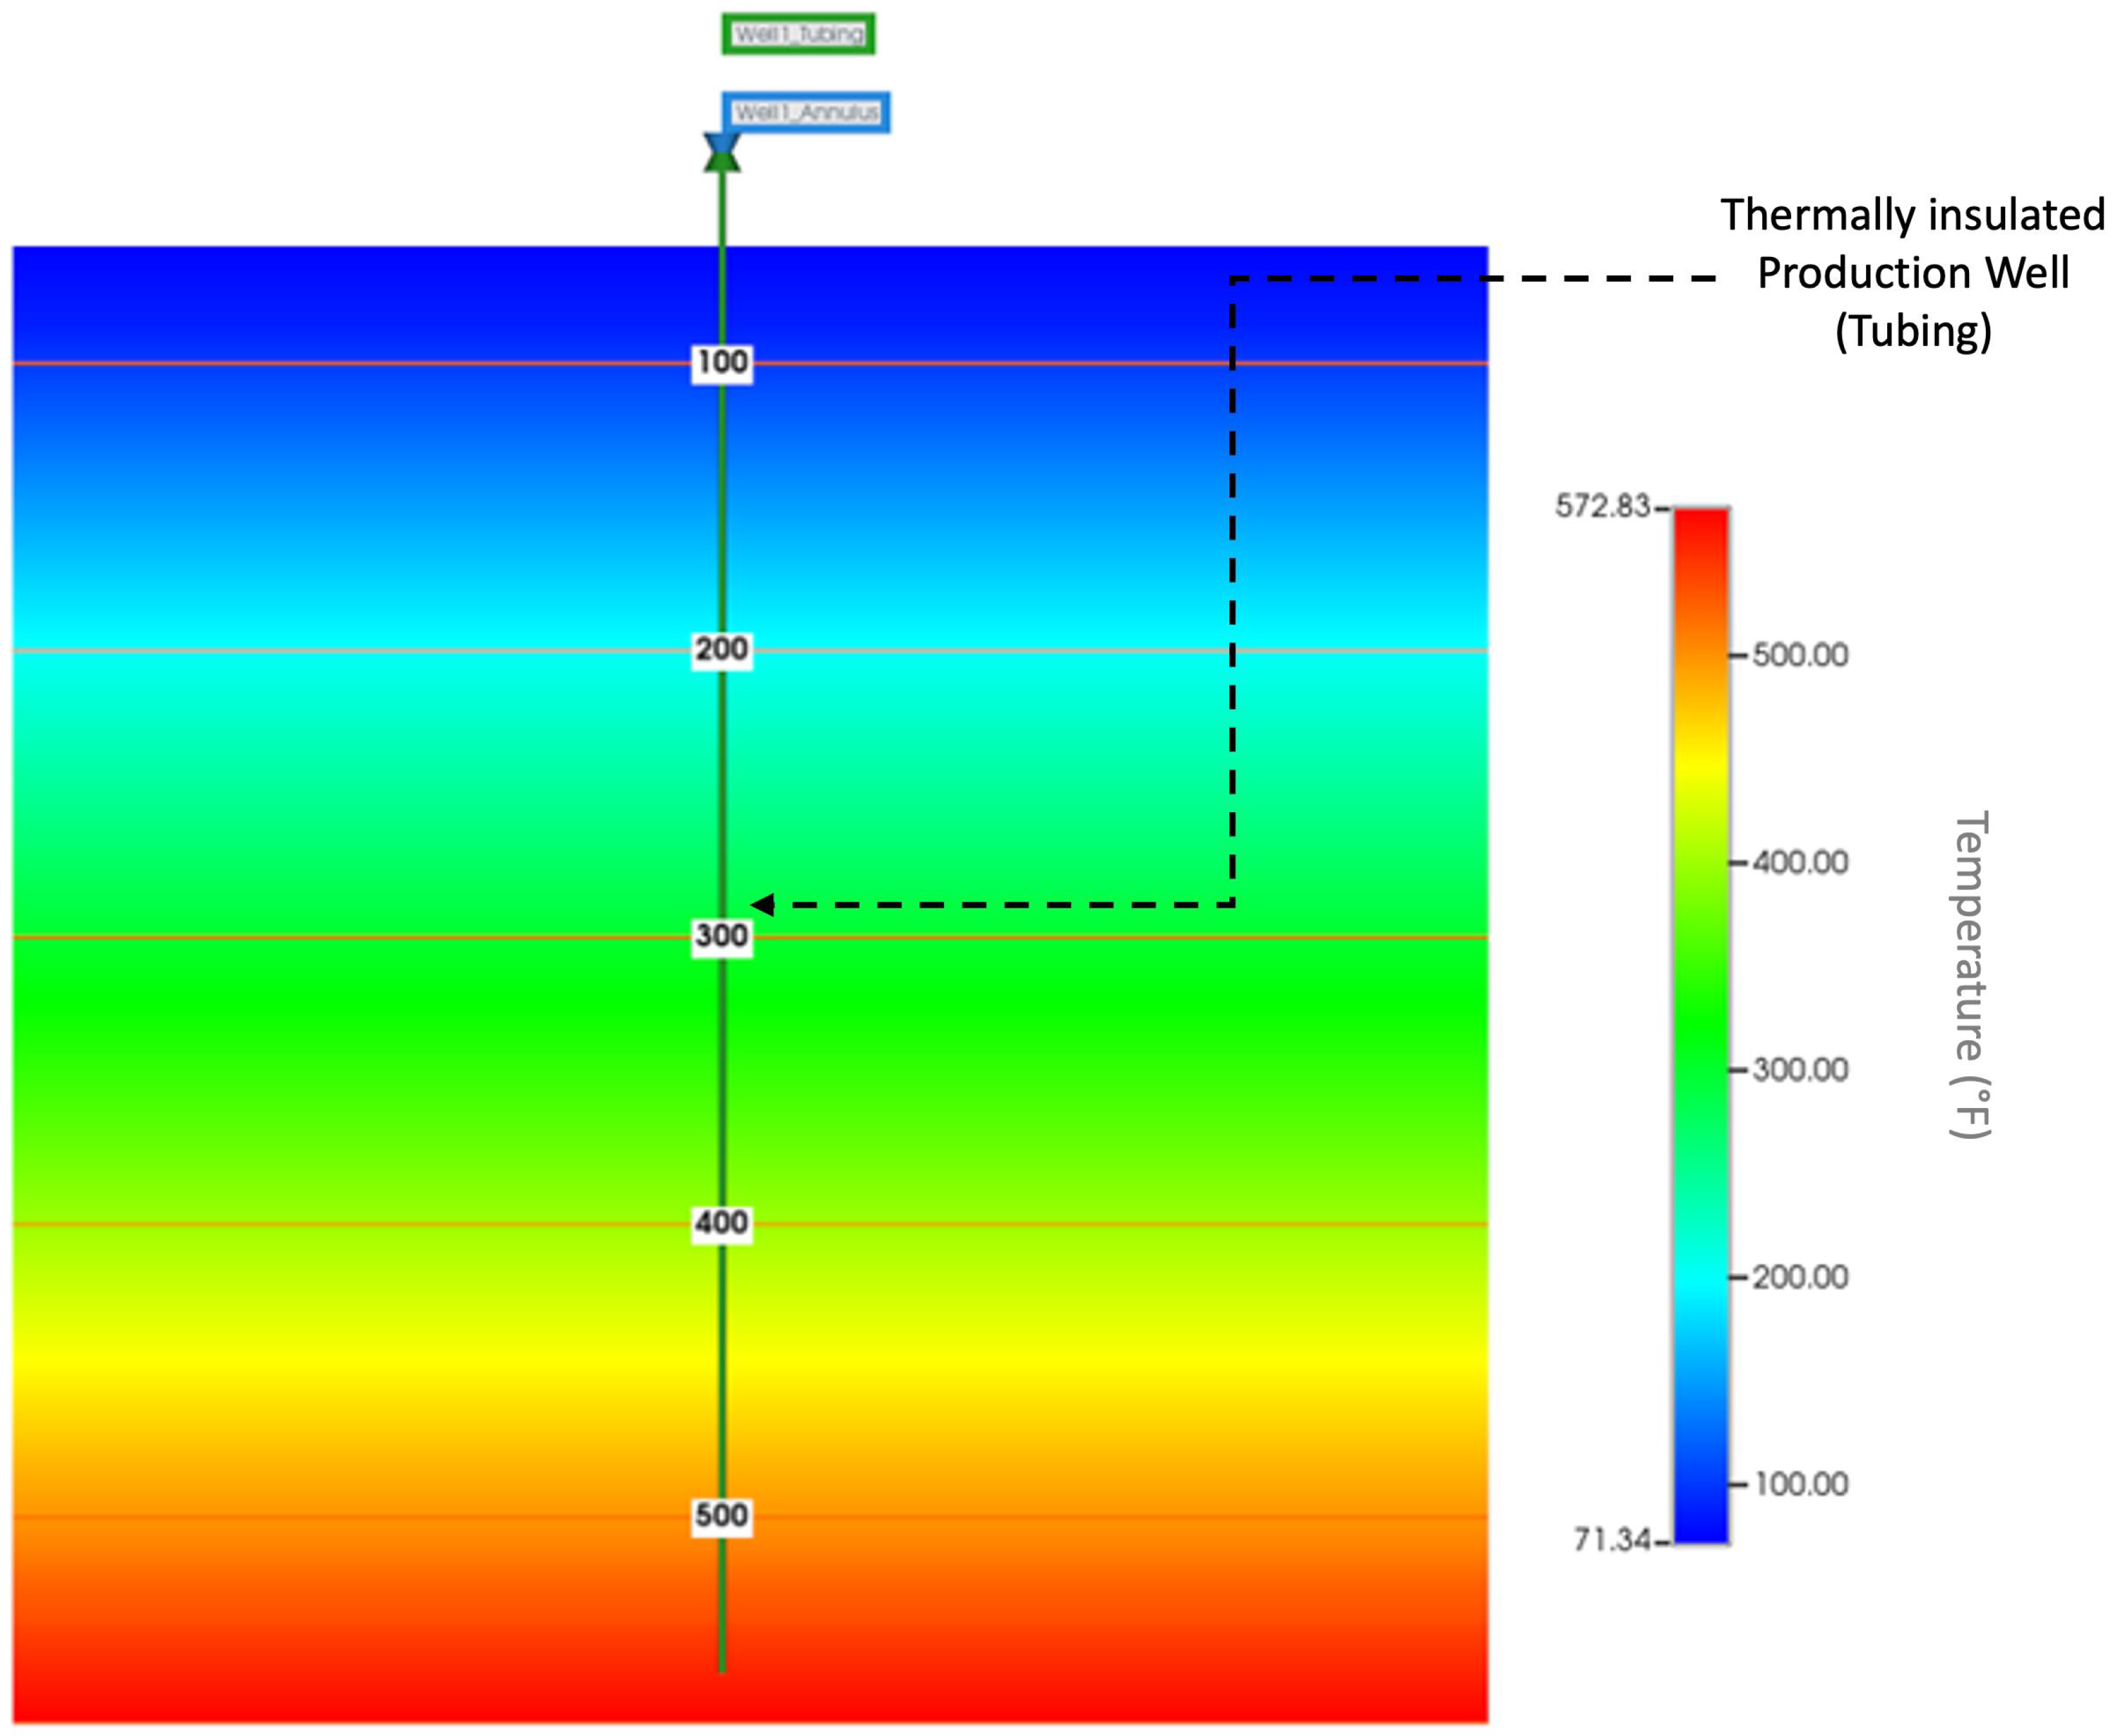
Figure 5.
Pipe-in-pipe closed-loop well model description.
Figure 5.
Pipe-in-pipe closed-loop well model description.
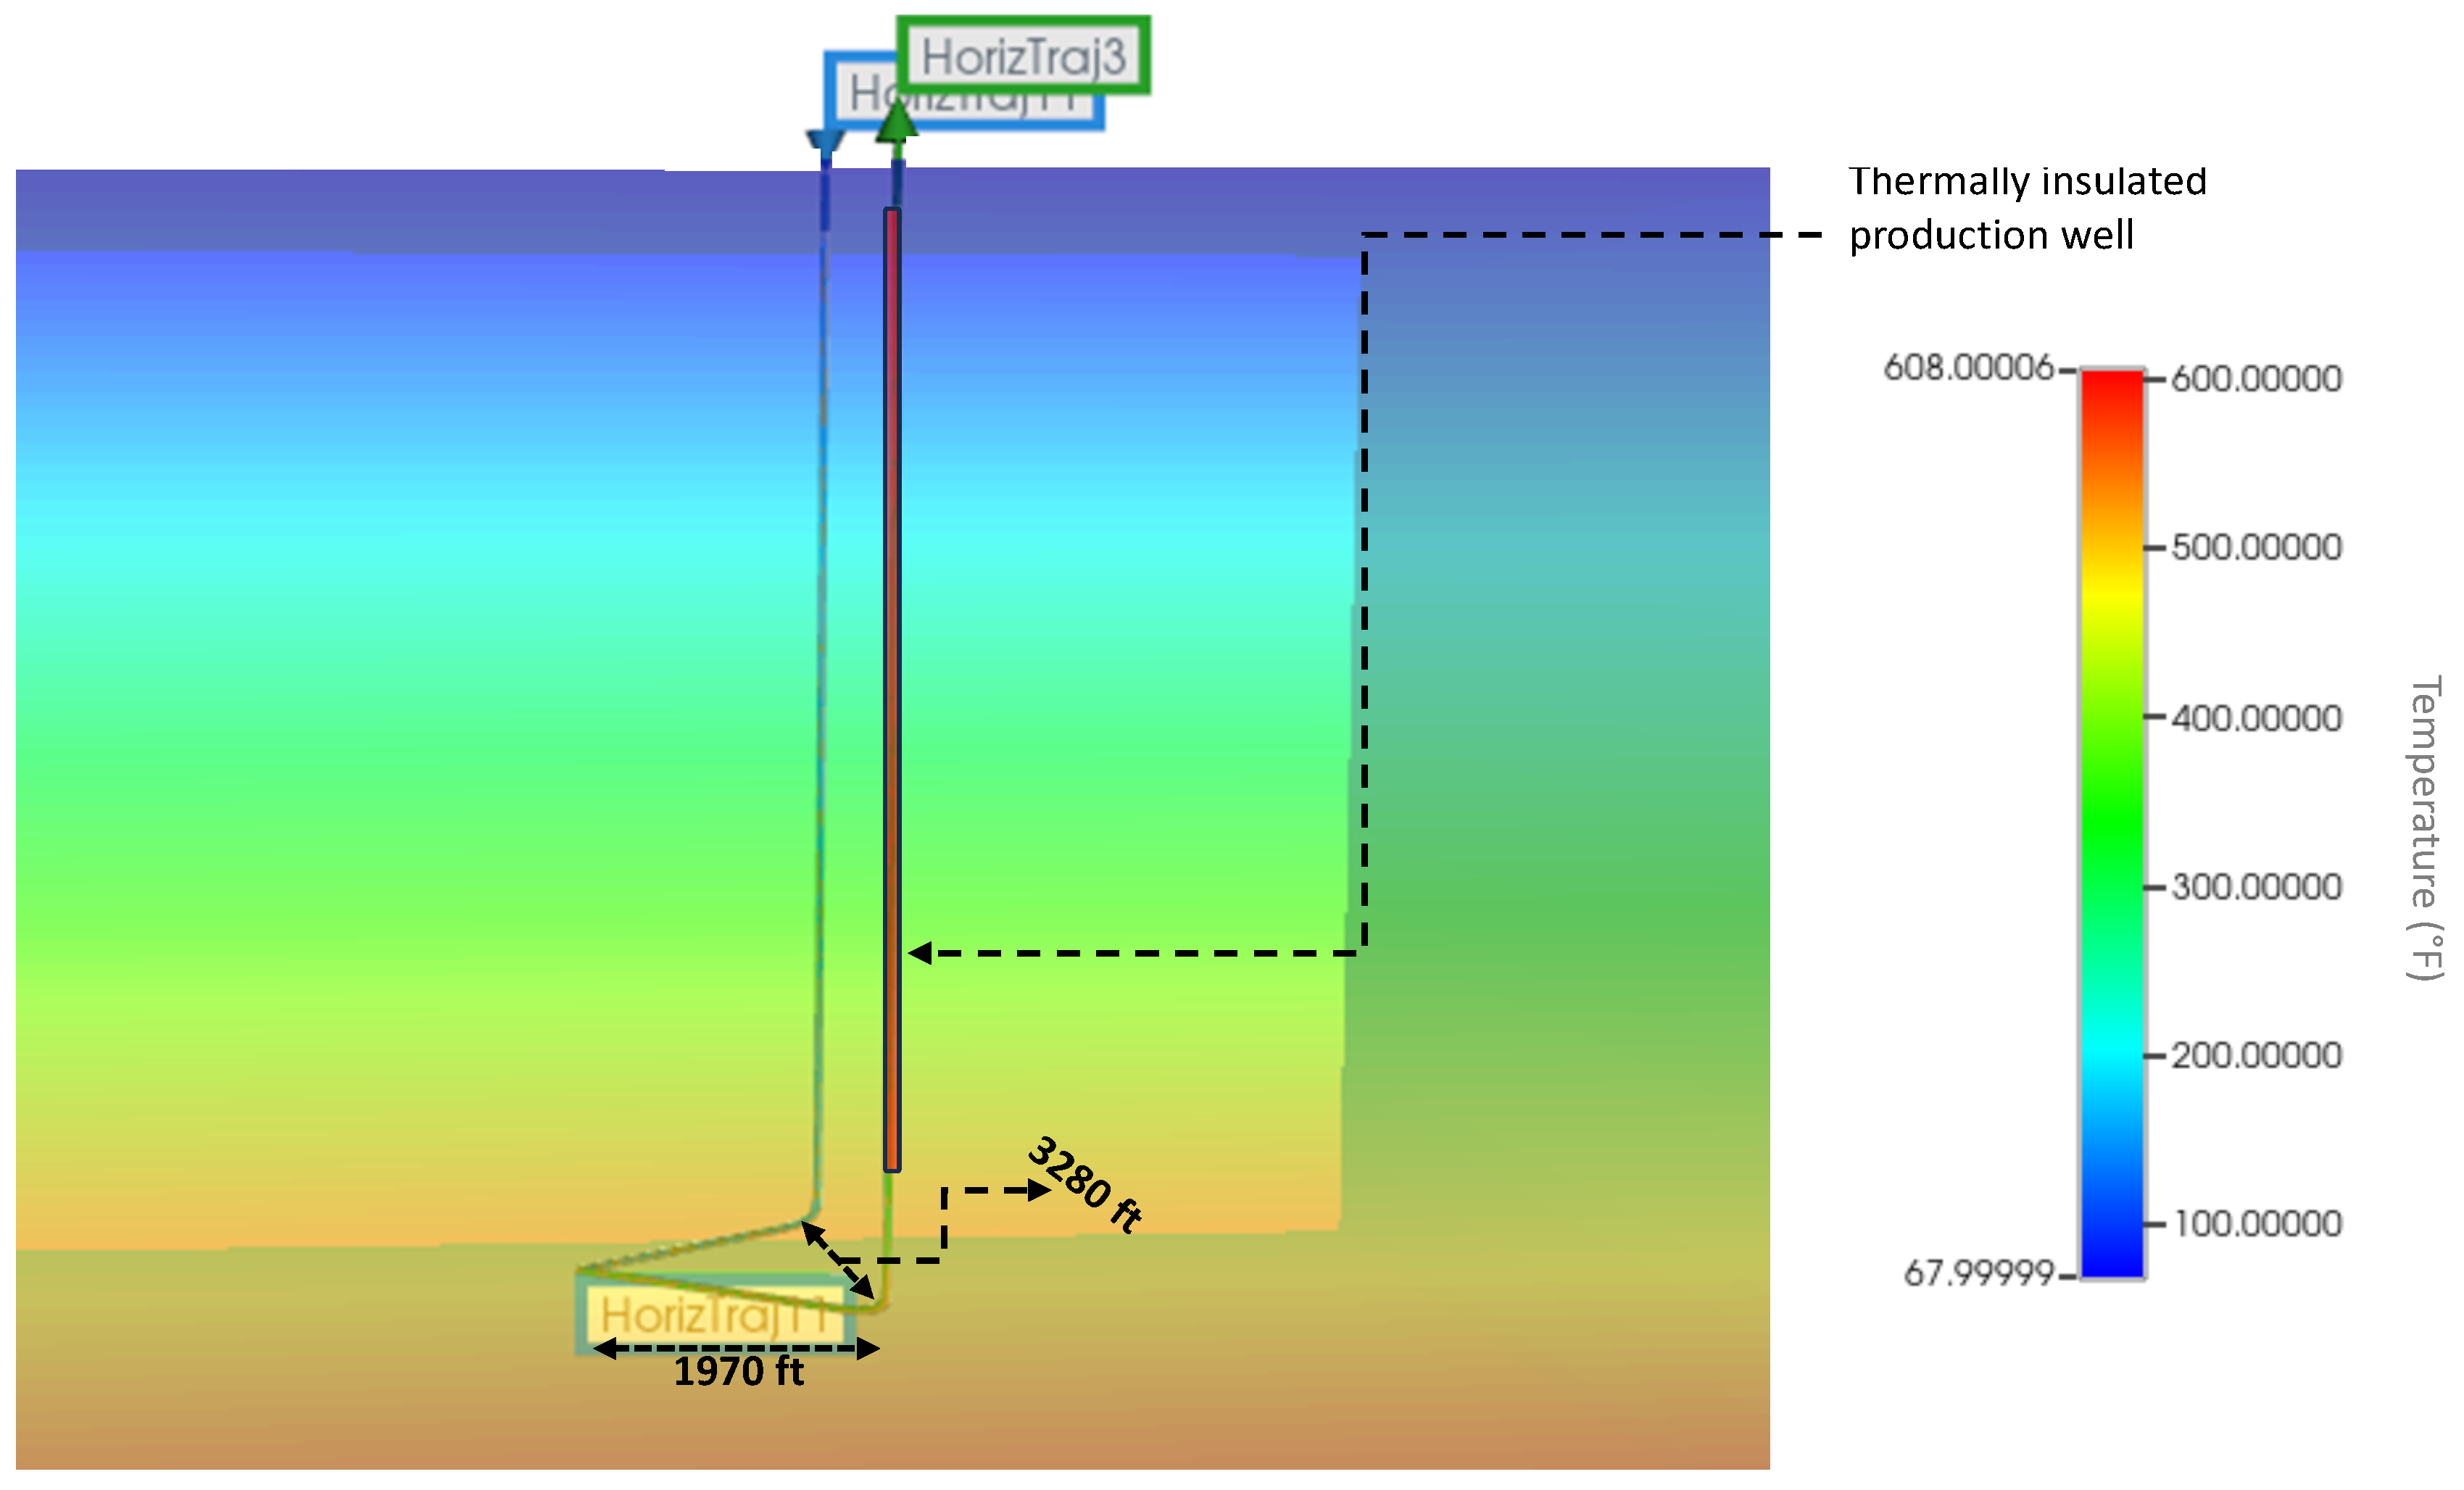
Figure 6.
V-shaped closed-loop well model description.
Figure 6.
V-shaped closed-loop well model description.
Figure 7.
Inclined V-shaped closed-loop well model’s geometric configuration.
Figure 7.
Inclined V-shaped closed-loop well model’s geometric configuration.
Figure 8.
EGS well model depiction.
Figure 8.
EGS well model depiction.
Figure 9.
Inclined EGS well model depiction.
Figure 9.
Inclined EGS well model depiction.
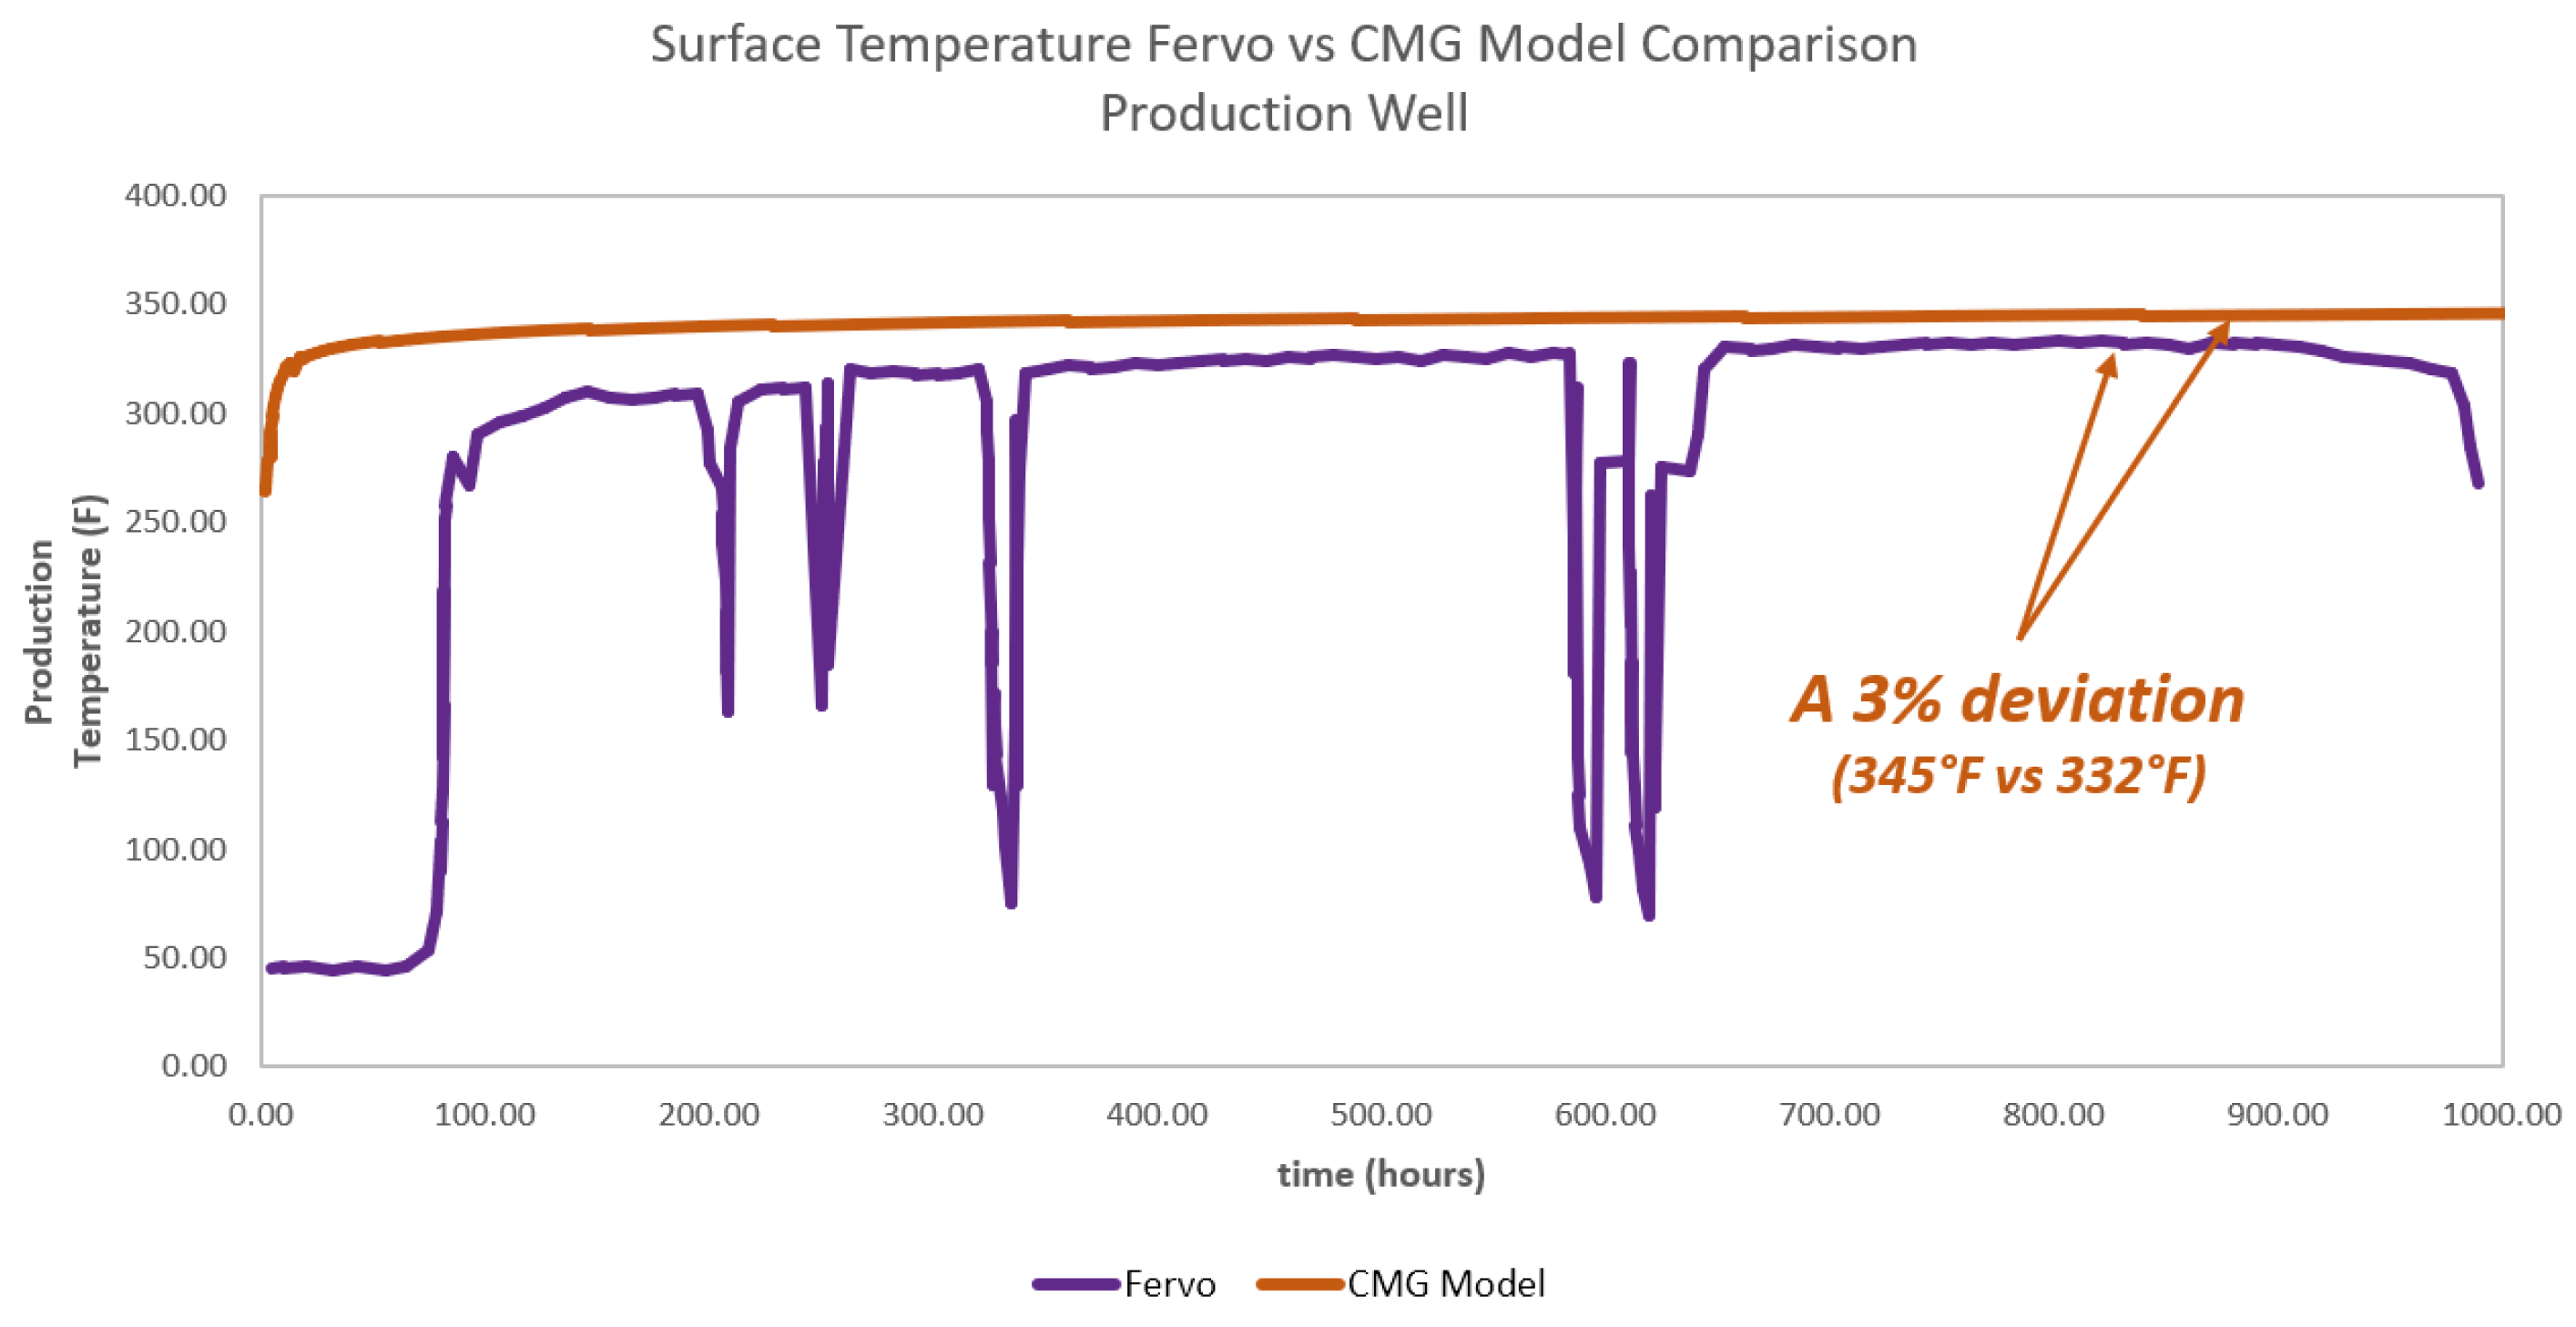
Figure 10.
Fervo field demonstration data vs. reservoir simulation results in terms of produced surface temperature.
Figure 10.
Fervo field demonstration data vs. reservoir simulation results in terms of produced surface temperature.
Figure 11.
Fervo field demonstration data vs. reservoir simulation results in terms of surface temperature, pressure, and flow rate of injection and production wells.
Figure 11.
Fervo field demonstration data vs. reservoir simulation results in terms of surface temperature, pressure, and flow rate of injection and production wells.
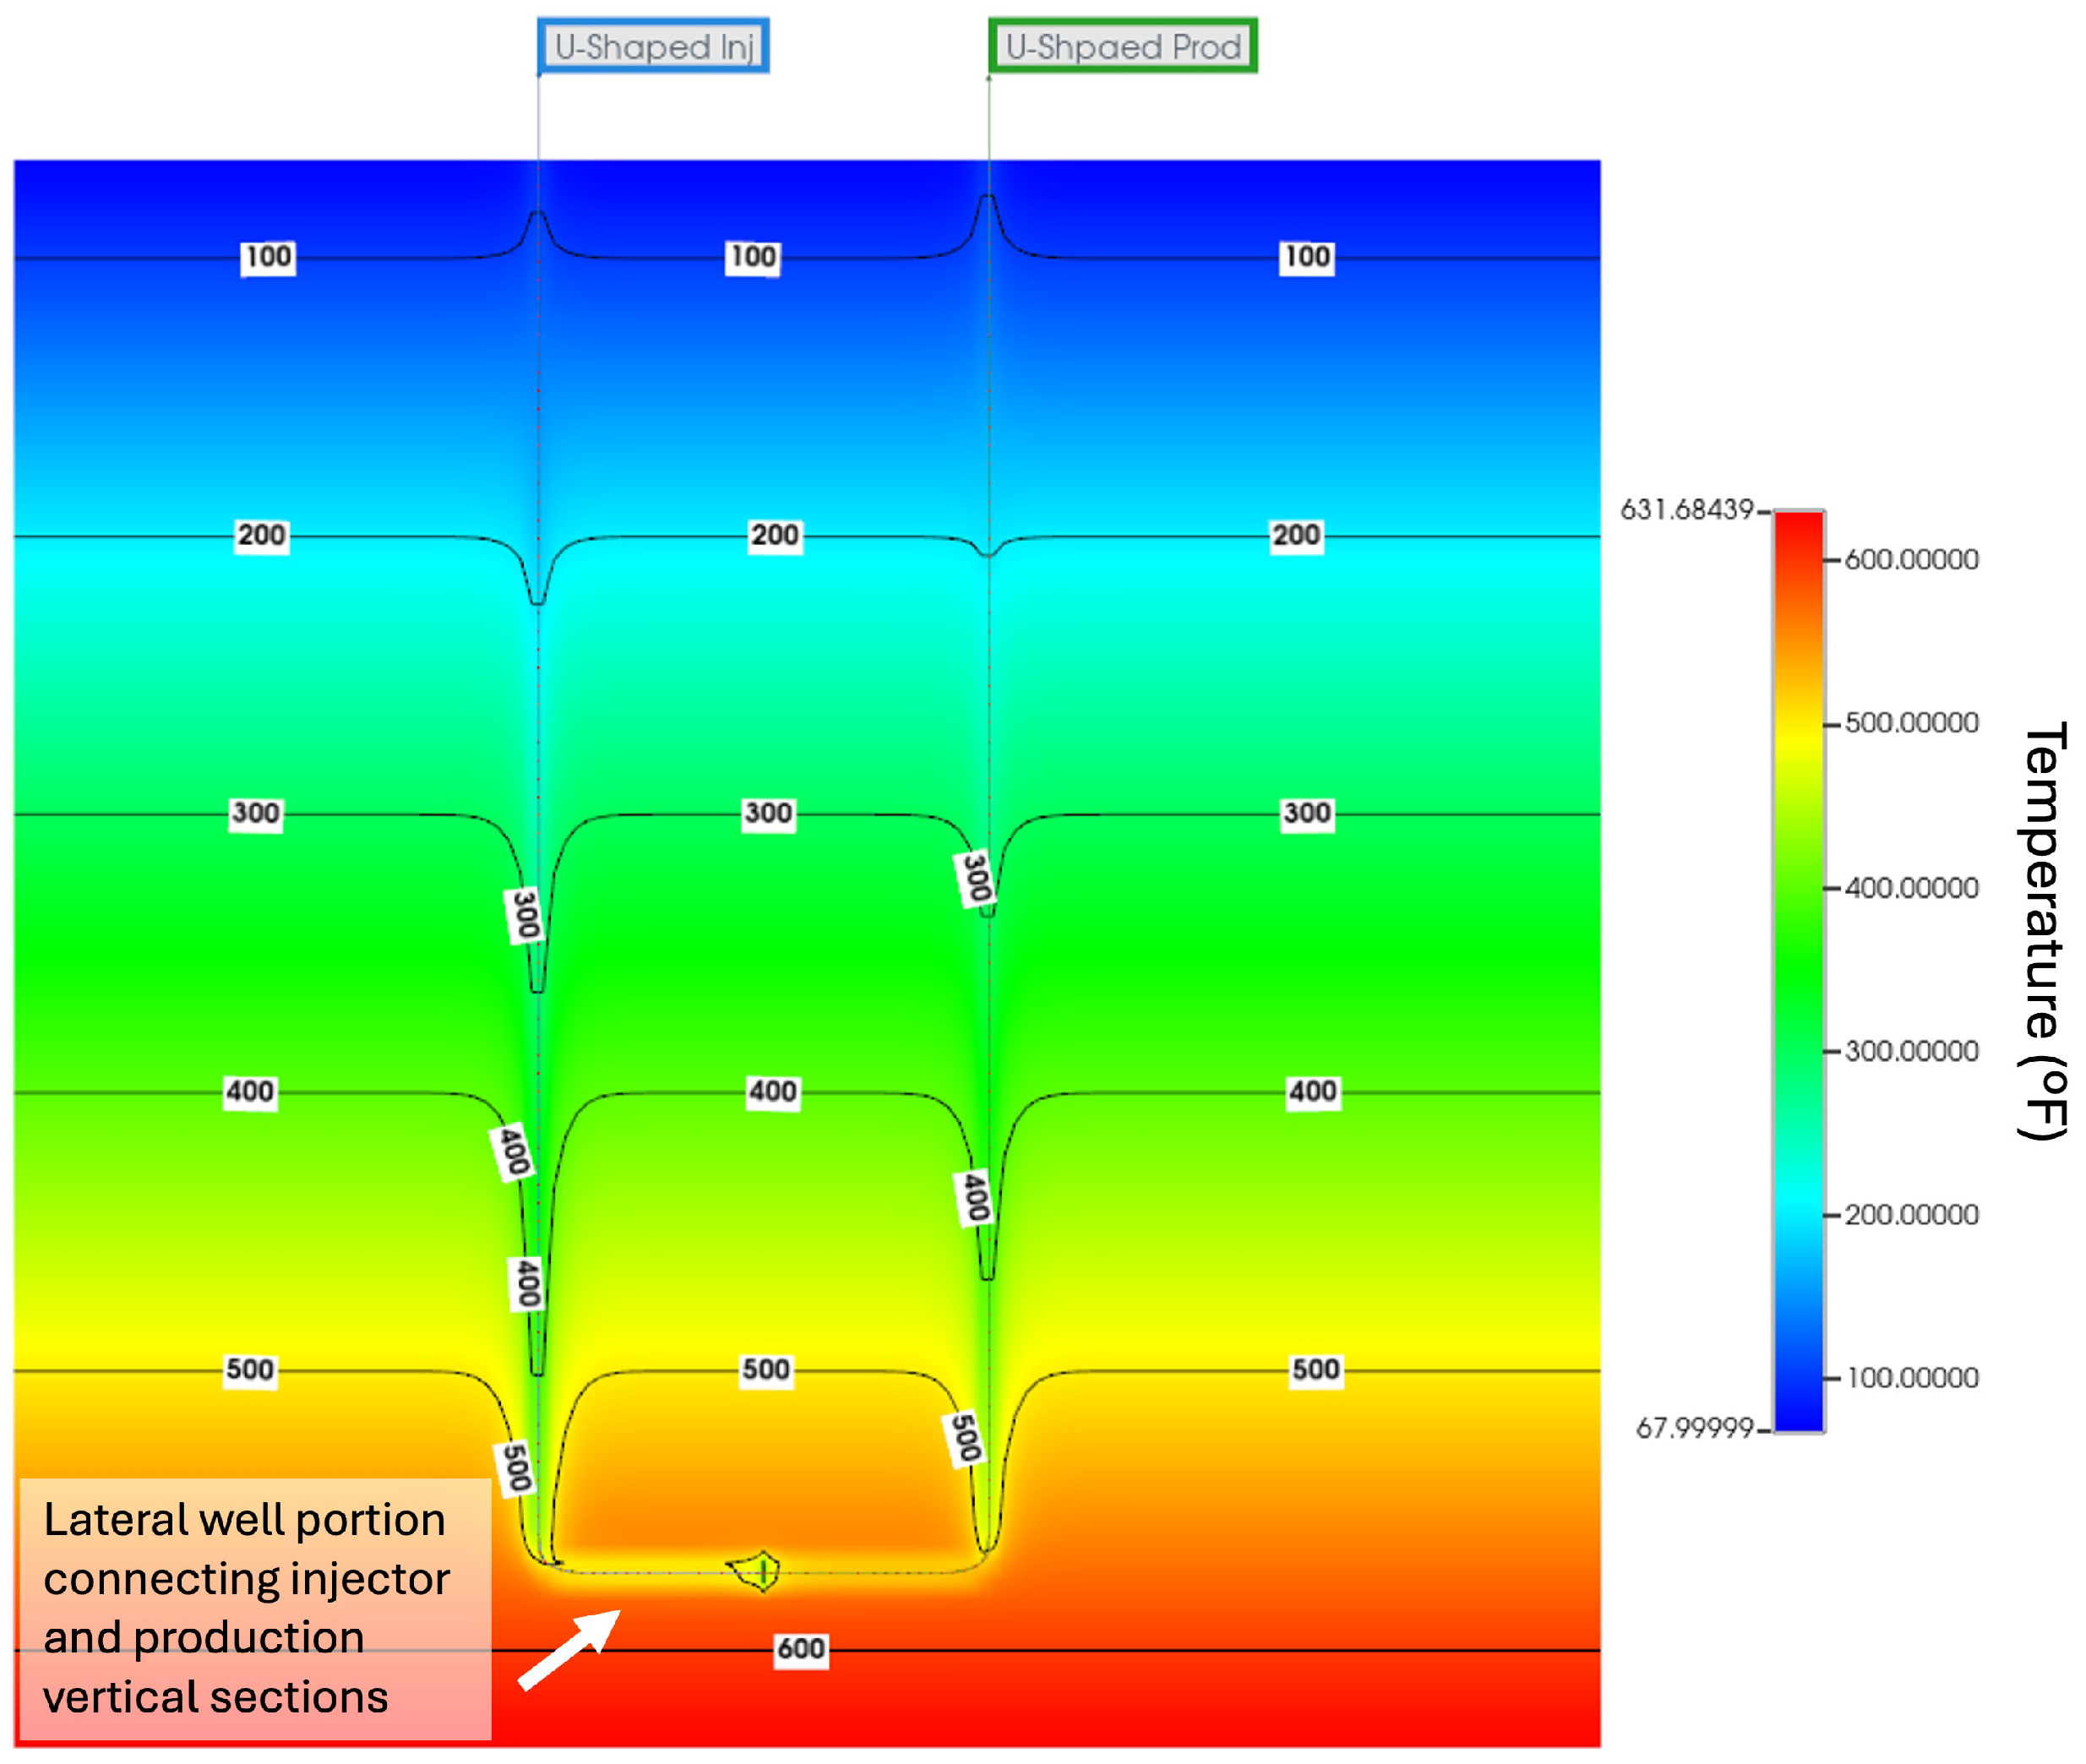
Figure 12.
U-shaped closed-loop wells’ reservoir temperature distribution after 20 years.
Figure 12.
U-shaped closed-loop wells’ reservoir temperature distribution after 20 years.
Figure 13.
Estimated temperature profiles as a function of the measured depth for the injection and production wells, including the lateral well portion, in the U-shaped CLGS.
Figure 13.
Estimated temperature profiles as a function of the measured depth for the injection and production wells, including the lateral well portion, in the U-shaped CLGS.
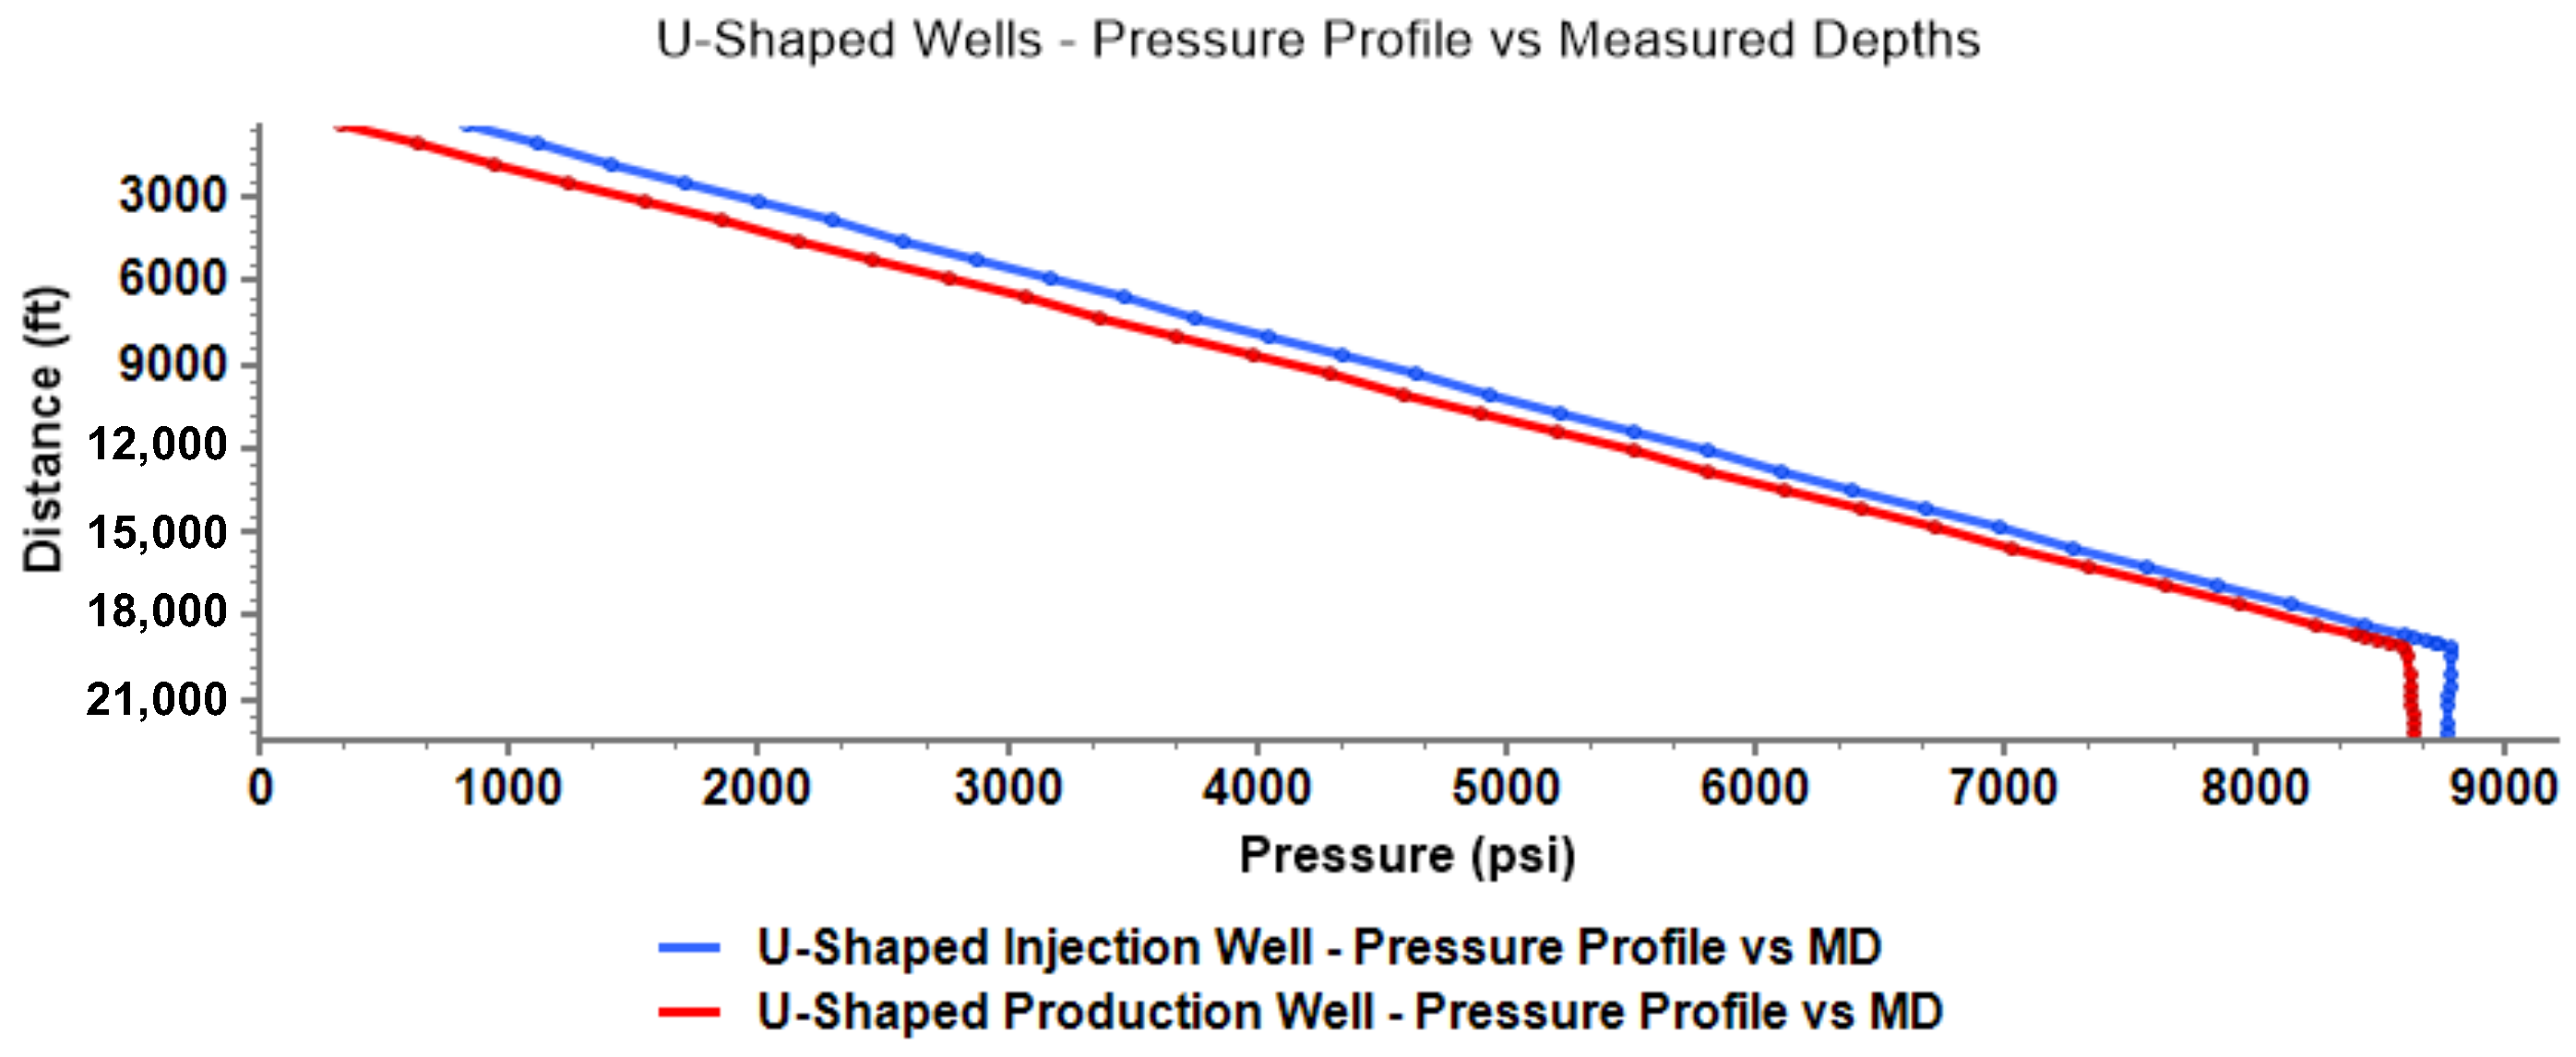
Figure 14.
Estimated pressure profiles as a function of the measured depth for the injection and production wells, including the lateral well portion, in the U-shaped CLGS.
Figure 14.
Estimated pressure profiles as a function of the measured depth for the injection and production wells, including the lateral well portion, in the U-shaped CLGS.
Figure 15.
Produced surface temperature (°F) vs. time (years) for all U-shaped models.
Figure 15.
Produced surface temperature (°F) vs. time (years) for all U-shaped models.
Figure 16.
Reservoir temperature distribution after 20 years of operation for the PIP closed-loop well configuration.
Figure 16.
Reservoir temperature distribution after 20 years of operation for the PIP closed-loop well configuration.
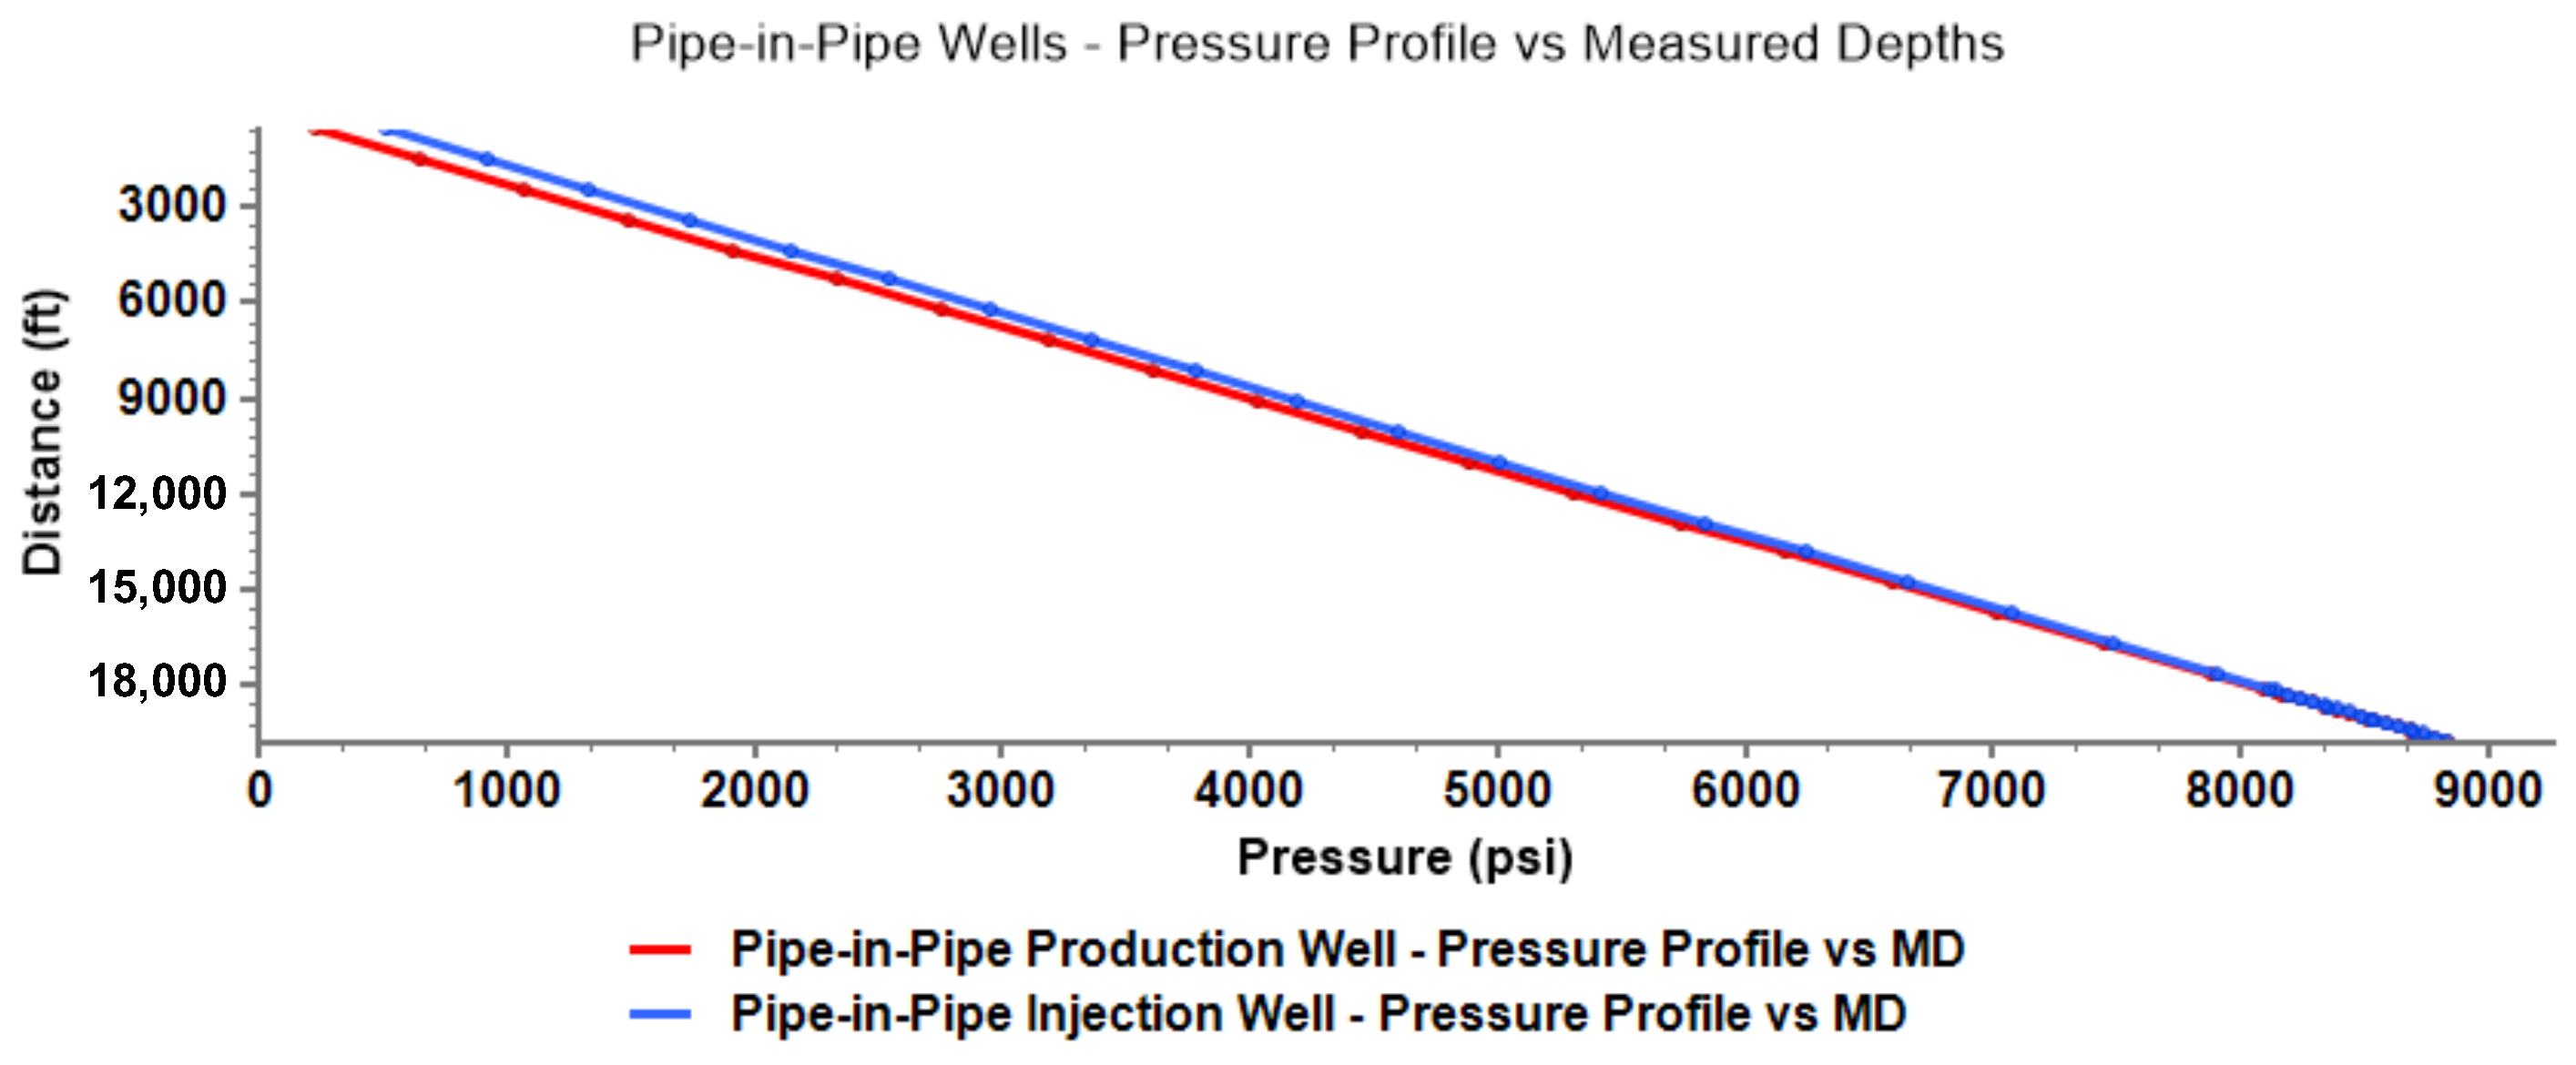
Figure 17.
Estimated temperature profiles as a function of the measured depth for the PIP well configuration.
Figure 17.
Estimated temperature profiles as a function of the measured depth for the PIP well configuration.
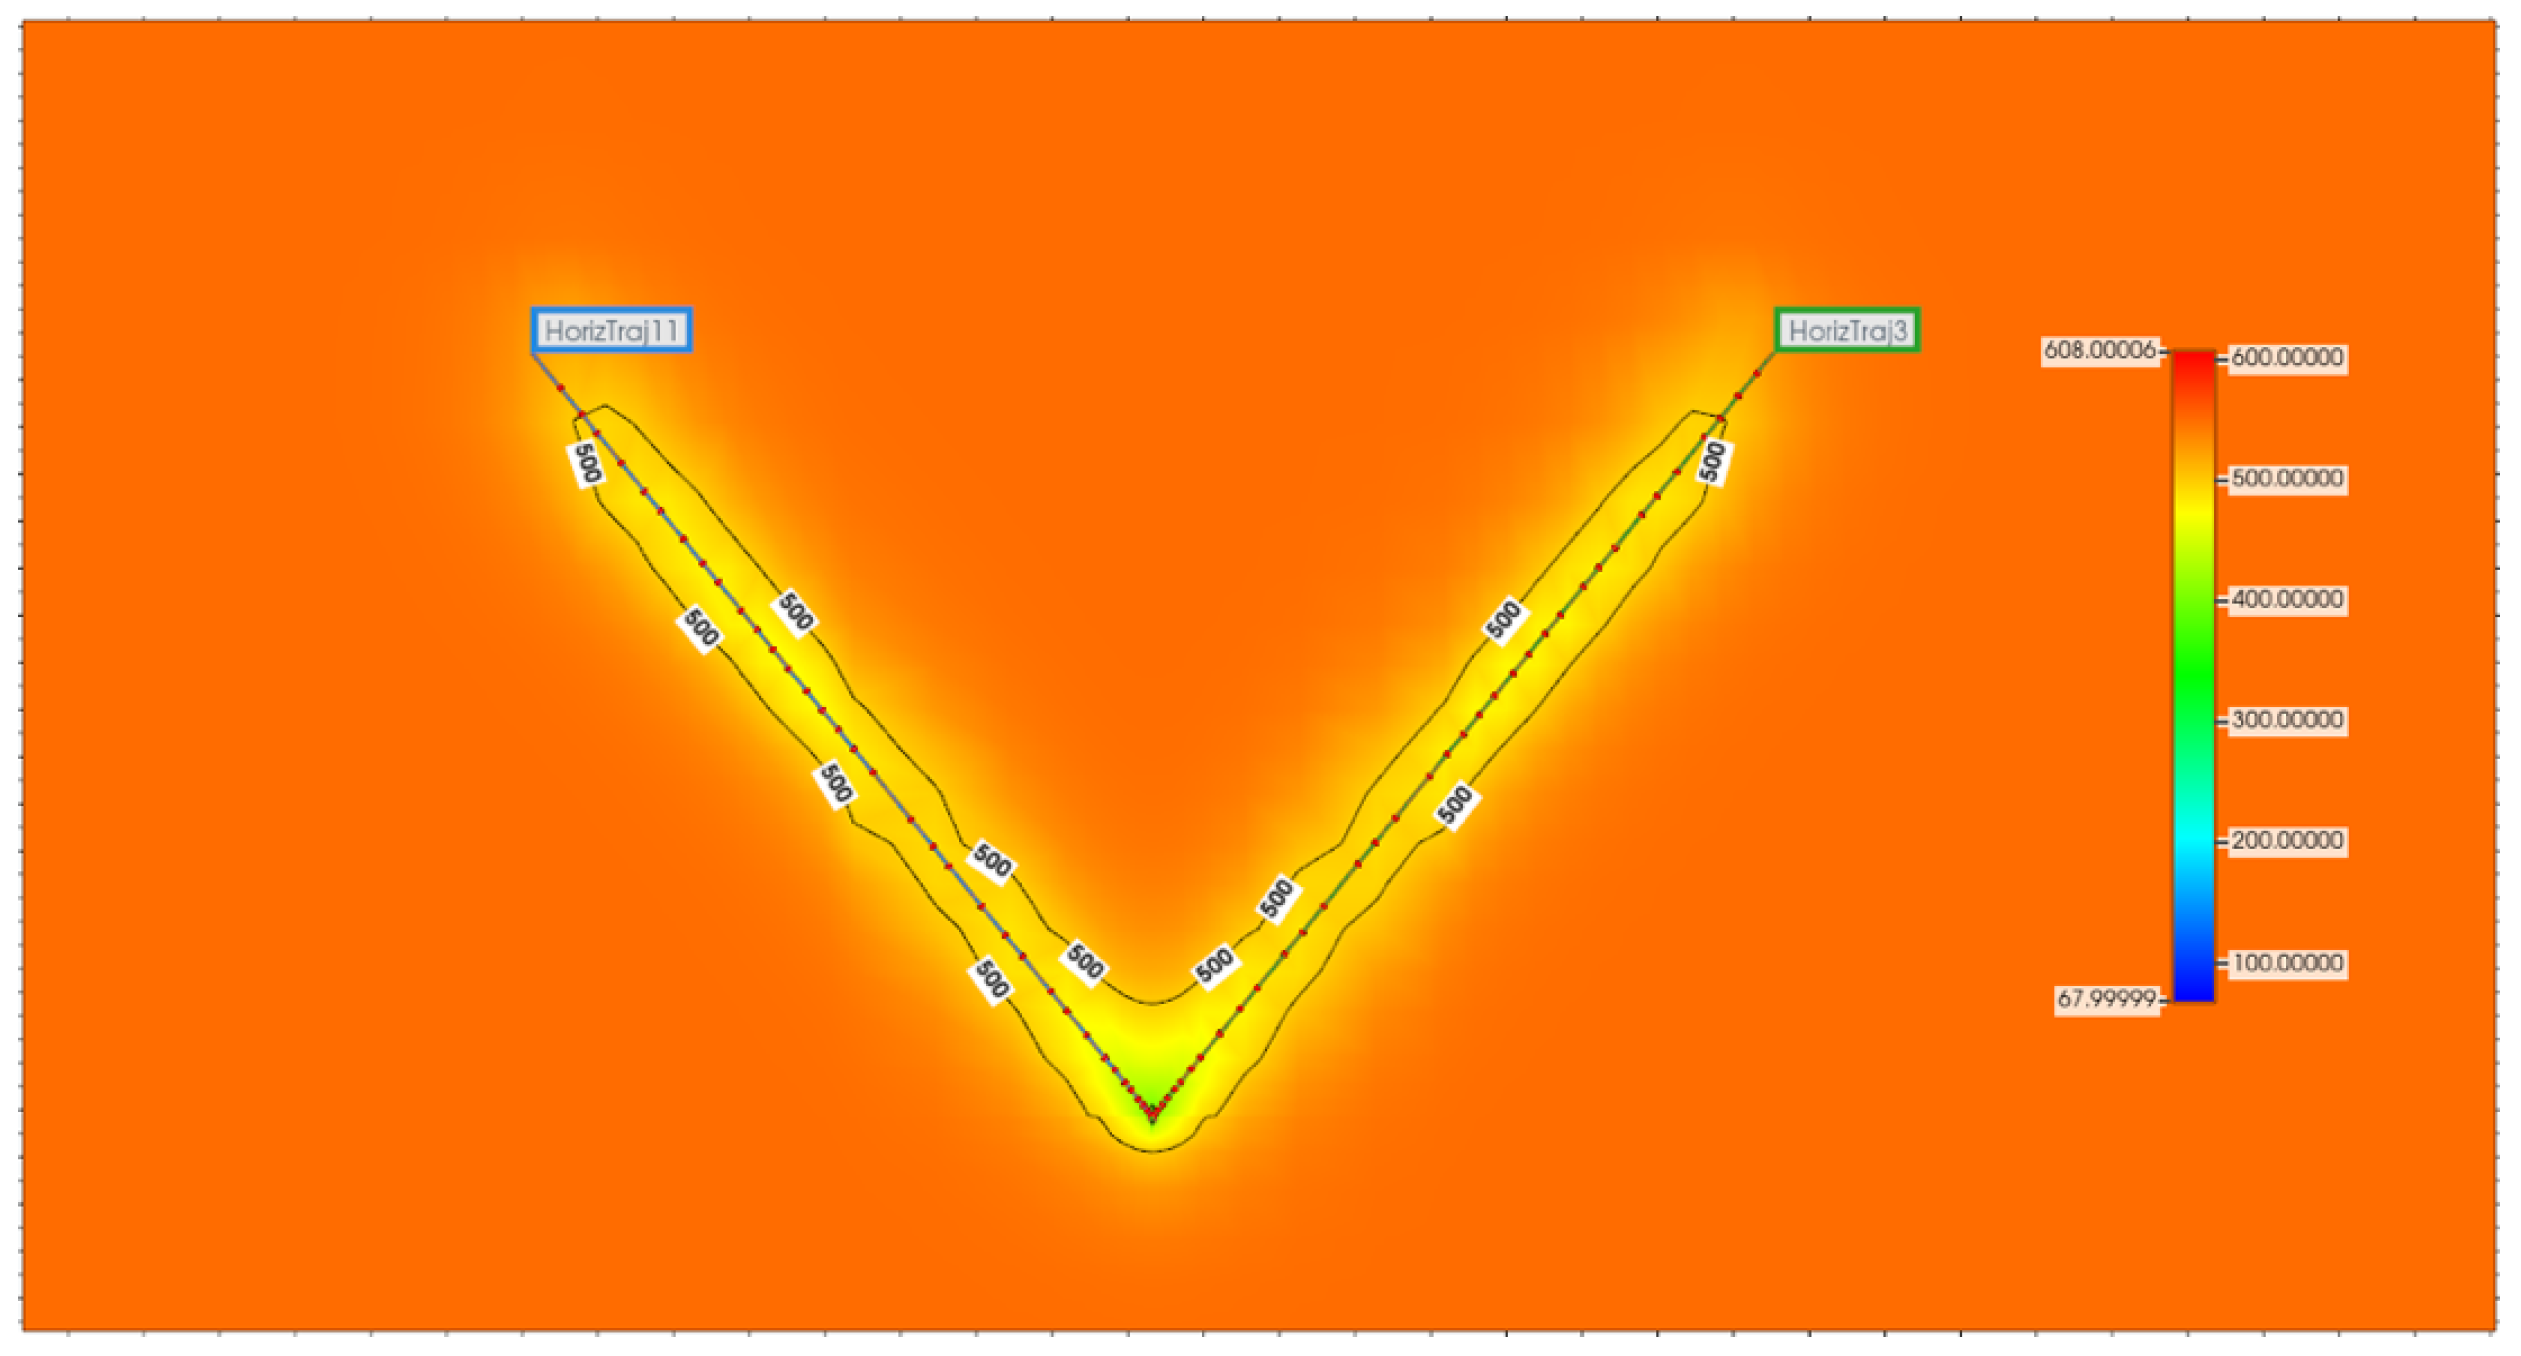
Figure 18.
Reservoir temperature distribution after 20 years of operation for the V-shaped closed-loop well configuration.
Figure 18.
Reservoir temperature distribution after 20 years of operation for the V-shaped closed-loop well configuration.
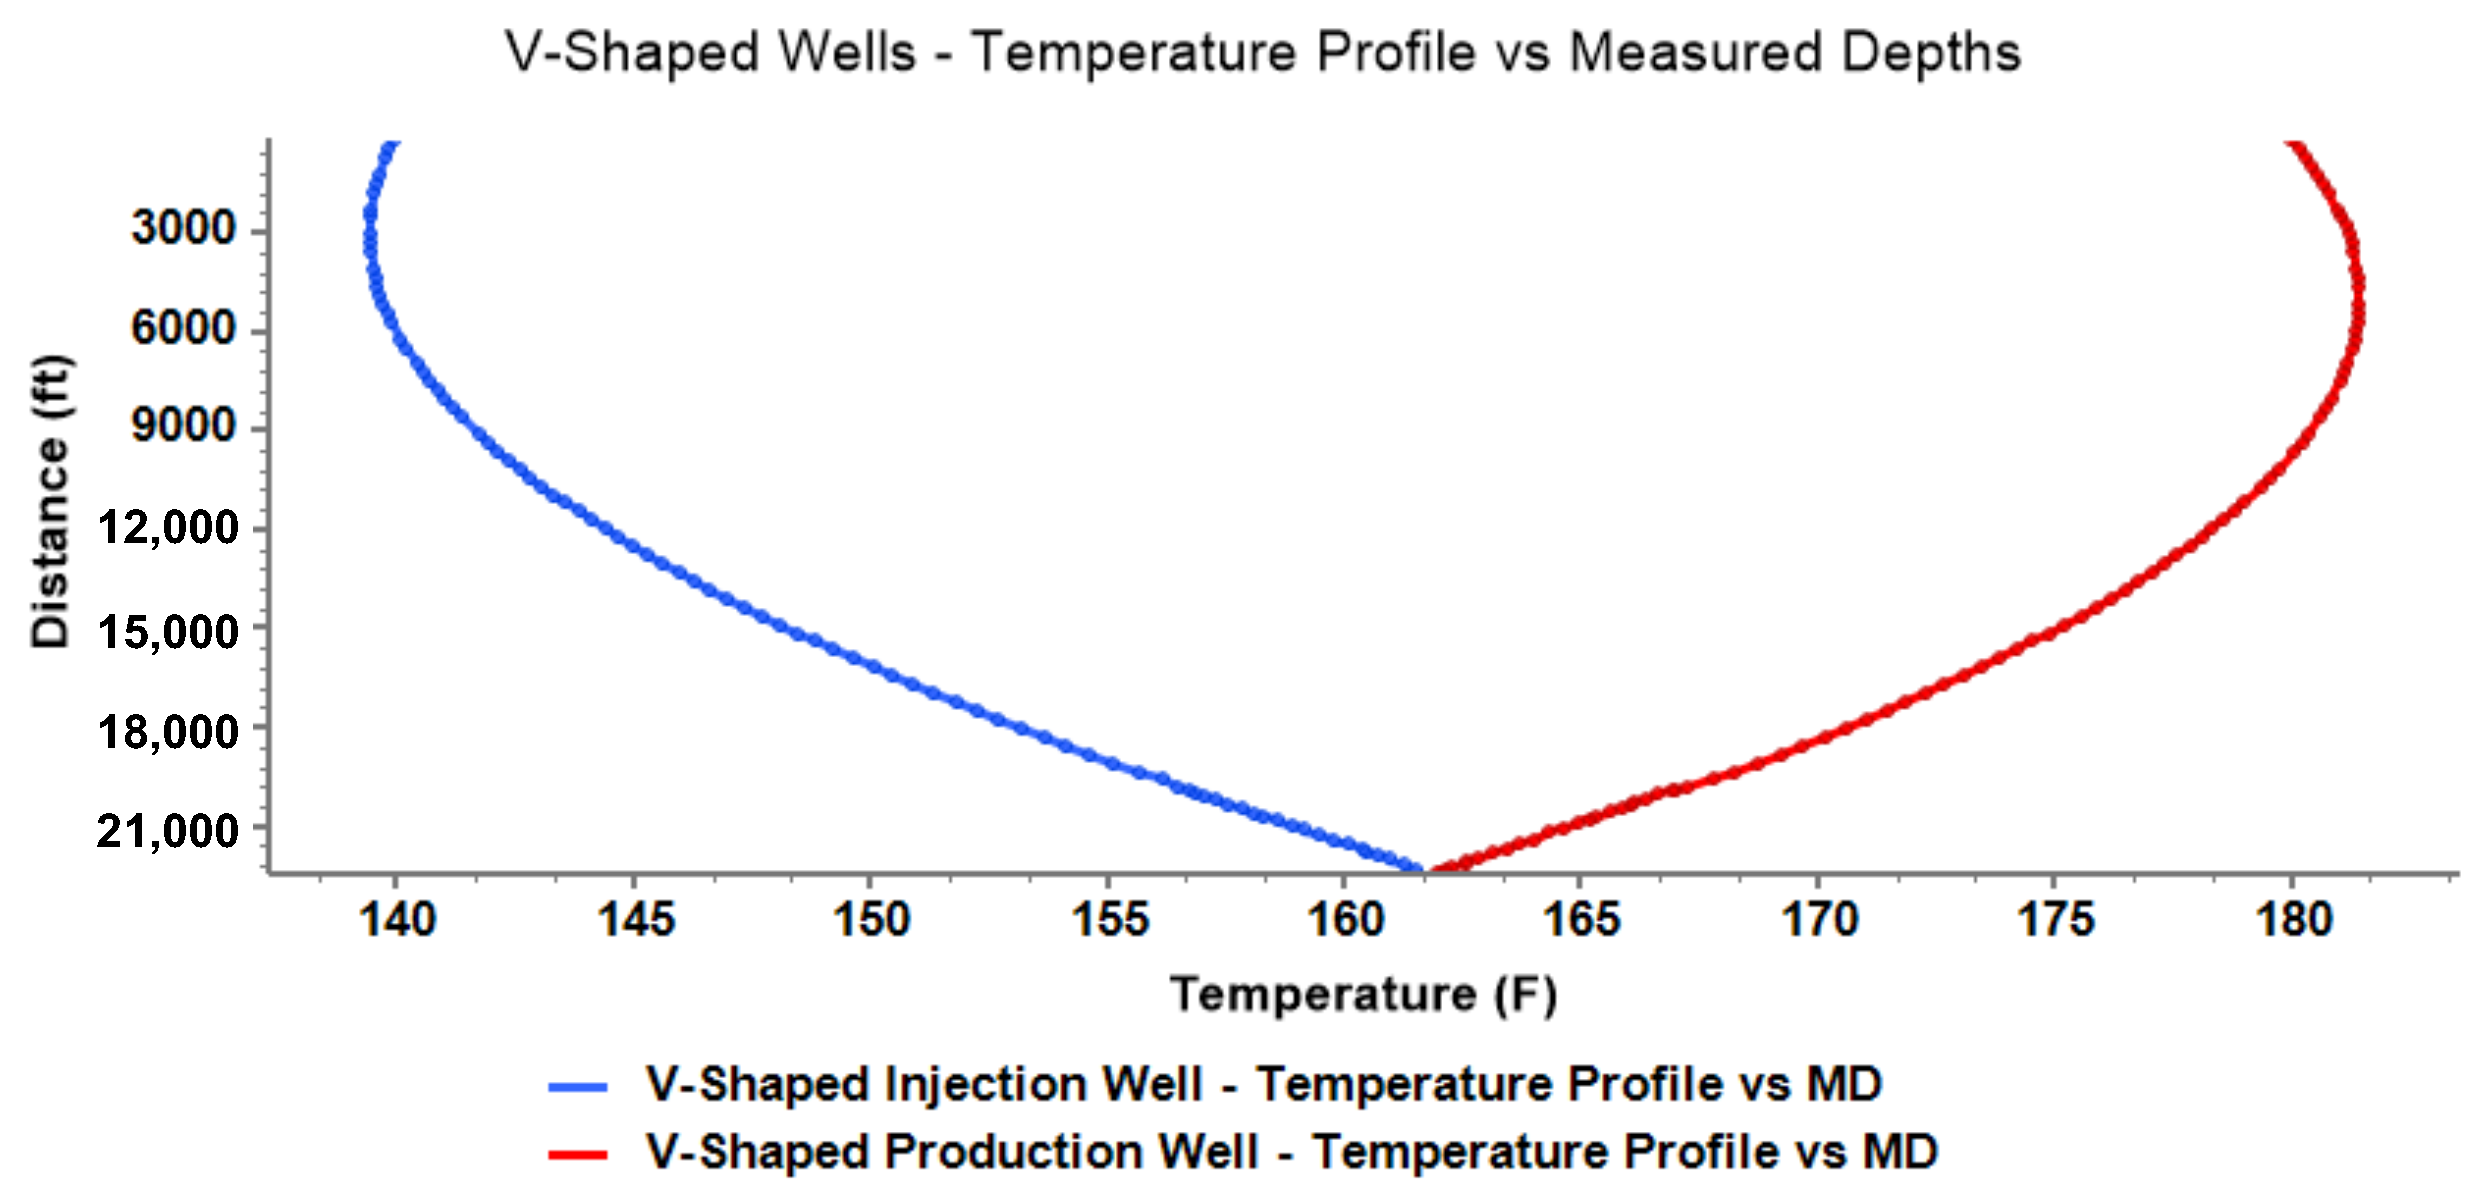
Figure 19.
Estimated temperature profiles as a function of the measured depth for the injection and production wells, including the V-shaped lateral well portion).
Figure 19.
Estimated temperature profiles as a function of the measured depth for the injection and production wells, including the V-shaped lateral well portion).
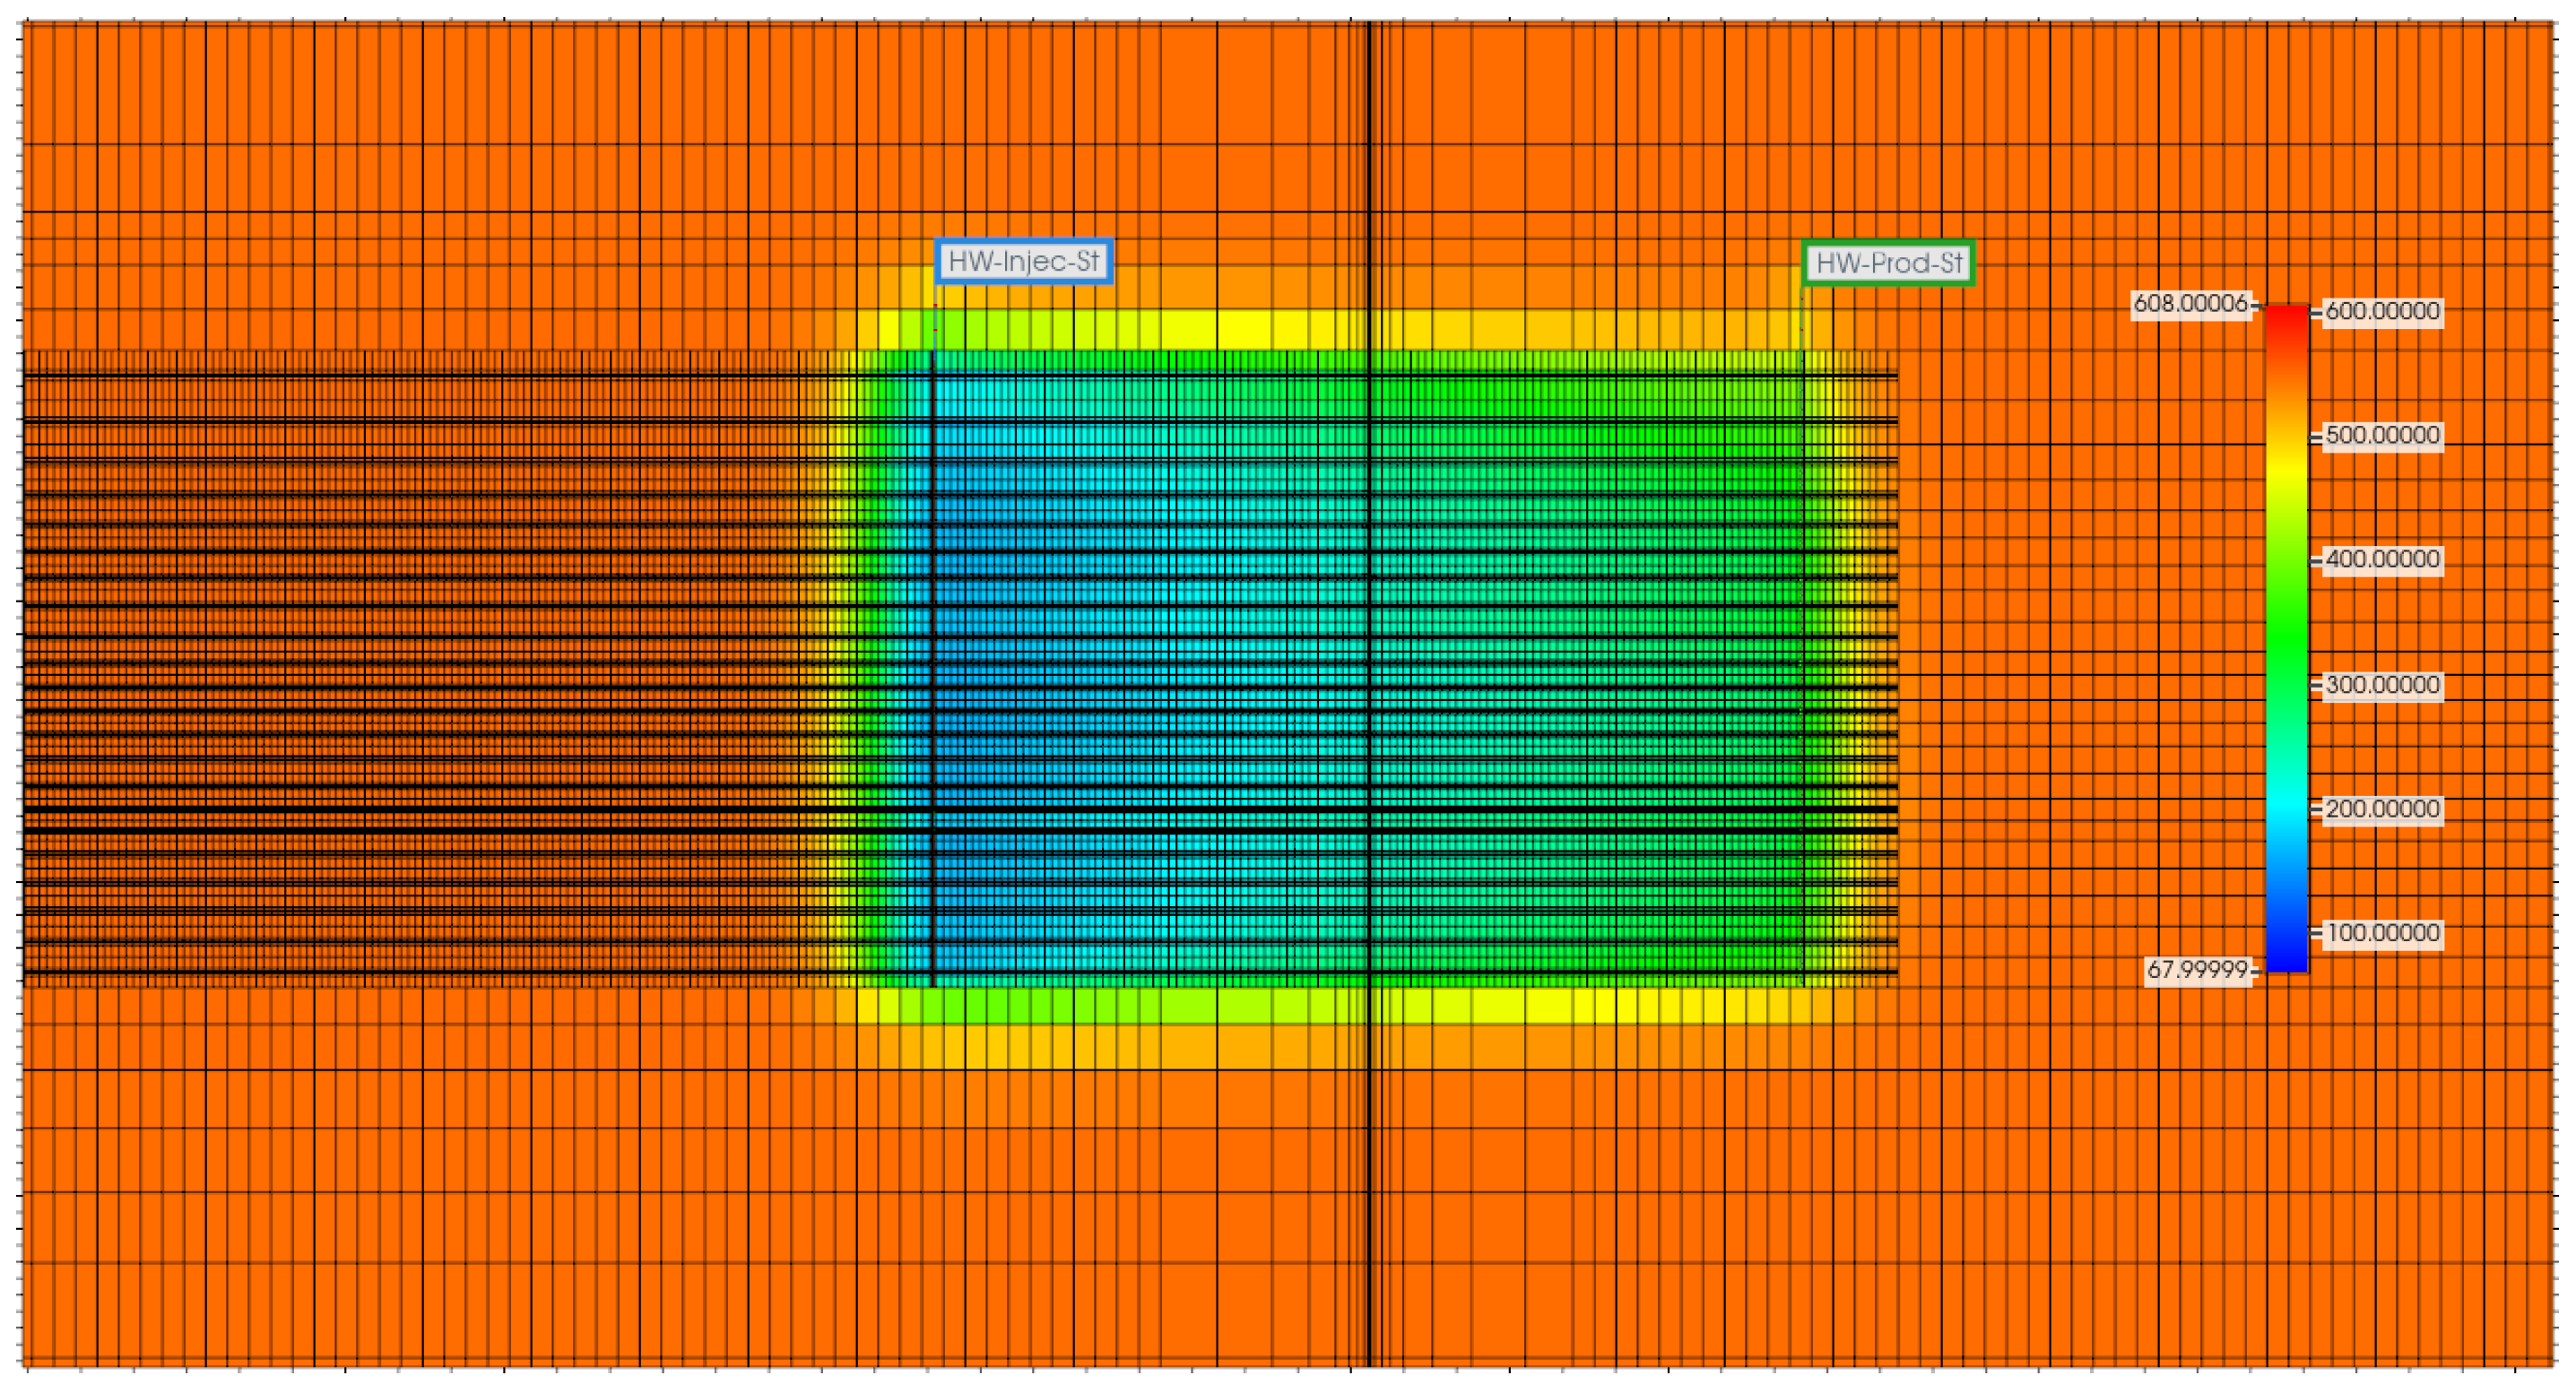
Figure 20.
Reservoir temperature distribution after 20 years of operation for the inclined V-shaped closed-loop well configuration.
Figure 20.
Reservoir temperature distribution after 20 years of operation for the inclined V-shaped closed-loop well configuration.
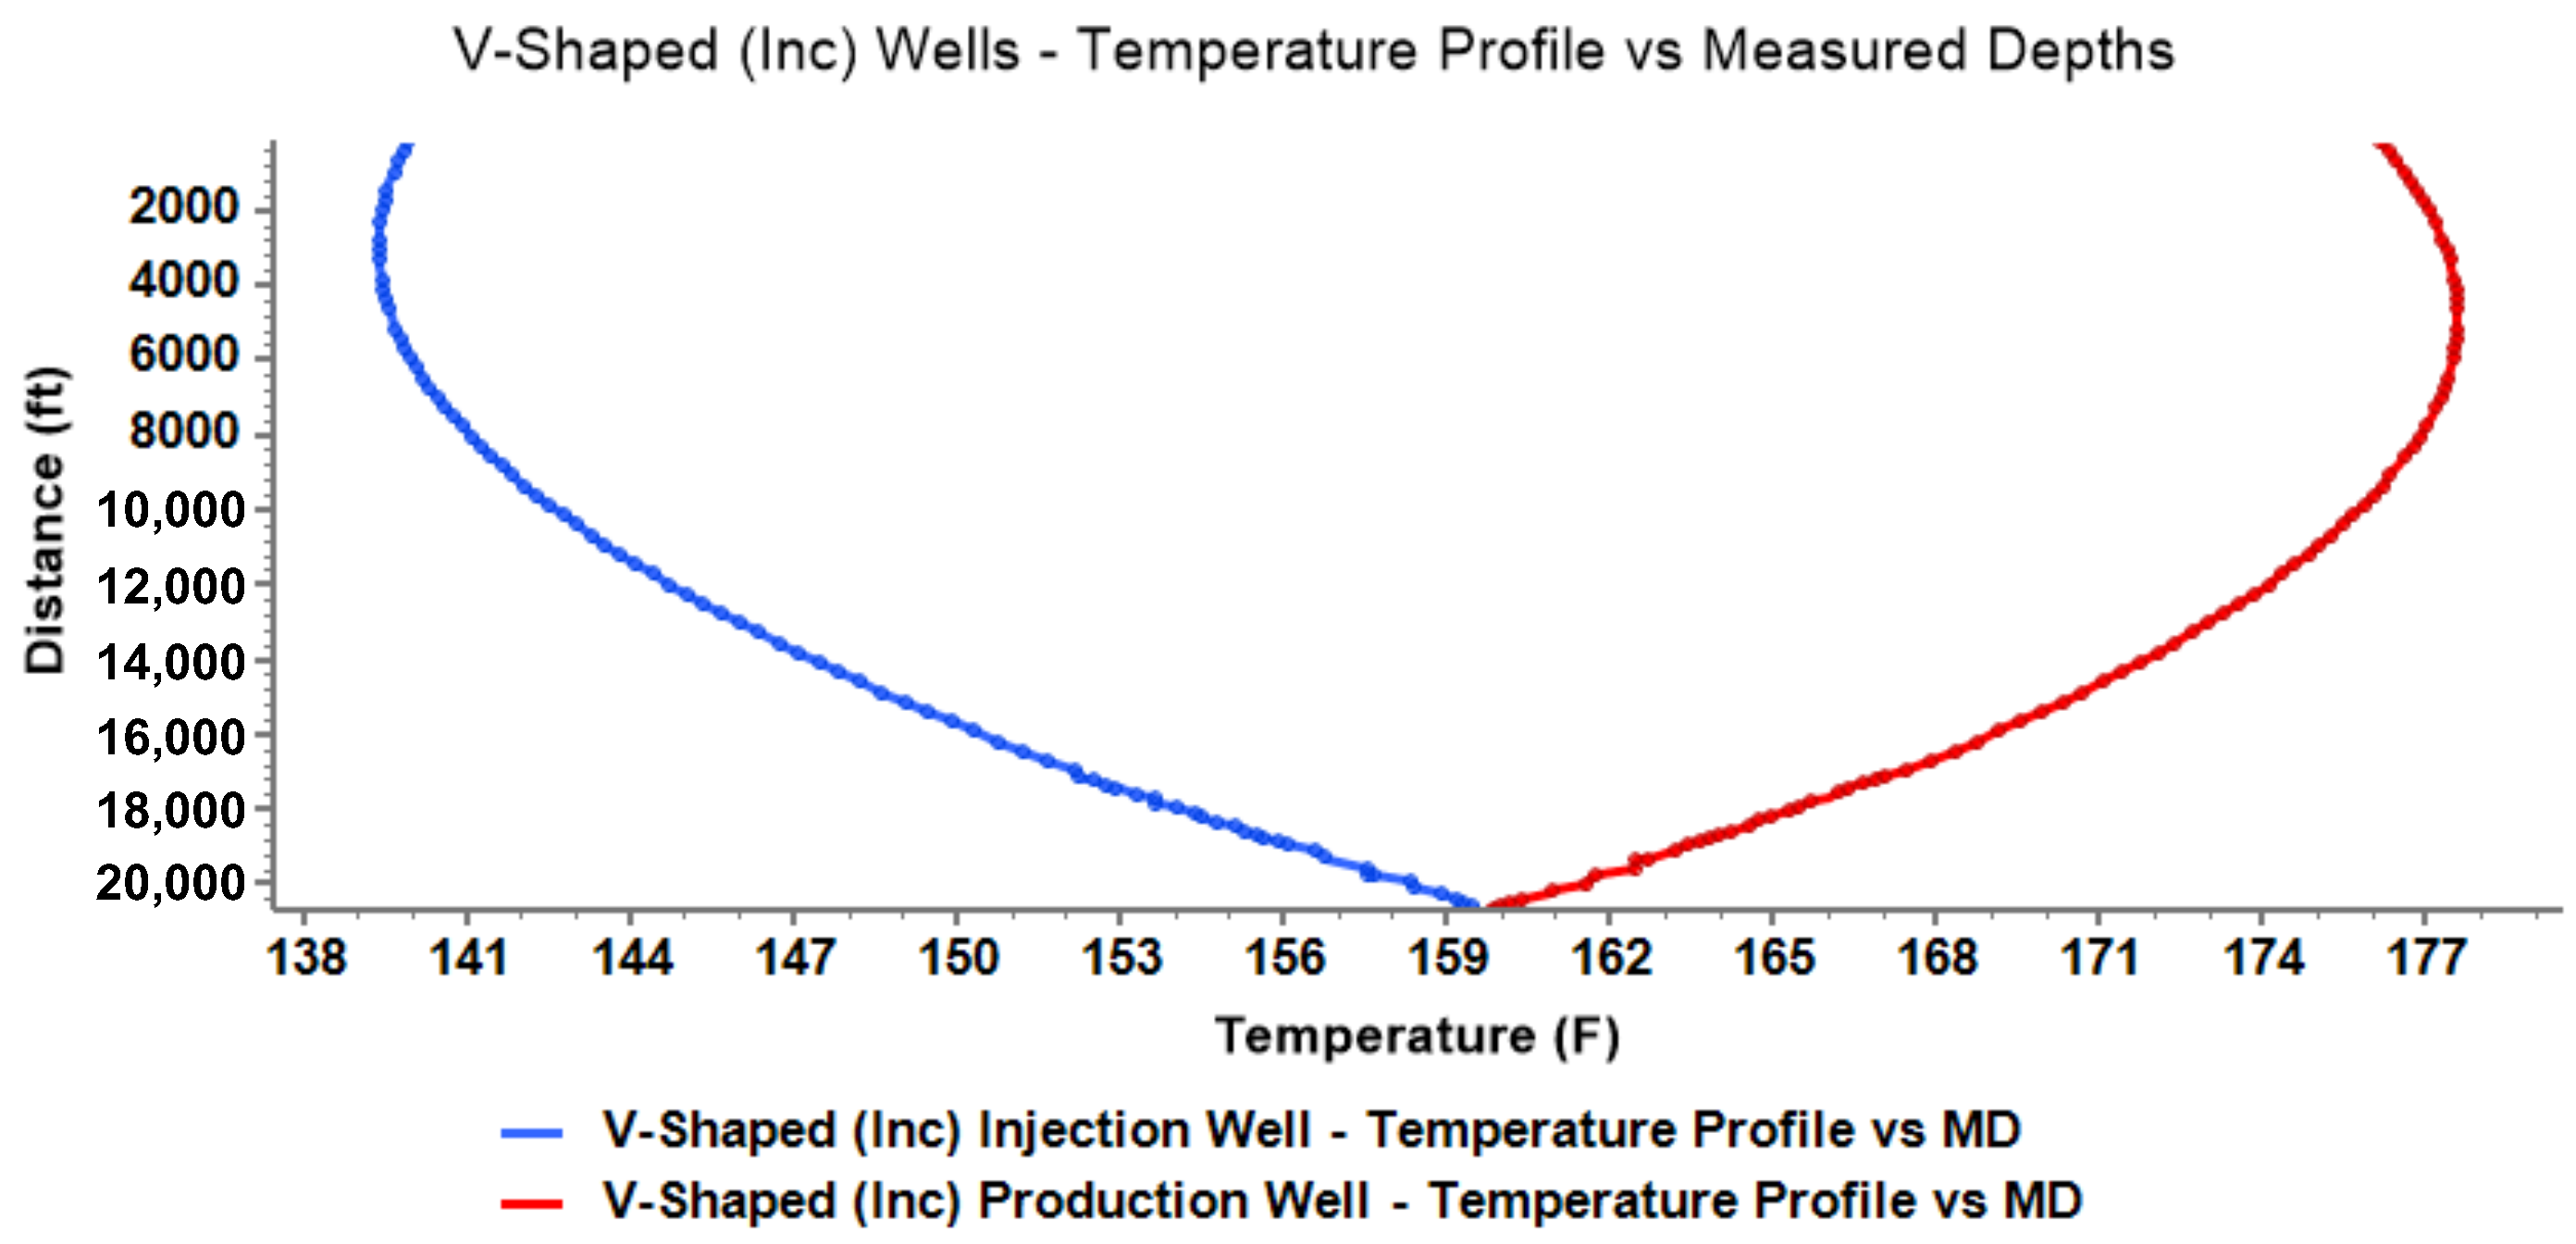
Figure 21.
Estimated temperature profiles as a function of the measured depth for the injection and production wells, including the inclined V-shaped lateral well portion. The notation “V-Shaped (Inc) Wells” was used in the simulation case labeling and is retained in this plot.
Figure 21.
Estimated temperature profiles as a function of the measured depth for the injection and production wells, including the inclined V-shaped lateral well portion. The notation “V-Shaped (Inc) Wells” was used in the simulation case labeling and is retained in this plot.
Figure 22.
Reservoir temperature distribution after 20 years of operation for the EGS well configuration.
Figure 22.
Reservoir temperature distribution after 20 years of operation for the EGS well configuration.
Figure 23.
Estimated temperature profiles as a function of the measured depth for the injection and production wells in the EGS model.
Figure 23.
Estimated temperature profiles as a function of the measured depth for the injection and production wells in the EGS model.
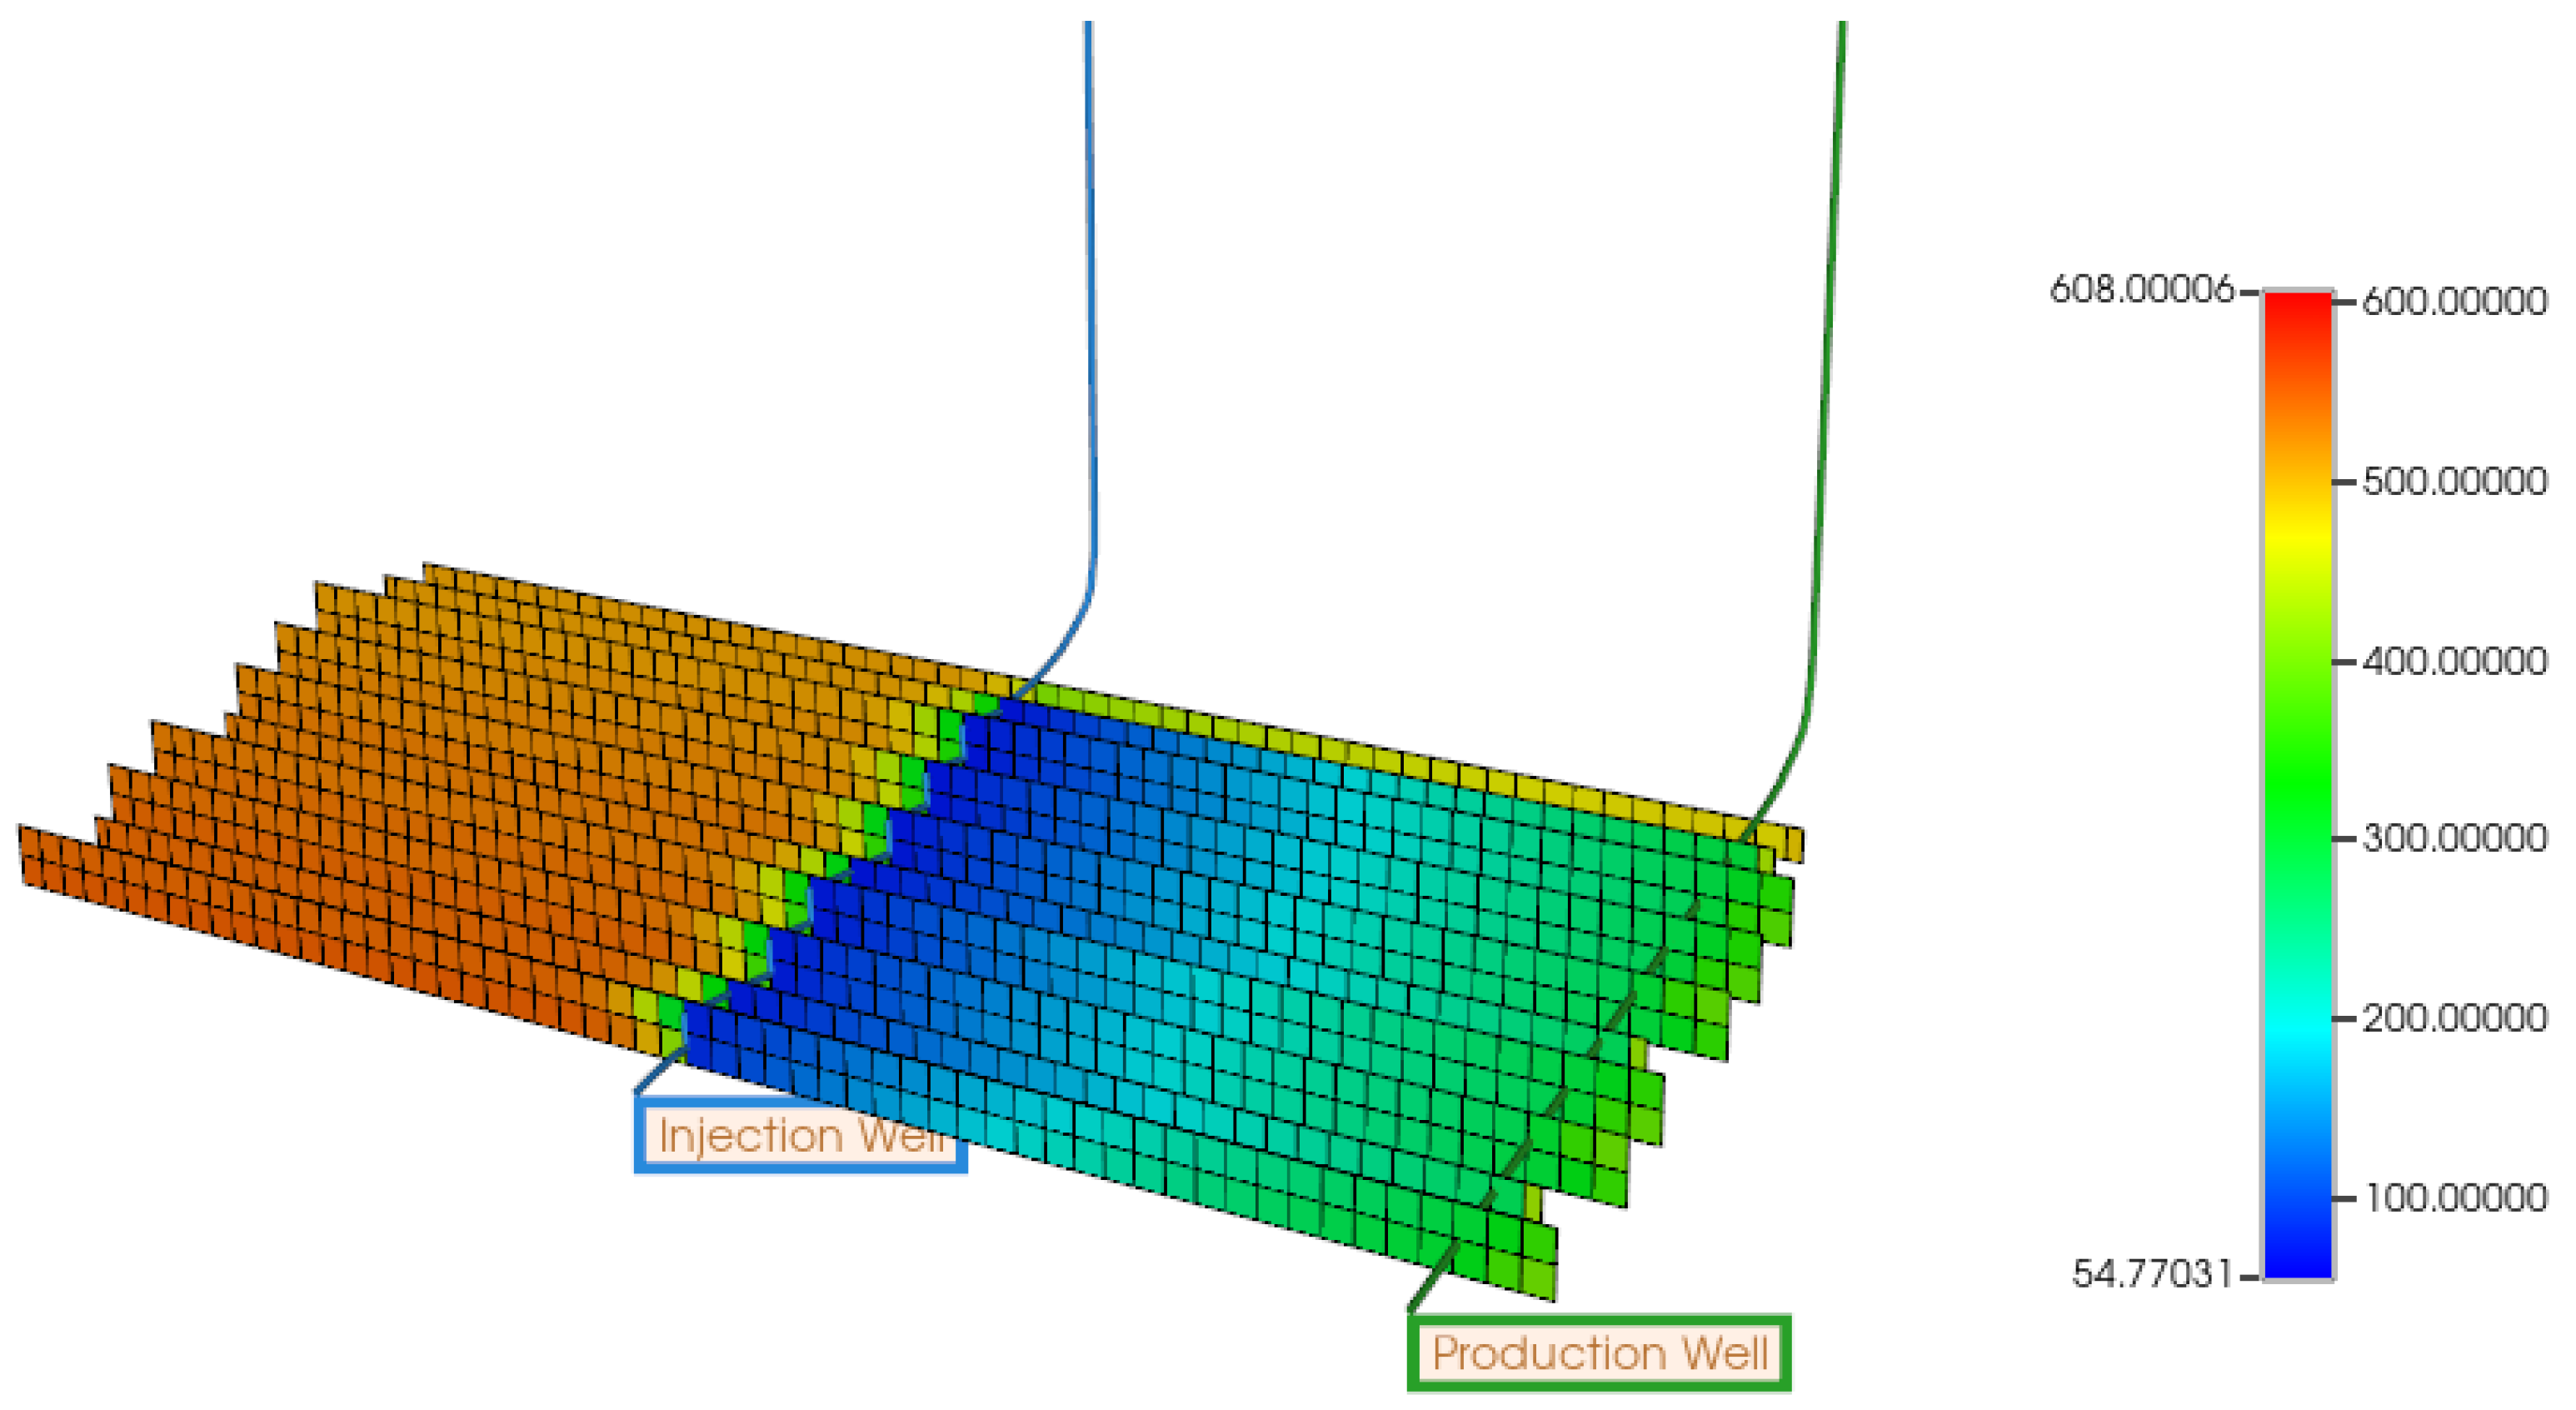
Figure 24.
Reservoir temperature distribution after 20 years of operation predicted by the inclined EGS model.
Figure 24.
Reservoir temperature distribution after 20 years of operation predicted by the inclined EGS model.
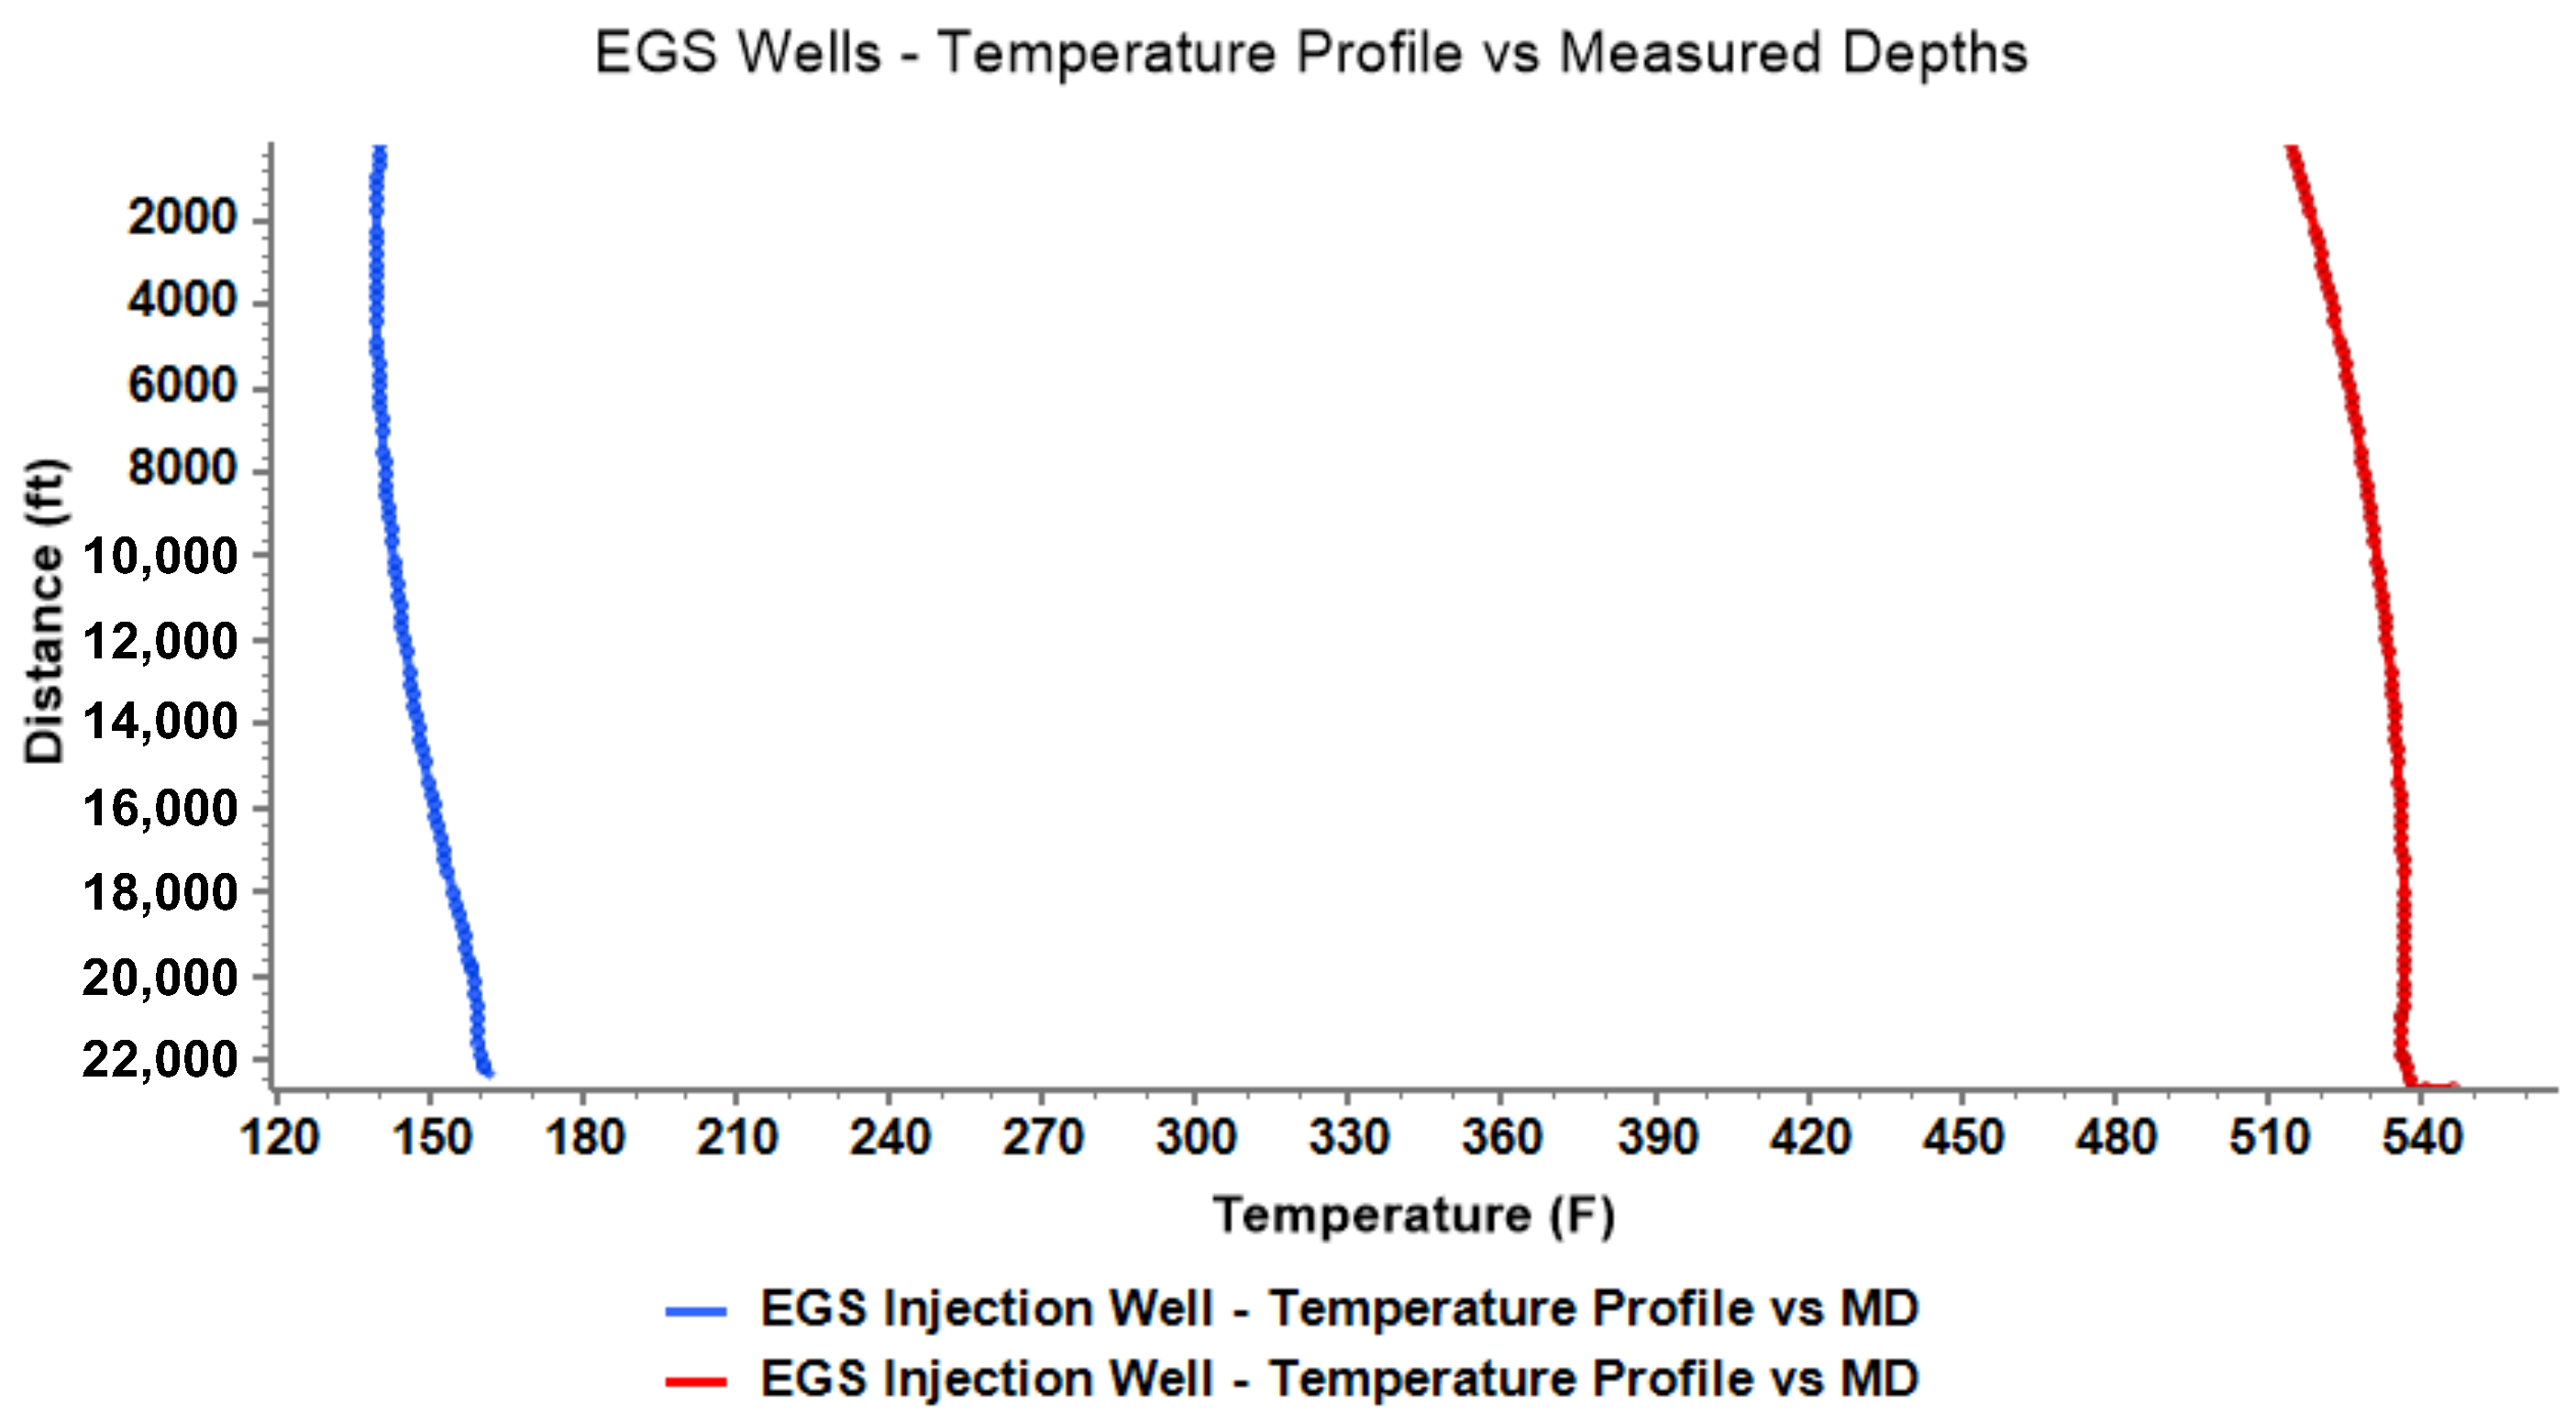
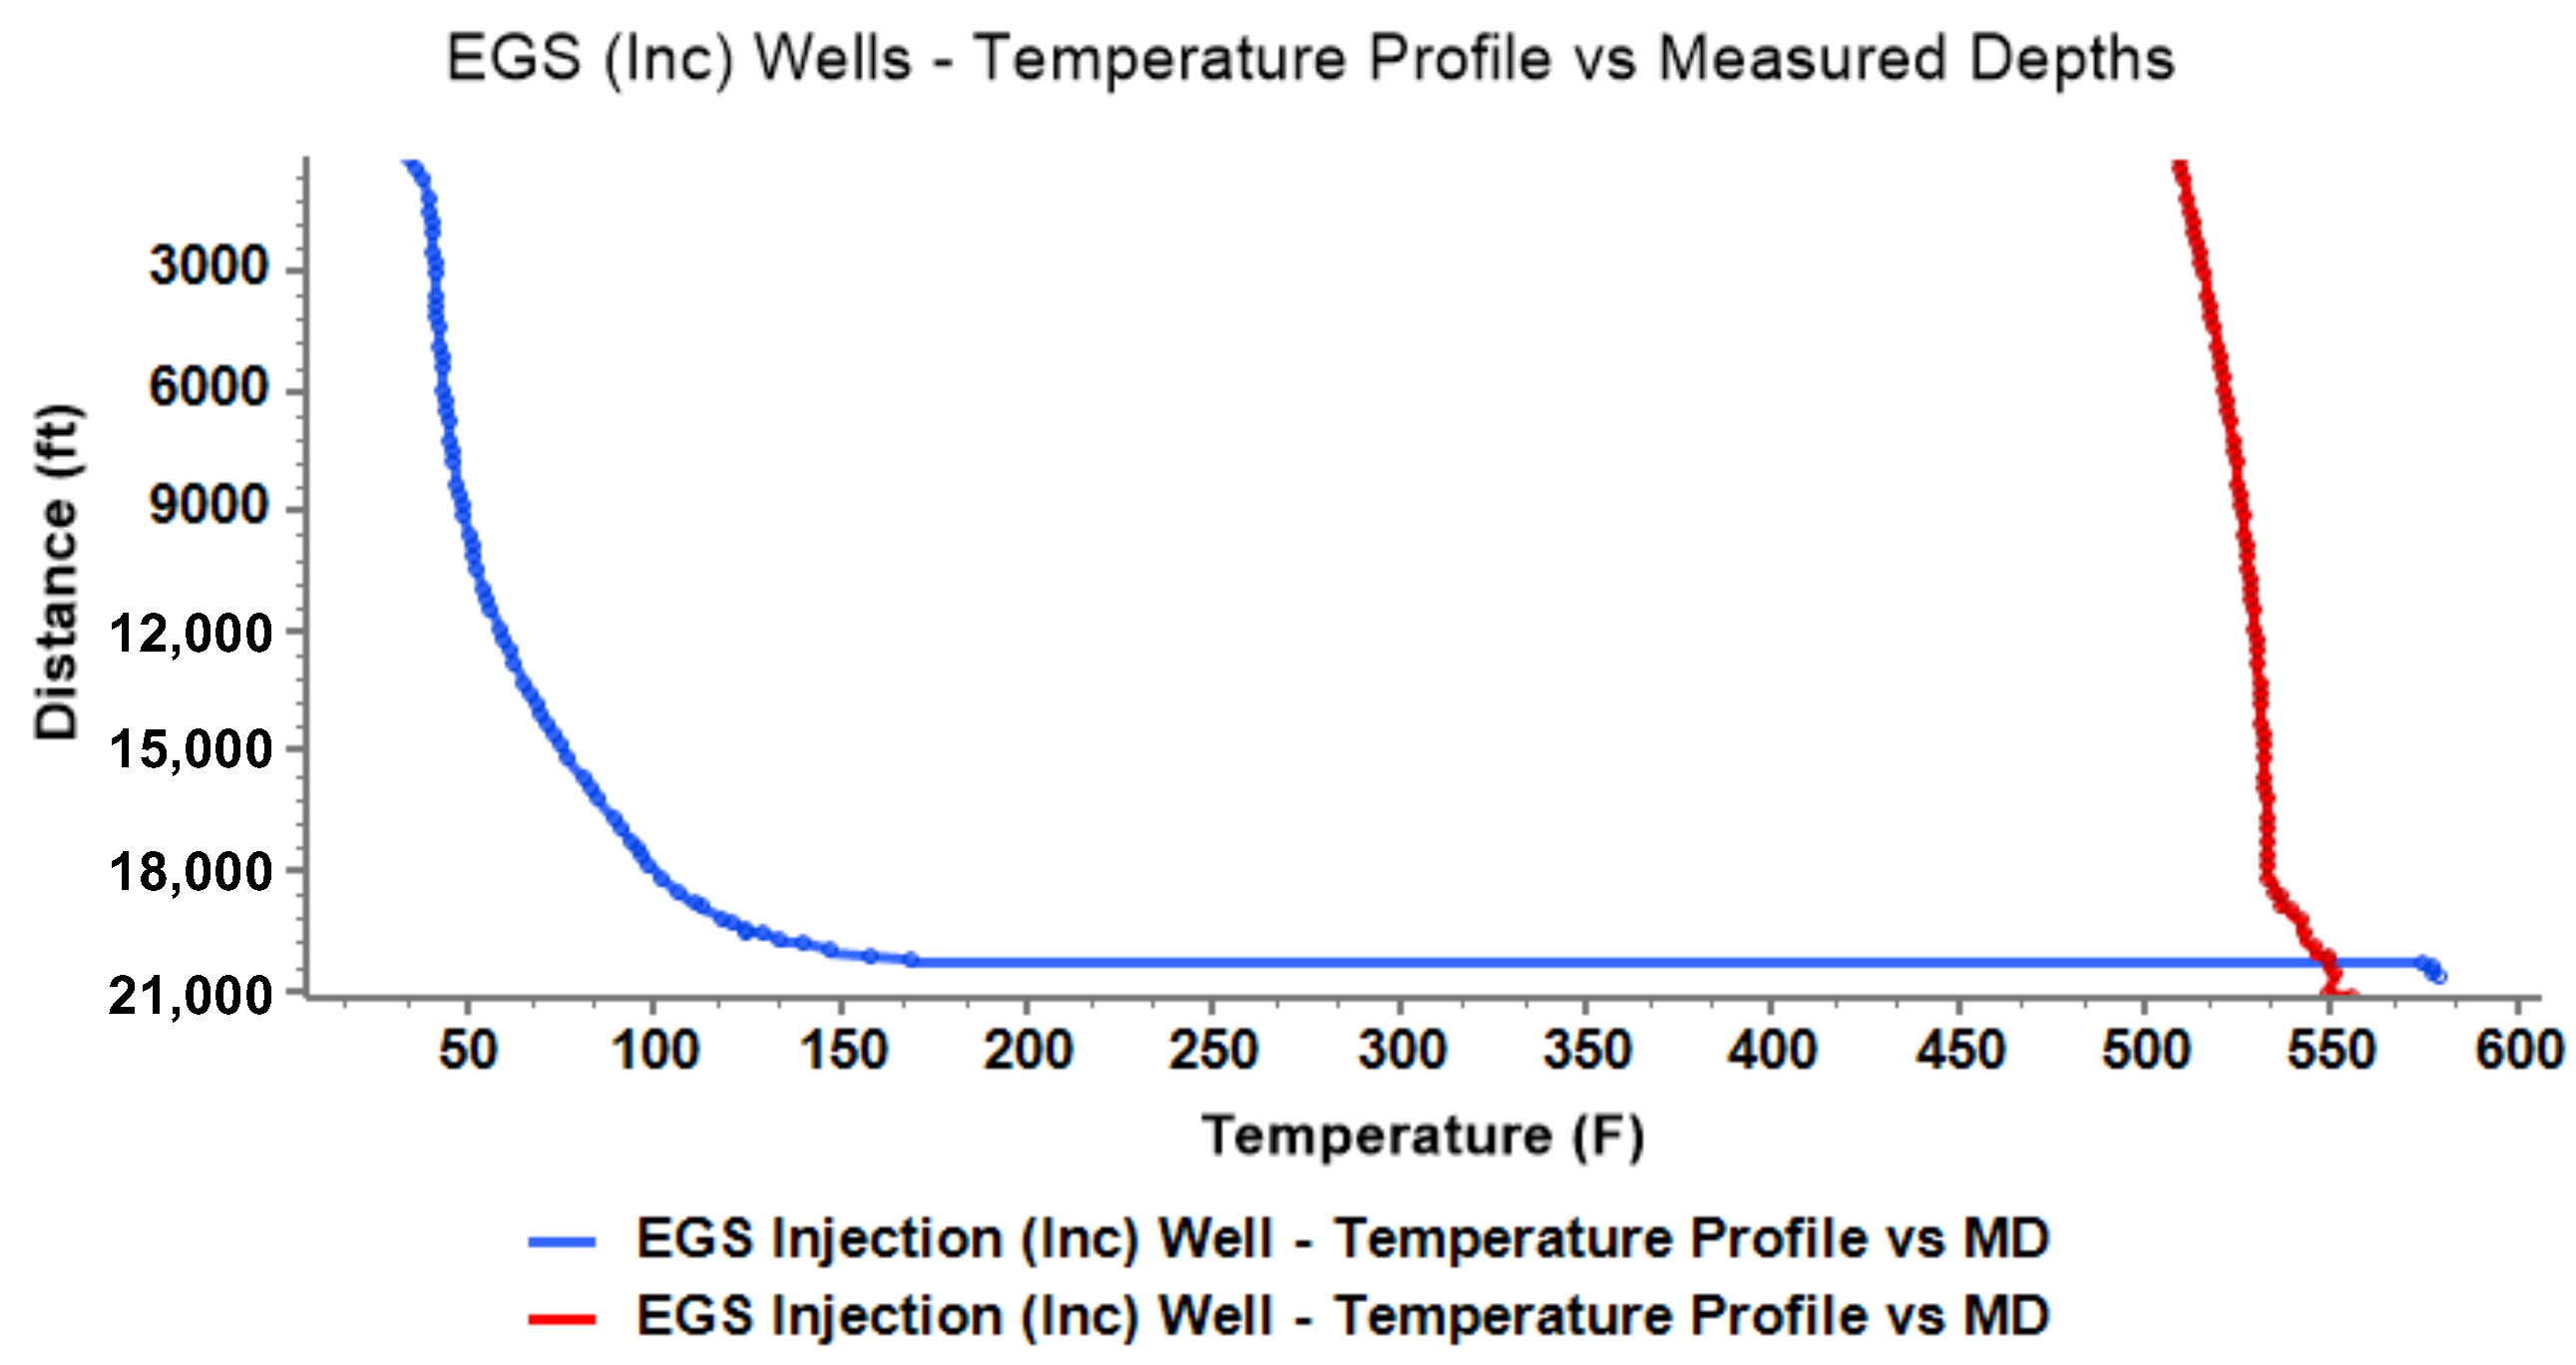
Figure 25.
Estimated temperature profiles as a function of the measured depth for the injection and production wells in the inclined EGS model. The notation “EGS (Inc) Wells" was used in the simulation case labeling and is retained in this plot.
Figure 25.
Estimated temperature profiles as a function of the measured depth for the injection and production wells in the inclined EGS model. The notation “EGS (Inc) Wells" was used in the simulation case labeling and is retained in this plot.
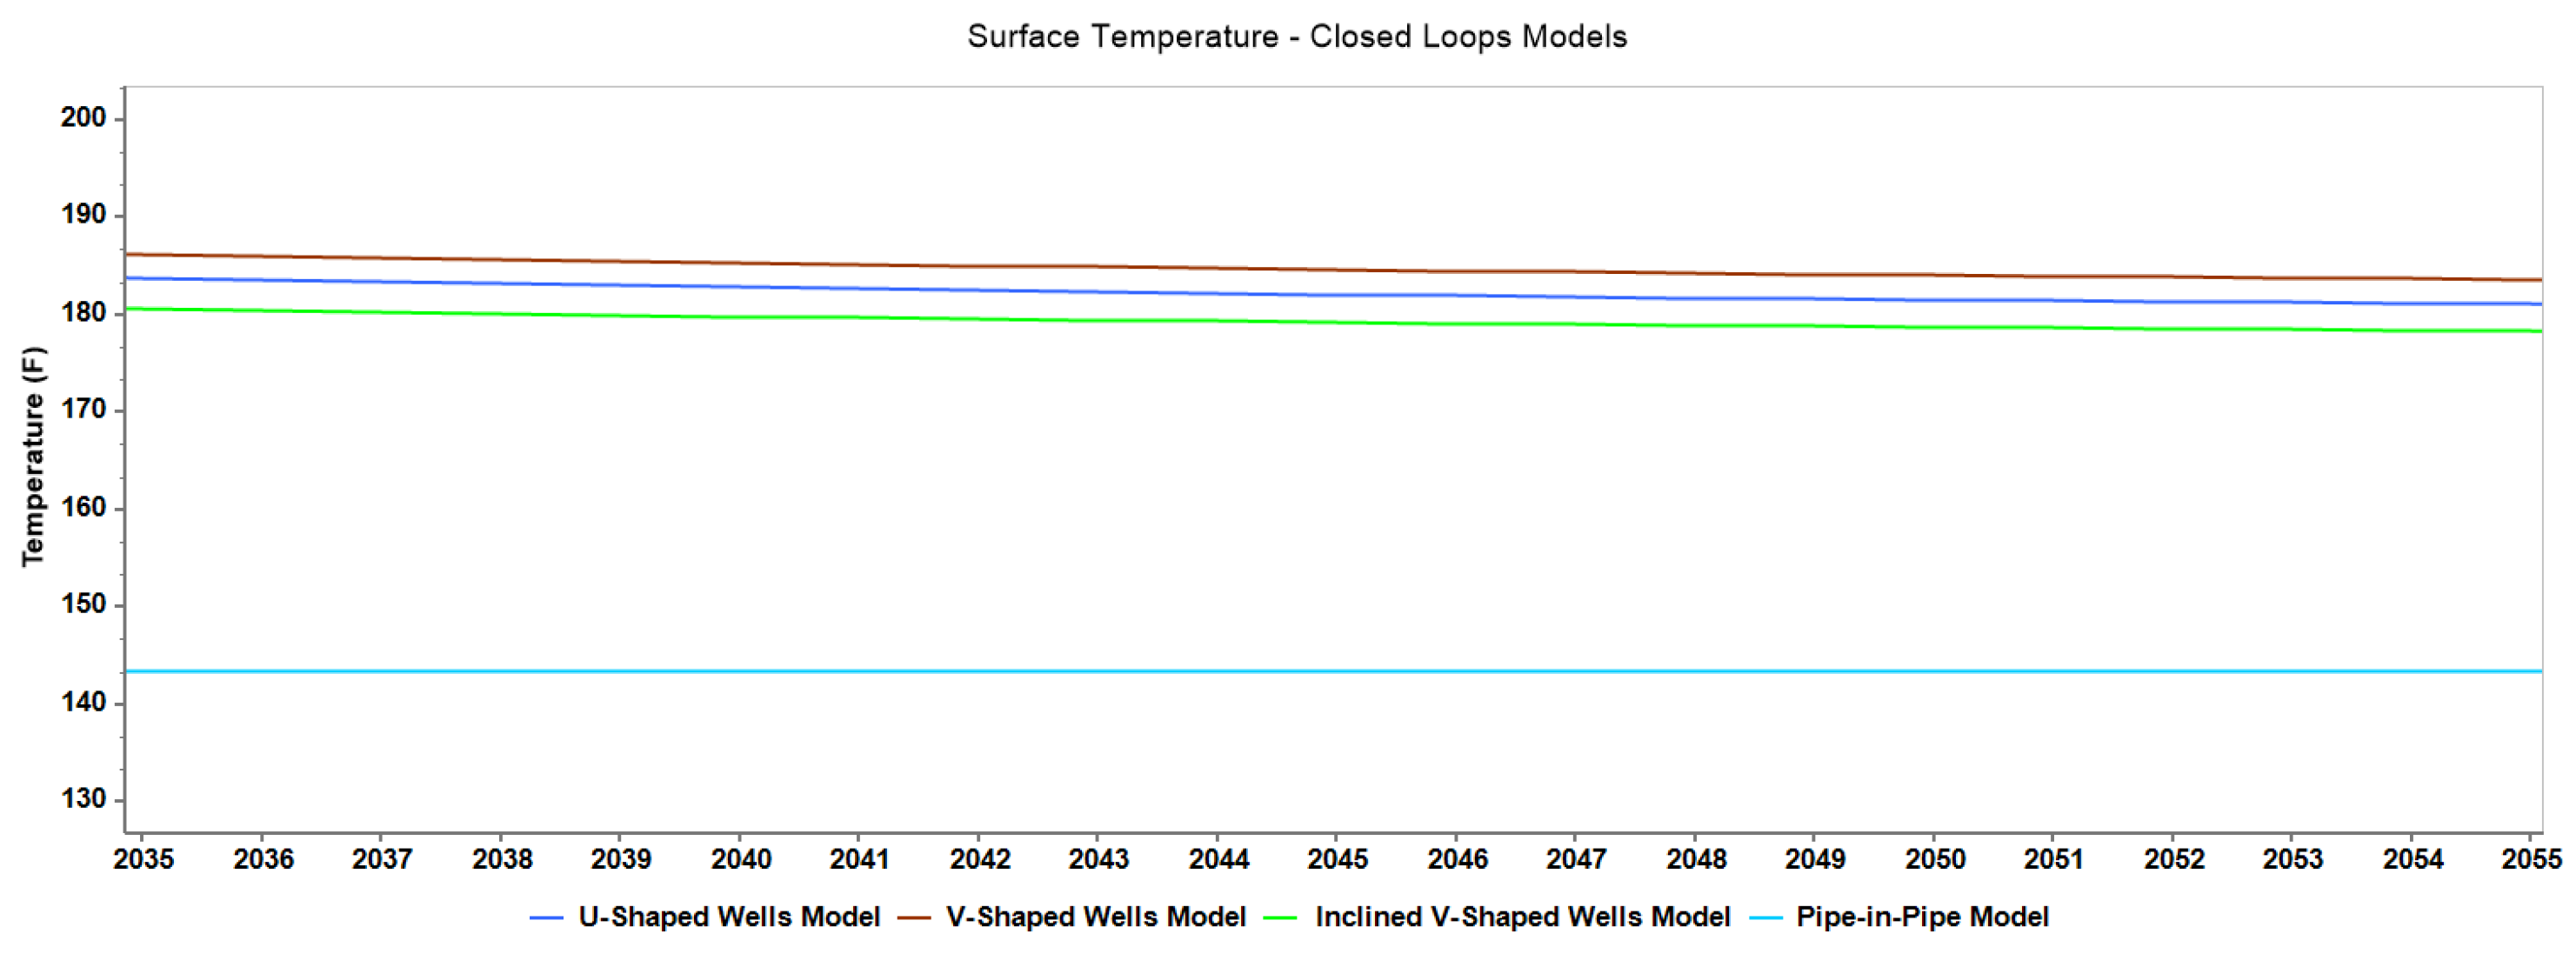
Figure 26.
Comparison of produced surface temperatures of closed-loop well configurations after 20 years.
Figure 26.
Comparison of produced surface temperatures of closed-loop well configurations after 20 years.
Figure 27.
Estimated produced surface temperatures by EGS and inclined EGS models after 20 years.
Figure 27.
Estimated produced surface temperatures by EGS and inclined EGS models after 20 years.
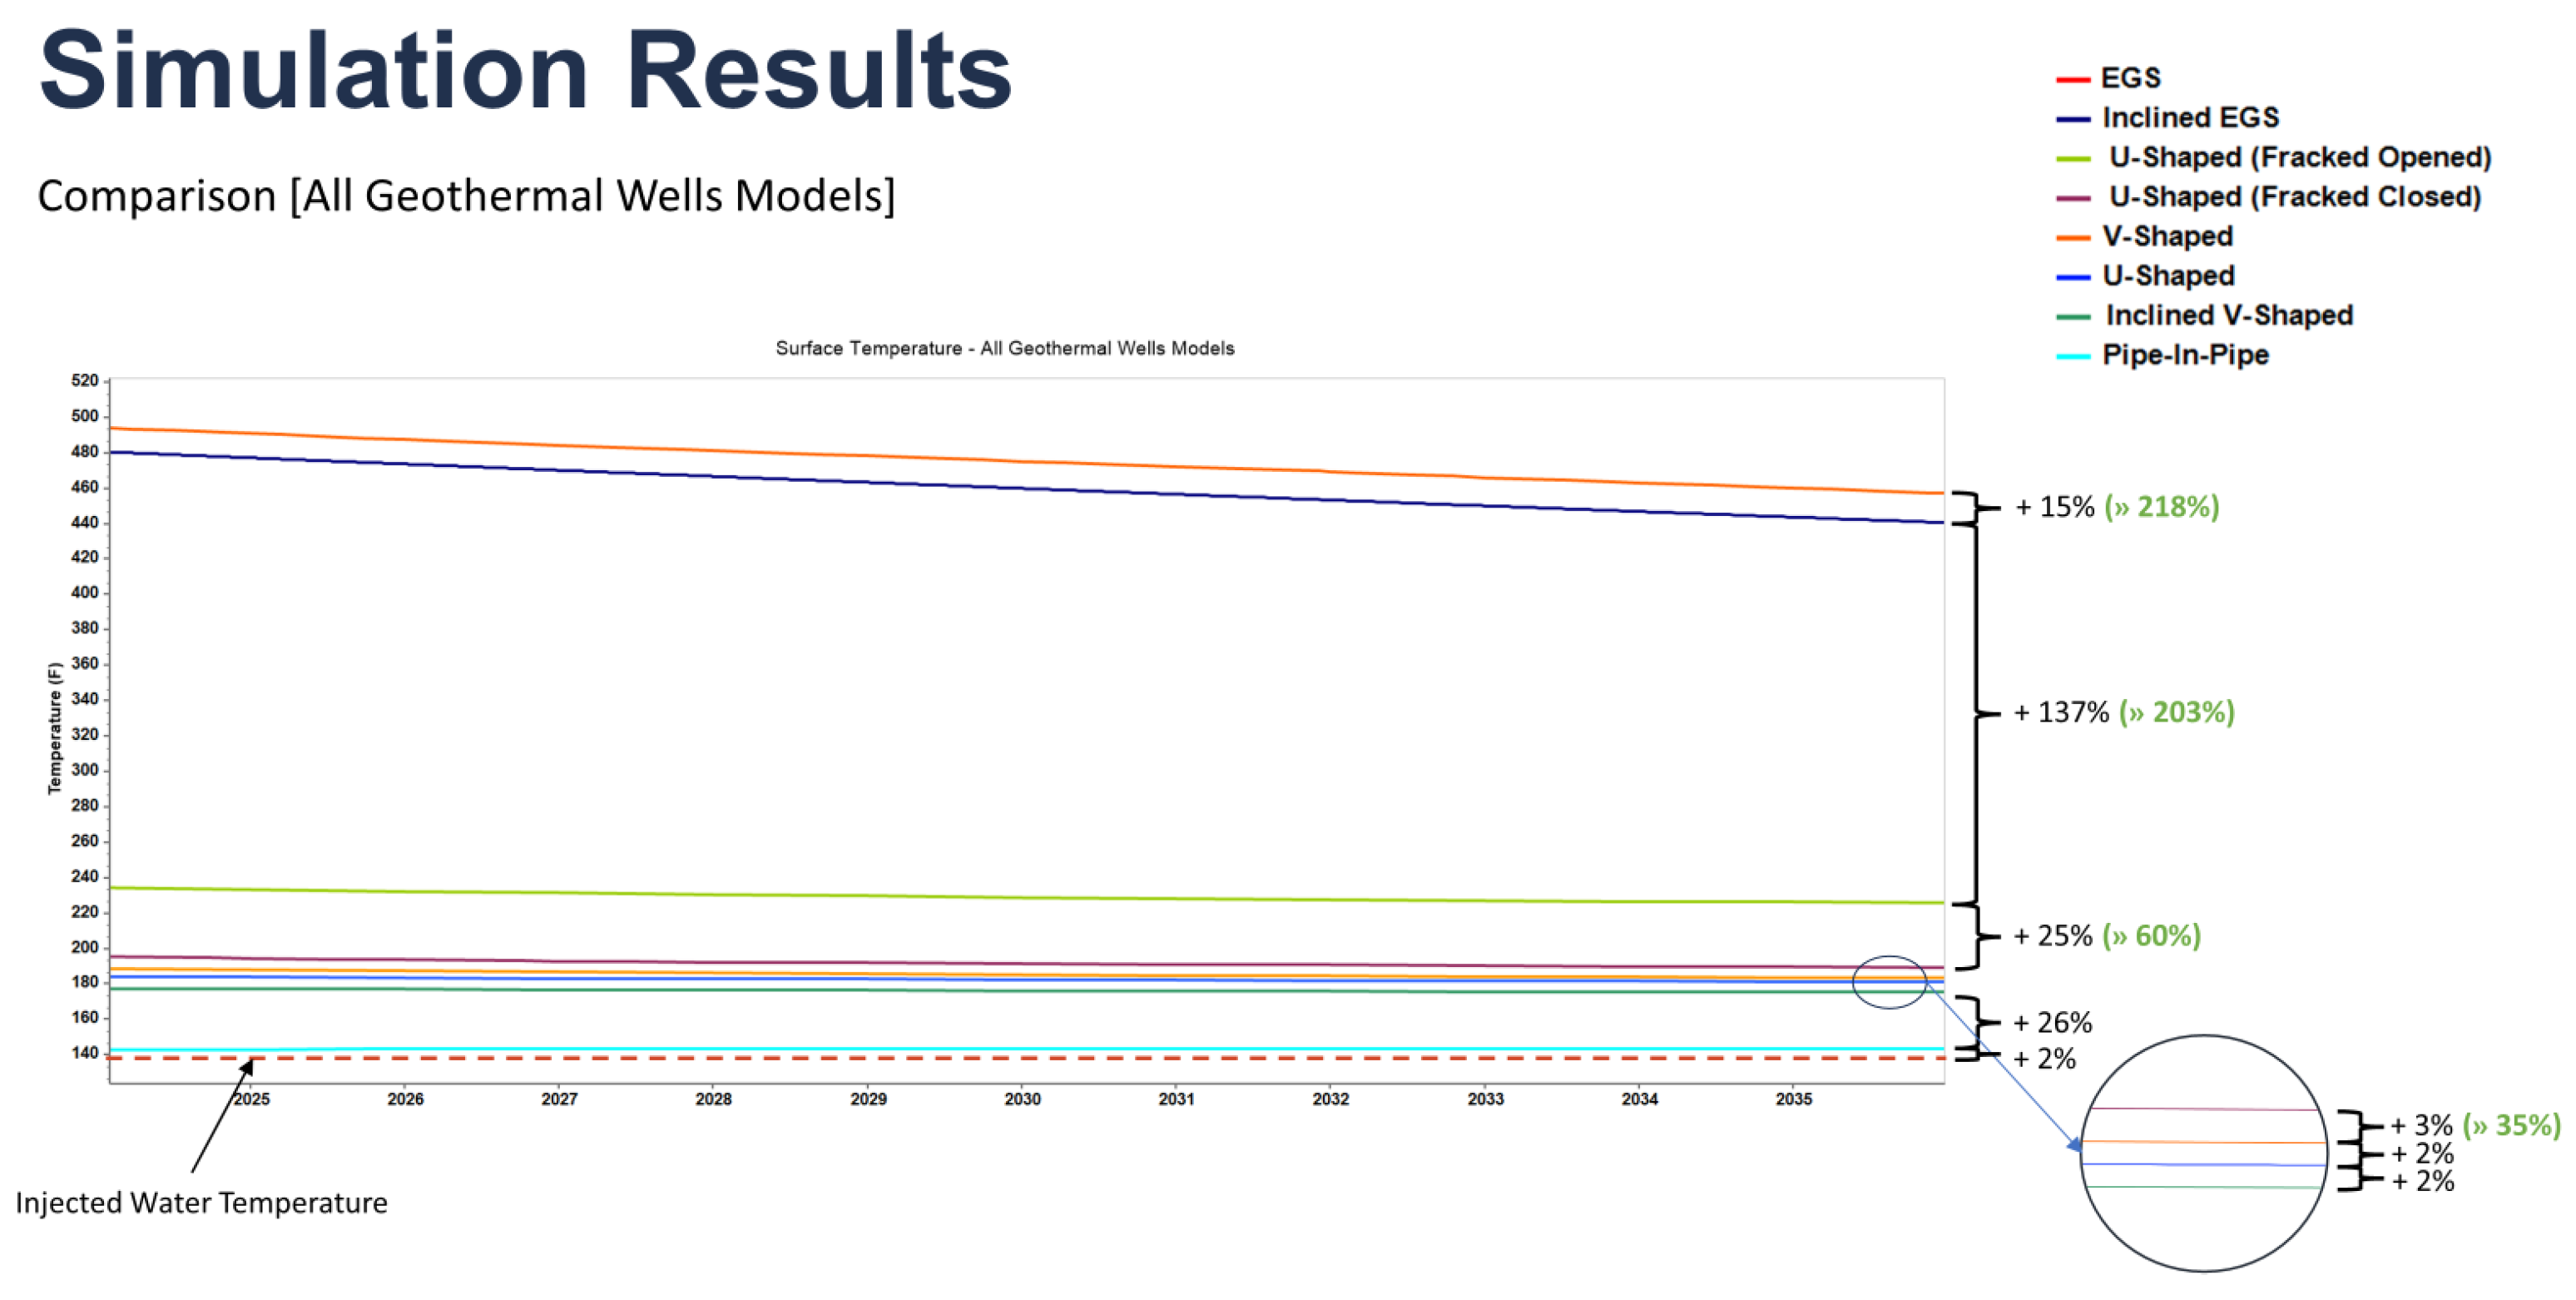
Figure 28.
Comparison of overall produced surface temperatures of all geothermal well configurations after 20 years.
Figure 28.
Comparison of overall produced surface temperatures of all geothermal well configurations after 20 years.
Table 1.
Input parameters for the reservoir and grid section.
Table 1.
Input parameters for the reservoir and grid section.
| Parameter | Value |
|---|
| Porosity | 0.01 |
| Permeability | md |
| Water saturation | 100% |
| Hydrostatic gradient | 10 kPa/m |
| Rock compressibility | |
| Formation thermal conductivity | 252,720 J/(m·day·°C) |
| Formation volume heat capacity | 2,667,500 J/(·°C) |
| Working fluid volume capacity | 53,500 J/(m·day·°C) |
| Temperature gradient | 50 °C/km |
Table 2.
Component properties for simulation.
Table 2.
Component properties for simulation.
| Parameter | Value |
|---|
| AVISC | 0.0047352 cp |
| BVISC | 2760.26 °F |
| Reference pressure | 8850 psi |
| Reference temperature | 572 °F |
| Surface pressure | 14.7 psi |
| Surface temperature | 68 °F |
Table 3.
Parameters for initial conditions.
Table 3.
Parameters for initial conditions.
| Parameter | Value |
|---|
| Reference pressure | 8850 psi |
| Reference depth | 20,000 ft |
Table 4.
Diameter specifications for FlexWells.
Table 4.
Diameter specifications for FlexWells.
| Well | Wall Inner Diameter (ID) | Wall Outer Diameter (OD) |
|---|
| Injector | 0.14 m | 0.152 m |
| Producer | 0.14 m | 0.152 m |
Table 5.
Comparison of well models’ temperature performance.
Table 5.
Comparison of well models’ temperature performance.
| Well Model | Surface Temperature (°F) | (°F) |
|---|
| Pipe-in-Pipe | 143 | +3 |
| Inclined V-Shaped | 179 | +39 |
| U-Shaped | 182 | +42 |
| V-Shaped | 185 | +45 |
| U-Shaped (Fracked Closed) | 189 | +49 |
| U-Shaped (Fracked Opened) | 225 | +85 |
| Inclined EGS | 425 | +285 |
| EGS | 446 | +306 |


