Article

Hydrothermal Co-Liquefaction of Sugarcane Bagasse and Residual Cooking Soybean Oil for Bio-Crude Production

by
Matheus Venâncio de Oliveira
,
Maria Pelisson
,
Fabiane Hamerski
,
Luís Ricardo Shigueyuki Kanda
,
Fernando A. P. Voll
,
Luiz Pereira Ramos
and
Marcos Lúcio Corazza
*
Department of Chemical Engineering, Federal University of Paraná, Rua Coronel Francisco Heráclito dos Santos 100, Curitiba 81531-980, PR, Brazil
*
Author to whom correspondence should be addressed.
Processes 2024, 12(7), 1371; https://doi.org/10.3390/pr12071371
Submission received: 5 June 2024 / Revised: 21 June 2024 / Accepted: 27 June 2024 / Published: 1 July 2024
(This article belongs to the Section Chemical Processes and Systems)

Abstract

:
Hydrothermal co-liquefaction (co-HTL) is a process involving two sources of biomasses aiming at bio-crude production. Since there is a lack of studies performed with sugarcane bagasse and residual soybean oil, this study investigated different conditions for the co-HTL of these biomasses, with and without the presence of ethanol as a co-solvent to maximize the bio-crude yield. All co-HTL reactions were carried out in a 300 mL Parr® reactor at temperatures ranging from 200 to 300 °C. After the reaction, a vacuum filtration was performed to separate the bio-char, later washed with ethanol to extract heavy bio-crude, while the liquid-phase was mixed with dichloromethane to recover light bio-crude. Bio-crude yields of around 95 wt.% were obtained at 300 °C using ethanol and water as solvents. The highest bio-char yield (16.6 wt.%) was achieved when using only sugarcane bagasse as the substrate, without the presence of soybean oil. Bio-crude samples obtained at higher temperatures (280 °C and 300 °C) using ethanol as a hydrogen donor presented higher contents of both free fatty acids and fatty acid ethyl esters. This work presents a promising process to produce high-quality bio-crude using an abundant feedstock (sugarcane bagasse) in the presence of a lipid source which could cause environmental problems if poorly handled.

1. Introduction

Biofuels and renewable energy sources have gained global attention due to the growing need for clean energy and fuels that can replace fossil fuels shortly [1]. Sugarcane bagasse stands out among the many possible options for new sources of energy, primarily in tropical countries. Around 151 million tons of sugarcane bagasse are produced worldwide annually [1] and part of this material is used to generate energy through its combustion in boilers and other cogeneration systems. However, better alternatives such as bio-crude, biofuels, synthetic oils, bio-char, and hydrogenated fuel production can be explored for a more effective use of sugarcane bagasse [1,2]. Another widely generated material that does not have a proper destination are residual cooking and frying vegetable oils, which have the potential to be employed in various processes including biodiesel, green diesel, and biokerosene production [3]. The annual estimate for residual soybean oil is 16.54 million tons generated worldwide [4].
Thermal processes are a technically viable alternative for processing several biomass types and their scalability has been demonstrated for different feedstocks [5,6,7]. Among these processes, biomass hydrothermal liquefaction (HTL) is advantageous because it does not require a pre-drying process, meaning that using biomass with high moisture content is possible, and even preferable. Furthermore, HTL bio-crudes can be produced from biomass at temperatures ranging from 250 to 400 °C in the presence or absence of co-solvents such as methanol, ethanol, glycerol, or even a mixture of solvents [5,8,9]. Table 1 summarizes studies that used different biomass types as feedstock and the bio-crude yields, reaction parameters, and higher heating values (HHVs) of the products obtained.
Zhang et al. [9] evaluated the effect of adding a lipid source such as a residual oil in HTL reactions using rice straw. Since two sources of biomasses were involved, the process was called hydrothermal co-liquefaction (co-HTL). While bio-crude yields of up to 50% have been achieved through HTL of biomass, adding a lipid agent has enhanced bio-crude yields by up to 80% [6,28,29]. Since there is a lack of studies regarding the use of co-HTL using a mixture of sugarcane bagasse and residual cooking soybean oil, the main objective of this work was to investigate such a reaction, in the presence and absence of ethanol, at different process temperatures.

2. Materials and Methods

2.1. Materials

Residual soybean oil (RSO) was obtained from local residences. The RSO was first filtered using a domestic strainer to remove solid residues, followed by another filtration using filter paper to remove smaller solid impurities. Sugarcane bagasse (SCB) was supplied by Melhoramentos Norte do Paraná (Nova Londrina, Brazil). Deionized water and ethanol (Neon, Suzano, Brazil, 99.5% purity) were used as the reaction medium. Dichloromethane (DCM) (Neon, Suzano, Brazil, 99.5% purity) was used to recover the bio-crude after HTL. N2 (White Martins, Rio de Janeiro, Brazil, 99.9% purity) was used to create an inert atmosphere in the reaction media. The analyses were performed using potassium bromide (KBr) (Vetec, Duque de Caxias, Brazil, 99% purity), helium (He) (White Martins, Rio de Janeiro, Brazil, 99.999% purity), N-methyl-N-(trimethylsilyl)trifluoroacetamide (MSTFA) (Sigma-Aldrich, St. Louis, MO, USA, 98.5% purity), pyridine (Sigma-Aldrich, St. Louis, MO, USA, 99% purity), and heptane (Sigma-Aldrich, St. Louis, MO, USA, 99% purity). All chemicals were used as received without further purification.

2.2. Experimental Procedures

Co-liquefaction was carried out in a Parr® (Moline, IL, USA) reactor coupled to a controller model 4848. The reactor consists of a 300 mL 316SS (stainless steel) vessel with an electric heating mantle and a mechanical agitation system. Reactions were carried out with SCB and SCB to RSO mass ratios of 1:3, 1:2, and 1:1 using a total biomass (RSO + SCB) to solvent mass ratio of 1:9. The reaction solvents were pure water and a mixture of water and ethanol (mass ratio of 1:1). Biomass and solvents were weighed on an analytical scale before being fed into the reactor.
After the biomass and solvents were fed into the reactor, N2 gas was purged into the reactor for 3 min and, after that, the heating was started to initiate the reaction process. The reactor temperature setpoints (TSP) ranged from 250 to 300 °C. After reaching the temperature setpoint, the reaction was sustained for different holding times (tSP), which ranged from 10 to 120 min. Then, the system was cooled down to the ambient temperature, and around 60 mL DCM was added to clean the reactor walls and obtain a mixture containing bio-crude, solvents, and solids.
Vacuum filtration was performed using a Solab (Piracicaba, SP, Brazil) SL 60 vacuum pump to separate the solids from the liquid mixture. The filtrate was taken to a separating funnel to split the organic phase, in which light bio-crude is recovered, from the aqueous phase. The solid residue that remained in the filter paper was washed with ethanol to extract the heavy bio-crude phase from the solid phase. The “DCM + light bio-crude” and “ethanol + heavy bio-crude” mixtures were taken to a rotary evaporator to separate the bio-crudes from the solvents. The solid phase that remained on the filter paper was recovered, oven-dried at 105 °C for 24 h, and weighed for mass yield calculations.

2.3. Bio-Crude and Bio-Char Yield Calculation

The bio-crude yield after HTL was calculated according to Equation (1),
Y b o ( % ) = m b o m s c b + m r s o · 100
where Y b o (%) is the yield of bio-crude obtained, m b o is the total bio-crude mass (heavy + light bio-crudes) obtained after rotary evaporation, m s c b is the mass of sugarcane bagasse added to the reactor, and m r s o is the total mass of residual frying oil added to the reactor.
The bio-char yield was calculated according to Equation (2),
Y b c ( % ) = m b c m s c b · 100
where Y b c ( % ) is the bio-char yield and m b c is the bio-char mass after drying.

2.4. Severity Index

The reactions performed in this study are non-isothermal because they involved both a heating and a cooling ramp. To account for this non-isothermal behavior, the integral of the curve “temperature vs. time” was calculated to determine a parameter known as the severity index ( S O ). This value can be used as the kinetic (or pseudo-kinetic) factor for thermochemical reactions where a biomass fractionation exists in non-isothermal conditions [30,31,32]. In this study, S O was calculated by integrating Equation (3) through the trapezoidal rule using the temperature profile measured during the reaction course,
S O = l o g 0 t e x p T ( t ) T b w d t
where t is the reaction time in min; T(t) is the temperature in °C as a function of time; Tb is a temperature reference value of 100 °C [33]; and w is a fixed parameter of 14.75, which corresponds to the activating energy of hemicellulose hydrolysis [33].

2.5. Bio-Crude and Bio-Char Characterization

For the analysis of mass loss and decomposition of the bio-crude and bio-char, a thermogravimetric analysis was performed using a PerkinElmer (Waltham, MA, USA) TGA 4000® analyzer. N2 was applied as the carrier gas at temperatures ranging from 30 to 800 °C, with a heating rate of 10 °C/min. FTIR analyses were performed to identify the main bio-crude and bio-char functional groups using a Bruker (Billerica, MA, USA) Alpha II analyzer, with potassium bromide (KBr) disks as the crystalline surface, ranging from 4000 cm−1 to 400 cm−1. The higher heating value (HHV) was determined using a LECO (St. Joseph, MI, USA) AC500 calorimeter according to a standard test method [34].

2.6. GC-FID Analysis

Free fatty acids, ethyl esters, and triacylglycerols present in the bio-crude were quantified by gas chromatography in a Shimadzu (Kyoto, Japan) GC-2010 equipped with an autosampler and a flame ionizing detector (FID). Analyses were performed in split mode (1:20) using a Select Biodiesel column (Agilent, Santa Clara, CA, USA, 15 m × 0.32 mm, 0.10 μm) and helium as the carrier gas. The injector and detector temperatures were 380 °C and 400 °C, respectively. The oven temperature program started at 50 °C and reached 180 °C at 15 °C/min, then continued to 230 °C at 7 °C/min, and finally, to 380 °C at 10 °C/min, where it stayed for 6 min.
Initially, about 50 mg of bio-crude was dissolved in 100 μL of pyridine and 50 μL of the derivatizing agent N-methyl-N-(trimethylsilyl)trifluoroacetamide) was added. The mixture was vigorously shaken and maintained at 40 °C for 20 min. Subsequently, the derivatized sample was diluted in heptane to a final concentration of approximately 1 mg/mL and sent for GC-FID analysis. Quantifications were carried out by external calibration using linoleic acid, ethyl linoleate, and soybean oil as reference standards for the determination of total free fatty acids, ethyl esters, and triacylglycerols, respectively.

2.7. Phase Envelope of the Mixture (Water + Ethanol)

To have a better understanding of the solvent mixture dynamics during the non-isothermal process of batch co-HTL reactions, a phase envelope of the mixture (water + ethanol) was built. To do so, the Peng–Robinson equation of state was used with the quadratic mixture rule, in which the binary interaction parameters between water and ethanol were obtained from the literature [35].
Saturation lines were calculated following the algorithms proposed by Michelsen and Mollerup [36] and implemented as described by Tavares et al. [37]. Critical lines for the mixture (water + ethanol) were calculated following the algorithm proposed by Michelsen and Mollerup [36].

3. Results and Discussion

3.1. Bio-Crude and Bio-Char Yields

Table 2 presents both bio-crude and bio-char yields as a function of different reaction conditions and solvent systems. The heating and cooling profiles that were used to determine SO for each reaction condition are shown in the Supplementary Materials. The contents (as weight percentages) of fatty acid ethyl esters (FAEE), free fatty acids (FFA), and triacylglycerols (TAG) in the bio-crude were determined by GC-FID and are also given in Table 2.
Table 2 demonstrates that variables such as temperature, SCB to RSO mass ratio, and reaction time have a direct influence on bio-crude yields, and this will be discussed in detail in the upcoming sections. The highest bio-char yields were obtained when RSO was absent in the reaction mixture, indicating that bio-char production is connected to the amount of sugarcane bagasse proportionally available for thermal conversion. A 16.6% bio-char was obtained in reaction 11, when only water was used as the solvent, whereas in reaction 12, the replacement of water by the water and ethanol mixture decreased the bio-char yield to 11.6%.

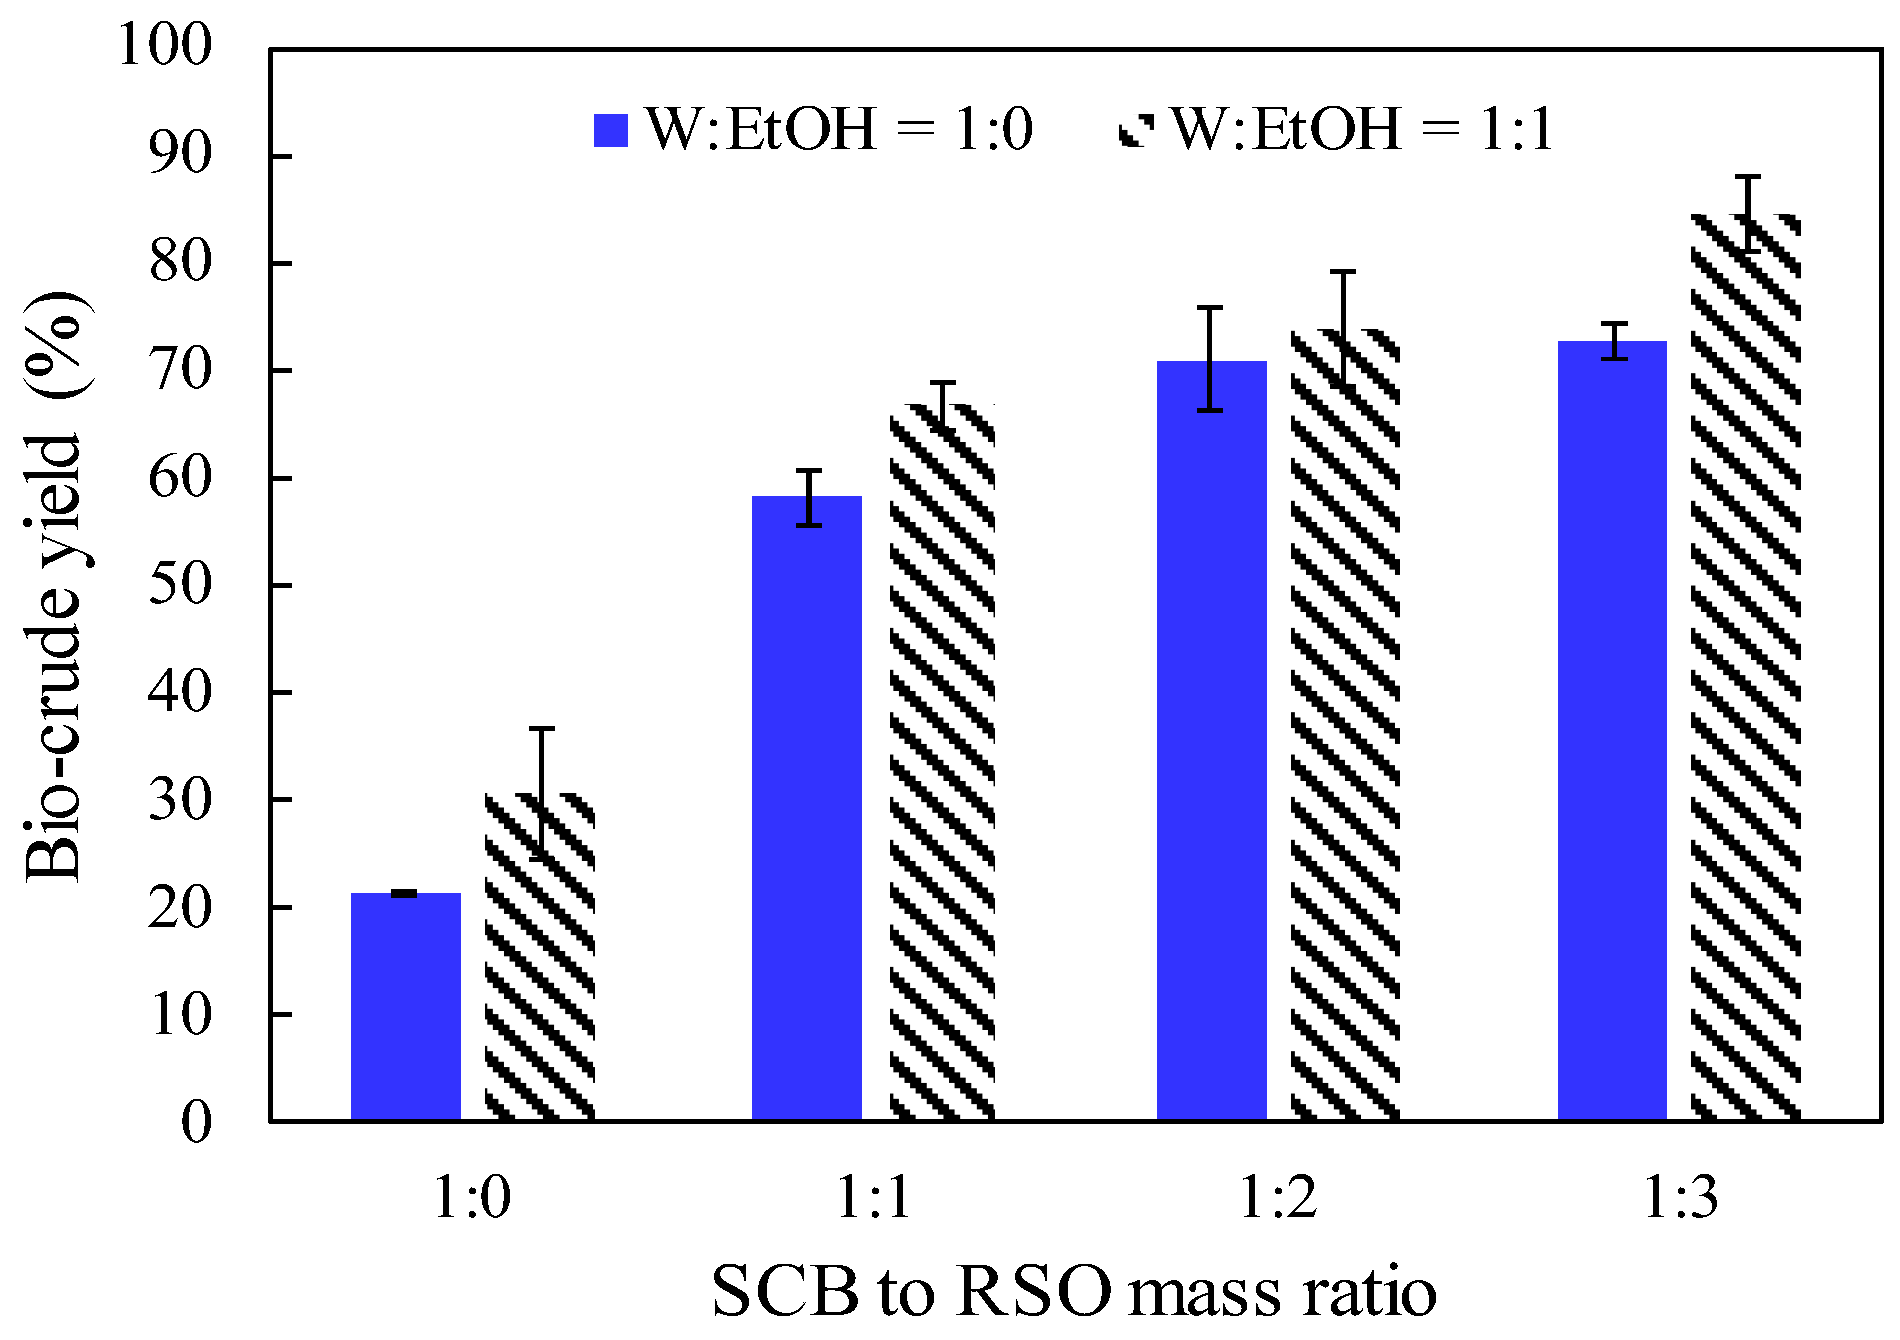
3.2. Effect of SCB to RSO Mass Ratio

Reactions were performed in the presence of water or a water and ethanol mixture at a mass ratio of 1:1. Figure 1 presents the effect of SCB to RSO mass ratio on bio-crude yields at the same setpoint temperature (275 °C), holding time at setpoint temperature (10 min), and solvents to biomass mass ratio (9:1). Regardless of the solvent used, higher RSO additions led to higher bio-crude yields. By contrast, reactions performed without RSO (reactions 11 and 12) resulted in two out of the three lowest bio-crude yields (21.3% and 30.5%, respectively). When the same conditions were applied to reactions with SCB to RSO mass ratio of 1:1 (reactions 8 and 10), bio-crude yields increased to 58.1% and 66.6%, respectively. Forero et al. [2] performed HTL reactions using SCB in the presence of different solvents without RSO addition. The maximum bio-crude yield was 66.1%, which confirms the positive impact of RSO on reaction performance.
When pure water is used as a solvent, hydrolysis of triacylglycerols takes place forming free fatty acids plus diacylglycerols and monoacylglycerols. However, when the solvent is a water and ethanol mixture, other reactions occur along with hydrolysis, such as transesterification of triacylglycerols and esterification of free fatty acids, producing fatty acid ethyl esters, diacylglycerols, monoacylglycerols, and glycerol. Since acylglycerols, free fatty acids, and fatty acid ethyl esters have low polarity, they remain in the organic phase, enhancing the bio-crude yield.
The highest yield of 84.5% was obtained for an SCB to RSO mass ratio of 1:3 using ethanol and water as solvents (reaction 5), indicating that this is the most suitable solvent for the co-HTL system. When pure water was used as the solvent, the highest yield (72.6%, reaction 1) was also obtained for a SCB to RSO mass ratio of 1:3. Analyses of the bio-crude compositions by GC-FID (see Table 2) revealed that the FFA content was much higher for reactions performed with pure water, while the FAEE content was higher when the mixture (water + ethanol) was used.
The presence of ethanol during co-HTCL reactions may also prevent the occurrence of undesired reactions, such as polymerization, and contributes to a lower viscosity and higher quality of the bio-crude, minimizing degradation, viscosity, instability through time, and coke formation [38].

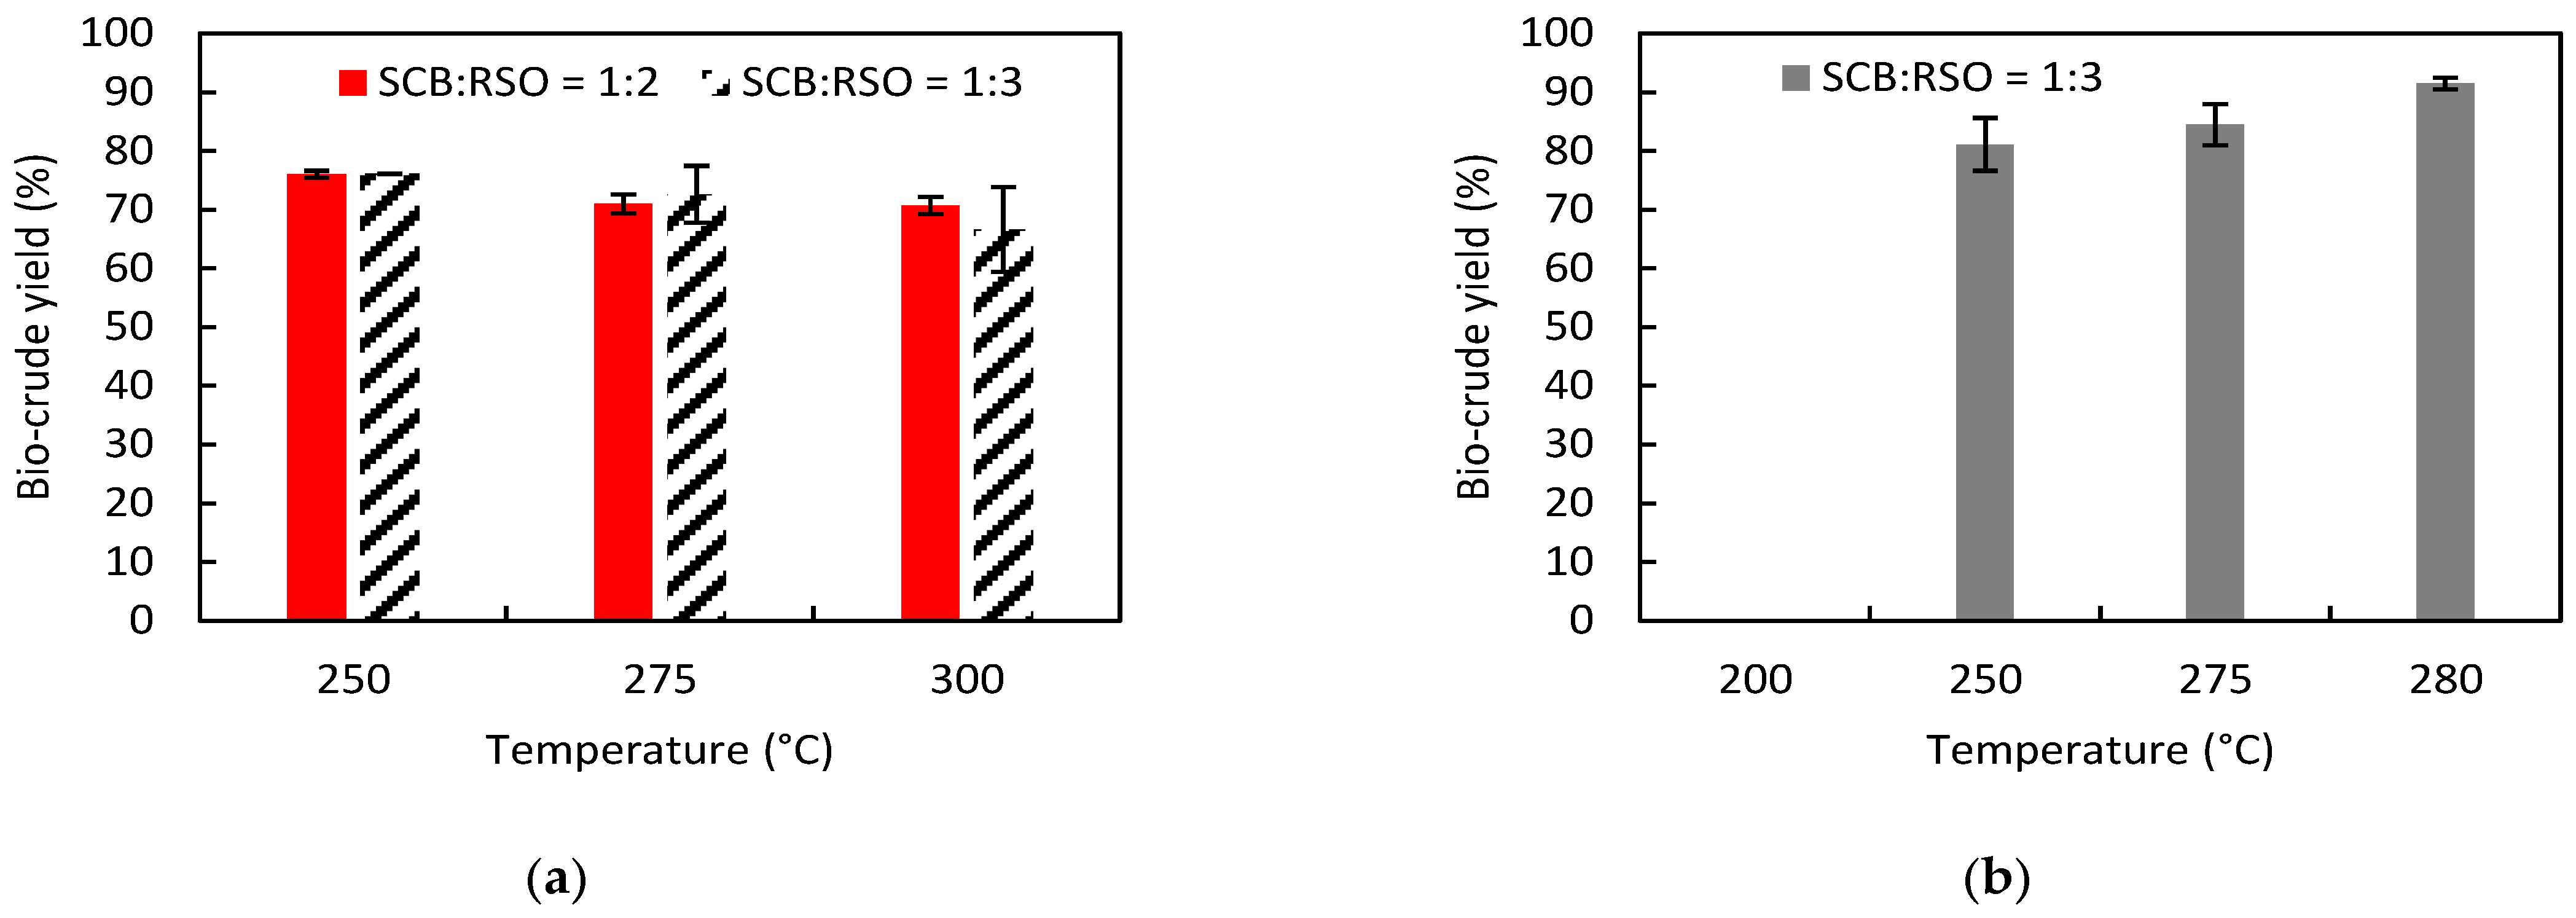
3.3. Effect of Temperature on Bio-Crude Yield

The effect of temperature on bio-crude yields can be observed in Figure 2 for reactions performed with SCB to RSO mass ratios of 1:2 and 1:3 and water to ethanol mass ratios of 1:0 (Figure 2a) and 1:1 (Figure 2b). Other reaction conditions involved a holding time of 10 min and a solvents to biomasses mass ratio of 9:1.
The reactions using pure water (Figure 2a) showed a decrease in bio-crude yields as the temperature increased for both SCB to RSO mass ratios (1:2 and 1:3). Therefore, the highest yields of 76.1% (reaction 2) and 76.0% (reaction 6) were obtained at 250 °C for SCB:RSO ratios of 1:3 and 1:2, respectively. For reactions using pure water at higher temperatures, some compounds present in the SCB might have dissolved and were not recovered in the organic phase (DCM-rich phase), justifying the observed decrease in bio-crude yields [39].
Figure 2b shows that, for reactions carried out using the solvent mixture (water + ethanol), higher bio-crude yields were obtained at higher temperatures (e.g., 91.5% at 280 °C in reaction 14). For all temperatures studied, the bio-crude yield was higher when the solvent used was the mixture of ethanol and water, indicating once again that the use of such a mixture may be more interesting for co-HTL reactions rather than pure water.
It is worth mentioning that both bio-crude and bio-char yields after reaction 20 were zero because the resulting solids resembled untreated SCB. This also indicates that the reaction temperature was too low for HTL which, according to our data, required a minimum setpoint temperature of 250 °C.

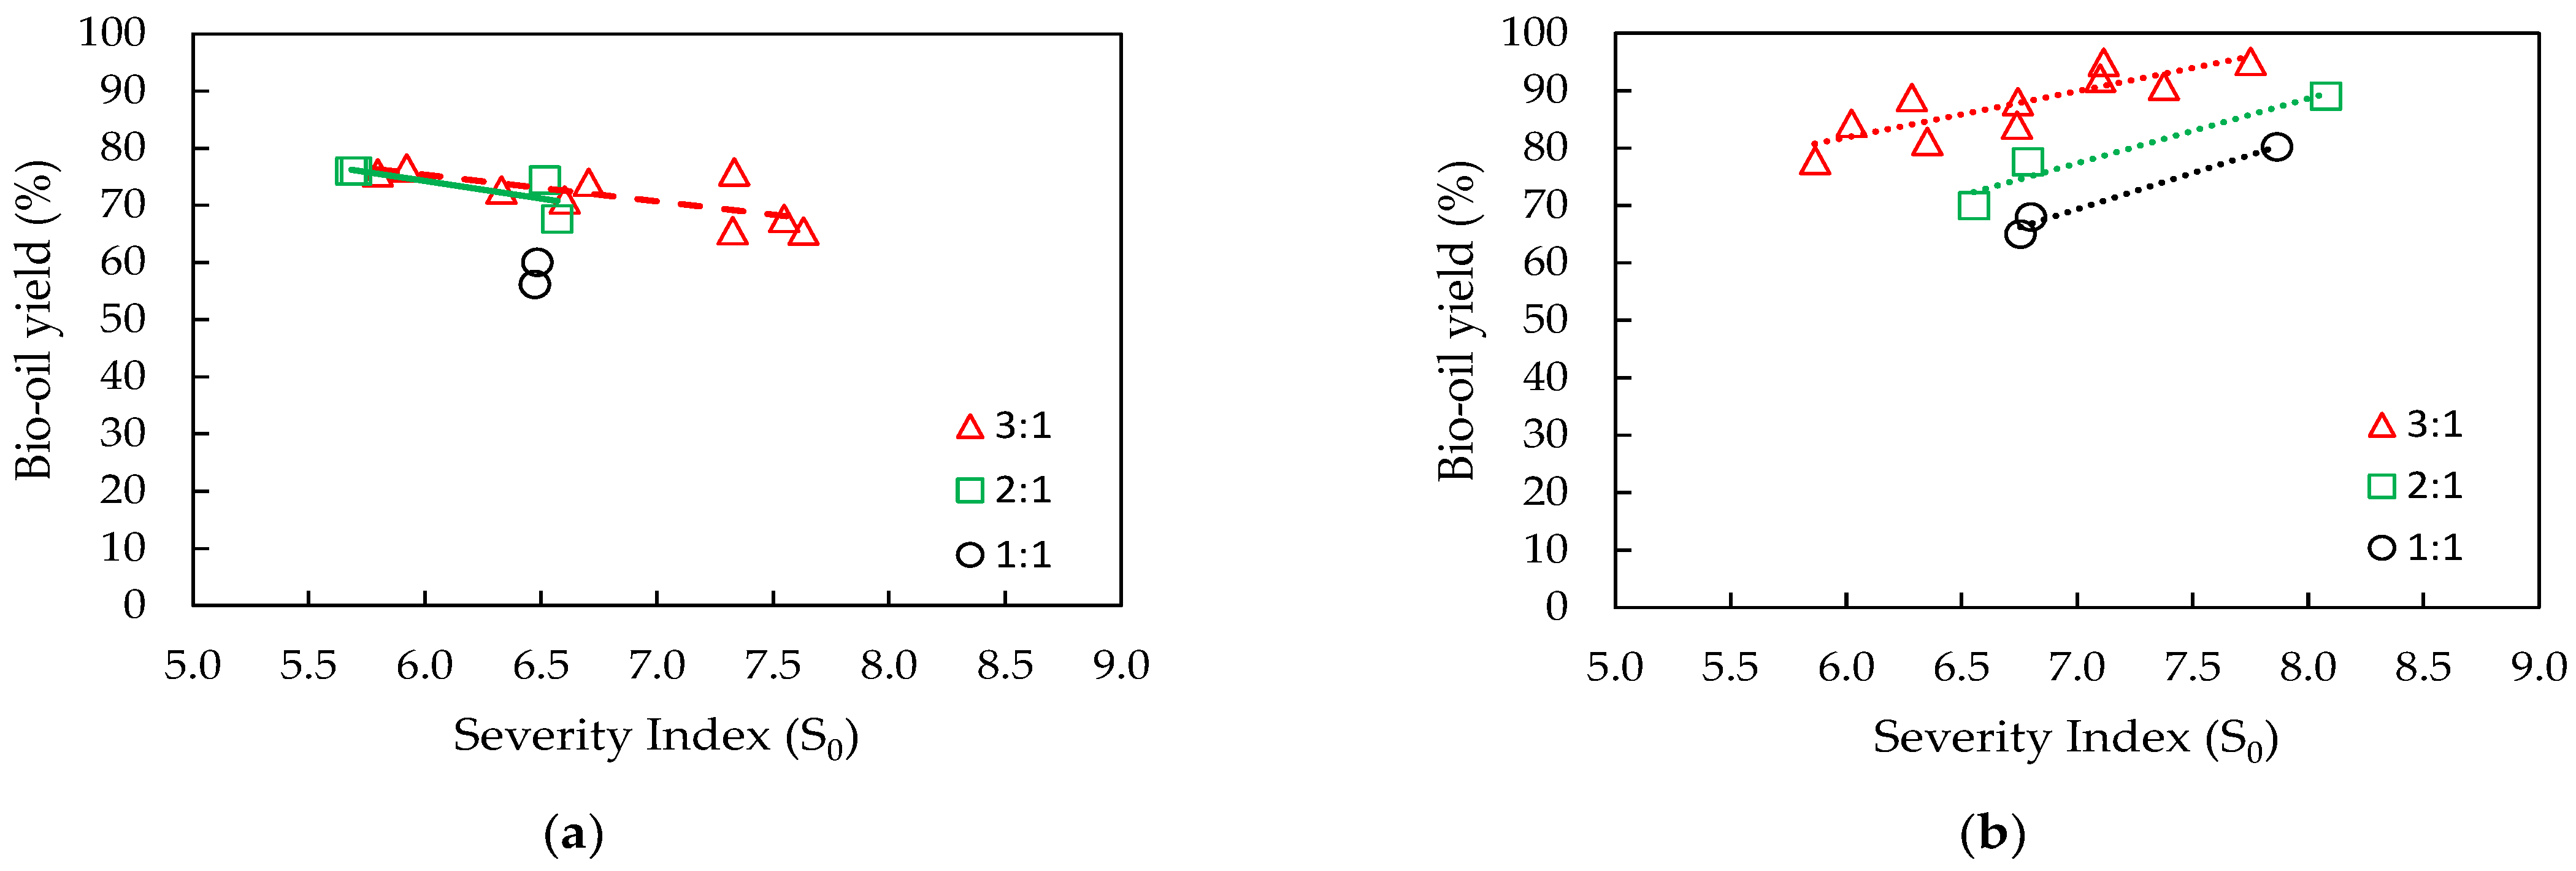
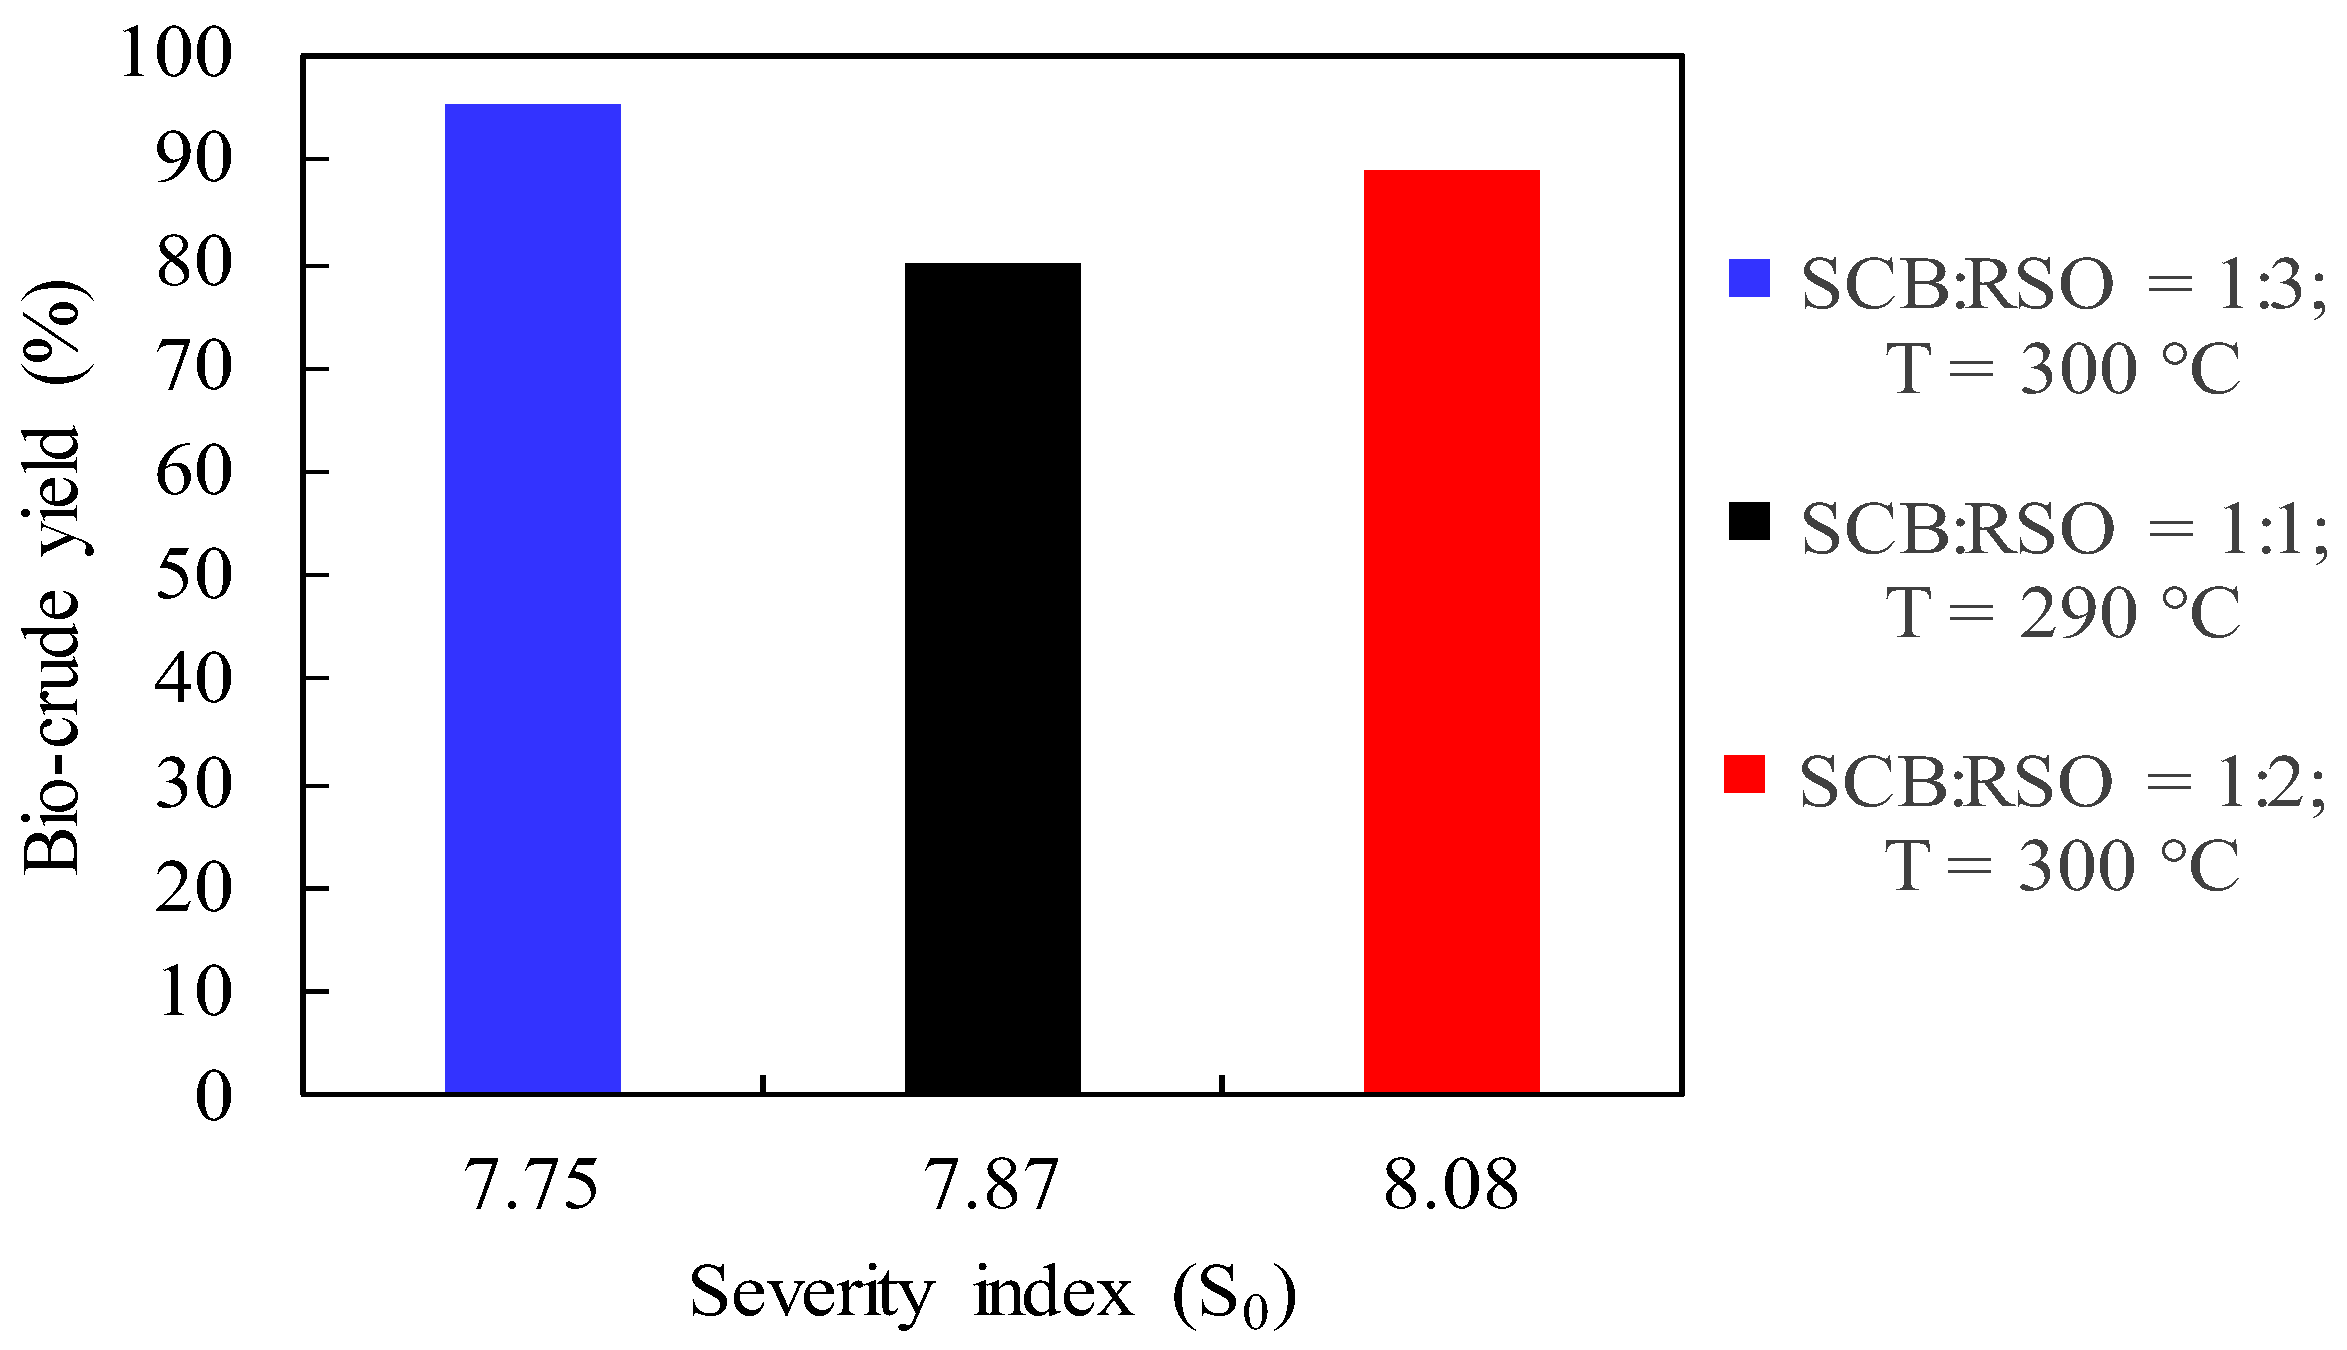
3.4. Effect of Severity Index in Bio-Crude Yield

The combined effect of temperature and reaction time on bio-crude yield was also studied through the severity index. Reactions with different holding times at the same temperature were performed to study the effect of reaction time on bio-crude yield. The severity indices were obtained from the heating and cooling profiles presented in the Supplementary Materials, using the methodology described in Section 2.4. Figure 3a,b shows severity indices that were calculated for reactions using water and the water and ethanol mixture as solvents, respectively.
Figure 3a shows that high severity indices led to low bio-crude yields, meaning that they are inversely proportional. By contrast, when the water and ethanol mixture was used as the solvent (Figure 3b), this trend was reversed, with severity indices and bio-crude yields becoming directly proportional.
Some reactions (reactions 2, 4, 6, and 20) resulted in a bio-crude with higher TAG concentrations (above 50 wt.%) and few to no FAEE because their severity indices were relatively low (below 5.94), indicating that the reaction process was inefficient. Reactions 2 and 6 were performed at 250 °C using pure water as the solvent, while reactions 4 and 20 were carried out at 200 °C and 250 °C, respectively, using the water and ethanol mixture as the solvent.
Other reactions (reactions 14, 15, 17, and 19), performed with the water and ethanol mixture as the solvent, presented higher FAEE contents (above 27 wt.%) at temperatures above 275 °C. These samples were generated at the highest severity indices (above 7.11), indicating that if the combination of setpoint temperature and time at the setpoint temperature is appropriate, high bio-crude yields and high FAEE contents in bio-crude can be achieved.
To summarize the severity index analysis, Figure 4 presents the bio-crude yields that were obtained at the highest severity indices (reactions 15, 18, and 19) used in this study. These reactions were performed using the water and ethanol mixture as the solvent and a solvent to biomass (SCB + RSO) mass ratio of 9:1. Among these three reaction conditions, it was not possible to infer a monotonic behavior: the highest bio-crude yield was obtained for the lowest severity index, but the highest severity index did not result in the lowest bio-crude yield. The fact that these reactions were not performed at the same temperature should not be an issue because the severity index adjusts the variables temperature and reaction time. On the other hand, it was evident that the SCB to RSO mass ratio has an impact on bio-crude yield and must be considered.

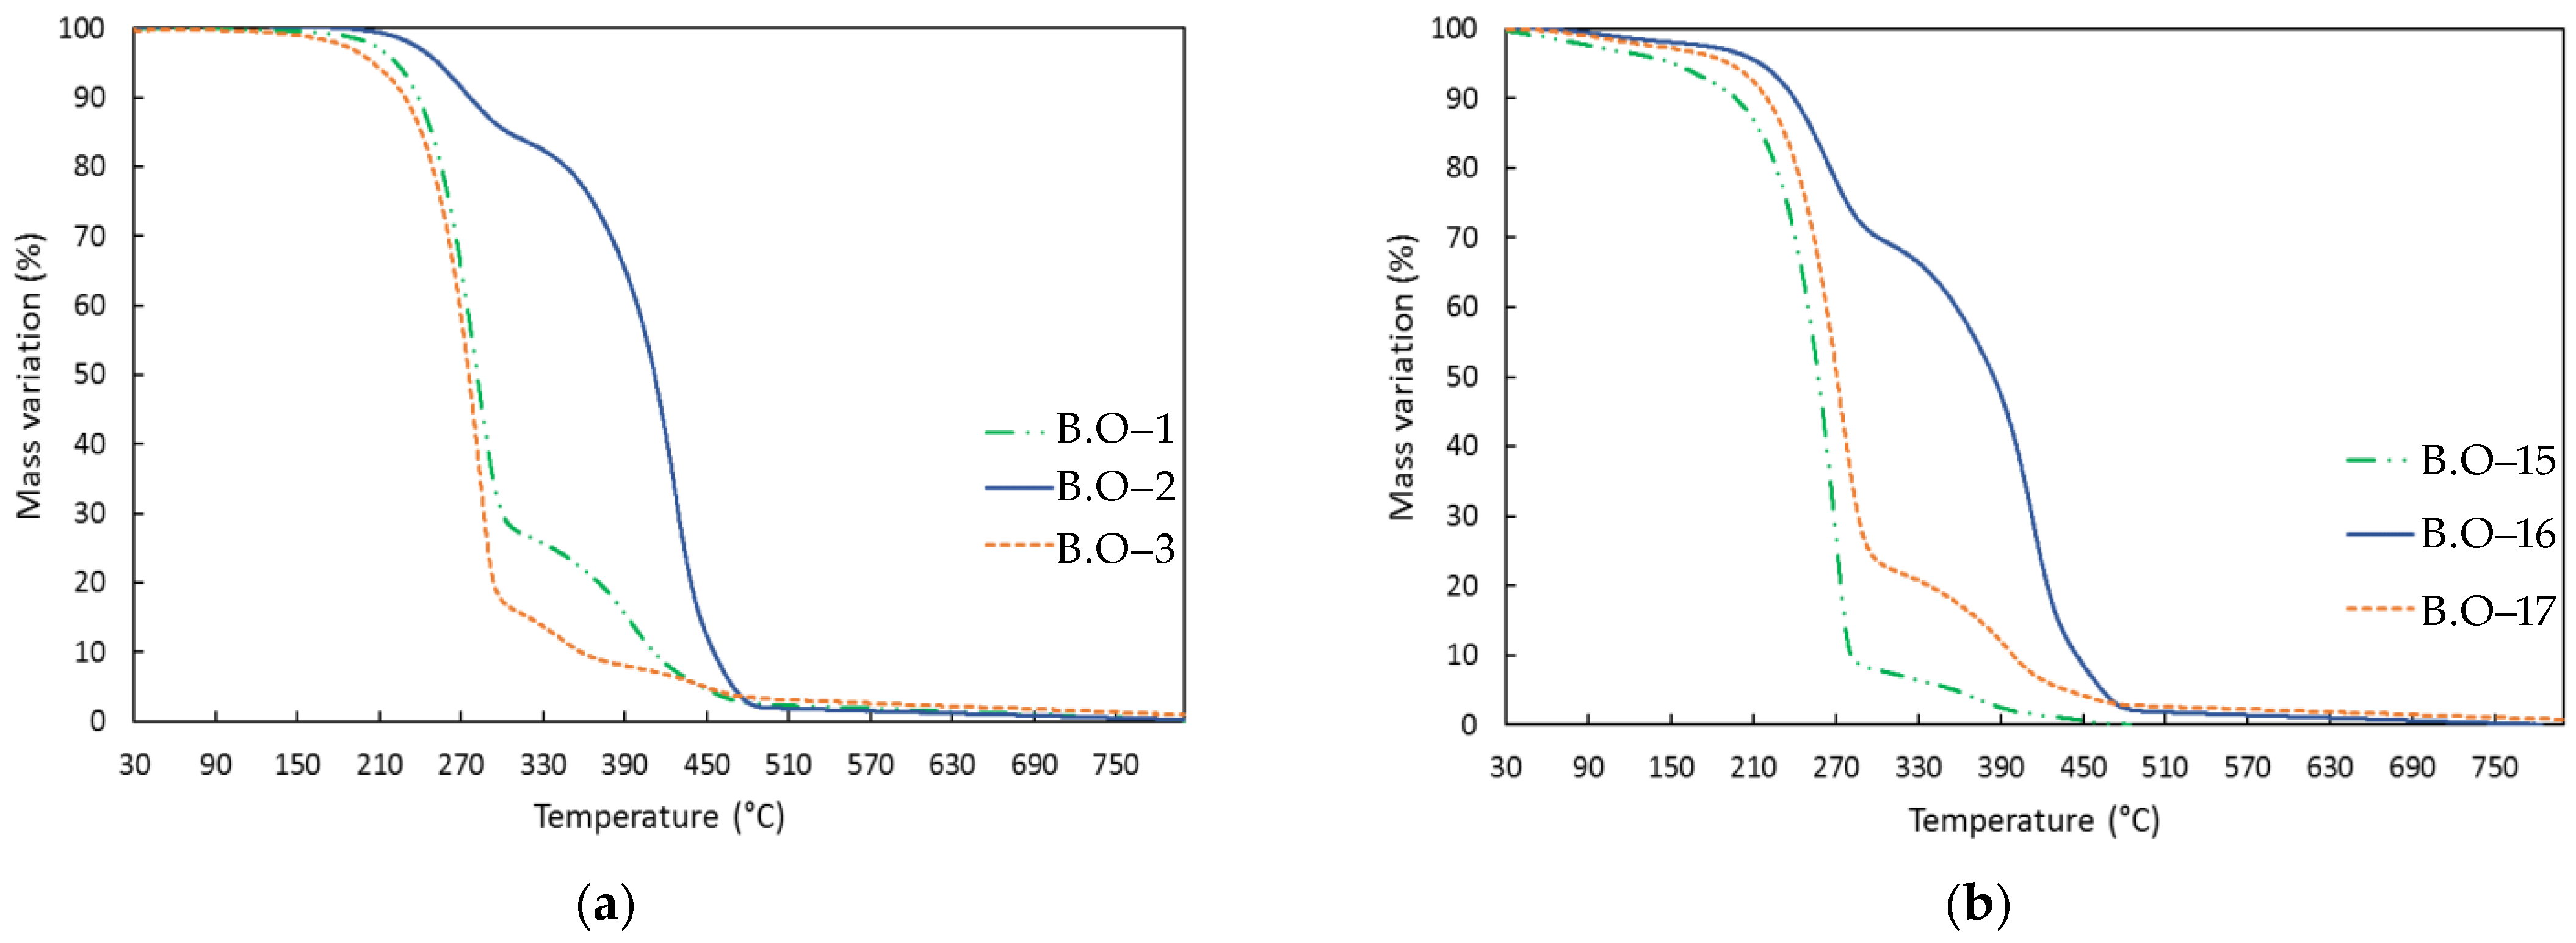
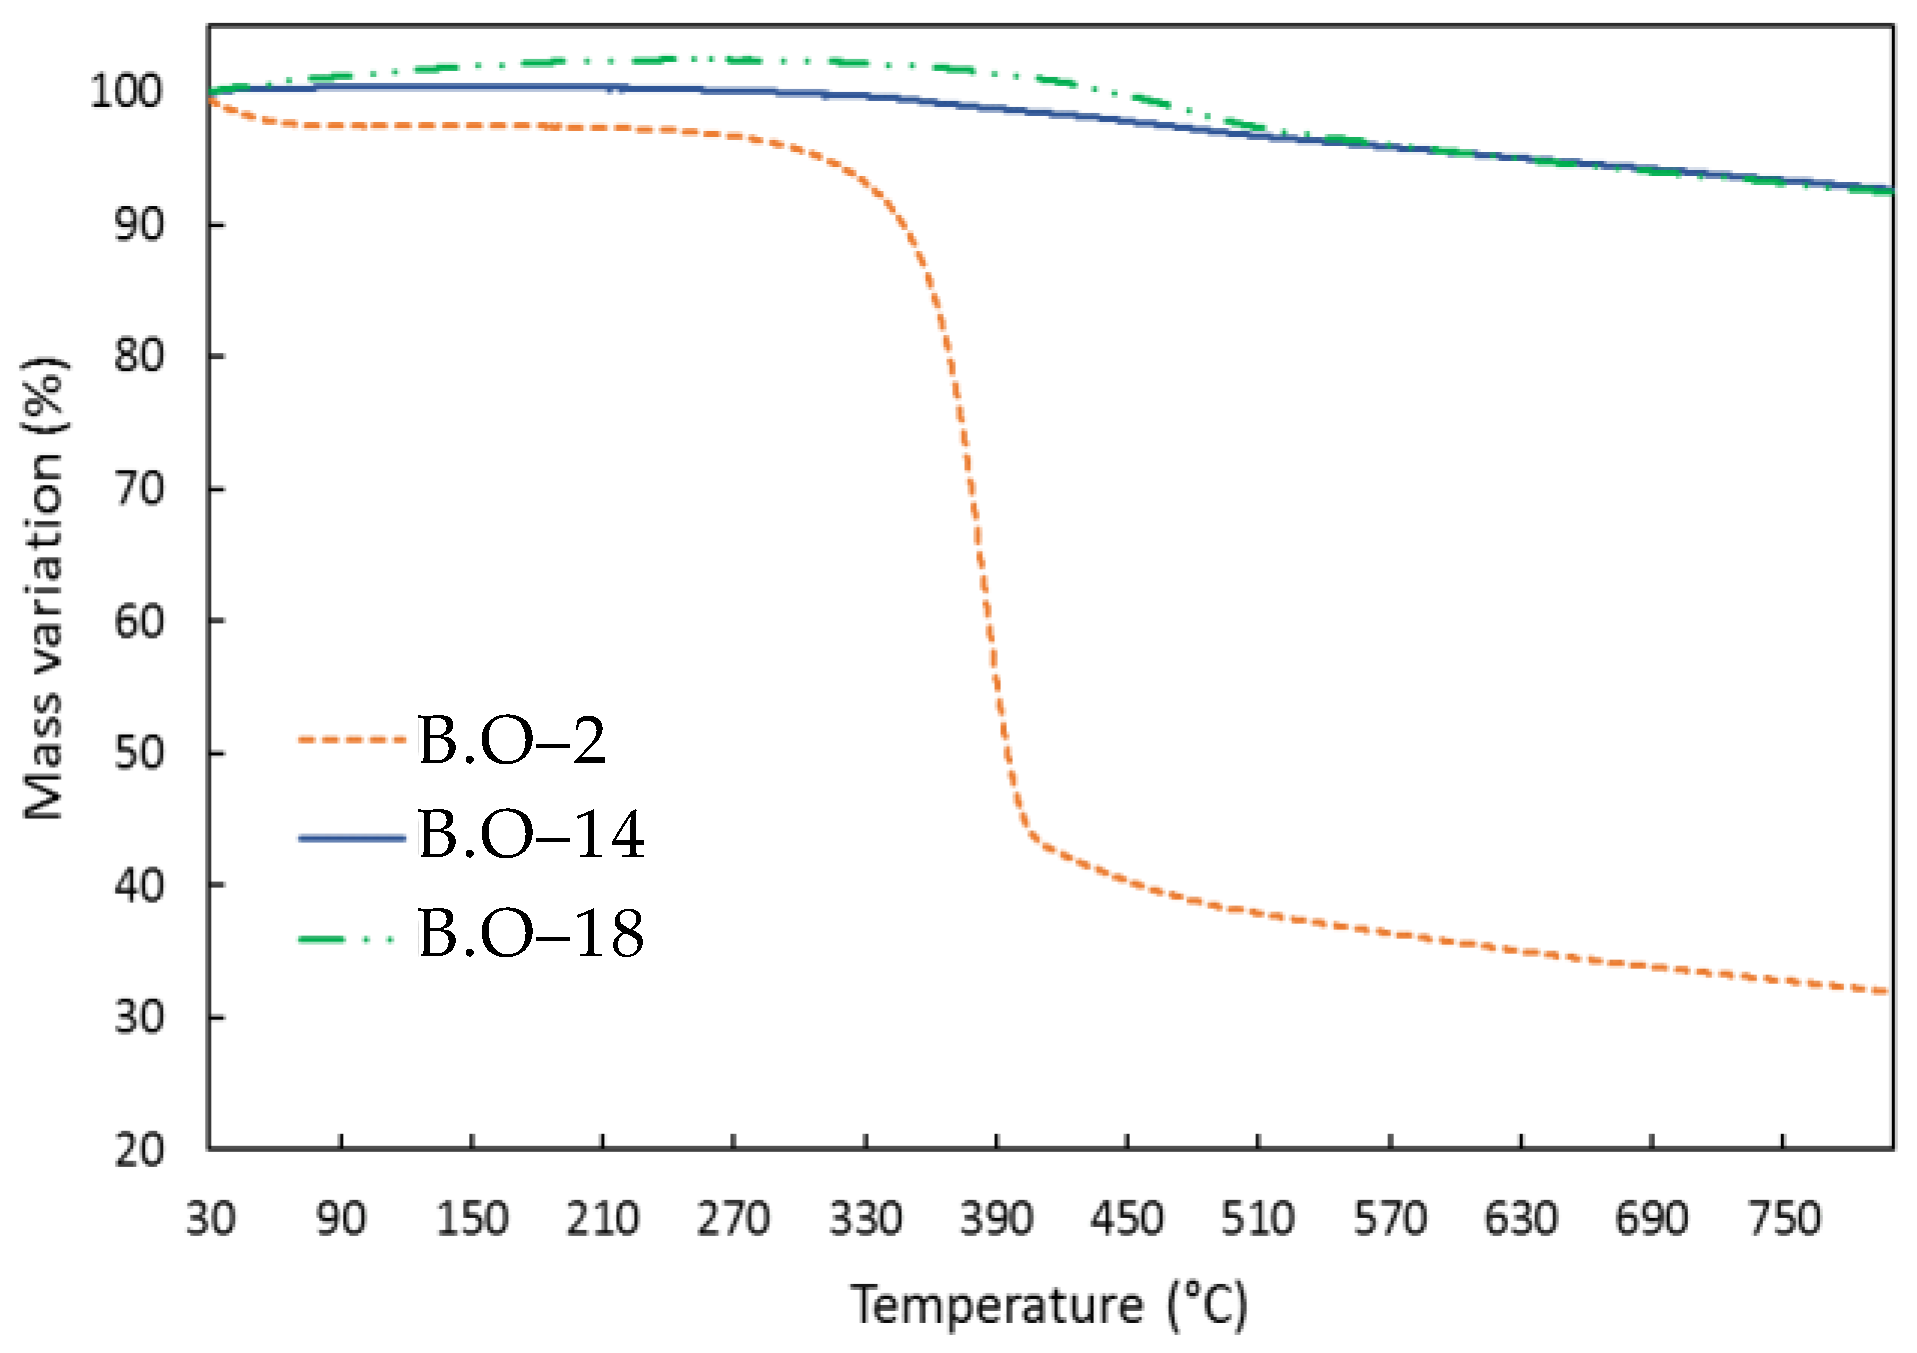
3.5. TGA Analysis of Bio-Crude and Bio-Char

Figure 5a,b shows the TGA profiles for bio-crude samples produced with pure water and with the water and ethanol mixture, respectively, with a solvent to biomass (SCB + RSO) mass ratio of 9:1.
Figure 5a,b reveal similarities among the TGA profiles of all bio-crude samples: the first mass loss event has onset temperatures of 220–240 °C, the second mass loss event has onset temperatures 360–390 °C, and the total mass loss reached almost 100% after 450–500 °C. On the other hand, Figure 5b shows small mass losses at temperatures below 100 °C, demonstrating that solvents still might be present in the bio-crudes obtained using the water and ethanol mixture.
A similar mass loss profile was also observed for samples obtained at the same temperatures, whether ethanol was present in the reaction media or not (Figure 5a,b). In this sense, bio-crude samples obtained at 250 °C (reactions 2 and 16) and at 275 °C (reactions 1 and 17) had two well-defined mass loss events, while for bio-crude samples obtained at 300 °C (reactions 3 and 15), only the first mass loss was well-defined. On the other hand, the use of pure water or water plus ethanol led to different bio-crude compositions (Table 2), which may partly explain the differences in mass loss among samples obtained at the same reaction temperature.
The first mass loss event can be attributed mainly to the evaporation of free fatty acids and fatty acid ethyl esters [40,41], while the second mass loss event can be primarily attributed to the evaporation of acylglycerols [42]. It is also important to mention that these bio-crude samples contained light and heavy fractions (the former obtained after separation of the liquid phase using DCM and the latter obtained by extraction of the solid phase with ethanol). Heavy bio-crudes tend to present TGA profiles similar to those of petroleum-based phenolic resins and bio-resins produced by direct liquefaction of lignocellulosic materials [43,44].
Figure 6 shows the TGA for bio-chars produced with pure water and a water and ethanol mixture at different temperatures. There was a great difference in mass loss profiles when different solvents were used. Bio-char sample 2 presented a sharp mass loss starting around 350 °C, which led to a final mass loss close to 60%, indicating bad thermal stability. It is important to mention that, at 250 °C, the reaction was possibly incomplete because the mass loss obtained by TGA was very similar to the results of other authors for SCB [1,45]. For bio-char samples 14 and 18, the mass loss was minimal, indicating good thermal stability [29].

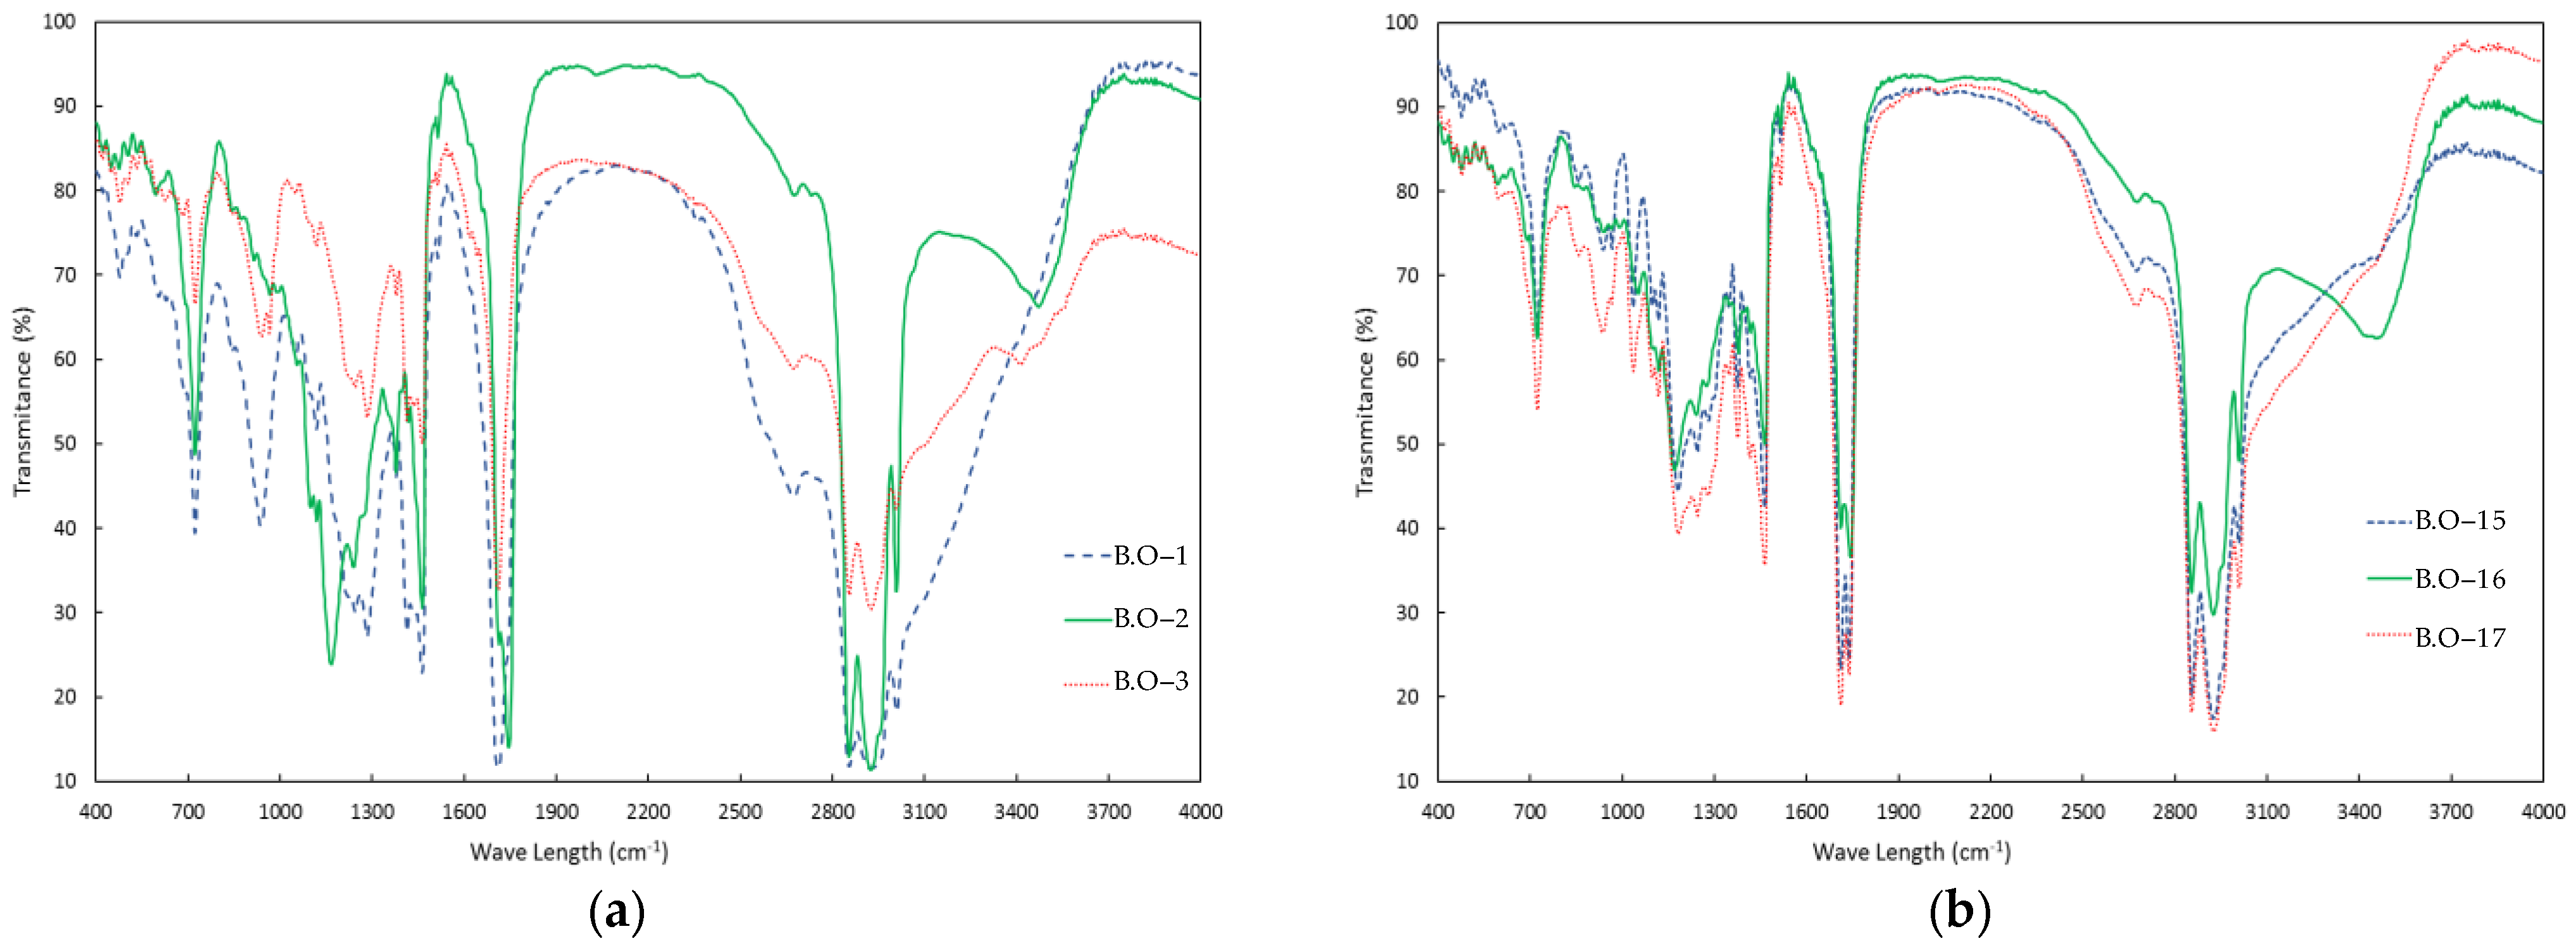
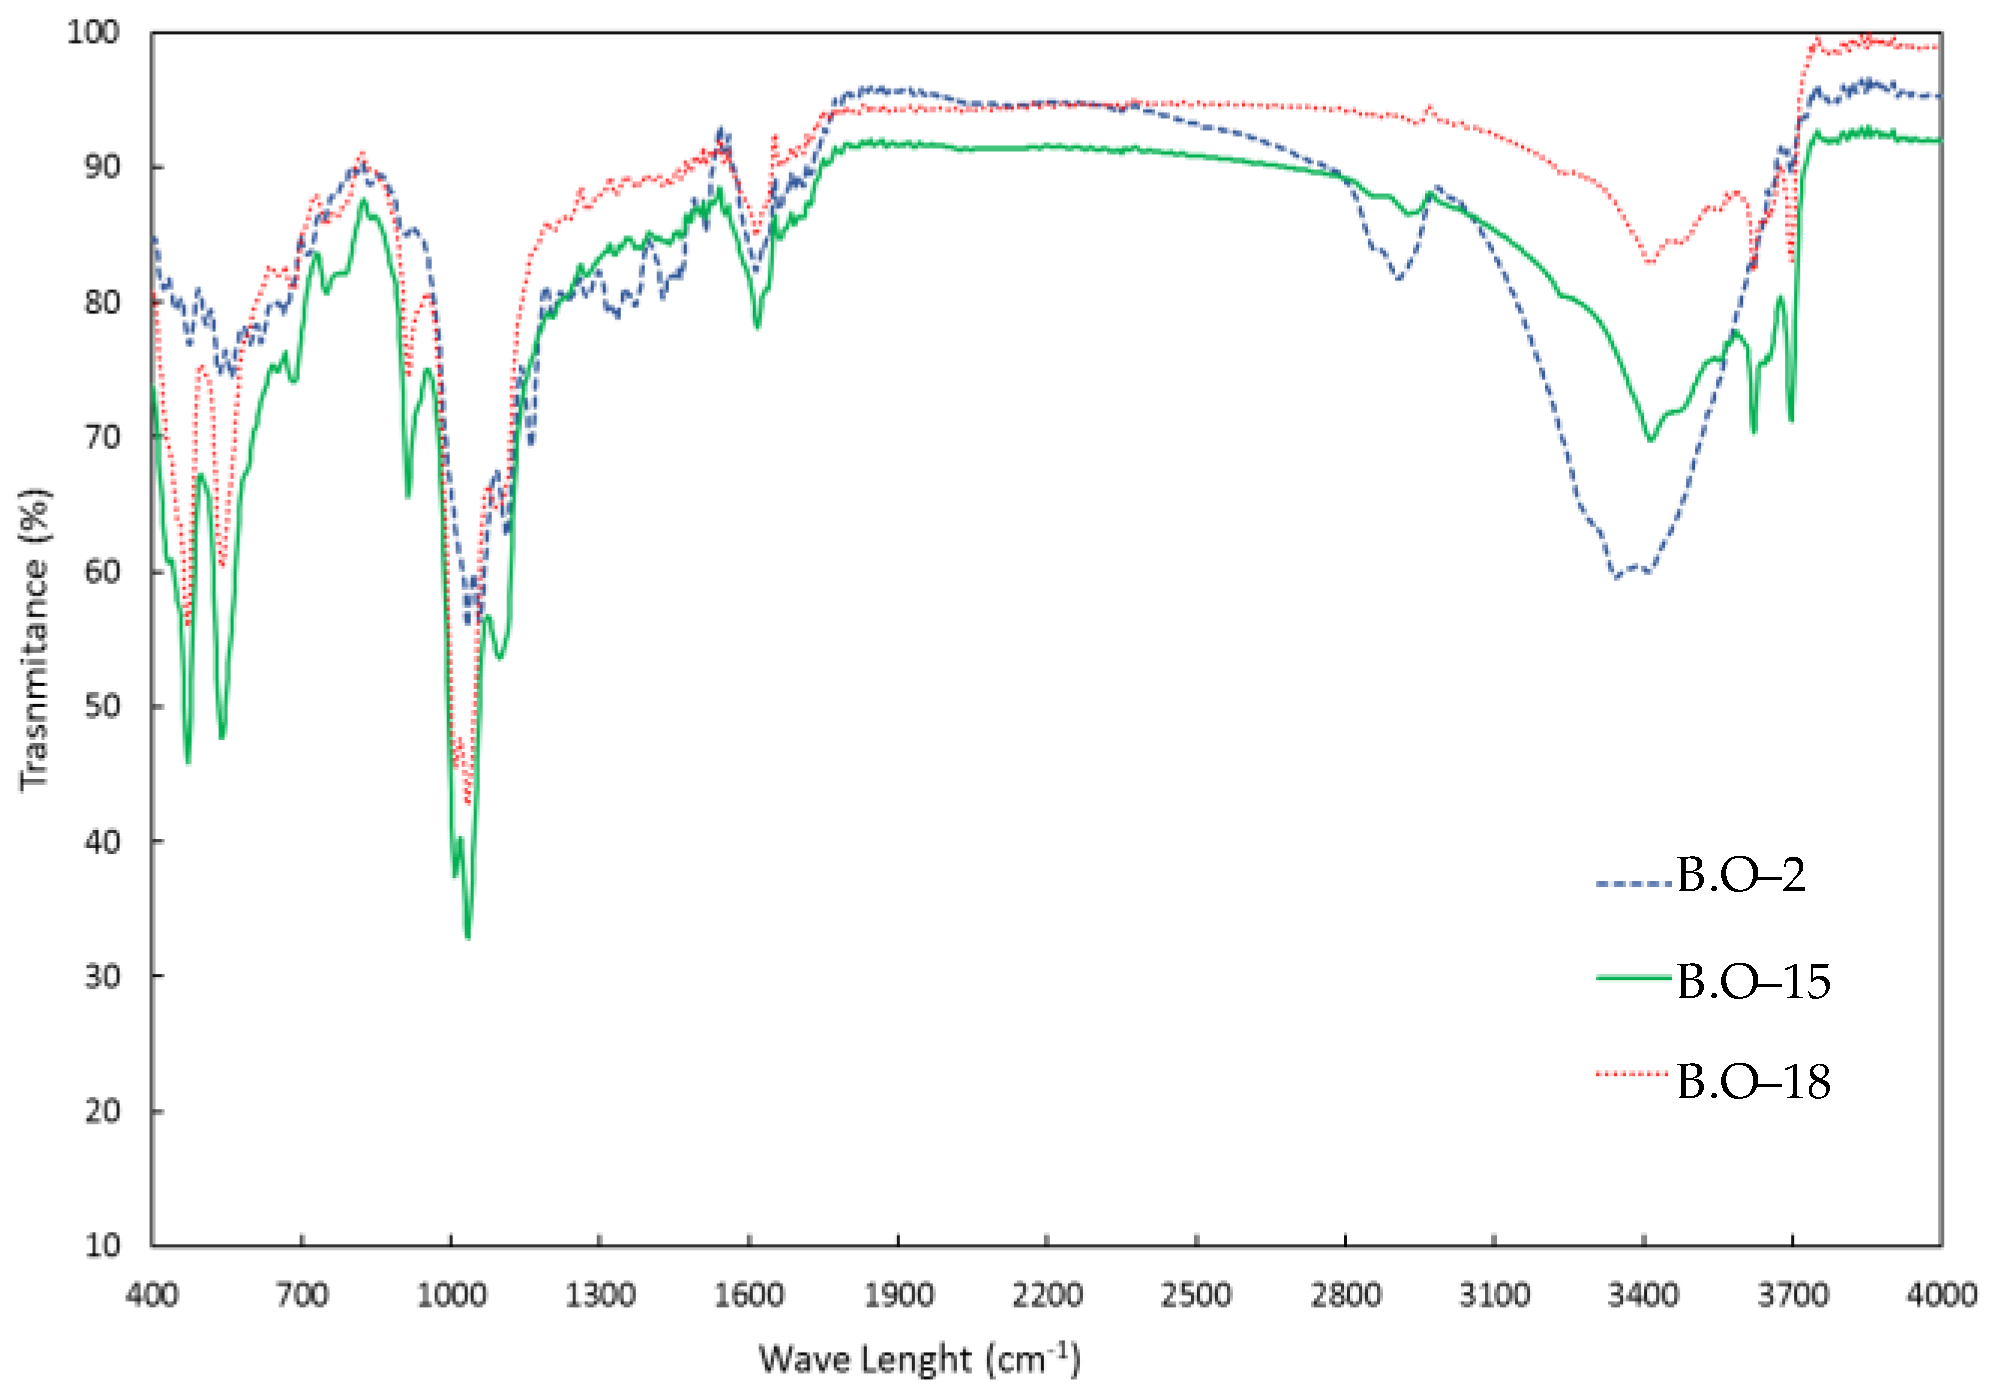
3.6. FTIR Analysis of Bio-Crude and Bio-Char

The FTIR spectra of bio-crudes obtained using pure water and water plus ethanol are presented in Figure 7a,b, respectively, while those for bio-char samples are given in Figure 8. Samples were chosen to compare products derived from different reactional conditions.
In Figure 7a,b, bands at 1000–1325 cm−1 are attributed to the C–OH, C–O–C, and C–O stretching, and at 1325–1450 cm−1 to the C–O stretching of glycerol moieties present in acylglycerols. Bands at 1600–1900 cm−1 correspond to the C=O stretching of carbonylated compounds, indicating that the bio-crudes may have aldehydes, carboxylic acids, esters, and ketones in their composition. Bands ranging from 1450 to 1600 cm−1, related to C=C stretching, indicate the presence of alkyl aromatics and aliphatics in bio-crudes. Bands between 2750 and 3100 cm−1 are related to the C–H stretching of CH, CH2, and CH3, while the broad band at 3250–3700 cm−1 is related to the O–H stretching of hydroxylated functional groups such as phenols and alcohols, but it may also be due to the presence of moisture [1,46].
Samples 1 and 3 presented very similar FTIR spectra, while sample 2 presented some differences, especially in the 1100–1500 cm−1 wavenumber range. According to Table 2, the main difference between samples 1 and 3 and sample 2 is the TAG content, which is confirmed by the differences observed by FTIR in Figure 7a. Likewise, Figure 7b shows similar spectra for samples 15, 16, and 17, indicating similar compositions as already described in Table 2.
The FTIR spectra of bio-char samples 15 and 18 were also very similar, while sample 2, obtained at a lower temperature, presented a spectrum more closely related to untreated SCB (Figure 8). This confirms once more that 250 °C was too low for HTL.

3.7. HHV Analysis of Bio-Crude and Bio-Char Samples

Table 3 presents the higher heating value (HHV) of bio-crudes and bio-chars, as well as the SCB and RSO used in co-HTL. In general, HHV values were above 37 MJ/kg and are below 16 MJ/kg for bio-crudes and bio-chars, respectively. Among the bio-char samples, the lowest HHV value (8.3 MJ/kg) was related to reaction 14, which provided high contents of both FAEE and FFA, indicating a considerable conversion of biomasses, especially SCB, into bio-crude. The HHV value of the bio-crude is almost four times higher than that of SCB.
Values of HHV obtained in the present study are in agreement with similar studies presented in the literature. Forero et al. [2] produced bio-crude from SCB in HTL reactions using water, a mixture of water and ethanol, and a mixture of water and glycerol, reaching HHV values from 26.58 to 34.57 MJ/kg. Zhang et al. [9] used rice husks in the presence of residual frying oil in co-HTL reactions having water and glycerol as solvents and the bio-crudes obtained presented HHV values ranging from 28.4 to 39.07 MJ/kg.

3.8. Analysis of the Reaction Projection in the Phase Envelope of the Mixture (Water + Ethanol)

The phase envelopes for pure water, pure ethanol, and a 1:1 (mass ratio) binary mixture (water + ethanol), which was used in the co-HTL reactions, are presented in the Supplementary Materials. From the phase envelopes, it is possible to observe that the temperature–pressure profiles of the reactions correspond to the line of pure water vapor when using water as the solvent and are consistent with the liquid–vapor envelope for the binary mixture (water + ethanol) when using such a mixture in the reactions. In a general manner, the reactions performed in this work were projected in the saturation region of the solvents involved in the process. However, for reaction 15, both temperature and pressure reached the supercritical region of the (water + ethanol) mixture, and this may explain why this reaction provided a higher bio-crude yield.
The Supplementary Materials also presents a projection of temperature and pressure curves overlapping the phase envelope of the mixture (water + ethanol), which provides a view of the non-isothermal path of the reactions, i.e., heating and cooling of the closed-vessel reactor, in which the heating and cooling profiles follow the bubble point and dew point lines, respectively. This indicates that the system does not suffer from overheating and reiterates that such a system must be monitored using a non-isothermal parameter, such as the severity index.

3.9. Prospects of Bio-Crude Production Processes

The bio-crude yields obtained in this work presented similar behaviors to those presented in the literature [9,27]. When solely lignocellulosic material is used in the reactions, HTL provides lower bio-crude yields when compared to co-HTL reactions performed also in the presence of RSO, demonstrating a synergistic effect caused by the presence of the RSO. Moreover, the HHV also presented the same order of magnitude as the higher values presented by other authors [9,26]. From the standpoint of the current climate crisis, it is critical to develop alternative technologies to replace fossil fuels with biofuels. Thus, the obtention of bio-crude by hydrothermal co-liquefaction (co-HTL) of SCB and RSO has been shown to be a promising approach, since the HHV obtained indicates their potential use to produce biofuels.
Research on HTL and co-HTL reactions is relatively new, and the technical feasibility is the first step for a proper scaling up of such processes. In this sense, the results reported in this work, obtained using a 300 mL batch reactor, are useful to understand the behavior of such reactions. The following steps are related to the reactor’s design itself, to ensure both uniform heating and mixing of the reaction media. Moreover, the reactor’s thickness must be evaluated to allow its operation at high pressures. Other steps should also include the evaluation of operating these reactors in a continuous mode and the selection of a proper thermal fluid capable of operating at high temperatures. It is also important to bear in mind that an economic analysis should also be performed at all steps. As it is evident from this brief discussion, many challenges still must be solved. Nonetheless, the results presented in this work are the first steps towards the development of bio-crude production processes using residual feedstock at an industrial scale.

4. Conclusions

The present work contributes to the study of co-HTL reactions with an abundant biomass feedstock (sugarcane bagasse, SCB) in the presence of a renewable lipid source that could cause environmental problems if poorly disposed. The presence of residual soybean oil (RSO) in the co-HTL reactions had a positive impact on bio-crude yield. Furthermore, the mixture (water + ethanol) was more advantageous for the obtainment of higher bio-crude yields in HTL and co-HTL reactions.
The severity index (S0), a parameter that combines the effects of temperature and reaction time, was used in this work to evaluate the non-isothermal conditions of the reaction system. For co-HTL reactions performed with the mixture (water + ethanol) as the solvent, higher severity indices generally resulted in higher bio-crude yields, given that appropriate amounts of RSO were used. An analysis of the (water + ethanol) phase envelope indicated that the operation of co-HTL reactions above or close to the critical point of the solvent mixture might be necessary to obtain higher bio-crude yields.
Characterization of bio-crude samples, which included TGA, FTIR, HHV, and GC-FID, indicated that the samples presented high HHVs, a favorable mass loss profile, and the presence of bonds and functional groups that are typical of bio-crudes in general. The co-HTL of SCB in the presence of RSO, along with the use of a binary solvent system and the ancillary separation methods, was a promising procedure to produce bio-crude at high yields and high quality.

Supplementary Materials

The following supporting information can be downloaded at: https://www.mdpi.com/article/10.3390/pr12071371/s1: Figure S1. Heating and pressure profiles of a 10 min reaction course using the water and ethanol mixture as solvents; Figure S2. Heating and pressure profile of a 10 min reaction course using water as solvent; Figure S3. Heating and pressure profiles of 50 and 60 min reaction courses using water as solvent; Figure S4. Heating and pressure profile of a 120 min reaction course using water as solvent; Figure S5. Phase envelope for the reactional system of interest: lines represent the saturation line for the pure components of water and ethanol. Open symbols represent the maximum coordinates of temperature and pressure that were reached during the experiments with pure water (blue triangles) and with the water and ethanol mixture (black squares). The crosses represent the critical points of the pure components (blue cross: water, and red cross: ethanol). The dotted green line represents the critical line of the water and ethanol mixture, calculated with EoS-PR; Figure S6. Phase envelope for the water and ethanol system with a projection of the heating and cooling curves of the reactional system.

Author Contributions

Conceptualization, M.V.d.O. and M.L.C.; methodology, M.V.d.O., M.P., F.H. and M.L.C.; formal analysis, M.V.d.O. and F.H.; investigation, M.V.d.O., M.P. and F.H.; resources, M.L.C.; data curation, M.V.d.O., F.A.P.V., L.R.S.K., L.P.R. and M.L.C.; writing—original draft preparation, M.V.d.O., L.R.S.K. and F.A.P.V.; writing—review and editing, L.P.R. and M.L.C.; supervision, M.L.C.; project administration, M.L.C.; funding acquisition, M.L.C. and L.P.R. All authors have read and agreed to the published version of the manuscript.

Funding

This research was funded by Fundação Araucária—NAPI-HCR, grant number 02/2021, and CNPq, grant number 405732/2022-8.

Data Availability Statement

The original contributions presented in the study are included in the article/Supplementary Materials, further inquiries can be directed to the corresponding author.

Acknowledgments

The authors would like to acknowledge Fundação Araucária and NAPI for the support of this project. M.L.C. and F.A.P.V. thank CNPq for the financial support and the scholarships Proc. Num. 310038/2020-0 and 306739/2022-4).

Conflicts of Interest

The authors declare no conflicts of interest.

References

  1. Baloch, H.A.; Nizamuddin, S.; Siddiqui, M.T.H.; Mubarak, N.M.; Dumbre, D.K.; Srinivasan, M.P.; Griffin, G.J. Sub-Supercritical Liquefaction of Sugarcane Bagasse for Production of Bio-Oil and Char: Effect of Two Solvents. J. Environ. Chem. Eng. 2018, 6, 6589–6601. [Google Scholar] [CrossRef]
  2. Forero, J.A.J.; Tran, T.H.T.; Tana, T.; Baker, A.; Beltramini, J.; Doherty, W.O.S.; Moghaddam, L. Hydrothermal Liquefaction of Sugarcane Bagasse to Bio-Oils: Effect of Liquefaction Solvents on Bio-Oil Stability. Fuel 2022, 312, 122793. [Google Scholar] [CrossRef]
  3. Almeida, L.; Corazza, M.L.; Sassaki, G.L.; Voll, F.A.P. Experimental Study and Kinetic Modeling of Waste Frying Soybean Oil Hydrolysis in Subcritical Water. React. Kinet. Mech. Catal. 2017, 121, 439–452. [Google Scholar] [CrossRef]
  4. Irsyad, M.; Amrizal; Harmen; Amrul; Susila Es, M.D.; Diva Putra, A.R. Experimental Study of the Thermal Properties of Waste Cooking Oil Applied as Thermal Energy Storage. Results Eng. 2023, 18, 101080. [Google Scholar] [CrossRef]
  5. Pedersen, T.H.; Jasiunas, L.; Casamassima, L.; Singh, S.; Jensen, T.; Rosendahl, L.A. Synergetic Hydrothermal Co-Liquefaction of Crude Glycerol and Aspen Wood. Energy Convers. Manag. 2015, 106, 886–891. [Google Scholar] [CrossRef]
  6. He, S.; Wang, J.; Cheng, Z.; Dong, H.; Yan, B.; Chen, G. Synergetic Effect and Primary Reaction Network of Corn Cob and Cattle Manure in Single and Mixed Hydrothermal Liquefaction. J. Anal. Appl. Pyrolysis 2021, 155, 105076. [Google Scholar] [CrossRef]
  7. Ranganathan, P.; Savithri, S. Techno-Economic Analysis of Microalgae-Based Liquid Fuels Production from Wastewater via Hydrothermal Liquefaction and Hydroprocessing. Bioresour. Technol. 2019, 284, 256–265. [Google Scholar] [CrossRef] [PubMed]
  8. Mishra, R.K.; Kumar, V.; Kumar, P.; Mohanty, K. Hydrothermal Liquefaction of Biomass for Bio-Crude Production: A Review on Feedstocks, Chemical Compositions, Operating Parameters, Reaction Kinetics, Techno-Economic Study, and Life Cycle Assessment. Fuel 2022, 316, 123377. [Google Scholar] [CrossRef]
  9. Zhang, C.; Han, L.; Yan, M.; Xia, J.; Rong, N.; Baloch, H.A.; Guo, H.; Wu, P.; Xu, G.; Ma, K. Hydrothermal Co-Liquefaction of Rice Straw and Waste Cooking-Oil Model Compound for Bio-Crude Production. J. Anal. Appl. Pyrolysis 2021, 160, 105360. [Google Scholar] [CrossRef]
  10. Vardon, D.R.; Sharma, B.K.; Scott, J.; Yu, G.; Wang, Z.; Schideman, L.; Zhang, Y.; Strathmann, T.J. Chemical Properties of Biocrude Oil from the Hydrothermal Liquefaction of Spirulina Algae, Swine Manure, and Digested Anaerobic Sludge. Bioresour. Technol. 2011, 102, 8295–8303. [Google Scholar] [CrossRef]
  11. Cheng, F.; Cui, Z.; Chen, L.; Jarvis, J.; Paz, N.; Schaub, T.; Nirmalakhandan, N.; Brewer, C.E. Hydrothermal Liquefaction of High- and Low-Lipid Algae: Bio-Crude Oil Chemistry. Appl. Energy 2017, 206, 278–292. [Google Scholar] [CrossRef]
  12. Lavanya, M.; Meenakshisundaram, A.; Renganathan, S.; Chinnasamy, S.; Lewis, D.M.; Nallasivam, J.; Bhaskar, S. Hydrothermal Liquefaction of Freshwater and Marine Algal Biomass: A Novel Approach to Produce Distillate Fuel Fractions through Blending and Co-Processing of Biocrude with Petrocrude. Bioresour. Technol. 2016, 203, 228–235. [Google Scholar] [CrossRef] [PubMed]
  13. López Barreiro, D.; Riede, S.; Hornung, U.; Kruse, A.; Prins, W. Hydrothermal Liquefaction of Microalgae: Effect on the Product Yields of the Addition of an Organic Solvent to Separate the Aqueous Phase and the Biocrude Oil. Algal Res. 2015, 12, 206–212. [Google Scholar] [CrossRef]
  14. Yan, L.; Wang, Y.; Li, J.; Zhang, Y.; Ma, L.; Fu, F.; Chen, B.; Liu, H. Hydrothermal Liquefaction of Ulva Prolifera Macroalgae and the Influence of Base Catalysts on Products. Bioresour. Technol. 2019, 292, 121286. [Google Scholar] [CrossRef] [PubMed]
  15. Caporgno, M.P.; Pruvost, J.; Legrand, J.; Lepine, O.; Tazerout, M.; Bengoa, C. Hydrothermal Liquefaction of Nannochloropsis Oceanica in Different Solvents. Bioresour. Technol. 2016, 214, 404–410. [Google Scholar] [CrossRef] [PubMed]
  16. Kaur, R.; Gera, P.; Jha, M.K.; Bhaskar, T. Reaction Parameters Effect on Hydrothermal Liquefaction of Castor (Ricinus Communis) Residue for Energy and Valuable Hydrocarbons Recovery. Renew. Energy 2019, 141, 1026–1041. [Google Scholar] [CrossRef]
  17. Valdez, P.J.; Nelson, M.C.; Wang, H.Y.; Lin, X.N.; Savage, P.E. Hydrothermal Liquefaction of Nannochloropsis Sp.: Systematic Study of Process Variables and Analysis of the Product Fractions. Biomass Bioenergy 2012, 46, 317–331. [Google Scholar] [CrossRef]
  18. Anastasakis, K.; Ross, A.B. Hydrothermal Liquefaction of Four Brown Macro-Algae Commonly Found on the UK Coasts: An Energetic Analysis of the Process and Comparison with Bio-Chemical Conversion Methods. Fuel 2015, 139, 546–553. [Google Scholar] [CrossRef]
  19. Anastasakis, K.; Biller, P.; Madsen, R.B.; Glasius, M.; Johannsen, I. Continuous Hydrothermal Liquefaction of Biomass in a Novel Pilot Plant with Heat Recovery and Hydraulic Oscillation. Energies 2018, 11, 2695. [Google Scholar] [CrossRef]
  20. Ma, C.; Geng, J.; Zhang, D.; Ning, X. Hydrothermal Liquefaction of Macroalgae: Influence of Zeolites Based Catalyst on Products. J. Energy Inst. 2020, 93, 581–590. [Google Scholar] [CrossRef]
  21. Zhang, B.; Feng, H.; He, Z.; Wang, S.; Chen, H. Bio-Oil Production from Hydrothermal Liquefaction of Ultrasonic Pre-Treated Spirulina Platensis. Energy Convers. Manag. 2018, 159, 204–212. [Google Scholar] [CrossRef]
  22. Han, Y.; Hoekman, S.K.; Cui, Z.; Jena, U.; Das, P. Hydrothermal Liquefaction of Marine Microalgae Biomass Using Co-Solvents. Algal Res. 2019, 38, 101421. [Google Scholar] [CrossRef]
  23. Tekin, K. Hydrothermal Conversion of Russian Olive Seeds into Crude Bio-Oil Using a CaO Catalyst Derived from Waste Mussel Shells. Energy Fuels 2015, 29, 4382–4392. [Google Scholar] [CrossRef]
  24. Vlaskin, M.S.; Grigorenko, A.V.; Kostyukevich, Y.I.; Nikolaev, E.N.; Vladimirov, G.N.; Chernova, N.I.; Kiseleva, S.V.; Popel, O.S.; Zhuk, A.Z. Influence of Solvent on the Yield and Chemical Composition of Liquid Products of Hydrothermal Liquefaction of Arthrospira Platensis as Revealed by Fourier Transform Ion Cyclotron Resonance Mass Spectrometry. Eur. J. Mass. Spectrom. 2018, 24, 363–374. [Google Scholar] [CrossRef] [PubMed]
  25. Hu, Y.; Wang, S.; Li, J.; Wang, Q.; He, Z.; Feng, Y.; Abomohra, A.E.F.; Afonaa-Mensah, S.; Hui, C. Co-Pyrolysis and Co-Hydrothermal Liquefaction of Seaweeds and Rice Husk: Comparative Study towards Enhanced Biofuel Production. J. Anal. Appl. Pyrolysis 2018, 129, 162–170. [Google Scholar] [CrossRef]
  26. Posmanik, R.; Cantero, D.A.; Malkani, A.; Sills, D.L.; Tester, J.W. Biomass Conversion to Bio-Oil Using Sub-Critical Water: Study of Model Compounds for Food Processing Waste. J. Supercrit. Fluids 2017, 119, 26–35. [Google Scholar] [CrossRef]
  27. Baloch, H.A.; Siddiqui, M.T.H.; Nizamuddin, S.; Mubarak, N.M.; Khalid, M.; Srinivasan, M.P.; Griffin, G.J. Catalytic Co-Liquefaction of Sugarcane Bagasse and Polyethylene for Bio-Oil Production under Supercritical Conditions: Effect of Catalysts. J. Anal. Appl. Pyrolysis 2021, 153, 104944. [Google Scholar] [CrossRef]
  28. Teri, G.; Luo, L.; Savage, P.E. Hydrothermal Treatment of Protein, Polysaccharide, and Lipids Alone and in Mixtures. Energy Fuels 2014, 28, 7501–7509. [Google Scholar] [CrossRef]
  29. Leng, L.; Li, J.; Yuan, X.; Li, J.; Han, P.; Hong, Y.; Wei, F.; Zhou, W. Beneficial Synergistic Effect on Bio-Oil Production from Co-Liquefaction of Sewage Sludge and Lignocellulosic Biomass. Bioresour. Technol. 2018, 251, 49–56. [Google Scholar] [CrossRef] [PubMed]
  30. Carrasco, F.; Chornet, E.; Overend, R.P.; Heitz, M. Fractionnement de Deux Bois Tropicaux (Eucalyptus et Wapa) Par Traitement Thermomécanique En Phase Aqueuse. Partie I: Conversion et Profils de Solubilisation. Can. J. Chem. Eng. 1986, 64, 986–993. [Google Scholar] [CrossRef]
  31. Bouchard, J.; Léger, S.; Chornet, E.; Overend, R.P. Quantification of Residual Polymeric Families Present in Thermo-Mechanical and Chemically Pretreated Lignocellulosics via Thermal Analysis. Biomass 1986, 9, 161–171. [Google Scholar] [CrossRef]
  32. Heitz, M.; Carrasco, F.; Rubio, M.; Chauvette, G.; Chornet, E.; Jaulin, L.; Overend, R.P. Generalized Correlations for the Aqueous Liquefaction of Lignocellulosics. Can. J. Chem. Eng. 1986, 64, 647–650. [Google Scholar] [CrossRef]
  33. Rogalinski, T.; Liu, K.; Albrecht, T.; Brunner, G. Hydrolysis Kinetics of Biopolymers in Subcritical Water. J. Supercrit. Fluids 2008, 46, 335–341. [Google Scholar] [CrossRef]
  34. ASTM D5468-02; Standard Test Method for Gross Calorific Ash Value of Waste Materials. ASTM International: West Conshohocken, PA, USA, 2002.
  35. Melfi, D.T.; Lenzi, M.K.; Ramos, L.P.; Corazza, M.L. Kinetic Modeling of ScCO2-Assisted Levulinic Acid Esterification with Ethanol Using Amberlyst-15 as a Catalyst in a Batch Reactor. Energy Fuels 2021, 35, 14770–14779. [Google Scholar] [CrossRef]
  36. Michelsen, M.L.; Mollerup, J.M. Thermodynamic Models: Fundamentals & Computational Aspects, 2nd ed.; Tie-Line Publications: Holte, Denmark, 2007; ISBN 978-8798996118. [Google Scholar]
  37. Tavares, M.V.L.; Giacomin-Junior, W.R.; Vandenberghe, L.P.D.S.; Chapman, W.G.; Corazza, M.L. Phase-Equilibrium Measurements and Thermodynamic Modeling of CO2 + Geraniol, CO2 + Geraniol + Acetic Acid, and CO2 + Geraniol + Ethyl Acetate. J. Chem. Eng. Data 2020, 65, 1721–1729. [Google Scholar] [CrossRef]
  38. Ramirez, J.A.; Brown, R.J.; Rainey, T.J. A Review of Hydrothermal Liquefaction Bio-Crude Properties and Prospects for Upgrading to Transportation Fuels. Energies 2015, 8, 6765–6794. [Google Scholar] [CrossRef]
  39. Heidari, M.; Dutta, A.; Acharya, B.; Mahmud, S. A Review of the Current Knowledge and Challenges of Hydrothermal Carbonization for Biomass Conversion. J. Energy Inst. 2019, 92, 1779–1799. [Google Scholar] [CrossRef]
  40. Niu, S.; Zhou, Y.; Yu, H.; Lu, C.; Han, K. Investigation on Thermal Degradation Properties of Oleic Acid and Its Methyl and Ethyl Esters through TG-FTIR. Energy Convers. Manag. 2017, 149, 495–504. [Google Scholar] [CrossRef]
  41. Peters, M.A.; Alves, C.T.; Wang, J.; Onwudili, J.A. Subcritical Water Hydrolysis of Fresh and Waste Cooking Oils to Fatty Acids Followed by Esterification to Fatty Acid Methyl Esters: Detailed Characterization of Feedstocks and Products. ACS Omega 2022, 7, 46870–46883. [Google Scholar] [CrossRef]
  42. Chand, P.; Reddy, C.V.; Venkat, J.G.; Wang, T.; Grewell, D. Thermogravimetric Quantification of Biodiesel Produced via Alkali Catalyzed Transesterification of Soybean Oil. Energy Fuels 2009, 23, 989–992. [Google Scholar] [CrossRef]
  43. Chen, W.T.; Zhang, Y.; Zhang, J.; Schideman, L.; Yu, G.; Zhang, P.; Minarick, M. Co-Liquefaction of Swine Manure and Mixed-Culture Algal Biomass from a Wastewater Treatment System to Produce Bio-Crude Oil. Appl. Energy 2014, 128, 209–216. [Google Scholar] [CrossRef]
  44. Wang, M.; Leitch, M.; Xu, C.C. Synthesis of Phenolic Resol Resins Using Cornstalk-Derived Bio-Oil Produced by Direct Liquefaction in Hot-Compressed Phenol-Water. J. Ind. Eng. Chem. 2009, 15, 870–875. [Google Scholar] [CrossRef]
  45. Kumar, A.; Negi, Y.S.; Choudhary, V.; Bhardwaj, N.K. Characterization of Cellulose Nanocrystals Produced by Acid-Hydrolysis from Sugarcane Bagasse as Agro-Waste. J. Mater. Phys. Chem. 2014, 2, 1–8. [Google Scholar] [CrossRef]
  46. Mahamuni, N.N.; Adewuyi, Y.G. Fourier Transform Infrared Spectroscopy (FTIR) Method to Monitor Soy Biodiesel and Soybean Oil in Transesterification Reactions, Petrodiesel- Biodiesel Blends, and Blend Adulteration with Soy Oil. Energy Fuels 2009, 23, 3773–3782. [Google Scholar] [CrossRef]
Figure 1. Effect of SCB to RSO mass ratio on bio-crude yield. Reaction conditions kept constant were as follows: set point temperature of 275 °C, holding time of 10 min, and solvent (W + EtOH) to biomass (SCB + RSO) mass ratio of 9:1. SCB = sugarcane bagasse; RSO = residual soybean oil; W = water; EtOH = ethanol; W:EtOH = water to ethanol mass ratio.
Processes 12 01371 g001
Figure 2. Effect of temperature on the bio-crude yield for (a) W:EtOH = 1:0 and (b) W:EtOH = 1:1. Reaction conditions kept constant were as follows: holding time of 10 min and solvent (W + EtOH) to biomass (SCB + RSO) mass ratio of 9:1. SCB = sugarcane bagasse; RSO = residual soybean oil; W = water; EtOH = ethanol; W:EtOH = water to ethanol mass ratio.
Processes 12 01371 g002
Figure 3. Bio-crude yield as a function of severity index in co-HTL reactions using (a) water as solvent and (b) water and ethanol (mass ratio of 1:1). Solvent (W + EtOH) to biomass (SCB + RSO) mass ratio was kept constant at 9:1 for all reactions. SCB = sugarcane bagasse; RSO = residual soybean oil; W = water; EtOH = ethanol.
Processes 12 01371 g003
Figure 4. Bio-crude yield as a function of severity index in co-HTL reactions using a mixture (ethanol + water) as solvent and solvent (W + EtOH) to biomass (SCB + RSO) mass ratio of 9:1. SCB = sugarcane bagasse; RSO = residual soybean oil; W = water; EtOH = ethanol. Note: x-axis is not in scale.
Processes 12 01371 g004
Figure 5. TGA curves of bio-crudes produced at different temperatures (a) with pure water and (b) with a mixture (water + ethanol). B.O–2 and B.O–16 are bio-crudes produced at 250 °C; B.O–1 and B.O–17 are bio-crudes produced at 275 °C; B.O–3 and B.O–15 are bio-crudes produced at 300 °C.
Processes 12 01371 g005
Figure 6. TGA analysis for bio-char samples produced with pure water and with a mixture (water + ethanol). B.C–2 is the bio-char produced at 250 °C using water; B.C–14 and B.C–18 are the bio-chars produced at 280 °C and 290 °C using water plus ethanol, respectively.
Processes 12 01371 g006
Figure 7. FTIR analysis for bio-crude samples produced (a) with pure water and (b) with the mixture (water + ethanol) as solvent. B.O–2 and B.O–16 are bio-crudes produced at 250 °C; B.O–1 and B.O–17 are bio-crudes produced at 275 °C; B.O–3 and B.O–15 are bio-crude produced at 300 °C.
Processes 12 01371 g007
Figure 8. FTIR analysis for bio-char samples produced with different solvents and bagasse to residual oil mass ratios. B.C–2 is the bio-char produced at 250 °C using water; B.C–18 and B.C–15 are the bio-chars produced at 290 °C and 300 °C using water plus ethanol.
Processes 12 01371 g008
Table 1. Literature review of biomasses used for bio-crude production.
ReferenceFeedstockTemperature
(°C)
Pressure
(MPa)
Bio-Crude Yield
(%)
Bio-Crude HHV
(MJ/Kg)
Pedersen et al. [5]Poplar380–400-38.05–52.26-
He et al. [6]Corn cob
Cattle manure
300–360
300–360
10–20
10–20
22.2
19.3
32.6
35.5
Zhang et al. [9]Rice straw250–350-88.7739.07
Vardon et al. [10]Spirulina sp.30010–1232.633.2
Swine manure30010–1230.234.7
Sludge30010–129.432
Cheng et al. [11]Nannochloropsis salina (CCMP1776)310–350-18.1–27.527
Lavanya et al. [12]Galdieria sulphuraria310–350-40–54.3020.5
Arthrospira platensis250–350183038.65
Tetraselmis sp.250–350182935.58
López Barreiro et al. [13]Almeriansis sp.--42.6-
Gaditana sp.--50.8-
Yan et al. [14]Ulva prolifera macroalgae270, 290 and 3104.3–7.026.7-
Caporgno et al. [15]Nannochloropsis oceana240–3003.2–8.954.237.7
Kaur et al. [16]Castor beans260, 280, and 300-15.814.43
Valdez et al. [17]Nannochloropsis sp.250–400-46-
Anastasakis et al. [18]L. digitata350-17.632
L. hyperbore350-9.833
L. saccharina350-1333.9
A. esculenta350-17.833.8
Anastasakis et al. [19]Miscanthus sp.50–350-2617.1
Spirulina sp.50–350-3323.3
Ma et al. [20]Ulva prolifera macroalgae260–3004.3–7.032.2–34.8
Zhang et al. [21]Spirulina platensis400402217.26
Han et al. [22]Tetraselmis sp.280–3505–2126–3115.33
Tekin [23]Olive seeds240–3403.2–1546.815.72
Vlaskin et al. [24]Arthrospira platensis3008.639.65–44.07-
Hu et al. [25]Rice husk4004035.1830.41–33.65
Posmanik et al. [26]Food waste200–3505–206738
Baloch et al. [27]Sugarcane bagasse280-62.324.7
Table 2. Results obtained at different co-HTL reaction conditions, with the (RSO + SCB) to solvents mass ratio fixed at 1:9.
Reaction
ID
SCB:RSO RatioW:EtOH
Ratio
TSP
(°C)
tSP
(min)
SOYbo
(%)
FAEE
(wt.%)
FFA
(wt.%)
TAG
(wt.%)
Ybc
(%)
11:31:0275106.55 ± 0.1972.6 ± 1.6NC64.18NC0.4
21:31:0250105.86 ± 0.0976.1 ± 0.6NC13.3352.333.0 ± 1.1
31:31:0300107.59 ±0.0666.6 ± 1.5NC60.72NC0.4 ± 0.2
41:31:1250105.94 ± 0.1181.1 ± 4.5NC7.3460.582.5 ± 2.1
51:31:1275106.61 ± 0.2384.5 ± 3.510.6031.6514.532.8 ± 1.5
61:21:0250105.69 ± 0.2376.0 ± 0.0NC9.2155.244.3 ± 1.0
71:21:0275106.54 ± 0.0471.0 ± 4.82.7437.68NC0.9 ± 0.1
81:11:0275106.48 ± 0.0158.1 ± 2.72.1739.03NC2.6 ± 0.8
91:21:1275106.67 ± 0.1773.9 ± 5.45.6321.9321.633.5 ± 2.5
101:11:1275106.78 ± 0.0366.6 ± 2.113.5736.51NC2.6 ± 1.8
111:01:0275106.50 ± 0.0221.3 ± 0.3NANANA16.6 ± 3.2
121:01:1275106.60 ± 0.1330.5 ± 6.0NANANA11.6 ± 3.5
131:21:0300107.33 ± 0.0170.7 ± 7.2NC54.82NC0.4 ± 0.2
141:31:1280107.24 ± 0.2091.5 ± 1.039.8332.35NC0.4 ± 0.1
151:31:1300507.7595.135.3634.95NC0.0
161:31:1250606.2888.87.754.85NC3.2
171:31:1275607.1195.027.0215.74NC0.4
181:11:12901207.8780.238.8230.69NC0.9
191:21:13001208.0889.043.9834.26NC0.0
201:31:12001020.0NCNC55.520.0
SCB:RSO = SCB to RSO mass ratio; W:EtOH = water to ethanol mass ratio; TSP (°C) = setpoint temperature for the reaction; tSP (min) = holding time at the setpoint temperature; Ybo (%) = bio-crude yield; Ybc (%) = bio-char yield; FAEE = fatty acid ethyl esters; FFA = free fatty acids; and TAG = triacylglycerols. NA = samples not analyzed by GC-FID; NC = not detected.
Table 3. HHV values obtained for bio-crude, bio-char, SCB, and RSO. B.O–X are different bio-crudes and B.C–X are different bio-chars, where X indicates the reaction condition presented in Table 2. SCB = sugarcane bagasse; RSO = residual soybean oil.
SampleHHV (MJ/kg)
B.O–238.81
B.O–1538.41
B.O–1637.78
B.O–1737.82
B.O–1838.14
B.O–1938.46
B.C–148.30
B.C–1616.04
SCB10.38
RSO39.34
Disclaimer/Publisher’s Note: The statements, opinions and data contained in all publications are solely those of the individual author(s) and contributor(s) and not of MDPI and/or the editor(s). MDPI and/or the editor(s) disclaim responsibility for any injury to people or property resulting from any ideas, methods, instructions or products referred to in the content.

