Article

Application of Anti-Solvent Crystallization for High-Purity Potash Production from K-Feldspar Leaching Solution

by
Sina Shakibania
1,*,
Lena Sundqvist-Öqvist
1,
Jan Rosenkranz
1 and
Yousef Ghorbani
2
1
Division of Minerals and Metallurgical Engineering, Department of Civil, Environmental and Natural Resources Engineering, Luleå University of Technology, 97187 Luleå, Sweden
2
Joseph Banks Laboratories, College of Health and Science, University of Lincoln, Green Lane, Lincoln LN6 7DL, Lincolnshire, UK
*
Author to whom correspondence should be addressed.
Processes 2024, 12(7), 1385; https://doi.org/10.3390/pr12071385
Submission received: 30 May 2024 / Revised: 27 June 2024 / Accepted: 28 June 2024 / Published: 3 July 2024
(This article belongs to the Section Separation Processes)

Abstract

:
Potassium-containing feldspars provide a high potential for producing potash, a product with widespread use in agriculture. The present work assesses applying the anti-solvent crystallization method for the purification and recovery of high-purity muriate of potash (KCl) from feldspar leaching solutions. Initially, screening experiments were carried out on a synthetic leaching solution with the aim of analyzing the crystallization behavior of key components. Screening experiments were performed using five anti-solvents, namely methanol, ethanol, acetone, 2-propanol, and ethylene glycol. Acetone and 2-propanol were viable options for crystallization of potassium chloride. Then, the effects of anti-solvent ratio (O/A), time, and anti-solvent addition rate on potassium-chloride crystallization were further investigated using acetone and 2-propanol. A recovery of 83% of potassium was achieved when using acetone at the O/A of 5 with the addition rate of 10 mL/min, at room temperature with a hold time of 180 min. The optimum conditions for 2-propanol were determined to be similar, except for using a 5 mL/min addition rate for 79% recovery. The final muriate of potash products had a purity of over 99.9% using either of the anti-solvent. However, differences in morphology and crystal size of products were observed. Acetone-formed potash crystals were aggregates of cubic crystals with an average size of 3 microns, while 2-propanol-formed potash crystals were 20 microns in size as cubic particles with a hollow core. Despite having almost the same performance in potassium recovery, acetone was found to be a more feasible anti-solvent for potash recovery due to simpler downstream solvent recovery.

1. Background and Objectives

1.1. Background

Feldspar minerals are one of the main components of the Earth’s crust [1]. These minerals are tectosilicate, primarily containing aluminum and silicon [2], as well as potassium, sodium, or calcium as the main composing elements [3]. This composition categorizes feldspar minerals into three main groups: K-bearing feldspar, Na-bearing feldspar, and Ca-bearing feldspar [3]. In recent years, feldspars have been widely employed in the glassmaking and ceramic industries due to their toughness and corrosion resistance [4].
While feldspar minerals are known for their toughness and corrosion resistance, their use in the mining and minerals industry as a source for metal extraction is often overlooked. This is due to their high structure energy bonds that make them difficult to decompose for the extraction of metallic components [5]. However, K-bearing feldspar shows great potential for producing muriate of potash (KCl) and alumina (Al2O3) [6]. Potash is a crucial component of the fertilizers used to grow food for both animals and humans [6]. The global consumption of potash for agricultural applications is expected to increase due to several factors. Firstly, the global population is expected to grow, and with it, the demand for food. Potash is a crucial nutrient for plant growth, helping to develop strong roots and healthy crops. Secondly, there is a growing trend towards sustainable agriculture practices, which rely on the use of fertilizers such as potash to improve soil health and increase crop yields. As more farmers adopt these practices, the demand for potash is expected to increase. Finally, there is an increasing awareness of the importance of soil health and the role that fertilizers such as potash play in maintaining it. This has led to a greater emphasis on soil testing and nutrient management, which in turn is expected to drive demand for potash. Overall, these factors are expected to contribute to an annual increase in the demand for potash in the agriculture industry of 2.5% to 3% [7].
Potash is commonly extracted from evaporites, such as sylvite (KCl, 52.3% K content), langbeinite (Mg2K2(SO4)3, 18.3% K content), kainite (KMg(SO4)Cl·3H2O, 15.8% K content), carnallite (KMgCl3·6(H2O), 14.1% K content), and polyhalite (K2Ca2Mg(SO4)4·2(H2O), 13.3% K content) [5]. Potash production is currently limited to a few nations mainly due to the geological availability of potash deposits (underground salt deposits) and the high cost of production [8]. Canada, Russia, Belarus, and China are the top producers of potash worldwide, accounting for around 80% of the global production [9]. Other countries with significant potash production include Israel, Germany, Jordan, and the United States. This limited number of suppliers could impose significant geopolitical implications, making it crucial to explore new unconventional sources of potash to meet the growing demand by the fertilizer industry. K-bearing feldspars are estimated to account for approximately 12 wt.% of the earth’s crust and they can contain up to 14 wt.% of potassium [10]. Accordingly, it can be considered a reliable source of potash [6]. Furthermore, the dead sea potash industry halite tailings pose substantial environmental concerns. Halite tailings are highly saline, polluting surface and ground waters and degrading the terrain. As a result, by extracting potash from alternate sources, these environmental issues may be mitigated to some degree.
The mineralogy of feldspar minerals and their high stability of the Al–Si–O tetrahedron structure make them challenging to decompose. Thermal processing has been suggested for the treatment of the feldspar minerals to break down their structure. It involves using a roasting process at a temperature of 1300 °C [11,12,13] or hydrothermal treatment [14,15] at a temperature between 800 °C to 1000 °C [16,17,18]. However, these methods generate a considerable amount of slag, consume significant energy, and have high capital costs [15,16,17]. Therefore, alternative methods of processing K-bearing feldspar need to be developed to make it a viable source of potash.
Hydrometallurgical treatment of feldspar minerals could be suggested as an alternative to thermal processing. Feldspar hydrometallurgical treatment involves leaching [11,19,20,21] and solution purification [2,8]. Leaching dissolves feldspar components, and the separation and purification step recovers dissolved species. A major challenge associated with feldspar hydrometallurgical treatment is the low dissolution efficiency. Several approaches have been suggested to solve this problem, such as leaching at elevated pressure [22,23,24], microbial decomposition [21,25,26], and mechanical activation through intensive milling prior to leaching [27,28]. A main drawback associated with all the approaches is non-selective leaching. Non-selective leaching creates further challenges in downstream processing. Accordingly, the separation and purification step is critical to the hydrometallurgical treatment of feldspar.
A typical potassium feldspar leaching solution contains potassium (K), aluminum (Al), sodium (Na), calcium (Ca) and iron (Fe) [29,30]. K and Al are often considered as the primary value components, while Na and Fe are impurities. The presence of these metal ions complicates the separation and purification operation as some share similar separation behavior (K with Na [31,32], and Al with Fe [33,34]). Moreover, these ions exhibit distinct separation behavior (K and Na compared to Al and Fe), which increases the number of unit operations.
Anti-solvent crystallization, also known as solvent displacement crystallization, a method for purification of feldspar leaching solution, generates a solid from a supersaturated solution by adding a water-miscible organic solution [35]. The addition of organic solution creates a competition between polar organic molecules and inorganic ions for the same water molecule, where organic molecules tend to form stronger hydrogen bonds with water than inorganic ions [36]. Organic molecules preferentially form hydrogen bonds with water, increasing their affinity for water and decreasing the amount of free water accessible for cation hydration. Anti-solvent crystallization can be performed at room temperature, unlike evaporation and cooling crystallization. Furthermore, the quantity of anti-solvent may be adjusted to manage the supersaturation state, which in turn helps prevent crystal agglomeration and co-precipitation of impurities [37]. Therefore, it is potentially the most cost-effective crystallization approach in terms of energy consumption for producing fine, high-purity crystals. However, it is important to note that the anti-solvent crystallization process manages large volumes of solution and needs to recover the anti-solvent after crystallization, both of which add cost and complexity [35].
Pharmaceutical and fine chemical industries make extensive use of anti-solvent crystallization [38,39]. Recently, it has been used for selective precipitation of soluble metals. The process has been shown to be effective for critical metals (rare earth elements, Ni and Co from sulfuric acid [40,41], citric acid [42], and ammonium fluoride-based solution [43,44,45]), base metals (from sulfuric acid [46], deep eutectics [47], citric acid [43] solution), and alkali metals (Na and K from sulfuric acid-based solutions [36,48]). However, it is not suitable for crystallizing metal ions from chloride solutions [36,49]. Because metal chlorides may be dissolved entirely or partially in polar organic solvents, such as low-molecular alcohols. Muriate of potash is a chloride salt, and this presents a challenge for the application of this method for its recovery from K-feldspar leaching solution.

1.2. Objectives

Research focusing on solution purification of feldspar leaching is lacking. This is important since feldspar minerals are a potential source for the extraction of potash, which, as explained above, is a critical commodity for the agricultural industry. The practical utilization of feldspar mineral for the extraction of its metallic components is contingent on the development of appropriate separation and purification procedures. This research is part of the POTASSIAL project aimed at developing a hydrometallurgical flowsheet for recovering potash and alumina from K-feldspar. This flowsheet uses HCl leaching. This work examines the efficiency of anti-solvent crystallization for the purification and recovery of potash chloride from hydrochloric acid leaching solution. Developing a method for the direct and selective recovery of high-purity potassium as muriate of potash was the primary focus of this study. The effectiveness of several anti-solvents on potassium recovery was investigated because of a lack of research on the efficacy of anti-solvent crystallization for chloride solutions. After the selection of the best anti-solvents, crystallization parameters such as anti-solvent ratio, mixing time, and addition rate were optimized to maximize potassium recovery. Finally, the obtained products were analyzed for crystal morphology and size.

2. Materials and Method

2.1. Materials

This present study is a part of the POTASSIAL project funded by ERA-MIN 3, which aims to investigate the zero-waste valorization of K-bearing feldspathic flotation concentrate to produce high-value-added products, including muriate of potash [50]. The project proposes a hydrometallurgical flowsheet that involves mechanical activation through intensive milling, leaching in hydrochloric acid (HCl), and subsequent separation and purification stages. The application of intensive milling followed by HCl leaching enables complete dissolution of the main feldspar components. The typical chemical composition of the pregnant leaching solution (PLS) is shown in Table 1.
To prepare the PLS, analytical-grade chemicals including potassium chloride (KCl), sodium chloride (NaCl), calcium chloride (CaCl2), aluminum chloride (AlCl3), ferric chloride (FeCl3), and HCl were utilized. These chemicals were procured from VWR Chemicals. Additionally, analytical-grade solvents such as acetone (C3H6O), ethanol (CH6O), methanol (C2H4O), 2-propanol (C3H8O), and ethylene glycol (C2H6O2), also supplied by VWR Chemicals (VWR International AB, Sweden), were used as anti-solvents for potash recovery.

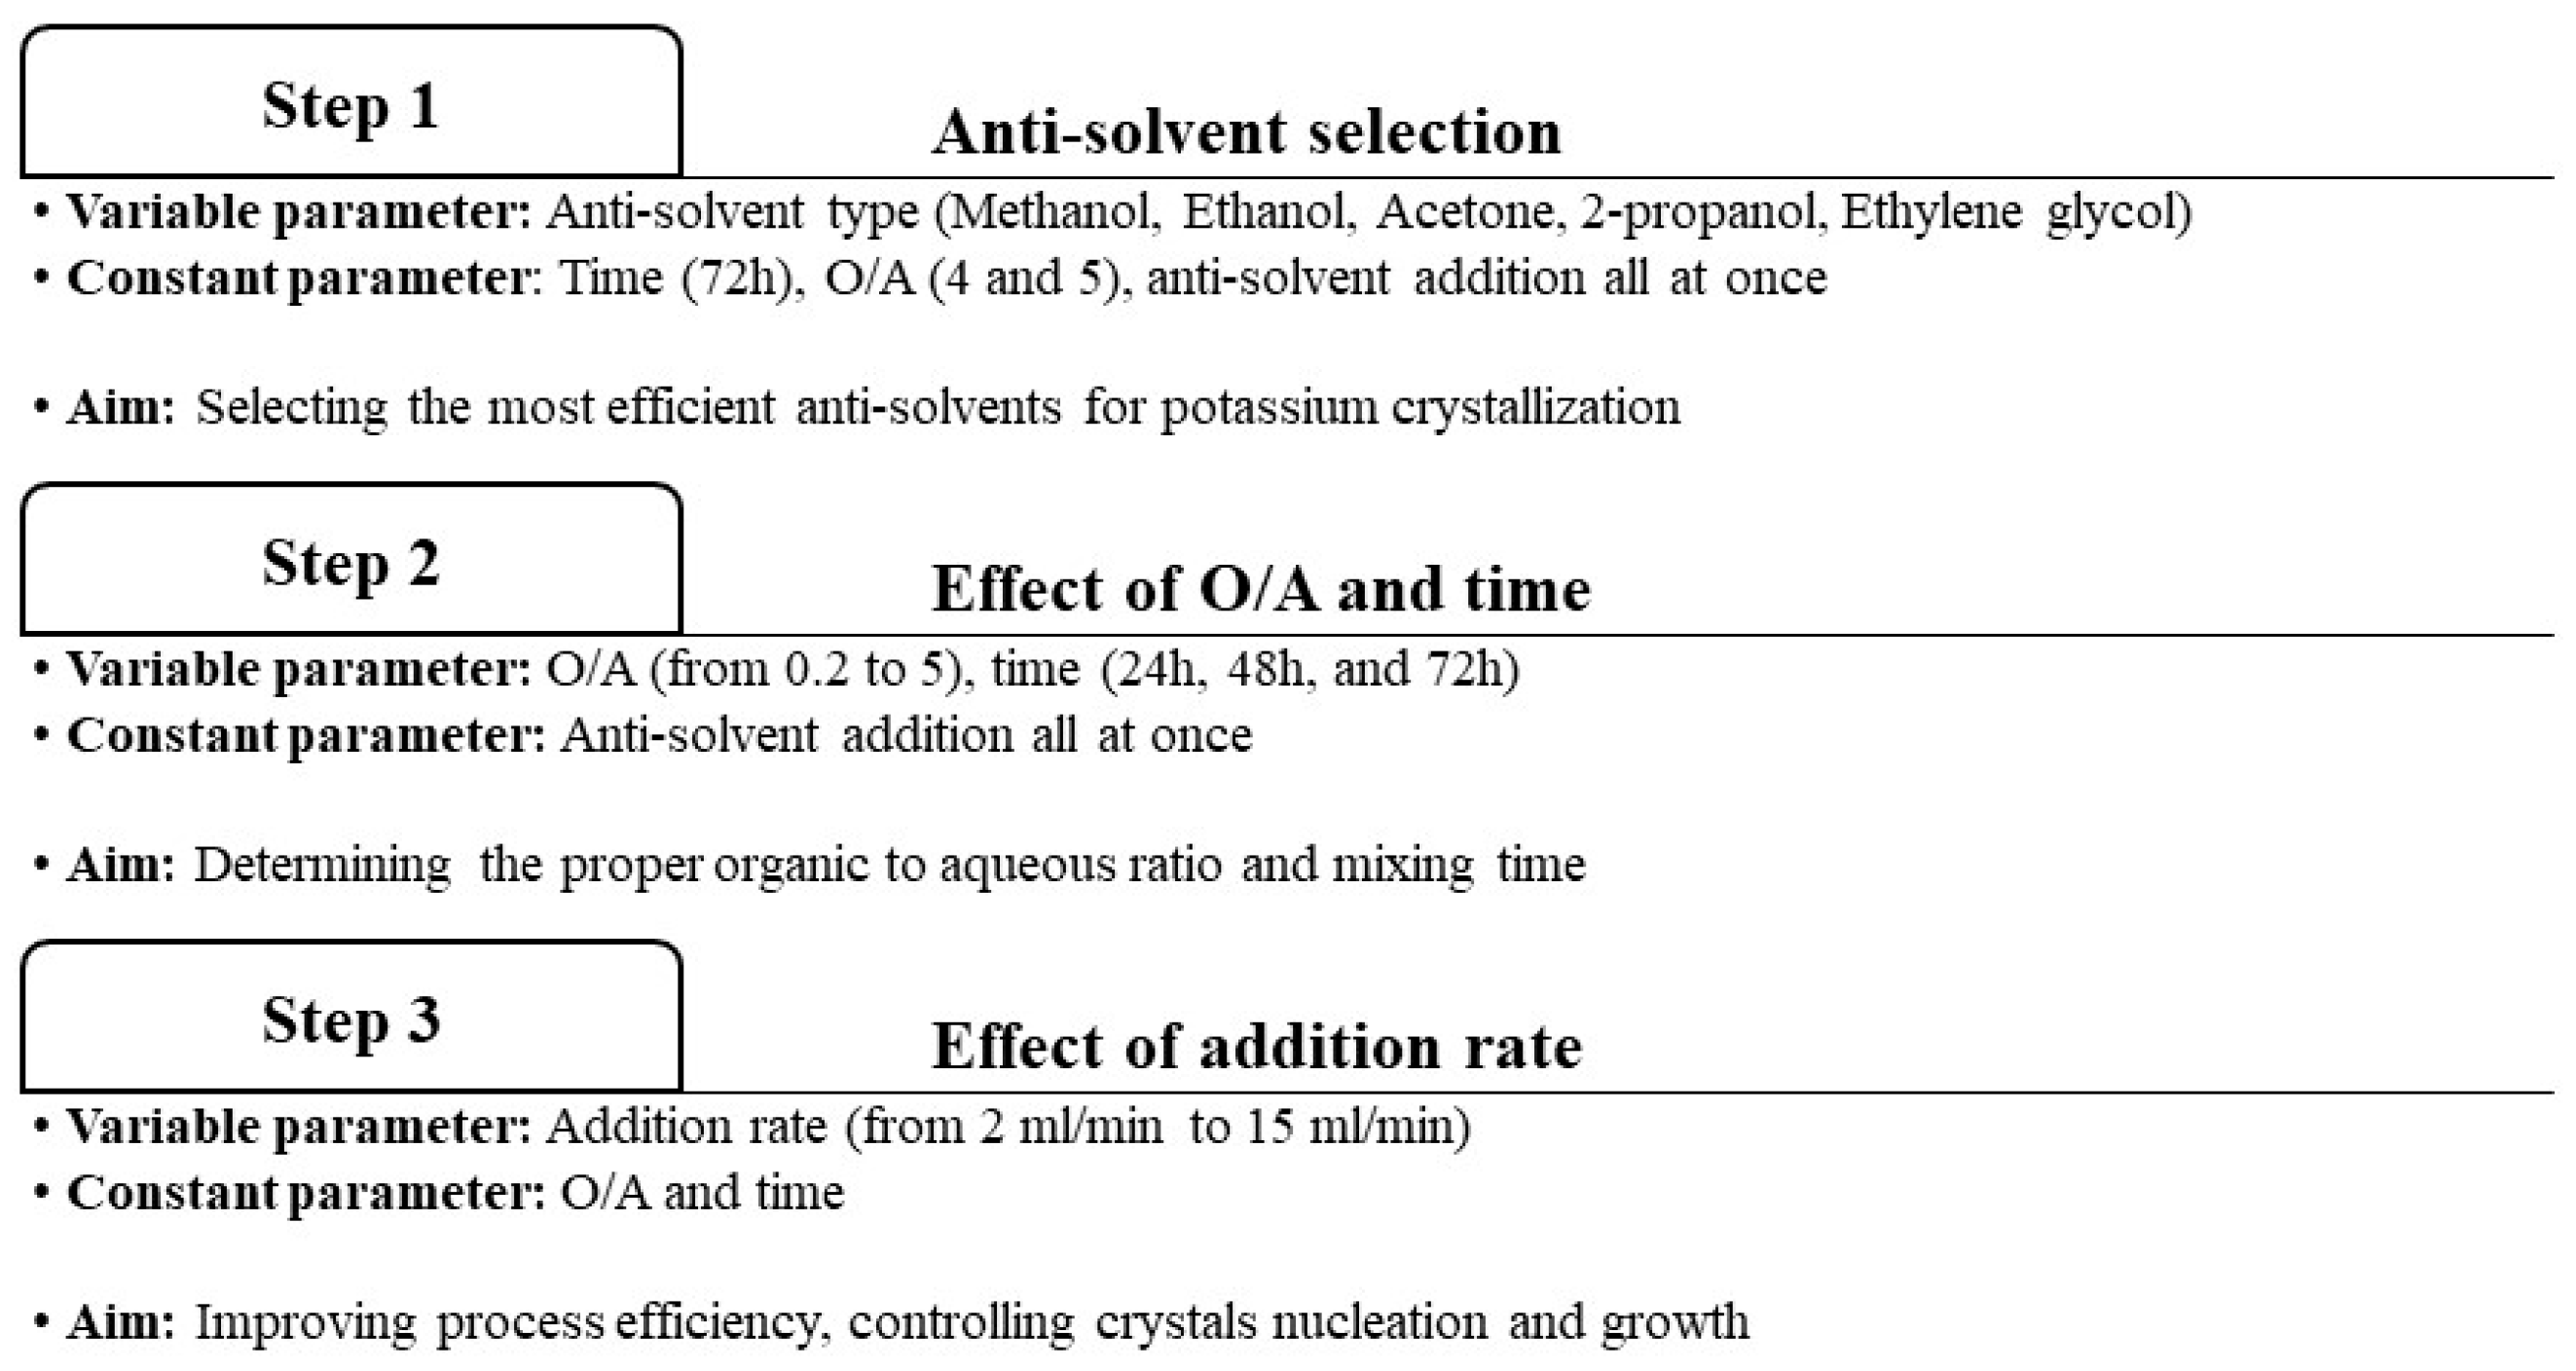
2.2. Anti-Solvents Selection

First, five anti-solvents were tested for their effectiveness in recovering potash from the PLS with the specifications listed in Table 2. The aim of evaluating several anti-solvents is to determine how effective each anti-solvent, with its unique qualities, is at facilitating the crystallization process. Various solvents can be utilized for ani-solvent crystallization. However, in this study, ethanol, methanol, acetone, 2-propanol and ethylene glycol were selected. The main aspects leading to the selection of these anti-solvents were the solvent’s boiling point, density, dielectric constant, molecular weight, and viscosity. These properties can affect the crystallization yield, crystal size, morphology of crystals, and downstream processes for the separation of the anti-solvent mixed with PLS.
The dielectric constant is one of the most important parameters affecting the process efficiency. Anti-solvents influence ion solvation by lowering the dielectric constant of the solution. The dielectric constant indicates the polarity of the solvent, which can reduce the quantity of free water and, as a result, influences the solute’s solubility [51]. A lower dielectric constant reduces the amount of free water, which influences solute solubility. The second factor considered in the selection of anti-solvents was molecular weight. Molecular weight is one of the effective factors affecting the dielectric constant. In general, the dielectric constant decreases as the molecule weight increases [52]. The hydrophobic property of an organic solution, on the other hand, rises with increasing molecular weight. As a result, it is essential to ensure that the organic component is sufficiently hydrophilic to be water-miscible. The dielectric constant is not the only factor affecting the process efficiency. Another aspect that should be taken into account is the viscosity. Anti-solvent crystallization is a diffusion-controlled process, as discussed later. Accordingly, the effectiveness of PLS mixing with the solvent and subsequent nucleation and growth of crystals might be impacted by viscosity. The boiling point affects the energy consumption and selectivity of the anti-solvent recovery after crystallization. Density affects the weight of the consumed anti-solvent when mixed with PLS based on the volumetric ratio. Finally, the crystallization yield was the most crucial criterion for choosing anti-solvents based on the existing literature. As stated in the introduction section, a limited number of studies are available on the anti-solvent crystallization of different metal ions from chloride-based solutions [37,50]. However, in these studies, unsuccessful crystallization of aluminum and iron was found using 2-propanol [36] and successful crystallization of sodium was achieved using ethylene glycol [48].
Table 2. Effective specification of the anti-solvents utilized in this study (data to construct this table were obtained from [36,53]).
Anti-SolventMolecular StructureMolecular Weight (g·mol−1)Density (g·mL−1)Boiling Point (°C)Dielectric ConstantViscosity (cP)
MethanolProcesses 12 01385 i001320.79264.632.70.59
EthanolProcesses 12 01385 i002460.7897824.51.1
AcetoneProcesses 12 01385 i003580.7845620.70.36
2-propanolProcesses 12 01385 i004600.78682.418.62.4
Ethylene glycolProcesses 12 01385 i005621.111973718.4
A summary of the main specifications of selected anti-solvents is given in Table 2. It is hard to find an organic solution that meets all the essential properties of a perfect anti-solvent. Each of the anti-solvents chosen is superior to others in a particular property or fulfills various criteria to varying degrees. Aside from that, given the unique characteristics of the K-feldspar leaching solution, it is critical that the efficiency of several anti-solvents with varying qualities is examined in the first step.

2.3. Experimental Procedure

At first, the screening tests were performed to identify anti-solvents by which potassium crystallization was possible. The screening experiments included mixing the PLS with acetone, ethanol, methanol, 2-propanol, and ethylene glycol at the organic-to-aqueous volumetric ratios of 4 and 5 for 72 h and at 25 °C. Anti-solvents were added all at once to 60 mL of the leaching solution. Experiments were performed in an incubator shaker to keep the temperature constant and provide agitation at 125 rpm (orbital agitation). At the end, the mixture was filtered on 0.2 µm filter paper. The filtered mixture was sampled, diluted 1000 times with a 5 v/v% HCl solution and analyzed by Inductively Coupled Plasma Optical Emission Spectroscopy (ICP-OES, ICAP 7200 Thermo Fisher Scientific, MA, USA). Given the use of plasma and the presence of organic solutions in the mixes, dilution by 1000 times was required for analysis using ICP-OES. According to the results presented in Section 3.1, acetone and 2-propanol were selected as the most efficient anti-solvents for the recovery of potash. Therefore, experiments that followed investigated the effects of time and anti-solvent ratio. To demonstrate the chemical interaction occurring during the addition of anti-solvents, the activity of PLS components was calculated. The activity coefficients of water and the main PLS components were calculated as a function of the molar ratio of anti-solvent to water for one liter of aqueous solution using Pitzer’s method [54]:
l n γ M = z M 2 F + d m d 2 B M d + Z C M D + c m c 2 ϕ M c + d m d ψ M c d + d d m d m d ψ d d M + Z m c d m c m d C c d
in which, zm and m are the charge of cation M and molality values, respectively. Subscripts represent the speciation of cations and anions. F, B, ϕ, ψ, and C are terms of function of ionic strength, charge of cations and anions, and other experimentally determined parameters. Following the selection of anti-solvents, experiments were conducted to determine the proper anti-solvent ratio and operating duration limit before testing the anti-solvent addition rate. The acetone in PLS ratio was investigated by mixing two solvents in the following volumetric ratios (organic:aqueous): 0.2:1, 0.4:1, 0.6:1, 0.8:1, 1:1, 2:1, 3:1, 4:1, and 5:1. Acetone was added at once to the leaching solution. Samples were taken after 24, 48, and 72 h, filtered, diluted with 5 v/v% HCl solution, and analyzed by ICP-OES. The temperature and agitation were constant at 25 °C and 125 rpm, respectively. The experiments were repeated using 2-propanol as the anti-solvent under the same conditions. Residues were also analyzed by ICP-OES, for chemical composition analysis. In total, 0.1 g of the solids were dissolved in 100 mL of 5 v/v% HCl solution and then subjected to ICP-OES. Scanning electron microscopy equipped with Energy Dispersive Spectroscopy (SEM-EDS, ZEISS Sigma 300 VP, Jena, Germany) was used to determine the phase composition and morphology of products. The solids separated from the solution and examined without being washed.
In all the above-mentioned experiments, the anti-solvent was added to the leaching solution at once, without controlling the addition condition. Controlling the addition first requires an understanding of the impact of O/A and time. After determining the proper organic-to-aqueous ratio and mixing time, experiments were followed with a progressive addition of anti-solvent. The degree of supersaturation may be regulated by changing the addition rate, which is one of the most crucial factors influencing the crystallization process. Controlling the degree of supersaturation affects crystallization yield and crystal morphology. For this purpose, experiments were performed in the Easymax 402 Synthesis Workstation equipped with EasyViewer 100 particle analyzer (Mettler-Toledo Inc., Ohio, USA). The Easymax 402 Synthesis Workstation setup included a 400 mL glass reactor, thermometer, pitch-blade glass propeller Ø 38 mm, dosing unit, and EasyViewer 100 particle analyzer probe. Temperature and stirring speed were set constant at 25 °C and 125 rpm. The final anti-solvent to aqueous volumetric ratio was 5. First, 60 mL of the leaching solution was mixed with 60 mL of anti-solvent, before being transferred to the reactor. Four different addition rates for both acetone and 2-propanol were examined: 2 mL/min, 5 mL/min, 10 mL/min, and 15 mL/min. The selection of addition rates was based on the PLS volume. Using the EasyViewer 100 particle analyzer, the number and size of crystals forming in the mixture were monitored over 10-s intervals. Crystal count and size were recorded where the laser beam shone. Due to this, not all crystals could be analyzed. However, taking into account the continual, constant agitation, it is justified to relate the quantity of crystals and their size in the analysis region to the whole system. Procedures were carried out until neither the quantity nor the size of the crystals changed up to 24 h. However, it was determined that 3 h minutes was long enough. After each experiment, solids were filtered and analyzed by ICP-OES and SEM (Zeiss Merlin) to determine the morphology and crystal size. A summary of the experimental procedure taken in this study is shown in Figure 1.

3. Results and Discussion

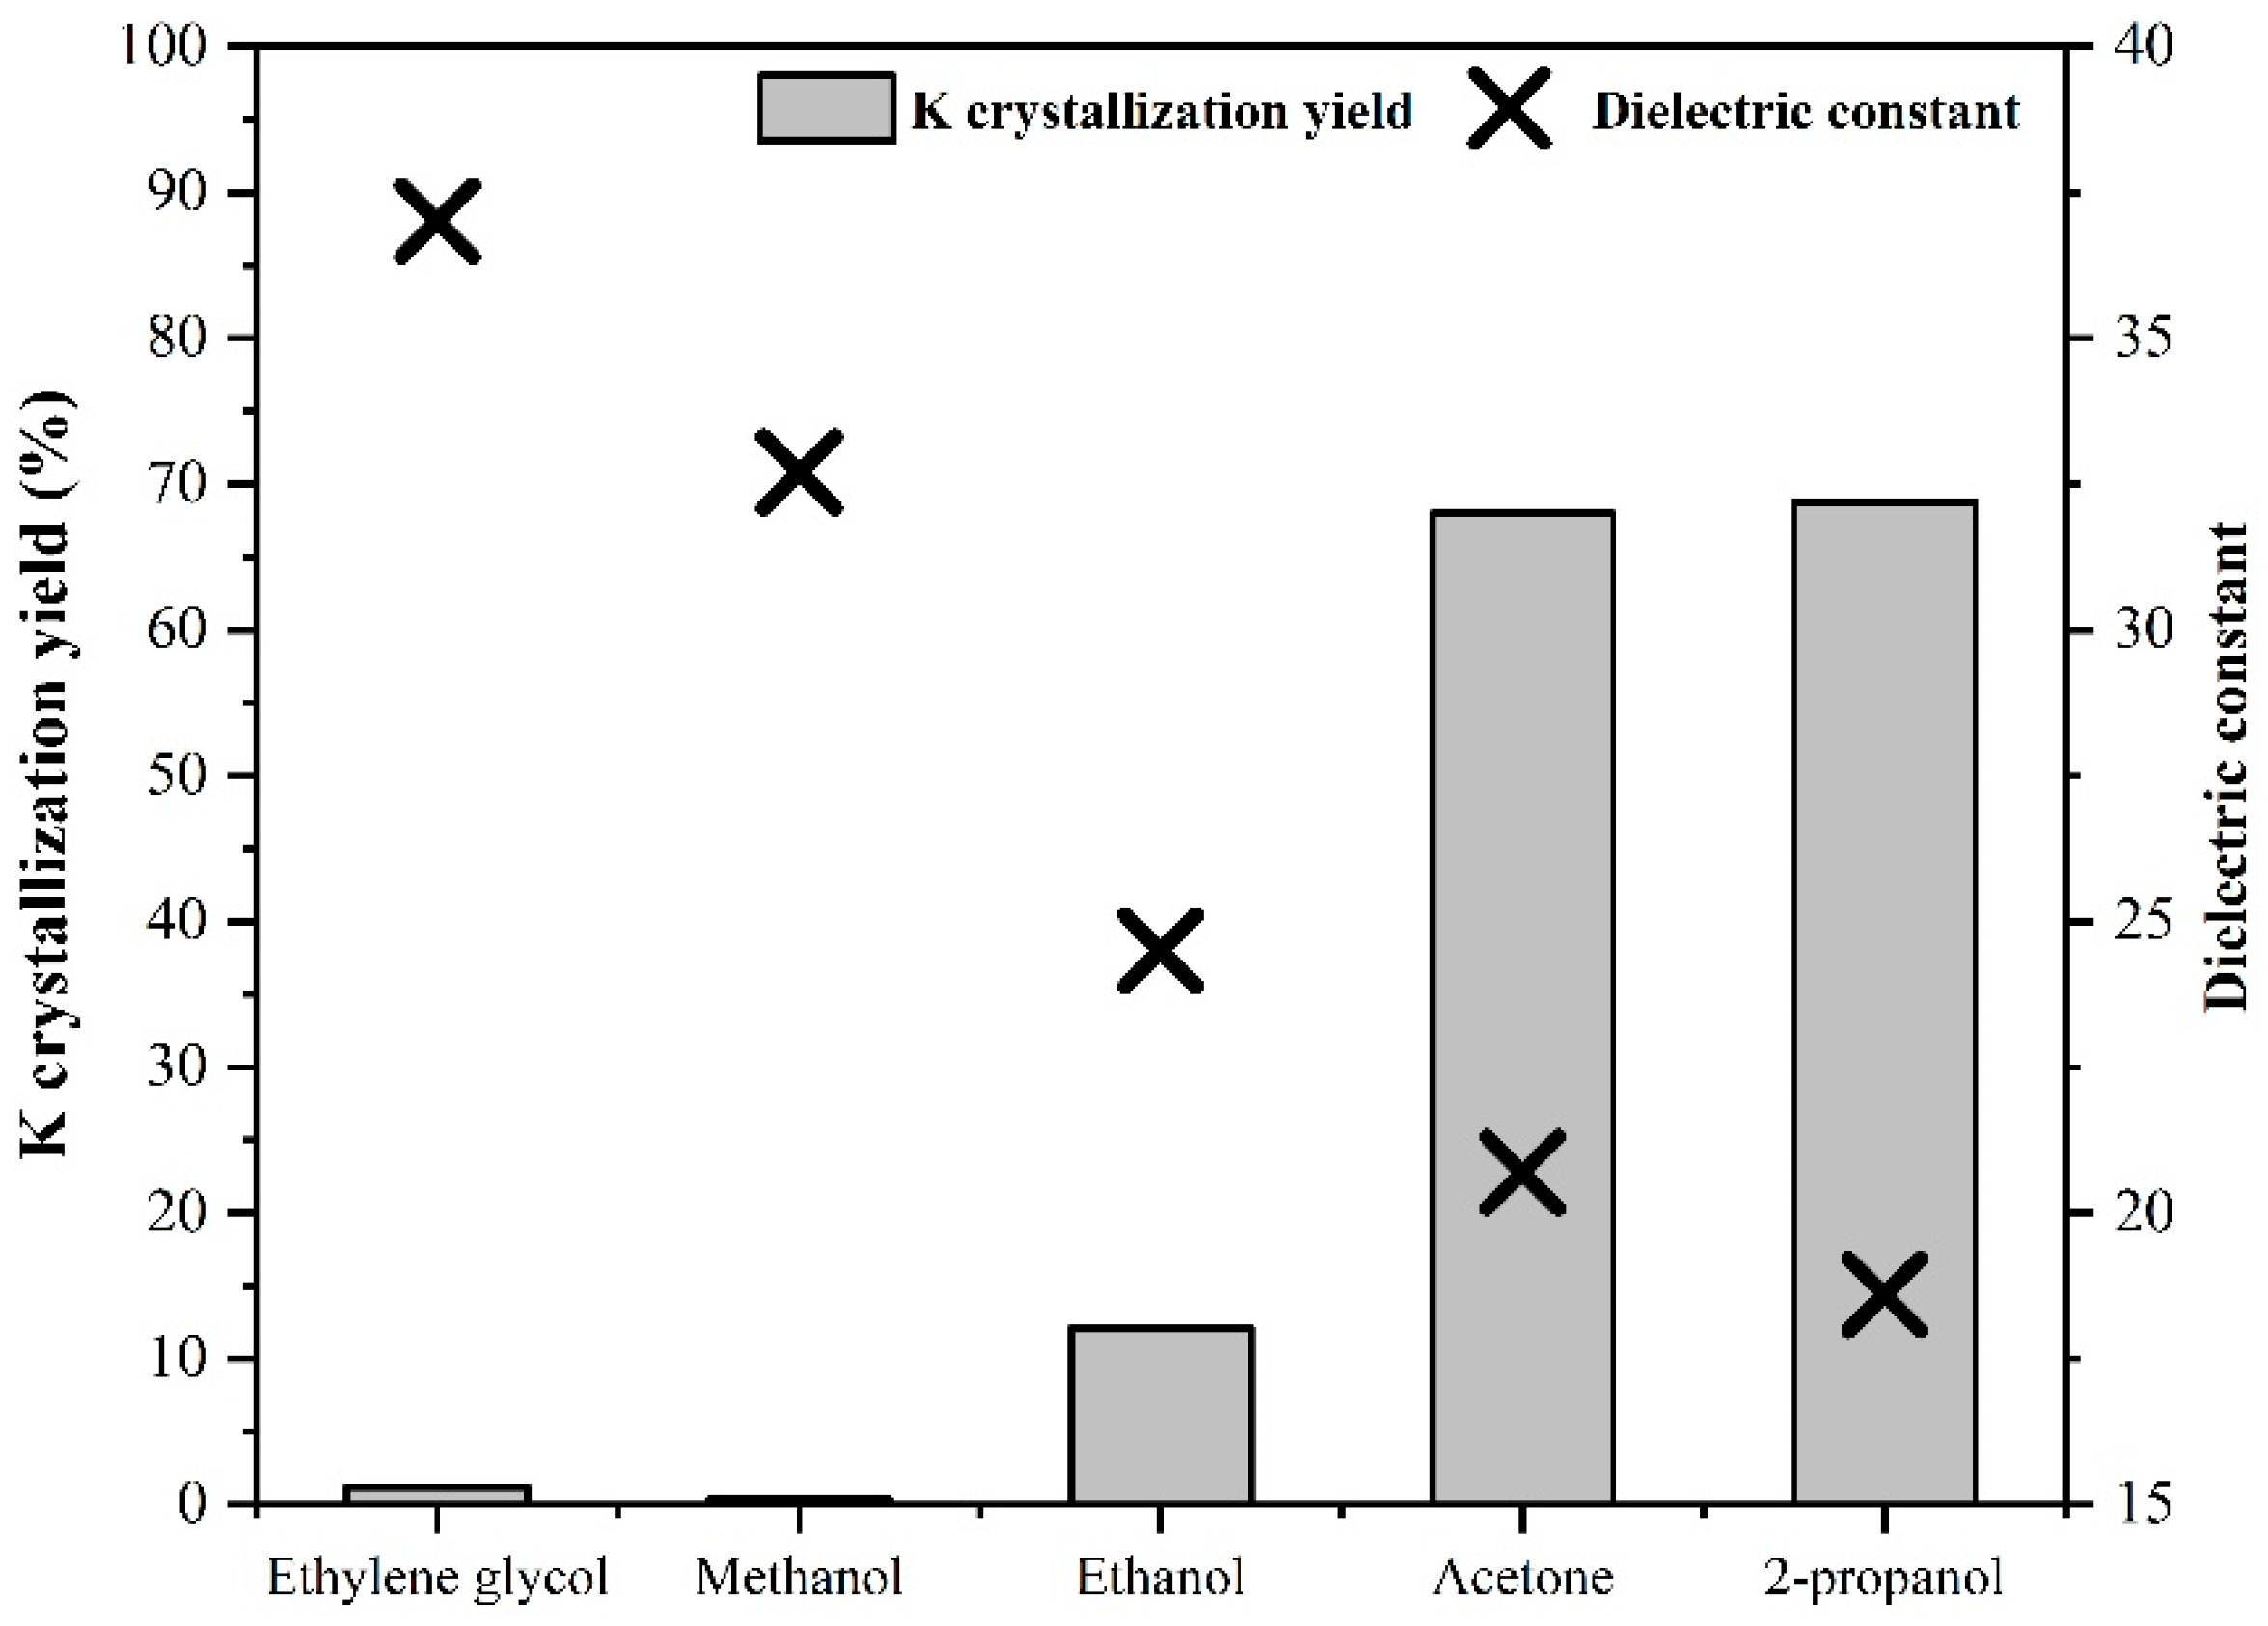
3.1. Results of Anti-Solvent Screening Tests

Screening results are presented in Table 3. The anti-solvents used showed drastically varied behavior when it came to the crystallization of PLS components. In these studies, either no crystallization occurred or only potassium crystallization. Experiments using acetone and 2-propanol yielded successful potash crystallization. Out of all the screening experiments, only five yielded visible solid crystals, namely using acetone (both O/A of 4 and 5), 2-propanol (both O/A of 4 and 5), and ethanol (O/A of 5). However, the crystallization yield with ethanol (12%) was much lower. The highest potassium crystallization yields were 68% using acetone at the O/A of 5, and 69% using 2-propanol at the same O/A.
These findings are consistent with the trend in dielectric constants observed for the anti-solvents (Figure 2): lowest to highest: 2-propanol, acetone, ethanol, methanol, and ethylene glycol. 2-propanol and acetone have the lowest dielectric constants. Due to the inverse relation between the dielectric constant and the attraction force between ions in solution, 2-propanol and acetone are more conducive to ion-association [36]. Although the dielectric constant of 2-propanol is lower than that of acetone, the crystallization yields are quite the same. This demonstrates that the dielectric constant is not the sole factor influencing crystallization yield. Section 3.3 goes into further detail.
An important finding obtained from the screening experiments is that in all the crystallization experiments, only crystallization potassium occurred. The reason for this can be explained by the ionic properties and activity of the cations. To create a supersaturated solution of a specific ion, ions first must release their hydration water. According to previous research [38], the interaction energy between ions and water dipoles is proportional to the ionic charge density. Cations with a higher ionic charge density are more resilient to the release of hydration water. The charge density of the ion increases with the increase in the oxidation state. Therefore, monovalent cations, such as K+ and Na+, are easier to crystallize than divalent (Ca2+ and Fe2+) and trivalent (Al3+ and Fe3+) cations. The ionic radius is another component that impacts the ionic charge density. For cations of identical oxidation states, the ionic radius is a useful metric by which to compare the charge density. The charge density of the ions is inversely proportional to the ionic radius. Thus, cations with a larger ionic radius have a lower ionic charge density, which makes them easier to crystallize. As shown in Table 4, potassium is the monovalent with the largest ionic radius.
The variation in crystallization behavior cannot be fully accounted for by the charge density effect alone. Solvation theory is another means to discuss the differences in the crystallization behavior. Solvation theory defines the hydration effect by two types of energy sources [55,56]:
  • “Energy required to separate water molecules where they cannot form hydrogen bonds (the energy reference by which hydration is characterized)”.
  • “Energy required for a hydrated ion to similarly be separated from its bound water, known as the heat of hydration”.
Table 4. The ionic properties of cations presented in the studied PLS [36,57].
IonOxidation StateIonic Radius (pm)Heat of Hydration (kcalg−1·ion)
K+113875
Na+110295
Ca+2114410
Fe+275500
Al+3671149
Fe+3691200
Crystallization occurs when the heat of hydration energy is overcome. It follows that the water molecules may be separated from the hydration sphere with greater ease as the lower the heat of the hydration value is. Table 4 shows the oxidation state, ionic radius, and the heat of hydration of the cations present in the studied PLS. Among all the cations, potassium is the monovalent cation with the largest ionic radius. It also has the lowest heat of hydration. This fact can be one explanation for the selective crystallization of potassium chloride from the PLS.
Before exploring the influence of further crystallization factors, it is necessary to demonstrate how the addition of anti-solvents results in crystallization. When the anti-solvent is added to the PLS, the hydrogen bonds between water molecules break, and new hydrogen bonds are formed between the H atom of a water molecule and the O atom of the acetone/2-propanol molecules [58]. This immobilizes the ionic molecules and reduces the water’s activity, which in return decreases the solubility of the solute. To demonstrate these interactions, the activity of the PLS components was calculated using Equation (1) with the chemical composition shown in Table 1. It should be noted that another factor that can affect the activity is ionic strength [59,60]. Ionic strength is a function of the concentration and charge of all ions in a solution. For the calculation of the activity coefficients, ionic strength was assumed to be 4.31 mol/kg (representative of the PLS chemical composition). Since anti-solvents used in this study are uncharged, their addition to PLS will not affect the ionic strength. Accordingly, ionic strength was considered constant at various O/A ratios. The results for the calculated activity coefficients are shown in Figure 3a for acetone and Figure 3b for 2-propanol. The activity coefficients of water and PLS components both change the same way when either acetone or 2-propanol is added. It is evident that the addition of anti-solvents results in a significant decrease in the activity coefficient of water from 0.95 in the absence of anti-solvent to around 0.5 after the addition of anti-solvent at the 1.4 molar ratio (equivalent to about 6 times volumetric ratio). This significant decrease in the water activity follows a simultaneous increase in the activity of PLS components namely potassium, sodium, aluminum, and chloride ions. The increase in the activity coefficient of cations is beneficial for their crystallization. However, the increase in the chloride ion activity can increase the stability of the divalent and trivalent cations through the formation of stable chloride complexes of these cations. In addition, the increase in the chloride ion activity can be considered ineffective in the crystallization of the monovalent cations. It is worth noting that the variations in the activity coefficient of PLS components caused by acetone and 2-propanol addition are quite comparable. However, in the presence of acetone, the activity coefficient values of K, Al, Na, and Cl are somewhat greater than in the presence of 2-propanol.
The anti-solvent crystallization approach was only effective for potassium crystallization, resulting in the selective recovery of muriate of potash. The preferential recovery of potassium was ascribed to its low charge density and heat of hydration compared to other PLS components. Acetone and 2-propanol, the anti-solvents with the lowest dielectric constant, had the highest potassium crystallization yields. This highlights the importance of the dielectric constant on process efficiency. Despite the lower dielectric constant of 2-propanol compared to acetone, the potassium crystallization yield was almost the same when these organic solutions were used as the anti-solvent. This finding emphasizes the significance of other anti-solvent properties to process efficiency. As a result, changing other crystallization process parameters may influence the potassium crystallization yield.

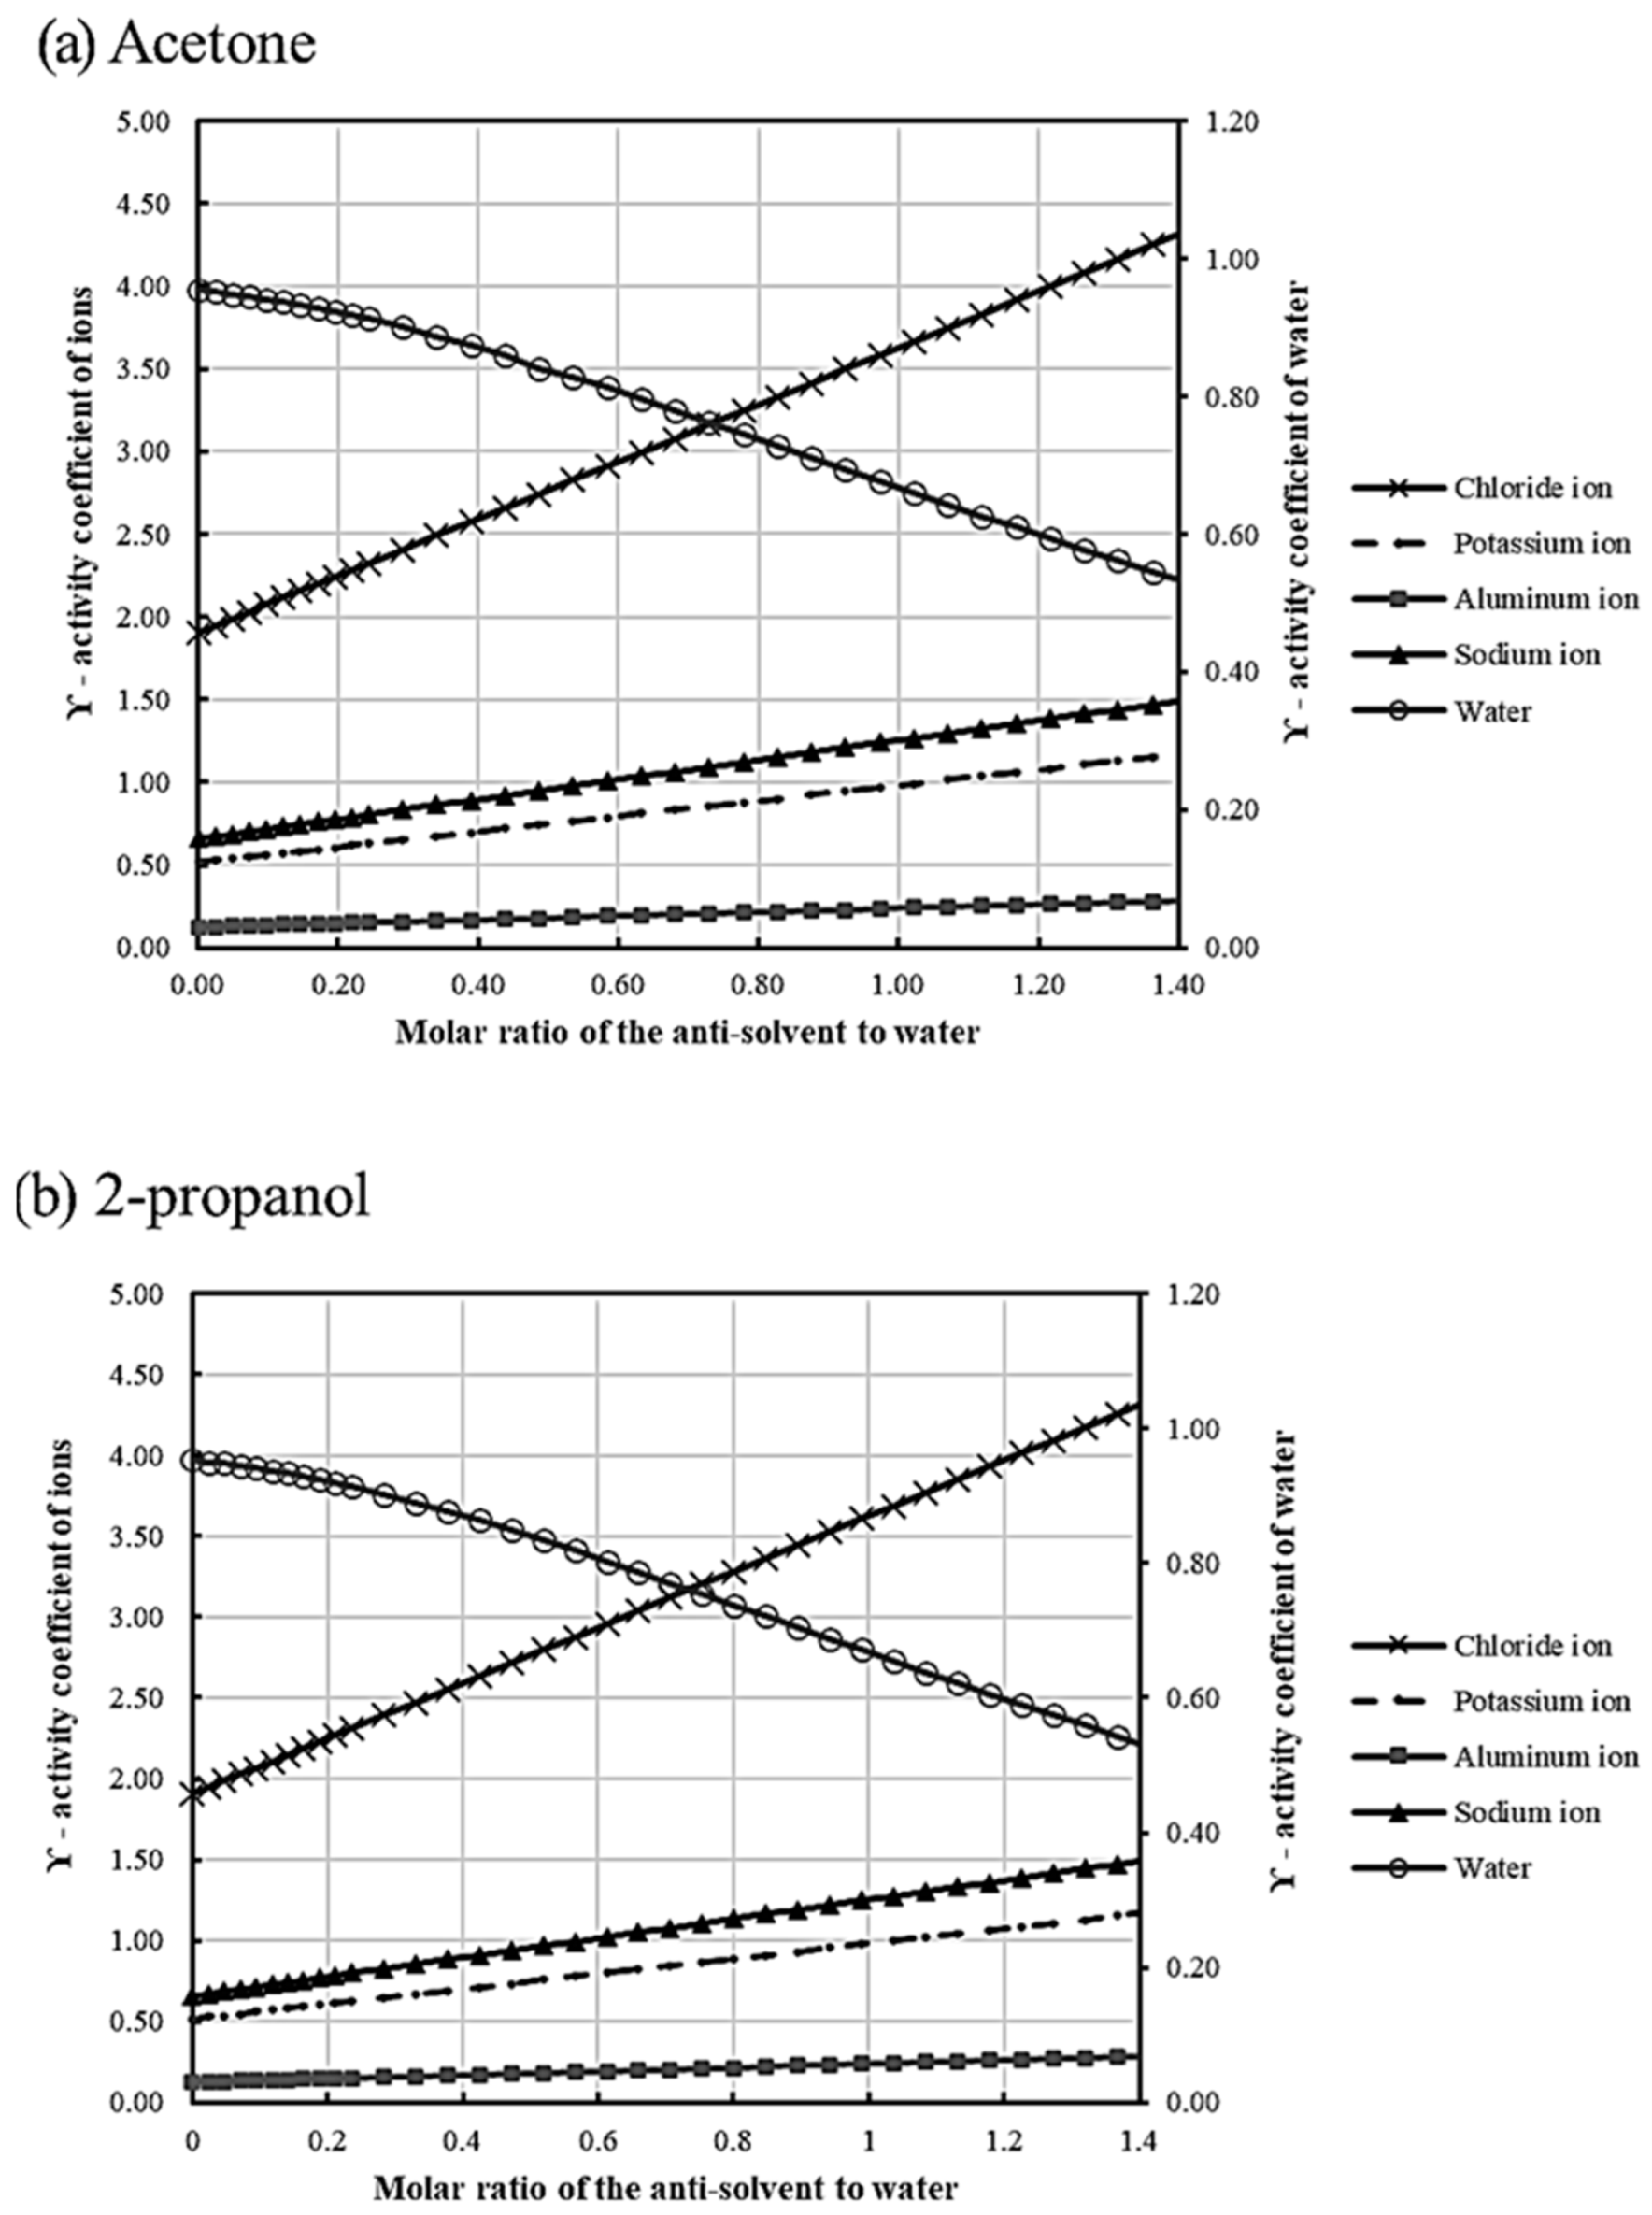
3.2. Influence of Anti-Solvent Ratio and Time on Potassium Crystallization

Figure 4a,b demonstrate the effects of antisolvent ratio and time for acetone and 2-propanol, respectively. The figures illustrate the findings of potassium concentration in PLS after crystallization as a function of anti-solvent ratio and time. This was performed in order to demonstrate the ability of anti-solvents to create supersaturation. Both anti-solvents have shown a comparable performance regarding the crystallization of the potassium starting at anti-solvent to PLS volumetric ratios larger 2. By increasing the anti-solvent ratio, the efficiency of potassium recovery increased accordingly. Moreover, a retention time of 24 h seems more than enough for the recovery of potassium. It shall be noted that the crystallization yields of other PLS components were negligible in all the experiments.
The solids obtained using acetone at the O/A of 4 and 5, and 2-propanol at the O/A of 4 and 5 were analyzed by SEM-EDS. Only potassium and chloride were identified in the samples using SEM-EDS. SEM images of the products are shown in Figure 5. So far, all the results obtained regarding the crystallization yield and the phase composition of the products obtained using acetone and 2-propanol were almost identical. However, differences in the morphology and the crystal size of the potash particles formed under different experimental conditions can be observed. Different investigations have documented the nucleation and growth of potassium chloride as cubic crystals [61,62]. Here too, crystals were mostly cubic. Different crystal sizes may form in a sample due to the solvent in which the crystals are formed. Potash crystals formed in the acetone mixture have mostly kept their cubic form. The diameter of the cubes formed at an acetone to PLS ratio of 4 varies between 3 to 5 microns (Figure 5a) while this parameter varies between 4 to 10 microns at the ratio of 5 (Figure 5b). However, the average size of crystals at two studied anti-solvent ratios is somewhat identical. For 2-propanol, an inverse trend in the crystal size by increasing the anti-solvent ratio can be observed. The crystals formed at the 2-propanol to PLS ratio of 4 are more in the form of rectangular cuboids with diameters ranging from 5 to 15 microns (Figure 5c), while crystals at the 2-propanol to PLS ratio of 5 are cubic at a diameter ranging from 3 to 5 microns with a hollow center (Figure 5d). The observation of the hollow-centered cubes indicates a defect in the crystal structure. This phenomenon can be attributed to the Schottky defect, which is further discussed in Section 3.3.3. The chemical composition of the products is shown in Table 5, indicating just a trace of contaminants in the obtained products. All the products have a purity of over 99.9%.

3.3. Progressive Addition of Anti-Solvents

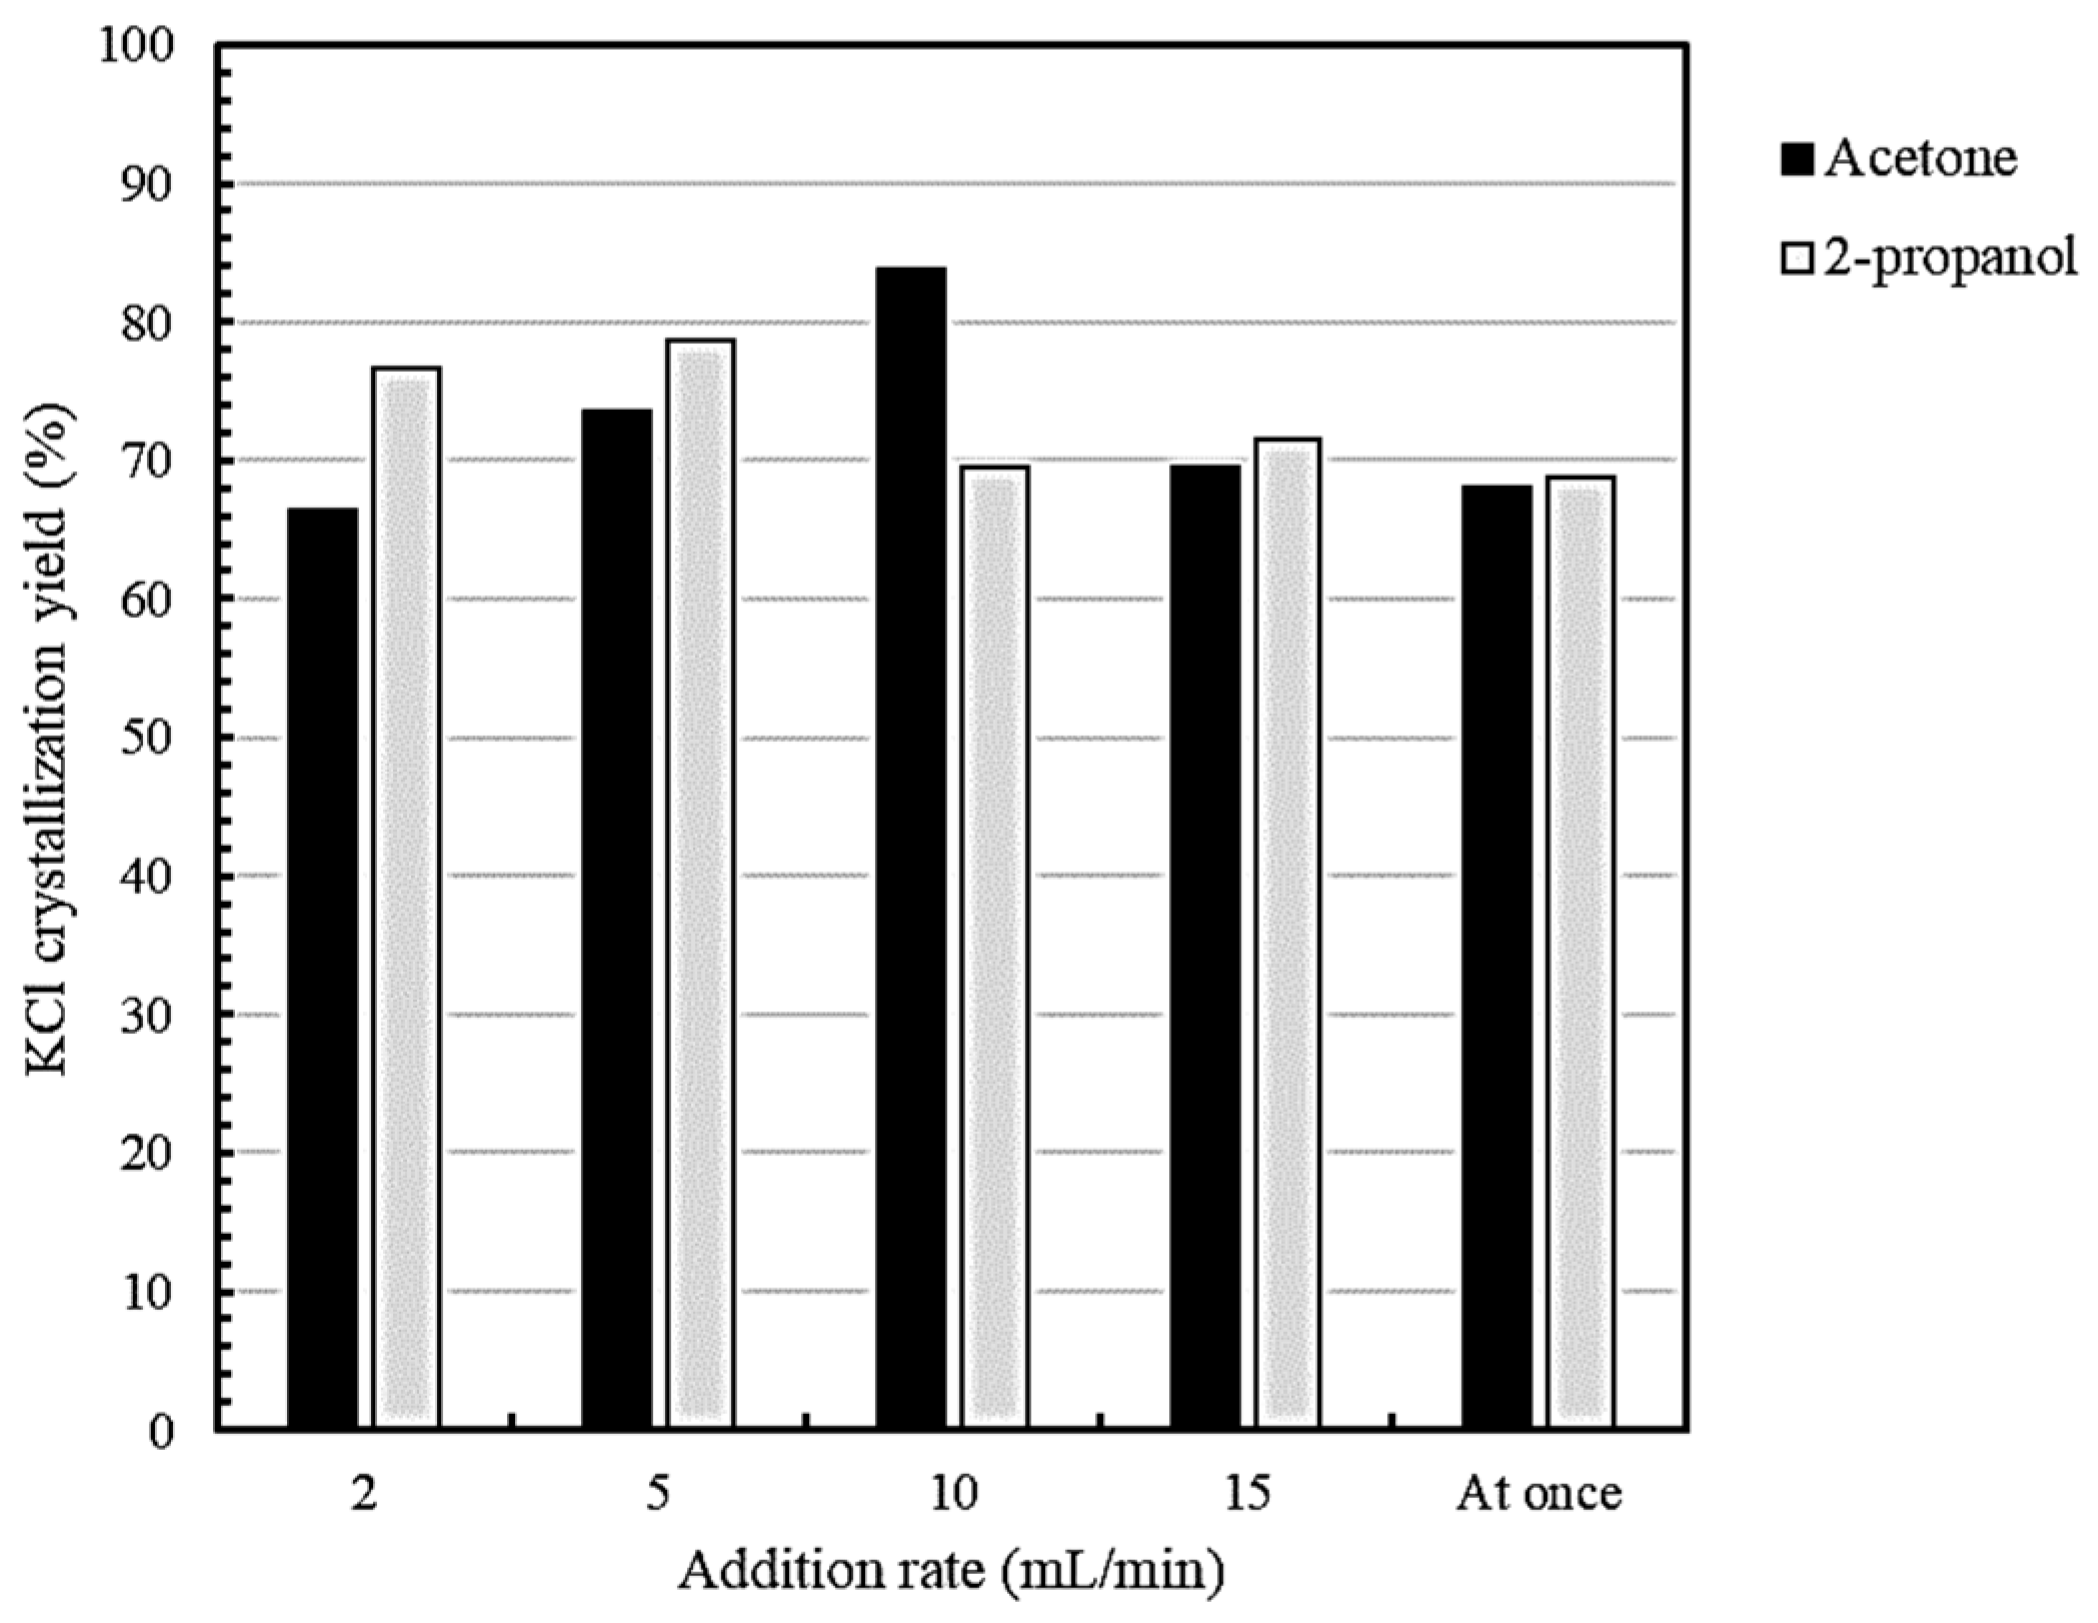
3.3.1. Effect of Addition Rate on Potassium Crystallization Yield

Figure 6 shows the result of potash recovery with a progressive addition of acetone and 2-propanol. When compared to findings obtained from the at-once addition of anti-solvents, it is notable that the total potash recovery can be enhanced with the progressive addition of the anti-solvent. Multiple investigations show that the rate of anti-solvent addition may have a substantial effect on crystallization yield [63,64,65]. The impact of the addition rate on crystallization has been attributed to controlling the degree of supersaturation. Burst nucleation occurs with instantaneous addition but to a lesser degree with progressive addition [65]. Many tiny nuclei are created during burst nucleation, and these nuclei may not be stable and can eventually disperse. Progressive addition yields uniform supersaturation and controlled crystal growth in the system.
The addition rate affects the induction time and the metastable zone width. Increasing the addition rate of anti-solvent decreases the induction time [66]. Induction time can be defined as a measure of the ability of the solution to remain in the state of metastable equilibrium [66,67]. When the induction time is passed, the nucleation of the stable crystals starts. Accordingly, the induction time can be considered inversely proportional to the nucleation rate. A shorter induction time is desirable for higher nucleation rates. Typically, faster addition of anti-solvent generates higher supersaturation, which may increase the crystallization yield [37]. In the case of potash crystallization using acetone, the crystallization yield was constantly improved by increasing the addition rate from 2 mL/min to 10 mL/min. However, the crystallization yield peaked at the addition rate of 10 mL/min then a decrease in the crystallization yield was observed when increasing the addition rate. A similar trend in the experiments conducted by 2-propanol was also observed, in which the potash recovery peaked at the addition rate of 5 mL/min.

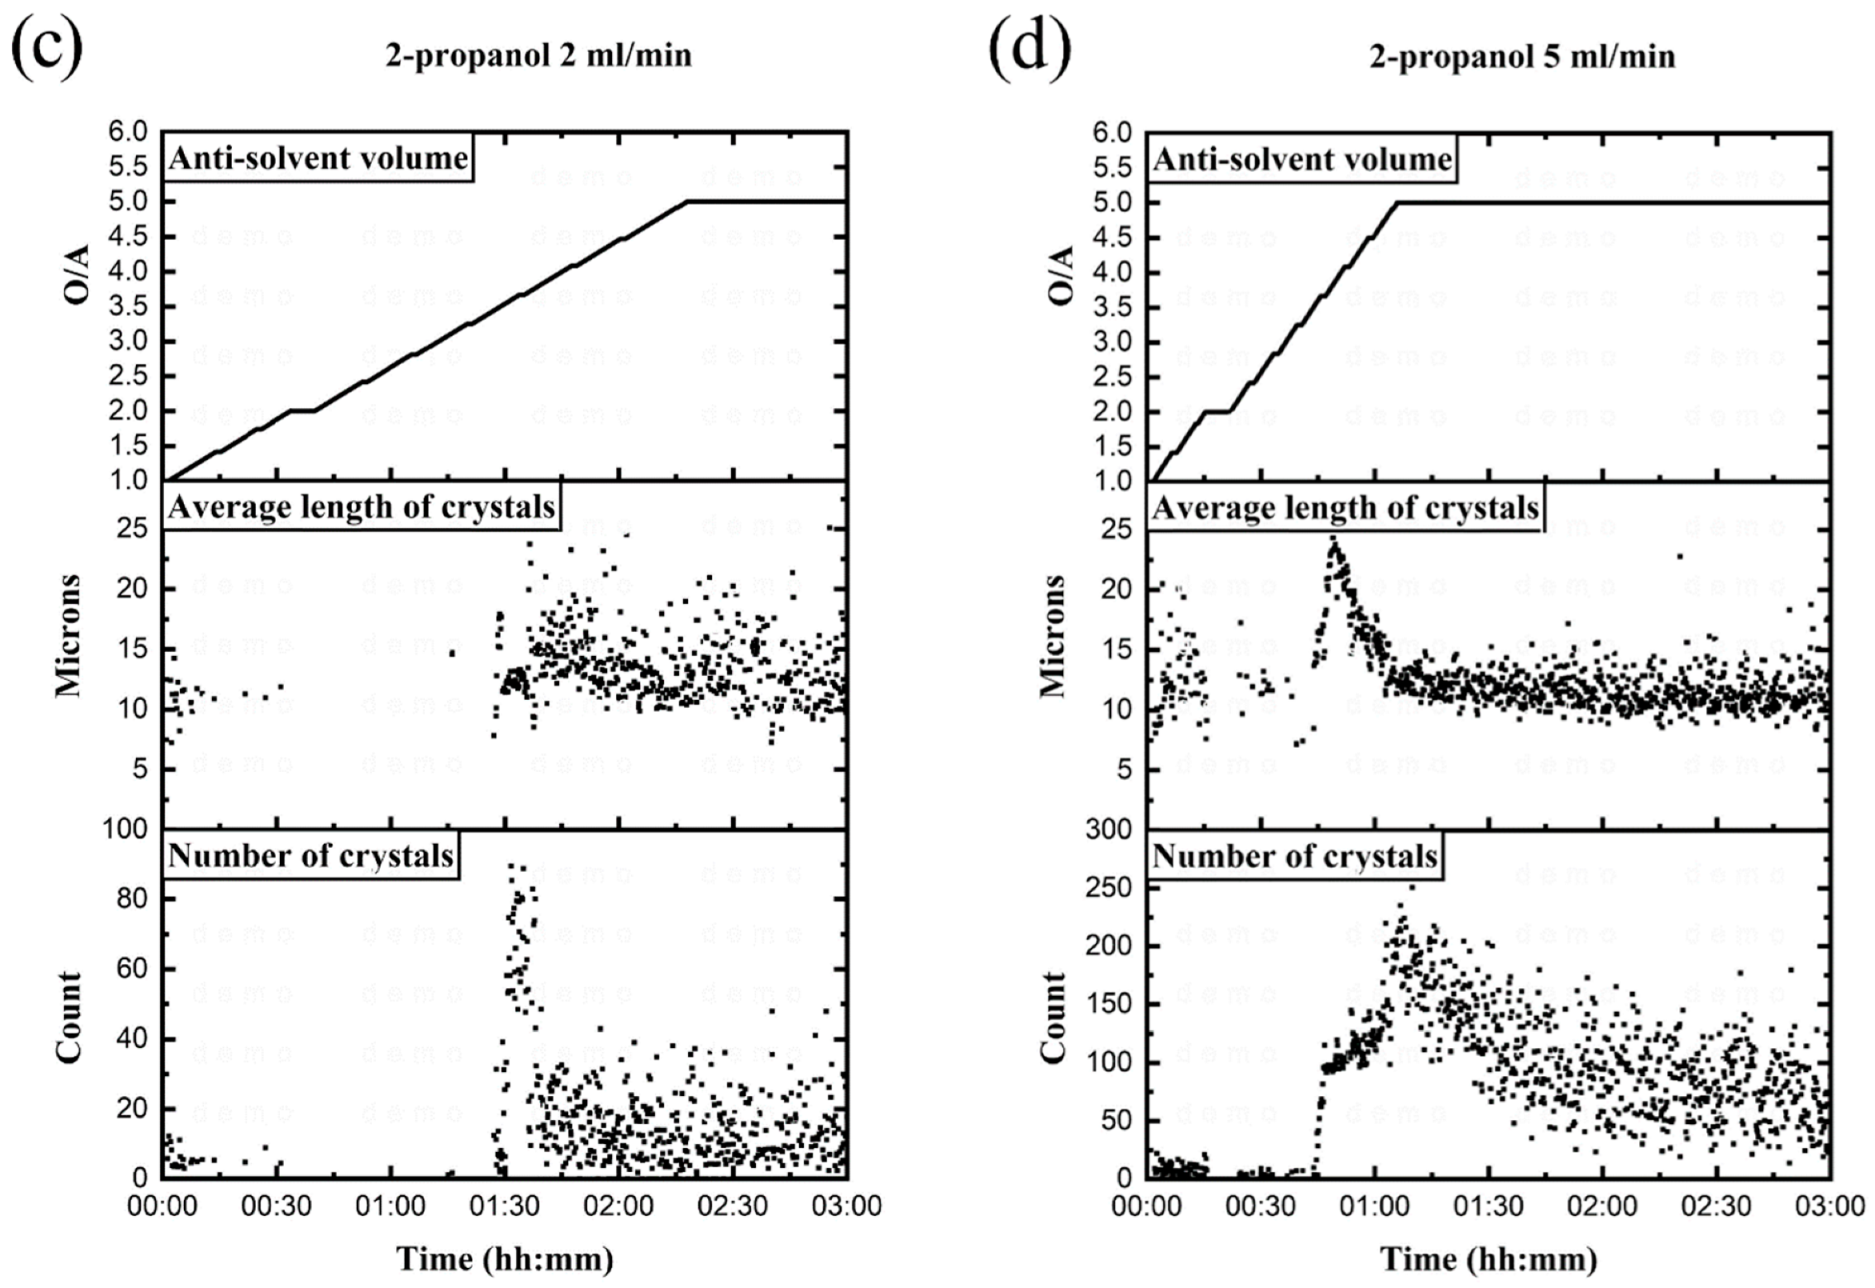
3.3.2. Controlling Parameters through Addition Rate

Adjusting the rate of addition allows for finer regulation of several variables. The rates of crystal nucleation and growth as well as the degree of supersaturation are the primary characteristics controlling the crystallization process that may be controlled by the addition rate. The degree of supersaturation has a direct impact on the crystallization yield while nucleation and growth rates mostly affect the morphological properties of crystals. It is important to note that the anti-solvent qualities also have an impact on these variables, in addition to the addition rate. For instance, it was shown in Section 3.1 that the crystallization yield is inversely proportional to the dielectric constant of the anti-solvent. As a result, in this section, the background of these parameters with a relative discussion of the results is provided. The section is followed by a discussion of the impact of the addition rate on nucleation and growth rates.

Degree of Supersaturation

The chemical potential differential between the solute in the solution and the crystal form (∆μ) is the driving factor for crystallization [68]. This can be defined as:
μ = R T l n ( a a * )
In which “a” is the activity of the solute in the supersaturated condition and “a*” is the activity in the saturated condition. R and T denote the ideal gas constant and temperature. The ratio of the activity values is the supersaturation, S [69]. Therefore, for the non-ideal solution, supersaturation equals:
S = x x * . γ γ *
where x and x* are mole fractions, and γ and γ* are the activity coefficients. The activity coefficients of PLS components as the function of the acetone and 2-propanol ratio are shown in Figure 1. More specifically, the potassium activity coefficients at different anti-solvent volumetric ratios are given in Table 6.
In the presence of acetone, the activity coefficient of potassium is somewhat greater than in the presence of 2-propanol. This can mean that the supersaturation is higher when acetone is used as the anti-solvent. Although the difference between the potassium activity coefficients in the presence of acetone and 2-propanol seems minor, the slightest difference in activity can significantly affect the crystals' nucleation rate and process efficiency [70,71].

Nucleation Rate

The rate of nucleation is often explained using the classical nucleation theory [72]. This theory describes nucleation as a single-step homogeneous process. The rate of nucleation in this condition is determined by the following equation:
J h o m = A h o m . e x p ( 16 π Υ 3 υ c 2 3 k B 3 T 3 ( l n S ) 2 )
In which Ahom, ϒ, υc, kB, T, and S are, pre-exponential factors, surface free energy, Boltzmann’s constant, temperature, and supersaturation, respectively. The parameters that can be controlled in anti-solvent crystallization are supersaturation, temperature, and surface-free energy [69]. It has been proposed that the nucleation rate is most susceptible to supersaturation. The nucleation rate may rise by a factor of roughly 1070 if the supersaturation value is raised from 2 to 4 [70]. Due to the greater activity coefficient of potassium in the presence of acetone, it can be concluded that, according to the classical nucleation theory, the nucleation rate of potassium in tests using acetone should be larger than that in experiments using 2-propanol.

Growth Rate

The third factor that can be regulated by the progressive addition of anti-solvent is particle growth. The development of bonds between growth units is central to the classical growth theory, which describes how a nucleus develops into a fully developed crystal. The crystal growth in anti-solvent crystallization can be described using the diffusion-surface reaction model [37,69]. In this model, the crystal growth is described in two steps: (i) the diffusion of solute molecules from the bulk of the supersaturated solution to the surface of the crystal and (ii) the integration of the solute molecules on the surface of the crystals. The overall growth rate is expressed using the empirical growth model as follows [72]:
R g = k g . ( S 1 ) g
where kg, S, and g are the overall mass transfer coefficient, supersaturation, and growth parameter, respectively. The values of kg and g vary between 10−7 to 10−9 m/s and 1 to 2, respectively [73]. This model is valid for growth up to a critical size [74]. However, further growth of crystals beyond their critical size occurs due to coagulation, aggregation, and agglomeration, where several crystals collide to form a larger crystal [37]. If this phenomenon happens, the number of particles decreases while their size increases. The particle collision kinetics can be defined by Smoluchowski’s rate of aggregation (rs) [37]:
r s = k s . n p 2
In this equation, ks is the rate constant function of temperature and the kinematic viscosity, and np is the number of particles per unit volume.

3.3.3. Impact of Addition Rate on Nucleation and Growth

The number of crystals and the average crystal length as a function of time for acetone and 2-propanol are shown in Figure 7. The organic-to-aqueous ratio at various stages is also shown in this figure to illustrate the effect of the progressive addition of anti-solvents on the count and size of the particles. The highest potash recoveries were achieved with acetone addition rates of 5 mL/min and 10 mL/min and 2-propanol addition rates of 2 mL/min and 5 mL/min, respectively.
Increasing the addition rate of both acetone and 2-propanol increased the number of crystals. When compared to 2-propanol, more crystals were formed with acetone. This may be due to the higher degree of supersaturation in acetone, and the lower viscosity of acetone. According to Equation (4), the nucleation rate is proportional to the supersaturation. The slightest changes in the supersaturation can result in significant changes in the nucleation rate. Moreover, as described earlier, anti-solvent crystallization is a diffusion-controlled process. A lower viscosity facilitates the diffusion, which accelerates the formation of stable nuclei to the critical radius. Another difference that can be seen in this figure is the O/A ratio in which the maximum number of crystals was obtained. For acetone, the highest number of crystals was observed when the O/A reached the value of 4 regardless of the addition rate. The corresponding figure for 2-propanol was around 3.5.
Figure 7a,b show results from acetone addition experiments with varying rates. Tests initially show some unstable crystals with lengths below 10 microns, but the correlation between the number and the size of particles cannot be stated in this period. In this stage, nucleation has started but the supersaturation is not high enough. When the volumetric ratio of anti-solvent to PLS approaches 2, an increase in both particle number and size is seen. The growth in particle count is more notable than the growth in crystal size and the number of particles seen at an O/A of 10 mL/min was also greater than at an O/A of 5 mL/min at this stage. This is due to the higher supersaturation of the solution, which results in an increase in the nucleation rate. When the O/A was 3, the greatest number of particles was recorded. There is a dramatic decrease in particle count and an accompanying increase in crystal size after this O/A level. As stated earlier, this can occur due to coagulation, aggregation, and agglomeration of the particles. According to Equation (6), increasing the number of particles can increase their collision. Moreover, increasing the number of particles can also affect the viscosity of the mixture. Considering the high number of particles, this phenomenon can be a possible reason for the subsequent increase in the crystal size. This was further proved through SEM imaging of the potash products. The SEM images of the potash products obtained using acetone at addition rates of 5 mL/min and 10 mL/min at two different magnifications are shown in Figure 6. This figure shows potash aggregates at different sizes at both addition rates with smaller crystals aggregating.
Another significant finding from the acetone experiments was the observation of secondary nucleation. A drop in crystal size and an increase in the total number of particles were both found after the formation of aggregates. Secondary nucleation may be the cause for this. Secondary nucleation may occur for various causes, although mechanical attrition is by far the most prevalent cause of low-volume crystallization [75]. Mechanical attrition, in which a single crystal splits into pieces upon contacting the stirrer or crystallizer walls, is thought to be the mechanism by which secondary nucleation in stirred small-volume solutions occurs. This is evident, for example, from the fact that potash aggregates have no discernible shape (Figure 8a,c).
The results for experiments performed using 2-propanol at the addition rates of 2 mL/min and 5 mL/min are shown in Figure 7c,d. When comparing the outcomes of crystallization using 2-propanol and acetone, the first visible difference is in the significant fluctuations in the number and size of the crystals in the presence of 2-propanol. In general, nucleation and growth take place simultaneously, when supersaturation is reached. 2-Propanol has a lower polarity but substantially greater viscosity than acetone, which might delay the onset of supersaturation, thus resulting in a slower nucleation rate. At higher addition rates of 2-propanol, less fluctuation was observed in the number and size of the crystals. Increasing the addition rate results in achieving supersaturation faster. Still, 2-propanol’s nucleation rate in crystallization is substantially slower than acetone. It took around an hour and fifteen minutes with 2-propanol to achieve the maximum number of particles at the addition rate of 5 mL/min, but it took less than 45 min with acetone at the same addition rate.
The SEM images of the potash products obtained using 2-propanol are shown in Figure 9. A noticeable observation are the defects in the crystal structure. Holes and voids in the center of the potash crystals can be observed. This could be a result of a specific crystal defect known as a Schottky defect [76]. A Schottky defect in an ionic crystal is a collection of point defects that maintain electrical neutrality [77,78]. When a Schottky defect occurs in a cubic crystal, it can result in the formation of voids or holes in the center of each surface of the crystal [76,77,78]. This is because the missing ions create a small region of vacancies or empty space in the crystal structure, which can manifest as a void or hole in the crystal’s surface. Slower crystallization kinetics in 2-propanol can be a reason for this observation since as the addition rate of 2-propanol was increased, the number of defective crystals decreased.
Based on the obtained results, it can be concluded that the optimum condition among those studied for the recovery of potash by anti-solvent crystallization using acetone is O/A = 5 volumetric ratio, addition rate = 10 mL/min, T = 25 °C, t = 180 min, and rpm = 125. In this condition, the potash crystallization yield is around 83%. For 2-propanol, the optimum condition is concluded as O/A = 5 volumetric ratio, addition rate = 5 mL/min, T = 25 °C, t = 180 min, and rpm = 125. In this condition, potash crystallization yield is slightly lower than the one obtained using acetone at around 79%. The chemical composition of potash products obtained in these experiments is shown in Table 7. The purity of products is comparable to the ones in the experiments in which anti-solvents were added all at once.

3.4. Process Considerations

Besides the efficiency of the purification process, the right selection of an anti-solvent for processing feldspar leaching solution is also reliant on operating conditions. Although acetone results in a higher potassium recovery, the amounts recovered when employing 2-propanol were not significantly different, i.e., comparing operational aspects is a useful approach for selecting the better anti-solvent. This section focuses on the anti-solvent recovery method with insights into energy demand.

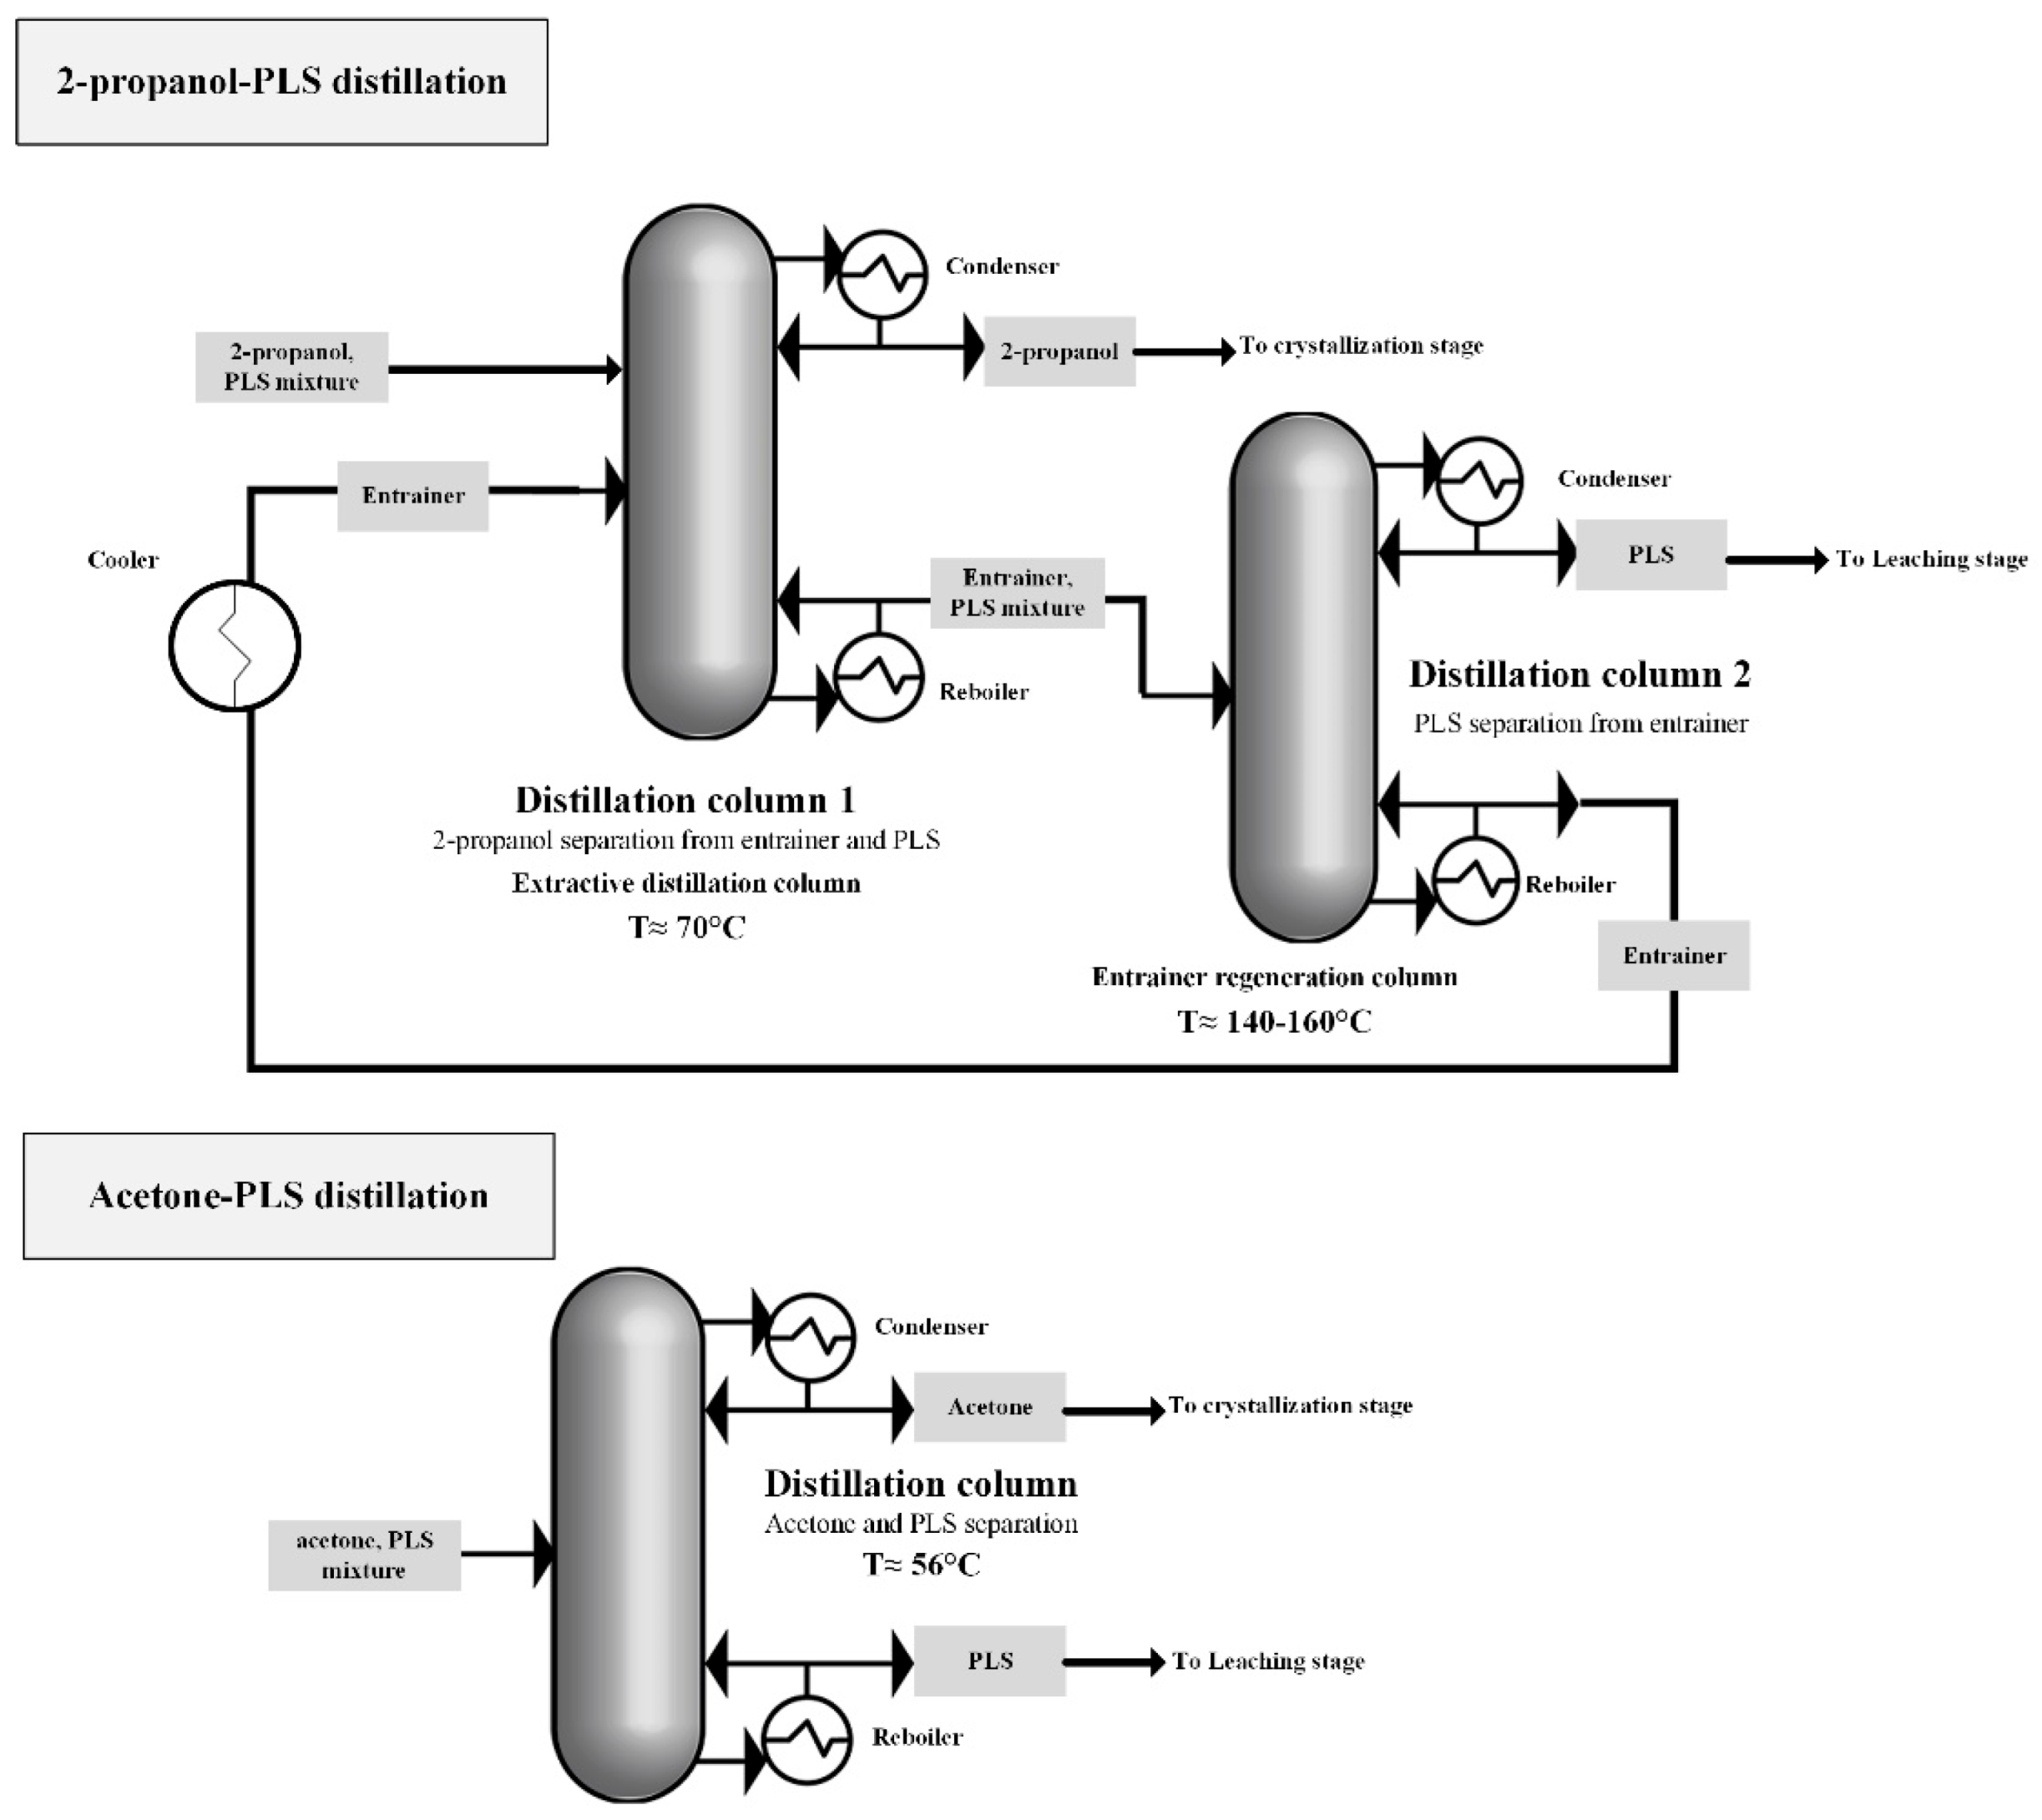
3.4.1. Anti-Solvent Recovery Method

After the crystallization of potash, recovery of the anti-solvent in a mixture with the PLS is required for further use in the process cycle. Distillation is the most commonly used method for anti-solvent recovery. Depending on the difference between the boiling point of the aqueous solution and the anti-solvent, various distillation methods can be applied [79]. A higher difference in the boiling point of the mixture components is typically desirable for their separation by distillation. Simple distillation is a process by which two liquids are separated by one stage of heating above the boiling point of the most volatile component. It can be used when there is at least an 80℃ difference in the boiling points. The distillation method becomes more complex if the difference in the boiling points is lower. Water miscible organic solutions may form azeotropes with water, which also impose a problem for separation.
At atmospheric pressure, acetone does not form an azeotrope with water; however, the formation of an azeotropic solution of water and 2-propanol is possible at a 2-propanol weight percentage of 87.7 [80]. Moreover, the difference in boiling point of PLS (104 °C) and acetone (56 °C) is much higher than between the PLS and 2-propanol (82 °C). Still, the difference in PLS and acetone boiling points is not high enough for simple distillation. Therefore, the conventional method for acetone and water separation is fractional distillation, which follows the same procedure as simple distillation, but is performed in a sequence of several distillation steps to improve the purity of the product (distillation rectification) [81]. The separation of 2-propanol from water has been studied using a variety of distillation methods, including vacuum distillation, extractive distillation, heterogeneous azeotropic distillation, etc. However, extractive distillation has shown to be the most cost-effective and technically feasible method thus far [80,82]. Extractive distillation is defined as distillation in the presence of a miscible, high-boiling, relatively non-volatile component, which is called solvent or entrainer, that forms no azeotrope with the other components in the mixture [82]. The addition of an entrainer makes selective separation of mixture components possible that otherwise cannot be separated. However, the addition of a third solvent adds to the complexity of the process. Various entrainers, such as glycerol [82], have been shown to be effective for 2-propanol–water separation. Accordingly, in conclusion, the method of acetone separation from PLS after crystallization can be assumed to be less complex than the separation of PLS and 2-propanol. Simple flowsheets of distillation processes for the separation of PLS from acetone and 2-propanol, respectively, are shown in Figure 10.
The second operating factor affecting the process is energy consumption. The main difference in energy consumption in the recovery of the anti-solvent via distillation determines the energy needed for the process. The energy consumed for heating can be taken into account using the specific heat capacity and the enthalpy of vaporization. Specific heat capacity indicates the energy necessary to obtain solutions to the boiling point, while enthalpy of vaporization describes the energy required for phase transition from liquid to gaseous. Since acetone and 2-propanol were found to have the same volumetric ratio for efficient crystallization, and their densities are quite the same, differences in mass were disregarded in the discussion.
Table 8 shows the boiling point, specific heat capacity, and enthalpy of vaporization of pure acetone and 2-propanol. Acetone has a lower specific heat capacity than 2-propanol. Therefore, less energy is needed to heat acetone than 2-propanol when both compounds are heated from room temperature to the same ultimate temperature. Additionally, acetone distillation requires a smaller temperature change than 2-propanol does. Extractive distillation of the PLS-2-propanol mixture is also performed in two steps [82]. The mixture then has to be typically heated to between 70 °C to 80 °C for 2-propanol separation and to 140 °C and 160 °C (depending on the type of entrainer) for PLS and entrainer separation [80,82,83]. As a result, the temperature changes necessary for the separation of PLS and 2-propanol are greater than those required for the separation of acetone and PLS. Moreover, the enthalpy of vaporization of 2-propanol is higher than acetone. Accordingly, it can be estimated that the energy required for the distillation of the acetone-PLS mixture is lower than the 2-propanol-PLS mixture.
Anti-solvent loss during distillation must be compensated for, which adds another variable to the operational cost spectrum alongside energy consumption. Loss of organic solutions during the distillation process can happen since fully complete separation of phases typically does not happen. So, the addition of an extra anti-solvent to the process cycle is required. Table 8 shows that when acetone and 2-propanol are compared in terms of pricing, the former is the more affordable option. The anti-solvent loss has been shown to be around 1 L per 1 m3 of anti-solvent in the cycle Moreover, during the 2-propanol distillation process, the loss of entrainer can also happen, which further adds to the operating cost. Accordingly, acetone distillation has lower energy consumption and cheaper reagents cost when compared to 2-propanol distillation.

3.4.2. Limitations and Potential Improvements

The limitations and prospective improvements related to the proposed anti-solvent crystallization technique for feldspar leaching solution purification are discussed in this section. Anti-solvent crystallization was used to selectively extract muriate of potash from HCl-based feldspar leaching solution. Experiments were conducted using a synthetic 2 M HCl solution. Changing the HCl concentration may affect process efficiency as the activities of potassium and chloride ions increase as the HCl concentration increases. Meanwhile, the solubility of potassium chloride may rise in this manner. The selected approach has shown to be practical for a 2 M HCl solution, with around 83% of the potassium recovered under optimal conditions. The addition rate of anti-solvent was determined to be considerably effective on process efficiency. The addition rate in this research was optimized based on the volume of the reactor used for crystallization tests. As a result, re-optimization of this parameter is required for each up-scaling to achieve optimal process efficiency. Moreover, after crystallization, a fraction of K and Al will remain in the aqueous solution. The buildup of potassium within the process cycle can be considered advantageous for the crystallization process. However, the presence of Al may become an issue that needs to be solved.
Furthermore, as noted in the introduction, one key challenge associated with the anti-solvent crystallization approach is managing large quantities of solution. The addition of anti-solvent at five times the volumetric ratio of the PLS was shown to be required for efficient potassium recovery in the developed procedure in this study. Even at such a high volumetric ratio, only potassium crystallization occurred. The approach was shown to be ineffective for recovering metals (divalent, and trivalent cations), and monovalent cations at low concentrations. Despite the fact that numerous anti-solvents with varying characteristics were investigated, the utility of this approach for crystallizing metals from chloride-based solutions is restricted to monovalent cations with high concentrations. Accordingly, to broaden the application of this method for other cations, further research is needed.
Regarding the content presented in the process considerations section (Section 3.4), most of the information was gathered from the available literature. It was performed to obtain an insight into the anti-solvent recovery process. The differences found in several elements of processing were significant. However, more precise calculations supported by experimental data are necessary for detailed design. Furthermore, since the aqueous solution employed is chloride-based, material selection for equipment is an important element to consider. The chloride ion is very corrosive, which may result in increased operational and capital expenses. Also, if the process requires evaporation of the aqueous solution, as outlined in the 2-propanol recovery route, safety precautions must be taken since chloride gas emissions are conceivable.

4. Conclusions

In this study, the application of anti-solvent crystallization for the purification of leaching solution achieved by HCl leaching of feldspar with the aim of selective recovery of potash was investigated. Initially, screening experiments adding all anti-solvents at once were performed to assess the efficiency of five different organic liquids on the crystallization of dissolved feldspar components. Anti-solvent crystallization experiments were performed using methanol, ethanol, acetone, 2-propanol, and ethylene. In this step, it was concluded that:
  • The highest crystallization yields for potassium in these experiments were obtained using acetone and 2-propanol at around 68% and 69%, respectively.
  • The potash products obtained in these experiments had a purity of over 99.9%.
The experimental results prove the concept of applicability of anti-solvent crystallization as a potential purification process for feldspar leaching solution with the aim of potash production. The importance of the findings can be sought in the context of potash extraction from unconventional resources. When potash is used as fertilizer, the inclusion of impurities such as Al and Fe may reduce its market value since their presence may stunt plant growth. The results obtained in screening experiments showed that a pure potash product can be produced from a feldspar leaching solution. The next step of experiments was focused on optimizing the efficiency of the process while keeping the purity of the potash product at high levels.
In the continuation, the experiments were focused on applying acetone and 2-propanol with varying process parameters. At first, the effect of the anti-solvent ratio (from 0.2 to 5) and the time (24 h, 48 h, and 72 h) on the crystallization yield of the potassium using acetone and 2-propanol was investigated. Based on the results, it was shown that:
  • For efficient crystallization of potassium using either anti-solvent, at least an O/A of 5 is required and all chemical and physical interactions during the process happen in less than 24 h.
Based on the obtained results regarding the O/A and time, the effect of the addition rate on potash crystallization was further investigated. In all previous experiments, anti-solvents were added to the PLS all at once. It was shown that through the progressive addition of anti-solvents, the crystallization yield can be improved by mitigating burst nucleation. The main concluding observations were that:
  • The highest potassium crystallization yields were 83% using acetone at an addition rate of 10 mL/min and 79% using 2-propanol at an addition rate of 5 mL/min.
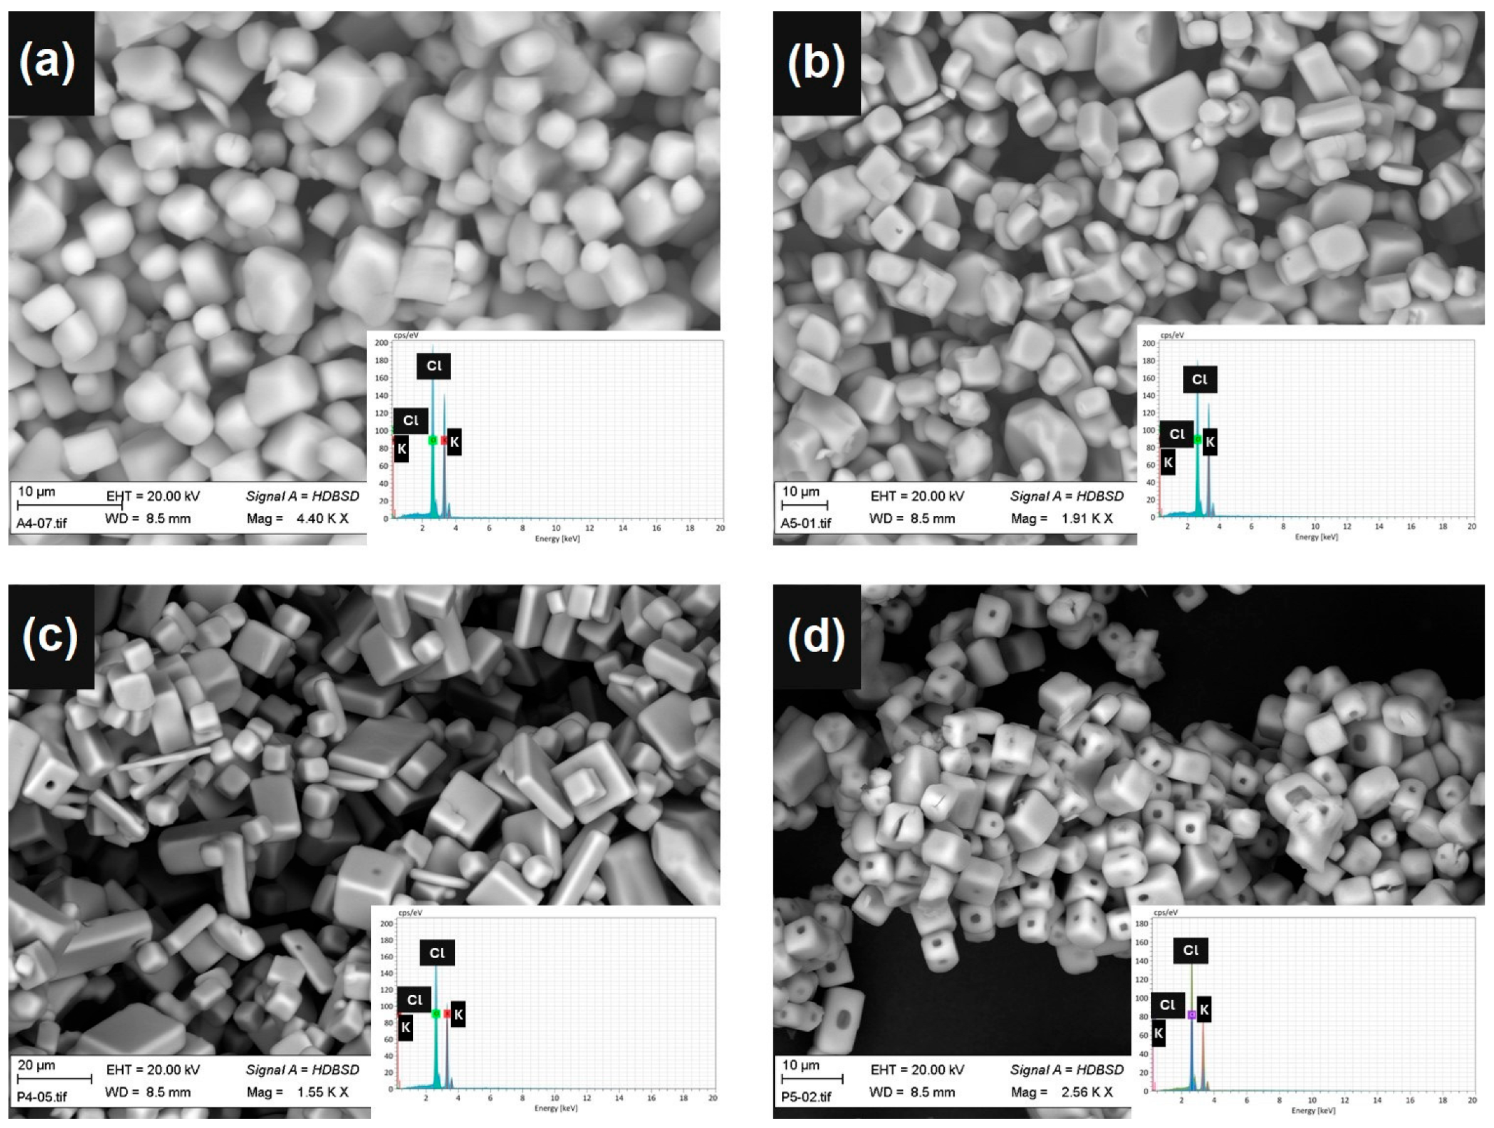
  • In all the experiments, selective crystallization of the potassium was observed. The final potash product has a purity of over 99.9% with sodium as the major impurity.
The results obtained in this work indicate that a selective recovery of potassium from the feldspar leaching solution is possible through the anti-solvent crystallization method using either acetone or 2-propanol. It follows that the morphology and crystal size of the potash particles may be affected by the type of anti-solvent used. It was shown that:
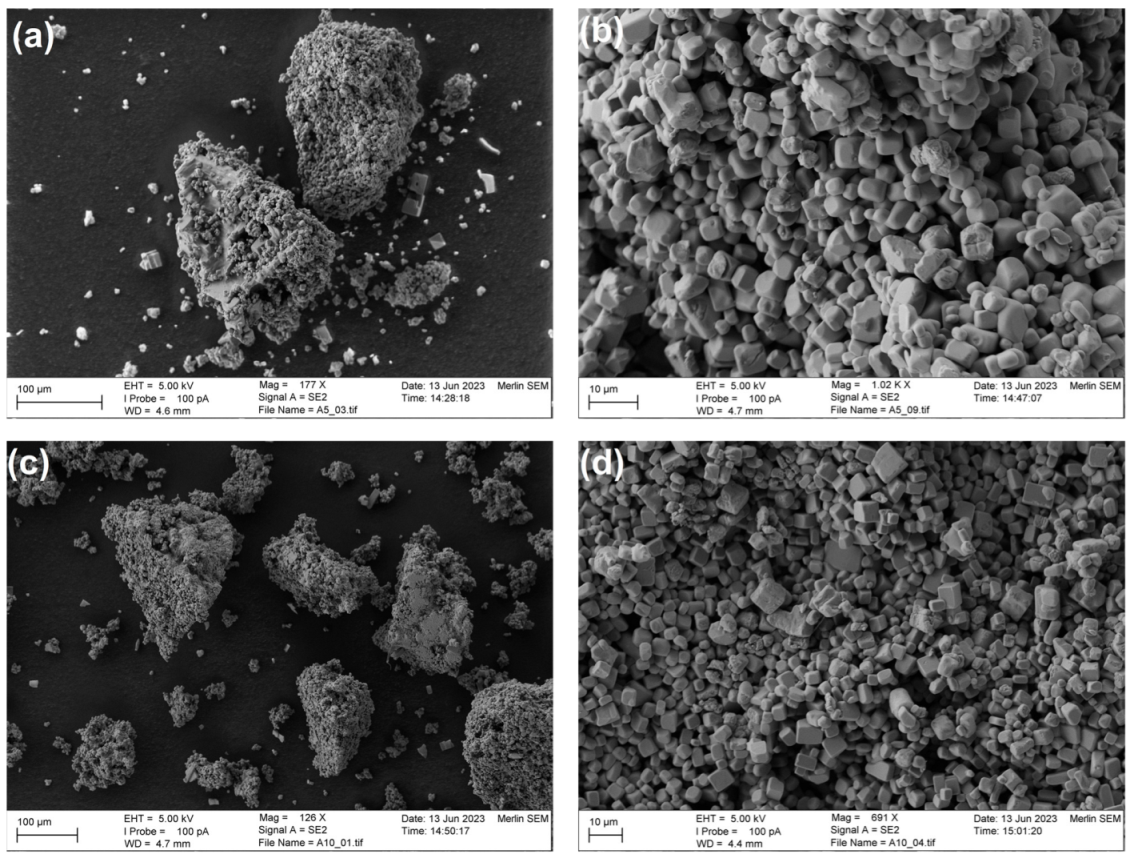
  • The application of acetone reduced the size of potash crystals as compared to 2-propanol.
  • When acetone was applied, crystal aggregation was detected.
Moreover, the choice of anti-solvent also affects the downstream solvent separation processes, by processes such as distillation. It was shown that:
  • The separation of acetone from a PLS-antisolvent mixture turned out to be less complex requiring less energy for distillation.
Considering these factors, the use of acetone for potash crystallization seems to be more feasible than the use of 2-propanol.

Author Contributions

Conceptualization, S.S., L.S.-Ö., J.R. and Y.G.; methodology, S.S., L.S.-Ö., J.R. and Y.G.; software, S.S.; validation, S.S.; formal analysis, S.S.; investigation, S.S.; writing—original draft preparation, S.S.; writing—review and editing, L.S.-Ö., J.R. and Y.G.; visualization, S.S.; supervision, L.S.-Ö., J.R. and Y.G.; project administration, J.R. and Y.G.; funding acquisition, Y.G. All authors have read and agreed to the published version of the manuscript.

Funding

This study is a part of the POTASSIAL project for which funding was provided by Vinnova, Sweden’s innovation agency, as part of the ERA-MIN 3 co-funded call (Vinnova 2022-00023).

Data Availability Statement

Data will be made available on request.

Conflicts of Interest

The authors declare no conflict of interest.

References

  1. King, H. Feldspar a Large Group of Silicate Minerals. The Most Abundant Group of Minerals in Earth’s Crust. Available online: https://geology.com/minerals/feldspar.shtml (accessed on 15 June 2023).
  2. Samantray, J.; Anand, A.; Dash, B.; Ghosh, M.K.; Behera, A.K. Production of potassium chloride from K-feldspar through roast–leach–solvent extraction route. Trans. Indian Inst. Met. 2019, 72, 2613–2622. [Google Scholar] [CrossRef]
  3. Zahradník, J.; Jirásek, J.; Starý, J.; Sivek, M. Production, Reserves, and Processing of Feldspar and Feldspathoid Rocks in the Czech Republic from 2005 to 2019—An Overview. Minerals 2020, 10, 722. [Google Scholar] [CrossRef]
  4. Salimkhani, H.; Joodi, T.; Bordbar-Khiabani, A.; Dizaji, A.M.; Abdolalipour, B.; Azizi, A. Surface and structure characteristics of commercial K-Feldspar powders: Effects of temperature and leaching media. Chin. J. Chem. Eng. 2020, 28, 307–317. [Google Scholar] [CrossRef]
  5. Samantray, J.; Anand, A.; Dash, B.; Ghosh, M.K.; Behera, A.K. Silicate minerals-Potential source of potash—A review. Miner. Eng. 2022, 179, 107463. [Google Scholar] [CrossRef]
  6. Kumanan, M.; Sathya, G.; Nandakumar, V.; Berchmans, L.J. Extraction of potash from K-Feldspar mineral by acid and molten salt leaching processes. Chem. Eng. 2016, 7, 1–10. [Google Scholar]
  7. Heffer, P.; Prud’homme, M. Fertilizer Outlook 2016–2020. In Proceedings of the 84th IFA Annual Conference, Moscow, Russia, 30 May–1 June 2016; pp. 1–5. [Google Scholar]
  8. Jena, S.K. A review on potash recovery from different rock and mineral sources. Min. Met. Explor. 2021, 38, 47–68. [Google Scholar] [CrossRef]
  9. National Minerals Information Center, Potash Statistics and Information, U.S. Geological Survey. 2023. Available online: https://www.usgs.gov/centers/national-minerals-information-center/potash-statistics-and-information (accessed on 15 June 2023).
  10. Ciceri, D.; Allanore, A. Microfluidic leaching of soil minerals: Release of K+ from K feldspar. PLoS ONE 2015, 10, e0139979. [Google Scholar] [CrossRef] [PubMed]
  11. Qiu, L.-H.; Wang, L.-S.; Jin, Z.-M. Leaching process of potassium sulfate from roasts of potash feldspar, gypsum and calcium carbonate. J. Chem. Eng. Chin. Univ. 2000, 14, 465–469. [Google Scholar]
  12. Feng, W.; Ma, H. Thermodynamic analysis and experiments of thermal decomposition for potassium feldspar at intermediate temperatures. Guisuanyan Xuebao (J. Chin. Ceram. Soc.) 2004, 32, 789–799. [Google Scholar]
  13. Jena, S.K.; Dhawan, N.; Rath, S.S.; Rao, D.S.; Das, B. Investigation of microwave roasting for potash extraction from nepheline syenite. Sep. Purif. Technol. 2016, 161, 104–111. [Google Scholar] [CrossRef]
  14. Jena, S.K.; Misra, P.K.; Das, B. Studies on extraction of potassium from feldspar by roast-leach method using phosphogypsum and sodium chloride. Miner. Process. Extr. Metall. Rev. 2016, 37, 323–332. [Google Scholar] [CrossRef]
  15. Jena, S.K.; Dash, N.; Samal, A.K.; Misra, P.K. Competency of chlorination roasting coupled water leaching process for potash recovery from K-feldspar: Mechanism and kinetics aspects. Korean J. Chem. Eng. 2019, 36, 2060–2073. [Google Scholar] [CrossRef]
  16. Ma, H.W.; Su, S.Q.; Yang, J.; Cai, B.Y.; Liu, M.T.; Yao, W.G.; Peng, H. Preparation of potassium sulfate from K-feldspar by hydrothermal alkaline method: Reaction principle and process evaluation. CIESC J. 2014, 65, 2363–2371. [Google Scholar]
  17. Yuan, B.; Li, C.; Liang, B.; Lü, L.; Yue, H.; Sheng, H.; Ye, L.; Xie, H. Extraction of potassium from K-feldspar via the CaCl2 calcination route. Chin. J. Chem. Eng. 2015, 23, 1557–1564. [Google Scholar] [CrossRef]
  18. Nie, Y.; Ma, H.; Liu, H.; Zhang, P.; Qiu, M.Y.; Wang, L. Reactive mechanism of potassium feldspar dissolution under hydrothermal condition. Guisuanyan Xuebao (J. Chin. Ceram. Soc.) 2006, 34, 846. [Google Scholar]
  19. Wang, C.; Yue, H.; Li, C.; Liang, B.; Zhu, J.; Xie, H. Mineralization of CO2 using natural K-feldspar and industrial solid waste to produce soluble potassium. Ind. Eng. Chem. Res. 2014, 53, 7971–7978. [Google Scholar] [CrossRef]
  20. Ma, J.; Zhang, Y.; Qin, Y.; Wu, Z.; Wang, T.; Wang, C. The leaching kinetics of K-feldspar in sulfuric acid with the aid of ultrasound. Ultrason. Sonochem. 2017, 35, 304–312. [Google Scholar] [CrossRef] [PubMed]
  21. Yi, L.; Peng, Q.; He, Q.; Peng, Q. Isolation and identification of potash feldspar-solubilizing bacteria and their potassium-releasing activities. Zhongguo Weishengtaxixue Zazhi/Chin. J. Microecol. 2012, 24, 773–785. [Google Scholar]
  22. Ciceri, D.; de Oliveira, M.; Chen, D.P.; Allanore, A. Role of processing temperature and time on the hydrothermal alteration of K-feldspar rock in autoclave. Min. Met. Explor. 2020, 37, 955–963. [Google Scholar] [CrossRef]
  23. Fogler, H.S.; Lund, K.; McCune, C.C. Acidization III—The kinetics of the dissolution of sodium and potassium feldspar in HF/HCl acid mixtures. Chem. Eng. Sci. 1975, 30, 1325–1332. [Google Scholar] [CrossRef]
  24. Xue, N.; Zhang, Y.; Liu, T.; Huang, J. Study of the dissolution behavior of muscovite in stone coal by oxygen pressure acid leaching. Metall. Mater. Trans. B 2016, 47, 694–701. [Google Scholar] [CrossRef]
  25. Rossi, G. Potassium recovery through leucite bioleaching possibilities and limitations. In Metallurgical Applications of Bacterial Leaching and Related Microbiological Phenomena; Academic Press: New York, NY, USA, 1978; ISBN 0125111509. [Google Scholar]
  26. Štyriaková, I.; Štyriak, I.; Malachovský, P.; Lovás, M. Biological, chemical and electromagnetic treatment of three types of feldspar raw materials. Miner. Eng. 2006, 19, 348–354. [Google Scholar] [CrossRef]
  27. Kleiv, R.A.; Thornhill, M. Production of mechanically activated rock flour fertilizer by high intensive ultrafine grinding. Miner. Eng. 2007, 20, 334–341. [Google Scholar] [CrossRef]
  28. Nojiri, H.; Okuno, M.; Okudera, H.; Mizukami, T.; Arai, S. Structural change of alkali feldspar by ball milling. J. Mineral. Petrol. Sci. 2013, 108, 267–277. [Google Scholar] [CrossRef]
  29. Ribbe, P.H. Feldspar Mineralogy; Mineralogical Society of America: Chantilly, VA, USA, 1983; ISBN 0-939950-14-6. [Google Scholar]
  30. Vernon, R.H. K-feldspar megacrysts in granites—Phenocrysts, not porphyroblasts. Earth Sci. Rev. 1986, 23, 1–63. [Google Scholar] [CrossRef]
  31. Dye, J.L.; DeBacker, M.G. Physical and chemical properties of alkalides and electrides. Annu. Rev. Phys. Chem. 1987, 38, 271–299. [Google Scholar] [CrossRef]
  32. Elseewi, A.A.; Straughan, I.R.; Page, A.L. Sequential cropping of fly ash-amended soils: Effects on soil chemical properties and yield and elemental composition of plants. Sci. Total Environ. 1980, 15, 247–259. [Google Scholar] [CrossRef]
  33. Lee, G.S.; Uchikoshi, M.; Mimura, K.; Isshiki, M. Separation of major impurities Ce, Pr, Nd, Sm, Al, Ca, Fe, and Zn from La using bis (2-ethylhexyl) phosphoric acid (D2EHPA)-impregnated resin in a hydrochloric acid medium. Sep. Purif. Technol. 2010, 71, 186–191. [Google Scholar] [CrossRef]
  34. Fritsch, E.; Allard, T.; Benedetti, M.F.; Bardy, M.; Nascimento, N.R.D.; Li, Y.; Calas, G. Organic complexation and translocation of ferric iron in podzols of the Negro River watershed. Separation of secondary Fe species from Al species. Geochim. Cosmochim. Acta 2009, 73, 1813–1825. [Google Scholar] [CrossRef]
  35. Ma, Y.; Svärd, M.; Xiao, X.; Gardner, J.M.; Olsson, R.T.; Forsberg, K. Precipitation and crystallization used in the production of metal salts for Li-ion battery materials: A review. Metals 2020, 10, 1609. [Google Scholar] [CrossRef]
  36. Moldoveanu, G.A.; Demopoulos, G.P. Organic solvent-assisted crystallization of inorganic salts from acidic media. J. Chem. Technol. Biotechnol. 2015, 90, 686–692. [Google Scholar] [CrossRef]
  37. Sinha, B.; Müller, R.H.; Möschwitzer, J.P. Bottom-up approaches for preparing drug nanocrystals: Formulations and factors affecting particle size. Int. J. Pharm. 2013, 453, 126–141. [Google Scholar] [CrossRef]
  38. Jia, S.; Yang, P.; Gao, Z.; Li, Z.; Fang, C.; Gong, J. Recent progress in antisolvent crystallization. CrystEngComm 2022, 24, 3122–3135. [Google Scholar] [CrossRef]
  39. Tulcidas, A.; Nascimento, S.; Santos, B.; Alvarez, C.; Pawlowski, S.; Rocha, F. Statistical methodology for scale-up of an anti-solvent crystallization process in the pharmaceutical industry. Sep. Purif. Technol. 2019, 213, 56–62. [Google Scholar] [CrossRef]
  40. Demirel, H.S.; Svärd, M.; Uysal, D.; Doğan, Ö.M.; Uysal, B.Z.; Forsberg, K. Antisolvent crystallization of battery grade nickel sulphate hydrate in the processing of lateritic ores. Sep. Purif. Technol. 2022, 286, 120473. [Google Scholar] [CrossRef]
  41. Korkmaz, K.; Alemrajabi, M.; Rasmuson, Å.C.; Forsberg, K.M. Separation of valuable elements from NiMH battery leach liquor via antisolvent precipitation. Sep. Purif. Technol. 2020, 234, 115812. [Google Scholar] [CrossRef]
  42. Xuan, W.; Chagnes, A.; Xiao, X.; Olsson, R.T.; Forsberg, K. Antisolvent Precipitation for Metal Recovery from Citric Acid Solution in Recycling of NMC Cathode Materials. Metals 2022, 12, 607. [Google Scholar] [CrossRef]
  43. Peters, E.M.; Svärd, M.; Forsberg, K. Impact of process parameters on product size and morphology in hydrometallurgical antisolvent crystallization. CrystEngComm 2022, 24, 2851–2866. [Google Scholar] [CrossRef]
  44. Peters, E.M.; Kaya, Ş.; Dittrich, C.; Forsberg, K. Recovery of scandium by crystallization techniques. J. Sustain. Metall. 2019, 5, 48–56. [Google Scholar] [CrossRef]
  45. Kaya, Ş.; Peters, E.M.; Forsberg, K.; Dittrich, C.; Stopic, S.; Friedrich, B. Scandium recovery from an ammonium fluoride strip liquor by anti-solvent crystallization. Metals 2018, 8, 767. [Google Scholar] [CrossRef]
  46. Alimohammadizadeh, H.; Behrad-Vakylabad, A.; Ghader, S. On the optimization of the crystallization related to an aqueous copper sulfate (CuSO4. 5H2O). Miner. Process. Extr. Metall. 2021, 130, 50–58. [Google Scholar]
  47. Ma, C.; Svärd, M.; Forsberg, K. Recycling cathode material LiCo1/3Ni1/3Mn1/3O2 by leaching with a deep eutectic solvent and metal recovery with antisolvent crystallization. Resour. Conserv. Recycl. 2022, 186, 106579. [Google Scholar] [CrossRef]
  48. Djamali, E.; Tomson, M.B.; Chapman, W.G. Thermodynamic Properties and Solubility of Sodium and Potassium Chloride in Ethane-1, 2-diol/Water Mixed Solvent Systems to High Temperatures. J. Chem. Eng. Data 2017, 62, 1326–1334. [Google Scholar] [CrossRef]
  49. Seidell, A. Solubilities of Inorganic and Metal Organic Compounds, 3rd ed.; National Institute of Health: Washington, DC, USA, 1940. [Google Scholar]
  50. ERA-MIN3, Zero-Waste Valorisation of Feldspathic Ores: Green Application and Sustainable Sourcing of Strategic Raw Materials. 2021. Available online: https://www.era-learn.eu/network-information/networks/era-min3/eu-co-funded-era-min-joint-call-2021/zero-waste-valorisation-of-feldspathic-ores-green-application-and-sustainable-sourcing-of-strategic-raw-materials (accessed on 15 June 2023).
  51. Peeters, D. Hydrogen bonds in small water clusters: A theoretical point of view. J. Mol. Liq. 1995, 67, 49–61. [Google Scholar] [CrossRef]
  52. Schneider, H. The selective solvation of ions in mixed solvents. J. Chim. Phys. 1969, 66, 2. [Google Scholar] [CrossRef]
  53. Wypych, G. Handbook of Solvents; ChemTec Publishing: Toronto, ON, Canada, 2001; ISBN 1-895198-24-0. [Google Scholar]
  54. Pitzer, K.S.; Press, C.R.C. Activity Coefficients in Electrolyte Solutions; CRC Press: Boca Raton, FL, USA, 1991. [Google Scholar]
  55. Price, E. Solvation of electrolytes and solution equilibria. Chem. Non-Aqueous Sol. Princ. Techn. 1966, 1, 67. [Google Scholar]
  56. Desnoyers, J.E.; Jolicoeur, C. Hydration effects and thermodynamic properties of ions. In Modern Aspects of Electrochemistry; Bockris, J.O.M., Conway, B.E., Eds.; Plenum: New York, NY, USA, 1969; Volume 5, p. 26. [Google Scholar]
  57. Atomistic Simulation Group in the Materials Department of Imperial College, Database of Ionic Radii. Available online: http://abulafia.Mt.Ic.Ac.Uk/Shannon/Ptable.Php (accessed on 15 June 2023).
  58. Fonseca, T.L.; Coutinho, K.; Canuto, S. Hydrogen bond interactions between acetone and supercritical water. Phys. Chem. Chem. Phys. 2010, 12, 6660–6665. [Google Scholar] [CrossRef] [PubMed]
  59. Daniele, P.G.; De Robertis, A.; De Stefano, C.; Sammartano, S.; Rigano, C. On the possibility of determining the thermodynamic parameters for the formation of weak complexes using a simple model for the dependence on ionic strength of activity coefficients: Na+, K+, and Ca2+ complexes of low molecular weight ligands in aqueous solution. J. Chem. Soc. Dalton Trans. 1985, 11, 2353–2361. [Google Scholar] [CrossRef]
  60. Ghosh, A.K.; Mukerjee, P. Ionic strength effects on the activity coefficient of methylene blue and its self-association. J. Am. Chem. Soc. 1970, 92, 6413–6415. [Google Scholar] [CrossRef]
  61. Sarig, S.; Glasner, A.; Epstein, J.A.; Eidelman, N. Growth of potassium chloride crystals. J. Cryst. Growth 1977, 39, 255–266. [Google Scholar] [CrossRef]
  62. Jin, S.; Chen, M.; Li, Z.; Wu, S.; Du, S.; Xu, S.; Rohani, S.; Gong, J. Design and mechanism of the formation of spherical KCl particles using cooling crystallization without additives. Powder Technol. 2018, 329, 455–462. [Google Scholar] [CrossRef]
  63. MacFhionnghaile, P.; Svoboda, V.; McGinty, J.; Nordon, A.; Sefcik, J. Crystallization diagram for antisolvent crystallization of lactose: Using design of experiments to investigate continuous mixing-induced supersaturation. Cryst. Growth Des. 2017, 17, 2611–2621. [Google Scholar] [CrossRef]
  64. Wang, L.; Bao, Y.; Sun, Z.; Pinfield, V.J.; Yin, Q.; Yang, H. Investigation of Agglomeration in the Presence of Oiling out in the Antisolvent Crystallization Process. Ind. Eng. Chem. Res. 2021, 60, 4110–4119. [Google Scholar] [CrossRef]
  65. Zhang, Y.; Gao, J.; Feng, D.; Du, Q.; Wu, S.; Zhao, Y. Optimization of the process of antisolvent crystallization of carbonized ammonia with a low carbon-to-nitrogen ratio. Fuel Process. Technol. 2017, 155, 59–67. [Google Scholar] [CrossRef]
  66. Lu, C.; Liu, X.; Xia, Y.; Li, Q.; Dang, L.; He, X.; Wang, Z. Determination of Metastable Zone Width and Nucleation Induction Period of Palm Oil and its Olein/Stearin in Melting Layer Crystallization. Chem. Eng. Technol. 2020, 43, 422–428. [Google Scholar] [CrossRef]
  67. Si, Z.; Li, A.; Yan, Y.; Zhang, X.; Yang, H. Interaction of metastable zone width and induction time based on nucleation potential. Ind. Eng. Chem. Res. 2020, 59, 22597–22604. [Google Scholar] [CrossRef]
  68. Smith, J.M. Introduction to Chemical Engineering Thermodynamics; McGraw Hill Publisher: New York, NY, USA, 1950; ISBN 1259696529. [Google Scholar]
  69. Thakur, A.K.; Kumar, R.; Kumar, V.K.V.; Kumar, A.; Gaurav, G.K.; Gupta, K.N. A critical review on thermodynamic and hydrodynamic modeling and simulation of liquid antisolvent crystallization of pharmaceutical compounds. J. Mol. Liq. 2022, 362, 119663. [Google Scholar] [CrossRef]
  70. Kalikmanov, V.I. Classical nucleation theory. In Nucleation Theory; Springer: Berlin/Heidelberg, Germany, 2012; pp. 17–41. [Google Scholar]
  71. Mullin, J.W. Nucleation. Crystallization 2001, 4, 181–215. [Google Scholar]
  72. Kwon, S.G.; Hyeon, T. Formation mechanisms of uniform nanocrystals via hot-injection and heat-up methods. Small 2011, 7, 2685–2702. [Google Scholar] [CrossRef] [PubMed]
  73. Lewis, A.; Seckler, M.; Kramer, H.; Van Rosmalen, G. Industrial Crystallization: Fundamentals and Applications; Cambridge University Press: Cambridge, UK, 2015. [Google Scholar]
  74. Panagiotou, T.; Mesite, S.V.; Fisher, R.J. Production of norfloxacin nanosuspensions using microfluidics reaction technology through solvent/antisolvent crystallization. Ind. Eng. Chem. Res. 2009, 48, 1761–1771. [Google Scholar] [CrossRef]
  75. Kadam, S.S.; Kramer, H.J.M.; Horst, J.H.T. Combination of a single primary nucleation event and secondary nucleation in crystallization processes. Cryst. Growth Des. 2011, 11, 1271–1277. [Google Scholar] [CrossRef]
  76. Jain, V.K. Defects in Solids. In Solid State Physics; Springer: Berlin/Heidelberg, Germany, 2022; pp. 81–96. [Google Scholar]
  77. Benisek, A.; Dachs, E. Calorimetric study of the entropy relation in the NaCl–KCl system. J. Chem. Thermodyn. 2013, 62, 231–235. [Google Scholar] [CrossRef] [PubMed]
  78. Barrett, W.T.; Wallace, W.E. Studies of NaCl-KCl solid solutions. I. Heats of formation, lattice spacings, densities, Schottky defects and mutual solubilities. J. Am. Chem. Soc. 1954, 76, 366–369. [Google Scholar] [CrossRef]
  79. Saidur, R.; Elcevvadi, E.T.; Mekhilef, S.; Safari, A.; Mohammed, H.A. An overview of different distillation methods for small scale applications. Renew. Sustain. Energy Rev. 2011, 15, 4756–4764. [Google Scholar] [CrossRef]
  80. De Guido, G.; Monticelli, C.; Spatolisano, E.; Pellegrini, L.A. Separation of the Mixture 2-Propanol+ Water by Heterogeneous Azeotropic Distillation with Isooctane as an Entrainer. Energies 2021, 14, 5471. [Google Scholar] [CrossRef]
  81. Weires, N.A.; Johnston, A.; Warner, D.L.; McCormick, M.M.; Hammond, K.; McDougal, O.M. Recycling of waste acetone by fractional distillation. J. Chem. Educ. 2011, 88, 1724–1726. [Google Scholar] [CrossRef]
  82. De, D.; Sai, M.S.N.; Aniya, V.; Jyothi, K.N.; Satyavathi, B. Economic and environmental impact assessment of extractive distillation with renewable entrainers for reprocessing aqueous 2-Propanol. Chem. Eng. Process.-Process Intensif. 2019, 143, 107616. [Google Scholar] [CrossRef]
  83. Zhang, Z.; Zhang, L.; Zhang, Q.; Sun, D.; Pan, F.; Dai, S.; Li, W. Separation of 2-propanol and water azeotropic system using ionic liquids as entrainers. Fluid Phase Equilibria 2016, 412, 94–100. [Google Scholar] [CrossRef]
  84. DDBST GmbH, Dortmund Data Bank. Available online: http://www.ddbst.com/ (accessed on 15 June 2023).
  85. E-Commerce of Chemical. Available online: https://www.echemi.com/ (accessed on 15 June 2023).
Figure 1. Summary of the experimental procedure.
Processes 12 01385 g001
Figure 2. Correlation between K crystallization yield and anti-solvent dielectric constant (O/A = 5, T = 25 °C, and t = 72 h).
Processes 12 01385 g002
Figure 3. Activity coefficient of water and the PLS component for one liter of the PLS as the function of anti-solvent ratio (a) acetone and (b) 2-propanol (PLS with the chemical composition shown in Table 1, ionic strength = 4.31 mol/kg).
Processes 12 01385 g003
Figure 4. Effects of O/A and time on the K concentration at PLS after crystallization (a) acetone (b) 2-propanol.
Processes 12 01385 g004
Figure 5. SEM images of the potash products obtained from crystallization experiments using (a) acetone at O/A of 4, (b) acetone at O/A at of 5, (c) 2-propanol at O/A of 4 (d) 2-propanol at O/A of 5, resolution 1.3 nm.
Processes 12 01385 g005
Figure 6. Effect of addition rate on potash crystallization yield (Final O/A = 5, t = 3 h, rpm = 125, and T = 25 °C).
Processes 12 01385 g006
Figure 7. The count and the average length of particles recorded in the focus area of the crystallizer laser beam using (a) acetone at an addition rate of 5 mL/min (b) acetone at an addition rate of 10 mL/min (c) 2-propanol at an addition rate of 2 mL/min, and (d) 2-propanol at addition rate of 5 mL/min (experimental condition: T = 25 °C and 125 rpm).
Processes 12 01385 g007aProcesses 12 01385 g007b
Figure 8. SEM images of potash products obtained using acetone at (a) an addition rate of 5 mL/min with 177× magnification (b) an addition rate of 5 mL/min with 1020× magnification (c) an addition rate of 10 mL/min with 126× magnification (d) an addition rate of 10 mL/min with 691× magnification.
Processes 12 01385 g008
Figure 9. SEM images of potash products obtained using 2-propanol at addition rates of (a) 2 mL/min, (b) 5 mL/min, (c) 10 mL/min, resolution 1.4 nm.
Processes 12 01385 g009
Figure 10. Simple flowsheets of distillation processes for separation of PLS mixed with acetone/2-propanol.
Processes 12 01385 g010
Table 1. Chemical composition of the synthetic PLS.
Element/CompoundKAlNaCaFeHCl
Concentration9 g/L9 g/L1.5 g/L0.2 g/L0.1 g/L2 M
Table 3. Crystallization yields for the screening experiments (T = 25 °C and t = 72 h)—errors range from 0.5 to 4%.
Anti-SolventsMethanolEthanolAcetone2-PropanolEthylene Glycol
O/A ratio4545454545
K recovery (%)0.00.40.112.150.668.051.068.81.21.2
Na recovery (%)0.00.00.00.30.00.50.00.50.40.0
Al recovery (%)1.80.94.30.52.60.00.40.03.91.3
Fe recovery (%)0.00.00.00.00.00.10.01.00.00.3
Table 5. The concentration of main impurities in the potash products obtained under uncontrolled addition of anti-solvent at O/A of 5, T = 25 °C, and t = 24 h.
Anti-SolventO/ANa (%)Al (%)Ca (%)
Acetone40.0280.0320.018
Acetone50.0540.0340.016
2-propanol40.0360.0300.010
2-propanol50.0890.0570.019
Table 6. The activity coefficient of potassium in the presence of acetone/2-propanol at different O/A ratios.
O/A0.10.51233.64.455.46
Acetone0.52760.57300.62970.72050.85670.92471.01551.08361.12901.1970
2-propanol0.53000.57120.62620.73610.84600.91200.99991.06591.10981.1758
Table 7. The concentration of main impurities in the potash products obtained under progressive addition of anti-solvent at O/A of 5, T = 25 °C, and t = 3 h.
Anti-SolventAnti-Solvent Addition Rate (mL/min)Na (%)Al (%)Ca (%)
Acetone50.01250.02180.0102
Acetone100.02550.01980.0099
2-propanol20.03220.02040.0139
2-propanol50.03410.03900.0178
Table 8. Solution specifications affecting anti-solvent recovery.
SolutionBoiling Point (°C)Specific Heat Capacity [84] (J/(g·K) at 25 °C)Enthalpy of Vaporization (kJ/mole)Price (USD per ton) [85] *
Acetone56.02.2431.3741
2-propanol82.42.6245.0895
* Prices on 15 June 2023, China market.
Disclaimer/Publisher’s Note: The statements, opinions and data contained in all publications are solely those of the individual author(s) and contributor(s) and not of MDPI and/or the editor(s). MDPI and/or the editor(s) disclaim responsibility for any injury to people or property resulting from any ideas, methods, instructions or products referred to in the content.

