Article

Strength Weakening and Phase Transition Mechanisms in Nanoindentation of Al/Mg-Layered Nanocomposites: A Molecular Dynamic Study

by
Zhou Li
1,2,
Junhao Li
1,2,
Tong Shen
1,2,
Shiqi Xia
1,2,
Xianshi Jia
1,2,*,
Lu Zhang
1,2,* and
Che Zhang
3
1
College of Mechanical and Electrical Engineering, Central South University, Changsha 410083, China
2
State Key Laboratory of Precision Manufacturing for Extreme Service Performance, Changsha 410083, China
3
Department of Mechanical Engineering, University of Melbourne, Parkville, VIC 3010, Australia
*
Authors to whom correspondence should be addressed.
Processes 2024, 12(7), 1423; https://doi.org/10.3390/pr12071423
Submission received: 5 June 2024 / Revised: 5 July 2024 / Accepted: 5 July 2024 / Published: 8 July 2024
(This article belongs to the Section Materials Processes)

Abstract

:
Molecular dynamics (MD) simulations were performed to investigate the nanoindentation behavior of Al/Mg-layered nanocomposites with varying layer thicknesses and Mg layer orientations in this study. The aim is to understand the weakening mechanisms at low layer thicknesses and the phase transition mechanisms associated with the dislocation slip angle in the Mg layer. Results indicate that the nanoindentation strength of nanocomposites increases with the layer thickness in the range of 1–10 nm, with the strength of 9.5 × 10⁻⁷ N at 10 nm being approximately 73% higher than that at 1 nm. This strength increase is mainly attributed to high interfacial stress, the higher percentage of amorphous atoms, weakened interatomic interactions, and the transition of adjacent interfaces to fully coherent interfaces that significantly reduce their ability to hinder dislocations at the low-layer thickness range. Additionally, in the initial deformation process, the hexagonal close-packed (HCP) phase of the Mg layer firstly transforms into the body-centered cubic (BCC) phase due to its lower energy barrier, followed by the emergence of a faced-centered cubic (FCC) phase driven by 1/3<1−100> dislocations. In the late stage of deformation, new dislocations are generated in the FCC phase and move along its slip planes, altering the dislocation direction. The FCC/HCP interfacial configuration also affects the HCP phase transition mechanism in the Mg layer. When the dislocation slip angle is 0°, the primary phase transition is the BCC phase, whereas a 45° slip angle results in the FCC phase. These findings will provide a guide for the preparation and manufacturing of new high-quality layered nanocomposites.

1. Introduction

In recent years, there has been considerable interest in multi-layered nanocomposites featuring distinct component layers, primarily due to their excellent mechanical properties such as impact resistance [1,2], abrasion resistance [3,4,5], and excellent strength [6,7]. Among those multi-layered nanocomposites, Al/Mg-layered nanocomposites have potential applications in lightweight aerospace conveying equipment and automotive components [8,9]. However, the thickness of their layers is typically much smaller than the in-plane grain size, and when the thickness diminishes to less than 10 nm, the strength of nanocomposites will be significantly affected by amorphization induced by substantial internal stresses at the interfaces. The small size of nanocomposites has made testing this phenomenon a significant challenge, but the molecular dynamics (MD) method can well observe the contact behavior and interfacial behavior processes of nanocomposites. This method has been widely used in the simulation of materials with various systems [10,11]. For instance, the effect of the amorphization phenomenon under nanoindentation on the deformation behavior and mechanical properties of biphasic high-entropy alloys was studied using the MD simulation [12]. The amorphous layer was found to have a significant effect on the mechanical behavior of high-entropy alloys, acting as an absorber of dislocations and a barrier to their sustained motion. The nanoindentation simulations of crystalline/amorphous nano-laminates were carried out using the MD method, and the thin amorphous layer was found to be an obstacle to the movement of dislocations, while the thicker layer was an obstacle to the sinking of dislocations [13].
Moreover, the phase transformation during plastic deformation also has a significant effect on the mechanical performance of nanocomposites [14]. Currently, there have been a series of studies on the phase transition behavior during plastic deformation of nanoscale materials. Kou et al. [15] conducted in-situ tensile experiments on pure Ti to study its HCP–FCC phase transition behavior, and found that the mesoscopic sliding of the FCC–Ti phase through the phase boundary was accomplished by conservative gliding of the extended dislocations along the phase boundary. Zhang et al. [16] investigated the deformation mechanism of nano-twinned Al/Ti multilayers using in-situ microcolumn compression tests. They found that the high-density lamellar dislocations and the HCP–FCC phase transition in Ti caused a compressive strength of 2.4 GPa. The mechanism of the deformation-induced phase transition in Ti and the collective behavior of some dislocations were clarified using MD simulations. Zu et al. [17] investigated the effects of surface and orientation on the stress-induced HCP–FCC phase transition in Ti nanopillars by MD simulation and found that the surface and orientation effects were the nanoscale controlling factors for the unconventional phase transition from the HCP to the FCC structure [18]. Sun et al. [19] used the MD simulation to study the phase transition behavior of ultrathin Cu films under uniaxial tensile stress and found that, with the increase in stress, the Cu film underwent successive phase transitions, i.e., FCC to BCC and then BCC to HCP.
However, the current research on the phase transition process in Al/Mg-layered nanocomposites with FCC/HCP structures is not exhaustive, and understanding the phase transition process during plastic deformation is crucial to excavate their mechanisms behind strength changes with the low-layer thickness. The aim of this study is to reveal the amorphization and phase transition mechanisms of Al/Mg-layered nanocomposites related to their layer thickness and the dislocation slip angle using an MD approach of nanoindentation simulation. This will help to reveal the detailed mechanism of the low-layer thickness weakening of such FCC/HCP-layered nanocomposites.

2. Methodology

The deformation behavior of Al/Mg-layered nanocomposites was simulated using Lammps, the open-source software paeckage (LAMMPS 64-bit, version 3Nov2022-MPI; Sandia National Laboratories: Los Alamos, NM, USA) [20], and the results were analyzed and visualized using Ovito (version Basic 3.8.0; OVITO GmbH: Darmstadt, Germany), a professional and powerful software for visualizing and analyzing atoms and molecules [21]. In this study, the Meam potential function developed [22] was used to simulate the force field. Compared with the embedded atom method (EAM) potential function, it has been proved that the Meam potential function can better describe the crystal elastic behavior [23]. In addition, the simulation iterates every 1 fs. The nanoindentation simulation model for this layered nanocomposite is shown in Figure 1. The thickness of the nanocomposite was determined to be 1 nm, 2 nm, 5 nm, and 10 nm, respectively, and the size of Al/Mg nanocomposite was 20 × 20 × 40 nm. The crystalline structures of the original Al and Mg are shown in Figure 2. The radius of rigid indenter was 6 nm, and the indentation depth was 6 nm. The interface of Al/Mg nanocomposite was incoherent, and its interfacial orientation was set as [001] || [0001]. The width-direction boundary of nanocomposites was a periodic boundary, the indentation plane and the bottom plane were contraction boundaries, and the bottom atom was fixed. The ambient temperature of the simulation process was set to 300 K under the Nose–Hoover method, the energy of the nanocomposite was minimized using the Conjugate gradient method (CG) [24], and the NVT ensemble relaxation model was used for 30 ps [25]. The indentation process consisted of three stages: loading, holding, and unloading. To prevent an interaction between the indentation head and the atoms in the Al/Mg nanocomposite, the indentation head was modeled as a rigid virtual indenter, and the pressure rate was 500 nm/ps.

3. Results and Discussion

3.1. Strength Weakening Mechanism of Al/Mg Nanocomposite with Low-Layer Thickness

Nanoindentation is a powerful tool for the mechanical characterization of nanocomposites at the nanoscale. During testing, the initial contact with the indenter was between a spherical indenter and a flat surface. The nature of the contact between a spherical indenter and a flat surface was first thoroughly investigated by Hertz. When an elastic sphere of radius R is in contact with an elastic plane, the indentation load P can be calculated with the following equation [26,27]:
P = 4 3 E r R 1 2 h e 1 2
where E r represents the equivalent modulus of elasticity and h e represents the depth of elastic deformation between the indenter and the specimen. The equivalent modulus of elasticity, E r , can be calculated using the following expression [28]:
1 E r = 1 v s 2 E s + 1 v i 2 E i  
where E s and E i represent the modulus of elasticity of the specimen and indenter materials, respectively, while ν s and ν i are their respective Poisson’s ratios. During the nanoindentation process, the load–indentation depth relationship, as shown in Figure 3 [29], can be measured to accurately calculate the hardness and elasticity modulus of material using the Oliver–Pharr method, thereby assessing its mechanical properties. The slope of the curve at the beginning of unloading is the material stiffness, and it can be expressed as [30]
S = d P / d h
where h is the indentation depth at the beginning of unloading. The entire curve is smooth and continuous, and a functional relationship between load and displacement is obtained by fitting it. This relationship is typically represented by a power function with the following expression [30]:
P = B ( h h f ) m
where B and m are the parameters obtained from the fitting, and h f is the residual indentation displacement after unloading.
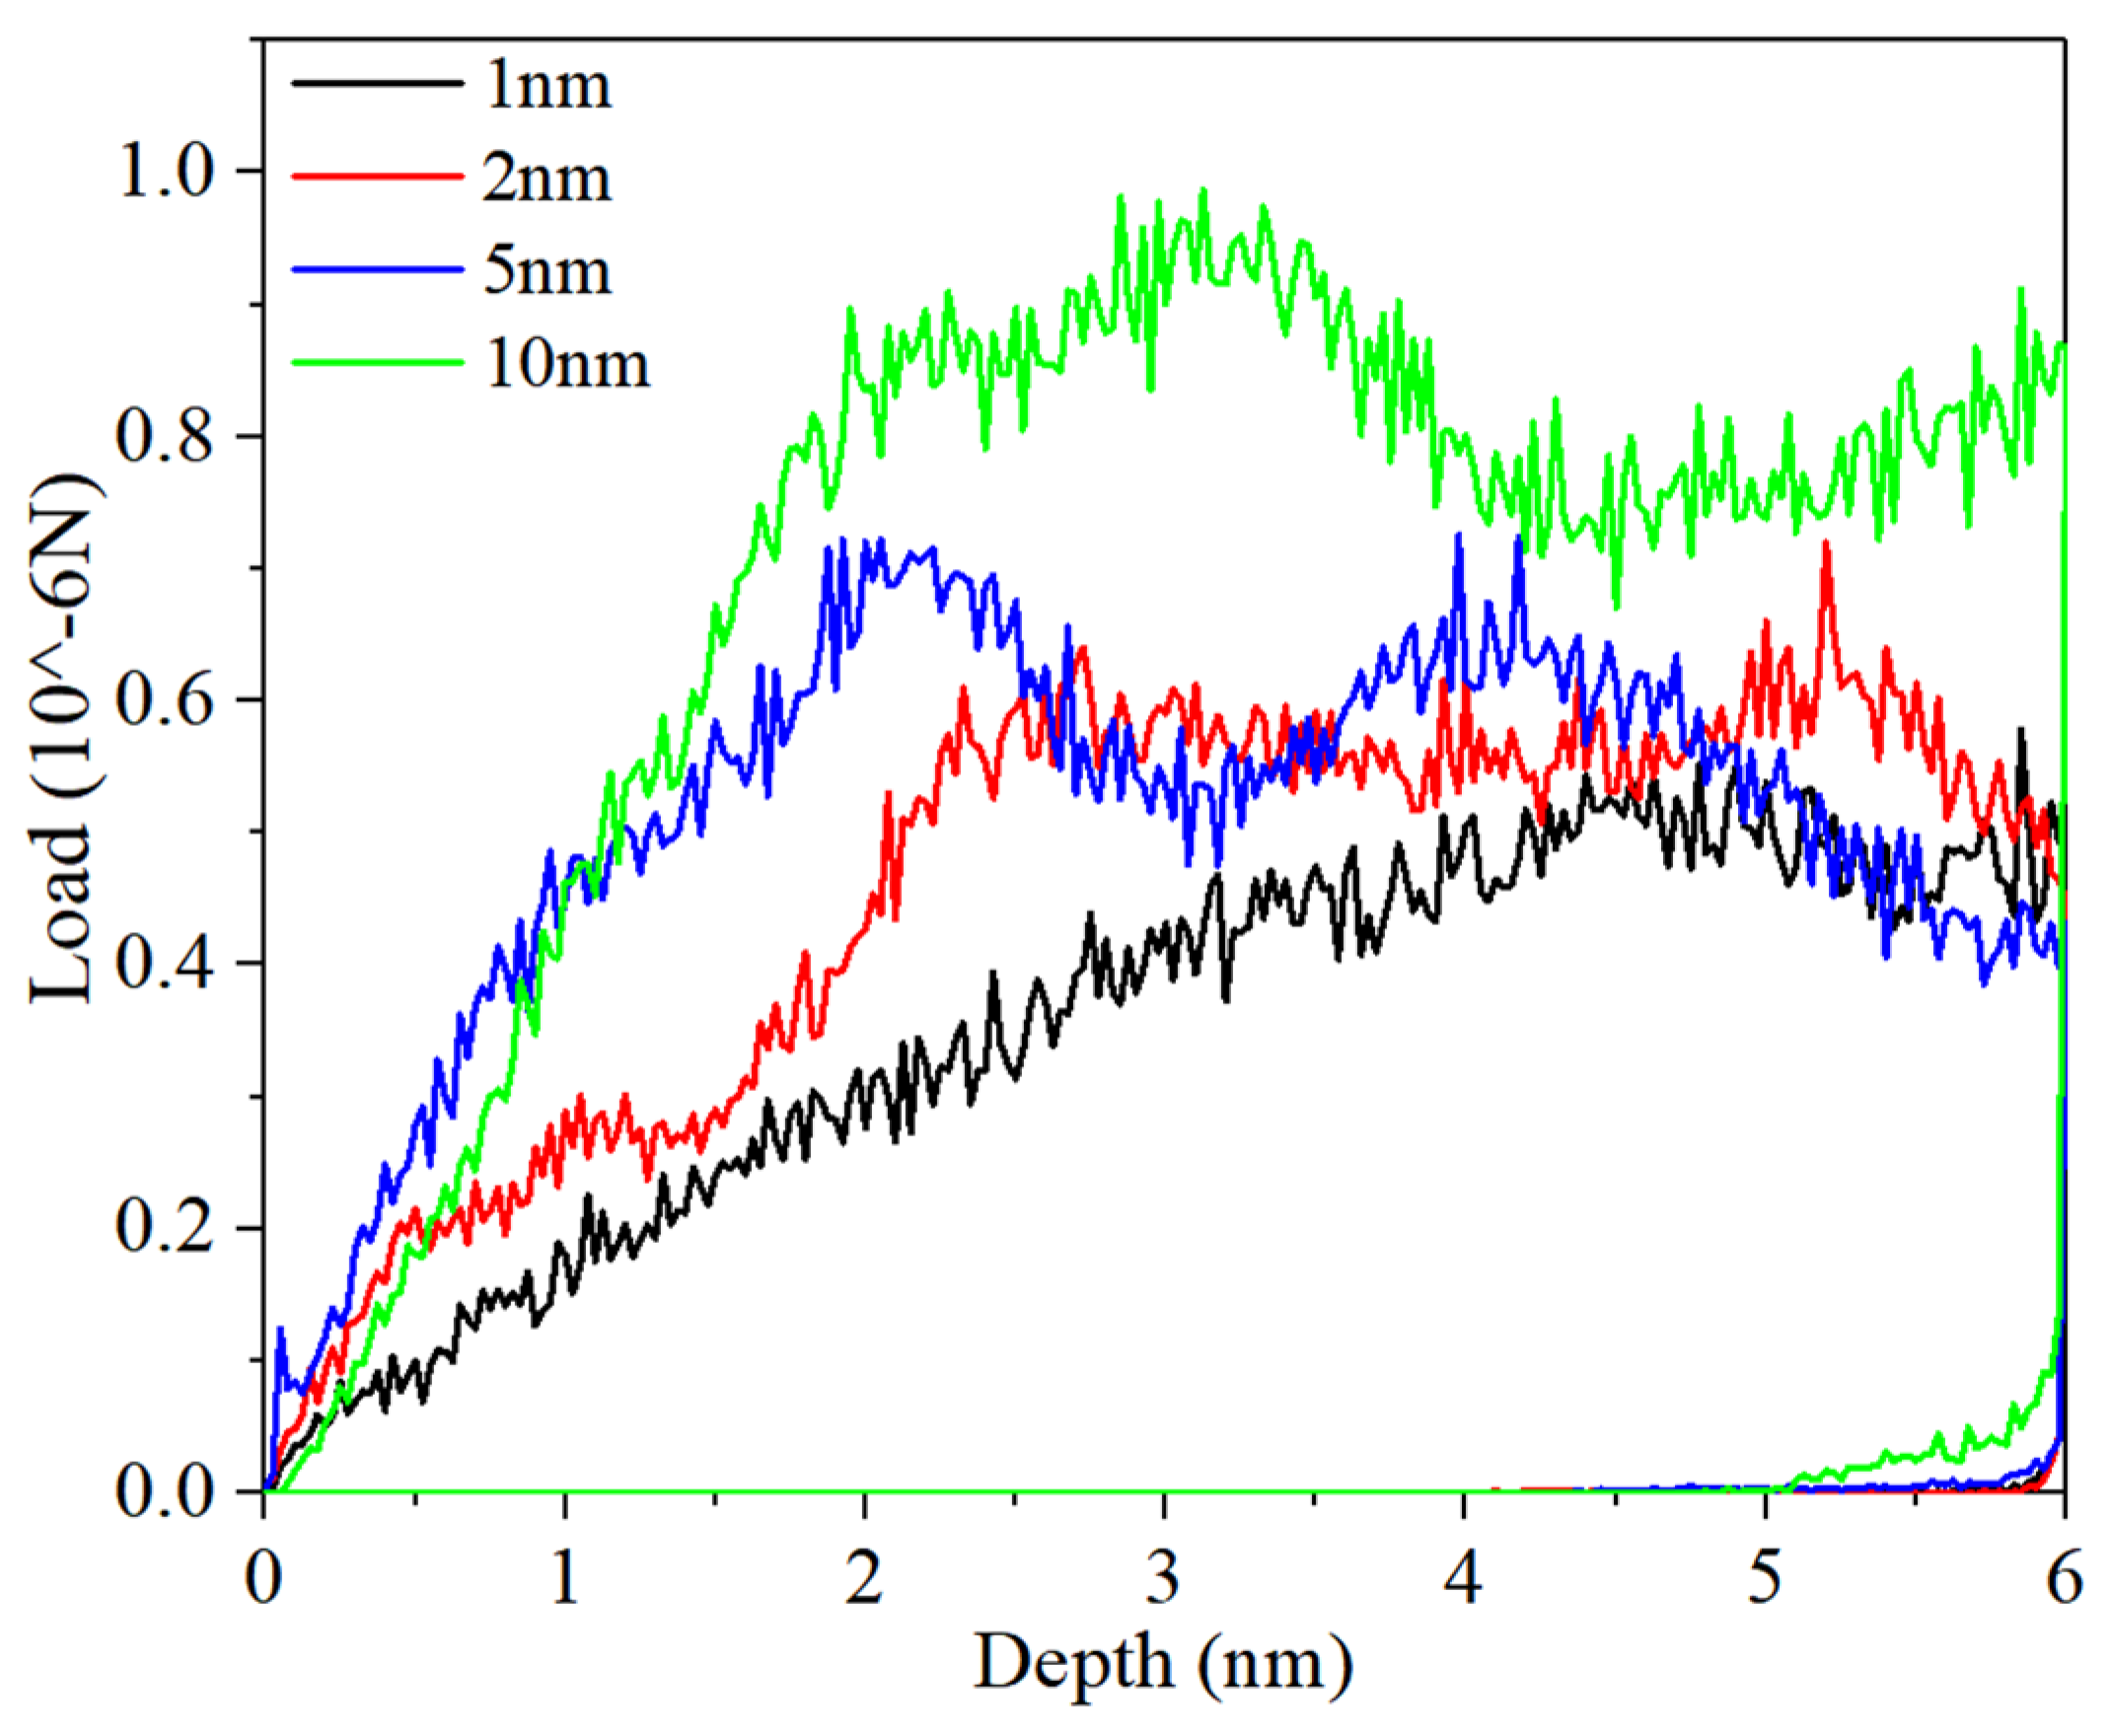
When examining Figure 3 and Figure 4, the load obtained from the simulation results has a large gap with the Hertzian theoretical value, due to the nanoscale and the extremely high strain rate [31]. However, the elastic trend of the Al/Mg nanocomposite in the simulation results aligns with the Hertzian theory [32]. As shown in Figure 4, it is observed that the elastic modulus of Al/Mg nanocomposite significantly decreases with decreasing layer thickness. With the increase in the indentation depth, the indenter load tends to stabilize when the indentation depth reaches 2 nm, and the average load borne by the indenter increases with the increase in the layer thickness. On unloading, the indenter load decreases sharply and then gradually to 0 N, deviating significantly from the unloading stage of the curve in Figure 3. This indicates that the nanoscale indentation process causes irreversible plastic deformation of the nanocomposite. Consequently, minimal elastic deformation occurs near the indenter of Al/Mg nanocomposites during the unloading process. This behavior is related to the extreme downward compression rate and the size effect in the simulation environment [33]. At the same time, the inapparent elastic recovery is also related to the absorption of kinetic energy in the process of plastic deformation. The rigid indenter load oscillates violently throughout, while no oscillation occurs during the elastic recovery stage during unloading. This mechanism of sudden load rise and fall is the same as that found in the nanoindentation experiments performed on Au (111) planes. This is explained by the fact that the load oscillations during nanoindentation are related to the emissions and slippage of multiple dislocations [34].
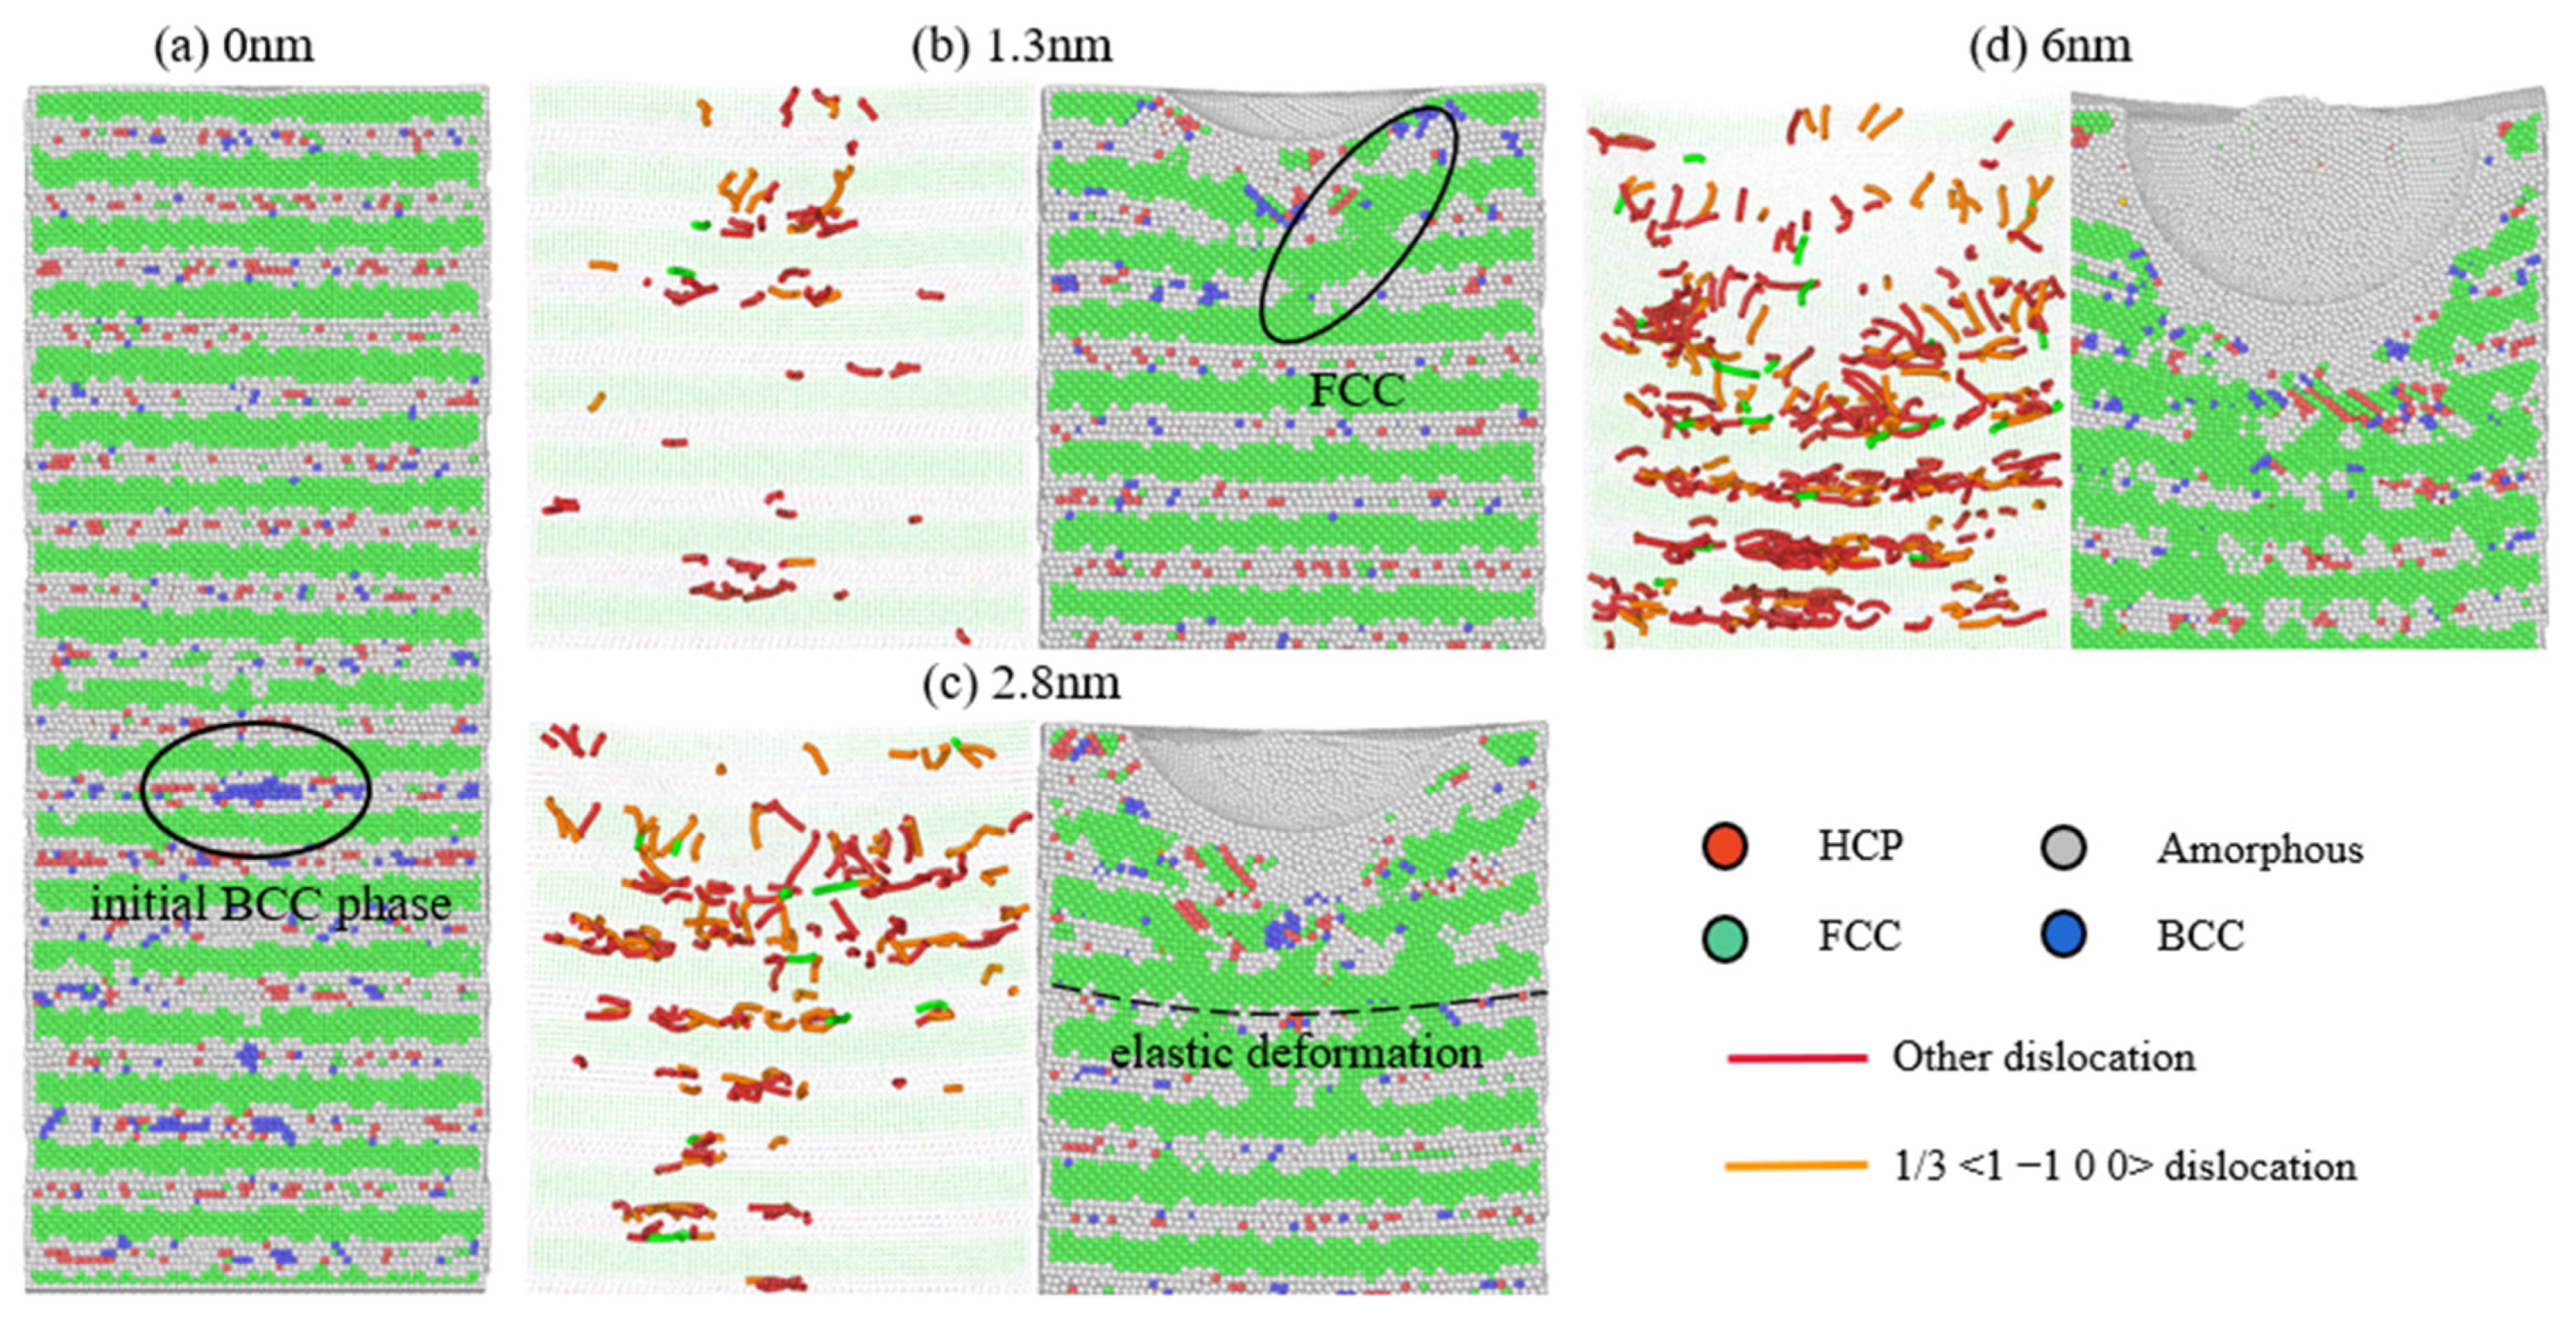
Figure 5a illustrates that the Mg layer of Al/Mg nanocomposite loses most of its crystal structure and becomes amorphous once the indenter contacts the nanocomposite. This transformation is attributed to the sharp increase in internal stress at the Al/Mg interface due to the extremely low layer thickness [35]. Additionally, a small number of HCP atoms in the Mg layer are converted into BCC crystals, indicating that the BCC phase can exist stably under very low layer thickness, as supported by other experimental studies [34]. When the indentation depth reaches 1.3 nm (Figure 5b), the FCC phase appears in the two layers of amorphous Mg atoms below the indenter, aligning with the FCC phase of Al atoms on both sides. Due to significant amorphization at the Al/Mg interface and within the Mg layer, no obvious dislocations or elastic deformations are observed in the Al/Mg nanocomposite [36]. When the indentation depth further reaches 2.8 nm (Figure 5c), the FCC phase further develops in the amorphous Mg layer under pressure, leading to substantial elastic deformation in the layers below the indenter and an increase in mismatch dislocations at the Al/Mg interface. By 6 nm indentation depth (Figure 5d), the proportion of the FCC phase in the Mg atoms increases further, with severe amorphization occurring, resulting in a fully coherent interface between the FCC phase Mg layer and the adjacent Al layer, allowing the Shockley dislocations to pass through the Mg layer [37]. The combination of atomic amorphization due to high pressure and low layer thickness along with the decreased capacity of the interface to hinder dislocations significantly reduces the strength of the Al/Mg-layered nanocomposite [38]. Moreover, the significant elastic deformation between the layers causes the Al/Mg nanocomposite with a 1 nm layer thickness to reach their maximum load at an indentation depth of 4 nm, notably later than composites with other layer thicknesses.
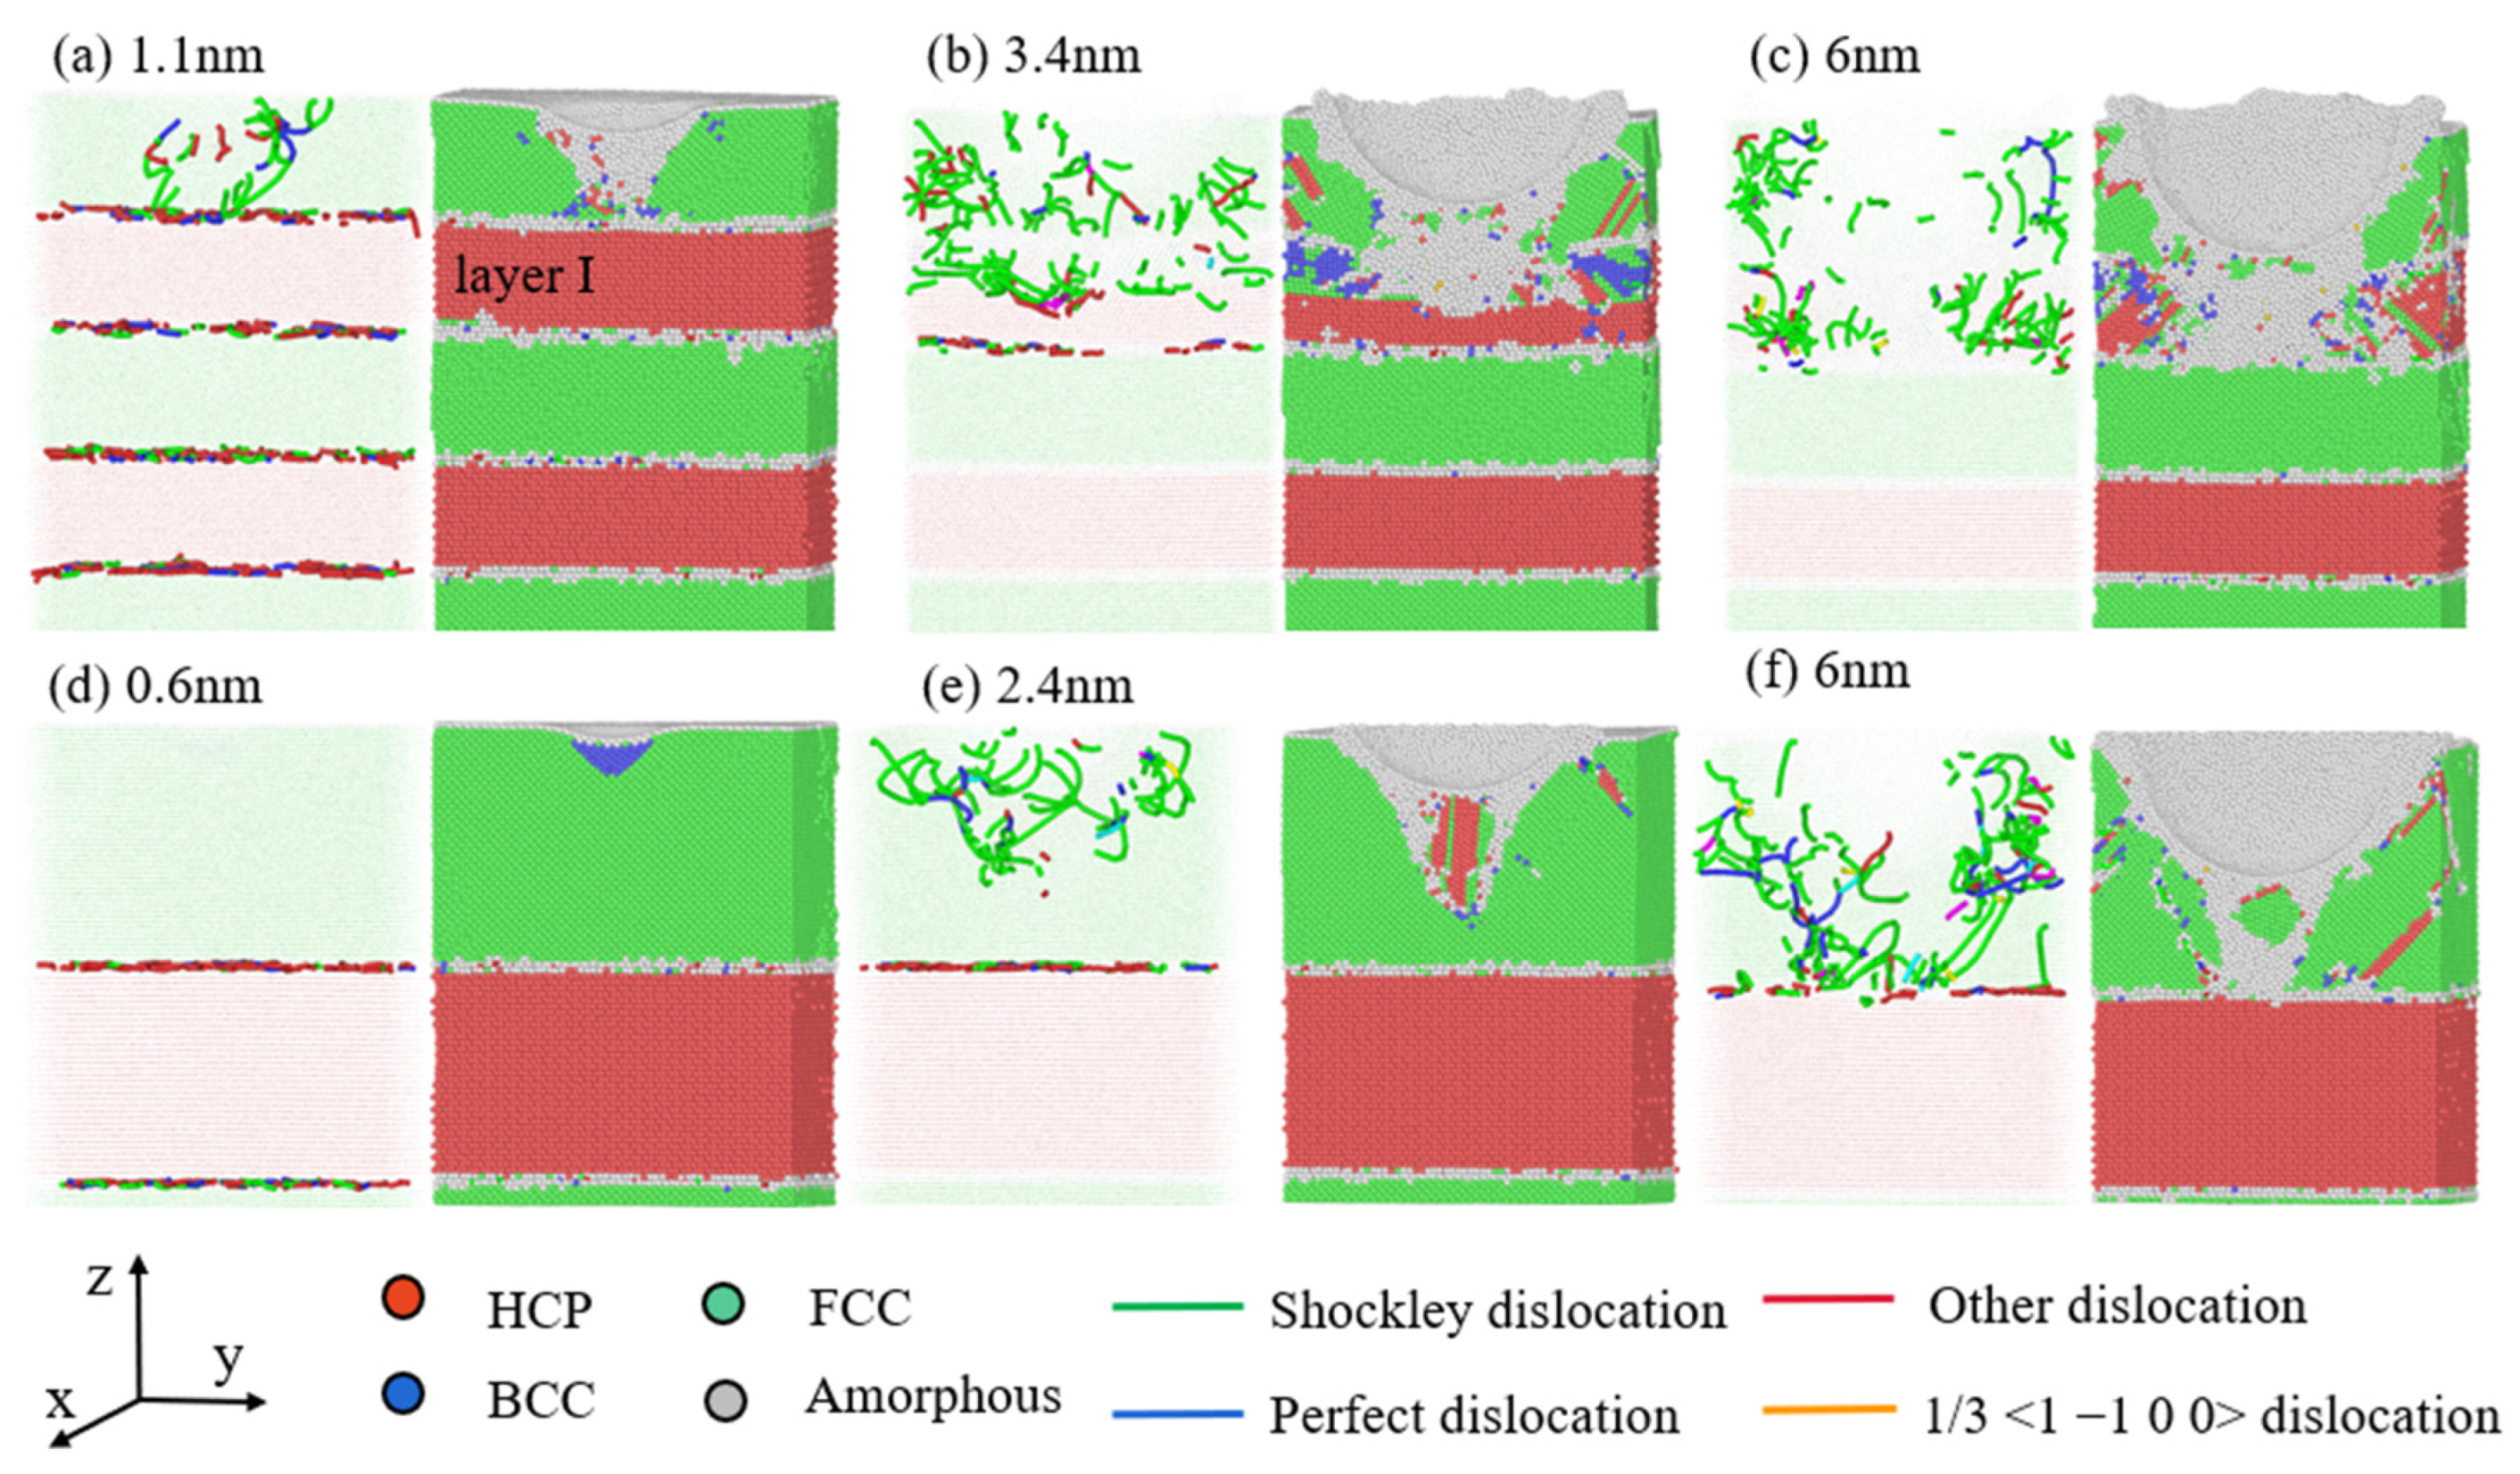
Figure 6a shows that a large number of mismatch dislocations appear at the interface of the Al/Mg nanocomposite with a layer thickness of 2 nm at the beginning. The amorphization of Mg layer atoms decreases significantly compared to the Al/Mg nanocomposite with a layer thickness of 1 nm. The Mg atoms at the interface exhibit an amorphous state, while those in the interlayer maintain the HCP structure. When the indentation depth reaches 2.4 nm (Figure 6b), the atoms in the Mg layer Ⅰ (marked in Figure 6a) directly beneath the indenter gradually transform into the amorphous state. Near the edges of these amorphous atoms, the Mg atoms are transformed into the FCC crystal structure, while those in the BCC phase are mainly distributed at the edge of the layer. In addition, the atoms located directly below the indenter in Mg layer II (marked in Figure 6a) are driven by pressure to transform into the FCC structure, with mismatch dislocations at the interface beginning to cross the FCC lattice Mg layer. When the indentation depth reaches 3.7 nm (Figure 6c), the proportion of the HCP phase in the Mg layer Ⅱ decreases significantly, transforming more into the FCC phase, BCC phase, and amorphous phase. Additionally, the slip direction of the FCC layer directly below the indentation is not perpendicular to the load direction, so there is shear strain distribution. The area most significantly affected by the shear strain is near the indentation, which is similar to the study of Guo et al. [26]. In this process, the orientation of the newly generated FCC phase aligns with the FCC phase in the Al layer, increasing the proportion of the coherent interface and allowing multiple Shockley dislocations to cross the interface [39]. Meanwhile, the atomic layer underneath the Mg layer Ⅱ still contains a large number of mismatched dislocations. Despite the phase transition, the FCC phase transition in the Mg layer of the Al/Mg nanocomposite with a 2 nm layer thickness is not widely distributed throughout the model as in the 1 nm case, being mainly confined to the layer below the indenter. This indicates that when the layer thickness exceeds 1 nm, the initial coherent stress at the interface decreases significantly, insufficient to reach the energy barrier required for amorphization, allowing the HCP phase of the Mg layer to stabilize.
Figure 6a–c illustrates the deformation and dislocation behaviors of Al/Mg nanocomposites during nanoindentation for a layer thickness of 5 nm. When the indentation depth reaches 1.1 nm, numerous mismatch dislocations appear at the interface due to the interaction between the indenter and the Al layer [40]. These dislocations extend along the {111} slip plane to the interface and then stop, indicating the critical role of the interface in controlling the dislocation propagation. As the indentation depth increases to 3.4 nm, the Mg layer Ⅰ (marked in Figure 7a) undergoes a BCC to FCC phase transition under the positive stress applied by the indenter, accompanied by the formation of many Shockley dislocations. These dislocations are mainly stress-driven and are not continuous with the previously generated Shockley dislocations in the Al layer. This indicates that, at a layer thickness of 5 nm, the coherent stress between the interfaces has decreased to a level insufficient to act in conjunction with the applied stresses to transform the HCP/FCC interface into a coherent FCC/FCC interface. At this point, the hindering effect of the large layer thickness on dislocations becomes a dominant factor in the strengthening of Al/Mg nanocomposite [9].
When the indentation depth increases to 6 nm, the amorphization in the Mg layer Ⅰ is intensified, indicating significant structural changes in the Mg layer under high pressure stress. However, during the whole deformation process, the elastic deformation of each atomic layer is minimal, with plastic deformation primarily concentrated in the surfaces of Al and Mg layer Ⅰ. The plastic deformation in Mg layer Ⅰ cannot be effectively transferred to the next layer of Al atoms through the interface, proving the critical role of the interface in controlling deformation behaviors of the nanocomposite. Figure 7d–f show the nanoindentation behaviors of Al/Mg nanocomposites with a layer thickness of 10 nm. In this case, all the plastic deformation occurs in the Al layer on the surface, and the mismatch dislocations at the interface decrease as the indentation depth increases. Shockley dislocations traverse the entire Al atomic layer but are eventually blocked from further propagation by the interface [39]. Throughout the indentation process, the Mg layer fails to undergo significant deformation or phase transition.

3.2. Phase Transition Mechanism Dominated by Dislocation Slip Angles in the Mg Layer

In order to further investigate the relationship between dislocation and phase transition in Al/Mg-layered nanocomposites concerning the Mg crystal orientation, and to enhance the understanding of the plastic deformation mechanism of nanocomposites, the Al/Mg nanocomposite with a layer thickness of 5 nm was examined. The dislocation slip angles were set to 0° and 45°, respectively, to compare the deformation behaviors of the Al/Mg nanocomposite under the nanoindentation at different dislocation slip angles. Figure 8 shows the load-indentation depth curves of the Al/Mg nanocomposite at dislocation slip angles of 0° and 45°, respectively. It was evident that the maximum load on the indenter of the Al/Mg nanocomposite was slightly larger when the dislocation slip angle was 0° compared to when it was 45°. However, the curves of the two are nearly identical in the rising stage of the indenter load, and the difference in the average load during the loading process was not significant. This suggests that, during nanoindentation, the Al/Mg-layered nanocomposite is subjected to localized stresses induced by the indenter, with the strength primarily governed by the Al in the surface layer, and the orientation of the Mg layer has minimal influence on the strength. In addition, when the slip angle of dislocations is 0°, there are two significant stress peaks, which are related to the extension of internal 1/3<1−100> dislocations [41].
Figure 9 shows the dislocation behaviors and phase transition in the Mg layer of the Al/Mg nanocomposite when the dislocation slip angle is 0°. It can be observed that, when the indentation depth reaches 1.7 nm, the atoms in the Mg layer near the indenter side begin to undergo amorphous transformation, and a small number of BCC atoms appear around the amorphous atoms. When the indentation depth reaches 1.9 nm, the proportion of the BCC phase further increases, preceded by the diffusion of amorphous atoms. Consequently, the phase transformation and dislocation gradually propagate within the Mg layer. The 1/3<1−100> dislocations parallel to the {0001} base plane begin to appear near the upper interface, and the phase transition and dislocations in the Mg layer gradually propagate as the indentation further penetrates. When the indentation depth reaches 4 nm, these dislocations basically penetrate through the whole Mg layer. The BCC phase transition occurs autonomously before other phase transitions, while the FCC phase transition requires the presence of dislocations for initiation, reflecting differences in phase stability. The BCC phase in the Mg layer is notably more stable than the FCC phase, characterized by lower energy barriers and smaller shear vectors [42]. Consequently, there is no obvious dislocation behavior before the BCC phase transition, whereas the FCC structure exhibits higher energy barriers, necessitating greater stress to induce phase transitions.
With the increase in the indentation depth, the proportion of amorphous atoms fails to change significantly, and the FCC phase becomes the main phase transformation with the deepening of the indentation, as shown in Figure 9g,h. Once the indentation depth reaches 5 nm, the phase transformation atoms and dislocations have already filled the entire Mg layer, leading to the stable phase transformation independent of further indentation depth. However, the dislocations are no longer strictly parallel to the HCP basal plane {0001}, instead extending to the interfaces on both sides as the indentation deepens. When the indentation depth reaches 6 nm, a complete dislocation traversing the Mg layer is pinned to the interfaces on both sides. This suggests that the original HCP phase in the Mg layer no longer generates new dislocations at this point. Furthermore, the slip direction of the FCC phase generated after the phase transition is not parallel to the interfaces, and although the dislocations in the FCC phase traverse the Mg layer, they are still prevented by the interfaces and fail to extend to the next layer.
Figure 10 shows the deformation behavior of the Mg layer when the dislocation slip angle is 45° on the Mg side. At the indentation depth of 1.7 nm, the Mg layer begins to generate the phase transformation, with the BCC phase forming first under the indenter and extending along the basal {0001} plane. Dislocations begin to form at an indentation depth of 1.9 nm, extending along the basal surface, and near the dislocations, the FCC phase appears. Compared to the Al/Mg nanocomposite with dislocation slip angles of 0° and 45°, the dislocations and phase transitions in this nanocomposite extend more rapidly. The dislocations penetrate the Mg layer and reach the interface below at an indentation depth of 2.4 nm, and by 3 nm, the BCC phase almost completely fills the Mg layer. With increased deformation, the FCC phase, accompanied by dislocations, expands throughout the Mg layer. After an indentation depth of 4 nm, the dislocations in the Mg layer change direction, indicating that the newly formed FCC phase starts to generate new dislocations. The proportion of amorphous atoms remains essentially unchanged throughout the indentation process.
The cross-section of the Mg layer, parallel to the basal {0001} plane at a layer thickness of 5 nm, a dislocation slip angle of 0°, and an indentation depth of 3.2 nm, is observed in Figure 11. During the process of indentation from 3.2 nm to 3.4 nm, the 1/3<1−100> dislocations move parallel to the basal plane, away from the indenter. Subsequently, a new layer of FCC atoms forms behind the dislocation line. This indicates that the primary mechanism for the transformation of the Mg layer atoms from HCP to FCC involves the overall deformation of the HCP lattice and the overall slip of the basal plane atoms along the [1−210] direction. The HCP atoms transition from the original ABAB stacking order to the ABCA of the FCC. The {0001} crystallographic planes of the HCP lattice Mg, after the phase transition, correspond to the {111} crystallographic planes of the FCC lattice Al, both representing the most stable densely packed surfaces.
In contrast to the phase transition from HCP to FCC, the HCP to BCC transition involves both the relative movement between the atomic layers of the basal plane and the movement of atoms within the basal plane itself. The black solid circles and red solid triangles in Figure 11 represent the A and B layers of HCP crystals, respectively, and the atoms (a, e, and c) are in the prismatic plane {1−210} of the HCP crystal system. The atoms of the B layer move overall in the direction of [11−2], while the prismatic plane atoms of the A layer (a, e, and c) remain stationary. The other atoms move along the black arrows within the basal plane, and eventually the atoms (h, f, e, g, and i) align in the same plane, forming the BCC lattice, which corresponds to the {011} plane in the BCC lattice. The arrangement of atoms within the yellow-dashed box corresponds to the atoms (a, b, c, and d) within the yellow-dashed box in the schematic diagram, illustrating this transition.

3.3. Comparison of Phase Transition with Existing Experiments

The phenomenon of phase transition of HCP-structured Mg under high pressure has been confirmed by relevant experiments. For instance, the phase transition behavior of HCP–FCC was found in the MD simulation of hot compression experiments of AZ31Mg alloy, and this phenomenon was proved in the hot compressed AZ31Mg specimen at 700 °C using HRTEM electron microscopy [43]. The HRTEM images of the specimens reveal the presence of Shockley partial dislocations in the transition region between the FCC and the HCP phases. The 1/3<1−100> dislocations responsible for the transformation of the HCP phase into the FCC phase, as shown in Figure 11, are exactly the representation of Shockley dislocations in the HCP crystal, which supports the plausibility of these dislocations inducing the HCP to FCC phase transition observed in previous simulations. The lattice structure is confirmed by measuring the atomic spacing in both directions of the FCC and HCP lattice stripes, respectively. However, this experiment only demonstrates the simultaneous existence of Shockley dislocations and the HCP–FCC phase transition without detailing the specific process of a dislocation-induced phase transition, a gap addressed by the simulation work in this study. Additionally, microcolumn compression tests on Mg/Nb nano lamellar composite specimens were performed, and the phase transition of HCP–BCC occurred in the Mg layer, leading to material strengthening [44]. The Mg layer of the BCC structure near the interface is always thicker and of uneven thickness, corresponding to the HCP–BCC phase transition of the Mg layer in the above simulations.

4. Conclusions

The low-layer thickness weakening and phase transition behaviors of Al/Mg-layered nanocomposites with different layer thicknesses and Mg layer orientations were investigated with nanoindentation simulations in this study. The following main conclusions can be drawn:
(1)
For the nanocomposites with layer thicknesses ranging from 1 to 10 nm, the strength during nanoindentation increases with layer thickness. At 1 nm, high initial internal stress at the interface and increased amorphous atoms weaken interatomic interactions. The FCC phase appears in the Mg layer, making the adjacent interface completely coherent, which reduces the hindrance to dislocation. At higher layer thicknesses, the proportion of amorphous atoms is lower, and the interface strongly hinders dislocation.
(2)
The HCP phase in the Mg layer transforms to the BCC phase under stress due to shorter displacement vectors and lower energy barriers. The FCC phase appears later, driven by dislocations, and grows along the direction of dislocation movement. In the late stage of deformation, the FCC phase becomes dominant, with new dislocations forming and moving its slip plane, causing changes in the direction of dislocations in the Mg layer.
(3)
The phase transformation process in the Mg layer is influenced by the FCC/HCP interface configuration. At a 45° dislocation slip angle of the Mg layer, dislocations extend faster, increasing the BCC phase and decreasing the FCC phase. This proves that the force perpendicular to the basal plane tends to generate the FCC phase, while the BCC phase transition is more sensitive to the basal plane shear force. The local deformation from nanoindentation does not significantly change the nanocomposite strength due to the different Mg orientations.

Author Contributions

Conceptualization, Z.L. and C.Z.; methodology, T.S. and J.L.; software, T.S. and S.X.; validation, Z.L., T.S. and X.J.; formal analysis, T.S.; investigation, T.S. and X.J.; resources, L.Z.; data curation, T.S.; writing—original draft preparation, T.S.; writing—review and editing, Z.L., X.J., S.X., L.Z. and C.Z.; visualization, T.S.; supervision, Z.L., X.J., S.X., L.Z. and C.Z.; project administration, Z.L.; funding acquisition, Z.L. All authors have read and agreed to the published version of the manuscript.

Funding

The authors wish to gratefully acknowledge the financial support from the National Natural Science Foundation of China (Grant No. 52105418), the Natural Science Foundation of Hunan Province (Grant No. 2023JJ20069), and the key scientific research project of Hunan Provincial Department of Education (Grant No. 23A0001).

Data Availability Statement

The data presented in this study are available on request from the corresponding author.

Conflicts of Interest

The authors declare no conflicts of interest.

References

  1. Meng, Q.; Wang, P.; Yu, Y.; Liu, J.; Su, X.; Kuan, H.-C.; Wang, B.; Zhang, L.; Zhang, Y.; Losic, D.; et al. Polyaspartic polyurea/graphene nanocomposites for multifunctionality: Self-healing, mechanical resilience, electrical and thermal conductivities, and resistance to corrosion and impact. Thin-Walled Struct. 2023, 189, 110853. [Google Scholar] [CrossRef]
  2. Shojaei, P.; Trabia, M.; O’Toole, B.; Jennings, R.; Zhang, X.; Liao, Y. Enhancing hypervelocity impact resistance of titanium substrate using Ti/SiC Metal Matrix Nanocomposite coating. Compos. Part B Eng. 2020, 194, 108068. [Google Scholar] [CrossRef]
  3. Xi, Z.; Sun, J.; Chen, L.; Cui, H.; Ma, Y.; Zhou, H.; Chen, J. Tribological behaviors of nano-schistose MSH in phosphate/graphite composite lubricating coatings under different friction temperatures. Tribol. Int. 2024, 191, 109172. [Google Scholar] [CrossRef]
  4. Zhang, L.; Yang, D.; Ma, Z.; Deng, Z.; Li, Z.; Drummer, D.; Jiang, B. Pulse current electroforming of Ni-PTFE nanocomposite mold insert with long-lifetime and anti-adhesive properties. Electrochim. Acta 2024, 491, 144308. [Google Scholar] [CrossRef]
  5. Nistal, A.; Ruiz-González, A.; Choy, K.-L. Robust icephobic nanocomposite coatings with superior abrasion resistance. Appl. Mater. Today 2022, 27, 101480. [Google Scholar] [CrossRef]
  6. El-Safty, S.A.; Shenashen, M.A.; Elmarakbi, A. Advances in polymer/inorganic nanocomposite fabrics for lightweight and high-strength armor and ballistic-proof materials. Chem. Eng. J. 2024, 493, 152422. [Google Scholar] [CrossRef]
  7. Ai, D.; Wu, C.; Han, Y.; Chang, Y.; Xie, Z.; Yu, H.; Ma, Y.; Cheng, Y.; Wu, G. Polymer nanocomposites with concurrently enhanced dielectric constant and breakdown strength at high temperature enabled by rationally designed core-shell structured nanofillers. J. Mater. Sci. Technol. 2024, 210, 170–178. [Google Scholar] [CrossRef]
  8. Li, Z.; Li, J.; Shen, T.; He, D.; Jia, X.; Xia, S.; Zhao, J.; Wang, R.; Jiang, Z. Plastic deformation and fracture mechanisms of a novel Al/Mg bimetal composite at cryogenic temperatures. J. Mater. Res. Technol. 2024, 30, 3297–3307. [Google Scholar] [CrossRef]
  9. Li, Z.; Shen, T.; Hu, X.; Zhang, L.; Jia, X.; Li, J.; Zhang, C. The Plastic Deformation Mechanism in Nano-Polycrystalline Al/Mg Layered Composites: A Molecular Dynamics Study. Nanomaterials 2024, 14, 114. [Google Scholar] [CrossRef]
  10. Talapatra, A.; Datta, D. Experimental and molecular dynamics simulation based investigation to understand tribological performance of graphene reinforced thermoplastic polyurethane (Gr/TPU) nanocomposites. Tribol. Int. 2024, 196, 109703. [Google Scholar] [CrossRef]
  11. Zhao, Y.; Liu, K.; Zhang, H.; Tian, X.; Jiang, Q.; Murugadoss, V.; Hou, H. Dislocation motion in plastic deformation of nano polycrystalline metal materials: A phase field crystal method study. Adv. Compos. Hybrid Mater. 2022, 5, 2546–2556. [Google Scholar] [CrossRef]
  12. Han, R.; Song, H.; Han, L.; An, M. Atomistic insights on the deformation mechanisms of amorphous/crystalline dual-phase high entropy alloys under nanoindentation. J. Mater. Res. Technol. 2023, 25, 6027–6038. [Google Scholar] [CrossRef]
  13. Shuang, F.; Wang, B.; Aifantis, K. Revealing multiple strengthening transitions in crystalline-amorphous nanolaminates through molecular dynamics. Mater. Today Commun. 2023, 35, 105675. [Google Scholar] [CrossRef]
  14. Li, Z.; Cao, L.; Huo, M.; Jiang, Z. Evidence-based uncertainty quantification for bending properties of bimetal composites. Appl. Math. Model. 2023, 121, 59–74. [Google Scholar] [CrossRef]
  15. Kou, Z.; Li, X.; Huang, R.; Yang, L.; Yang, Y.; Feng, T.; Lan, S.; Wilde, G.; Lai, Q.; Tang, S. Stress-induced phase transformation and phase boundary sliding in Ti: An atomically resolved in-situ analysis. J. Mater. Sci. Technol. 2023, 152, 30–36. [Google Scholar] [CrossRef]
  16. Zhang, Y.; Li, Q.; Gong, M.; Xue, S.; Ding, J.; Li, J.; Cho, J.; Niu, T.; Su, R.; Richter, N.; et al. Deformation behavior and phase transformation of nanotwinned Al/Ti multilayers. Appl. Surf. Sci. 2020, 527, 146776. [Google Scholar] [CrossRef]
  17. Zu, Q.; Guo, Y.-F.; Yao, X. Surface and orientation effects on stress-induced hcp-fcc phase transformation in Ti nanopillars. Appl. Surf. Sci. 2020, 509, 145234. [Google Scholar] [CrossRef]
  18. Polak, W.Z. Efficiency in identification of internal structure in simulated monoatomic clusters: Comparison between common neighbor analysis and coordination polyhedron method. Comput. Mater. Sci. 2022, 201, 110882. [Google Scholar] [CrossRef]
  19. Sun, B.; Ouyang, W.; Ren, J.; Mi, L.; Guo, W. Fcc→bcc→hcp successive phase transformations in the strained ultrathin copper film: A molecular dynamic simulation study. Mater. Chem. Phys. 2019, 223, 171–182. [Google Scholar] [CrossRef]
  20. Assaf, E.I.; Liu, X.; Lin, P.; Erkens, S. PDB2DAT: Automating LAMMPS data file generation from PDB molecular systems using Python, Rdkit, and Pysimm. Softw. Impacts 2024, 20, 100656. [Google Scholar] [CrossRef]
  21. Ehrich, H.; Dollmann, A.; Grützmacher, P.; Gachot, C.; Eder, S. Automated identification and tracking of deformation twin structures in molecular dynamics simulations. Comput. Mater. Sci. 2024, 236, 112878. [Google Scholar] [CrossRef]
  22. Sircar, A.; Patra, P.K. A comparative investigation of shock response in high entropy Cantor alloys by MEAM and LJ type potentials. Mater. Today Commun. 2022, 33, 104843. [Google Scholar] [CrossRef]
  23. Srinivasan, P.; Nicola, L.; Simone, A. Modeling pseudo-elasticity in NiTi: Why the MEAM potential outperforms the EAM-FS potential. Comput. Mater. Sci. 2017, 134, 145–152. [Google Scholar] [CrossRef]
  24. Zhang, G.; Zhang, J.; Chen, Y.; Du, M.; Li, K.; Su, L.; Yi, H.; Zhao, F.; Cao, X. Logarithmic total variation regularization via preconditioned conjugate gradient method for sparse reconstruction of bioluminescence tomography. Comput. Methods Programs Biomed. 2024, 243, 107863. [Google Scholar] [CrossRef]
  25. Tan, S.; Do, D.D.; Nicholson, D. Consistency of NVT, NPT, µVT and Gibbs (NV2T and NPT) with kinetic Monte Carlo schemes. Chem. Eng. J. 2020, 401, 126056. [Google Scholar] [CrossRef]
  26. Guo, Q.; Hou, H.; Pan, Y.; Pei, X.; Song, Z.; Liaw, P.K.; Zhao, Y. Hardening-softening of Al0.3CoCrFeNi high-entropy alloy under nanoindentation. Mater. Des. 2023, 231, 112050. [Google Scholar] [CrossRef]
  27. Shen, Z.; Dong, R.; Li, J.; Su, Y.; Long, X. Determination of gradient residual stress for elastoplastic materials by nanoindentation. J. Manuf. Process. 2024, 109, 359–366. [Google Scholar] [CrossRef]
  28. Ning, J.; Gao, K.; Wang, J.; Xiong, X.; Li, H.; Min, F.; Wen, S.; Wu, X.; Huang, H.; Wei, W.; et al. The mechanical properties of Al3Sc single crystal investigated by nanoindentation using Hertzian elasticity theory method and Oliver-Pharr method. J. Alloys Compd. 2024, 994, 174598. [Google Scholar] [CrossRef]
  29. Gong, J.; Peng, Z.; Miao, H. Analysis of the nanoindentation load–displacement curves measured on high-purity fine-grained alumina. J. Eur. Ceram. Soc. 2005, 25, 649–654. [Google Scholar] [CrossRef]
  30. Gao, X.; Hong, D.; Paranjape, H.M.; Zhang, W.; Anderson, P.M. Berkovich indentation and the Oliver-Pharr method for shape memory alloys. Int. J. Mech. Sci. 2024, 270, 109077. [Google Scholar] [CrossRef]
  31. Li, Z.; Gao, Y.; Zhan, S.; Fang, H.; Zhang, Z. Molecular dynamics study on temperature and strain rate dependences of mechanical properties of single crystal Al under uniaxial loading. AIP Adv. 2020, 10, 075321. [Google Scholar] [CrossRef]
  32. Machado, M.; Moreira, P.; Flores, P.; Lankarani, H.M. Compliant contact force models in multibody dynamics: Evolution of the Hertz contact theory. Mech. Mach. Theory 2012, 53, 99–121. [Google Scholar] [CrossRef]
  33. Cross, G.L.W.; Schirmeisen, A.; Grütter, P.; Dürig, U.T. Plasticity, healing and shakedown in sharp-asperity nanoindentation. Nat. Mater. 2006, 5, 370–376. [Google Scholar] [CrossRef]
  34. Ham, B.; Zhang, X. High strength Mg/Nb nanolayer composites. Mater. Sci. Eng. A 2011, 528, 2028–2033. [Google Scholar] [CrossRef]
  35. Dhawan, S.; Dhawan, T.; Vedeshwar, A.G. Crystalline to amorphous phase transformation of Ta2O5 quantum dots driven by residual stress. J. Alloys Compd. 2016, 657, 366–371. [Google Scholar] [CrossRef]
  36. Wu, Z.; Liu, W.; Zhang, L.; Lim, S. Amorphization and dislocation evolution mechanisms of single crystalline 6H-SiC. Acta Materialia 2020, 182, 60–67. [Google Scholar] [CrossRef]
  37. Maurya, S.K.; Nie, J.F.; Alankar, A. Atomistic analyses of HCP-FCC transformation and reorientation of Ti in Al-Ti multilayers. Comput. Mater. Sci. 2021, 192, 110329. [Google Scholar] [CrossRef]
  38. Shao, X.; He, C.; Liu, H.; Su, N.; Wu, Y.; Chen, Q.; Ma, X. Amorphization of nano-Mg layers in LPSO-containing magnesium alloy during cyclic deformation. Scr. Mater. 2024, 245, 116059. [Google Scholar] [CrossRef]
  39. Colin, J. Dislocation equilibrium in a misfitted composite structure with partially coherent interfaces. Mech. Res. Commun. 2023, 132, 104168. [Google Scholar] [CrossRef]
  40. Li, J.; Lu, H.; Ni, Y.; Mei, J. Quasicontinuum study the influence of misfit dislocation interactions on nanoindentation. Comput. Mater. Sci. 2011, 50, 3162–3170. [Google Scholar] [CrossRef]
  41. He, D.; Zhu, J.-C.; Lai, Z.-H.; Liu, Y.; Yang, X.-W.; Nong, Z.-S. Residual elastic stress–strain field and geometrically necessary dislocation density distribution around nano-indentation in TA15 titanium alloy. Trans. Nonferrous Met. Soc. China 2013, 23, 7–13. [Google Scholar] [CrossRef]
  42. Zhou, J.-N.; Guo, Y.-F.; Ren, J.-Y.; Tang, X.-Z. The mechanism of hcp-bcc phase transformation in Mg single crystal under high pressure. Scr. Mater. 2023, 236, 115670. [Google Scholar] [CrossRef]
  43. Xue, C.; Li, S.; Chu, Z.; Yang, Q.; Li, Y.; Ma, L.; Tuo, L. Molecular dynamics study on the effect of temperature on HCP→FCC phase transition of magnesium alloy. J. Magnes. Alloys 2023, 11, 3749–3764. [Google Scholar] [CrossRef]
  44. Jain, M.; Yaddanapudi, K.; Kidigannappa, A.T.; Baldwin, K.; Knezevic, M.; Mara, N.A.; Beyerlein, I.J.; Pathak, S. Simultaneous high strength and mechanical stability of bcc Nb/Mg nanolaminates. Acta Mater. 2023, 242, 118487. [Google Scholar] [CrossRef]
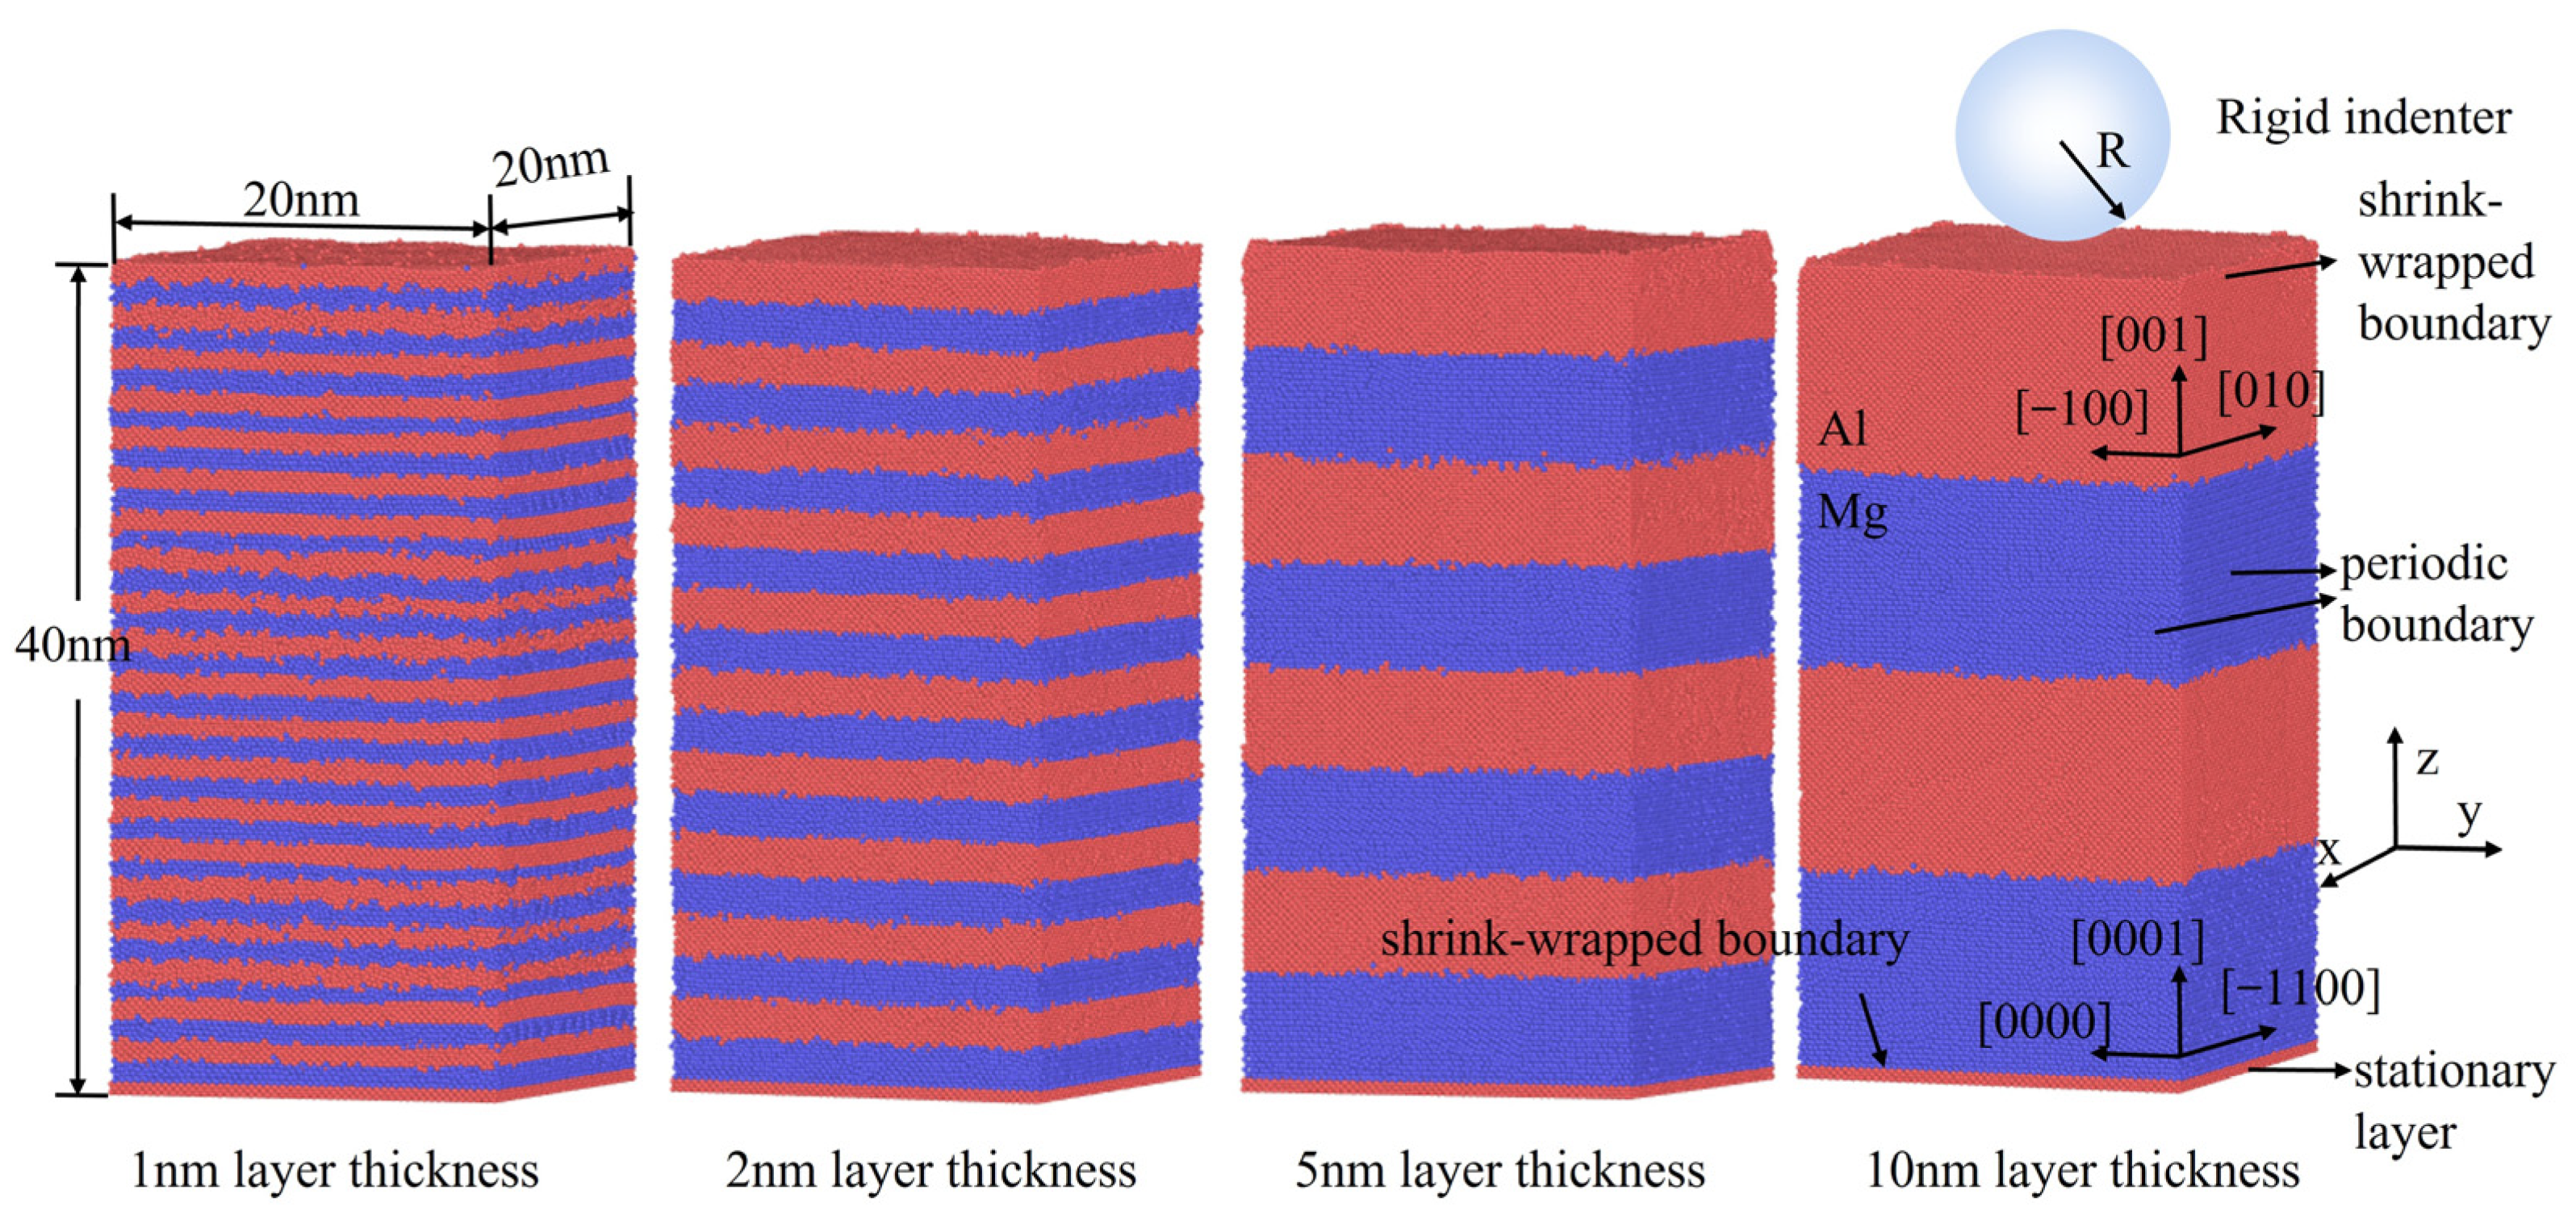
Figure 1. Nanoindentation simulation model setup for the Al/Mg-layered nanocomposite.
Processes 12 01423 g001
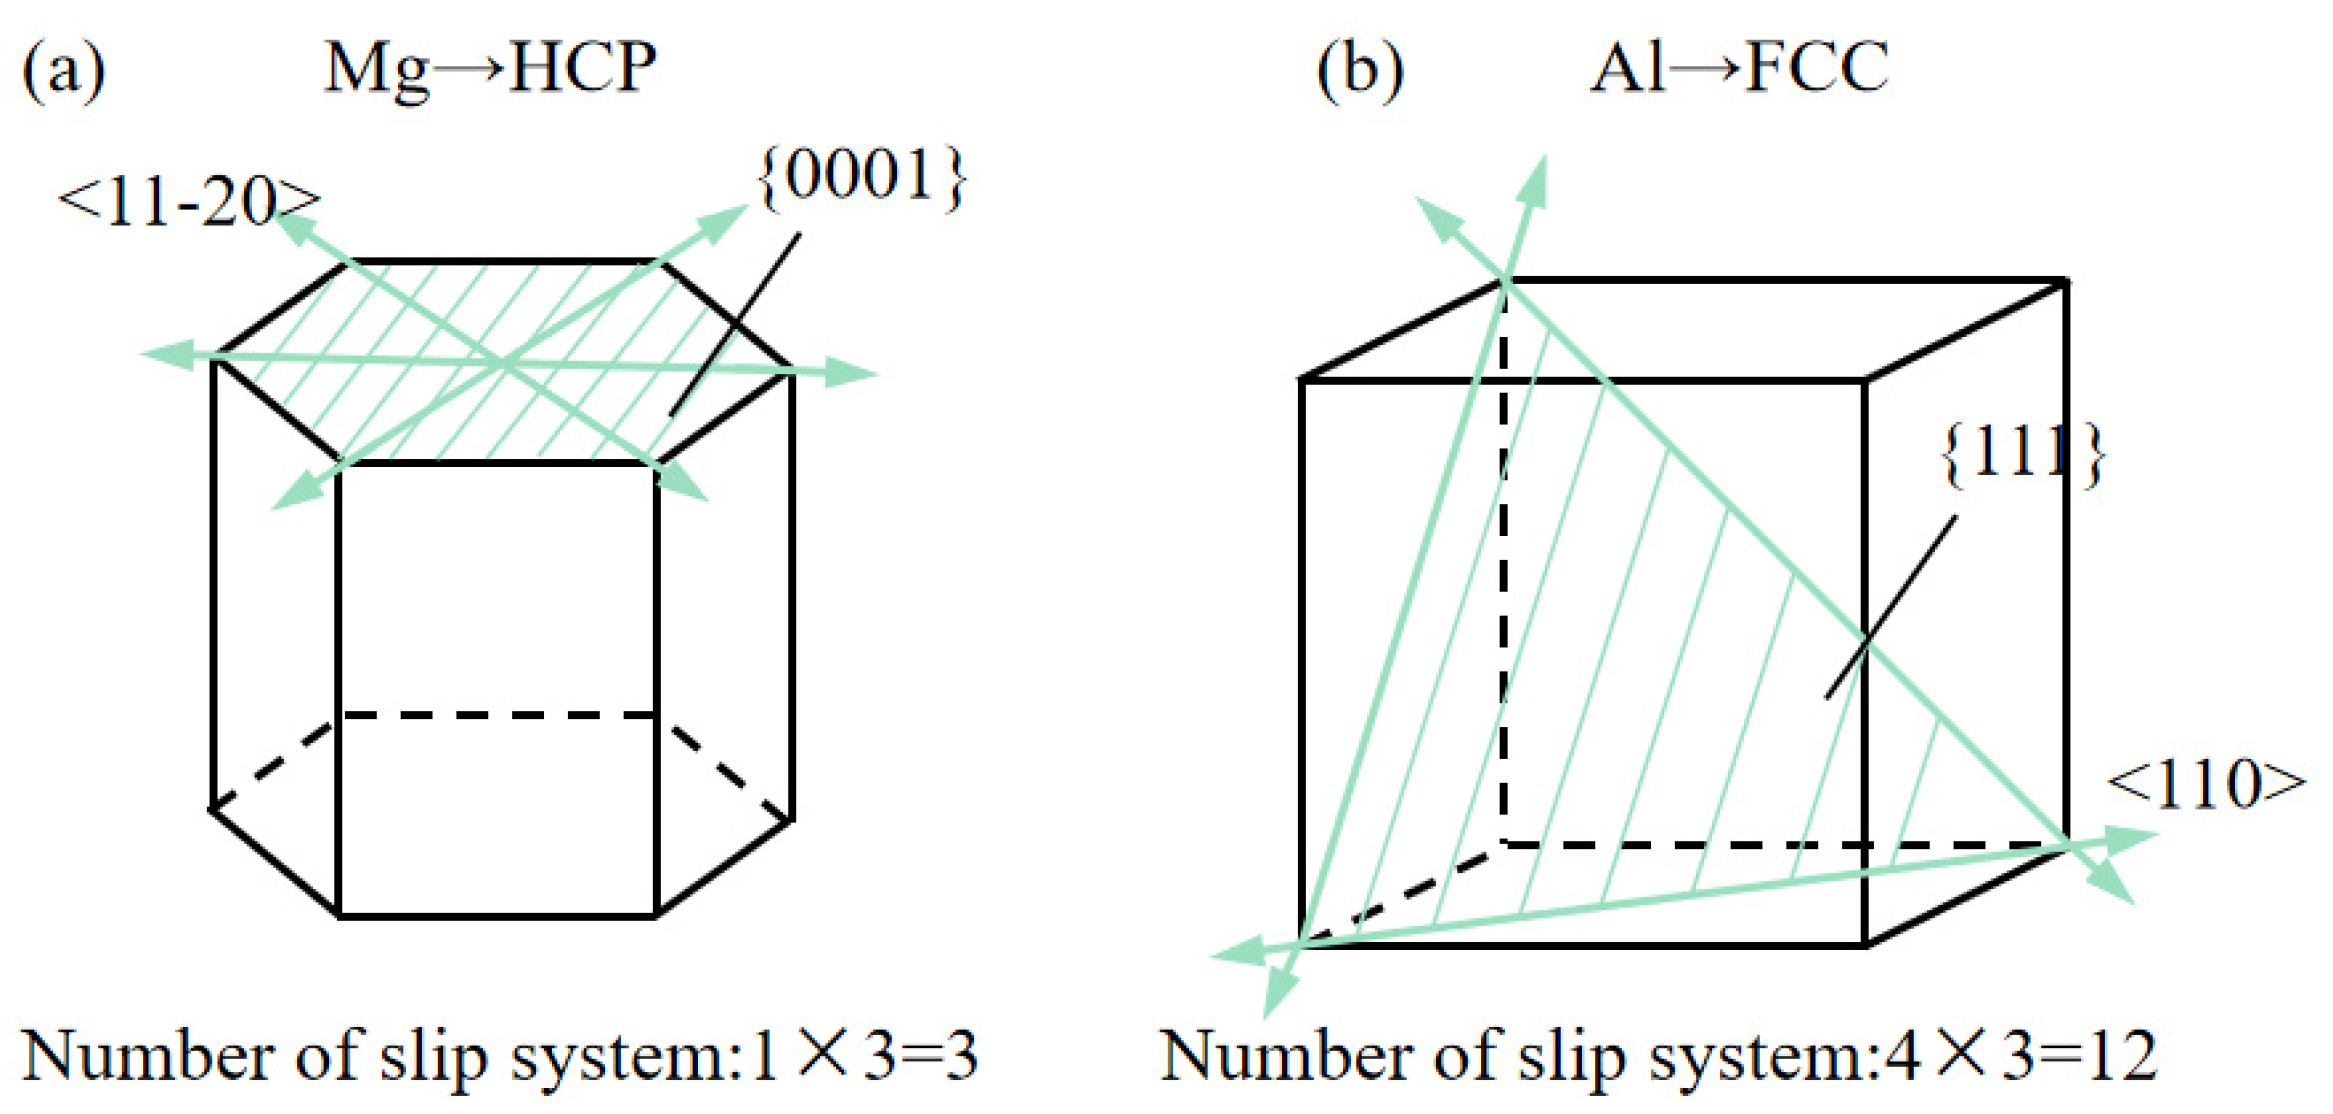
Figure 2. The crystalline structures of (a) Mg and (b) Al, respectively.
Processes 12 01423 g002
Figure 3. Relationship of nanoindentation load–indentation depth.
Processes 12 01423 g003
Figure 4. Nanoindentation load–indentation depth relationships for four layer thicknesses, respectively.
Processes 12 01423 g004
Figure 5. Lattice variation and dislocation behaviors of Al/Mg nanocomposite with layer thickness of 1 nm at the indentation depth of (a) 0 nm, (b) 1.3 nm, (c) 2.8 nm, and (d) 6 nm, respectively.
Processes 12 01423 g005
Figure 6. Dislocation behaviors and lattice variation of Al/Mg nanocomposite with a layer thickness of 2 nm at the indentation depth of (a) 0.3 nm, (b) 2.4 nm, and (c) 3.7 nm, respectively.
Processes 12 01423 g006
Figure 7. Dislocation behaviors and lattice variation of Al/Mg nanocomposite with a layer thickness of (ac) 5 nm and (df) 10 nm, respectively.
Processes 12 01423 g007
Figure 8. Load–indentation depth curves of Al/Mg nanocomposite during the loading-unloading process with dislocation slip angles of 0° and 45°, respectively.
Processes 12 01423 g008
Figure 9. Dislocations and HCP lattice phase transition in Al/Mg nanocomposite with a dislocation slip angle of 0° in the Mg layer under the indentation depth of (a) 1.7 nm, (b) 1.9 nm, (c) 2.1 nm, (d) 2.4 nm, (e) 3 nm, (f) 4 nm, (g) 5 nm, and (h) 6 nm, respectively.
Processes 12 01423 g009
Figure 10. Dislocations and HCP lattice phase transition in Al/Mg nanocomposite with a dislocation slip angle of 45° in the Mg layer under the indentation depth of (a) 1.7 nm, (b) 1.9 nm, (c) 2.1 nm, (d) 2.4 nm, (e) 3 nm, (f) 4 nm, (g) 5 nm, and (h) 6 nm, respectively.
Processes 12 01423 g010
Figure 11. Phase transition and dislocation formation in the Mg layer of Al/Mg nanocomposite.
Processes 12 01423 g011
Disclaimer/Publisher’s Note: The statements, opinions and data contained in all publications are solely those of the individual author(s) and contributor(s) and not of MDPI and/or the editor(s). MDPI and/or the editor(s) disclaim responsibility for any injury to people or property resulting from any ideas, methods, instructions or products referred to in the content.