
Strength Weakening and Phase Transition Mechanisms in Nanoindentation of Al/Mg-Layered Nanocomposites: A Molecular Dynamic Study


 , , and
Abstract
:1. Introduction
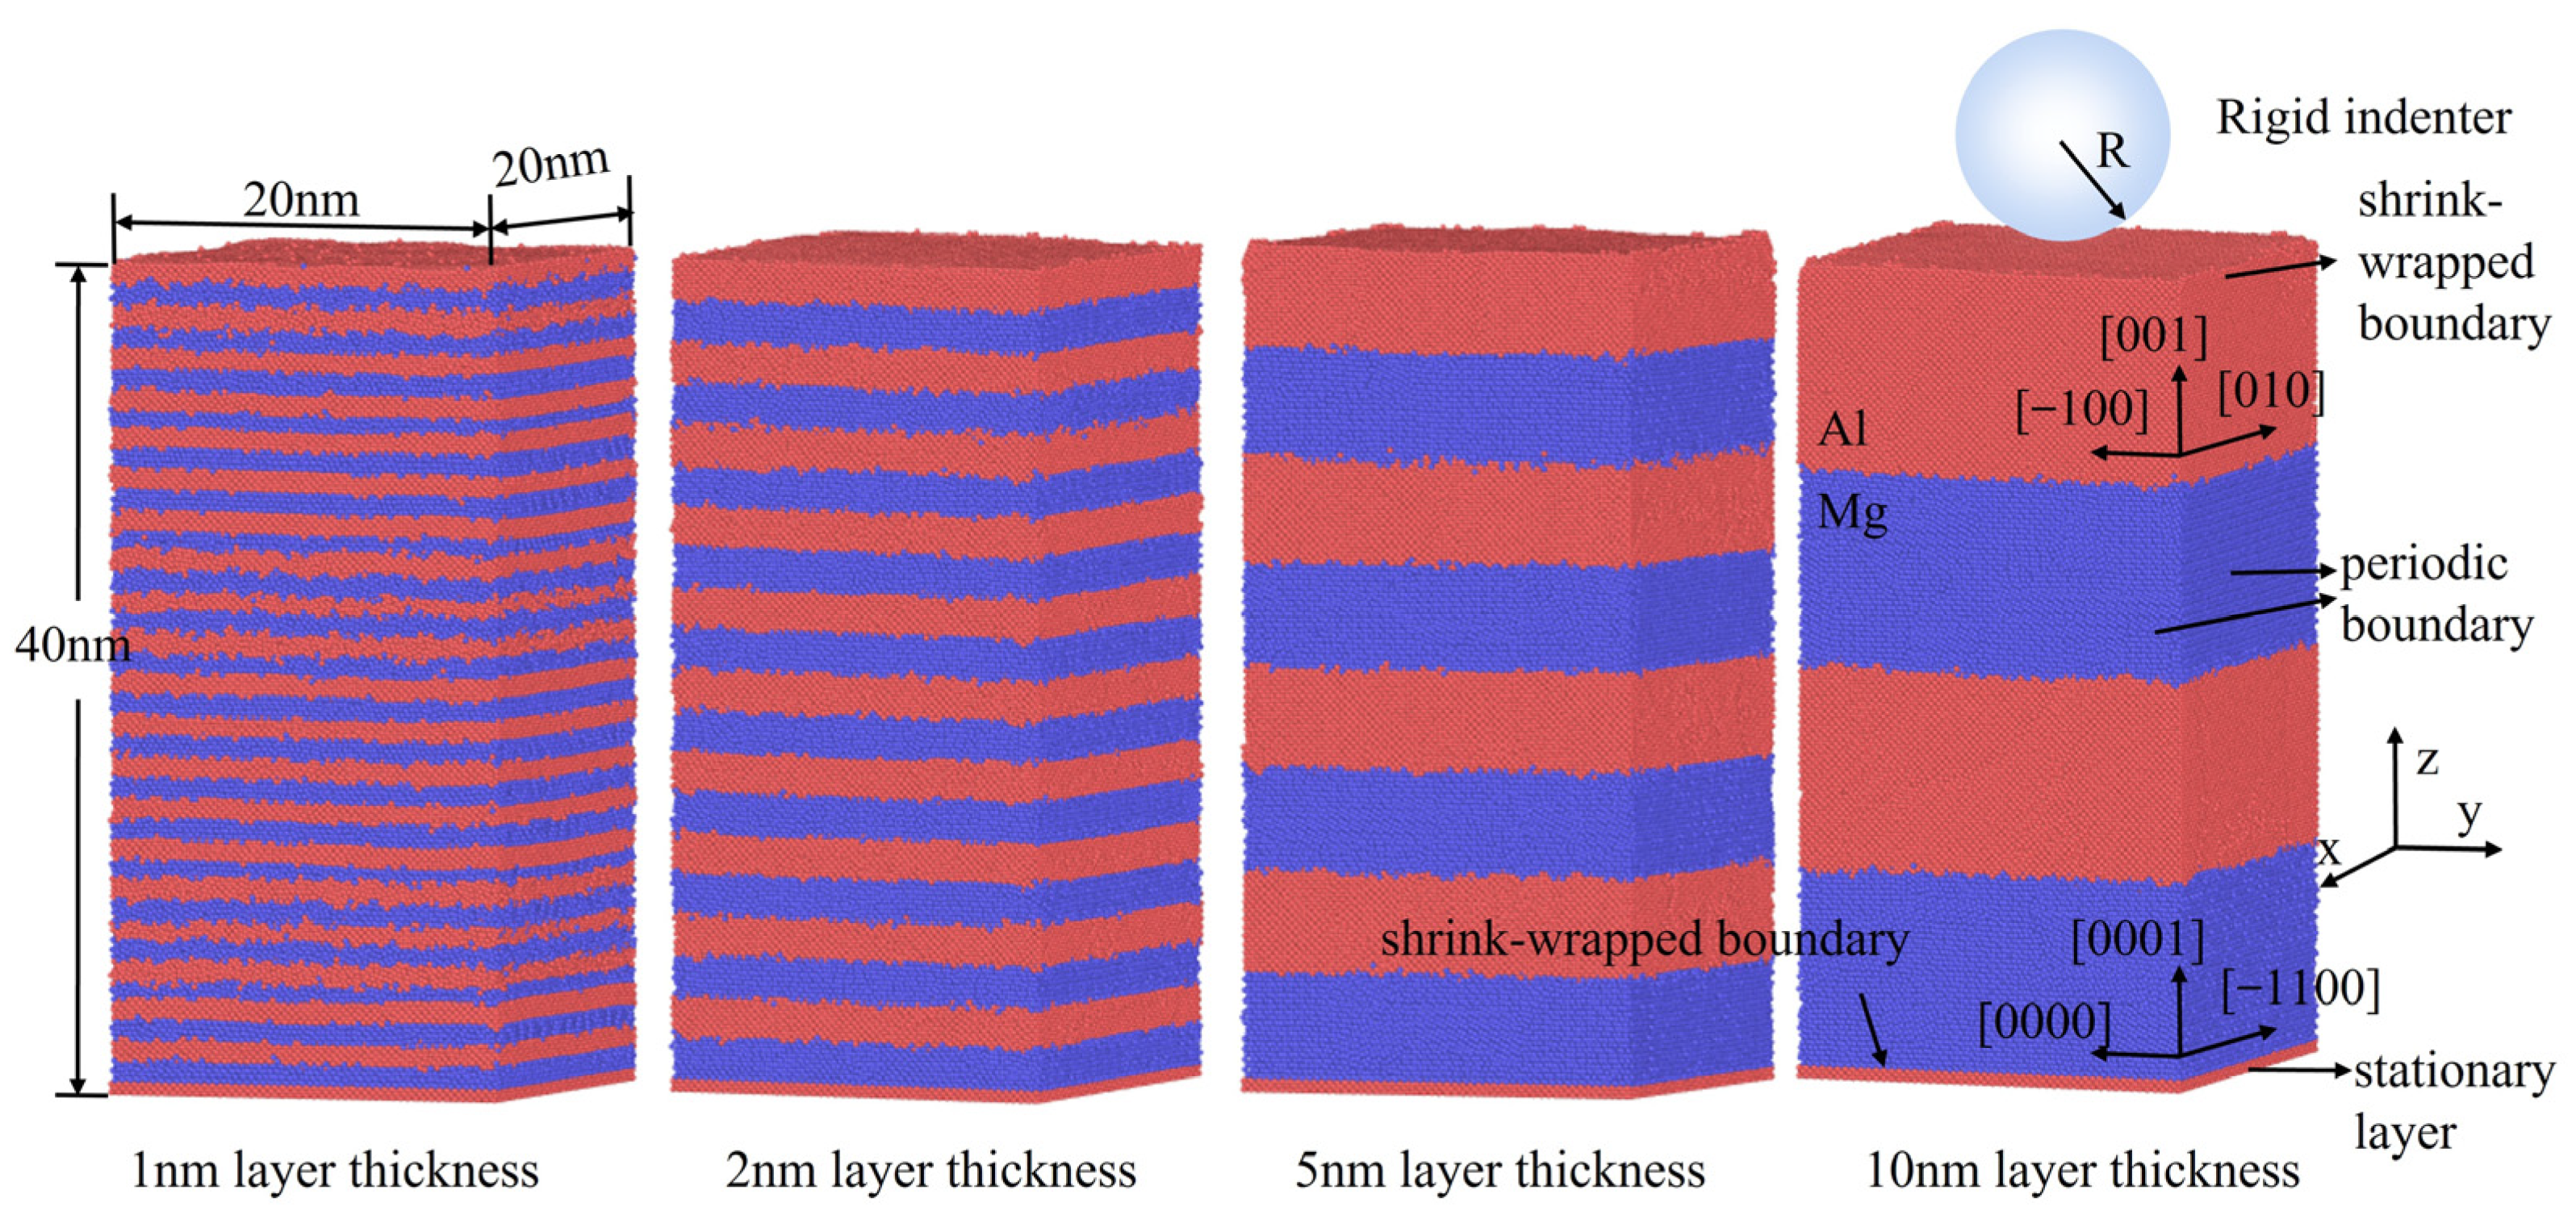
2. Methodology
3. Results and Discussion
3.1. Strength Weakening Mechanism of Al/Mg Nanocomposite with Low-Layer Thickness
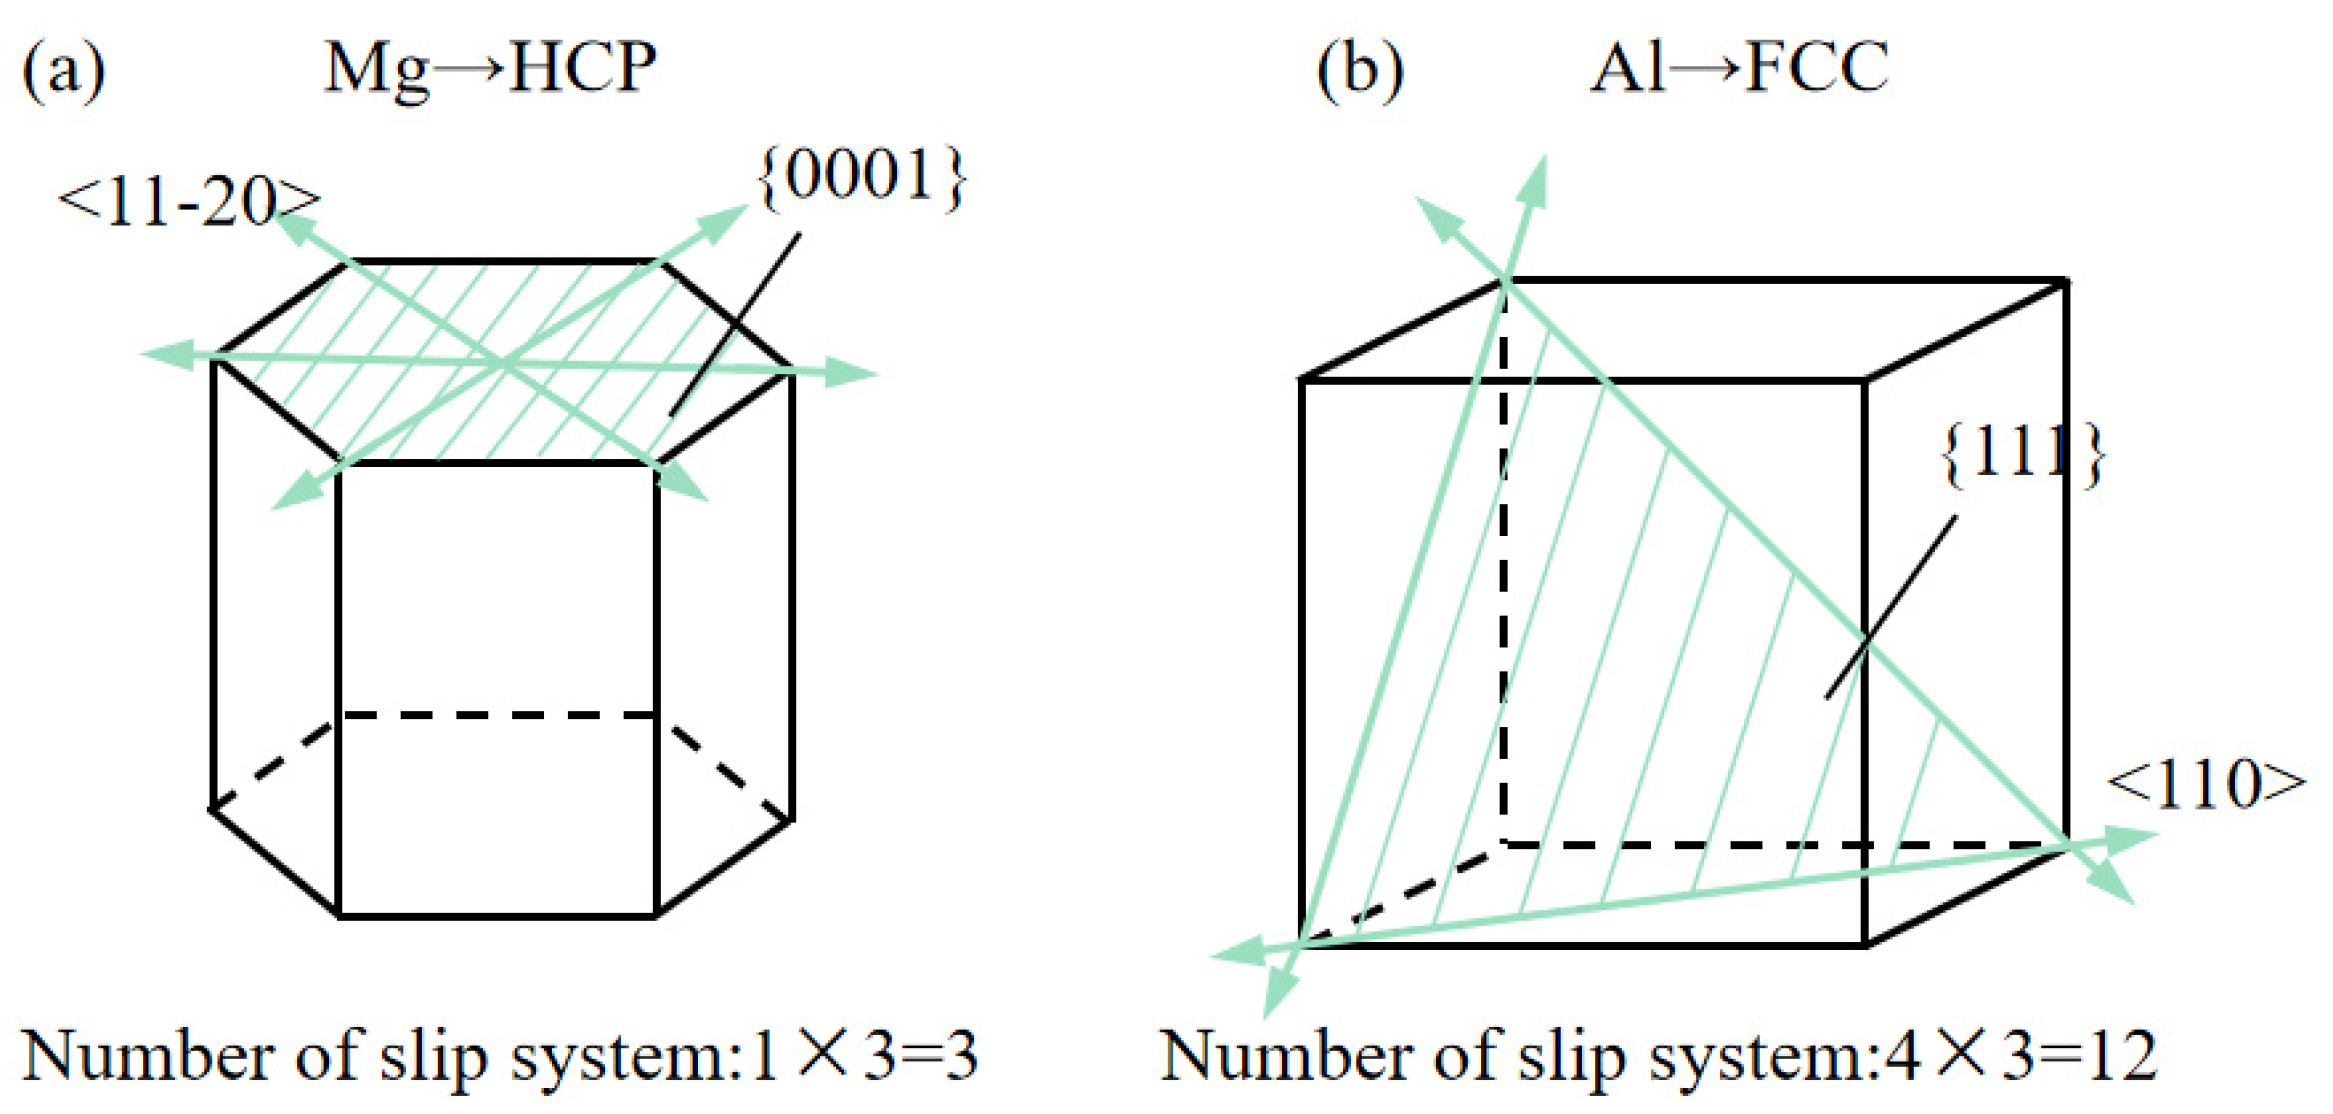
3.2. Phase Transition Mechanism Dominated by Dislocation Slip Angles in the Mg Layer
3.3. Comparison of Phase Transition with Existing Experiments
4. Conclusions
- (1)
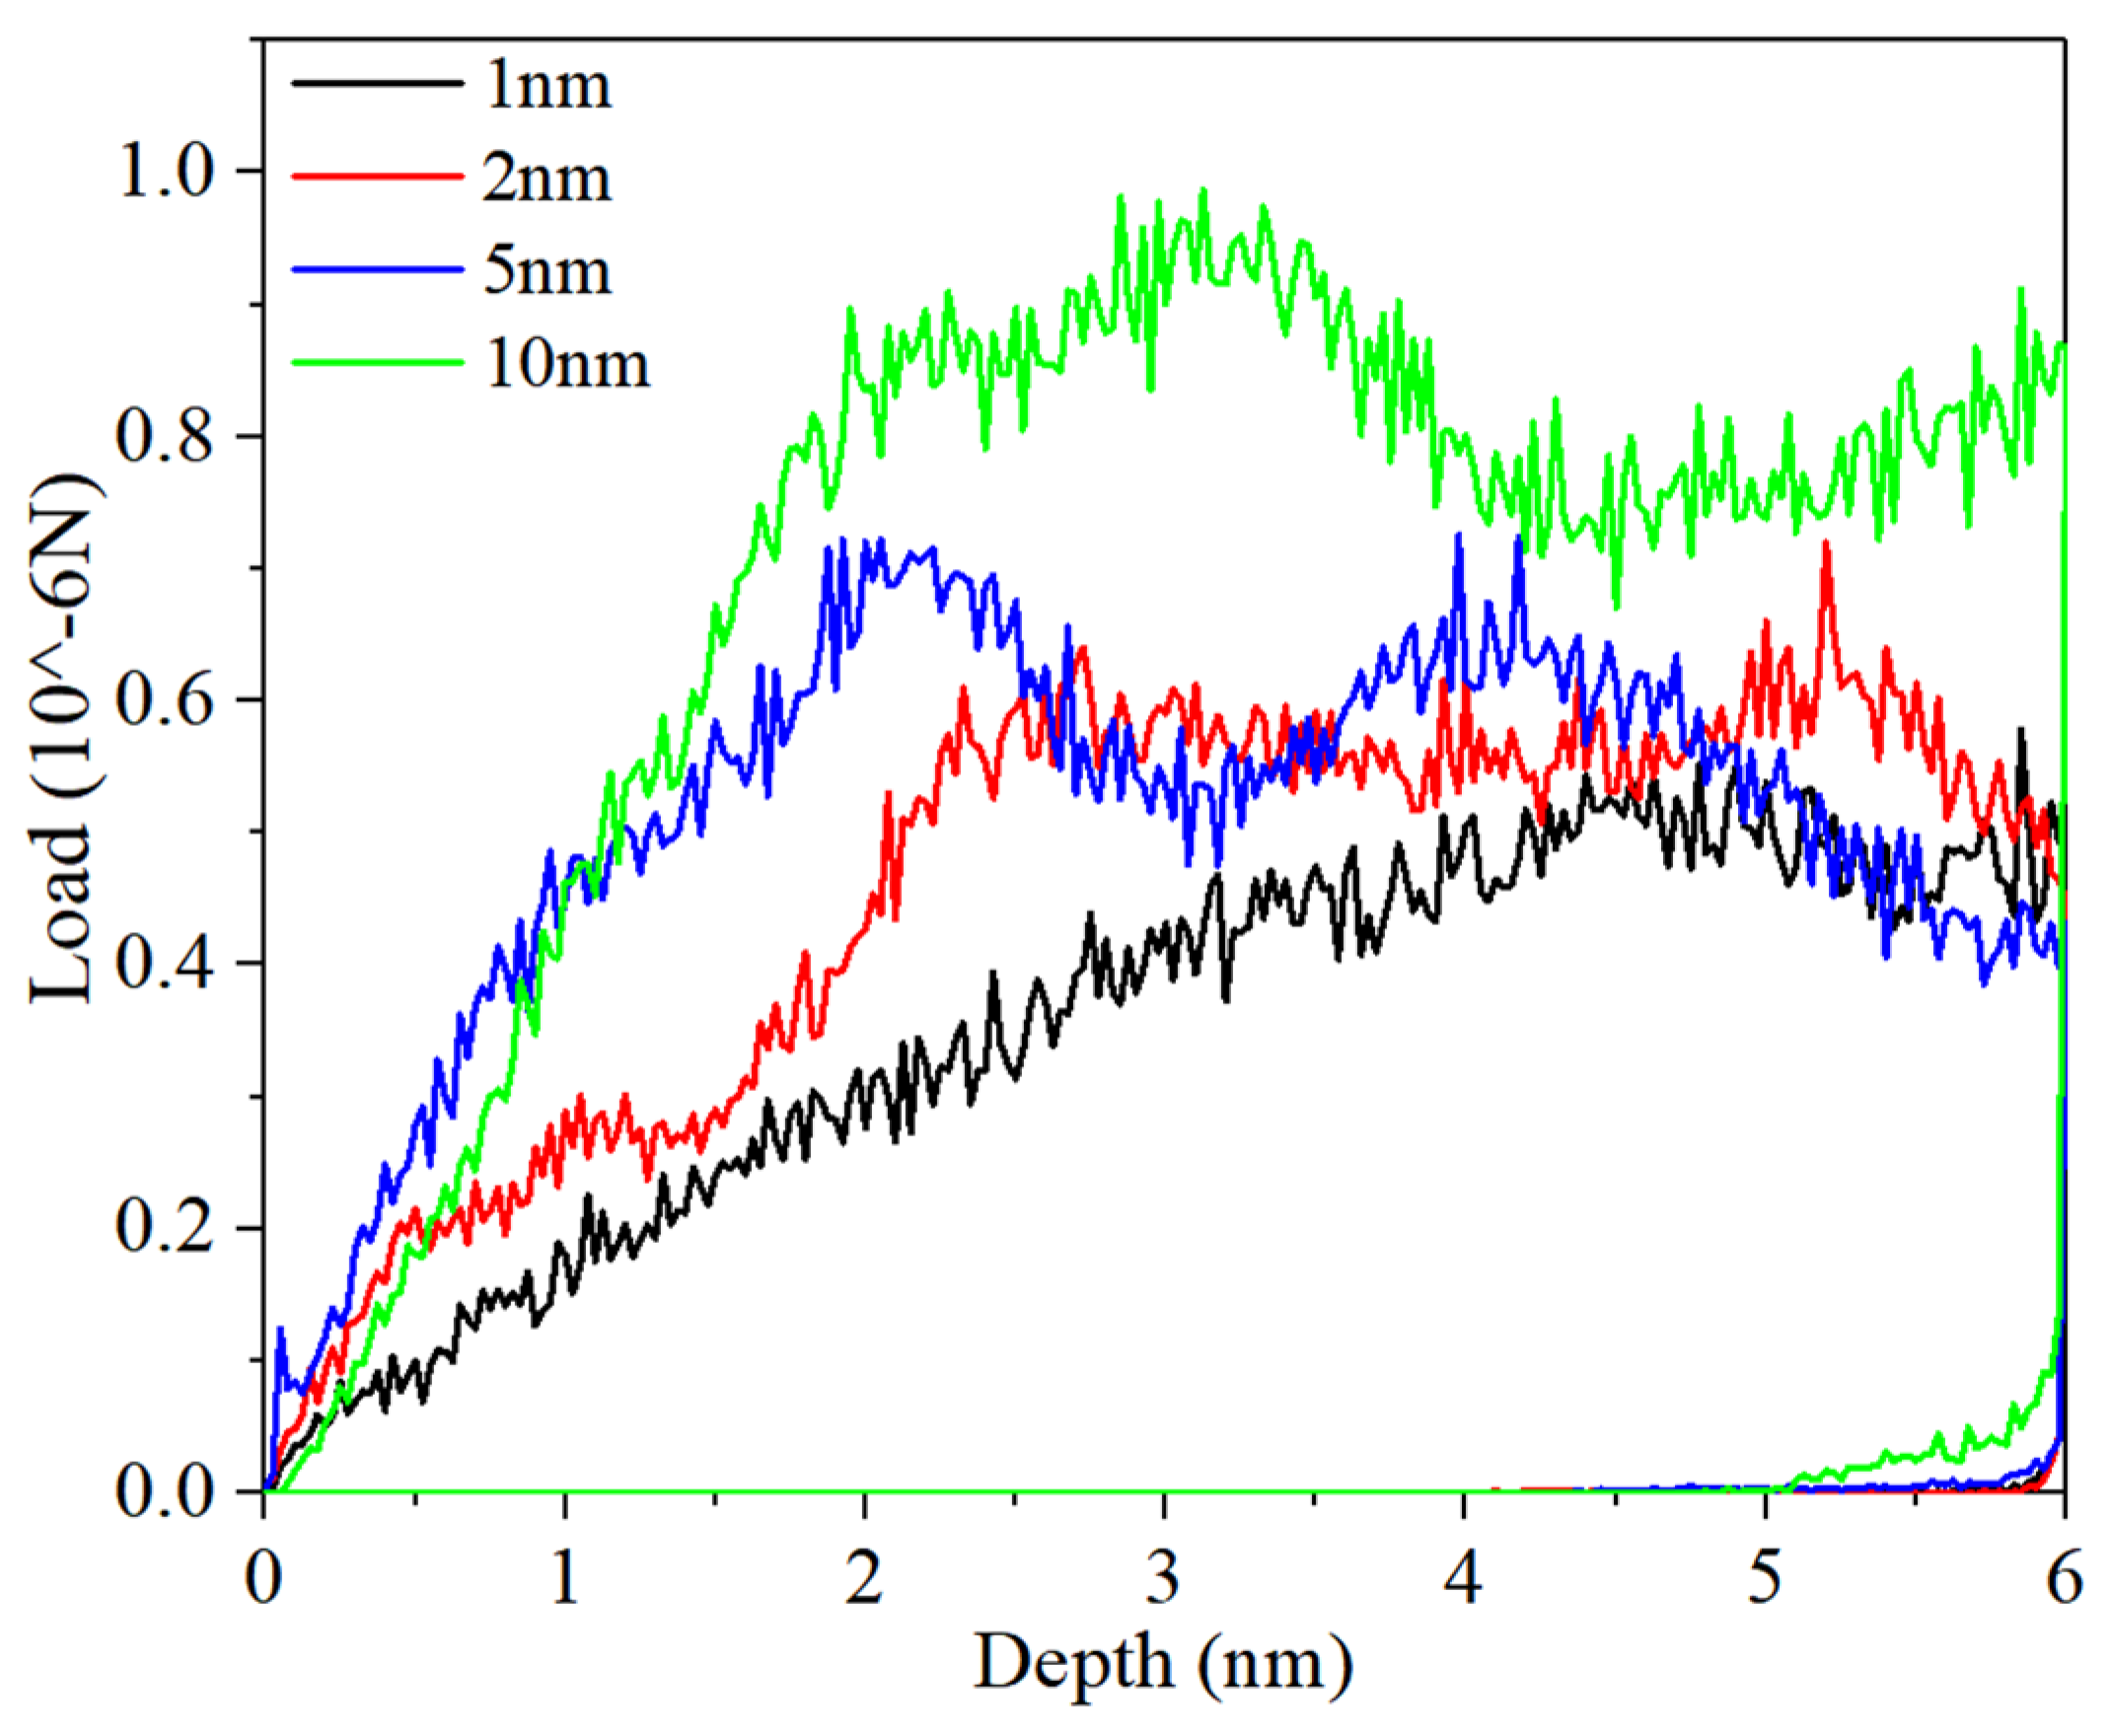
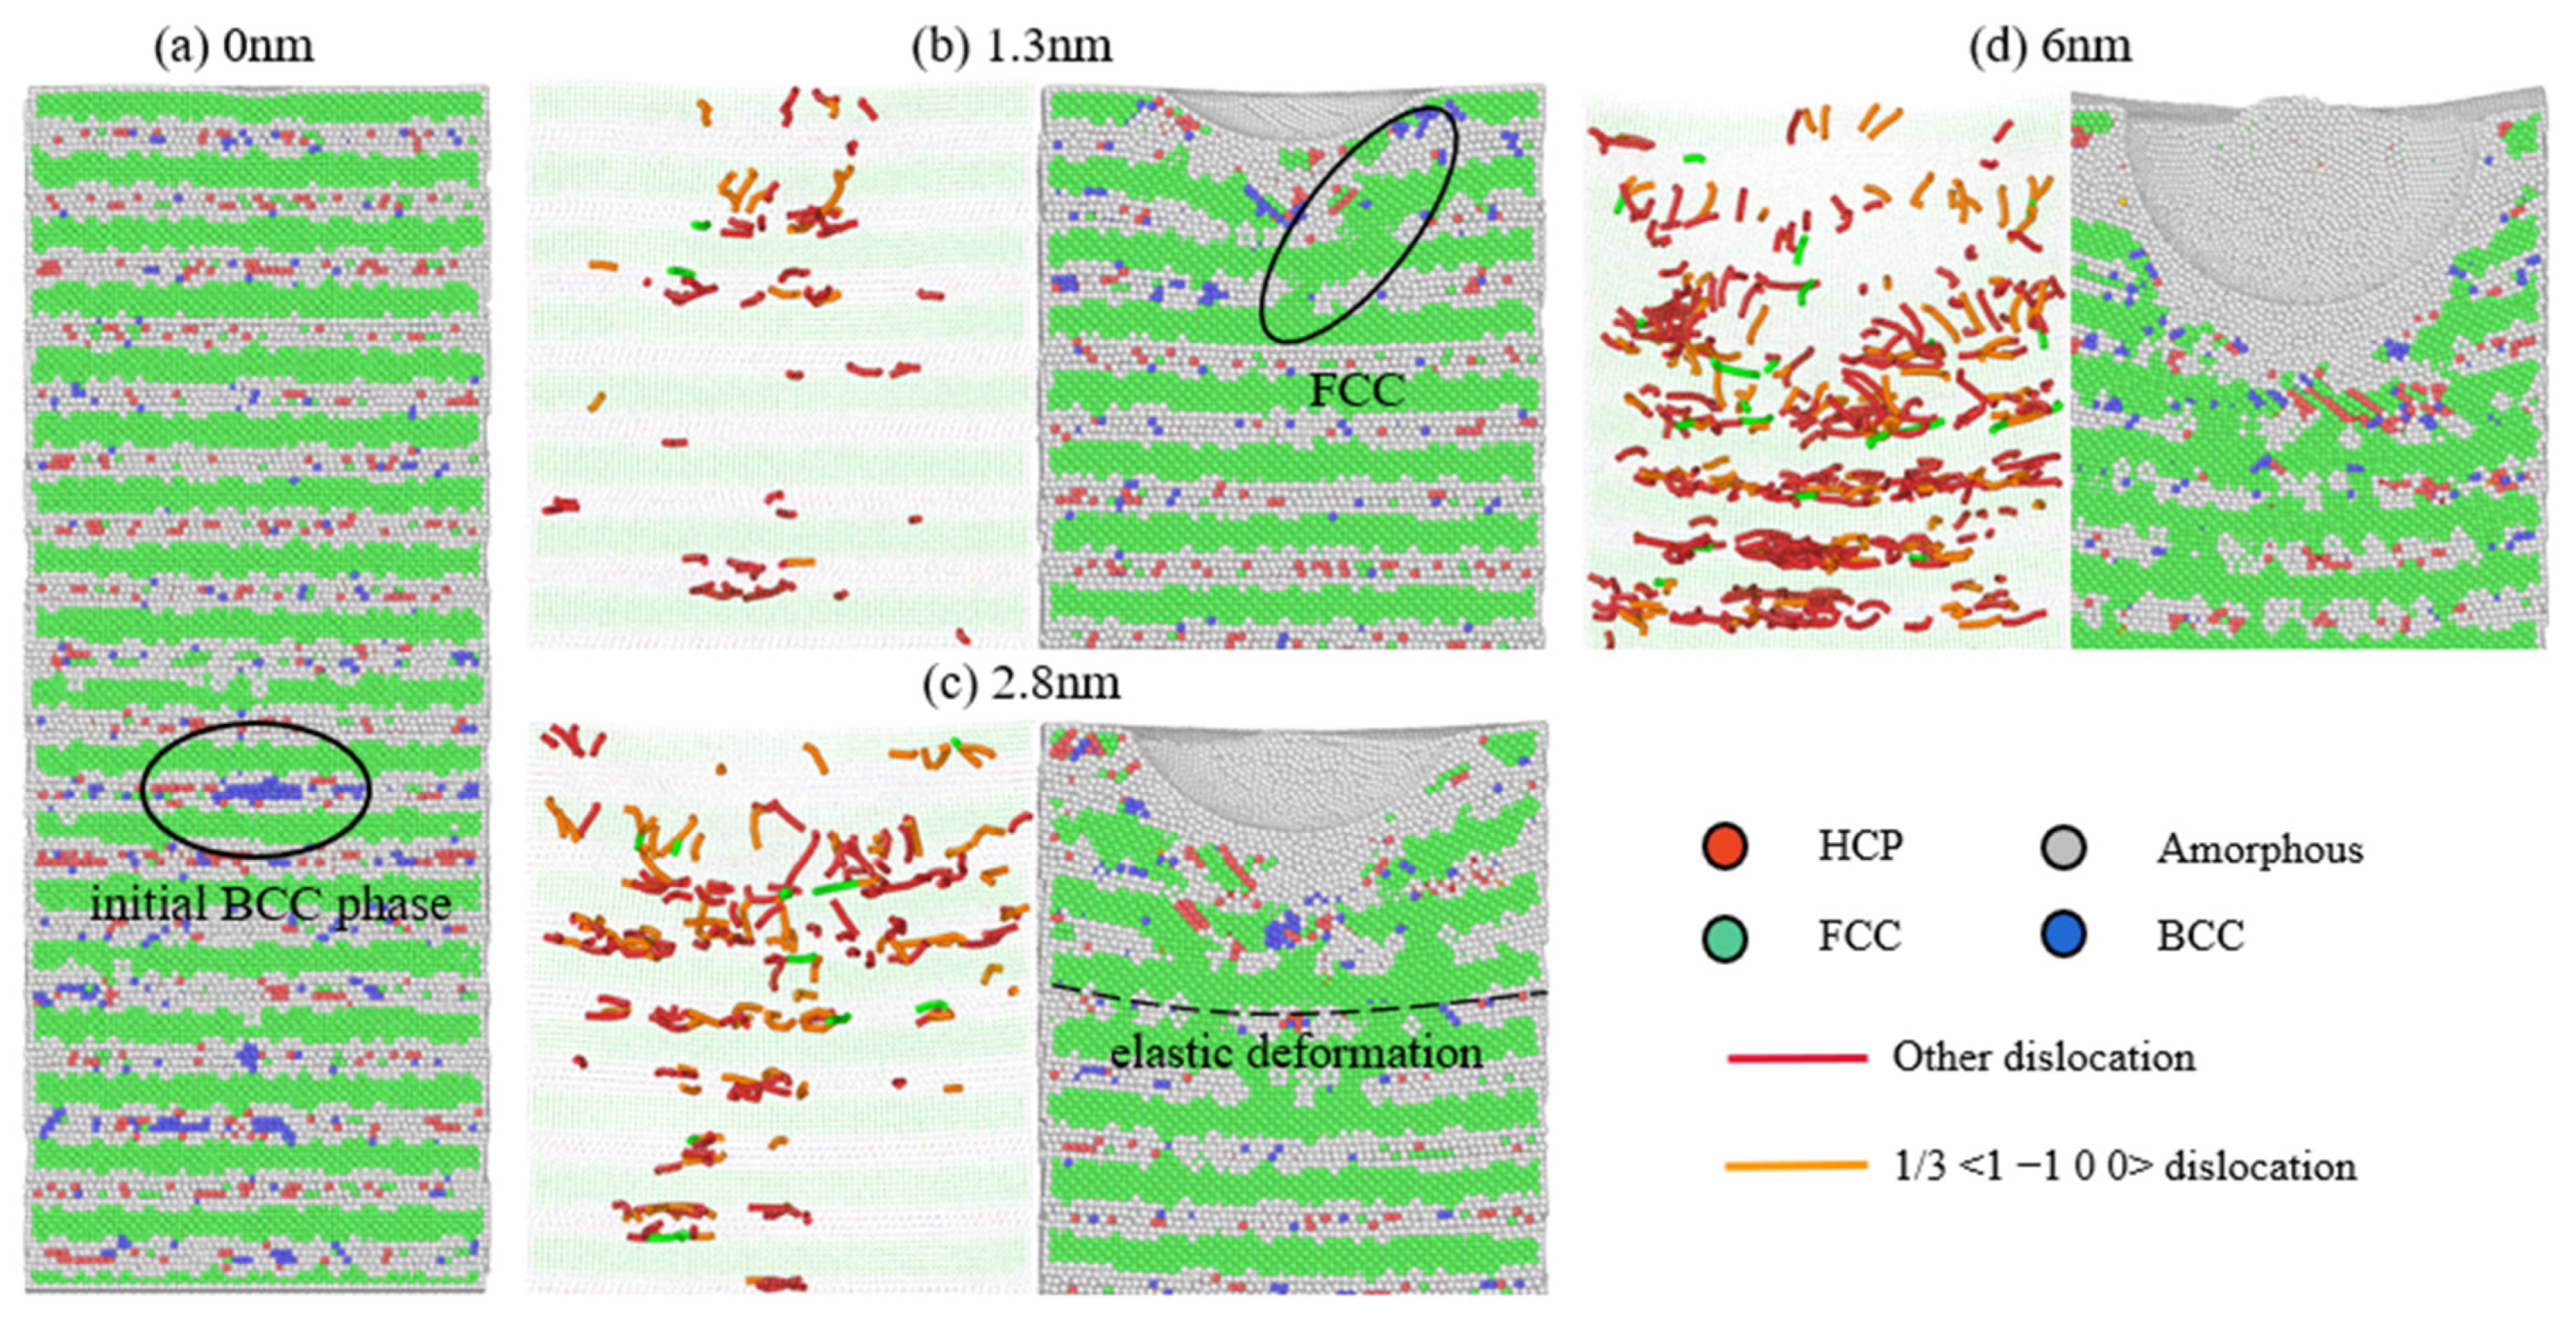
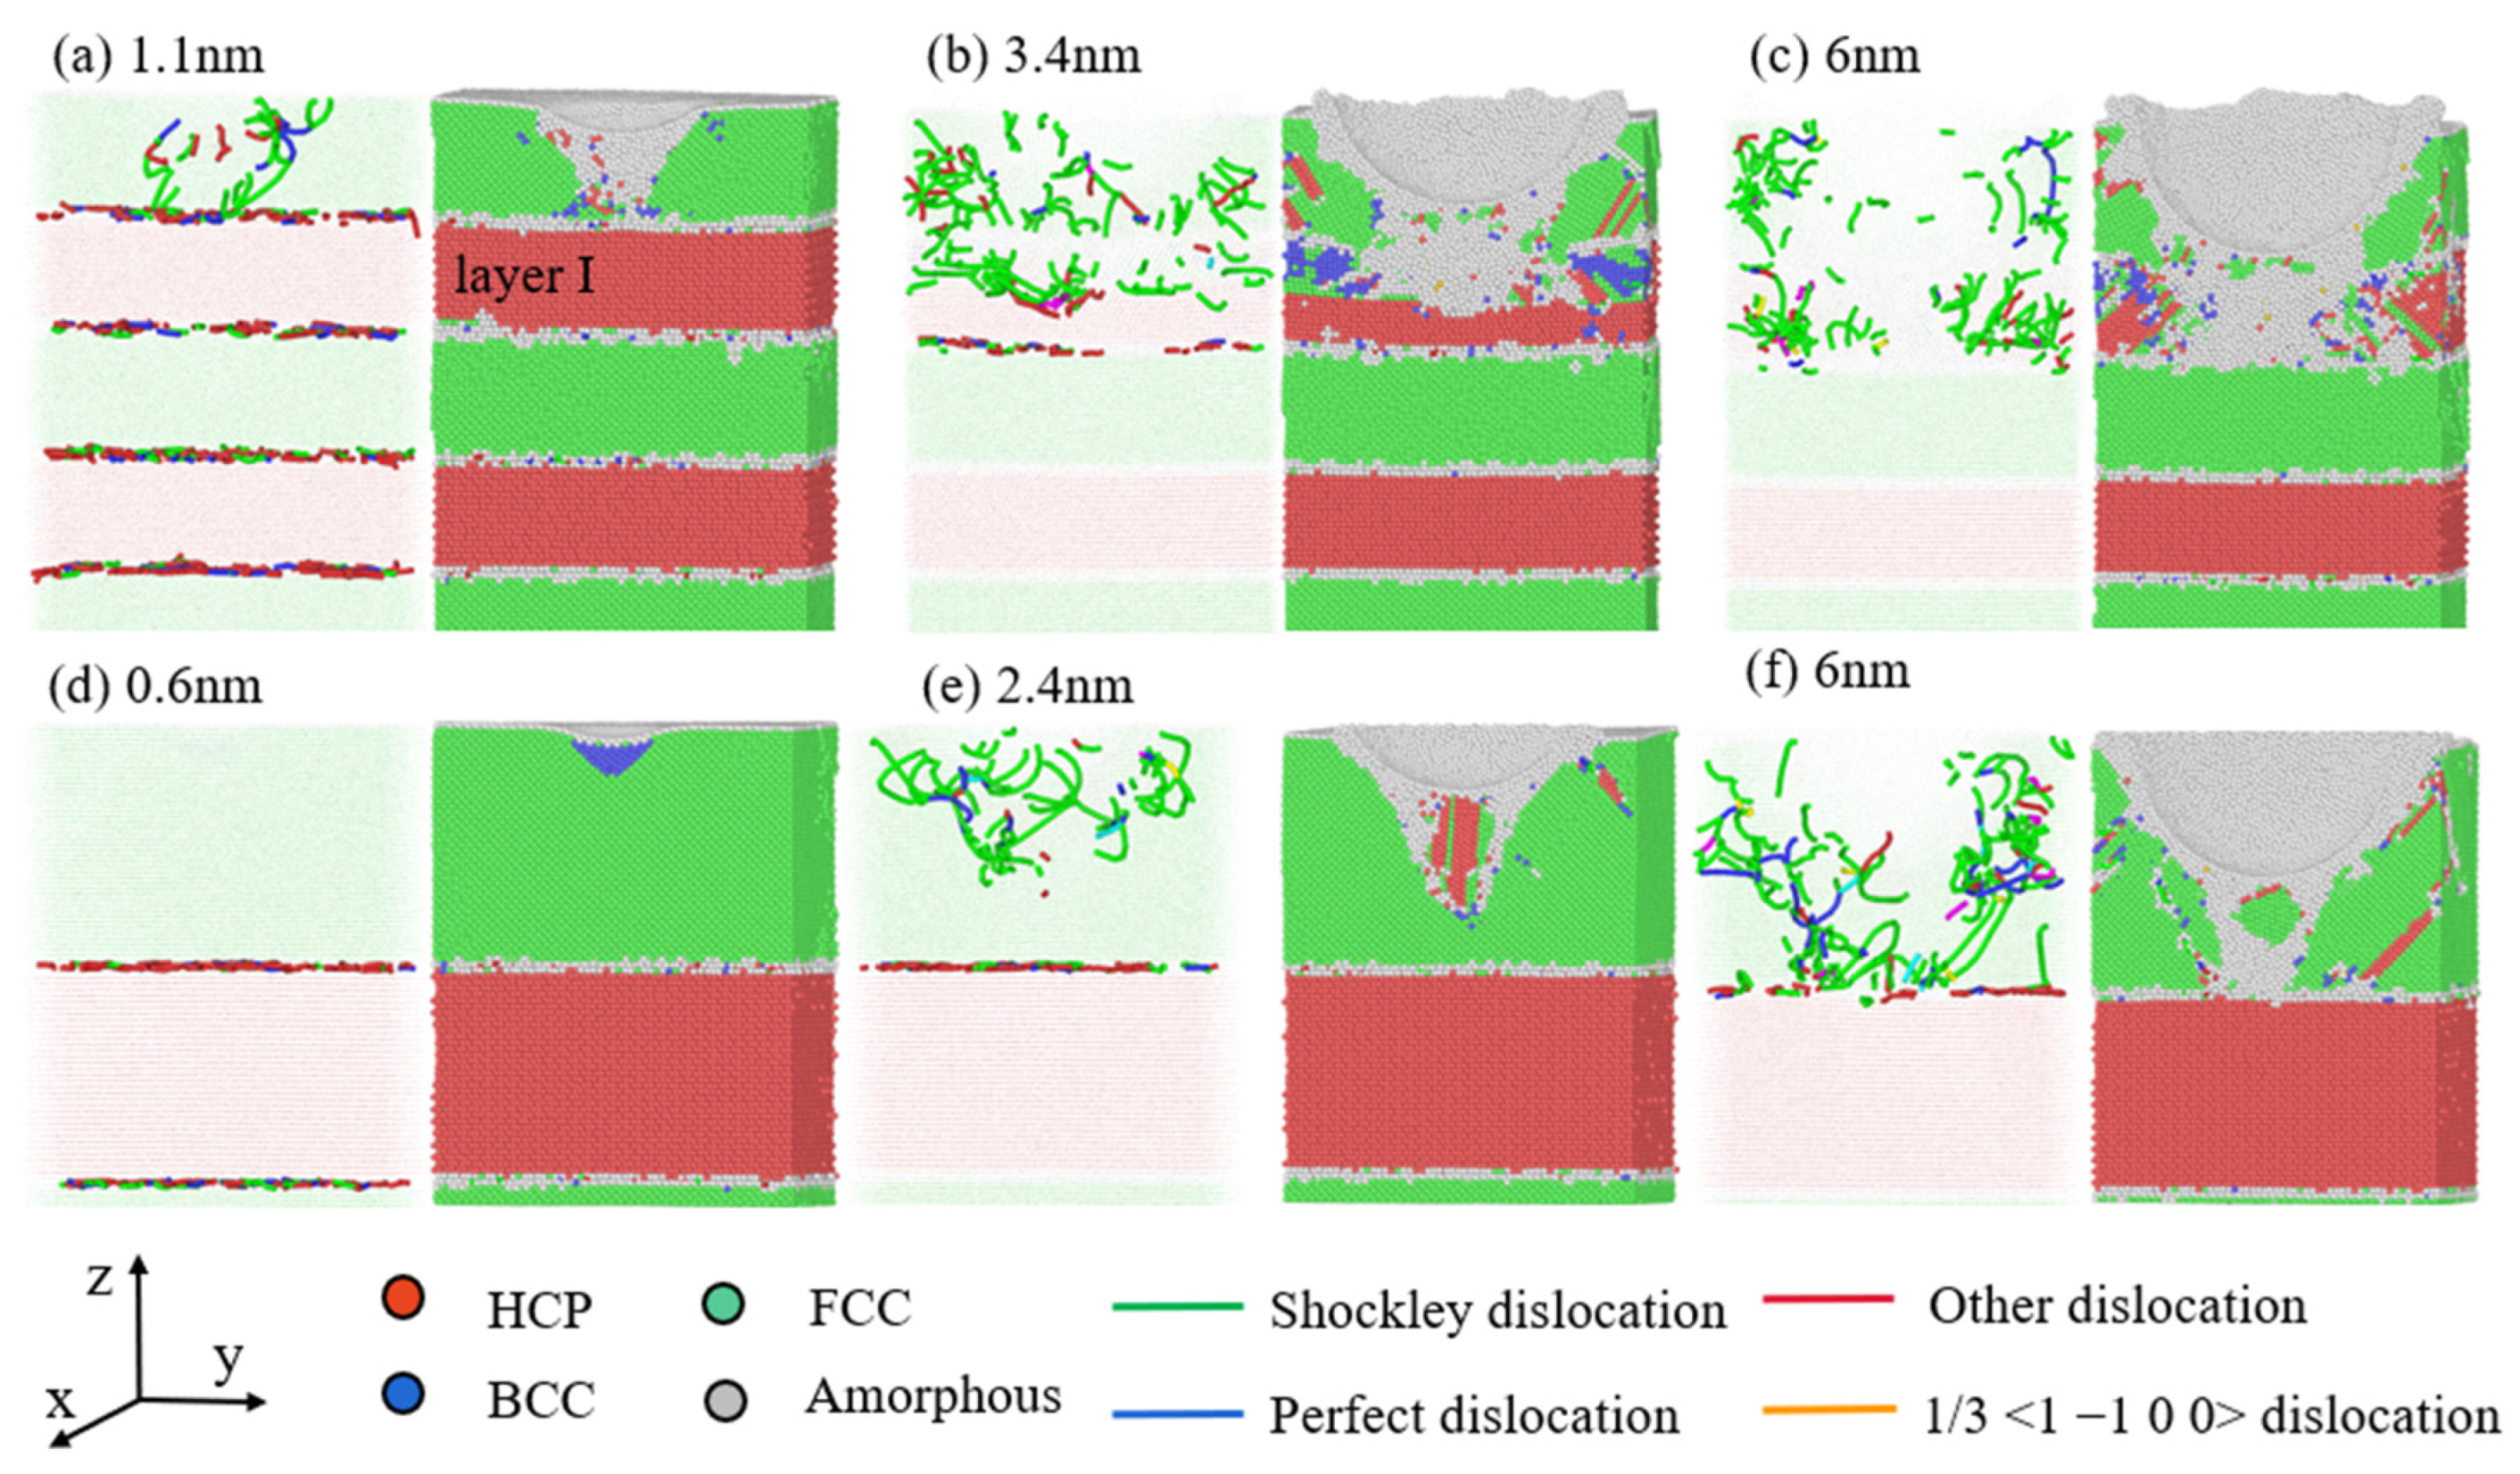
- For the nanocomposites with layer thicknesses ranging from 1 to 10 nm, the strength during nanoindentation increases with layer thickness. At 1 nm, high initial internal stress at the interface and increased amorphous atoms weaken interatomic interactions. The FCC phase appears in the Mg layer, making the adjacent interface completely coherent, which reduces the hindrance to dislocation. At higher layer thicknesses, the proportion of amorphous atoms is lower, and the interface strongly hinders dislocation.
- (2)
- The HCP phase in the Mg layer transforms to the BCC phase under stress due to shorter displacement vectors and lower energy barriers. The FCC phase appears later, driven by dislocations, and grows along the direction of dislocation movement. In the late stage of deformation, the FCC phase becomes dominant, with new dislocations forming and moving its slip plane, causing changes in the direction of dislocations in the Mg layer.
- (3)
- The phase transformation process in the Mg layer is influenced by the FCC/HCP interface configuration. At a 45° dislocation slip angle of the Mg layer, dislocations extend faster, increasing the BCC phase and decreasing the FCC phase. This proves that the force perpendicular to the basal plane tends to generate the FCC phase, while the BCC phase transition is more sensitive to the basal plane shear force. The local deformation from nanoindentation does not significantly change the nanocomposite strength due to the different Mg orientations.
Author Contributions
Funding
Data Availability Statement
Conflicts of Interest
References
- Meng, Q.; Wang, P.; Yu, Y.; Liu, J.; Su, X.; Kuan, H.-C.; Wang, B.; Zhang, L.; Zhang, Y.; Losic, D.; et al. Polyaspartic polyurea/graphene nanocomposites for multifunctionality: Self-healing, mechanical resilience, electrical and thermal conductivities, and resistance to corrosion and impact. Thin-Walled Struct. 2023, 189, 110853. [Google Scholar] [CrossRef]
- Shojaei, P.; Trabia, M.; O’Toole, B.; Jennings, R.; Zhang, X.; Liao, Y. Enhancing hypervelocity impact resistance of titanium substrate using Ti/SiC Metal Matrix Nanocomposite coating. Compos. Part B Eng. 2020, 194, 108068. [Google Scholar] [CrossRef]
- Xi, Z.; Sun, J.; Chen, L.; Cui, H.; Ma, Y.; Zhou, H.; Chen, J. Tribological behaviors of nano-schistose MSH in phosphate/graphite composite lubricating coatings under different friction temperatures. Tribol. Int. 2024, 191, 109172. [Google Scholar] [CrossRef]
- Zhang, L.; Yang, D.; Ma, Z.; Deng, Z.; Li, Z.; Drummer, D.; Jiang, B. Pulse current electroforming of Ni-PTFE nanocomposite mold insert with long-lifetime and anti-adhesive properties. Electrochim. Acta 2024, 491, 144308. [Google Scholar] [CrossRef]
- Nistal, A.; Ruiz-González, A.; Choy, K.-L. Robust icephobic nanocomposite coatings with superior abrasion resistance. Appl. Mater. Today 2022, 27, 101480. [Google Scholar] [CrossRef]
- El-Safty, S.A.; Shenashen, M.A.; Elmarakbi, A. Advances in polymer/inorganic nanocomposite fabrics for lightweight and high-strength armor and ballistic-proof materials. Chem. Eng. J. 2024, 493, 152422. [Google Scholar] [CrossRef]
- Ai, D.; Wu, C.; Han, Y.; Chang, Y.; Xie, Z.; Yu, H.; Ma, Y.; Cheng, Y.; Wu, G. Polymer nanocomposites with concurrently enhanced dielectric constant and breakdown strength at high temperature enabled by rationally designed core-shell structured nanofillers. J. Mater. Sci. Technol. 2024, 210, 170–178. [Google Scholar] [CrossRef]
- Li, Z.; Li, J.; Shen, T.; He, D.; Jia, X.; Xia, S.; Zhao, J.; Wang, R.; Jiang, Z. Plastic deformation and fracture mechanisms of a novel Al/Mg bimetal composite at cryogenic temperatures. J. Mater. Res. Technol. 2024, 30, 3297–3307. [Google Scholar] [CrossRef]
- Li, Z.; Shen, T.; Hu, X.; Zhang, L.; Jia, X.; Li, J.; Zhang, C. The Plastic Deformation Mechanism in Nano-Polycrystalline Al/Mg Layered Composites: A Molecular Dynamics Study. Nanomaterials 2024, 14, 114. [Google Scholar] [CrossRef]
- Talapatra, A.; Datta, D. Experimental and molecular dynamics simulation based investigation to understand tribological performance of graphene reinforced thermoplastic polyurethane (Gr/TPU) nanocomposites. Tribol. Int. 2024, 196, 109703. [Google Scholar] [CrossRef]
- Zhao, Y.; Liu, K.; Zhang, H.; Tian, X.; Jiang, Q.; Murugadoss, V.; Hou, H. Dislocation motion in plastic deformation of nano polycrystalline metal materials: A phase field crystal method study. Adv. Compos. Hybrid Mater. 2022, 5, 2546–2556. [Google Scholar] [CrossRef]
- Han, R.; Song, H.; Han, L.; An, M. Atomistic insights on the deformation mechanisms of amorphous/crystalline dual-phase high entropy alloys under nanoindentation. J. Mater. Res. Technol. 2023, 25, 6027–6038. [Google Scholar] [CrossRef]
- Shuang, F.; Wang, B.; Aifantis, K. Revealing multiple strengthening transitions in crystalline-amorphous nanolaminates through molecular dynamics. Mater. Today Commun. 2023, 35, 105675. [Google Scholar] [CrossRef]
- Li, Z.; Cao, L.; Huo, M.; Jiang, Z. Evidence-based uncertainty quantification for bending properties of bimetal composites. Appl. Math. Model. 2023, 121, 59–74. [Google Scholar] [CrossRef]
- Kou, Z.; Li, X.; Huang, R.; Yang, L.; Yang, Y.; Feng, T.; Lan, S.; Wilde, G.; Lai, Q.; Tang, S. Stress-induced phase transformation and phase boundary sliding in Ti: An atomically resolved in-situ analysis. J. Mater. Sci. Technol. 2023, 152, 30–36. [Google Scholar] [CrossRef]
- Zhang, Y.; Li, Q.; Gong, M.; Xue, S.; Ding, J.; Li, J.; Cho, J.; Niu, T.; Su, R.; Richter, N.; et al. Deformation behavior and phase transformation of nanotwinned Al/Ti multilayers. Appl. Surf. Sci. 2020, 527, 146776. [Google Scholar] [CrossRef]
- Zu, Q.; Guo, Y.-F.; Yao, X. Surface and orientation effects on stress-induced hcp-fcc phase transformation in Ti nanopillars. Appl. Surf. Sci. 2020, 509, 145234. [Google Scholar] [CrossRef]
- Polak, W.Z. Efficiency in identification of internal structure in simulated monoatomic clusters: Comparison between common neighbor analysis and coordination polyhedron method. Comput. Mater. Sci. 2022, 201, 110882. [Google Scholar] [CrossRef]
- Sun, B.; Ouyang, W.; Ren, J.; Mi, L.; Guo, W. Fcc→bcc→hcp successive phase transformations in the strained ultrathin copper film: A molecular dynamic simulation study. Mater. Chem. Phys. 2019, 223, 171–182. [Google Scholar] [CrossRef]
- Assaf, E.I.; Liu, X.; Lin, P.; Erkens, S. PDB2DAT: Automating LAMMPS data file generation from PDB molecular systems using Python, Rdkit, and Pysimm. Softw. Impacts 2024, 20, 100656. [Google Scholar] [CrossRef]
- Ehrich, H.; Dollmann, A.; Grützmacher, P.; Gachot, C.; Eder, S. Automated identification and tracking of deformation twin structures in molecular dynamics simulations. Comput. Mater. Sci. 2024, 236, 112878. [Google Scholar] [CrossRef]
- Sircar, A.; Patra, P.K. A comparative investigation of shock response in high entropy Cantor alloys by MEAM and LJ type potentials. Mater. Today Commun. 2022, 33, 104843. [Google Scholar] [CrossRef]
- Srinivasan, P.; Nicola, L.; Simone, A. Modeling pseudo-elasticity in NiTi: Why the MEAM potential outperforms the EAM-FS potential. Comput. Mater. Sci. 2017, 134, 145–152. [Google Scholar] [CrossRef]
- Zhang, G.; Zhang, J.; Chen, Y.; Du, M.; Li, K.; Su, L.; Yi, H.; Zhao, F.; Cao, X. Logarithmic total variation regularization via preconditioned conjugate gradient method for sparse reconstruction of bioluminescence tomography. Comput. Methods Programs Biomed. 2024, 243, 107863. [Google Scholar] [CrossRef]
- Tan, S.; Do, D.D.; Nicholson, D. Consistency of NVT, NPT, µVT and Gibbs (NV2T and NPT) with kinetic Monte Carlo schemes. Chem. Eng. J. 2020, 401, 126056. [Google Scholar] [CrossRef]
- Guo, Q.; Hou, H.; Pan, Y.; Pei, X.; Song, Z.; Liaw, P.K.; Zhao, Y. Hardening-softening of Al0.3CoCrFeNi high-entropy alloy under nanoindentation. Mater. Des. 2023, 231, 112050. [Google Scholar] [CrossRef]
- Shen, Z.; Dong, R.; Li, J.; Su, Y.; Long, X. Determination of gradient residual stress for elastoplastic materials by nanoindentation. J. Manuf. Process. 2024, 109, 359–366. [Google Scholar] [CrossRef]
- Ning, J.; Gao, K.; Wang, J.; Xiong, X.; Li, H.; Min, F.; Wen, S.; Wu, X.; Huang, H.; Wei, W.; et al. The mechanical properties of Al3Sc single crystal investigated by nanoindentation using Hertzian elasticity theory method and Oliver-Pharr method. J. Alloys Compd. 2024, 994, 174598. [Google Scholar] [CrossRef]
- Gong, J.; Peng, Z.; Miao, H. Analysis of the nanoindentation load–displacement curves measured on high-purity fine-grained alumina. J. Eur. Ceram. Soc. 2005, 25, 649–654. [Google Scholar] [CrossRef]
- Gao, X.; Hong, D.; Paranjape, H.M.; Zhang, W.; Anderson, P.M. Berkovich indentation and the Oliver-Pharr method for shape memory alloys. Int. J. Mech. Sci. 2024, 270, 109077. [Google Scholar] [CrossRef]
- Li, Z.; Gao, Y.; Zhan, S.; Fang, H.; Zhang, Z. Molecular dynamics study on temperature and strain rate dependences of mechanical properties of single crystal Al under uniaxial loading. AIP Adv. 2020, 10, 075321. [Google Scholar] [CrossRef]
- Machado, M.; Moreira, P.; Flores, P.; Lankarani, H.M. Compliant contact force models in multibody dynamics: Evolution of the Hertz contact theory. Mech. Mach. Theory 2012, 53, 99–121. [Google Scholar] [CrossRef]
- Cross, G.L.W.; Schirmeisen, A.; Grütter, P.; Dürig, U.T. Plasticity, healing and shakedown in sharp-asperity nanoindentation. Nat. Mater. 2006, 5, 370–376. [Google Scholar] [CrossRef]
- Ham, B.; Zhang, X. High strength Mg/Nb nanolayer composites. Mater. Sci. Eng. A 2011, 528, 2028–2033. [Google Scholar] [CrossRef]
- Dhawan, S.; Dhawan, T.; Vedeshwar, A.G. Crystalline to amorphous phase transformation of Ta2O5 quantum dots driven by residual stress. J. Alloys Compd. 2016, 657, 366–371. [Google Scholar] [CrossRef]
- Wu, Z.; Liu, W.; Zhang, L.; Lim, S. Amorphization and dislocation evolution mechanisms of single crystalline 6H-SiC. Acta Materialia 2020, 182, 60–67. [Google Scholar] [CrossRef]
- Maurya, S.K.; Nie, J.F.; Alankar, A. Atomistic analyses of HCP-FCC transformation and reorientation of Ti in Al-Ti multilayers. Comput. Mater. Sci. 2021, 192, 110329. [Google Scholar] [CrossRef]
- Shao, X.; He, C.; Liu, H.; Su, N.; Wu, Y.; Chen, Q.; Ma, X. Amorphization of nano-Mg layers in LPSO-containing magnesium alloy during cyclic deformation. Scr. Mater. 2024, 245, 116059. [Google Scholar] [CrossRef]
- Colin, J. Dislocation equilibrium in a misfitted composite structure with partially coherent interfaces. Mech. Res. Commun. 2023, 132, 104168. [Google Scholar] [CrossRef]
- Li, J.; Lu, H.; Ni, Y.; Mei, J. Quasicontinuum study the influence of misfit dislocation interactions on nanoindentation. Comput. Mater. Sci. 2011, 50, 3162–3170. [Google Scholar] [CrossRef]
- He, D.; Zhu, J.-C.; Lai, Z.-H.; Liu, Y.; Yang, X.-W.; Nong, Z.-S. Residual elastic stress–strain field and geometrically necessary dislocation density distribution around nano-indentation in TA15 titanium alloy. Trans. Nonferrous Met. Soc. China 2013, 23, 7–13. [Google Scholar] [CrossRef]
- Zhou, J.-N.; Guo, Y.-F.; Ren, J.-Y.; Tang, X.-Z. The mechanism of hcp-bcc phase transformation in Mg single crystal under high pressure. Scr. Mater. 2023, 236, 115670. [Google Scholar] [CrossRef]
- Xue, C.; Li, S.; Chu, Z.; Yang, Q.; Li, Y.; Ma, L.; Tuo, L. Molecular dynamics study on the effect of temperature on HCP→FCC phase transition of magnesium alloy. J. Magnes. Alloys 2023, 11, 3749–3764. [Google Scholar] [CrossRef]
- Jain, M.; Yaddanapudi, K.; Kidigannappa, A.T.; Baldwin, K.; Knezevic, M.; Mara, N.A.; Beyerlein, I.J.; Pathak, S. Simultaneous high strength and mechanical stability of bcc Nb/Mg nanolaminates. Acta Mater. 2023, 242, 118487. [Google Scholar] [CrossRef]


Disclaimer/Publisher’s Note: The statements, opinions and data contained in all publications are solely those of the individual author(s) and contributor(s) and not of MDPI and/or the editor(s). MDPI and/or the editor(s) disclaim responsibility for any injury to people or property resulting from any ideas, methods, instructions or products referred to in the content. |
© 2024 by the authors. Licensee MDPI, Basel, Switzerland. This article is an open access article distributed under the terms and conditions of the Creative Commons Attribution (CC BY) license (https://creativecommons.org/licenses/by/4.0/).
Share and Cite
Li, Z.; Li, J.; Shen, T.; Xia, S.; Jia, X.; Zhang, L.; Zhang, C. Strength Weakening and Phase Transition Mechanisms in Nanoindentation of Al/Mg-Layered Nanocomposites: A Molecular Dynamic Study. Processes 2024, 12, 1423. https://doi.org/10.3390/pr12071423
Li Z, Li J, Shen T, Xia S, Jia X, Zhang L, Zhang C. Strength Weakening and Phase Transition Mechanisms in Nanoindentation of Al/Mg-Layered Nanocomposites: A Molecular Dynamic Study. Processes. 2024; 12(7):1423. https://doi.org/10.3390/pr12071423
Chicago/Turabian StyleLi, Zhou, Junhao Li, Tong Shen, Shiqi Xia, Xianshi Jia, Lu Zhang, and Che Zhang. 2024. "Strength Weakening and Phase Transition Mechanisms in Nanoindentation of Al/Mg-Layered Nanocomposites: A Molecular Dynamic Study" Processes 12, no. 7: 1423. https://doi.org/10.3390/pr12071423