Abstract
The control of spoilage yeasts in wines is crucial to avoid organoleptic deviations in wine production. Traditionally, sulfur dioxide (SO2) was used to control them; nevertheless, SO2 influence on human health and its use is criticized. Biocontrol emerges as an alternative in wine pre-fermentation, but there is limited development in its applicability. Managing kinetics is relevant in the microbial interaction process. pH was identified as a factor affecting the interaction kinetics of Wickerhamomyces anomalus killer biocontrol on Zygosaccharomyces rouxii. Mathematical modeling allows insight into offline parameters and the influence of physicochemical factors in the environment. Incorporating submodels that explain manipulable factors (pH), the process can be optimized to achieve the best-desired outcomes. The aim of this study was to model and optimize, using a constant and a variable pH profile, the interaction of killer biocontrol W. anomalus vs. Z. rouxii to reduce the spoilage population in pre-fermentation. The evaluated biocontrol was W. anomalus against the spoilage yeast Z. rouxii in wines. The kinetic interactions of yeasts were studied at different pH levels maintained constant over time. The improved Ramón-Portugal model was adopted using the AMIGO2 toolbox for Matlab. A static optimization of a constant pH profile was performed using the Monte Carlo method, and a dynamic optimization was carried out using a method based on Fourier series and orthogonal polynomials. The model fit with an adjusted R2 of 0.76. Parametric analyses were consistent with the model behavior. Variable vs. constant optimization achieved a lower initial spoilage population peak (99% less) and reached a lower final population (99% less) in a reduced time (100 vs. 140 h). These findings reveal that control with a variable profile would allow an early sequential inoculation of S. cerevisiae. The models explained parameters that are difficult to quantify, such as general inhibitor concentration and toxin concentration. Also, the models indicate higher biocontrol efficiency parameters, such as toxin emission or sensitivity to it, and lower fitness of the contaminant, at pH levels above 3.7 during biocontrol. From a technological standpoint, the study highlights the importance of handling variable profiles in the controller associated with the pH management actuators in the process without incurring additional costs.
1. Introduction
Wine is the result of grape must fermentation, mainly carried out by S. cerevisiae [1]. However, at the beginning (pre-fermentative stage), various yeast species coexist, originating from the grape surface and winery elements, among others [2]. Among them, spoilage yeast strains develop, affecting the organoleptic characteristics of the wine; one of them is Zygosaccharomyces rouxii [3]. Due to the economic significance of this industry in the region and several economies worldwide, these microbiological contaminations cause substantial economic losses and must be addressed [1,2,3]. For its control, traditionally, SO2 has been used. However, its use is not desired by consumers who prefer more natural products [4], nor by international organizations such as the International Organization of Vine and Wine “OIV” or the World Health Organization “WHO”, which seek to reduce it due to its toxicity to human health [5,6,7]. Moreover, regional wines (warm climate areas) often have a high pH [8] and this fact causes the total SO2 to lose its molecular SO2 (microbial inhibitor) condition from 6% at pH 3 to 0.6% at pH 4 [9]. Ultimately, this compound is inefficient in controlling Z. rouxii [4] and its use must be reconsidered.
Biocontrol has been cited as an alternative for a long time in different areas [10] and continues to be relevant today [11], with the aim of reducing the use of SO2 in wines [12,13,14]. However, most studies focus on yeast selection and/or biocontrol mechanisms, and there is limited information on their application, especially in more real environments [15]. Biocontrol occurs due to the interaction of microorganisms; in this case, it is desired to take place in a pre-fermentation stage, as it is expected that Saccharomyces cerevisiae (through sequential inoculation), with its ethanol production, will conclude the biocontrol process against weakened spoilage yeasts [16]. A problem related to the applicability and realism of the must wine, as initially named, is the complexity of the involved yeast populations and their interactions. However, in order to advance the study of the interactions in the pre-fermentation must, it is relevant to abstract this to an individual interaction kinetic behavior (two populations). Specifically, an interaction previously studied by us involves Wickerhamomyces anomalus and Z. rouxii. The former was selected for its positive oenological attributes but primarily for its wide spectrum of action against the strains of Z. rouxii and Brettanomyces bruxellensis (two of the major contaminants of musts and wines). This interaction, based on our investigations, is a case of amensalism (killer) [17]. This type of interaction involves two simultaneous characteristics, competition for the medium and the emission of the toxin (amensalism) [15]. Therefore, unlike adding SO2, the kinetics of the interaction is highly relevant, as the inhibitory molecule must be produced in the medium during the development of both populations [16].
In order to analyze the relative importance of competition and amensalism, and due to the complexity of quantifying certain metabolites, a model-based approach is a relevant alternative to elucidate these underlying mechanisms of interaction [17]. Mathematical models can describe the most relevant mechanisms of a biological system, i.e., the growth kinetics and the formation of products such as the toxin itself [16]. Additionally, based on our background in fixed-time (static) statistical screenings and the optimizations of the interaction in a liquid medium, it was determined that pH was a significant factor and some optimal working conditions were obtained [18]. pH affects fitness and individual population kinetics [2,19] and interaction kinetics (competence) through toxin emission (amensalism) [18,20]. As mentioned, pH in winemaking initially differs in grape musts from warm regions, where it tends to be high (average pH: 3.8, reaching 4.4) [8,21]. On the other hand, pH can be manipulated, and is a common practice, through acidification by adding organic acids [9] or deacidification by adding salts or electro-dialysis with ion exchange resins [22]. Evaluating models under different physicochemical conditions (e.g., pH) highlights parametric changes. This allows for the creation of secondary models and the possibility of generating predictions under unexplored conditions [23,24]. These unexplored conditions may predict better biocontrol interaction performance through the optimization of different desirability functions (maximizing biocontrol population, minimizing spoilage yeast population, maximizing amensalism, and maximizing competition) [25].
Traditional process optimization involves generating a response surface from a set of experiments maintaining constant operating conditions to find the optimal condition that meets a specific objective function [25]. However, in many systems, the optimal conditions change over time, and biological systems are no exception to this reality. In the case of the killer toxin, it is estimated to be produced mainly during the exponential phase [20]. On the other hand, certain conditions and manipulable variables such as pH, in processes like pre-fermentation or fermentation, can be modified over time [26]. Nevertheless, there is little exploration in biotechnology regarding the use of variable profiles to improve the objective function [26]. Our research group developed a dynamic optimization technique based on orthogonal polynomials and Fourier series useful in bioprocesses to produce mathematically continuous and differentiable functions and develop smooth profiles for manipulable physicochemical variables, avoiding abrupt changes that negatively affect microorganisms [27,28]. These techniques have been utilized by our research group in metabolite production biotechnology related to simple microbial populations [29]. However, dynamic optimizations using a variable profile (e.g., pH) for interactions in mixed populations and particularly for enological processes and their yeast populations have not been found. This goal necessarily requires the development of robust mathematical models with submodels that accurately explain physicochemical changes. Therefore, the objective of this study is to model mathematically and optimize, using a constant and a variable pH profile, the biocontrol process of the biocontrol yeast W. anomalus against the wine spoilage yeast Z. rouxii, aiming to reduce it in the pre-fermentation stages of wine and thus, in the future, by making microbial interactions more complex and understanding them, we can reduce the use of total SO2 in musts and wines.
2. Materials and Methods
2.1. Microorganisms and Pre-Fermentations
Two non-Saccharomyces strains from the culture collection of the Institute of Biotechnology at the Faculty of Engineering of the National University of San Juan were used. The strain Wickerhamomyces anomalus “BWa156” was determined as a killer biocontroller of Zygosaccharomyces rouxii and Brettanomyces bruxellensis in previous assays [16]. Moreover, BWa156 was selected due to contributing positive traits to wine and the absence of influence on human health in the experiments realized [16]. The strain Z. rouxii “BZr6” is a wine’s spoilage yeast [4]. Both strains were molecularly identified by our research group [30].
Erlenmeyer flasks of 250 mL were filled with 200 mL of grape must. The sterile grape must had a sugar content of 23 °Brix with a 0.1% yeast extract. The pre-inoculum of each isolate was made under the same initial conditions but with pH: 3.7, 1% yeast extract, and 110 rpm overnight. The pre-fermentation biocontroller/spoilage population inoculation ratio was 20%:80% (total inoculum 2 × 10⁶ cells/mL) [16]. Three different pH levels were tested: 3.2, 3.7, and 4.2 (n = 3), which were maintained constant by adding HCL or NaOH 1N daily for 225 h at 25 °C. Pre-fermentation samples were plated on Wallerstein Laboratory Nutrient (WLN agar), a selective medium (Figure 1), for cell counts at a dilution allowing the observation of 50 to 250 colonies for both the strains. In Figure 1, the colony differences between both the yeast strains can be observed. At the time of counting, both the yeasts were found together on the plates due to having originated from a mixed culture. In the cases where population differences did not permit simultaneous counting, populations were counted from different dilutions of the same sample with the same colony expression objective.
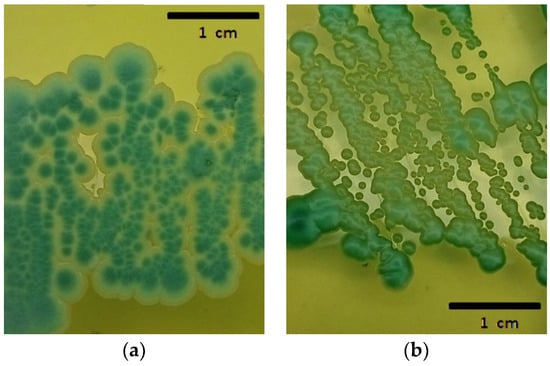
Figure 1.
(a) Wickerhamomyce anomalus “BWa156”; (b) Zygosaccharomyces rouxii “BZr6” in WLN.
2.2. Model for Amensalism
As it involves a killer amensalism, the model that best explains the biological behavior is the one proposed by Ramón-Portugal et al. [31], later modified in its adaptation phase by Pommier et al. [32], and further modified in its stationary phase by our research group [16].
In this primary model [16], biomass (cells/mL) is segregated into 2 variables: the viable controller yeasts (killer) “” and the viable spoilage yeasts (sensitive) “”. “” is the killer toxin concentration and “” is a generic inhibitor undefined for both the yeasts (ethanol, oxygen, and limiting substrate, among others). The dynamic evolution of each of the 6 variables in the model is given by the system.
The growth rates “” and “” (cells/h × mL) are related to specific growth rates “” and “” (h−1) and are limited by a general inhibition of both yeasts, and they can be logistically expressed through deceleration parameters “” and “” (L/g) (killer and sensitive strain, respectively).
The production rate of the general inhibitor “” (g/L) is proportional “” to the sum of the growth rates from both populations.
The death rates “” and “” are driven by different forces where the parameters “” y “” (h−1) describes the natural death. While the killer population only dies naturally, the sensitive population involves another term including the concentration of the toxin “” (g/L). The toxicity of the toxin or the sensitivity of the spoilage yeasts is defined by the parameter “” (L/g × h) describing the influence of the toxin concentration over the sensitive population concentration.
The toxin production “” is proportional to the killer yeast growth rate “” (g × mL/L × cells), and the adhesion rate of the toxin to the sensitive population “”, or consume, is defined by the parameter “” (mL/cells × h), the sensitive population, and the toxin concentration. This process is assumed to be instantaneous.
Equation (2) belonging to Pommier et al.’s [32] model was modified by Equation (14) proposed by our group [16]. This update takes into account the multiplication rates of both the populations and the influence on the behavior due to wine static conditions “”, through an activation function “Heaviside”, where patches of the population with certain physicochemical continuity occur [33].
2.3. Theoretical Methods: The Modeling Pipeline
Modeling was approached from a system identification perspective, which included the following steps: the formulation of candidate models, parameter estimation from multiple experiments with the same initial conditions (Table 1), and model reduction and selection.

Table 1.
Experiment initial conditions.
2.4. Candidate Models Formulation
Several candidate models were formulated, taking into account the biology of the amensalism system (primary model) and different polynomial submodels based on pH. The solution of the model depends on the given initial conditions, the process pH, and the values of a series of unknown parameters.
2.5. Parameter Estimation
The aim is to calculate the unknown parameters, constants related to growth, and kinetic parameters that minimize the distance between the data and the model predictions, in other words, the error. One way to minimize it is through an objective function that includes the measure of distance using least squares:
where “” is the number of experiments and “” is the number of observables for each experiment. The vectors ∈ ⊂ represent the data samples for each observable in each experiment, ∈ ⊂ represent the corresponding model predictions, ∈ ⊂ is a vector of unknown parameters, and ∈ ⊂ is a symmetric matrix of weights.
2.6. Model Selection and Reduction
The models were iteratively compared based on their ability to fit the experimental data. Since the models with more parameters often have better fits but tend to overfit, the number of parameters was also considered. The Akaike Information Criterion (AIC) was used for this purpose, aiming to balance parsimony and the relative loss of information among the candidate models by penalizing the number of parameters [34]. It is defined as follows:
where “” is the number of parameters, “” is the number of data points, and “” is the sum of squared residuals. The process started with the most complex candidate models, and after fitting the data, the less influential parameters were iteratively eliminated following the AIC strategy.
The minimum AICM value “AICmin” was used to rescale AIC. The rescaled value ΔM = AICM − AICmin was used to measure the models’ merit: the models with ΔM ≤ 2 provide substantial support, models with 4 ≤ ΔM ≤ 7 provide considerably less support, and models with ΔM > 10 have no support [34].
2.7. Numeric Tools
To automate the modeling process, we used the AMIGO2 toolbox (IIM-CSIC, Vigo, Spain) [24]. AMIGO2 is a MATLAB-based tool focused on the identification and optimization of parametric models, including sensitivity and identifiability analysis. Software: The MathWorks Inc. (Natick, MA, USA) MATLAB version 9.3.0.713579 (R2017b). It provides a set of numerical methods for both simulation and optimization. From the available options, we selected CVODES [35] to solve the model equations and Enhanced Scatter Search (eSS) [36] to find the optimal parameter values within a reasonable time frame.
2.8. Optimization
2.8.1. Constant pH
To achieve static optimization, a Monte Carlo algorithm was developed, which is widely used in the parametric estimation of nonlinear systems [37,38]. This is a method that makes random choices to generate an outcome. This implies that it can provide a higher or lower index, subject to probability [39]. Although this random algorithm may not find the minimum value, the probability of obtaining such a result is limited. One way to reduce this probability is to simply run the algorithm repeatedly (N times), with independent random parameter choices in each iteration, theorem 1 [40]. The number of simulations (N) is determined by choosing appropriate accuracy ε and confidence δ to limit the possibility of getting an undesired answer. Then, Equation (16) is used to calculate the number of iterations.
The values of and were chosen for the desired accuracy: = 0.01 and = 0.005, resulting in N = 1000.
2.8.2. Variable pH
To find the optimal pH variable profile, a novel strategy, originally developed by, is proposed [27]. This strategy assumes that the optimal control action is a continuous or piecewise continuous function and can be approximated by a function belonging to the Hilbert space L2 [0, tf], where tf is the final reaction time. Therefore, it can be constructed through a linear combination of bases belonging to this space. One of the bases that belongs is obtained through the orthogonalization and subsequent normalization of the base B = {1, t, t2, t3,…}. Considering this hypothesis, the optimal control action (uopt) can be approximated with an orthonormal basis polynomial:
where ci are the coefficients of the polynomial, pi are the orthonormal polynomials obtained by applying Grand-Schmidt to the base B = {1, t, t2, t3,…} between 0 and tf, and l is the order of the polynomial.
On the other hand, another basis belonging to L2 [0, tf] is the orthogonal trigonometric Fourier basis, which states that any function in this space can be expressed as a sum of an infinite series of sine and cosine terms [41]. When the signal is smooth, successive harmonics have decreasing amplitudes (Bessel’s inequality and Parseval’s identity [42]) and the majority of the signal’s energy lies in a few terms using a minimal number of parameters. Therefore, the orthonormal basis polynomial is approximated with the initial terms of the Fourier series. Then, the polynomial coefficients are computed through the Fourier coefficients. However, when attempting to approximate the function with a polynomial, too many parameters can be needed for the approximation, and it can be challenging to manage control action constraints. Therefore, the key to the proposed methodology is to perform a Fourier series expansion for Equation (19), that is, a linear combination of the Fourier basis approximating uopt(t). This approach leverages the specific characteristics of the Fourier series:
- -
- Any piecewise continuous function can be approximated by a linear combination of the Fourier basis.
- -
- When the function to be approximated is smooth, only a few parameters are needed. Then, the first few terms of the series capture over 85% of the signal’s energy.
- -
- By adjusting the parameters, the signal can be bounded to handle constraints.
Thus, employing the Fourier series requires a minimal number of parameters, and it allows for signal bounding as well. In this way, if it is possible to obtain the optimal Fourier parameters such that the best control vector is found, then the Optimal Control Problem (OCP) is resolved. For more details, see Pantano et al. [27]. The Fourier parameters are optimized through a hybrid methodology which combines Monte Carlo with genetic algorithms (eSS) for parameter optimization.
The proposed methodology has the advantage of using fewer parameters than traditional Control Vector Parameterization “CVP” techniques, simplifying the optimization problem, and making it computationally more efficient. Moreover, the optimal operation profiles are smooth, continuous, and differentiable. Smooth changes in operational conditions help maintain cell viability and health. Abrupt changes in parameters such as temperature, pH, nutrient concentration, or agitation speed can stress or shock the cells, leading to reduced productivity or even cell death.
3. Results and Discussion
3.1. Data Obtained: Kinetic Behaviors Depend on pH
The killer biocontrol of Wickerhmaomyces anomalus over Zygosaccheromyces rouxii is an amensalism interaction [18]. Biocontrol success certainly could reduce the spoilage population and diminish the use of SO2. In relation to this, previous works cite that prevalence in the media of one yeast population implies spoilage control [31,32]. Kinetics revealed different behaviors in the function of the pH evaluated (Figure 2) and it can be observed that W. anomalus prevails in all the pre-fermentations; nevertheless, Z. rouxii decay was observed in pHs 3.7 and 4.2. The results are in agreement with our previous works [16,18]. The pH is a significant variable for individual or axenic dynamics of yeast cultures [19,43] as mixed cultures [16,18].
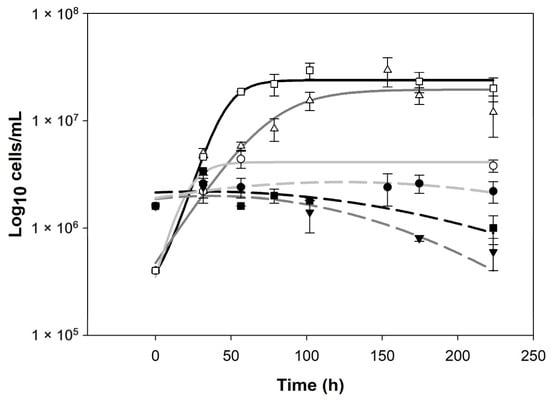
Figure 2.
Data for both yeast populations W. anomalus (empty markers, solid lines) and Z. rouxii (filled markers, dashed lines) obtained for 3 different pH values. Circles, light gray lines, pH: 3.2; triangles, dark gray lines, pH: 3.7; squares, black lines, pH: 4.2. Lines were developed with sigmoidal and peak models.
In ecology, coexistence and exclusion are related to the ecological niche concept. This can be summarized as the environmental conditions that allow a species to satisfy survival requirements and the effect of the species on the environment or medium [44]. In our case, pH seems to define the niche dynamics, where in pH 3.2 we have a dynamic of coexistence, and in pH 3.7 and 4.2, a dynamic of exclusion.
3.2. Model of Amensalism Improved, Best Fit: 0.68
The study was designed to dive into the ecology of the interaction in the function of the pH with a model approach. The amensalism model was developed initially by Ramon-Portugal et al. [31], improved in the lag phase by Pommier et al. [32]), and lately improved in the spoilage population decay reaching a stability phase in Kuchen et al. [16]. The model by Kuchen et al. [16] was simultaneously fitted to the three kinetics at three constant pH values (3.2, 3.7, and 4.2) using AMIGO2. The best fit was 0.681, the errors were normally distributed, and the adjusted R2 was 0.76. Nonlinear function simulation was performed using the CVODES method [35], parameter estimation was optimized with the nonlinear problem solver “eSS”, and the error calculation was based on least squares.
Each yeast has its specific growth rates in the function of the medium physicochemical conditions. On the other hand, every interaction which occurs in a medium with a limiting substrate (sugar and oxygen among others) develops a competition for these resources [45]. Usually, competitions in models are segregated into intraspecific competition and interspecific competition plus individual fitness [16,24].
This model has growth equations (Equations (7) and (8)) with parameters as “” and “” and a variable “” related to the individual fitness of each yeast. Also, these have parameters like ””, “”, and the variable “”. Nevertheless, “” (Equation (9)) is a general inhibitor produced by both the yeasts, with a parameter “” and the variables “” and “”. “” works as both intra- and interspecific inhibitor variables. This interspecific inhibition could be related to competence by limiting substrate or space [46]. Also, the model has death equations (Equations (10) and (11)), different between them, to explain interspecific inhibition by amensalism. The killer population death equation involves only natural death, with a parameter “” and a variable “”, while the sensitive population, instead, links natural death “” and “” with the amensalism influence through a pure interspecific part, with a parameter “W” and the variables “” and “”. The variable “” explain the toxin concentration (Equations (5), (12), and (13)) with the parameters “” and “” and the variables “” and “”. Summarizing the interspecific inhibition could be segregated into two parts, competence explained by the variable “” and amensalism by the variable “”. Taking into account the biological aspects of the killer system, we must highlight that the model has parameters for toxin production, toxin adherence or consumption, and toxicity or spoilage sensitivity to toxin; nevertheless, there is no parameter for toxin stability. The model assumes the toxin is emitted and adhered to sensitive cell wall instantaneously [31,32].
3.3. Akaike Criterion: The Model with Five Quadratic Submodel Equations and One Linear Is the Reduced Model with Substantial Contribution
Through an iterative procedure of model construction and selection and using the Akaike criterion, which weighs models based on their fitting ability and penalizes overparameterization, a reduced model was selected.
The minimum value of AIC (AICmin) was used to rescale the Akaike Information Criterion (Table 2). The rescaled value ΔM = AICM − AICmin was used to assess the relative merit of the models: the models with ΔM ≤ 2 have substantial support, the models for which 4 ≤ ΔM ≤ 7 have considerably less support, and the models with ΔM > 10 have no support [34]. The chosen model is the one by Kuchen et al. [16] plus five parameters with quadratic submodels related to the maximum specific growth rate of the killer population “”, proportional to the growth decrease by the common killer inhibitor “”, proportional to the growth decrease by the common sensitive inhibitor “”, proportional to the production of the common inhibitor “”, and the toxicity of the toxin or sensitivity to it by the sensitive “”, while the maximum specific growth rate of the spoilage population “” is lineal with minimal variation during pH change. This behavior could explain higher stability in Z. rouxii fitness through pH change. Even if this species has been cited with acidophilic character, growing below pH 2.3 [47], sharing a pH range with extreme acidophile organisms [48] also is cited with optimal growth rates in pHs near 3.5 [49].
Table 2.
Akaike criterion for the selection of the reduced model.
3.4. Kinetics and Parameters: The Growth Rates, Intraspecific Saturations, Toxin Production, and Toxin Toxicity Were Influenced by the pH
Kinetics for different pH values: 3.2, 3.7, and 4.2 from the reduced model (fit: 0.681) (Figure 3).
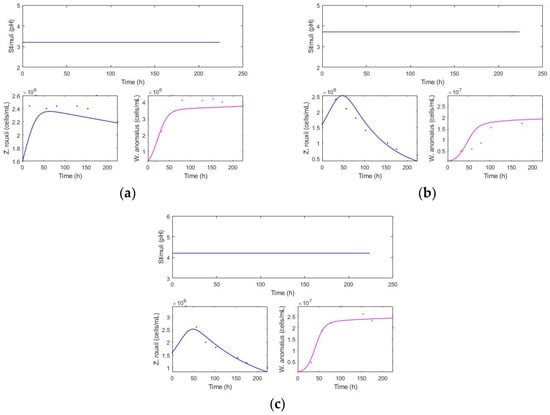
Figure 3.
Constant pH and population levels over time. (a) pH: 3.2, (b) 3.7, and (c) 4.2.
At pH 3.2, a low total population of killer yeast and a high population of spoilage yeast were observed, with the spoilage population remaining consistently high throughout the time without any decline (Figure 3). At pH 4.2, there is a higher cellular fitness of the killer yeast, with a higher total population “”, and is an intermediate decline in the spoilage yeast. pH 3.7 exhibits a high total population of “”, similar to the condition at pH 4.2. Moreover, the greatest decrease in spoilage population was obtained.
To assess the influence of the interaction, some parameters were normalized to different pH levels, with the value obtained at pH 3.2 (Table 3). These parameters were determined based on the kinetics observed in Figure 3, where the amensalism interaction would be lower (pH 3.2). Normalized parameters: natural death “” and “”, the production of the common inhibitor “”, and toxin adhesion or consumption “” (3 × 10⁻⁹ mL/cell × h). Evaluating the results obtained in the parametric variation (submodels), we found the pH affected; fitness parameters, like “” and “”; intraespecific parameters “” and “”; and interspecific parameters “” and “” (amensalism).
Table 3.
Parameters and submodels adjusted.
The highest “” occurs at pH 3.2, while the highest “” is observed at pH 4.2 and the lowest “” at 3.7 (Table 3). Cellular fitness and consequently, nutrient competition are affected by pH [45]. Also, this may be related to the maintenance costs or optimal growth of each organism [2]. The parameters “” and “” measure both intraspecific inhibition and interspecific inhibition related to competition and the sensitivity to a common inhibitor for both the yeasts [2,32] and were higher at pH 3.2. It can be observed that these parameters are of a higher order in the condition where there is no toxin interaction, which explains the dominance of this factor related to the logistic model and competition for a limiting substrate [50]. The production of toxin “” and the sensitivity to the toxin “” are the lowest at pH 3.2, medium at pH 4.2, and maximum at pH 3.7. The pH affects the efficiency of the toxin [20], and they are effective in a limited range of environmental conditions [51,52]. Efficiency may depend on its production “” [32,51], stability [20,53], adherence “” [54], and toxicity or sensitivity of the affected cell “” [15,54,55]. Some W. anomalus strains have been cited with optimum toxin production at pH between 4.2 and 4.4 [20,56]. It should be noted that for W. anomalus, several killer toxins are associated [56,57], and therefore, the estimated parameters could represent the behavior of multiple toxins simultaneously. Linked to this, at pH 3.7 where higher toxin efficiency is observed, simultaneously lower specific growth rate of the killer population is observed. This could be due to the metabolic energy cost of toxin production, leading to a decrease in cellular fitness [58].
3.5. Correlation and Sensitivity Analysis: The Parametric Analyzes Were Consistent with the Model’s Behavior
Correlation and sensitivity were calculated using AMIGO2 (Figure 4a). The parameters showing correlation are involved in the equations of parametric variation in the different submodels. Thus, mvk1, mvk2, and mvk3 are the constituents of a single parameter, “”.
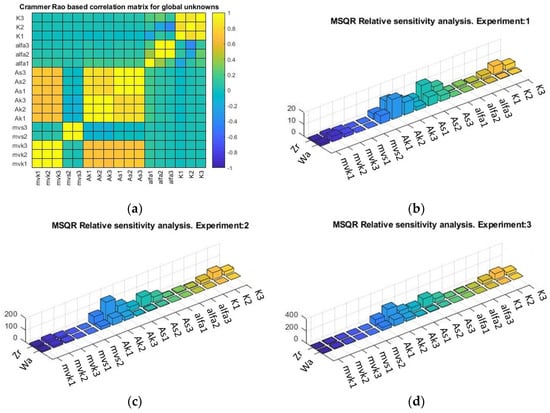
Figure 4.
(a) Crammer/Rao matrix correlation from global analysis. Relative parametric sensitivity by experiment: (b) pH: 3.2, (c) pH: 3.7, and (d) pH: 4.2. Zr: Zygosaccharomyces rouxii, Wa: Wickerhamomyces anomalus.
Local sensitivity shows the influence of the parameter on the modeled kinetics of each experiment (Figure 4b–d). The highest sensitivities were observed in the parameters linked to “” and “”, which are related to the deceleration of the logistic curve and are associated with the common inhibitor. There is also higher sensitivity in the parameters related to “”, the toxicity of the toxin concentration, or the sensitivity of the spoilage yeast to the killer toxin.
In the sensitivity analysis, it is observed that first the intraspecific and then the interspecific parameters are critical in the dynamics of the system, influencing the theoretical predictions of the model used [59]. This could be linked to hypotheses where it is suggested that niche differences cause species to limit themselves more in intraspecific competition than they limit competitors in interspecific competition [60].
3.6. Optimization at Constant and Variable pH: The Variable Profile Reduces 99% the Spoilage Population throughout the Process Compared to the Constant Profile
In line with the main objective of this work, which is to control the spoilage yeast, the new reduced model with its submodels was used to find the variable profile that minimizes the spoilage population present in the experiment over the entire reaction time. Firstly, a static optimization was performed to find an optimal pH value to achieve the objective. Then, a dynamic optimization strategy was developed to find the best variable pH profile.
3.6.1. Optimization at Constant pH
In this case, the static optimization problem involved finding the best pH value through the Monte Carlo method that minimizes the following objective function:
subject to the equality constraints provided by the mathematical model of the system [16], considering the initial conditions specified in Table 1 and the final time, 225 h, and subject to the inequality constraints:
After 1000 simulations in the pH range, the simulation results were compared in a sorted matrix, and the pH that minimizes the total concentration of spoilage yeast was selected.
Objective function J1: 2.05 × 10¹⁰ cells/mL × process and the best manipulated variable pH: 3.99.
3.6.2. Optimization at Variable pH
Using the orthonormal polynomials technique developed by the research group [27], dynamic optimization was performed to find the best time-dependent pH variation profile that minimizes the objective function:
subject to the same constraints of the mathematical model [16], the same specified initial conditions (Table 1), and tf: 225 h, along with the same inequality constraints as static optimization.
Objective function J1: 1.31 × 10³ cells/mL × process, and manipulated variable profile: pH.
The results of the optimization with a constant profile are shown in Figure 5, while those of the optimization with a variable profile are shown in Figure 6. The variable optimization was more efficient in eliminating the spoilage population in a reduced time period. Moreover, the reduction in population, comparing the variable with constant optimization throughout the entire process time, was 2.05 × 10¹⁰ cells/mL × process, 99% less spoilage yeast population over the process. Furthermore, the final population was reduced from 4.43 × 10⁷ cells/mL in the constant profile optimization versus 1.54 × 10³ cells/mL in the variable profile optimization, also 99% less spoilage population at the end of the process. This difference suggests that selecting the best constant pH may not be the optimal option and implies that a variable pH control strategy could be more attractive for pre-fermentation, as it enhances biocontrol while also reducing the time required for the process [29], enabling earlier inoculation with Saccharomyces cerevisiae (fermenting population) and reducing the risks of proliferation of unwanted yeasts species [61].
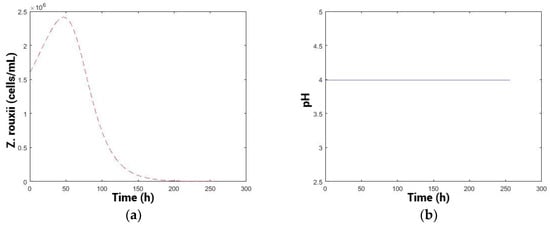
Figure 5.
(a) Kinetic simulation of spoilage population. (b) pH profile.
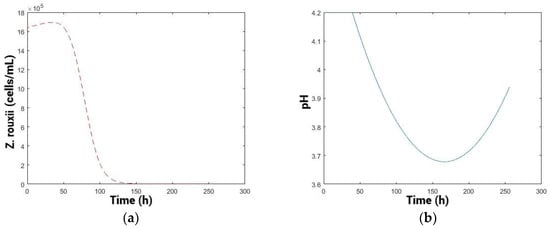
Figure 6.
(a) Kinetic simulation of spoilage population. (b) pH optimal profile.
The variable profile (Figure 6b) starts at a high pH (4.2) and is maintained for a period of 48 h, which would be relevant in musts from the region with high pH (pH > 3.8) [21,62]. Biologically, this may be related to the prediction of the model to improve the fitness of the biocontroller yeasts initially, which would consequently prevail in the medium [45], also in terms of toxin production as a primary metabolite. Then, the pH begins to decrease gradually, probably to a pH where the multiplication of the biocontroller population is lower but the efficiency of the toxin increases in terms of the toxicity or sensitivity of the spoilage yeasts, thus controlling the spoilage population more effectively [20,56]. Subsequently, the pH profile should increase again, possibly to maintain the competitive advantage of the biocontroller. This could be related to the low concentration of sensitive cells present in the medium and the difficulty of controlling those, caused by spatial distancing [16].
No studies were found on biocontrol implementing pH control strategies with a variable pH profile. On the other hand, other studies on dynamic optimization in liquid fermentation with stepped temperature profiles were found to enable better process yields [63,64]. However, stepped profiles are difficult to implement in real conditions because instantaneous increases and decreases are physically impossible to achieve in reality. In contrast, smooth and continuous profiles are more suitable for reproduction in a real system. Additionally, abrupt changes in physicochemical parameters (such as temperature or pH, among others) can negatively affect microbial systems, causing cellular stress [27,29].
Although the study focuses on a particular strain combination, the findings may well be relevant to other cases, and especially the methodology may be applicable to other cases. The dynamic optimization of variable profiles can be applied to other winemaking cases where mixed cultures and microbial interactions occur. One case could be biocontrol with other mechanisms, such as competition between Metschnikowia pulcherrima and Z. rouxii [18], as well as in the sequential mixed inoculation of non-Saccharomyces yeasts with S. cerevisiae for different purposes, such as improving organoleptic profile [24] and reducing ethanol concentration [65], among others, where static optimization was performed.
Finally, using a variable profile involves only modifying the controller, while the control action actuators (higher equipment cost) remain constant. This means that the process can be significantly more efficient simply by changing the controller and utilizing optimization with a variable profile. On the other hand, managing the biocontrol process through the use of the manipulable variable pH instead of temperature, for example, could result in lower energy use, influencing production costs.
4. Conclusions
The main objective of this study was to explore the role of pH in the dynamics of pre-fermentative biocontrol through an ecological modeling approach. The variation in parameters with pH was incorporated, and it accurately predicted the population levels of biocontroller/spoilage yeast antagonism under different conditions of must/wine. The model explained parameters that are not quantifiable online. The model analysis revealed that Wickerhamomyces anomalus decreases the population levels of Zygosaccharomyces rouxii to low values at pH levels above 3.7 in co-inoculation. It is inferred from the results that pH influences nutrient consumption patterns, tolerance to different environmental stressors, varying intra- and interspecific competition, and modifying the niche over time by changing pH.
One of the main implications of this research is that sequential inoculation is the most promising alternative for new fermentations aimed at reducing the use of SO2. Further research is needed to formulate suitable mechanistic models for optimal design based on the models of new mixed pre-fermentations. On the other hand, this allowed us to establish the mathematical foundations for implementing the dynamic pH optimization strategy.
The variable pH profile optimized was smooth, continuous, and differentiable, which is highly suitable for bioprocesses. It reduced the total spoilage population and the time it takes to do so. Moreover, its practical implementation is feasible because it avoids abrupt changes in pH during the bioprocess. Also, at a technological level, it is highly relevant since it only involves changing the controller profile without additional costs.
Author Contributions
Conceptualization, G.S. and F.V.; methodology, G.S.; software, B.K., M.C.G. and M.N.P.; formal analysis, G.S. and B.K.; investigation, B.K., M.N.P. and M.C.G.; resources, G.S.; data curation, L.P.P.; writing—original draft preparation, B.K.; writing—review and editing, B.K.; visualization, L.P.P.; supervision, G.S. and F.V.; project administration, B.K. and G.S.; funding acquisition, B.K. and G.S. All authors have read and agreed to the published version of the manuscript.
Funding
This work was supported by grants from Agencia Nacional de Promoción de la Investigación, el Desarrollo Tecnológico y la Innovación, Ministerio de Ciencia, Tecnología e Innovación, Argentina, (PICT-2021-I-INVI-00284).
Data Availability Statement
The raw data supporting the conclusions of this article will be made available by the authors without undue reservation.
Acknowledgments
We thank ENAV S.A. CUIT: 30-69313567-9. San Juan, for kindly giving concentrated grape must and data related.
Conflicts of Interest
The authors declare that the research was conducted in the absence of any commercial or financial relationships that could be construed as a potential conflict of interest.
References
- Tafel, M.; Szolnoki, G. Estimating the economic impact of tourism in German wine regions. Int. J. Tour. Res. 2020, 22, 788–799. [Google Scholar] [CrossRef]
- Ciani, M.; Capece, A.; Comitini, F.; Canonico, L.; Siesto, G.; Romano, P. Yeast interactions in inoculated wine fermentation. Front. Microbiol. 2016, 7, 555. [Google Scholar] [CrossRef] [PubMed]
- Csoma, H.; Kállai, Z.; Antunovics, Z.; Czentye, K.; Sipiczki, M. Vinification without Saccharomyces: Interacting osmotolerant and “spoilage” yeast communities in fermenting and ageing botrytised high-sugar wines (tokaj essence). Microorganisms 2021, 9, 19. [Google Scholar] [CrossRef] [PubMed]
- Rojo, M.C.; Arroyo López, F.N.; Lerena, M.C.; Mercado, L.; Torres, A.; Combina, M. Evaluation of different chemical preservatives to control Zygosaccharomyces rouxii growth in high sugar culture media. Food Control 2015, 50, 349–355. [Google Scholar] [CrossRef]
- Cejudo-Bastante, M.J.; Sonni, F.; Chinnici, F.; Versari, A.; Perez-coello, M.S.; Riponi, C. Fermentation of sulphite-free white musts with added lysozyme and oenological tannins: Nitrogen consumption and biogenic amines composition of final wines. LWT-Food Sci. Technol. 2010, 43, 1501–1507. [Google Scholar] [CrossRef]
- Comitini, F.; Ciani, M. The zymocidial activity of Tetrapisispora phaffii in the control of Hanseniaspora uvarum during the early stages of winemaking. Lett. Appl. Microbiol. 2010, 50, 50–56. [Google Scholar] [CrossRef] [PubMed]
- Ferrer-Gallego, R.; Puxeu, M.; Martín, L.; Nart, E.; Hidalgo, C.; Andorrà, I. Microbiological, Physical, and Chemical Procedures to Elaborate High-Quality SO2-Free Wines. In Grapes and Wines-Advances in Production, Processing, Analysis and Valorization; IntechOpen: London, UK, 2018. [Google Scholar] [CrossRef]
- Lerena, M.C.; Rojo, M.C.; Sari, S.; Mercado, L.A.; Krieger-Weber, S.; Combina, M. Malolactic fermentation induced by Lactobacillus plantarum in Malbec wines from Argentina. S. Afr. J. Enol. Vitic. 2016, 37, 115–123. [Google Scholar] [CrossRef]
- Ribéreau-Gayon, P.; Dubourdieu, D.; Donèche, B.; Lonvaud, A. (Eds.) Handbook of Enology, Volume 2: The Microbiology of Wine and Vinifications; John Wiley & Sons Ltd.: Chichester, UK, 2006; Volume 2. [Google Scholar] [CrossRef]
- Baker, K.F.; Cook, R.J. Biological Control of Plant Pathogens; W.H. Freeman and Company: San Francisco, CA, USA, 1974. [Google Scholar]
- Canonico, L.; Agarbati, A.; Galli, E.; Comitini, F.; Ciani, M. Metschnikowia pulcherrima as biocontrol agent and wine aroma enhancer in combination with a native Saccharomyces cerevisiae. LWT 2023, 181, 114758. [Google Scholar] [CrossRef]
- Oro, L.; Ciani, M.; Comitini, F. Antimicrobial activity of Metschnikowia pulcherrima on wine yeasts. J. Appl. Microbiol. 2014, 116, 1209–1217. [Google Scholar] [CrossRef]
- Berbegal, C.; Garofalo, C.; Russo, P.; Pati, S.; Capozzi, V.; Spano, G. Use of autochthonous yeasts and bacteria in order to control Brettanomyces bruxellensis in wine. Fermentation 2017, 3, 65. [Google Scholar] [CrossRef]
- Simonin, S.; Roullier-Gall, C.; Ballester, J.; Schmitt-Kopplin, P.; Quintanilla-Casas, B.; Vichi, S.; Peyron, D.; Alexandre, H.; Tourdot-Maréchal, R. Bio-Protection as an Alternative to Sulphites: Impact on Chemical and Microbial Characteristics of Red Wines. Front. Microbiol. 2020, 11, 1308. [Google Scholar] [CrossRef] [PubMed]
- Boynton, P.J. The ecology of killer yeasts: Interference competition in natural habitats. Yeast 2019, 36, 473–485. [Google Scholar] [CrossRef] [PubMed]
- Kuchen, B.; Maturano, Y.P.; Gil, R.M.; Vazquez, F.; Scaglia, G.J.E. Kinetics and mathematical model of killer/sensitive interaction under different physicochemical conditions of must/wine: A study from a biological point of view. Lett. Appl. Microbiol. 2022, 74, 718–728. [Google Scholar] [CrossRef] [PubMed]
- Kuchen, B.; Maturano, Y.P.; Mestre, M.V.; Combina, M.; Toro, M.E.; Vazquez, F. Selection of native non-Saccharomyces yeasts with biocontrol activity against spoilage yeasts in order to produce healthy regional wines. Fermentation 2019, 5, 60. [Google Scholar] [CrossRef]
- Kuchen, B.; Vazquez, F.; Maturano, Y.P.; Scaglia, G.J.E.; Pera, L.; Vallejo, M.D. Toward application of biocontrol to inhibit wine spoilage yeasts: The use of statistical designs for screening and optimisation. Oeno One 2021, 55, 75–96. [Google Scholar] [CrossRef]
- Serra, A.; Strehaiano, P.; Taillandier, P. Influence of temperature and pH on Saccharomyces bayanus var. uvarum growth; impact of a wine yeast interspecific hybridization on these parameters. Int. J. Food Microbiol. 2005, 104, 257–265. [Google Scholar] [CrossRef] [PubMed]
- Comitini, F.; Ingeniis De, J.; Pepe, L.; Mannazzu, I.; Ciani, M. Pichia anomala and Kluyveromyces wickerhamii killer toxins as new tools against Dekkera/Brettanomyces spoilage yeasts. FEMS Microbiol. Lett. 2004, 238, 235–240. [Google Scholar] [CrossRef] [PubMed]
- Fanzone, M.L.; Sari, S.E.; Mestre, M.V.; Catania, A.A.; Catelén, M.J.; Jofré, V.P.; Maturano, Y.P. Combination of pre-fermentative and fermentative strategies to produce Malbec wines of lower alcohol and pH, with high chemical and sensory quality. OENO One 2020, 54, 1041–1058. [Google Scholar] [CrossRef]
- Comuzzo, P.; Battistutta, F. Acidification and pH control in red wines. In Red Wine Technology; Academic Press: Cambridge, MA, USA, 2019; Chapter 2; pp. 17–34. [Google Scholar]
- Hellweger, F.L.; Clegg, R.J.; Clark, J.R.; Plugge, C.M.; Kreft, J.U. Advancing microbial sciences by individual-based modelling. Nat. Rev. Microbiol. 2016, 14, 461–471. [Google Scholar] [CrossRef]
- Balsa-Canto, E.; Alonso-del-Real, J.; Querol, A. Temperature Shapes Ecological Dynamics in Mixed Culture Fermentations Driven by Two Species of the Saccharomyces Genus. Front. Bioeng. Biotechnol. 2020, 8, 915. [Google Scholar] [CrossRef] [PubMed]
- Narayanan, H.; Luna, M.F.; von Stosch, M.; Cruz Bournazou, M.N.; Polotti, G.; Morbidelli, M.; Butté, A.; Sokolov, M. Bioprocessing in the Digital Age: The Role of Process Models. Biotechnol. J. 2020, 15, e1900172. [Google Scholar] [CrossRef] [PubMed]
- Noll, P.; Lilge, L.; Hausmann, R.; Henkel, M. Modeling and Exploiting Microbial Temperature Response. Processes 2020, 8, 121. [Google Scholar] [CrossRef]
- Pantano, M.N.; Fernández, M.C.; Ortiz, O.A.; Scaglia, G.J.E.; Vega, J.R. A Fourier-based control vector parameterization for the optimization of nonlinear dynamic processes with a finite terminal time. Comput. Chem. Eng. 2020, 134, 106721. [Google Scholar] [CrossRef]
- Pantano, M.N.; Fernández, M.C.; Amicarelli, A.; Scaglia, G.J.E. Evolutionary Algorithms and Orthogonal Basis for Dynamic Optimization in L2 Space for Batch Biodiesel Production. Chem. Eng. Res. Des. 2022, 177, 354–364. [Google Scholar] [CrossRef]
- Groff, M.C.; Noriega, S.E.; Gil, R.M.; Pantano, N.; Scaglia, G. Dynamic Optimization of Lactic Acid Production from Grape Stalk Solid-State Fermentation with Rhizopus oryzae Applying a Variable Temperature Profile. Fermentation 2024, 10, 101. [Google Scholar] [CrossRef]
- Maturano, Y.P.; Mestre, M.V.; Combina, M.; Toro, M.E.; Vazquez, F.; Esteve-Zarzoso, B. Culture-dependent and independent techniques to monitor yeast species during cold soak carried out at different temperatures in winemaking. Int. J. Food Microbiol. 2016, 237, 142–149. [Google Scholar] [CrossRef] [PubMed]
- Ramon-Portugal, F.; Délia-Dupuy, M.L.; Pingaud, H.; Carrillo-leroux, G.A.; Riba, J.P. Kinetic study and mathematical modelling of killer and sensitive S. cerevisiae strains growing in mixed culture. Bioprocess Eng. 1997, 17, 375–381. [Google Scholar] [CrossRef]
- Pommier, S.; Strehaiano, P.; Délia, M.L. Modelling the growth dynamics of interacting mixed cultures: A case of amensalism. Int. J. Food Microbiol. 2005, 100, 131–139. [Google Scholar] [CrossRef] [PubMed]
- Hua, M.X.; Chi, Z.; Liu, G.L.; Aslam Buzdar, M.; Chi, Z.-M. Production of a novel and cold-active killer toxin by Mrakia frigida 2E00797 isolated from sea sediment in Antarctica. Extremophiles 2010, 14, 515–521. [Google Scholar] [CrossRef]
- Burnham, K.P.; Anderson, D.R. Multimodel Inference: Understanding AIC and BIC in Model Selection. Soc. Methods Res. 2004, 33, 261–304. [Google Scholar] [CrossRef]
- Hindmarsh, A.C.; Brown, P.N.; Grant, K.E.; Lee, S.L.; Serban, R.; Shumaker, D.E.; Woodward, C.S. SUNDIALS: Suite of nonlinear and differential/algebraic equation solvers. ACM Trans. Math. Softw. (TOMS) 2005, 31, 363–396. [Google Scholar] [CrossRef]
- Egea, J.A.; Vazquez, E.; Banga, J.R.; Martí, R. Improved scatter search for the global optimization of computationally expensive dynamic models. J. Glob. Optim. 2009, 43, 175–190. [Google Scholar] [CrossRef]
- Solonen, A. Monte Carlo Methods in Parameter Estimation of Nonlinear Models. Master’s Thesis, Lappeenranta University of Technology, Lappeenranta, Finland, 2006. [Google Scholar]
- Kroese, D.P.; Brereton, T.; Taimre, T.; Botev, Z.I. Why the Monte Carlo method is so important today. Wiley Interdiscip. Rev. Comput. Stat. 2014, 6, 386–392. [Google Scholar] [CrossRef]
- Chaves de Resende, L.; Facion do Nascimento, R.; De Sousa Sales, W.; Aparecido de Assis, F.; Carlos do Nascimento, L. Well-Being Analysis Applied to the Study of Composite Systems Flexibility Considering Wind Energy Sources. IEEE Lat. Am. Trans. 2021, 19, 1640–1647. [Google Scholar] [CrossRef]
- Tempo, R.; Ishii, H. Monte Carlo and Las Vegas Randomized Algorithms for Systems and Control. Eur. J. Control 2007, 13, 189–203. [Google Scholar] [CrossRef]
- Nearing, J.C. Mathematical Tools for Physics; Dover Publications: New York, NY, USA, 2003. [Google Scholar]
- Kreyszig, E. Introductory Functional Analysis with Applications; John Wiley & Sons: Hoboken, NJ, USA, 1978. [Google Scholar]
- Arroyo-López, F.N.; Orlić, S.; Querol, A.; Barrio, E. Effects of temperature, pH and sugar concentration on the growth parameters of Saccharomyces cerevisiae, S. kudriavzevii and their interspecific hybrid. Int. J. Food Microbiol. 2009, 131, 120–127. [Google Scholar] [CrossRef] [PubMed]
- Chase, J.; Leibold, M. Ecological Niches: Linking Classical and Contemporary Approaches, 2nd ed.; University of Chicago Press: Chicago, IL, USA, 2003. [Google Scholar] [CrossRef]
- Pirt, S.J. Parameters of growth and analysis of growth data. In Principles of Microbe and Cell Cultivation; Blackwell Scientific Publications: Hoboken, NJ, USA, 1975; pp. 4–14. [Google Scholar]
- Oztekin, S.; Dikmetas, D.N.; Devecioglu, D.; Acar, E.G.; Karbancioglu-Guler, F. Recent insights into the use of antagonistic yeasts for sustainable biomanagement of postharvest pathogenic and mycotoxigenic fungi in fruits with their prevention strategies against mycotoxins. J. Agric. Food Chem. 2023, 71, 9923–9950. [Google Scholar] [CrossRef] [PubMed]
- Martorell, P.; Stratford, M.; Steels, H.; Fernández-Espinar, M.T.; Querol, A. Physiological characterization of spoilage strains of Zygosaccharomyces bailii and Zygosaccharomyces rouxii isolated from high sugar environments. Int. J. Food Microbiol. 2007, 114, 234–242. [Google Scholar] [CrossRef] [PubMed]
- Johnson, D.B. Biodiversity and ecology of acidophilic microorganisms. FEMS Microbiol. Ecol. 1998, 27, 307–317. [Google Scholar] [CrossRef]
- Wang, H.; Hu, Z.; Long, F.; Guo, C.; Niu, C.; Yuan, Y.; Yue, T. Combined effect of sugar content and pH on the growth of a wild strain of Zygosaccharomyces rouxii and time for spoilage in concentrated apple juice. Food Control 2016, 59, 298–305. [Google Scholar] [CrossRef]
- Dantigny, P.; Bevilacqua, A. Fungal starters: An insight into the factors affecting the germination of conidia. In Starter Cultures in Food Production; Speranza, B., Bevilacqua, A., Corbo, R.M., Sinigaglia, M., Eds.; John Wiley and Sons: West Sussex, UK, 2017; pp. 50–63. [Google Scholar] [CrossRef]
- McBride, R.; Greig, D.; Travisano, M. Fungal viral mutualism moderated by ploidy. Evolution 2008, 62, 2372–2380. [Google Scholar] [CrossRef] [PubMed]
- Deschaine, B.M.; Heysel, A.R.; Lenhart, B.A.; Murphy, H.A. Biofilm formation and toxin production provide a fitness advantage in mixed colonies of environmental yeast isolates. Ecol. Evol. 2018, 8, 5541–5550. [Google Scholar] [CrossRef] [PubMed]
- Sinclair, R.M. Citation: Sinclair RM (2014) Persistence in the Shadow of Killers. Front. Microbiol. 2014, 5, 342. [Google Scholar] [CrossRef] [PubMed]
- Fernández de Ullivarri, M.; Mendoza, L.M.; Raya, R.R. Characterization of the killer toxin KTCf20 from Wickerhamomyces anomalus, a potential biocontrol agent against wine spoilage yeasts. Biol. Control 2018, 121, 223–228. [Google Scholar] [CrossRef]
- Károlyi, G.; Neufeld, Z.; Scheuring, I. Rock-scissors-paper game in a chaotic flow: The effect of dispersion on the cyclic competition of microorganisms. J. Theor. Biol. 2005, 236, 12–20. [Google Scholar] [CrossRef] [PubMed]
- Liu, G.L.; Chi, Z.; Wang, G.Y.; Wang, Z.P.; Li, Y.; Chi, Z.M. Yeast killer toxins, molecular mechanisms of their action and their applications. Crit. Rev. Biotechnol. 2013, 35, 222–234. [Google Scholar] [CrossRef] [PubMed]
- Magliani, W.; Conti, S.; Gerloni, M.; Bertolotti, D.; Polonelli, L. Yeast killer systems. Clin. Microbiol. Rev. 1997, 10, 369–400. [Google Scholar] [CrossRef] [PubMed]
- Pieczynska, M.D.; Wloch-Salamon, D.; Korona, R.; de Visser, J.A.G.M. Rapid multiple-level coevolution in experimental populations of yeast killer and nonkiller strains. Evolution. Int. J. Org. Evol. 2016, 70, 1342–1353. [Google Scholar] [CrossRef]
- Zi, Z. Sensitivity analysis approaches applied to systems biology models. IET Syst. Biol. 2011, 5, 336–346. [Google Scholar] [CrossRef]
- Levine, J.; HilleRisLambers, J. The importance of niches for the maintenance of species diversity. Nature 2009, 461, 254–257. [Google Scholar] [CrossRef]
- Bianchi, A.; Taglieri, I.; Venturi, F.; Sanmartin, C.; Ferroni, G.; Macaluso, M.; Palla, F.; Flamini, G.; Zinnai, A. Technological Improvements on FML in the Chianti Classico Wine Production: Co-Inoculation or Sequential Inoculation? Foods 2022, 11, 1011. [Google Scholar] [CrossRef] [PubMed]
- Morata, A.; Loira, I.; Manuel del Fresno, J.; Escott, C.; Antonia Bañuelos, M.; Tesfaye, W.; González, C.; Palomero, F.; Antonio Suárez Lepe, J. Strategies to Improve the Freshness in Wines from Warm Areas. In Advances in Grape and Wine Biotechnology; IntechOpen: London, UK, 2019. [Google Scholar] [CrossRef]
- Feng, J.; Feng, N.; Zhang, J.S.; Yang, Y.; Jia, W.; Lin, C.C. A New Temperature Control Shifting Strategy for Enhanced Triterpene Production by Ganoderma Lucidum G0119 Based on Submerged Liquid Fermentation. Appl. Biochem. Biotechnol. 2016, 180, 740–752. [Google Scholar] [CrossRef] [PubMed]
- Cheng, K.K.; Zeng, J.; Jian, J.H.; Zhu, J.F.; Zhang, G.X.; Liu, D.H. Model-Based Temperature Control for Improving Lactic Acid Production from Glycerol. RSC Adv. 2019, 9, 11614–11620. [Google Scholar] [CrossRef] [PubMed]
- Maturano, Y.P.; Mestre, M.V.; Kuchen, B.; Toro, M.E.; Mercado, L.A.; Vazquez, F.; Combina, M. Optimization of fermentation-relevant factors: A strategy to reduce ethanol in red wine by sequential culture of native yeasts. Int. J. Food Microbiol. 2019, 289, 40–48. [Google Scholar] [CrossRef] [PubMed]


Disclaimer/Publisher’s Note: The statements, opinions and data contained in all publications are solely those of the individual author(s) and contributor(s) and not of MDPI and/or the editor(s). MDPI and/or the editor(s) disclaim responsibility for any injury to people or property resulting from any ideas, methods, instructions or products referred to in the content. |
© 2024 by the authors. Licensee MDPI, Basel, Switzerland. This article is an open access article distributed under the terms and conditions of the Creative Commons Attribution (CC BY) license (https://creativecommons.org/licenses/by/4.0/).