1. Introduction
The cheese manufacturing process produces a by-product, cheese whey (CW), which reached more than 190 million tons (Mt) worldwide in 2016 [
1] and, according to Rama et al. [
2], was estimated to reach 230 Mt per year in 2023. Due to its high nutritional value [
3], it should be further processed to produce other food products in order to comply with the hierarchy of waste management. However, many small dairies around the world lack the resources or investment capacity to transform CW into alternative processed foods, such as butter or cottage cheese, as well as food supplements or pharmaceutical products [
4]. Consequently, almost half of the CW produced is often used for animal feed, fertilizers, or improperly managed as waste, which can lead to negative environmental consequences [
5]. The high levels of chemical oxygen demand (COD) (0.6–102.1 kg m
−3), lactose (0.18–60 kg m
−3), fats (0.08–11.0 kg m
−3), proteins (1.4–100 kg m
−3), mineral salts (10–189 kg m
−3), and the large percentage of water (87.6–93.4%) [
6,
7,
8,
9] make CW a potential pollutant to soils, surface waters, or groundwater if not properly managed [
10]. This problem is commonly replicated throughout the world, with greater intensity in developing countries and places where small dairies are abundant [
11,
12].
CW also shows great energy generation potential because it has a high content of carbohydrates (mainly lactose) proteins, and lipids that can be biochemically converted into biogas through anaerobic digestion [
10]. In fact, due to its high organic load and its warm temperature, anaerobic processes are a preferred option for CW treatment over aerobic processes. Moreover, aerobic processes demand larger areas and higher energy than anaerobic digestion [
10]. Therefore, a potential pollution problem could be transformed into an opportunity for environmental protection through the generation of renewable energy and organic fertilizer. Biogas is mainly composed of methane and carbon dioxide; given its high calorific value (16–28 MJ m
−3), it can be used as a substitute for conventional energy sources such as fuel or natural gas. The anaerobic degradation of CW is associated with high biogas yields, with values ranging from 337 to 861 L of CH
4 per kg of volatile solids (VS) [
11,
13,
14,
15]. Compared to other substrates used in anaerobic digestion, CW is homogeneous and has a low viscosity despite its high solids content, which facilitates pumping and mixing. The anaerobic degradation process performs optimally at neutral pH values (6.8–7.4) such that any significant variation in this chemical parameter can inhibit methane producing activity, which would stop digestion and biogas production [
16]. This aspect is relevant when transforming CW, since it has an acid profile with pH values lower than 5 for acidic whey and between 6 and 7 for sweet whey [
8], as well as low alkalinity and low buffer capacity [
17], thus leading to the quick acidification of digesters [
14,
18]. Temperature also plays a fundamental role in the anaerobic digestion process due to the fact that the bacteria involved, and in particular the methanogenic ones, are sensitive to sudden thermal changes. Temperature also influences the metabolic activity of microorganisms, thus leading to higher degradation efficiencies at higher temperatures [
16].
The use of tubular reactors for managing CW is especially interesting for small dairies and cheese manufacturers due to their low investment needs and ease of use. This type of digester is common in developing countries, but it is scarce in Europe and North America, where high-tech biogas plants are normally constructed. Tubular reactors differ from highly technical reactors in the absence of agitation and temperature control, in addition to large differences in instrumentation and automation processes [
19]. Lower degradation efficiencies and biogas production are therefore expected in tubular reactors compared to high-tech (plug flow reactors—PFRs—or continuously stirred tank reactors—CSTRs). Escalante-Hernández et al. [
20] studied the anaerobic monodigestion of CW in laboratory scale tubular reactors at ambient temperatures (26 ± 2 °C). The monodigestion of CW led to the inhibition of the process due to the accumulation of volatile fatty acids (VFAs), although the biogas yield reached 535 L per kg of VS before complete inhibition. To avoid inhibition due to the acidification of the reactor, Escalante-Hernández et al. [
20] and Jaimes-Estévez et al. [
21] studied the codigestion of CW with cow manure, wherein they achieved success at organic loading rates (OLRs) lower than 3 kg of VS m
−3digester d
−1 and 1.5 kg of COD m
−3digester d
−1, respectively, thus obtaining biogas yields of 430–470 L kg
−1 (on a VS basis) and 330–440 L kg
−1 (on a COD basis), respectively. Thus, the scientific literature shows the high potential of the anaerobic digestion of CW in contributing to the energy self-sufficiency of small- and medium-sized farms and cheese factories. CW’s and dairy effluents’ anaerobic monodigestion has been proved as feasible at the lab- and pilot-scale using high-performance reactors such as Upflow Anaerobic Sludge Blanket (UASB) reactors, the Fluidized Bed Reactor (FBR), anaerobic filters, anaerobic sequencing batch reactors [
10,
22]. However, there is a scarcity of studies on its implementation at the pilot scale in tubular reactors, despite being applicable to low-income countries and small-scale dairies.
In this study, CW was digested in a pilot scale biogas plant composed of two tubular reactors (4 m3 working volume each), with one of them including an external heating system to maintain the working temperature at 30 ± 3 °C. The goal of this study was to assess the efficiency of degradation and biogas production among tubular, low-cost digesters operating at different temperature ranges to evaluate if temperature control is energetically efficient. In this way, the efficiency and the technical viability of CW monodigestion can be determined for subtropical climates in a low-cost, tubular digester.
2. Materials and Methods
2.1. Pilot Scale Biogas Plant
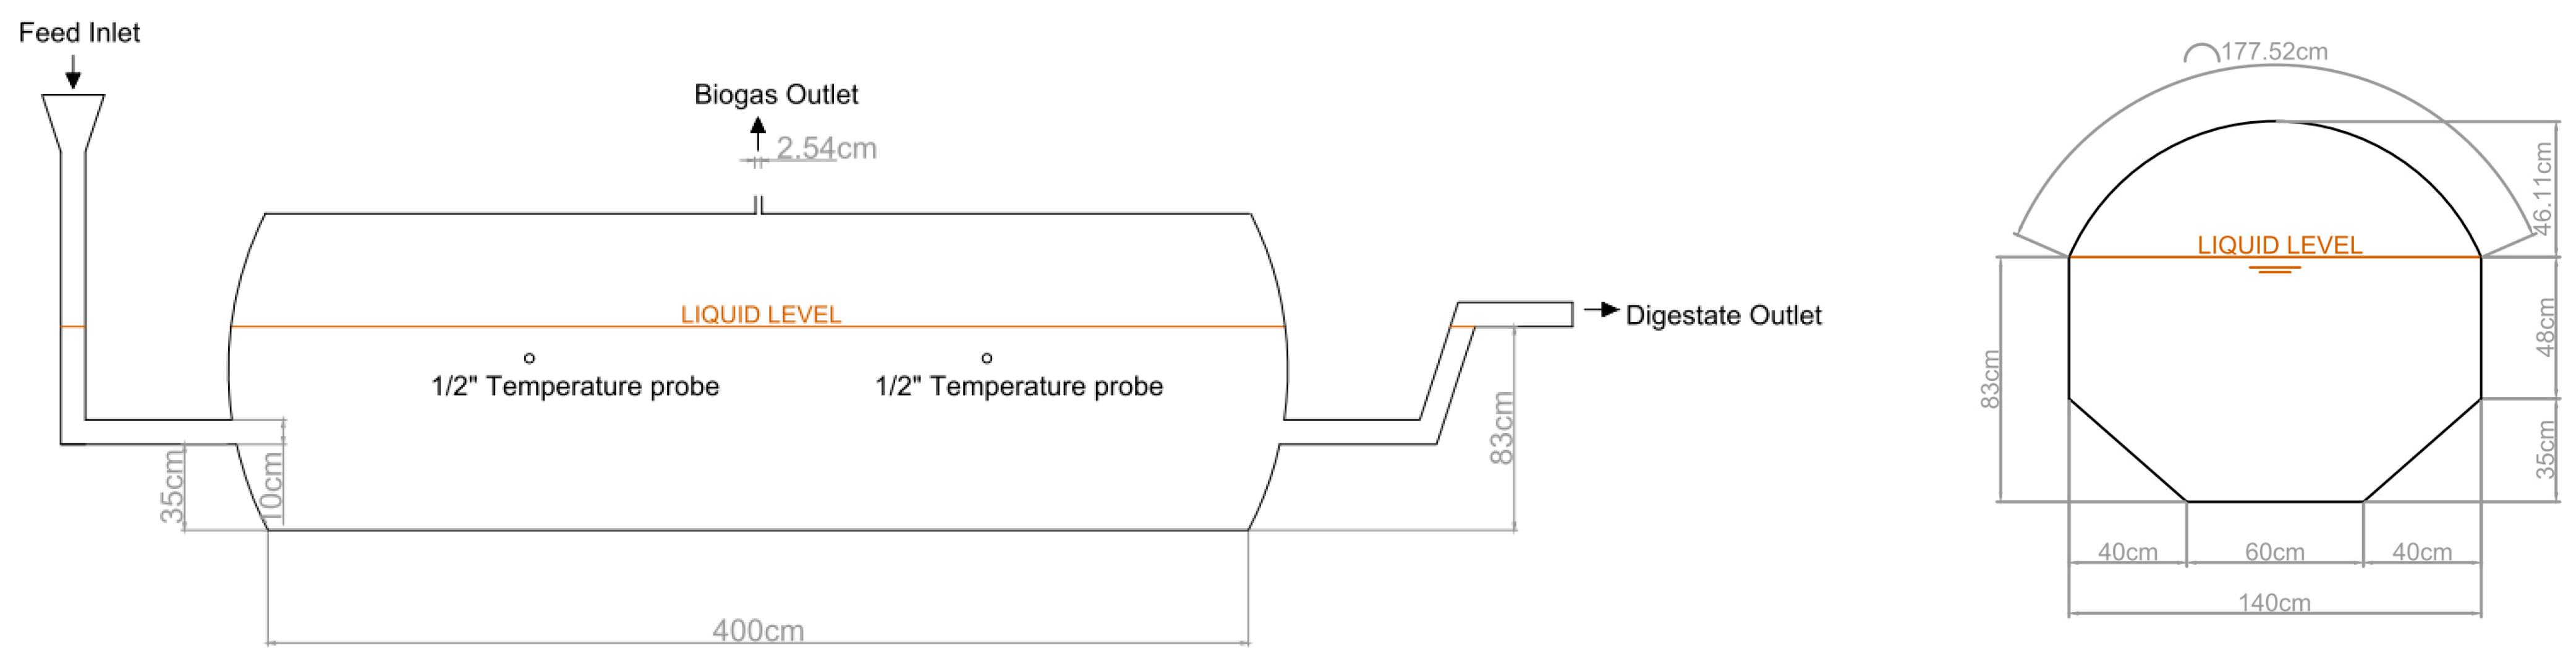
The pilot scale biogas plant is located in the Agricultural Engineering Section of the University of La Laguna, in San Cristóbal de La Laguna (Tenerife, Spain). UTM coordinates of the exact location of the pilot plant are X = 370,902.88 m, Y = 3,150,806.58 m, z = 552.44 m a.s.l. It is composed of two tubular reactors made of flexible polyester–polyvinyl chloride material. Each digester is 4 m in length and 1.4 m in diameter, which makes a total capacity of 6.15 m
3. Digesters are arranged in trapezoidal ditches, as shown in
Figure 1, with a working volume of 4 m
3. Both digesters have two ports for temperature probe insertions, a biogas outlet at the top of the digester (1″), and an inlet and outlet at both ends of the digester (4″). While digester 1 (D1) works at ambient conditions, i.e., without any temperature control, digester 2 (D2) includes an external heating system located underneath the digester. The external heating system consists of crosslinked polyethylene tubes through which hot water (>60 °C), previously produced in an electrical heater of 300 L, was pumped continuously in a closed circuit. A thermostat set at 30.0 ± 0.1 °C was used to control the recirculation pump: the system worked when temperature fell below 29.9 °C and stopped when temperature was equal or higher than 30.1 °C. Thermal insulation (rock wool of 5 cm thick) was arranged between the digester and the soil and protected by two layers of ethylene propylene diene monomer (EPDM) rubber of 1.2 mm thick: one in contact with the digester and the other one in contact with the soil.
The produced biogas was collected from the top of each digester with approximately 15 m polyethylene tubing (DN32). A sampling point was available in the tubing for each digester to measure the biogas composition (0–100% CH4, 0–100% CO2, 0–21% O2, 0–5000 ppm H2S; all measures expressed in vol/vol) with a Multitec® 545 biogas analyzer (Hermann Sewerin GmbH, Gütersloh, Germany) before reaching the corresponding diaphragm biogas counter, a model BK-G4 (Honeywell International Inc., Lotte, Germany). Afterwards, biogas was stored in a 3 m3 biogas bag and burned periodically in a cooking stove to avoid methane emissions to the atmosphere. Digestate from each digester freely flowed into a 1 m3 capacity tank, from which it was pumped into long-term storage until used for agricultural purposes.
2.2. Substrate and Inoculum
2.2.1. Cheese Whey
Except in exceptional cases properly indicated in
Section 3, CW was collected from ‘
Quesería de Benijos’, an industrial cheese factory located in La Orotava (Tenerife, Canary Islands, Spain) (UTM coordinates: X = 348,549.10 m, Y = 3,138,155.35 m, z = 922.08 m a.s.l.) and transported to the pilot scale biogas plant at University of La Laguna. This factory is owned by a cooperative, which collects milk from different farms around the island to produce fresh cheese from cow and/or goat milk. Cow CW is produced at a daily rate of 9.6 m
3 from Monday to Friday, and it is not used for any further conversion, thus leading to high costs of treatment. On the other hand, cottage cheese is made from goat CW once goat cheese has been produced. Therefore, only cow CW was used for this experiment.
Different CW samples were collected to feed the digesters during the experiment. Samples were transported and stored at ambient conditions in 1 m3 capacity tanks from which the daily feed was pumped to the digesters. All samples were analyzed to determine their physical and chemical properties after arriving at the University, including pH, Electrical Conductivity (EC), Total Solids (TS), VS, total Chemical Oxygen Demand (CODt), soluble Chemical Oxygen Demand (CODs), Partial Alkalinity (PA), Total Alkalinity (TA), and Intermediate Alkalinity (IA). When these samples remained stored during more than one week, analyses were repeated to study the effects of degradation within environmental conditions on CW.
2.2.2. Inoculum
The two tubular digesters from the pilot plant were initially filled with diluted cow manure. Cow manure was collected from a local cow farm in San Cristóbal de La Laguna, Tenerife (Canary Islands, Spain). Manure was pumped into the digesters after dilution and separation of long fibers using a metallic cage for the pump. Liquid manure used as inoculum was analyzed to determine its initial physical and chemical properties (
Table 1). After a six-week period during which pilot plant was not fed, inoculum was ready to start the experiment. At this point, the inoculum was analyzed to determine its physical and chemical properties (
Table 1), thus showing increases in pH, PA, and TA as well as decreases in IA, CODs, and CODt.
2.3. Experimental Procedure
The experiments described herein were performed between October 2020 and June 2021. During the study period, ambient temperature ranged between a minimum of 6.4 °C and a maximum of 33.4 °C, and the monthly average temperature was 15.4 ± 1.7 °C.
On the pilot scale, tubular digesters were first fed with diluted cow manure, which was used as inoculum. Afterwards, they were not fed for six weeks to stabilize the microbial population inside the digesters and create anaerobic conditions. Three operating conditions were then performed (
Table 2) starting at low OLR and high hydraulic retention time (HRT) for three weeks (operating condition 0, C0). After a forced temporary stop of three weeks due to a lack of substrate, the experiment started in a constant manner. The digesters were fed with 25 L per day (operating condition 1: C1). Afterwards, daily feeding was doubled up to 50 L (operating condition 2: C2). Finally, in the third operating condition (C3), daily feeding was increased up to 75 L d
−1. After that, the experiment was completely stopped due to constant substrate supply problems that made unfeasible the normal operation of the pilot plant. This procedure aimed at finding the maximum degradation capacity of the tubular reactors for each temperature regime, thus determining biogas production, quality, and stability of the process.
From Monday to Friday, CW was fed daily (calculations of HRT and OLR are therefore shown on a weekly basis) with a centrifugal pump, and biogas composition was also monitored consistently. Digestate was drained daily by gravity during digester feeding and stored in tanks until use in agriculture. Samples were taken once every two weeks directly from the draining pipe to explore changes inside the digester and organic matter degradation efficiency. Biogas flow was monitored daily during the first months of operation based on the reading of biogas counters. Afterwards, pulse generators, model IN-Z31/61 (Honeywell International Inc., Lotte, Germany), were installed on the biogas counters, and measurements were stored automatically with dataloggers. In this way, continuous biogas production data could be obtained.
2.4. Analytical Methods
EC and pH were measured by direct immersion of the EC or the pH probe into the stirred CW, inoculum, or diluted cow manure. TS and VS were analyzed according to APHA [
23]. PA and TA were determined according to Ripley et al. [
24] by titration to pH 5.75 and 4.30, respectively. IA was calculated as the difference between TA and PA. CODt and CODs were analyzed by an adaptation of the 410.4 method of the U.S. EPA using a multiparametric photometer HI83399 (Hanna Instruments; Woonsocket, RI, USA). Analyses were performed in triplicate per sample.
2.5. Data Processing
Since the digesters operation was performed from Monday to Friday on a regular basis (i.e., no digester’s feeding was carried out during weekends), the real OLR resulted in a lower value compared to the daily operation (contrarily, the HRT increased). Although biogas production continued during weekends, since anaerobic bacteria did not stop degrading available organic matter, results discussion was carried out based only on the daily biogas and methane yields obtained when digesters’ feeding was performed in a regular manner. Consequently, average values of the biogas and methane yields for each operating condition were calculated from the daily values when digesters were fed. In contrast, when computing HRT and OLR, weekly averages were used to take into account the time that reactors were not fed with substrate, thus giving anaerobic microorganisms time to degrade organic matter and stabilize the anaerobic process. An average OLR was calculated for each week as follows:
where
OLRw_av is the weekly average of the daily organic loading rate,
OLRi (kg of VS m
−3 d
−1) considers
n = 7 days in a week, and OLR equals to zero during weekends.
The weekly average hydraulic retention time (
HRTw_av in days) was calculated as the ratio of the digester’s volume (
Vdigester in liters) to the average feeding flow each week (
n = 7 days). This was derived by summing up the daily volume fed into the digester (
Vfeed in liters) from Monday to Friday.
Periods during which feeding could not be performed during five or more consecutive days were not considered for these calculations.
Biogas and methane yields are reported at standard reference conditions (T = 25 °C and P = 1 atm). In the pilot plant, daily average ambient temperature, the sum of the atmospheric pressure, and the manometric pressure in digesters (the latter oscillating normally between 4 and 7 mbar depending on the height of water in the safety valve) were used to calculate the biogas volume produced at standard reference conditions.
3. Results
3.1. Cheese Whey Composition
Table 3 shows the composition of the nine different CW samples collected for this study. From these samples, the first one (S1) was used to determine its Biochemical Methane Potential (BMP) at the batch scale, wherein the results are shown in another study [
11]. The rest of the samples (S2–S9) were collected afterwards and used to feed the digesters in a continuous mode. For two weeks (from 17 February to 1 March), digesters were fed with CW from an artisan cheese factory, which makes cheese from a mixture of goat and sheep milk (S4) due to CW supply problems from ‘
Quesería de Benijos’. Since CW is an easily biodegradable substrate that changes in composition very fast due to degradation at environmental conditions,
Table 3 also shows the composition of CW batches, which were stored for several weeks before being fed into the digesters.
The composition of CW fed into the digesters changed considerably over the months of the experiment. This was a consequence of the storage time of the CW in the cheese factory. S2 showed a relatively high pH (6.1) and the highest TS and VS content of all samples used in the experiment. This sample was fresh when collected and directly discharged into transportation tanks from the coagulation vats. However, the next samples (except S4, which came from another cheese factory) were partially degraded, thus reaching pH values as low as 3.3 at the same day of collection. According to the pH values (>6) of the fresh samples S2 and S4, these CWs can be classified as sweet whey [
25]. Sweet whey has higher levels of lactose and proteins than acidic whey [
8]. It also lacks in buffer capacity and tends to acidify very fast due to the presence of enzymes and starter cultures added during the manufacture of cheese [
25], as was found in this study. Degradation at environmental conditions of CW started very fast since the date of collection. The pH in S2 decreased from 6.1 to 4.0 in only five days at ambient temperature, and its TS, VS, and CODt contents also reduced by 11.4, 16.1, and 19.3%, respectively. This degradation affected the anaerobic digestion process as follows: on the first hand, the low pH could affect anaerobic bacteria, and specially methanogens, whose optimal pH range is between 6.8 and 7.4 [
16]. It could also lead to quick acidification of the digester when pumped into it. On the second hand, there was a loss of organic matter due to fermentation of the CW stored in open tanks at ambient conditions, which has been shown to decrease the biogas potential of the substrate [
11].
The degradation rate of S2 was reduced during the next fifteen days, as TS, VS, and CODt decreased by 12.9, 17.3, and 14.2%, respectively, whereas the pH decreased from 4.0 to 3.9. The other samples where natural degradation was monitored (S3, S5, S6, and S9) exhibited similar trends of degradation as S2 from day 5 onwards, thus showing that these samples were stored during some days in the cheese factory before being transported and analyzed for the experimental trials.
S4 was collected in fresh at an artisan cheese factory working with goat and sheep milk. The composition did not vary substantially compared to the cow CW used during most of the experiment. S4 presented the highest pH (6.6) and alkalinity of all the samples.
Previous studies have shown that the milk type did not influence the physical and chemical composition of the CW, although the cheese manufacturing process (artisan vs. industrial) was shown to affect the TS, VS, and CODt [
11]: industrial practices such as pasteurization and calcium chloride (CaCl
2) addition to increase coagulation efficiency led to lower TS, VS, and CODt contents.
Also notable are the high EC values in all the samples analyzed. Both cheese factories used sodium chloride (NaCl) during the coagulation process by direct addition to the coagulation vat, whereas the industrial cheese factory also added CaCl2, which is a common practice in the cheesemaking process when milk pasteurization is performed. These practices increased the EC to very high levels (14.8–20.3 mS cm−1) due to the presence of residual NaCl and CaCl2 in CW, which will remain in the digestate and hinder its use in agriculture.
3.2. Biogas Production from Cheese Whey
The biogas and methane yields obtained in digesters D1 (without temperature control) and D2 (with temperature control) at the pilot scale plant are shown in
Figure 2.
Digester D2, where the temperature was 30 ± 3 °C during the experiment (except in short periods when maintenance work was done), showed higher biogas and methane yields for each operating condition (C1–C3) than for D1. The temperature in D1 oscillated between a minimum of 15 °C in winter and a maximum of 27 °C at the beginning of the summer. Temperature changes took place very slowly during the day thanks to the thermal inertia of the digested liquid, but they changed constantly during each season (
Figure 3). For instance, the temperature in October was around 22 °C, dropping to around 15 °C in December, where it increased to a maximum of 27 °C on average in mid-June.
The biogas and methane yields in each digester and for each operating condition are shown in
Table 4. The higher biogas and methane yields in D2 were expected due to the temperature control in the mesophilic range (30–40 °C) or close to it, whereas D1 worked at the psychrophilic range during the experiment (<30 °C) [
26]. The increases in biogas and methane yields thanks to the temperature control in D2 were 22.6% and 26.7% for C1, 18.3% and 20.8% for C2, and 32.3% and 43.0% for C3, respectively. Significant differences were observed only for C3 in its biogas yield and for C2 and C3 in their methane yields.
Low OLR and large HRT values allowed the anaerobic microorganisms at the psychrophilic range to reach the necessary rate of organic matter degradation with a low decrease in the biogas and methane yields compared to the digester working at the mesophilic range. However, the temperature control showed a higher effect during the last stage of the experiment, where the operating conditions were more demanding. An increase in temperature from the psychrophilic (<30 °C) to the mesophilic (30–40 °C) range increased the biogas production and degradation efficiency by accelerating the biochemical reaction rates and microbial growth rates [
27]. Moreover, a lower temperature also affects the hydrolysis rate, which is catalyzed by enzymes, which are sensitive to temperature [
28]. Specially, the hydrolysis of lipids and proteins, major constituents of CW, is critically affected by low temperatures [
29].
The yields obtained in the pilot plant were higher than the results obtained by Escalante-Hernández et al. [
20] at a lab-scale PFR working in the psychrophilic range (26 ± 2 °C) at an OLR of 2 kg
VS m
−3 d
−1 and an HRT of 30 days, where the biogas production reached a peak of 535 L kg
−1VS before diminishing due to acidification. However, in this study, the operating conditions were less demanding due to the lower OLR applied (0.4 vs. 2 kg
VS m
−3 d
−1), which explained this higher efficiency of degradation and the lack of acidification of the digesters. Jaimes-Estévez et al. [
21] studied at a pilot scale tubular digester the anaerobic codigestion of CW and cow manure to avoid acidification problems, thus resulting in similar biogas and methane yields for similar operating conditions as in this study. With a mixture composed of 60% CW and 40% cow manure, their biogas and methane yields were 720 and 420 L kg
−1VS with an OLR of 0.72 ± 0.09 kg
VS m
−3 d
−1 and an HRT of 75 days. CW anaerobic digestion has been studied widely at the lab scale, albeit the literature studying this process at the pilot scale in tubular reactors is scarce. This study proves that the monodigestion of CW is possible in low-cost, tubular reactors working with low demanding operating conditions, both at psychrophilic and mesophilic conditions. Although the HRT used in this study is high compared to typical high-tech anaerobic reactors, for low-cost digesters and temperate climates, the HRT usually varies between 60 and 90 days [
30,
31].
The BMP analysis of CW from ‘
Quesería de Benijos’ was performed in another study [
11], thus showing a biogas yield of 932.9 ± 39.4 L kg
−1VS with a 66.4 ± 1.1% of CH
4. The BMP results show the ultimate biogas potential for substrates used in anaerobic digestion, thus being a critical parameter for the full-scale implementation of anaerobic digestion processes [
32]. The results obtained at the pilot scale in all operating conditions were like those from the BMP assay, thus indicating a very good utilization efficiency of CW for biogas production in both digesters.
3.3. Process Stability and Organic Matter Degradation
The process stability and organic matter degradation can be analyzed based on the conditions inside the digesters.
Figure 4a shows the evolution of the pH and the EC of the substrate and the digesters during the experiment. The EC was low at the beginning because of the diluted cow manure used as inoculum and, as the experiment progressed, it increased in both digesters at a constant rate because of the high EC of the CW used as the substrate. Approximately at day 180, the EC of the CW was almost the same as the EC measured in the digestates of both D1 and D2. According to the Association of German Engineers [
33], when a new substrate is fed into a digester (or an operating condition is changed), only after the expiry of 3 to 5 HRT would new constant conditions be found inside continuously stirred tank reactors. In the PFRs used in this experiment, the EC reached almost constant conditions after the expiry of 2 × HRT.
The pH was stable along the experiment, thus indicating that acidification did not take place. The pH of D2 oscillated between 7.28 and 8.49. However, the pH in D1 decreased at the end of the operating condition C3, thus reaching the lowest observed pH value (6.85). This decrease in the pH value was a consequence of the saturation of the anaerobic process and the accumulation of VFA inside D1. This could be seen in the increase in the IA and the decrease in the PA of D1 (see
Figure 4b), which was clearly shown by the gradual increase in the IA/PA ratio from day 113, thus reaching 1.11 at the end of the experiment. IA can act as an estimation of the accumulation of VFA inside the digester, whereas IA/PA ratios higher than 0.3 are normally considered to be an indicator of the instability of the anaerobic process [
24,
34]. During the experiment, besides sudden increases in the IA/PA in D2 (day 85; IA/PA ratio = 0.31), the IA/PA ratio was kept under 0.3.
The instability of the process in D1 is a consequence of the lack of temperature control, because a lower temperature could reduce the kinetics of methanogenic bacteria, thus leading to an accumulation of intermediate compounds produced by acidogenic and acetogenic bacteria (i.e., VFA) and to a pH decrease. This behavior shows the importance of the increase in the temperature of the reactor, especially if more demanding operating conditions are established. Escalante-Hernandez et al. [
20] had similar problems working with lab-scale PFR at ambient conditions, thus showing VFA concentrations higher than 1000 mg L
−1 for OLR of 2 kg of VS m
−3 d
−1, which led to a sharp pH decrease to 5.5 and the inhibition of the process. Codigestion with cow manure avoided the acidification of the reactor and the accumulation of VFA. This study shows that temperature control avoids the need to use other substrates with high alkalinity to digest CW, thus facilitating the implementation of anaerobic digestion for treating CW in cheese industries. By avoiding the use of cosubstrates, investment costs in biogas plants could be reduced due to the need for smaller digesters (for the same quantity of CW treated) and pumps of lower power. However, a lower OLR may be needed to avoid the acidification of PFRs, whereas the heating system implies a higher investment and energy self-consumption of the biogas plant. A technoeconomic evaluation, which is outside the scope of this study, should be performed to assess the cost–benefit of each option.
The methane and hydrogen sulfide content of biogas produced in D1 and D2 are shown in
Figure 5, whereas
Table 5 shows the average values for each digester and operating condition. There were no relevant differences between the digesters in each operating condition.
Once the operating conditions increased in demand (higher OLR and lower HRT), the methane and hydrogen sulfide contents were similar for all the digesters. The biogas composition is an important indicator of process stability in anaerobic digestion [
35], although other parameters, such as the VFA concentration and profile, may show imbalances in the process before the biogas composition changes, thus also giving more precise information [
36]. However, in a low-cost biogas plant, VFA analysis and profiling is almost impossible due to the associated high costs [
37]. The similar methane contents in all the digesters highlights the same process equilibrium in the digesters of the pilot plant. Only D1 (at ambient temperature) showed a pronounced imbalance at the end of C3 compared to D2, which was appreciated in the IA/PA ratio. Treu et al. [
14] digested CW at mesophilic conditions in a continuously stirred tank reactor at a lab scale and an OLR of 2.2 kg of VS m
−3 d
−1 with continuous imbalances in the anaerobic process, which were attributed to the high concentration of NaCl in the digester. Only the addition of a buffer avoided the acidification of the digester. In this study, the high EC of the CW was an indicator of the high salinity, which could hinder the anaerobic digestion process, thus impeding a higher OLR and a shorter HRT.
The organic matter degradation was monitored by means of the TS, VS, and CODt in the influent (CW) and effluent (digestate) of each digester.
Figure 6 shows the variation along the experiment of these parameters. Reduction of the TS, VS, and CODt was noticeable for all digesters compared to the substrate used. No relevant differences were observed between D1 and D2, but during operation condition C3, the TS, VS, and CODt concentrations of the digestate from D2 showed slightly lower values than those from D1. Probably, the imbalance problems in D1 caused a reduction in the degradation efficiency of the CW due to the reduced temperature process.
The organic matter degradation, calculated as the percentage reduction of TS, VS, or CODt between the substrate (CW) and the digestate of each digester, was high for all digesters and all operating conditions (
Table 5).
The organic matter degradation was high for the PFR in the pilot plant, where D2 showed on average higher organic matter degradation. The CODt degradation was higher than 90% for all operating conditions in D2, whereas it fell during C3 in D1 below 90%. The VS degradation showed a similar behavior, thus being in D2 higher than 90% in all operating conditions but falling below 90% in D1 during C2 and C3. The TS content also showed a high reduction for both tubular digesters, thus being slightly higher in D2. The anaerobic digestion of CW in PFRs at the pilot scale reached high organic matter degradation, thus yielding higher than values reached in a membrane reactor with phase separation at 37 °C—where 79% of CODt removal was achieved [
38]—and similar to UASB reactors operated at 35 °C, where 91–97% COD removal was observed [
39]. It must be considered that operating conditions are much more demanding in membrane and UASB reactors, where the HRTs were 4 days and between 2 and 4 days, respectively. Jaimes-Estevez et al. [
21] observed that by substituting water in CW in the dilution of cow manure and increasing the organic loading rate by 450%, the COD removal in a PFR operating at ambient conditions decreased only by around 10%. These results show the high efficiency of a PFR degrading CW, which is an excellent, highly biodegradable substrate for anaerobic digestion in low-cost digesters. These results should be taken with caution, since organic matter accumulation is common in unstirred tubular digesters [
40]. Moreover, the accumulation of organic matter inside a PFR, which is an operational problem that would lead in the long run to a loss of the active volume of the digester, might act in this case act as a booster of biogas production during the experiment.
3.4. Heat Losses in Tubular Digesters with Temperature Control
The increase in temperature in the tubular digesters led to an increase in the biogas yield and a more stable process, thus leading to a higher OLR and a lower HRT without process imbalance, which were shown by the differences between D1 and D2 in the pH, IA (indicator of VFA accumulation inside digesters), and IA/PA ratio. However, temperature control at temperatures higher than ambient temperatures entails an energy cost, which must come from the biogas generated.
To evaluate the convenience of controlling the temperature of the tubular digesters when operating in subtropical climates, the heat losses of D2 were calculated and compared with the energy gain due to the increase in biogas productivity between D2 and D1. The heat losses in a tubular digester come from the heat transfer from the digester to the soil, since the heat losses through the ceiling are negligibly low, because the ceiling is in contact with gas and/or air inside and outside [
41]. Therefore, the energy demand to keep a tubular digester at a certain temperature comes from the energy necessary to heat up the substrate to the desired temperature (in this case, 30 °C) and the energy necessary to compensate for the heat losses from the digester to the soil. Milk is usually heated up between 20–40 °C for the coagulation process [
42], with temperatures around 35 °C being optimum for most common milk-clotting enzymes [
43]. After milk coagulation, CW is produced. Therefore, in small biogas plants where tubular digesters are used for treating CW produced on site, no energy will be required to heat the substrate to the desired temperature.
The heat losses from the digester to the soil are calculated according as follows:
where
q are the heat losses of the reactor to the soil (W), Δ
T is the temperature difference between the digester (30 °C) and soil (assumed to be the same as the average monthly temperature),
hint is the heat transfer coefficient inside the digester (2000 W m
−2 K
−1 for slowly agitated liquid),
S is the surface of the digester in contact with the soil (10.5 m
2),
ei is the thickness of the insulation layer (m),
λi is the heat transmission coefficient of the insulation layer (W m
−1 K
−1), and
hext is the heat transfer coefficient outside the digester (400 W m
−2 K
−1 for humid soil).
Although rock wool was used in the pilot plant in this paper, the heat losses were calculated in this paper for a standard 50 mm thick polystyrene panel, with a heat transmission coefficient of λ = 0.03 W m−1 K−1. Moreover, the two layers of EPDM of 1.2 mm thick and a λ = 0.25 W m−1 K−1 were considered. The annual heat losses were estimated to be 754.4 kWh year−1.
On the other hand, the biogas gain was calculated based on the increase in the methane yield for operational condition C3 (565.8 ± 20.9 L kg−1VS for D2 vs. 395.6 ± 7.4 L kg−1VS for D1 at an OLR of 0.416 kgVS m−3 d−1), thus leading to a daily methane increase of 283.2 L. This is equivalent to an annual increase of 103.2 m3 of methane, with an energy content of 9.96 kWh m−3, which is equivalent to a gross energy gain of 1029.6 kWh year−1. In a boiler with a 90% efficiency rate, the net heat gain would be 926.6 kWh year−1, thus showing that the energy demand to keep digester at 30 °C is slightly lower than the energy gained by the increase in biogas. Therefore, when using CW as substrate on site, it would be recommended to use heating systems for tubular digesters working in a subtropical climate if appropriate heat insulation can be used.


 ,
, 


