Article

An Accurate Calculation Method on Blasingame Production Decline Model of Horizontal Well with Dumbbell-like Hydraulic Fracture in Tight Gas Reservoirs

by
Zuping Xiang
1,2,3,
Ying Jia
1,
Youjie Xu
3,4,*,
Xiang Ao
3,
Zhezhi Liu
3,
Shijie Zhu
3 and
Zhonghua Chen
3
1
State Key Laboratory of Shale Oil and Gas Enrichment Mechanism and Effective Development, Beijing 102206, China
2
Key Laboratory of Marine Oil and Gas Reservoirs Production, Sinopec, Beijing 102206, China
3
School of Petroleum Engineering, Chongqing University of Science and Technology, Chongqing 401331, China
4
Chongqing Key Lab Complex Oil & Gas Fields Exploration, Chongqing University of Science and Technology, Shapingba, Chongqing 401331, China
*
Author to whom correspondence should be addressed.
Processes 2024, 12(7), 1460; https://doi.org/10.3390/pr12071460
Submission received: 11 June 2024 / Revised: 7 July 2024 / Accepted: 10 July 2024 / Published: 12 July 2024

Abstract

:
Blasingame production decline is an effective method to obtain permeability and single-well controlled reserves. The accurate Blasingame production decline curve needs an accurate wellbore pressure approximate solution of the real-time domain. Therefore, the aim of this study is to present a simple and accurate wellbore pressure approximate solution and Blasingame production decline curves calculation method of a multi-stage fractured horizontal well (MFHW) with complex fractures. A semi-analytical model of MFHWs in circle-closed reservoirs is presented. The wellbore pressure and dimensionless pseudo-steady productivity index JDpss (1/bDpss) are verified with a numerical solution. The comparison result reaches a good match. Wellbore pressure and Blasingame production decline curves are used to analyze parameter sensitivity. Results show that when the crossflow from matrix to natural fracture appears after the pseudo-state flow regime, the value of the inter-porosity coefficient has an obvious influence on the pressure approximate solution of the pseudo-steady flow regime in naturally fractured gas reservoirs. The effects of relevant parameters on wellbore pressure and the Blasingame decline curve are also analyzed. The method of pseudo-steady productivity index JDpss can applied to all well and reservoir models.

1. Introduction

Due to depleting conventional gas reservoirs and increasing world energy demand, it is urgent to produce unconventional resources. Low permeability and porosity are a most obvious characteristic of unconventional hydrocarbon resources [1,2]. Since the permeability of the tight formation is less than 0.1 mD, the development of tight gas reservoirs will require horizontal well multi-stage hydraulic technology [3,4].
We expect to create longer and more hydraulic fractures by vertical well large-scale fracturing. At the same time, since the minimum and maximum stress direction around the wellbore is different, a multi-directional hydraulic fracture will be formed, which is called a multi-wing fracture. Most scholars presented the multi-wing fractures semi-analytical model with different seepage mechanisms and hydrocarbon reservoirs. Wellbore pressure transient curves and productivity index curves are discussed [5,6,7,8,9,10,11,12]. However, their research mainly focuses on wellbore pressure analysis and productivity index analysis of pseudo-steady flowing regimes. There is no relevant research on the Blasingame production decline model in previous works.
Compared with vertical hydraulic fractured wells, horizontal well multi-stage hydraulic fracturing shows more advantages in enhancing the gas well rate. Therefore, a multi-stage fractured horizontal well is the main measure of low permeability gas development. However, in the past decades, some scholars have presented mathematical models and wellbore pressure solutions of the MFHWs with infinite conductivity fracture by the source function [13,14,15]. Later, Cinco-Ley [16] presented the method of coupling the reservoirs model and hydraulic fracture model by discrete hydraulic fracture. It is assumed that there is a pressure drop in the hydraulic fracture, which lays the foundation for wellbore pressure calculation of a finite conductivity fractured well. Based on the above research results, some scholars carried out wellbore pressure dynamic research of the MFHWs with infinite and finite conductivity fractures [17,18,19,20]. However, their research assumes that hydraulic fractures are symmetrical about the wellbore. A large number of micro-seismic maps show that a complex fracture network is generated around the wellbore due to the uneven distribution of in situ stress around the wellbore during hydraulic fracturing [21,22,23,24]. The conventional symmetrical fracture model cannot meet the interpretation of field data. Therefore, some scholars presented semi-analytical models of the MFHWs with a complex fracture style and arbitrary shape fracture by employing the end-point flux conservation and star-delta transformation [25,26,27,28,29,30,31]. A horizontal well with dumbbell-like fracture geometry was observed in gas fields through the micro-seismic mapping technique. Xu [32] presented the production performance of the MFHWs with the dendritic-like hydraulic fractures by the finite volume method. However, there is no report about pressure transient analysis of the MFHWs with dumbbell-like fractures. Most importantly, the Blasingame production decline model of the MFHWs with a dumbbell-like fracture or bi-wing symmetrical fracture is reported rarely. Of course, although some scholars have presented the Blasingame curves of the MFHWs, they only use the coefficient of the pseudo-steady state approximate solution of a vertical (hydraulic fractured) well to transform the material balance pseudo-time [23,24,25,26,27,28,29,30,31,32,33,34,35,36]. Therefore, there are many deficiencies and defects in their research results. In order to conduct a more accurate evaluation of the fracturing effect, some scholars have considered the influence of fracture stress sensitivity and fracture skin [37,38].
In the last decades, the wellbore pressure solution of a vertical well during a pseudo-state flowing regime in the real-time domain can be obtained by introducing the Dietz shape factor. However, the calculation of the Dietz shape factor for the MFHWs is very difficult and relies on a wellbore pressure approximate solution. Based on the pressure build-up well test interpretation method, Matthews et al. [39] obtained the average formation pressure curve vs. time at any position of a rectangular closed hydrocarbon reservoir. Based on this method, Dietz [40] gives the shape factor of the pseudo-steady flowing regime and the corresponding pseudo-steady start-time of vertical wells in different boundary hydrocarbon reservoirs. Helmy [41] presented the calculation method of the shape factor for constant pressure production and compared it with the Dietz shape factor. Haryanto [42] obtained the shape factor of a fractured vertical well with finite conductivity by numerical simulation and analyzed the relationship between the shape factor and conductivity. The Dietz shape factor calculation method provides thinking to obtain the wellbore pressure approximate solution during the pseudo-state flowing regime. In order to obtain the Blasingame decline curve of a hydraulic fractured well accurately, some scholars presented the wellbore pressure approximate solution of hydraulic fracture during a pseudo-state flowing regime for circle and rectangle closed boundary reservoirs [32,43]. However, the method of sPratikno and Xing is suitable for Blasingame curves of a vertical fractured well.
Based on the above literature, the goals of this paper are as follows: (1) establish the mathematical model of MFHWs with a dumbbell-like conductivity fracture, obtain the semi-analytical solution, and verify the wellbore pressure solution with the numerical model; (2) verify the wellbore pressure approximate solution of the MFWHs with a dumbbell-like conductivity fracture during the pseudo-state regime using the relationship between the pressure and its derivative curve; (3) verify the wellbore pressure approximate solution with a numerical model using the dimensionless pseudo-steady productivity index bDpss (1/bDpss); (4) plot the wellbore pressure and Blasingame production decline curves of the MFHWs with dumbbell-like conductivity fracture in log–log and analyze the influence of some important parameters on typical curves; and (5) use the field data to verify the model and method.

2. Physics Model

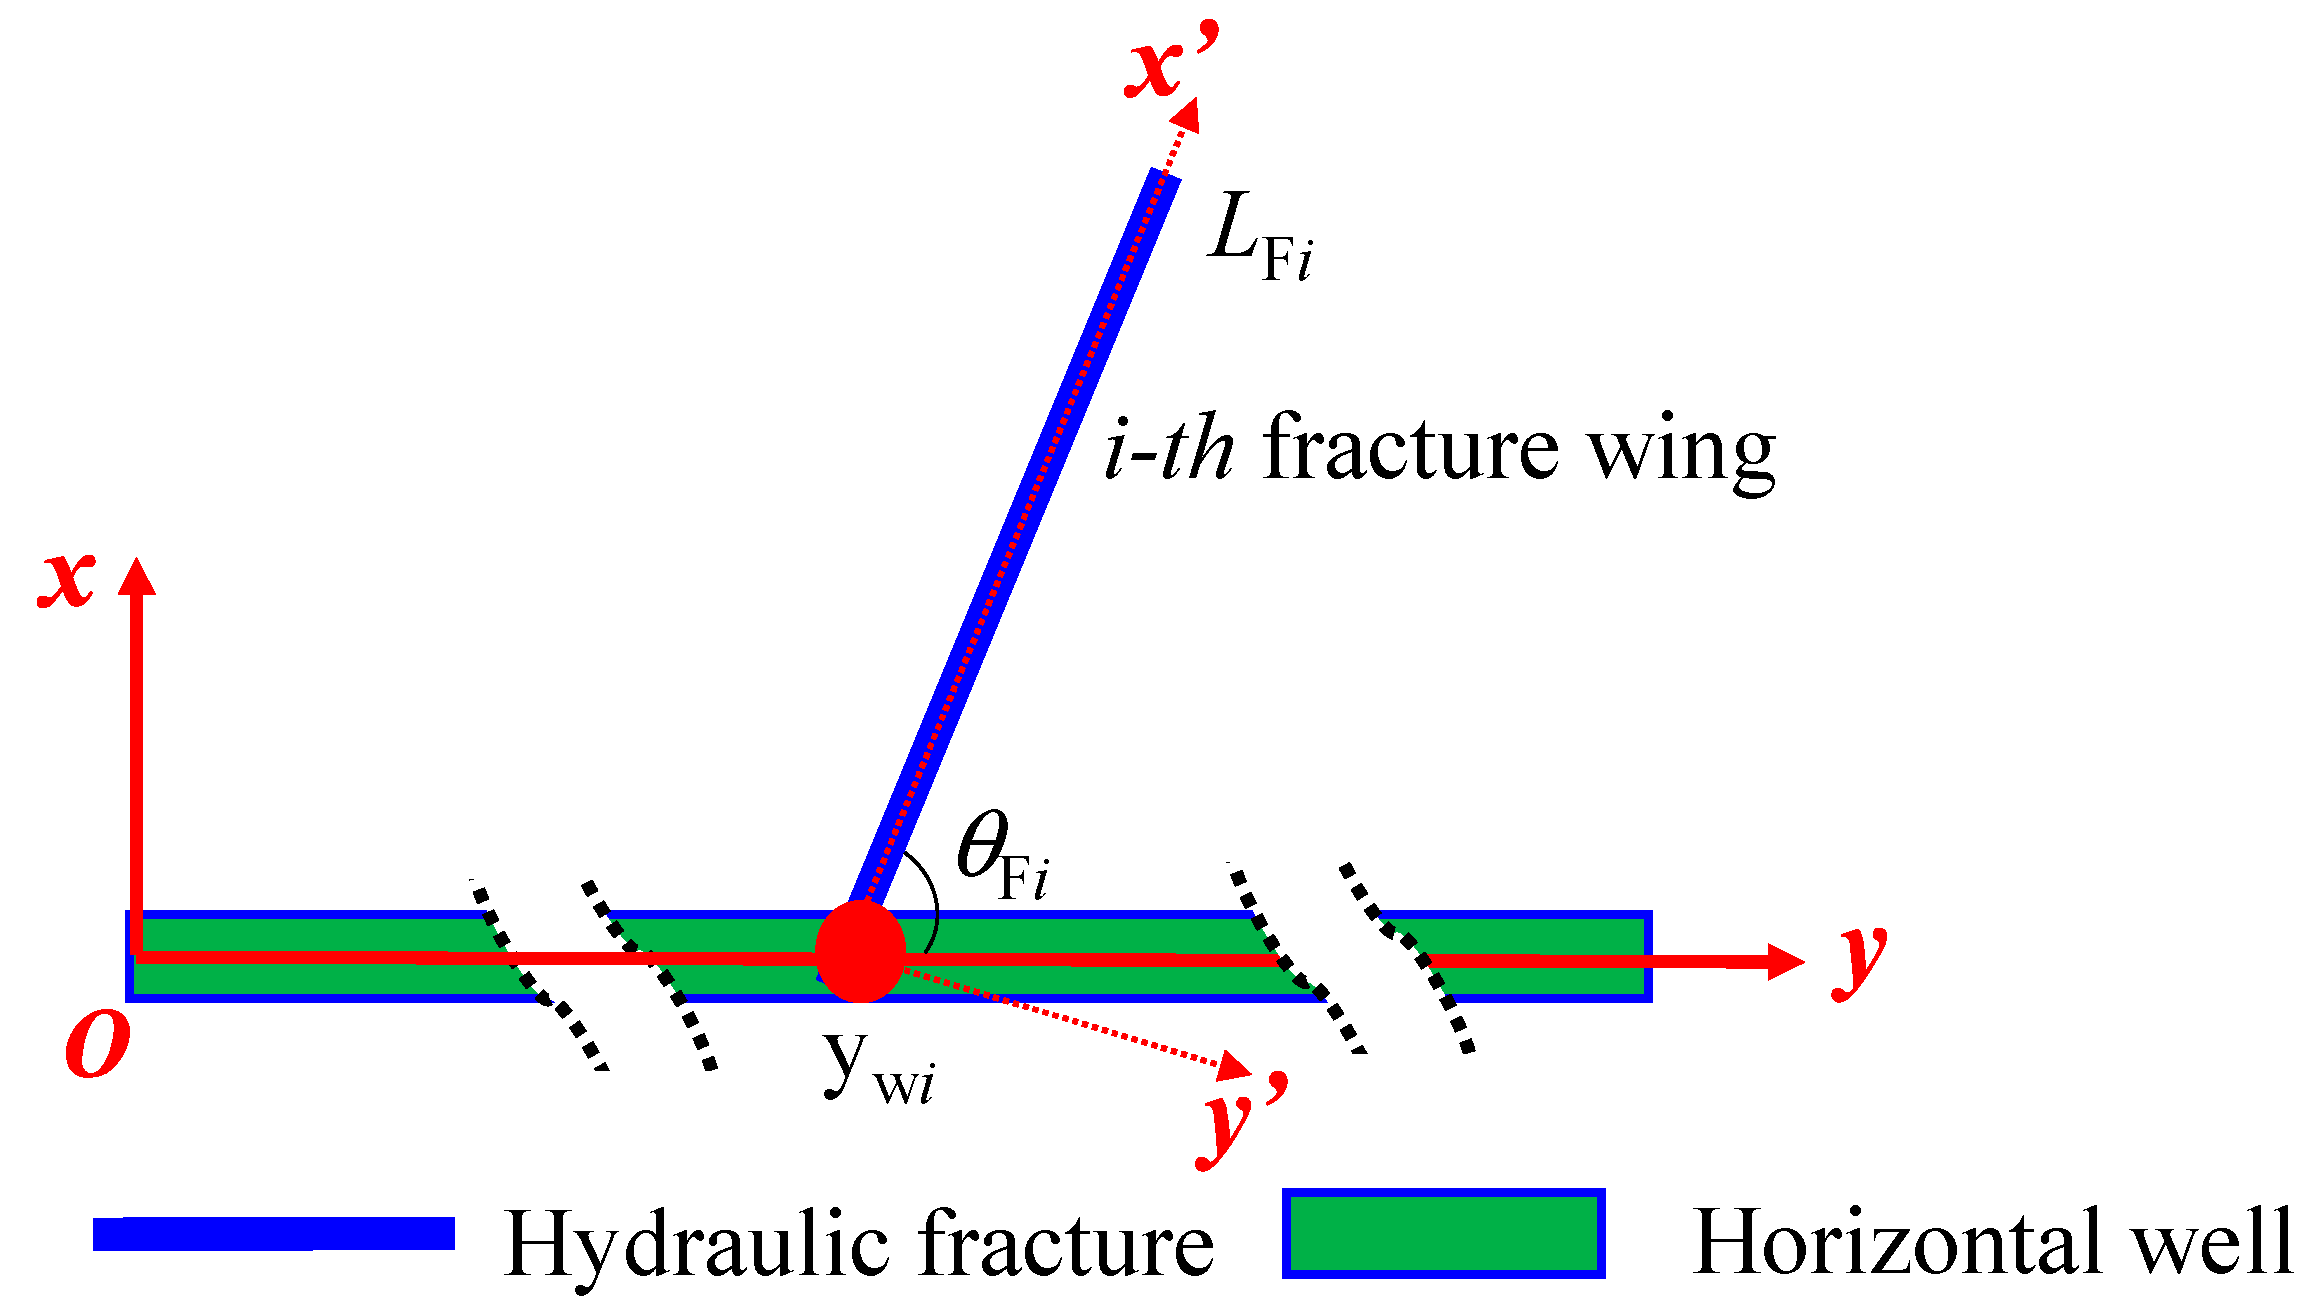
Due to the influence of in situ stress, the hydraulic fractures extend along different directions during the multi-stage fracturing process. Microseismic maps confirm the existence of this phenomenon. A physical model of a multi-stage fractured horizontal well with a dumbbell-like conductivity fracture is shown in Figure 1. The assumptions are listed as follows:
(1)
The total stage number of fractures is M. The height of the fractures is assumed to be equal to the formation thickness.
(2)
The total fracture number of each cluster is MF.
(3)
The length, permeability, and width of the i-th fracture wings are represented by LFi, KFi, and wFi respectively.
(4)
The angle between each fracture wing and horizontal well is represented by θFi.
(5)
The gas flows into the horizontal wellbore mainly through the hydraulic fracture.
(6)
The total rate of the MFHWs is denoted by qsc for a constant-production gas well.
(7)
The top and bottom boundaries of gas reservoirs are considered as impermeable boundaries.
(8)
The gas flow meets Darcy’s law in formation and hydraulic fractures.
(9)
The influence of the gravity and capillary effect is ignored and gas flow meets isothermal seepage.

3. Mathematical Model and Solution

3.1. Reservoirs Model

The source function is an important method to solve the wellbore pressure of the MFHWs with an arbitrary shape hydraulic fracture [14,15]. For gas reservoirs, the pseudo-pressure is usually used to linearize the equation. The definition of pseudo-pressure is as follows.
ψ = p 0 p 2 p μ Z d p
According to the dimensionless variables definition (Table 1), the dimensionless vertical linear source solution of the Laplace domain of the circle closed boundary is listed as follows [15]:
s ψ ¯ D ( r D , s ) = q ˜ D [ K 0 ( f ( s ) r D ) + D 0 I 0 ( f ( s ) r D ) ]
where f ( s ) = s ( ω + ( 1 ω ) λ λ + ( 1 ω ) s ) ; D 0 = K 1 ( R eD f ( s ) ) I 1 ( R eD f ( s ) ) ; r D = ( x D x wD ) 2 + ( y D y wD ) 2 .
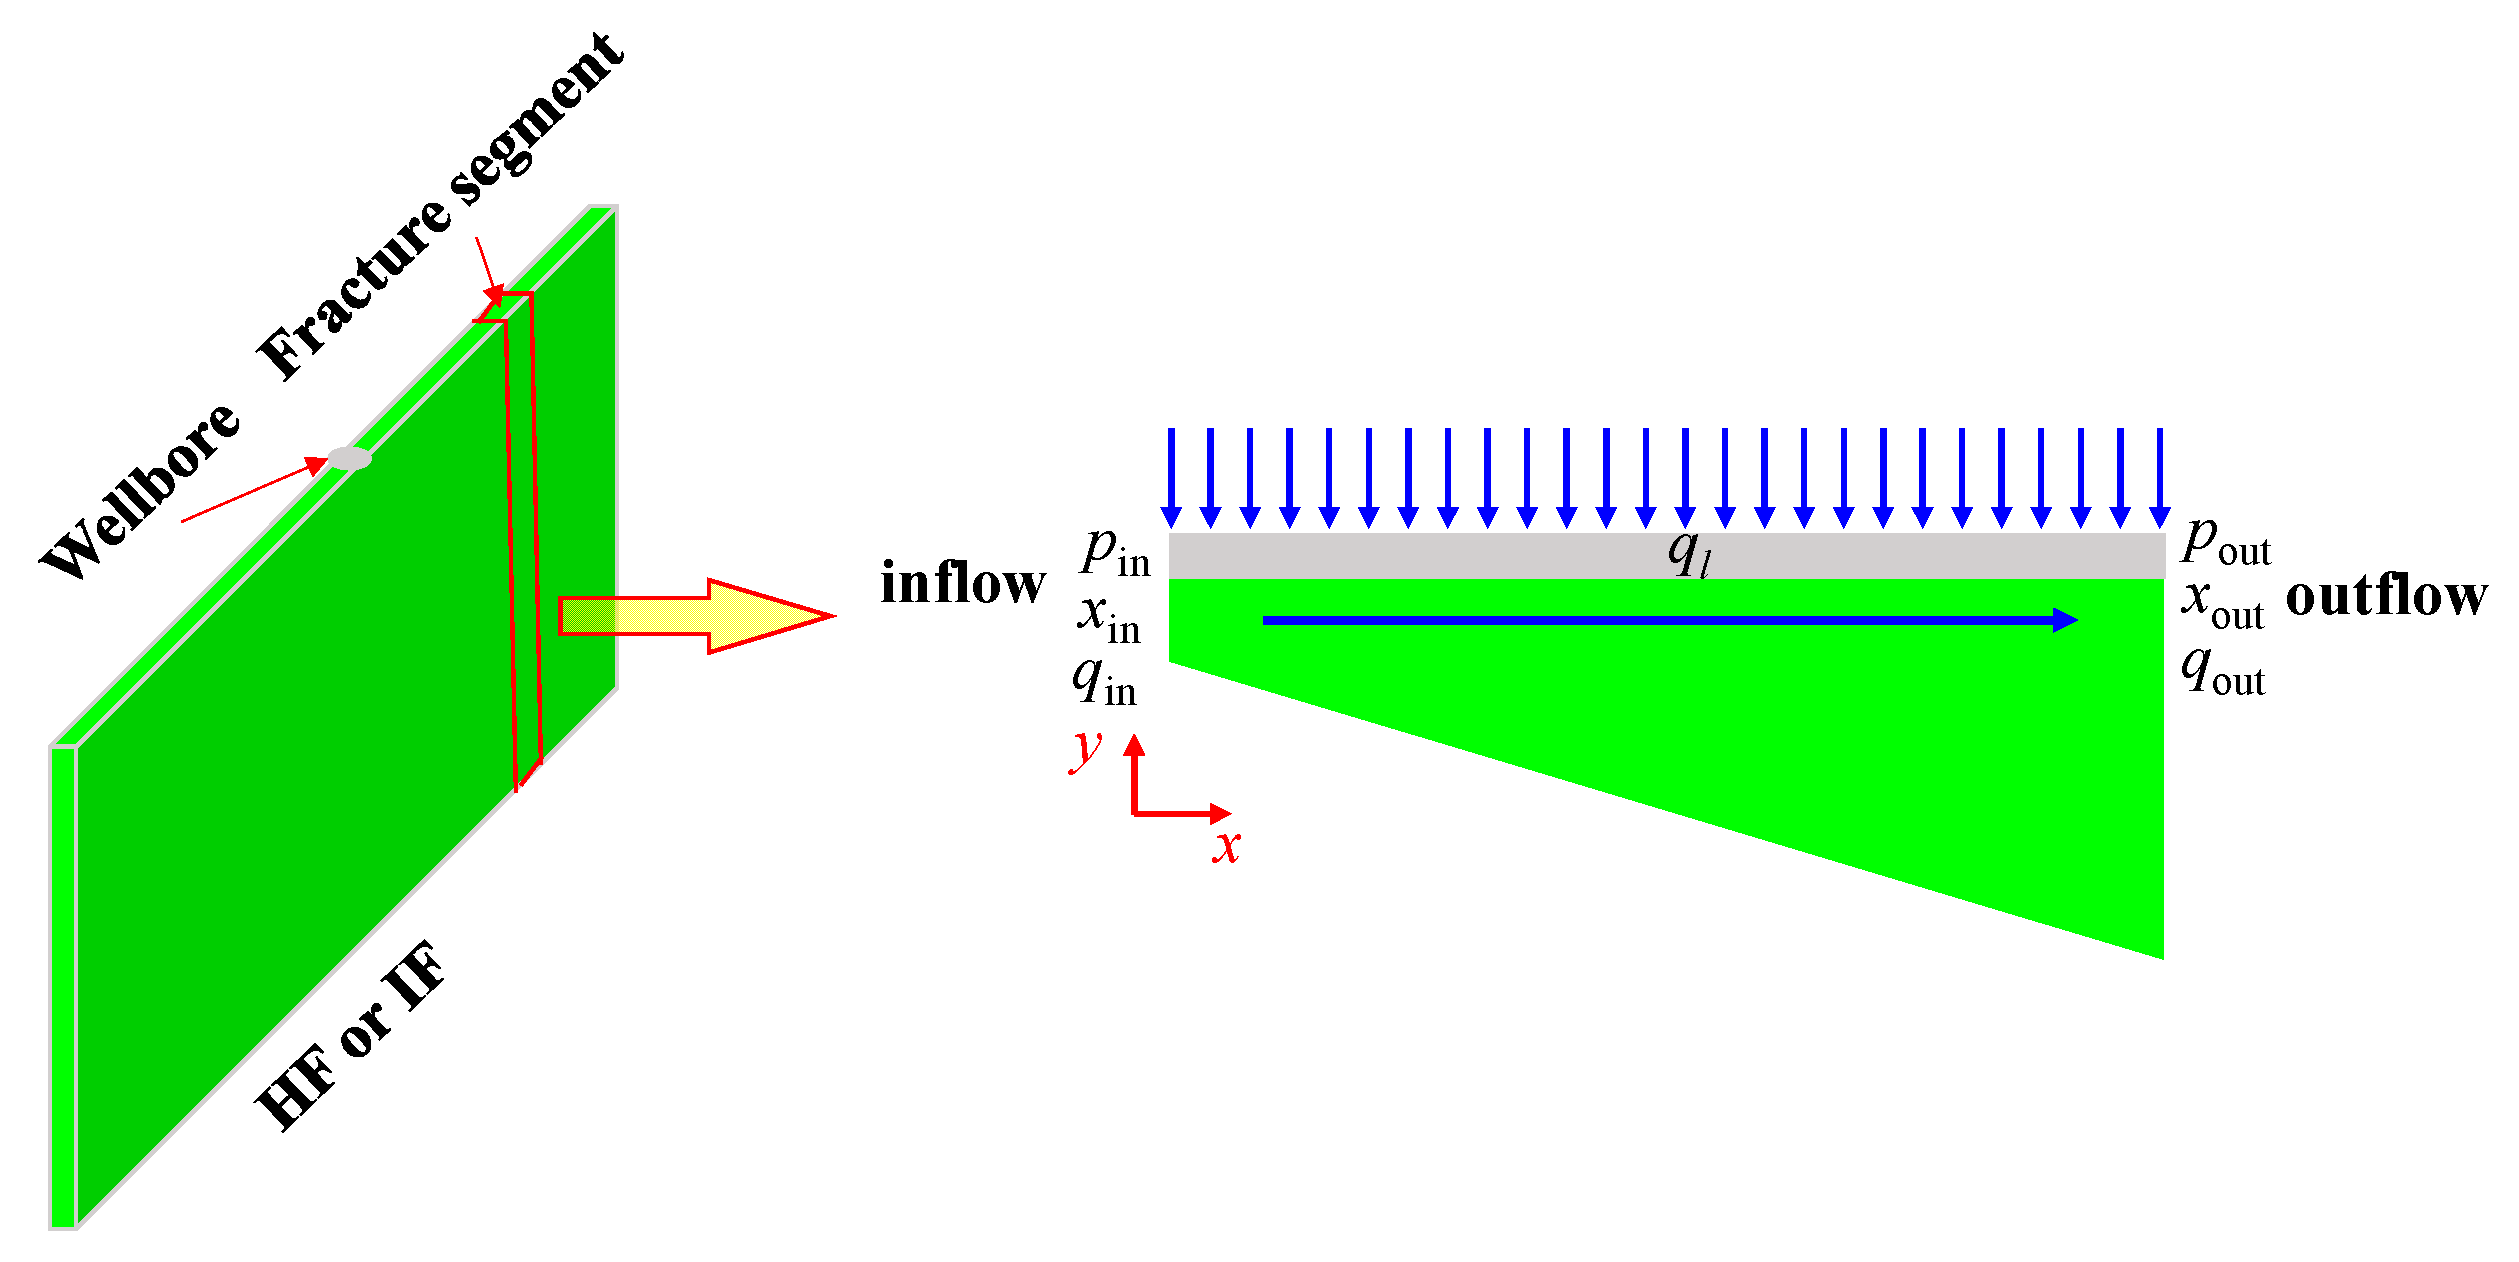
Each wing is seen as a hydraulic fracture segment. The uniform flux surface source solution of the i-th fracture wing is obtained by integrating the vertical line source function (Figure 2).
According to the pressure drop superposition principle, the total pressure of the i-th fracture wing is
ψ ¯ D i ( R D , s ) = i = 1 M × M F 0 L FD i q ˜ ¯ D i [ K 0 ( f ( s ) R D ) + D 0 I 0 ( f ( s ) R D ) ] d α
where: R D = ( x D α sin θ F i ) 2 + ( y D y wD i α cos θ F i ) 2 .

3.2. Fracture Wing Model

The fluid flowing in the hydraulic fracture belongs to a one-dimensional flow. Cinco-Ley [16] presented the flowing equation of the hydraulic fracture and analytical solution with the Fredholm integral equation. The flowing equation and solution of the fracture discrete element are given by combining the boundary-element technique with the Laplace transform [44,45]. The pressure drop equation of the fracture discrete element is presented by the vertex mass balance [46,47]. Jia [48] presented pressure drop equations of fracture discrete elements using the finite difference. The above methods can calculate the wellbore pressure of the MFHW with the conductivity finite fracture. Zhou’s method is used to calculate the wellbore pressure of the MFHW with the dumbbell-like conductivity finite fracture in this paper.
The fracture flowing segment is taken as the research object (Figure 3) and the dimensionless 2D flowing equation of the fracture segment of the local coordinate in the Laplace domain can be written as follows [46]:
x D ( ψ ¯ FD x D ) = 2 π q ˜ ¯ D C FD
ψ ¯ FD x D | x D = x inD = 2 π C FD q ¯ inD , i
The flow rate at any position of the fracture element can be expressed by the following equation:
q D ( x ) = q inD + q ˜ D ( x D x inD )
According to the research of Cinco-Ley [16], Equation (4) can be written as the integration from xinD to xD towards xinD.
d ψ ¯ FD i ( x D , s ) d x D d ψ ¯ FD i ( x inD , s ) d x D = 2 π C FD q ˜ ¯ D ( x D x inD )
Substituting Equation (5) into Equation (7), Equation (7) can be written as the integration from xinD to xoutD towards xD.
ψ ¯ out , FD ψ ¯ in , FD = 2 π C FD x inD x outD [ q ˜ ¯ D ( x D x inD ) + q ¯ inD ] d x D

3.3. Coupling of Hydraulic and Reservoirs

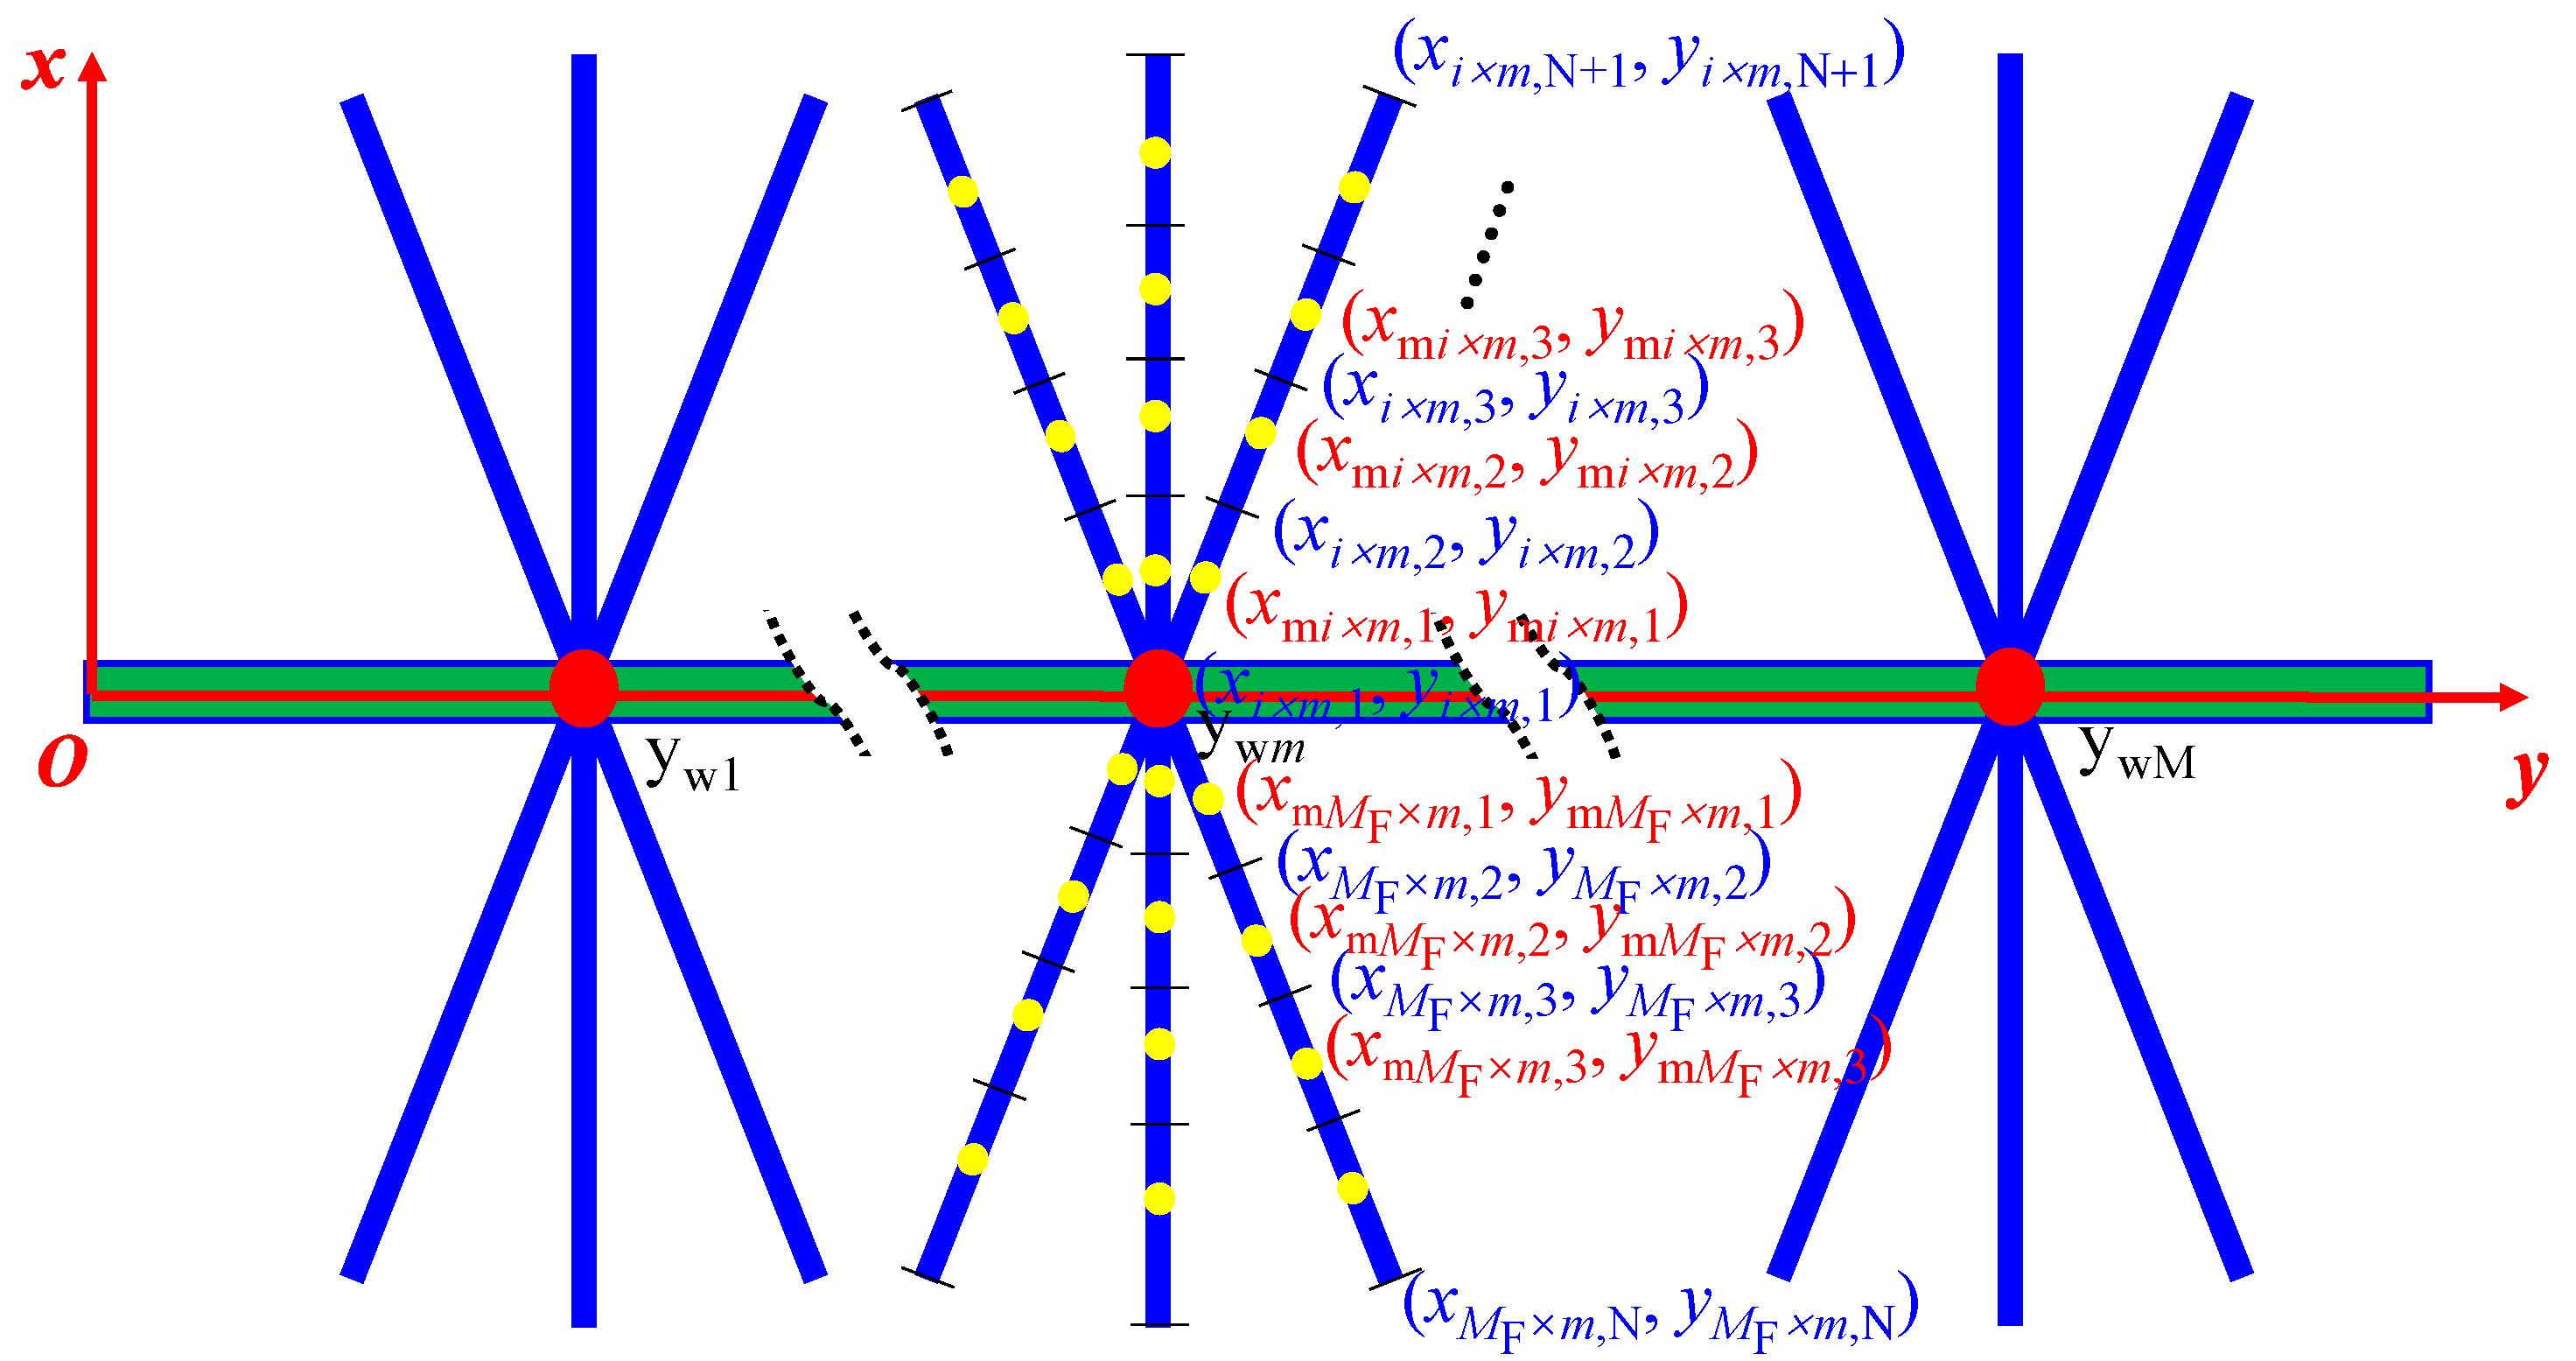
In order to calculate the wellbore pressure of the MFHW with dumbbell-like conductivity fracture, every hydraulic fracture wing is discretized into N segments and every segment length is equal (Figure 4).
As is shown in Figure 2 and Figure 4, the end-point and mid-point coordinate of the local coordinate x′-y′ system is
x D m × i , j = ( j 1 ) L FD m × i N 1 m M ; 1 i M F ; 1 j N + 1
x mD m × i , j = ( j 0.5 ) L FD m × i N 1 m M ; 1 i M F ; 1 j N
The end-point and mid-point coordinate of the x-y system is
x D m × i , j = x D m × i , j sin θ m × i x mD m × i , j = x mD m × i , j sin θ m × i
y D m × i , j = x D m × i , j cos θ m × i y mD m × i , j = x mD m × i , j cos θ m × i
The end-point and mid-point coordinate of the fracture segment is calculated by the calculation program (Figure 5).
The fracture segment vertex near the wellbore is seen as the outflow according to Equations (3) and (8). The following unknowns are listed following.
  • Dimensionless outflow vertice pseudo-pressure of every fracture segment in the Laplace domain, ψ ¯ out , FD i , i = 1, 2, …, MF × M × N.
  • Dimensionless surface fluxes of the Laplace domain, q ˜ ¯ D i , i = 1, 2, …, MF × M × N.
  • Dimensionless inflow vertices flux of every fracture segment in the Laplace domain, q ¯ inD i , i = 1, 2, …, MF × N × M + M.
  • Dimensionless wellbore pseudo-pressure of the Laplace domain, ψ ¯ wD .
The pressure difference of every fracture wing segment from the outflow vertices to the inflow vertices.
ψ ¯ out , FD i ψ ¯ in , FD i = 2 π C FD x inD i x outD i [ q ˜ ¯ D i ( x D x inD i ) + q ¯ inD i ] d x D   i = 1 , 2 , , M F × M × N
The pressure difference of every hydraulic fracture wing segment from the outflow vertices to the mid-point.
ψ ¯ mFD i ψ ¯ in , FD i = 2 π C FD x inD i x mD i [ q ˜ ¯ D i ( x D x inD i ) + q ¯ inD i ] d x D   i = 1 , 2 , , M F × M × N
According to the pressure drop superposition principle, the total pressure of the i-th hydraulic segment is
ψ ¯ D i ( R D , s ) = i = 1 M × M F j = 1 N x D i , j x D i , j + 1 q ˜ ¯ D i , j [ K 0 ( f ( s ) R D ) + D 0 I 0 ( f ( s ) R D ) ] d α
For each vertex, the inflow must equate to the outflow. The following equation can satisfy the mass balance:
q ¯ outD i q ¯ inD i = q ˜ ¯ D i ( x D i + 1 x D i )   i = 1 , 2 , , M F × M × N
In addition, the rate of the gas well is equal to the total rate of each hydraulic fracture segment.
i = 1 M × M F × N q ˜ ¯ D i = 1 s
Combining Equations (13)–(17), the 3 × MF × M × N + 1 order linear equation is structured, and the wellbore pressure of the Laplace domain and dimensionless surface fluxes of the Laplace domain are obtained. It is noted that pressure represents the wellbore pressure when the calculation point is located at the wellbore.
When the skin factor and wellbore storage are considered, the wellbore pressure can be written as follows [49]:
ψ ¯ wD = s ψ ¯ wfD + S s + C D s 2 ( s ψ ¯ wfD + S )

4. Wellbore Pressure Verification

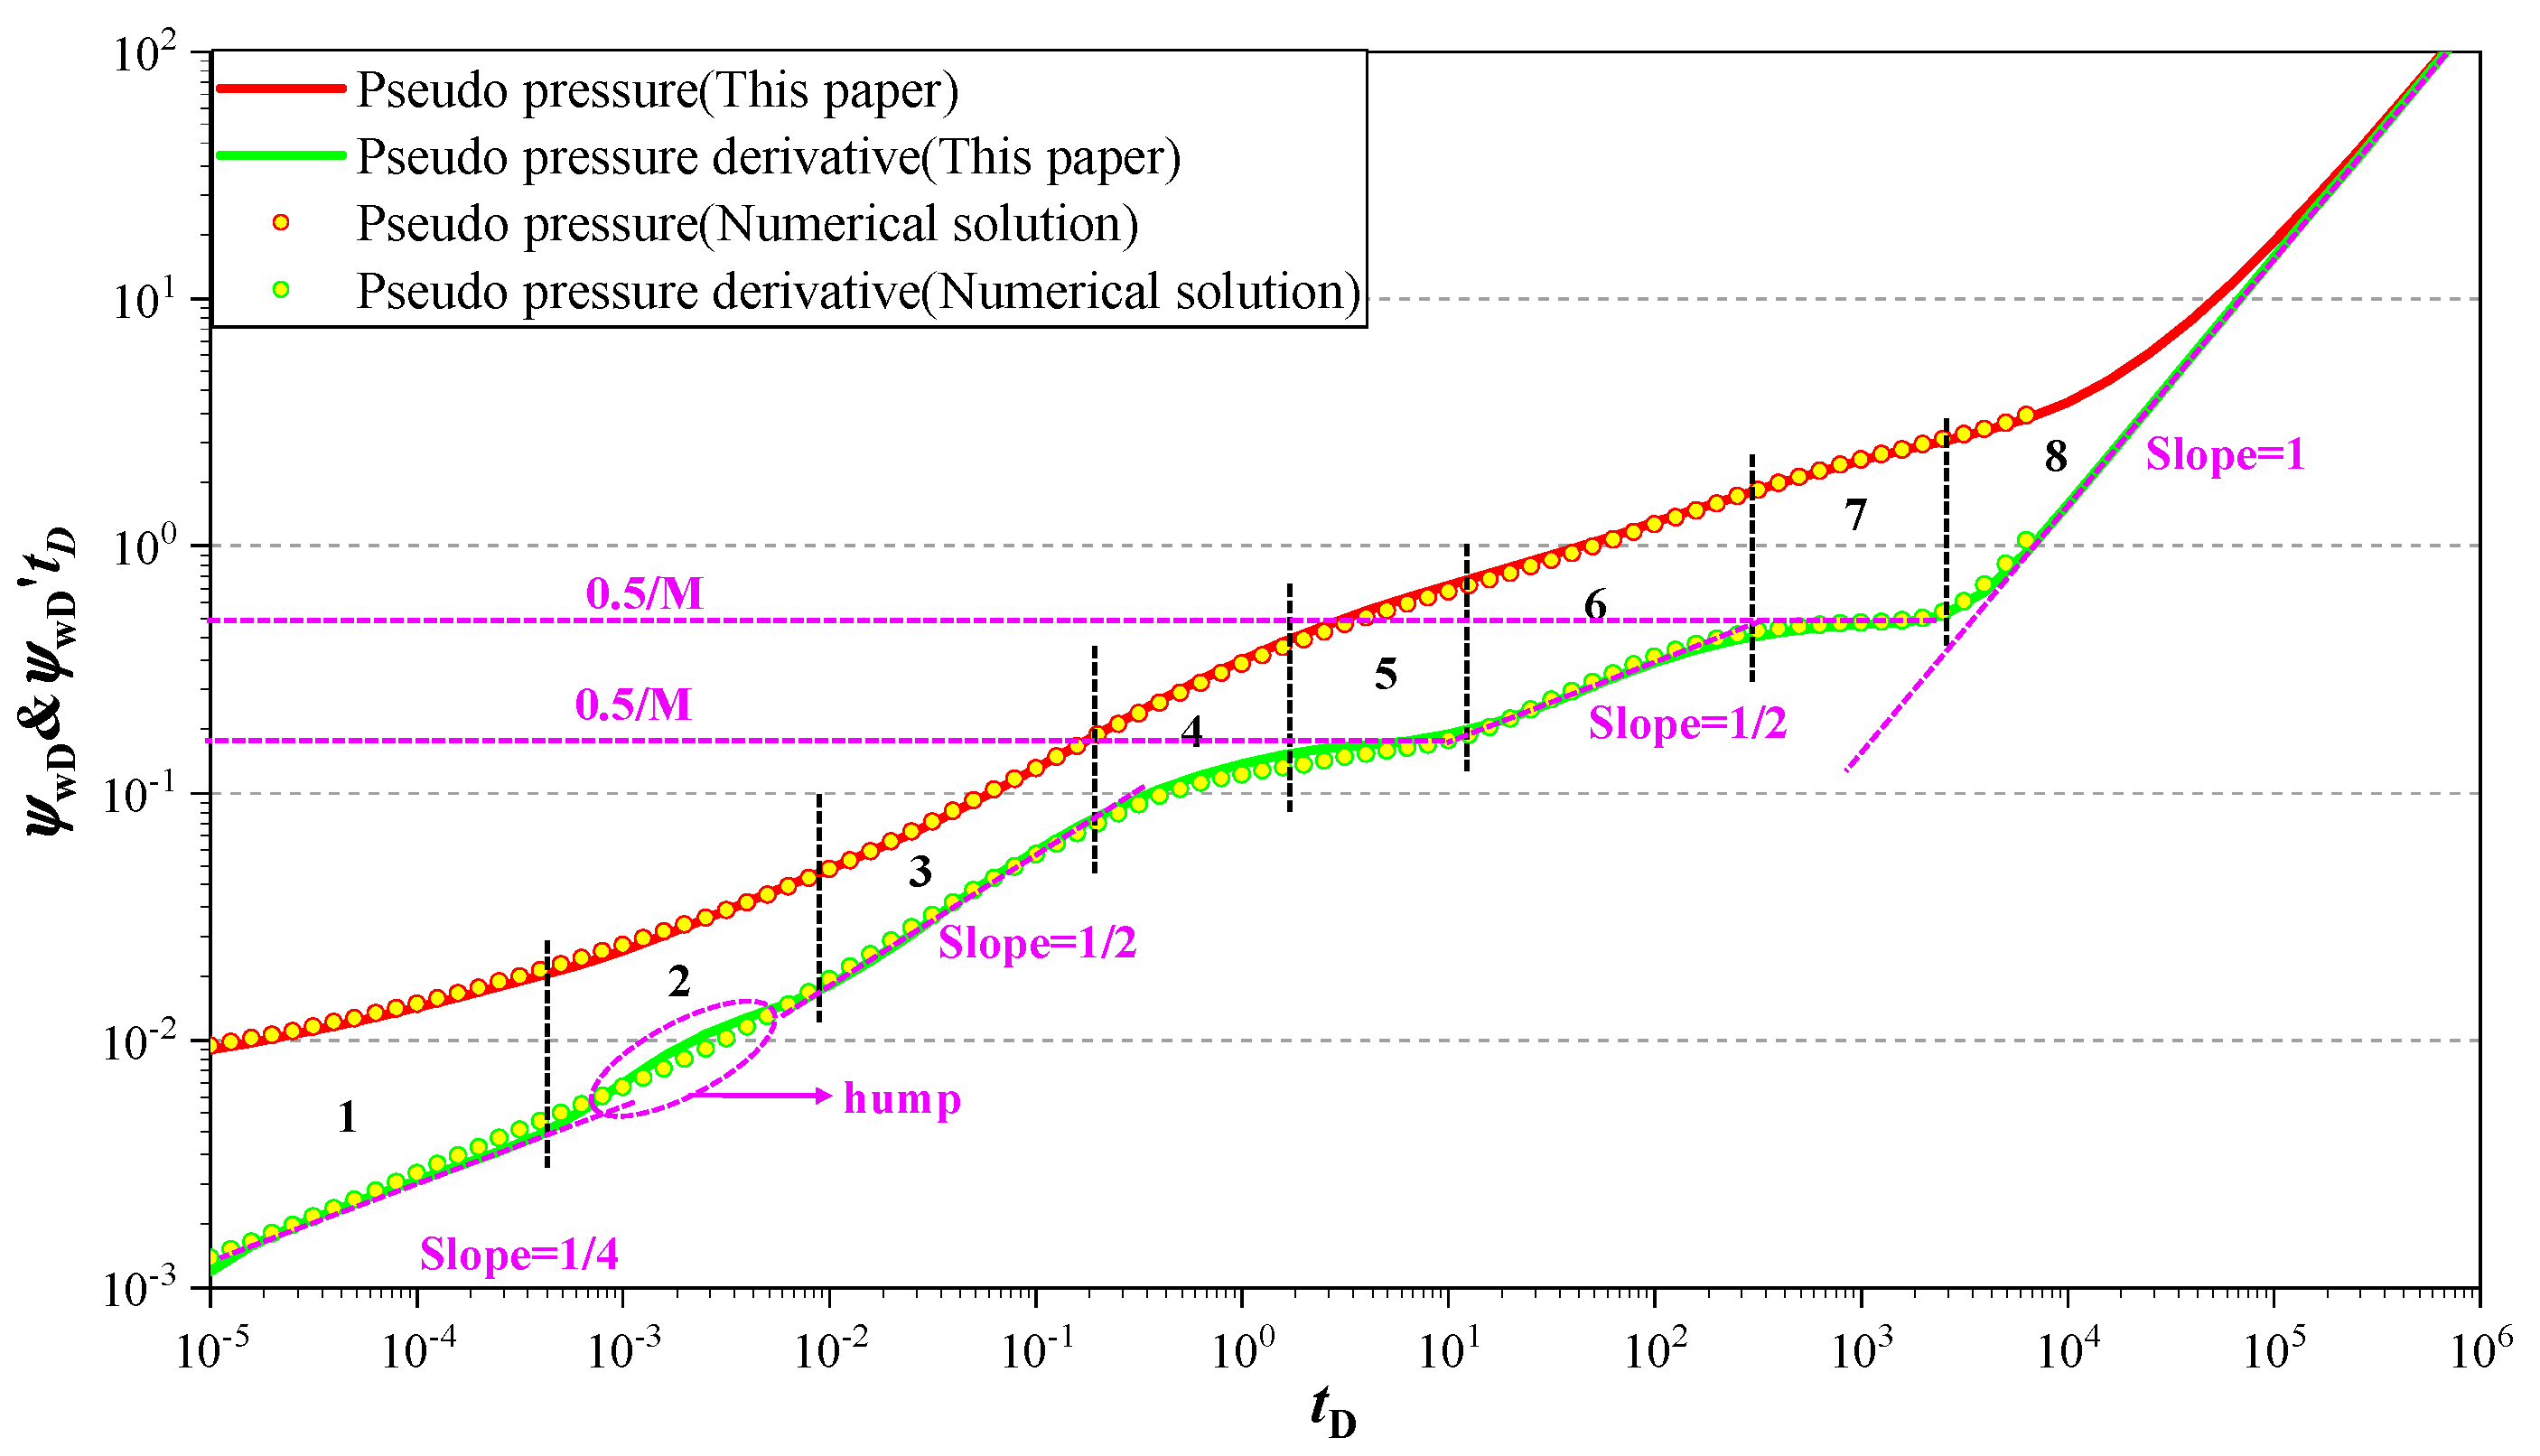
The wellbore pressure of the real-time domain can be obtained by Stehfes [50] and the numerical inversion algorithm. In order to verify the accuracy of the mathematical model in this paper, this model can be verified with a numerical solution. The storativity ratio ω is set as 1. Our model can be simplified as a homogeneous gas reservoir. The basic parameters are as follows: the initial reservoir pressure is 35 MPa, the reservoir thickness is 10 m, the wellbore radius is 0.1 m, the total compressibility is 0.001 MPa−1, the reservoir porosity is 0.1, the formation volume factor is 0.1, the gas reservoir temperature is 100 °C, the hydraulic fracture half-length is 60 m, the hydraulic fracture conductivity is 5526 mD·m, the reservoir permeability is 0.1 mD, the outer boundary radius is 7000 m, the length of the horizontal well is 2000 m, the discrete fracture network resolution is set as 0.4, the progression ration is 1.4 of the numerical solution. As is shown in Figure 6, the numerical and semi-analytical solutions of this paper reach a good match, which indicates that the accuracy of this method is verified (Table 2).
It should be noted that the pseudo-pressure derivative curve characteristic is not obvious by numerical solution calculation in the fracture interferences regime. The reason is that the precision of the numerical solution is not satisfied. At the same time, the computational efficiency of the numerical solution is obviously lower than that of the semi-analytical solution, which shows the advantage of the semi-analytical solution.

5. Blasingame Production Decline and Verification

5.1. Blasingame Production Decline

According to the definition of Fetkovich rate decline curve, the definition of q Dd and t Dd is.
t Dd = 2 π b Dpss t AD
q Dd = q D b Dpss
The dimensionless rate integration function is
q Ddi = 1 t ADd 0 t Dd q Dd ( α ) d α
The dimensionless rate integration derivative function is
q Ddid = q Ddi q Dd
It is noted that qD can be replaced by 1/ψwD approximately, but it is difficult to obtain a wellbore pressure analytical solution of a pseudo-steady flow regime for the MFHWs with a dumbbell-like conductivity fracture, which leads to the calculation of the coefficient bDpss being very difficult. Relevant scholars have carried out relevant research on the calculation of coefficients [51].

5.2. Model Verification by Productivity Index

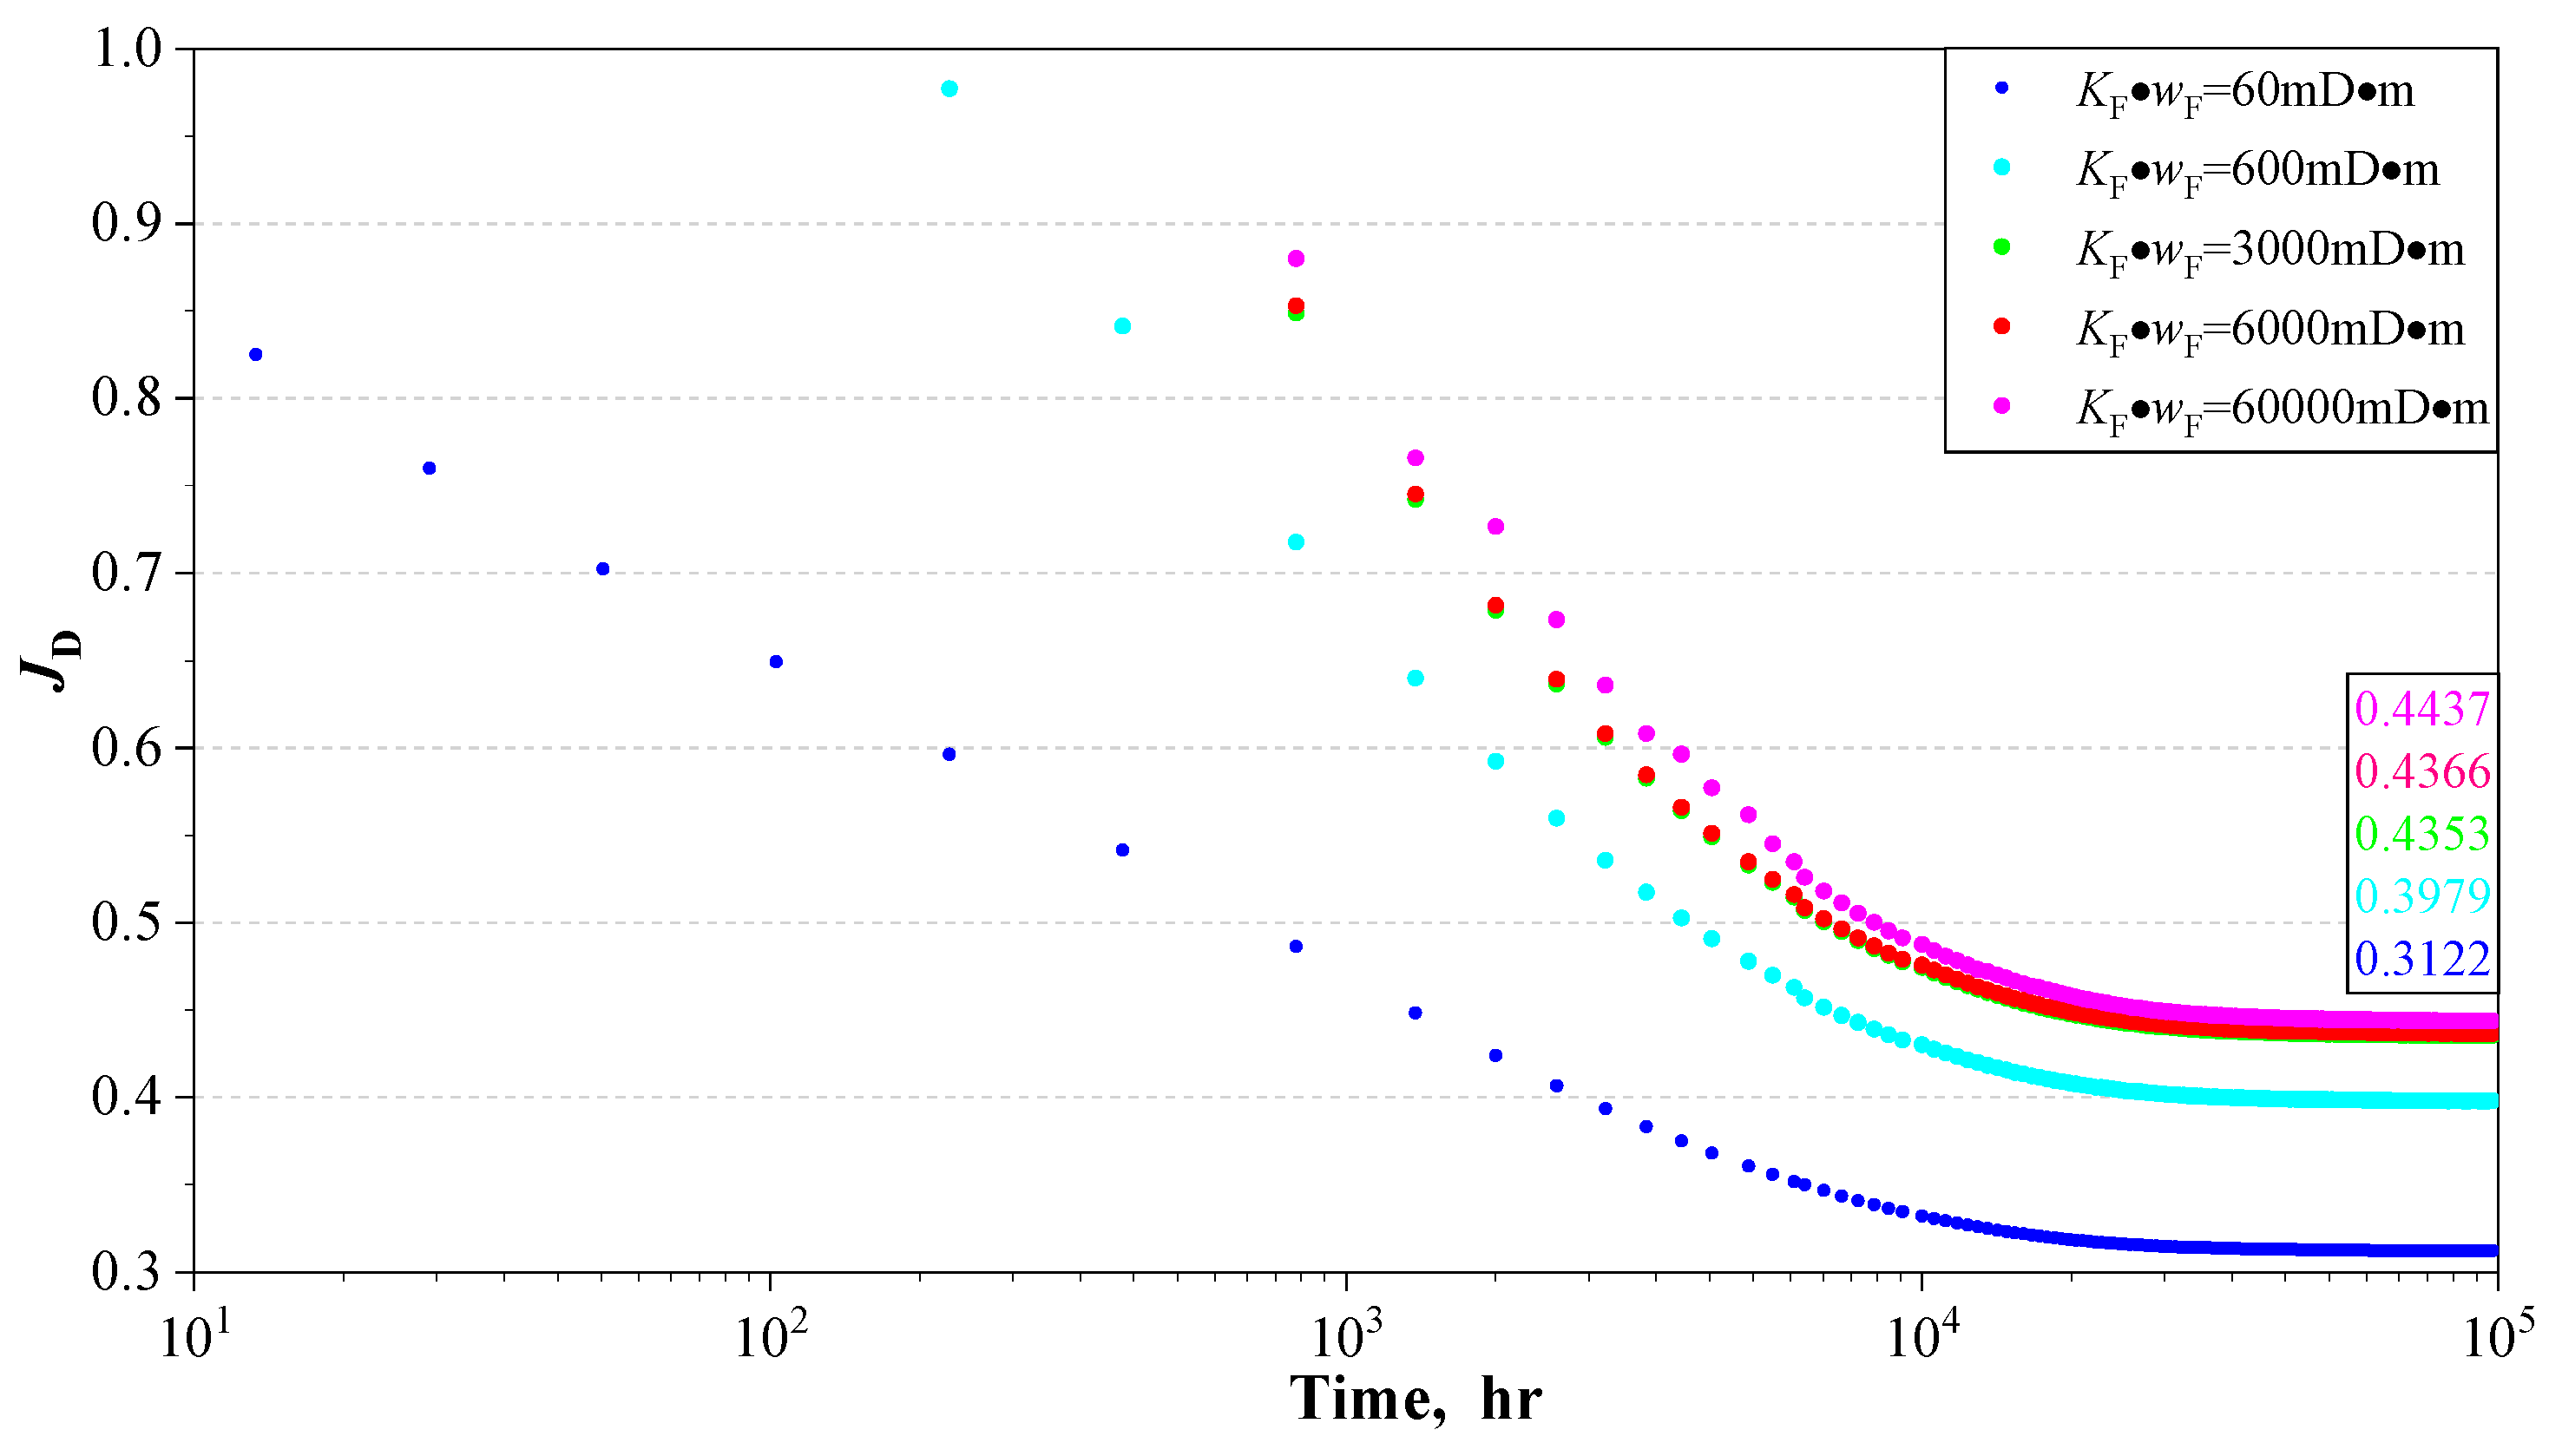
The numerical model is presented to verify the dimensionless productivity index of the MFHW with a finite dumbbell-like hydraulic fracture. An obvious drop in the productivity index is apparent during the transient-steady-state flow regime, but we obtain a steady productivity index value in the boundary-dominant flow regime (Figure 7). The productivity index of the boundary-dominant flow regime can be called the pseudo-steady productivity index, JDpss. Compared with the numerical simulation, our method matches the results of the numerical simulation for different conductivities. The relative error is less than 1% (Table 3).

6. Pressure Transient and Blasingame Production Decline Curve Analysis

6.1. Fracture Distribution

Seven fracture distribution models are shown in Table 4, and the corresponding wellbore pressure curves, Blasingame curves, and pressure distribution are shown in Figure 8, Figure 9, Figure 10, Figure 11, Figure 12 and Figure 13.
Figure 8 shows that the wellbore pressure and Blasingame decline curves are affected by the fracture wing angle. The angle between the fracture wing has an obvious influence on the wellbore pressure and Blasingame decline curves. The small fracture wing angle shows a large pressure drop and stranger fracture interferences around the MFHW (Figure 9). Therefore, the smaller the fracture wing angle, the higher the pressure and its derivative curve before the early radial flow regime, and the earlier the pressure derivative curve ‘hump’ of the fracture interferences regime appears (Figure 8A and Figure 9). A smaller fracture wing angle leads to a smaller Blasingame integral curve and integral derivative curves before the pseudo-steady flow regime (Figure 8B).
Figure 11 shows that the wellbore pressure and Blasingame decline curves are affected by the fracture wing number. A lower fracture wing number shows a large pressure drop. However, since the fracture wing is equal to 90 degrees (Case 5 and Case 1 of Figure 10), the ‘hump’ of the fracture interferences regime is the same for Case 5 and Case 1 of Figure 11. Of course, there is no fracture wing interference when the fracture wing is set to 2 (Case 4), so the ‘hump’ of the derivative curve disappears (Figure 11). Therefore, the smaller the fracture wing number, the higher the pressure and its derivative curve before the early radial flow regime (Figure 10A). Therefore, a smaller fracture wing number leads to a smaller Blasingame integral curve and integral derivative curves before the pseudo-steady flow regime (Figure 10B).
Figure 12 shows that the wellbore pressure and Blasingame decline curves are affected by the fracture wing length. Compared with three different fracture wing length distribution models, the pressure and its derivative curve are smallest when the fracture wing length distribution is Case 1 (Figure 13). Compared with three different fracture wing length distribution models, the duration of the early radial flow regime is the shortest when the fracture wing length distribution is Case 1 (Figure 12A). Therefore, compared with three different fracture wing length distribution models, the pressure approximate solution of the pseudo-steady flow regime is smallest when fracture wing length distribution is Case 1. Therefore, the Blasingame integral curve and integral derivative curves during the early linear flow regime are the smallest when fracture wing length distribution is Case 1 (Figure 12B).

6.2. Fracture Stages

Figure 14 shows that the wellbore pressure and Blasingame decline curves are affected by the fracture cluster number. The fracture wing length degrees are shown in Case 1 of Table 4. The higher the fracture cluster number, the smaller the fracture cluster space. Therefore, the higher fracture cluster number leads to a small pressure curve before the radial flow regime and a shorter duration of the early radial flow regime (Figure 14A). A higher fracture cluster number indicates that the pressure wave will propagate quickly to the closed boundary. The pressure difference of the pseudo-steady flow regime is smaller. Therefore, a higher fracture cluster number leads to a larger Blasingame integral curve and integral derivative curves before the pseudo-steady flow regime (Figure 14B).

6.3. Fracture Conductivity

Figure 15 shows that the wellbore pressure and Blasingame decline curves are affected by dimensionless conductivity. The fracture wing length degrees are shown in Case 1 of Table 3. The larger the dimensionless conductivity, the smaller the pressure and derivative curve of the bilinear and early linear flow regime (Figure 15A). A larger dimensionless conductivity indicates that the pressure wave will propagate more quickly to the closed boundary. The pressure difference of the pseudo-steady flow regime is smaller. Therefore, a larger dimensionless conductivity leads to a larger Blasingame integral curve and integral derivative curves before the radial flow regime (Figure 15B).

6.4. Inter-Porosity Flow Coefficient and Storativity Ratio

Figure 16 shows that the wellbore pressure and Blasingame decline curves are affected by the inter-porosity flow coefficient. The fracture wing length degrees are shown in Case 1 of Table 3. The larger the inter-porosity flow coefficient, the earlier the ‘concave’ characteristic of the derivative curve appears (Figure 16A). When the crossflow from matrix to natural fracture appears before the pseudo-state flow regime, the value of the inter-porosity flow coefficient has little influence on the pressure approximate solution of the pseudo-steady flow regime. When the crossflow from matrix to natural fracture appears after the pseudo-state flow regime, the value of the inter-porosity flow coefficient has an obvious influence on the pressure approximate solution of the pseudo-steady flow regime. A smaller inter-porosity flow coefficient leads to a larger pressure approximate solution of pseudo-steady flow regime, so a larger inter-porosity coefficient leads to an earlier ‘concave’ of Blasingame integral derivative curves during the crossflow regime (Figure 16B).
Figure 17 shows that the wellbore pressure and Blasingame decline curves are affected by the storativity ratio. The fracture wing length degrees are shown in Case 1 of Table 3. The larger the storativity ratio, the shallower the ‘concave’ characteristics of the pressure derivative curve appear (Figure 17A). When the crossflow from matrix to natural fracture appears before the pseudo-state flow regime, the value of the storativity ratio has little influence on the pressure approximate solution of the pseudo-steady flow regime. A larger storativity ratio leads to a shallower ‘concave’ and a larger value of the Blasingame integral derivative curves during the crossflow regime (Figure 17B).

7. Field Application

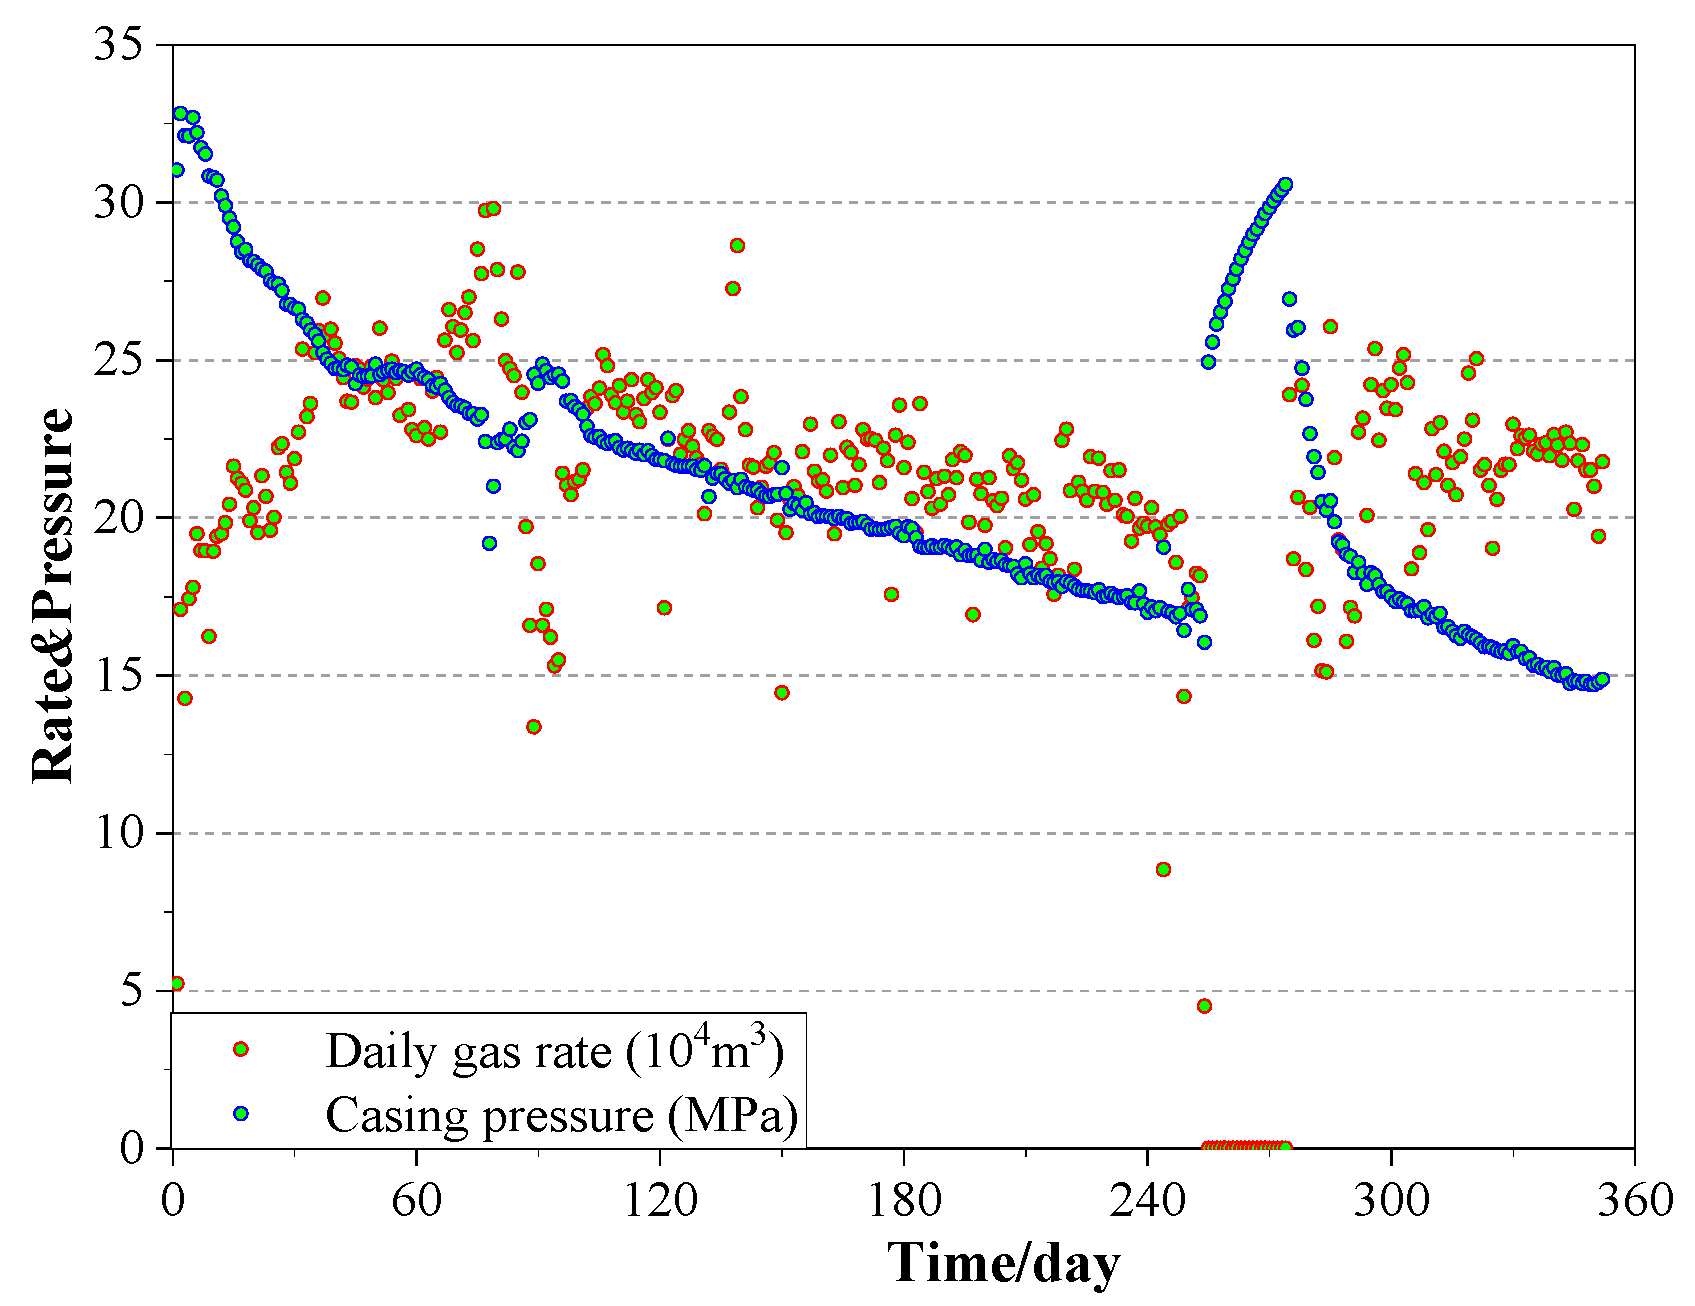
A field example is presented. The formation thickness is 56.9 m. The formation’s average porosity is 5.2%. The wellbore radius is 0.114 m. The formation temperature is 415.7 K. The initial pressure is 86.4 MPa, and the gas gravity is 0.6448. The length of the horizontal well is 1564 m. The number is 24, the horizontal well perforation cluster is 8, and there are 3 perforations in every cluster. The production data of the gas well are shown in Figure 18. The well product was about two years and the conduct build-up test was 20 days.
The well pressure of the pressure build-up well test can be written as
ψ Db ( Δ t D ) = ψ wD ( t pD ) ψ wD ( t pD + Δ t D ) + ψ wD ( Δ t D )
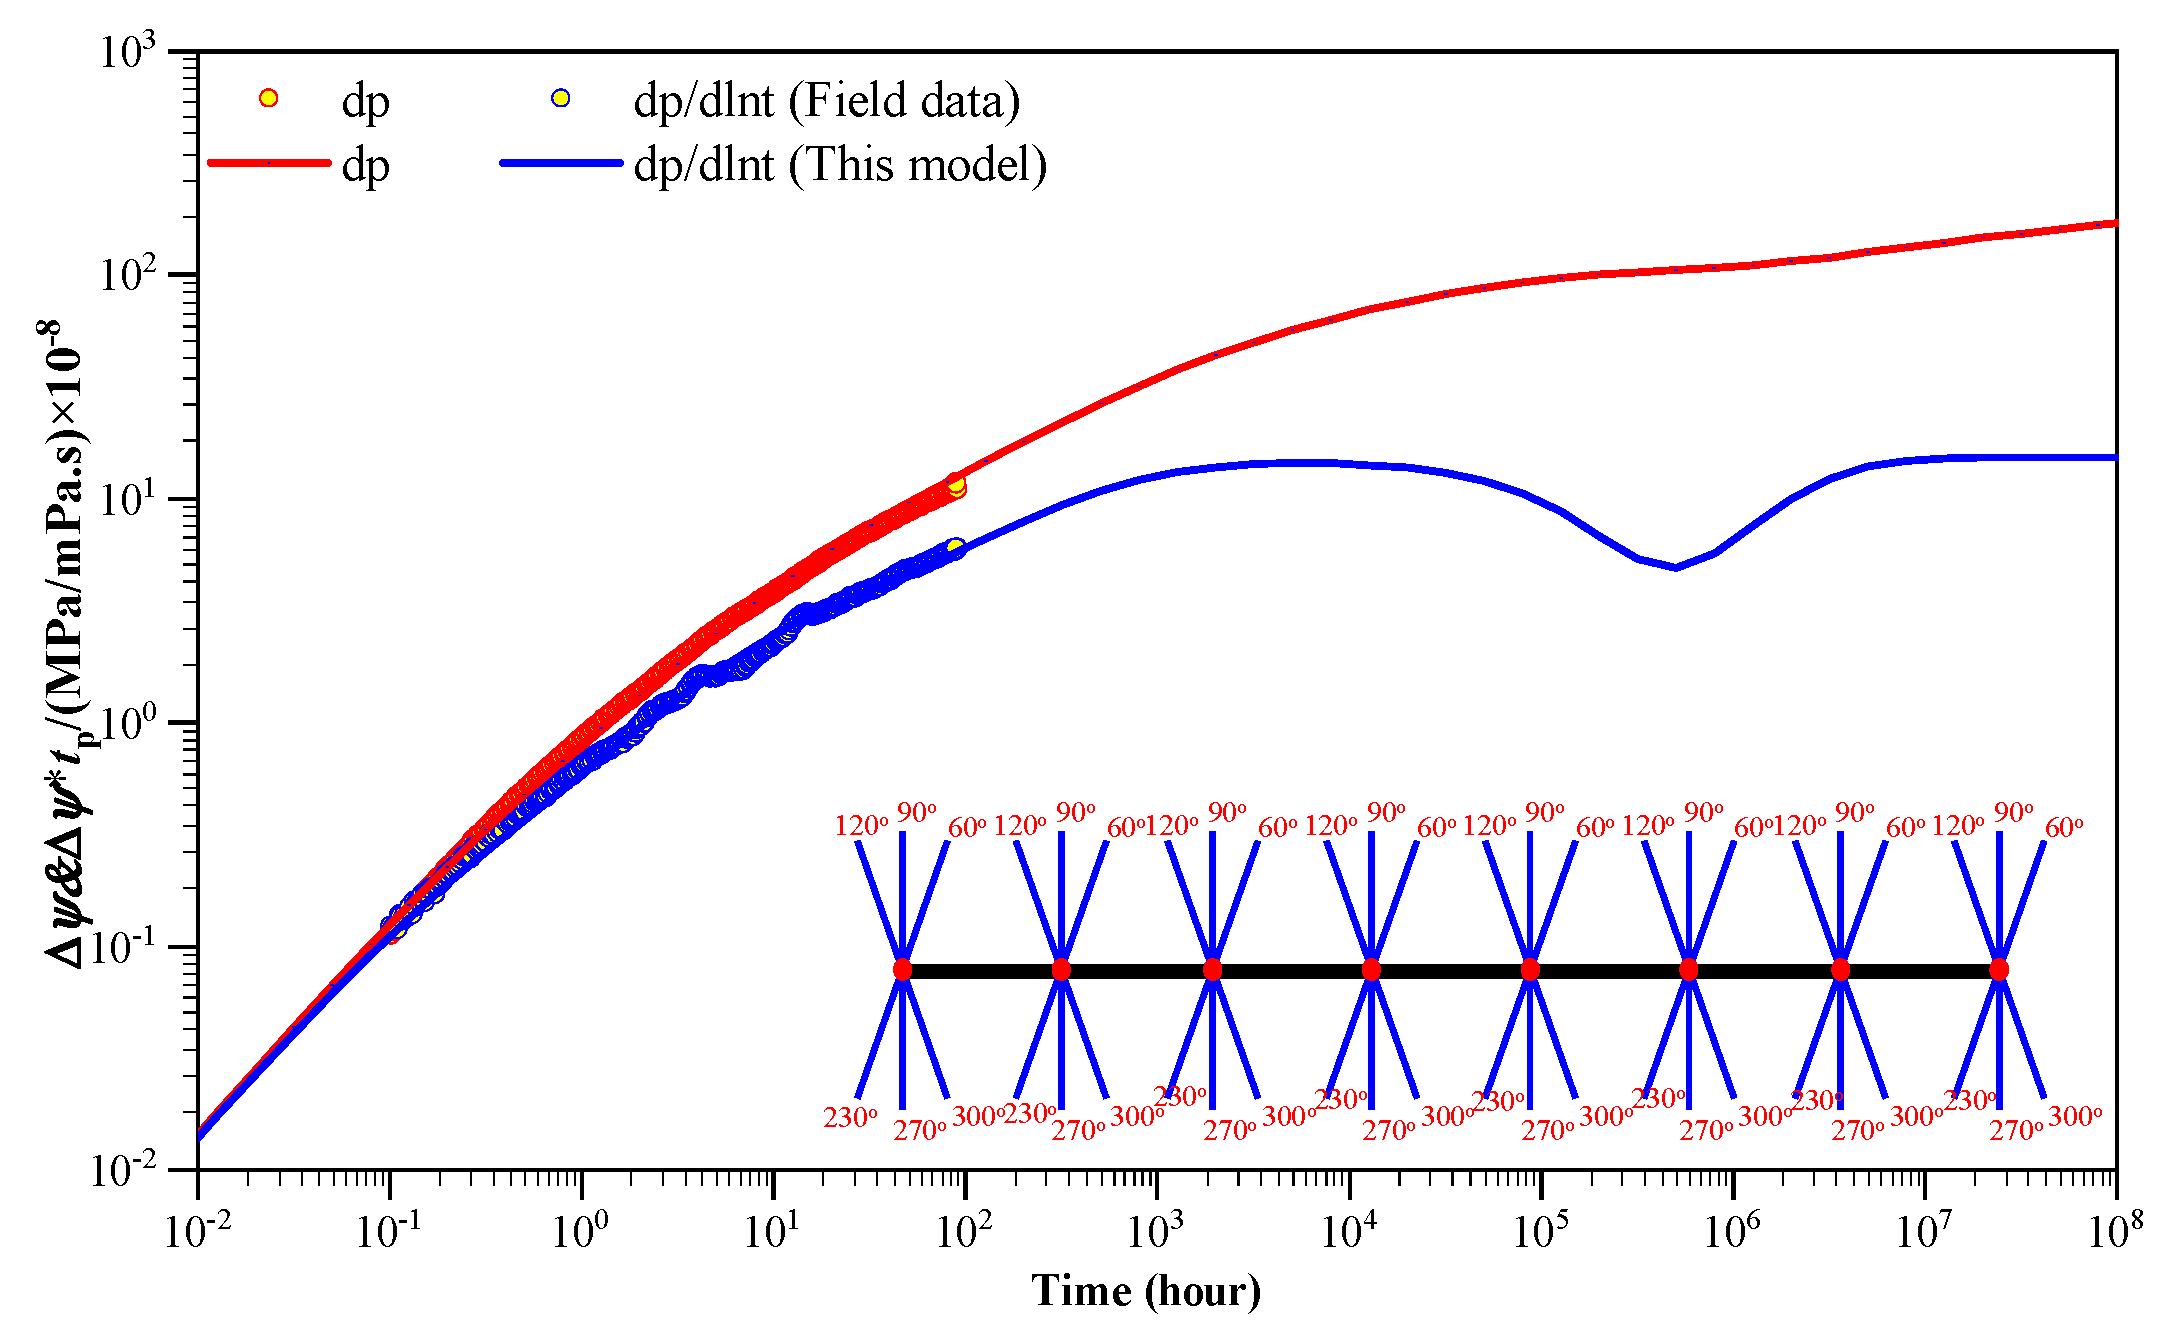
Based on pressure build-up well test analysis, a genetic algorithm is used to obtain the formation and hydraulic fracture parameters. The formation average permeability is 0.338 mD, the hydraulic fracture wing length is 44.158 m, and the hydraulic fracture conductivity is 746.27 mD.m. The wellbore storage is 1.55038 m3/MPa and the skin is 0.001 (Figure 19).
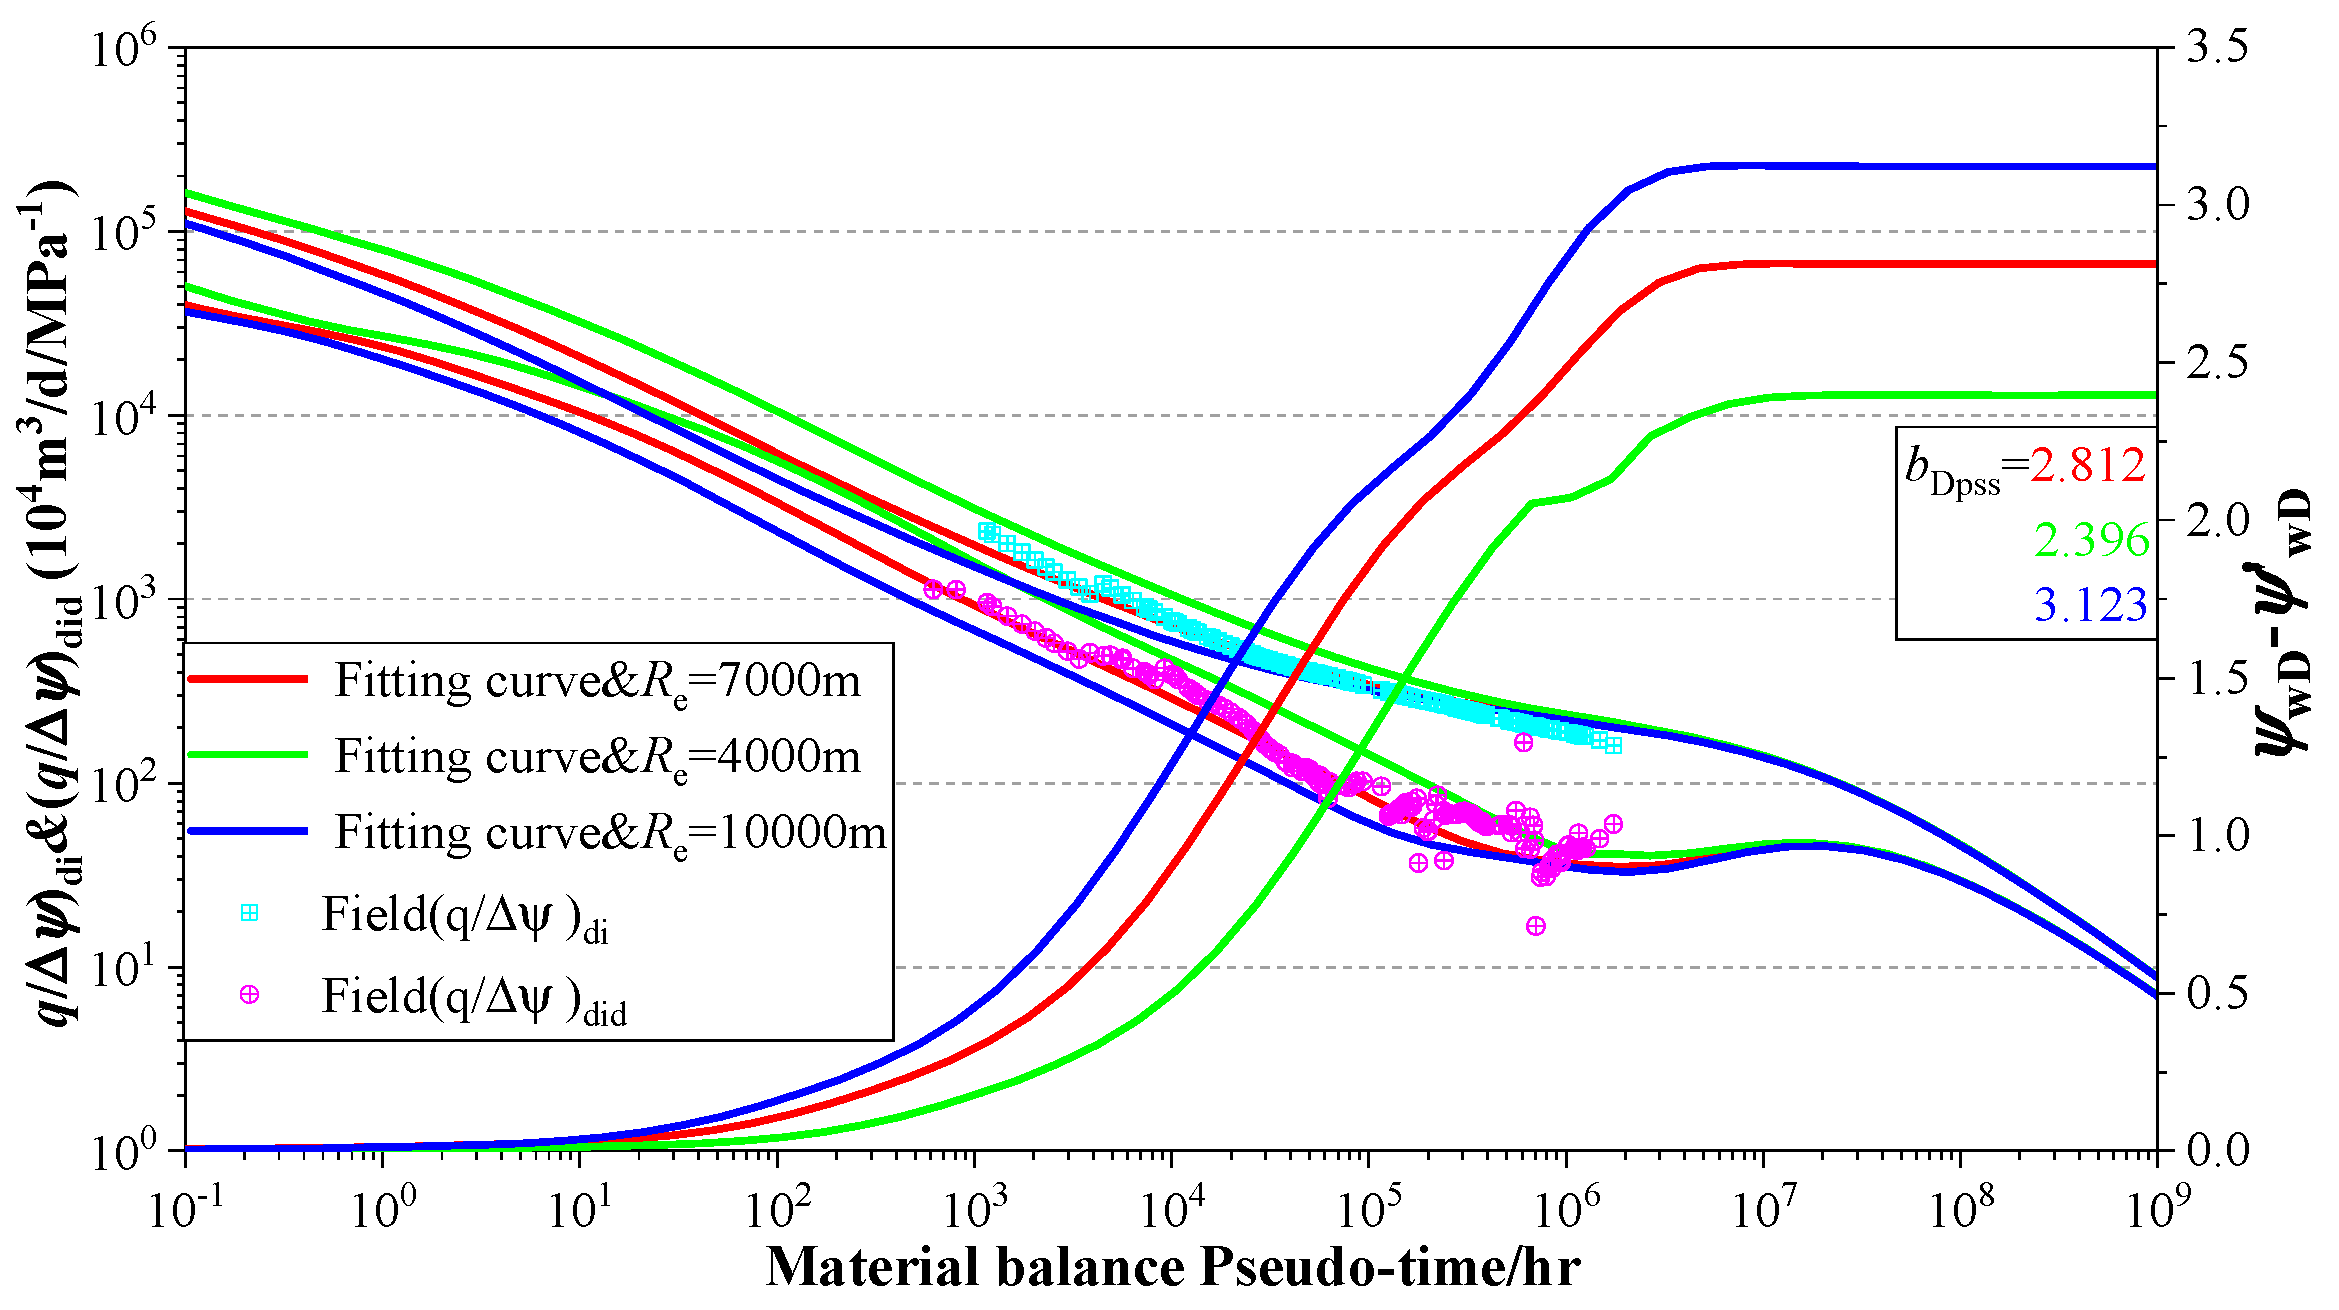
Based on the fitting result of the build-up well test analysis, the Blasingame production decline curves with different outer boundary radii (4000 m, 7000 m, 10,000 m) are plotted. The Blasingame production decline curve fitting result is best when the outer boundary radius is 7000 m. Therefore, the controlled reserves of MFHWs can be calculated by the Blasingame production decline curve fitting and the value is 4.55 × 10⁸ m3 (Figure 20).

8. Conclusions

On the basis of unsteady seepage and the source function approach, the MFHWs with the dumbbell-like hydraulic fracture mathematical model are established. The wellbore pressure is solved by the Laplace transform and pressure drop superposition. The main conclusions are listed as follows:
  • A semi-analytical model of MFHWs with a dumbbell-like hydraulic fracture in circle closed reservoirs is presented. The wellbore pressure transient is verified using a numerical solution. The comparison result reaches a good match. When comparing MFHWs with a bi-wing symmetrical fracture, there is an obvious ‘hump’ of the pressure derivative curve between the bilinear and early linear flow regimes. Compared with the numerical solution, the precision of the semi-analytical model is higher during the early flow regime.
  • The wellbore pressure approximate solution of the pseudo-steady flow regime of MFHWs with a dumbbell-like hydraulic fracture is obtained and verified. The relative error of all comparison results is when the relative error is less than 1%.
  • The smaller fracture wing angle leads to the higher pressure and its derivative curve before the early radial flow regime. The pressure derivative curve ‘hump’ of the fracture interferences regime appears earlier. The smaller the fracture wing number, the higher the pressure and its derivative curve before the early radial flow regime. A higher fracture cluster number leads to a small pressure curve before the radial flow regime and a shorter duration of the early radial flow regime.
  • A smaller fracture wing angle, smaller fracture wing number, smaller dimensionless conductivity, and a smaller fracture cluster number lead to a smaller Blasingame integral curve and integral derivative curves before the pseudo-steady flow regime.
  • When the crossflow from matrix to natural fracture appears after the pseudo-state flow regime, the value of the inter-porosity coefficient has an obvious influence on the pressure approximate solution of the pseudo-steady flow regime.
This study is based on the pressure and pressure derivative difference to obtain the wellbore pressure asymptotic solution and coefficient bDpss. The goal of this study is to study the circular closed boundary, and further research will be conducted on the wellbore pressure asymptotic solution of the rectangular closed boundary during the boundary control flow regime in the future. Although the results obtained by this method are relatively accurate, the calculation is relatively inconvenient. Therefore, the analytical form of the wellbore pressure asymptotic solution during the boundary control flow stage will be directly derived in future research.

Author Contributions

Methodology, Y.X. and S.Z.; validation, Z.L.; formal analysis, Z.X.; investigation, X.A. and Z.C.; resources, Y.J. and Z.L.; writing—review and editing, Z.X. and Y.X.; funding acquisition, Y.J. All authors have read and agreed to the published version of the manuscript.

Funding

This work was supported by the Open Fund Project of Sinopec State Key Laboratory of Shale Oil and Gas Enrichment Mechanisms and Effective Development (33550000-22-ZC0613-0285), Natural Science Foundation of Chongqing, China (CSTB2024NSCQ-MSX0218), and the Research Foundation of Chongqing University of Science and Technology (ckrc20231215). We declare that we have no conflicts of interest.

Data Availability Statement

Data are contained within the article.

Conflicts of Interest

Author Zuping Xiang was employed by the Key Laboratory of Marine Oil and Gas Reservoirs Production, Sinopec. The remaining authors declare that the research was conducted in the absence of any commercial or financial relationships that could be construed as a potential conflict of interest. The funding sponsors had no role in the design of the study; in the collection, analyses, or interpretation of data; in the writing of the manuscript, and in the decision to publish the results.

Nomenclature

AGas well control area, m2 The dimensionless pressure build-up time.
bDpssWellbore pressure approximate solution coefficient The dimensionless production time
CWellbore storage coefficient, MPa/m3ReCircle closed boundary radius, m
JProductivity index, 104 m3/d/MPasLaplace integration variables
CFConductivity of the hydraulic fracture wing, D·mSSkin factor, dimensionless
CtTotal compressibility, MPa−1TTemperature of shale gas reservoirs, K
I0(x)The first-kind zero-order modified Bessel functiontProduction time, hr
I1(x)The first-kind one-order modified Bessel functionx, yDescartes coordinates, m
KPermeability, Dxw, ywx, y, z-coordinates of the line source, m
K0(x)The second-kind zero-order modified Bessel function, ZGas compression factor
K1(x)The second-kind one-order modified Bessel functionθFAngle between hydraulic fracture wing and horizontal well, degree
LFHydraulic fracture wing length, mαmMatrix shape factor, dimensionless
LrefReference length, mϕFormation porosity, decimal
ψPseudo-pressure defined by Equation (1), MPa/(mPa·s)λInter-porosity coefficient, dimensionless
MThe hydraulic fracture cluster number, integerμShale gas viscosity, cp.
ψwD,pssWellbore pressure approximate solution during pseudo-state flowing regimeωStorativity ratio, dimensionless
NThe hydraulic fracture wing discrete element number, integerSubscripts
MFThe hydraulic fracture wing number of every hydraulic fracture cluster, integerDDimensionless
wWellbore
pReservoirs pressure, MPaEInitial state
mMatrix system
p0Reference pressure, MPafNatural fracture system
q ˜ Continuous unite length source strength, m3/dinInflow vertices of every segment
qscTotal production, 104 m3/doutOutflow vertices of every segment
rRadial distance in x-y plane, mFHydraulic fracture
p wD ( Δ t D ) The dimensionless wellbore pressure during build-up testSuperscripts
p wD ( t pD ) The dimensionless wellbore pressure at the instant of falloff-Variables in the Laplace domain
p Db ( Δ t D ) The dimensionless wellbore pressure build-up value from shut-in well time to Δ t D
p wD ( t pD + Δ t D ) The dimensionless wellbore pressure drop value from production starting-time to t pD + Δ t D

References

  1. Mojid, M.R.; Negash, B.M.; Abdulelah, H.; Jufar, S.R.; Adewumi, B.K. A state-of-art review on waterless gas shale fracturing technologies. J. Pet. Sci. Eng. 2021, 196, 108048. [Google Scholar] [CrossRef]
  2. Liehui, Z.; Baochao, S.; Yulong, Z.; Zhaoli, G. Review of micro seepage mechanisms in shale gas reservoirs. Int. J. Heat Mass Transf. 2019, 139, 144–179. [Google Scholar] [CrossRef]
  3. King, G.E. Hydraulic Fracturing 101: What Every Representative, Environmentalist, Regulator, Reporter, Investor, University Researcher, Neighbor, and Engineer Should Know about Hydraulic Fracturing Risk. J. Pet. Technol. 2012, 64, 34–42. [Google Scholar] [CrossRef]
  4. Zhang, T.; Wang, B.-R.; Zhao, Y.-L.; Zhang, L.-H.; Qiao, X.-Y.; Zhang, L.; Guo, J.-J.; Thanh, H.V. Inter-layer interference for multi-layered tight gas reservoir in the absence and presence of movable water. Pet. Sci. 2024, 21, 1751–1764. [Google Scholar] [CrossRef]
  5. Zhiming, C.; Xinwei, L.; Chenghui, H.; Xiaoliang, Z.; Langtao, Z.; Yizhou, C.; Heng, Y.; Zhenhua, C. Productivity estimations for vertically fractured wells with asymmetrical multiple fractures. J. Nat. Gas Sci. Eng. 2014, 21, 1048–1060. [Google Scholar] [CrossRef]
  6. Chen, Z.; Liao, X.; Zhao, X.; Dou, X.; Zhu, L. A semi-analytical mathematical model for transient pressure behavior of multiple fractured vertical well in coal reservoirs incorporating with diffusion, adsorption, and stress-sensitivity. J. Nat. Gas Sci. Eng. 2016, 29, 570–582. [Google Scholar] [CrossRef]
  7. Chen, Z.; Liao, X.; Zhao, X.; Lyu, S.; Zhu, L. A comprehensive productivity equation for multiple fractured vertical wells with non-linear effects under steady-state flow. J. Pet. Sci. Eng. 2017, 149, 9–24. [Google Scholar] [CrossRef]
  8. Liu, Q.-G.; Xu, Y.-J.; Peng, X.; Liu, Y.; Qi, S. Pressure transient analysis for multi-wing fractured wells in dual-permeability hydrocarbon reservoirs. J. Pet. Sci. Eng. 2019, 180, 278–288. [Google Scholar] [CrossRef]
  9. Luo, W.; Wang, X.; Tang, C.; Feng, Y.; Shi, E. Productivity of multiple fractures in a closed rectangular reservoir. J. Pet. Sci. Eng. 2017, 157, 232–247. [Google Scholar] [CrossRef]
  10. Ren, J.; Fang, N.; Zheng, Q.; Guo, P.; Wang, D.; Zhao, C. Semi-analytical model of a multi-wing fractured vertical well in linear composite reservoirs with a leaky fault. J. Pet. Sci. Eng. 2020, 191, 107143. [Google Scholar] [CrossRef]
  11. Wang, H.; Kou, Z.; Guo, J.; Chen, Z. A semi-analytical model for the transient pressure behaviors of a multiple fractured well in a coal seam gas reservoir. J. Pet. Sci. Eng. 2021, 198, 108159. [Google Scholar] [CrossRef]
  12. Wanjing, L.; Changfu, T. A Semianalytical Solution of a Vertical Fractured Well With Varying Conductivity Under Non-Darcy-Flow Condition. SPE J. 2015, 20, 1028–1040. [Google Scholar] [CrossRef]
  13. Chen, C.-C.; Raghavan, R. A Multiply-Fractured Horizontal Well in a Rectangular Drainage Region. SPE J. 1997, 2, 455–465. [Google Scholar] [CrossRef]
  14. Gringarten, A.C.; Ramey, H.J.J. Unsteady-State Pressure Distributions Created by a Well with a Single Horizontal Fracture, Partial Penetration, or Restricted Entry. Soc. Pet. Eng. J. 1974, 14, 413–426. [Google Scholar] [CrossRef]
  15. Ozkan, E.; Raghavan, R. New Solutions for Well-Test-Analysis Problems: Part 1—Analytical Considerations (includes associated papers 28666 and 29213). SPE Form. Eval. 1991, 6, 359–368. [Google Scholar] [CrossRef]
  16. Cinco-Ley, H.; Meng, H.Z. Pressure Transient Analysis of Wells With Finite Conductivity Vertical Fractures in Double Porosity Reservoirs. In Proceedings of the SPE Annual Technical Conference and Exhibition, Houston, TX, USA, 2–5 October 1988. [Google Scholar]
  17. Hanyi, W. New Approaches to Model and Analyze Diagnostic Fracturing Injection Tests. Ph.D. Thesis, University of Texas at Austin, Austin, TX, USA, 2019. [Google Scholar]
  18. He, J.; Teng, W.; Xu, J.; Jiang, R.; Sun, J. A quadruple-porosity model for shale gas reservoirs with multiple migration mechanisms. J. Nat. Gas Sci. Eng. 2016, 33, 918–933. [Google Scholar] [CrossRef]
  19. Wang, H.-T. Performance of multiple fractured horizontal wells in shale gas reservoirs with consideration of multiple mechanisms. J. Hydrol. 2014, 510, 299–312. [Google Scholar] [CrossRef]
  20. Zhao, Y.-L.; Zhang, L.-H.; Zhao, J.-Z.; Luo, J.-X.; Zhang, B.-N. “Triple porosity” modeling of transient well test and rate decline analysis for multi-fractured horizontal well in shale gas reservoirs. J. Pet. Sci. Eng. 2013, 110, 253–262. [Google Scholar] [CrossRef]
  21. Mayerhofer, M.J.; Lolon, E.P.; Warpinski, N.R.; Cipolla, C.L.; Walser, D.; Rightmire, C.M. What Is Stimulated Reservoir Volume? SPE Prod. Oper. 2010, 25, 89–98. [Google Scholar] [CrossRef]
  22. Sarvaramini, E.; Gracie, R.; Dusseault, M. Hydraulic Fracture Stimulated Zone Analysis with a FEM Upscaled Model. In Proceedings of the ISRM International Symposium-10th Asian Rock Mechanics Symposium, Singapore, 29 October–3 November 2018. [Google Scholar]
  23. Wang, H.; Ran, Q.; Liao, X. Pressure transient responses study on the hydraulic volume fracturing vertical well in stress-sensitive tight hydrocarbon reservoirs. Int. J. Hydrogen Energy 2017, 42, 18343–18349. [Google Scholar] [CrossRef]
  24. Zhu, Y.; Carr, T. Interpretation of Hydraulic Fractures Based on Microseismic Response in the Marcellus Shale, Monongalia County, West Virginia, USA: Implications for Shale Gas Production. SPE Reserv. Eval. Eng. 2020, 23, 1265–1278. [Google Scholar] [CrossRef]
  25. Chen, Z.; Liao, X.; Zhao, X.; Zhu, L. Influence of magnitude and permeability of fracture networks on behaviors of vertical shale gas wells by a free-simulator approach. J. Pet. Sci. Eng. 2016, 147, 261–272. [Google Scholar] [CrossRef]
  26. Chen, Z.; Xie, J.; Liao, X.; Li, X.; Zhang, J.; Li, R.; Li, L. A Semi-Analytical Model for Complex Fracture Geometries with Fracture Hits. In Proceedings of the International Petroleum Technology Conference, Beijing, China, 26–28 March 2019. [Google Scholar]
  27. Jia, P.; Cheng, L.; Huang, S.; Wu, Y. A semi-analytical model for the flow behavior of naturally fractured formations with multi-scale fracture networks. J. Hydrol. 2016, 537, 208–220. [Google Scholar] [CrossRef]
  28. Luo, L.; Cheng, S.; Lee, J. Characterization of refracture orientation in poorly propped fractured wells by pressure transient analysis: Model, pitfall, and application. J. Nat. Gas Sci. Eng. 2020, 79, 103332. [Google Scholar] [CrossRef]
  29. Wang, L.; Xue, L. A Laplace-transform boundary element model for pumping tests in irregularly shaped double-porosity aquifers. J. Hydrol. 2018, 567, 712–720. [Google Scholar] [CrossRef]
  30. Xing, G.; Wang, M.; Wu, S.; Li, H.; Dong, J.; Zhao, W. Pseudo-Steady-State Parameters for a Well Penetrated by a Fracture with an Azimuth Angle in an Anisotropic Reservoir. Energies 2019, 12, 2449. [Google Scholar] [CrossRef]
  31. Xu, Y.; Liu, Q.; Li, X.; Meng, Z.; Yang, S.; Tan, X. Pressure transient and Blasingame production decline analysis of hydraulic fractured well with induced fractures in composite shale gas reservoirs. J. Nat. Gas Sci. Eng. 2021, 94, 104058. [Google Scholar] [CrossRef]
  32. Xu, C.; Li, P.; Lu, D. Production performance of horizontal wells with dendritic-like hydraulic fractures in tight gas reservoirs. J. Pet. Sci. Eng. 2017, 148, 64–72. [Google Scholar] [CrossRef]
  33. Cui, Y.; Jiang, R.; Gao, Y. Blasingame decline analysis for multi-fractured horizontal well in tight gas reservoir with irregularly distributed and stress-sensitive fractures. J. Nat. Gas Sci. Eng. 2021, 88, 103830. [Google Scholar] [CrossRef]
  34. Jiang, L.; Liu, J.; Liu, T.; Yang, D. Semi-analytical modeling of transient rate behaviour of a horizontal well with multistage fractures in tight formations considering stress-sensitive effect. J. Nat. Gas Sci. Eng. 2020, 82, 103461. [Google Scholar] [CrossRef]
  35. Lu, T.; Li, Z.; Lai, F.; Meng, Y.; Ma, W.; Sun, Y.; Wei, M. Blasingame decline analysis for variable rate/variable pressure drop: A multiple fractured horizontal well case in shale gas reservoirs. J. Pet. Sci. Eng. 2019, 178, 193–204. [Google Scholar] [CrossRef]
  36. Wang, J.; Wang, X.; Dong, W. Rate decline curves analysis of multiple-fractured horizontal wells in heterogeneous reservoirs. J. Hydrol. 2017, 553, 527–539. [Google Scholar] [CrossRef]
  37. Hernandez, R.F.; Younes, A.; Fahs, M.; Hoteit, H. Pressure transient analysis for stress-sensitive fractured wells with fracture face damage. Geoenergy Sci. Eng. 2023, 221, 211406. [Google Scholar] [CrossRef]
  38. Zhang, Z.; He, S.; Liu, G.; Guo, X.; Mo, S. Pressure buildup behavior of vertically fractured wells with stress-sensitive conductivity. J. Pet. Sci. Eng. 2014, 122, 48–55. [Google Scholar] [CrossRef]
  39. Matthews, C.; Brons, F.; Hazebroek, P. A Method for Determination of Average Pressure in a Bounded Reservoir. Trans. AIME 1954, 201, 182–191. [Google Scholar] [CrossRef]
  40. Dietz, D. Determination of Average Reservoir Pressure From Build-Up Surveys. J. Pet. Technol. 1965, 17, 955–959. [Google Scholar] [CrossRef]
  41. Helmy, M.W.; Wattenbarger, R.A. New Shape Factors for Wells Produced at Constant Pressure. In Proceedings of the SPE Gas Technology Symposium, Calgary, AB, Canada, 15–18 March 1998. [Google Scholar]
  42. Haryanto, E. New Shape Factor for Vertically Fractured Well Produced at Constant Pressure. In Proceedings of the SPE Annual Technical Conference and Exhibition, Dallas, TX, USA, 9–12 October 2005. [Google Scholar]
  43. Pratikno, H.; Rushing, J.A.; Blasingame, T.A. Decline Curve Analysis Using Type Curves—Fractured Wells. In Proceedings of the SPE Annual Technical Conference and Exhibition, Denver, CO, USA, 5–8 October 2003. [Google Scholar] [CrossRef]
  44. van Kruysdijk, C.P.J.W. Semianalytical Modeling of Pressure Transients in Fractured Reservoirs. In Proceedings of the SPE Annual Technical Conference and Exhibition, Houston, TX, USA, 2–5 October 1988. [Google Scholar]
  45. Zhang, M.; Ayala, L.F. A General Boundary Integral Solution for Fluid Flow Analysis in Reservoirs With Complex Fracture Geometries. J. Energy Resour. Technol. 2018, 140, 052907. [Google Scholar] [CrossRef]
  46. Tang, X.; Chen, Z.; Chu, H.; Liao, X.; Chen, H.; Zhang, J. Well testing interpretation for horizontal well with hydraulic fractures and interconnected micro-fractures. J. Pet. Sci. Eng. 2019, 179, 546–557. [Google Scholar] [CrossRef]
  47. Zhou, W.; Banerjee, R.; Poe, B.D.; Spath, J.; Thambynayagam, M. Semianalytical Production Simulation of Complex Hydraulic-Fracture Networks. SPE J. 2013, 19, 6–18. [Google Scholar] [CrossRef]
  48. Jia, P.; Cheng, L.; Clarkson, C.R.; Williams-Kovacs, J.D. Flow behavior analysis of two-phase (gas/water) flowback and early-time production from hydraulically-fractured shale gas wells using a hybrid numerical/analytical model. Int. J. Coal Geol. 2017, 182, 14–31. [Google Scholar] [CrossRef]
  49. Van Everdingen, A.; Hurst, W. The Application of the Laplace Transformation to Flow Problems in Reservoirs. J. Pet. Technol. 1949, 1, 305–324. [Google Scholar] [CrossRef]
  50. Stehfest, H. Numerical inversion of Laplace transforms. Commun. ACM 1970, 13, 47–49. [Google Scholar] [CrossRef]
  51. Xu, Y.; Tan, X.; Li, X.; Li, J.; Liu, Q. Blasingame production decline and production prediction model of inclined well in triple-porosity carbonate gas reservoir. J. Nat. Gas Sci. Eng. 2021, 92, 103983. [Google Scholar] [CrossRef]
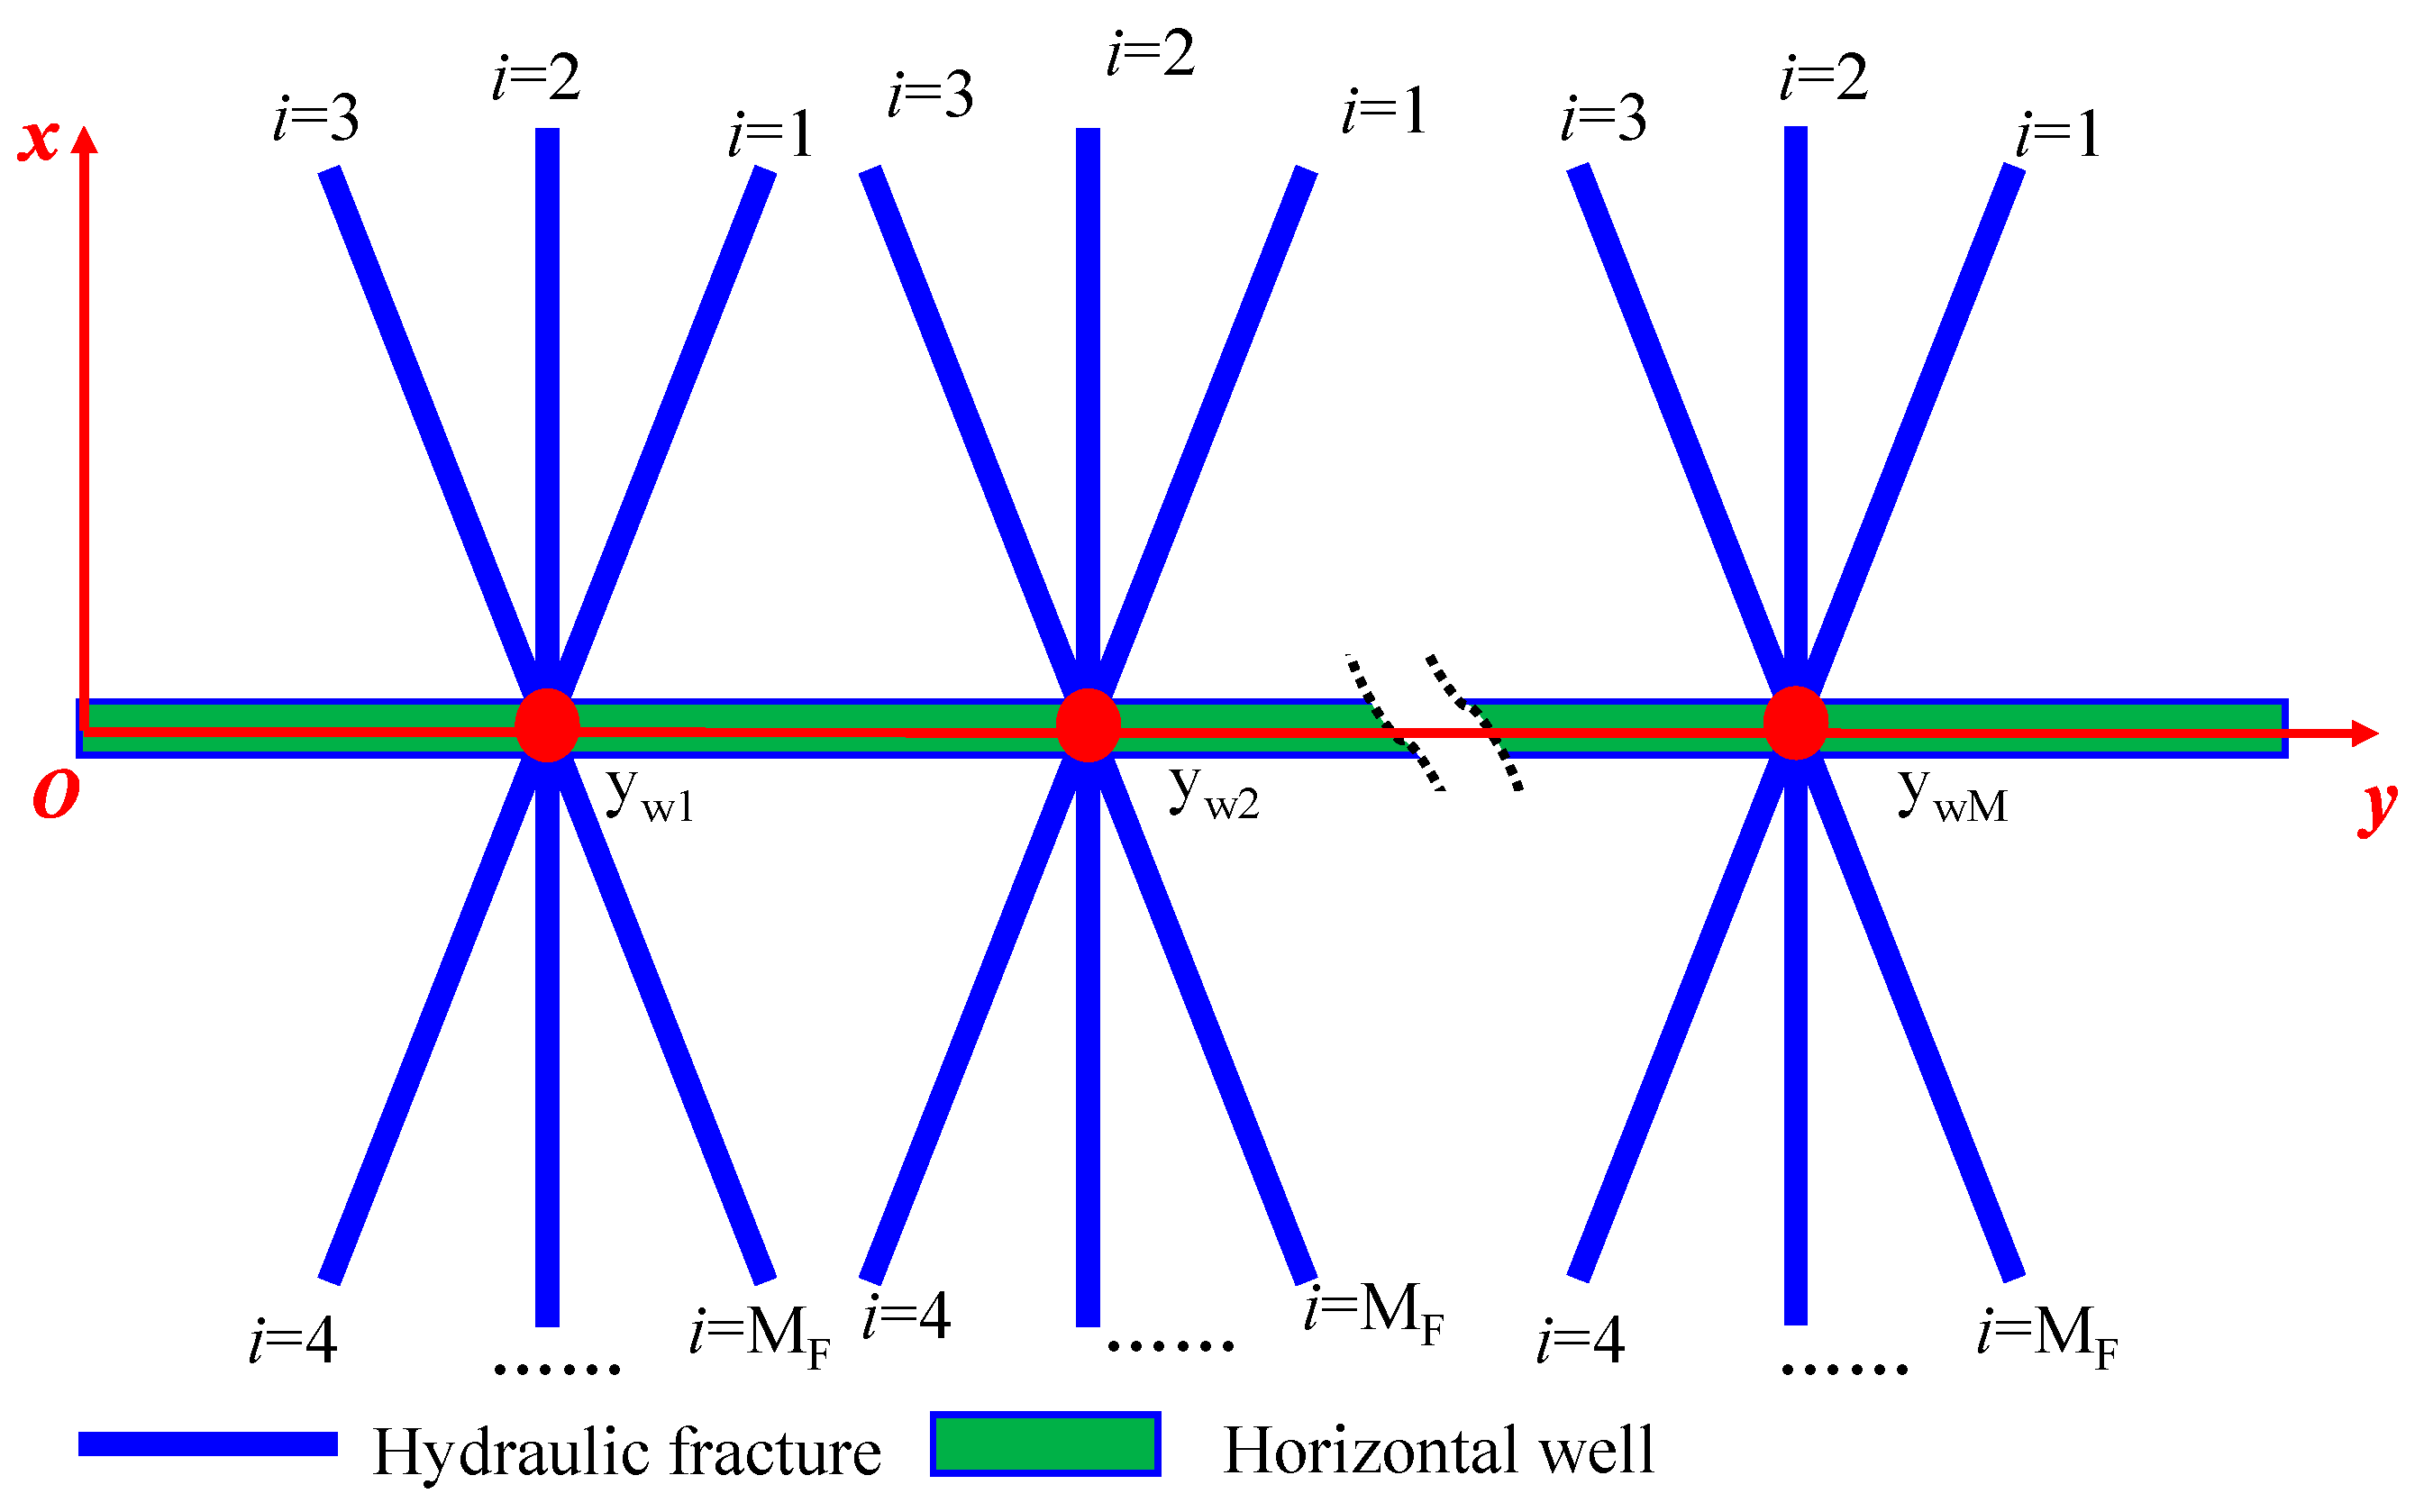
Figure 1. Physical model of a multi-stage fractured horizontal well.
Processes 12 01460 g001
Figure 2. Geometric diagram of the i-th fracture wing.
Processes 12 01460 g002
Figure 3. Physical model of fracture flow segment (modified Zhou [47]).
Processes 12 01460 g003
Figure 4. Physical model of discrete hydraulic fracture.
Processes 12 01460 g004
Figure 5. Fracture discrete segment end-point and mid-point (MF = 6; M = 3, N = 5).
Processes 12 01460 g005
Figure 6. Wellbore pressure transient curve of this model.
Processes 12 01460 g006
Figure 7. Dimensionless productivity index of the MFHW with finite dumbbell-like hydraulic fracture.
Processes 12 01460 g007
Figure 8. Wellbore pressure and Blasingame decline curves are affected by fracture wing angle. (A) Wellbore pressure curves; (B) Blasingame decline curves.
Processes 12 01460 g008
Figure 9. Pressure distribution is affected by fracture wing angle (tD = 1 × 10⁻³).
Processes 12 01460 g009
Figure 10. Wellbore pressure and Blasingame decline curves are affected by fracture wing number. (A) Wellbore pressure curve; (B) Blasingame decline curve.
Processes 12 01460 g010
Figure 11. Pressure distribution is affected by fracture wing number (tD = 1 × 10⁻²).
Processes 12 01460 g011
Figure 12. Wellbore pressure and Blasingame decline curves are affected by fracture wing length. (A) Wellbore pressure curve; (B) Blasingame decline curve.
Processes 12 01460 g012
Figure 13. Pressure distribution is affected by fracture wing length (tD = 1 × 10⁻²).
Processes 12 01460 g013
Figure 14. Wellbore pressure and Blasingame decline curves are affected by fracture cluster number. (A) Wellbore pressure curve; (B) Blasingame decline curve.
Processes 12 01460 g014
Figure 15. Wellbore pressure and Blasingame decline curves are affected by dimensionless conductivity. (A) Wellbore pressure curve; (B) Blasingame decline curve.
Processes 12 01460 g015
Figure 16. Wellbore pressure and Blasingame decline curves are affected by the inter-porosity coefficient. (A) Wellbore pressure curve; (B) Blasingame decline curve.
Processes 12 01460 g016
Figure 17. Wellbore pressure and Blasingame decline curves are affected by the storativity-ratio. (A) Wellbore pressure curve; (B) Blasingame decline curve.
Processes 12 01460 g017
Figure 18. Natural gas hydrating well production data.
Processes 12 01460 g018
Figure 19. Gas well pressure build-up wellbore pressure transient fitting.
Processes 12 01460 g019
Figure 20. Gas well Blasingame fitting.
Processes 12 01460 g020
Table 1. Dimensionless variables definition.
Dimensionless VariablesDefinitionDimensionless VariablesDefinition
Dimensionless pseudo-pressure ψ D = K f h 0.01273 q sc T ( ψ e ψ ) Dimensionless coordinate l D = l L ref ( l = x , y , r )
Dimensionless time (length) t D = 3.6 K f t μ e ( ϕ C te ) f + m L ref 2 Dimensionless source point coordinate x wD = x w L ref ; y wD = y w L ref
Dimensionless outer boundary radius R eD = R e L ref Dimensionless productivity index J D = 0.01273 T K f h J
Dimensionless hydraulic fracture wing length L FD = L F L ref Storage capacity ratio of natural fracture system ω = ϕ f C fte / ( ϕ f C te ) f + m
Crossflow coefficient from matrix to natural fracture λ = α K m L ref 2 K f Dimensionless time (area) t AD = 3.6 K f t μ e ( ϕ C te ) f + m A
Table 2. Flowing regime and curve characteristic.
Flowing Regime,Regime Name, and Pseudo-Pressure Derivative Curve CharacteristicsSketch Map
Stage 1A bilinear flow regime perpendicular to every hydraulic fracture wing and parallel to the fracture wing. The pressure derivative curve is the 1/4-slope straight line during this regime in the log–log plot.Processes 12 01460 i001
Stage 2The fracture interferences regime. The pressure derivative curve shows obvious “humps” in this regime, which reflect the interferences among multiple fracture wings at the intersection between the wellbore and hydraulic fracture wing (Chen, Z. et al. (2016) [6]).Processes 12 01460 i002
Stage 3The early linear flow regime perpendicular to every hydraulic fracture wing. The pressure derivative curve is the 1/2-slope straight line during this regime in the log–log plot (Wang, H.-T. (2014) [19]).Processes 12 01460 i003
Stage 4The transition flow period between the early-time linear flow regime and the early radial flow regime. After the end of the early linear flow regime, the radial flow around the fracture wing will last for a period. Therefore, compared with the bi-wing symmetrical fracture of the MFHW, this regime shows a long duration.Processes 12 01460 i004
Stage 5The early radial flow regime around each fracture cluster. The pseudo-pressure derivative curve is a constant in this regime, and the value is a 0.5/M horizontal line. M is the hydraulic fracture cluster number consisting of the multi-fracture wing. Of course, when the hydraulic fracture cluster space is very small or the fracture wing is very long, the characteristics of the pseudo-pressure derivative curve may not be obvious in this regime.Processes 12 01460 i005
Stage 6The intermediate-time linear flow period. The pressure wave has propagated to position away from the fractured horizontal well. During this flowing regime, formation fluid flows into the MFHW in the linear flowing style. Therefore, the pseudo-pressure derivative curve of this flow regime also shows an obvious 1/2-slope straight line.Processes 12 01460 i006
Stage 7The radial flow regime around the MFHW pseudo-pressure derivative curve is a constant in this regime, and the value is a 0.5 horizontal line. Of course, when the outer boundary radius is very close to half the length of the horizontal well, the characteristics of the pseudo-pressure derivative curve may not be obvious in this regime.Processes 12 01460 i007
Stage 8The pseudo-steady flow regime. The pressure wave has propagated to a circle closed boundary. The pseudo-pressure derivative curve is a unit-slope straight line.
Table 3. Comparison of the results of the numerical solution and this paper.
CFDJDpss (Numerical Solution)JDpss (This Paper)Relative Error/%
0.10.31220.31270.16
10.39790.40060.67
50.43530.43420.25
100.43660.43790.30
1000.44370.44270.23
Table 4. Length and angle of fracture wing.
StageM = 1M = 2M = 3
Case
MF123456123456123456
Case 1Length606060606060606060606060606060606060
Angle659011524527029565901152452702956590115245270295
Case 2Length606060606060606060606060606060606060
Angle459013522527031545901352252703154590135225270315
Case 3Length606060606060606060606060606060606060
Angle309015021027033030901502102703303090150210270330
Case 4Length/60//60//60//60//60//60/
Angle/90//270//90//270//90//270/
Case 5Length60/6060/6060/6060/6060/6060/60
Angle45/135225/31545/135225/31545/135225/315
Case 6Length301203030120303012030301203030120303012030
Angle459013522527031545901352252703154590135225270315
Case 7Length753075753075753075753075753075753075
Angle459013522527031545901352252703154590135225270315
Disclaimer/Publisher’s Note: The statements, opinions and data contained in all publications are solely those of the individual author(s) and contributor(s) and not of MDPI and/or the editor(s). MDPI and/or the editor(s) disclaim responsibility for any injury to people or property resulting from any ideas, methods, instructions or products referred to in the content.